Embed Size (px)
Citation preview
Inventory and monitoring toolbox: birds
DOCDM-577914
This specification was prepared by John Dowding and Terry Greene in 2012.
Contents
Synopsis .......................................................................................................................................... 2
Assumptions .................................................................................................................................... 2
Resources ....................................................................................................................................... 2
Advantages ...................................................................................................................................... 3
Disadvantages ................................................................................................................................. 3
Suitability for inventory ..................................................................................................................... 4
Suitability for monitoring ................................................................................................................... 4
Skills ................................................................................................................................................ 5
Minimum attributes .......................................................................................................................... 5
Data storage .................................................................................................................................... 6
Analysis, interpretation and reporting ............................................................................................... 6
Case study A ................................................................................................................................... 7
Full details of technique and best practice ......................................................................................11
References and further reading ......................................................................................................12
Appendix A .....................................................................................................................................13
Birds: complete counts— true census
Version 1.0
Disclaimer This document contains supporting material for the Inventory and Monitoring Toolbox, which contains DOC’s biodiversity inventory and monitoring standards. It is being made available to external groups and organisations to demonstrate current departmental best practice. DOC has used its best endeavours to ensure the accuracy of the information at the date of publication. As these standards have been prepared for the use of DOC staff, other users may require authorisation or caveats may apply. Any use by members of the public is at their own risk and DOC disclaims any liability that may arise from its use. For further information, please email [email protected]
DOCDM-577914 Birds: complete counts—true census v1.0 2
Inventory and monitoring toolbox: birds
Synopsis
Complete counts are simply counts of all individuals of a target species within a defined area of
interest, i.e. a complete census is conducted. This method is likely to work when applied at a small
spatial scale, e.g. a roost, colony or lake, or within an area and habitat where individual birds are
easily detected and it is certain all can be counted. Counting methods will be species-specific. They
include visual observations from a fixed point, systematic scans of a series of strips, physical
sweeps of an area (e.g. shoulder to shoulder search of a riverbed), or interpretation of photographs.
Complete counts are usually possible only for a very small proportion of species present in an area,
i.e. those birds that are slow or relatively immobile, large and highly visible. If the target species is
highly mobile, small, cryptic, or widely spread, or it has combination of these attributes, a complete
count is likely to fail.
Failure to meet this method’s assumptions can turn an attempted complete count into an index of
an unknown quality. That index could be good, bad, or so close to the total number that it could be
treated as such. The challenge then becomes knowing into which category the count has fallen and
how, or whether, it can be interpreted in a meaningful way.
Assumptions
All populations (e.g. roosts, colonies, leks) are geographically discrete, with no undetected
movement in or out of the survey area during the census.
All members of the target population (e.g. roost, colony, lek) are available to be counted.
Resources
Although this population assessment method is simple, largely relying on counts derived from field-
based visual observations or interpretation of suitable imagery, it has some shortcomings. Total
counts can be very resource expensive and the provision of adequate resources does not
guarantee an unbiased result. Cost is exacerbated by having to cover large areas within relatively
short time-frames. Total counts are usually only possible by mobilising and coordinating large
numbers of people or using expensive imaging and interpretation technologies.
Field-based counts can be done with binoculars, notebook and/or data sheets, a pencil and a map.
Extra requirements will often be specific to the birds being counted and the locality (e.g. spotting
scope for small wading birds on distant sandbars) and the way data are to be collected (e.g. aircraft
and aerial cameras).
Usually, costs will increase as the monitoring programme’s scale increases and as specialised
remote-sensing techniques are applied. In addition to observation costs, the programme budget
should always consider the costs of survey design, data entry, analysis and reporting.
DOCDM-577914 Birds: complete counts—true census v1.0 3
Inventory and monitoring toolbox: birds
Advantages
If assumptions can be met there will be no variance (or very low sampling variance) associated
with the count, i.e. a true census of all individuals in the population.
This method may be the only option given a species’ status (e.g. extreme rarity) and behaviours
(e.g. nocturnal or other cryptic behaviours, flocking, colonial nesting).
The complete count method is very simple and it requires minimal statistical analysis.
Disadvantages
This method is likely to be applicable only to a small number of bird populations as the
assumptions are difficult to meet in real-world situations.
Unbiased comparisons across time and space are often difficult as detectability typically varies
across time (especially where habitat succession processes are occurring) and between places
(variations in habitat).
Potentially very expensive for large areas. Count frequency may need to be constrained
accordingly.
These difficulties increase if the target species is small and/or highly mobile, and as scale of the
count increases.
Inter-site movement during the count period can be problematic, particularly if the individuals
from the population are unmarked.
The absence of non-breeders or foraging adults from colonies or roosts can severely bias
population estimates.
This type of counting approach will not perform well for all species or even related species within a
group. A report by Sagar et al. (1999) on the National Wader Count Scheme clearly illustrates the
difficulties of attempting total counts or even approximate counts (and associated trends) for large
numbers of species over large areas. Human, logistical and resource limitations meant that
coverage was incomplete for parts of sites, some sites were not visited at all, some species had
specific habitat requirements which took them outside the main coastal habitats surveyed, and
there were serious count estimation errors where species congregated in large flocks.
Counts of wrybill and banded dotterel were particularly problematic in the National Wader Count.
Both species are cryptic and widely dispersed over their preferred braided riverbed breeding habitat
and are often missed during riverbed surveys (J.E. Dowding, pers. comm.). There were also
problems with winter flock counts, particularly for banded dotterels. Over half of the banded dotterel
population is thought to leave New Zealand to spend the winter in Australia, where many of them
cannot be located, and a reliable total (or even local) count of this species presents an intractable
problem (Dowding & Moore 2006). Similarly, winter flock counts of wrybills around the Auckland
isthmus are blighted by large estimation error, significant annual fluctuations in the numbers of
juveniles, and apparent changes in roost site allegiances over various time scales (e.g. as habitats
change with the expansion of mangrove populations) (Reigen & Dowding 2003). However, the
larger wrybill flocks are now counted from photographs and estimation errors appear to be much
lower than in the 1970s and 1980s.
DOCDM-577914 Birds: complete counts—true census v1.0 4
Inventory and monitoring toolbox: birds
Although some bird species seem suited to total counts, relatively few of these counts are likely to
be reliable (particularly for flocking species where counts usually involve an element of estimation).
Unless there are good, objective grounds to believe these counts are precise (see comments on
northern New Zealand dotterel census in Case Study A) emphasis should be on documenting the
completeness of an attempted total count (and degree of precision if there has been an element of
estimation). Such information helps others assess reliability of the count. It might also motivate
practitioners to improve the count method or amend the sampling strategy. Documentation on
survey completeness is particularly important in multi-species counts, where data are collected at
the same time for species that display wide variations in behaviour and habitat requirements.
Suitability for inventory
Complete counts require all birds of a designated population be counted. Resource costs (labour
and money) for such counts are significant and the data obtained are beyond those required for
simple inventory. For these reasons, complete counts of an entire study area are not recommended
as a way to compile a species inventory.
Suitability for monitoring
Provided all assumptions can be met, complete counts provide the best possible measure of
population size (i.e. they establish the exact number with no error) and, therefore, population
trends. The value gained from such exact measures has to be balanced against the efficiency and
expense of obtaining them. In some instances, a complete count may be the only appropriate
method given a species’ status and behaviours (e.g. for an endangered species such as the kākāpō
or takahē).
Difficulties in meeting the assumptions often mean complete counts become indices of abundance
by default. Unless the proportion of individuals not being counted within a population can be
estimated, e.g. through use of photographs calibrated on the ground (Moore & Blezard 1999a; see
‘Birds: complete counts—ground-based photo counts for seabirds’—docdm-578675) or assessment
of the proportion of birds away from a colony or roost, population estimates will be biased by an
unknown amount and their reliability will be uncertain. Total counts with these shortcomings are, in
reality, extremely expensive, ‘simple’, unadjusted counts or indices. At best, such indices, like all
other indices, will give an approximate estimation of population trend. At worst, they can be quite
misleading (Thompson et al. 1998).
However, we need to remind ourselves that monitoring rare species is primarily for practical
conservation management purposes. While it’s worth being aware of all the limitations and possible
sources of error, and realising that a rigorous complete count is virtually unobtainable, it is useful to
attempt to count some whole populations, even if it is done imperfectly. There are two reasons to
attempt such counts:
1. An attempted count of the whole population (where 90–95% or more of a population can be
located, based on knowledge of suitable habitat, past numbers and distribution, etc.) is
DOCDM-577914 Birds: complete counts—true census v1.0 5
Inventory and monitoring toolbox: birds
going to give us a more accurate estimate than an index that counts only 5 or 10 percent of
the population. Extrapolation of numbers or a search for trends based on the index results
will compound any errors in the initial index, e.g. those from inaccurate counting or lack of
representativeness in the sample.
2. Complete counts provide a lot of extra information, particularly on distribution. This can be
very useful for guiding species recovery planning and management for threatened species.
For example, counts of the northern NZ dotterel population showed that while the species
was increasing on the east coast (and overall), it was collapsing and becoming fragmented
on the west coast. The recovery programme has responded to that information.
Nearly all complete counts done in New Zealand focus on shorebirds. These include northern NZ
dotterel, southern NZ dotterel, shore plover, Chatham Island oystercatcher and wrybill. Several
factors support the use of complete counts for these five species. Three of the five have populations
of about 300 or less, and restricted ranges. All inhabit open habitats either year-round or
seasonally. Complete counts are not suitable for monitoring secretive wetland birds or birds that
inhabit forests.
Skills
No specialist skills are required for complete counts. However, practitioners must be:
Familiar with the target species (identification, behaviours, preferred habitats, etc.)
Sufficiently mobile to cover the intended sample area within a stipulated time-frame
Able to read colour-band combinations accurately and distinguish other identifying marks if
present
Able to use and interpret aerial photographs (or related imaging tools) correctly
Minimum attributes
Consistent measurement and recording of these attributes is critical for the implementation of the
method. Other attributes may be optional depending on your objective. For more information refer
to ‘Full details of technique and best practice’.
DOC staff must complete a ‘Standard inventory and monitoring project plan’ (docdm-146272).
Minimum attributes to record:
Record metadata, including observers’ names and contact details, date of survey, location (see
next bullet point), time over which the survey was conducted, and weather during the survey
period (optional). Use a standardised and pre-tested data sheet for each sampling event and
throughout the whole programme, if possible.
Record location (easting and northing, and polygon) of the survey area. Selection and definition
of survey area and counting strategy (e.g. use of fixed points, or systematic scans, etc.) must be
DOCDM-577914 Birds: complete counts—true census v1.0 6
Inventory and monitoring toolbox: birds
determined before starting the count. Details are likely to be survey specific. For further
information refer to appropriate case studies.
Record habitat variables associated with the survey area, if required.
Record the number of each target species seen, individual marks, presence of nests, juveniles,
breeding behaviours and other behaviours that might explain presence or absence.
Tally the total number of birds seen in each survey area. Note the number of marked birds seen
(if any) and the total time it took to cover the survey area.
Data storage
Forward copies of completed survey sheets to the survey administrator, or enter data into an
appropriate spreadsheet as soon as possible. Collate, consolidate and store survey information
securely, also as soon as possible, and preferably immediately on return from the field. The key
steps here are data entry, storage and maintenance for later analysis, followed by copying and data
backup for security.
Summarise the results in a spreadsheet or equivalent. Arrange data as ‘column variables’, i.e.
arrange data from each field on the data sheet (date, time, location, plot designation, number seen,
identity, etc.) in columns, with each row representing a surveyed site.
If data storage is designed well at the outset, it will make the job of analysis and interpretation much
easier. Before storing data, check for missing information and errors, and ensure metadata are
recorded.
Storage tools can be either manual or electronic systems (or both, preferably). They will usually be
summary sheets, other physical filing systems, or electronic spreadsheets and databases. Use
appropriate file formats such as .xls, .txt, .dbf or specific analysis software formats. Copy and/or
backup all data, whether electronic, data sheets, metadata or site access descriptions, preferably
offline if the primary storage location is part of a networked system. Store the copy at a separate
location for security purposes.
Analysis, interpretation and reporting
Results from bird counts can be presented in a number of ways. Distribution maps can be drawn,
and the number of birds counted can be graphed or mapped within given sample areas or regions.
Graphical comparisons of counts and analysis of trends among sites, regions and across time
(using, for example, change detection procedures within GIS software) are valid, provided some
conditions are met. There needs to be perfect detectability (or ability to adjust counts to account for
imperfect detectability, e.g. ground-truth aerial photos) and demographic closure (i.e. no significant
births, deaths, immigration or emigration during the study).
Authors must ensure that results are reported regularly and in a timely manner (particularly if the
monitoring programme is a long-term one) and in a format suited to the intended audience. This will
ensure that analysis effort is spread throughout the monitoring programme and will ensure feedback
DOCDM-577914 Birds: complete counts—true census v1.0 7
Inventory and monitoring toolbox: birds
and the continued interest of all participants. All survey participants should receive a copy of the
report.
Case study A
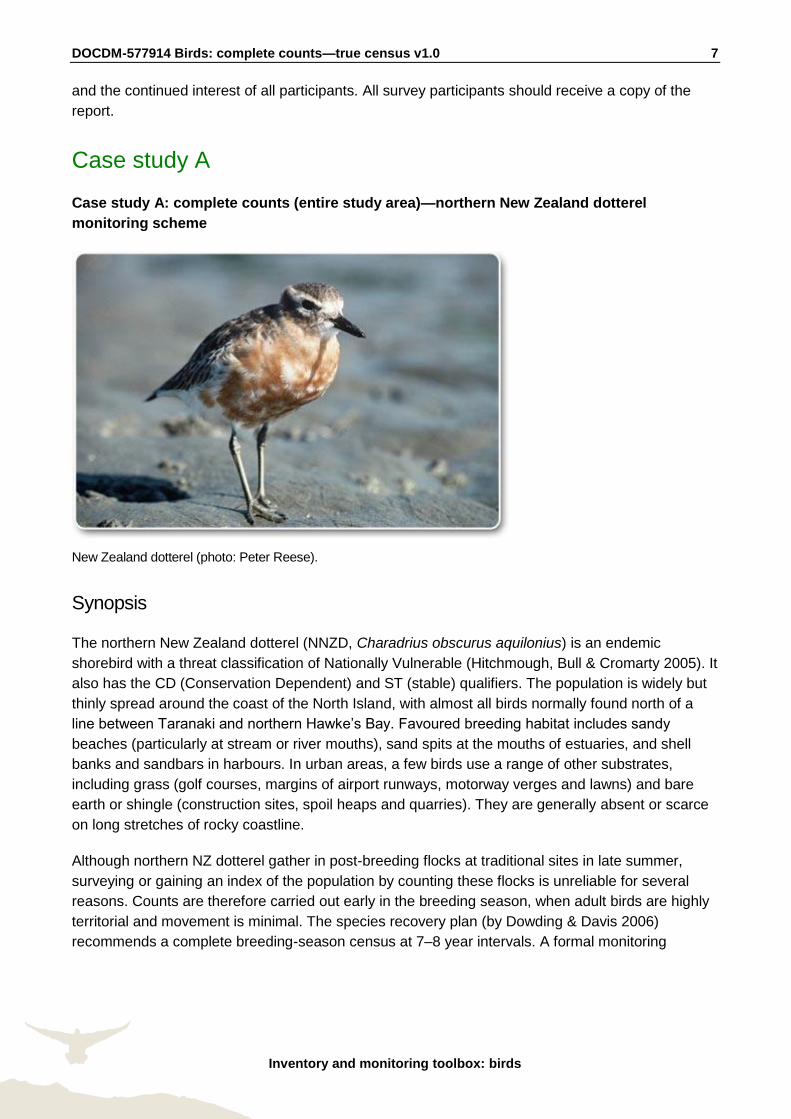
Case study A: complete counts (entire study area)—northern New Zealand dotterel
monitoring scheme
New Zealand dotterel (photo: Peter Reese).
Synopsis
The northern New Zealand dotterel (NNZD, Charadrius obscurus aquilonius) is an endemic
shorebird with a threat classification of Nationally Vulnerable (Hitchmough, Bull & Cromarty 2005). It
also has the CD (Conservation Dependent) and ST (stable) qualifiers. The population is widely but
thinly spread around the coast of the North Island, with almost all birds normally found north of a
line between Taranaki and northern Hawke’s Bay. Favoured breeding habitat includes sandy
beaches (particularly at stream or river mouths), sand spits at the mouths of estuaries, and shell
banks and sandbars in harbours. In urban areas, a few birds use a range of other substrates,
including grass (golf courses, margins of airport runways, motorway verges and lawns) and bare
earth or shingle (construction sites, spoil heaps and quarries). They are generally absent or scarce
on long stretches of rocky coastline.
Although northern NZ dotterel gather in post-breeding flocks at traditional sites in late summer,
surveying or gaining an index of the population by counting these flocks is unreliable for several
reasons. Counts are therefore carried out early in the breeding season, when adult birds are highly
territorial and movement is minimal. The species recovery plan (by Dowding & Davis 2006)
recommends a complete breeding-season census at 7–8 year intervals. A formal monitoring
DOCDM-577914 Birds: complete counts—true census v1.0 8
Inventory and monitoring toolbox: birds
scheme is in place. The first count survey was done in 1989. Site coverage was improved for the
1996 count and has been consistent since then.
Objectives
What is the total breeding population of northern New Zealand dotterels on North Island
beaches during the month of October?
Has the North Island population of New Zealand dotterels declined, remained stable or
increased since 1996? Does any change need to be reflected in the New Zealand Threat
Classification System administered by DOC (Molloy et al. 2002)?
Have there been local or regional changes in dotterel numbers?
Are there changes in the range of this dotterel?
Sampling design and methods
This ambitious scheme involves teams of experienced volunteers, coordinated in each DOC
conservancy by one DOC staff member and one Ornithological Society of New Zealand (OSNZ)
member. Counting is carried out largely by OSNZ members, DOC staff, members of the Royal
Forest & Bird Protection Society, and other volunteers. The census is run as follows:
Counts are conducted in areas of known suitable habitat based on recent and historic records. A
list of sites with suitable NNZD habitat is maintained (in MS Excel files) by each conservancy
and the Recovery Group).
At least 1 month before the census, observers are assigned to specific sites. Instruction and
record sheets are circulated.
The census is undertaken in October, when most birds are breeding and movement is minimal.
A ‘core’ weekend is selected, based on suitable tide heights and times. As many counts as
possible are carried out on this core weekend. In some isolated areas where distances are large
and resources limited (particularly parts of Northland), counts may be conducted up to 1 week
either side of the core weekend.
Counts are made within 2 hours of high water to ensure that off-duty birds foraging in nearby
estuaries are not missed.
Details of location, date, time, and observer (including contact details) are noted on a record
sheet, along with the number of NNZD counted. The identity of any colour-banded birds is also
recorded. Only fledged (flying) birds are counted in the total, but nests and unfledged chicks
seen can be recorded. There is also space on the sheet for records of other species and other
observations.
Record sheets are forwarded to one of the two coordinators in each conservancy within 1 week.
Sheets are checked against the list of sites to ensure there has been full coverage. If a site has
been missed, it is visited as soon as possible.
Record sheets and updated Excel spreadsheet site lists are forwarded to the science advisor of
the recovery group for collation.
DOCDM-577914 Birds: complete counts—true census v1.0 9
Inventory and monitoring toolbox: birds
Results
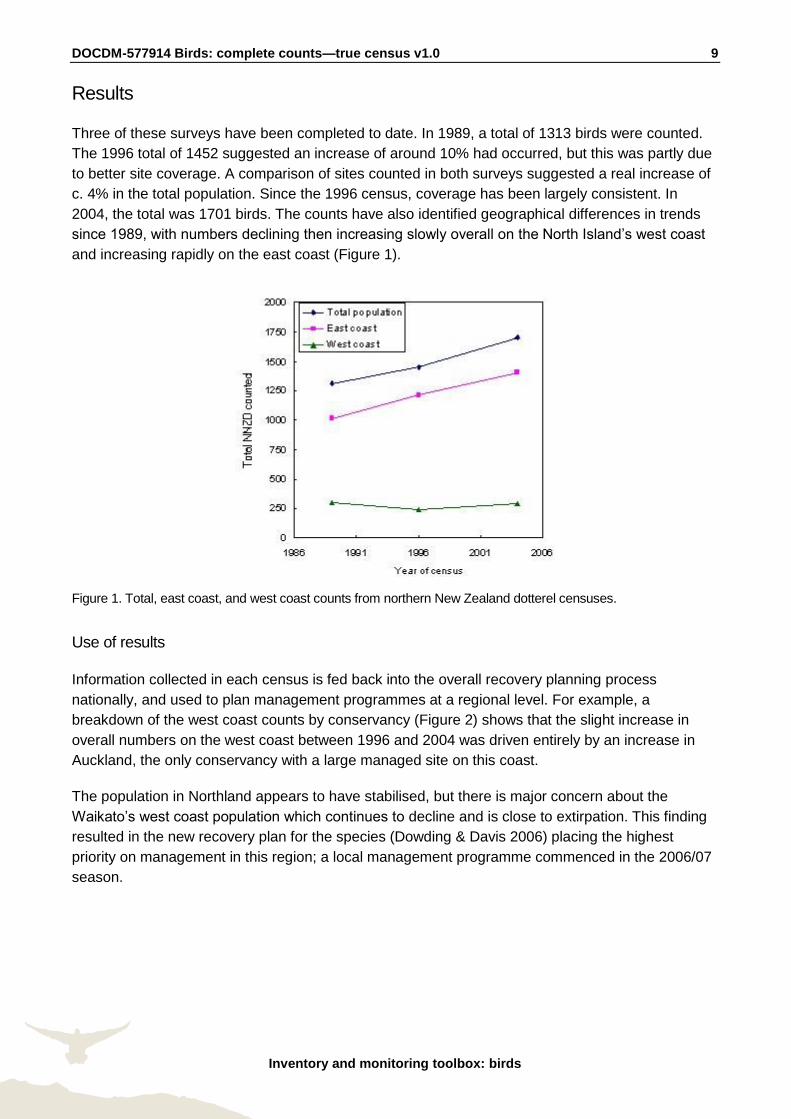
Three of these surveys have been completed to date. In 1989, a total of 1313 birds were counted.
The 1996 total of 1452 suggested an increase of around 10% had occurred, but this was partly due
to better site coverage. A comparison of sites counted in both surveys suggested a real increase of
c. 4% in the total population. Since the 1996 census, coverage has been largely consistent. In
2004, the total was 1701 birds. The counts have also identified geographical differences in trends
since 1989, with numbers declining then increasing slowly overall on the North Island’s west coast
and increasing rapidly on the east coast (Figure 1).
Figure 1. Total, east coast, and west coast counts from northern New Zealand dotterel censuses.
Use of results
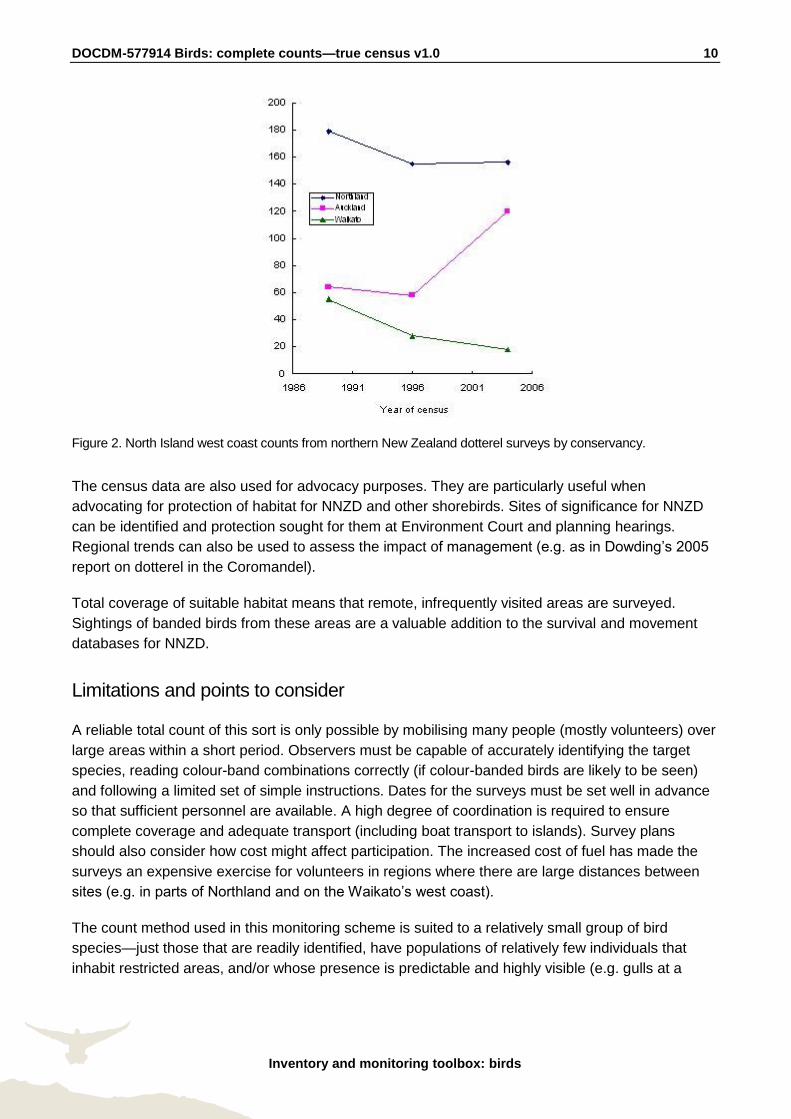
Information collected in each census is fed back into the overall recovery planning process
nationally, and used to plan management programmes at a regional level. For example, a
breakdown of the west coast counts by conservancy (Figure 2) shows that the slight increase in
overall numbers on the west coast between 1996 and 2004 was driven entirely by an increase in
Auckland, the only conservancy with a large managed site on this coast.
The population in Northland appears to have stabilised, but there is major concern about the
Waikato’s west coast population which continues to decline and is close to extirpation. This finding
resulted in the new recovery plan for the species (Dowding & Davis 2006) placing the highest
priority on management in this region; a local management programme commenced in the 2006/07
season.
DOCDM-577914 Birds: complete counts—true census v1.0 10
Inventory and monitoring toolbox: birds
Figure 2. North Island west coast counts from northern New Zealand dotterel surveys by conservancy.
The census data are also used for advocacy purposes. They are particularly useful when
advocating for protection of habitat for NNZD and other shorebirds. Sites of significance for NNZD
can be identified and protection sought for them at Environment Court and planning hearings.
Regional trends can also be used to assess the impact of management (e.g. as in Dowding’s 2005
report on dotterel in the Coromandel).
Total coverage of suitable habitat means that remote, infrequently visited areas are surveyed.
Sightings of banded birds from these areas are a valuable addition to the survival and movement
databases for NNZD.
Limitations and points to consider
A reliable total count of this sort is only possible by mobilising many people (mostly volunteers) over
large areas within a short period. Observers must be capable of accurately identifying the target
species, reading colour-band combinations correctly (if colour-banded birds are likely to be seen)
and following a limited set of simple instructions. Dates for the surveys must be set well in advance
so that sufficient personnel are available. A high degree of coordination is required to ensure
complete coverage and adequate transport (including boat transport to islands). Survey plans
should also consider how cost might affect participation. The increased cost of fuel has made the
surveys an expensive exercise for volunteers in regions where there are large distances between
sites (e.g. in parts of Northland and on the Waikato’s west coast).
The count method used in this monitoring scheme is suited to a relatively small group of bird
species—just those that are readily identified, have populations of relatively few individuals that
inhabit restricted areas, and/or whose presence is predictable and highly visible (e.g. gulls at a
DOCDM-577914 Birds: complete counts—true census v1.0 11
Inventory and monitoring toolbox: birds
landfill). Counts of shore plover, Chatham Island oystercatcher and southern New Zealand dotterel
are other examples of taxa for which this method has worked effectively.
Future counts
As part of the ongoing recovery programme, another census is planned for October 2011 (Dowding
& Davis 2006). The methodology is well established and no major changes are required. Many
volunteers and DOC staff have been involved in two or three of these counts. This continuity is
particularly helpful.
References for case study A
Dowding, J.E. 2005: Management of northern New Zealand dotterels on Coromandel Peninsula.
Unpublished report to Waikato Conservancy, Department of Conservation. DM Consultants,
Christchurch.
Dowding, J.E.; Davis, A.M. 2006: New Zealand dotterel (Charadrius obscurus) recovery plan 2004–
2014. Department of Conservation, Wellington.
Hitchmough, R.; Bull, L.; Cromarty, P. 2005: New Zealand threat classification system lists 2005.
Department of Conservation, Wellington. 194 p.
Molloy, J.; Bell, B.; Clout, M.; de Lange, P.; Gibbs, G.; Given, D.; Norton, D.; Smith, N.; Stephens, T.
2002: Classifying species according to threat of extinction. A system for New Zealand.
Threatened Species Occasional Publication 22. Department of Conservation, Wellington. 26 p.
Full details of technique and best practice for dotterel monitoring
‘Dotterel census notes’ (docdm-132557) provides information on the census taken of the North
Island population of the New Zealand dotterel in October 2004. The data sheet used for this survey
was the ‘Dotterel census form’ (docdm-132556).
Full details of technique and best practice
There is no generic set of rules for the application of total count methods to birds as each species
has its own set of techniques, problems and assumptions. The most important recommendation
common across all counts of this type is to try and maximise the detection rate to as close to p = 1
as possible. This may be a simple matter of increasing the number of observers on a riverbed or
using aircraft to count the number of colonial nesting seabirds. Where there is some suspicion that
not all birds are likely to be detected, a limited set of more intensive counts (plots, transects,
photographs, etc.) can provide a useful means of improving the overall population estimate.
DOCDM-577914 Birds: complete counts—true census v1.0 12
Inventory and monitoring toolbox: birds
References and further reading
Dowding, J.E. 2005: Management of northern New Zealand dotterels on Coromandel Peninsula.
Unpublished report to Waikato Conservancy, Department of Conservation. DM Consultants,
Christchurch.
Dowding, J.E.; Davis, A.M. 2006: New Zealand dotterel (Charadrius obscurus) recovery plan 2004–
2014. Department of Conservation, Wellington.
Dowding, J.E.; Moore, S.J. 2006: Habitat networks of indigenous waders. OSNZ Contract Report
Series, No. 1. Ornithological Society of New Zealand, Wellington.
Hitchmough, R.; Bull, L.; Cromarty, P. 2005: New Zealand threat classification system lists 2005.
Department of Conservation, Wellington. 194 p.
Molloy, J.; Bell, B.; Clout, M.; de Lange, P.; Gibbs, G.; Given, D.; Norton, D.; Smith, N.; Stephens, T.
2002: Classifying species according to threat of extinction. A system for New Zealand.
Threatened Species Occasional Publication 22. Department of Conservation, Wellington. 26 p.
Moore, P.J. 2004: Abundance and population trends of mollymawks on Campbell Island. Science for
Conservation 242. Department of Conservation, Wellington. 62 p.
Moore, P.J.; Blezard, R. 1999: Photographs of Campbell Island mollymawk colonies. A guide to
photopoints, historical comparisons, and counting mollymawks. Department of Conservation
Technical Series 17. Department of Conservation, Wellington. 106 p.
Riegen, A.C.; Dowding, J.E. 2003: The wrybill Anarhynchus frontalis: a brief review of status, threats
and work in progress. Wader Study Group Bulletin 100: 20–24.
Sagar, P.M.; Shankar, U.; Brown, S. 1999: Distribution and numbers of waders in New Zealand, 1983–
1994. Notornis 46: 1–43.
Thompson; W.L.; White; G.C.; Gowan, C. 1998: Monitoring vertebrate populations. Academic Press,
Inc., San Diego. 365 pp.

DOCDM-577914 Birds: complete counts—true census v1.0 13
Appendix A
The following Department of Conservation documents are referred to in this method:
docdm-578675 Birds: complete counts—ground-based photo counts for seabirds
docdm-132556 Dotterel census form
docdm-132557 Dotterel census notes
docdm-146272 Standard inventory and monitoring project plan