Embed Size (px)
Citation preview
Birds track their Grinnellian niche through a centuryof climate changeMorgan W. Tingleya,b,1, William B. Monahanc, Steven R. Beissingera,b, and Craig Moritzb,d
Departments of aEnvironmental Science, Policy, and Management and dIntegrative Biology, and bMuseum of Vertebrate Zoology, University of California,Berkeley, CA 94720; and cAudubon California, 4225 Hollis Street, Emeryville, CA 94608
Edited by David B. Wake, University of California, Berkeley, CA, and approved August 11, 2009 (received for review March 16, 2009)
In the face of environmental change, species can evolve newphysiological tolerances to cope with altered climatic conditions ormove spatially to maintain existing physiological associations withparticular climates that define each species’ climatic niche. Whenenvironmental change occurs over short temporal and large spatialscales, vagile species are expected to move geographically bytracking their climatic niches through time. Here, we test forevidence of niche tracking in bird species of the Sierra Nevadamountains of California, focusing on 53 species resurveyed nearlya century apart at 82 sites on four elevational transects. Changesin climate and bird distributions resulted in focal species shiftingtheir average climatological range over time. By comparing thedirections of these shifts relative to the centroids of species’range-wide climatic niches, we found that 48 species (90.6%)tracked their climatic niche. Analysis of niche sensitivity on anindependent set of occurrence data significantly predicted thetemperature and precipitation gradients tracked by species. Fur-thermore, in 50 species (94.3%), site-specific occupancy modelsshowed that the position of each site relative to the climatic nichecentroid explained colonization and extinction probabilities betterthan a null model with constant probabilities. Combined, ourresults indicate that the factors limiting a bird species’ range in theSierra Nevada in the early 20th century also tended to drivechanges in distribution over time, suggesting that climatic modelsderived from niche theory might be used successfully to forecastwhere and how to conserve species in the face of climate change.
climatic niche � geographic range � elevational gradient �occupancy dynamics
Nearly a century ago, Joseph Grinnell (1) presented theconcept of the ecological niche as the primary determinant
of a species’ range. Grinnell defined the niche as a set ofenvironmental conditions that restricts each species, through‘‘physiological and psychological respects,’’ to a geographicalrange where it can prosper. In particular, Grinnell (2) discussedthe important role played by temperature in ultimately definingrange boundaries, but noted that within the limits of physiolog-ical tolerance, numerous factors, including interspecific compe-tition, can determine realized range boundaries. Since Grinnell,empirical explorations of species’ range determinants have suc-cessfully related environmental limits to range boundariesthrough physiological knowledge (3). At the same time, field andlaboratory experiments have demonstrated that species interac-tions may also limit ranges (4, 5) and climatic associations canrapidly change when species are introduced to new environments(6). Nevertheless, the concept that environmental limiting fac-tors define the niche where a species can have a positive growthrate still remains the dominant explanation for range boundaries(7), suggesting that the spatial extent of the range for mostspecies is approximately equal to the geographical expression ofa species’ niche (8).
Temporal sampling of changing environments makes it pos-sible to measure the dynamic relationship between the environ-ment, a species’ climatic requirements, and its realized range. Ifranges are shaped by physiological limitations that remain fixed
over the time scale of comparison, then species ranges shouldalso move across the landscape as averages and extremes oftemperature, precipitation, and relative humidity change overshort time spans (9–11). This process, by which species followlimiting environmental boundaries through geographical spaceto remain in a favorable climatic space, is called niche tracking(10, 12, 13). Niche tracking can occur when a local population inunfavorable climate conditions becomes extinct or when indi-viduals colonize sites in newly favorable climates. Studies of bothrecent and paleontological climate change have examined nichetracking through range changes (14, 15). If species track nicheslimited by temperature, then they should move upward inelevation or poleward in latitude as the climate warms. A globalmetaanalysis of 434 species that have shifted ranges indicatedthat 81% of species showed this expected pattern in response torecent climate change (16). However, 19% moved in directionsopposite that predicted by temperature, and many others did notchange range. Studies that have explored life history factors aspotential correlates of movement patterns have found no simpleexplanation (17), and there is little empirical evidence for whyspecies show heterogeneous responses (15).
A more direct approach to examining the role of the niche indriving species response to climate change is necessary if theseseemingly contradictory patterns are to be understood. Analysesof shifts in elevational or latitudinal range are used as proxies forshifting temperature gradients (18), yet niches can be defined byany set of abiotic factors that may or may not covary withelevation or latitude (19, 20). If the role of the niche indynamically determining ranges is to be understood, multipleenvironmental facets of the niche need to be explored. Modernresurveys of areas with historical occurrence data provideunique opportunities to empirically test the role of niche track-ing in driving species-specific responses to climate change (21).
Here, we use a unique dataset of changes in avian siteoccupancy over the past century to test the degree to which 53bird species distributed across an elevational gradient track atwo-variable environmental niche through space and time. Weexpect species to have responded to climate change by modifyingtheir ranges to remain within their preexisting climatic niche.Our data come from historical (1911–1929) surveys and con-temporary (2003–2008) resurveys of 82 sites along four eleva-tional transects throughout the Sierra Nevada of California (Fig.1). These sites have seen an average change in breeding season
This paper results from the Arthur M. Sackler Colloquium of the National Academy ofSciences, ‘‘Biogeography, Changing Climates and Niche Evolution,’’ held December 12–13,2008, at the Arnold and Mabel Beckman Center of the National Academies of Sciences andEngineering in Irvine, CA. The complete program and audio files of most presentations areavailable on the NAS web site at www.nasonline.org/Sackler�Biogeography.
Author contributions: M.W.T., W.B.M., S.R.B., and C.M. designed research; M.W.T. andW.B.M. performed research; M.W.T. and W.B.M. analyzed data; and M.W.T., W.B.M., S.R.B.,and C.M. wrote the paper.
The authors declare no conflict of interest.
This article is a PNAS Direct Submission.
1To whom correspondence should be addressed. E-mail: [email protected].
This article contains supporting information online at www.pnas.org/cgi/content/full/0901562106/DCSupplemental.
www.pnas.org�cgi�doi�10.1073�pnas.0901562106 PNAS � November 17, 2009 � vol. 106 � suppl. 2 � 19637–19643
Dow
nloa
ded
by g
uest
on
May
9, 2
020
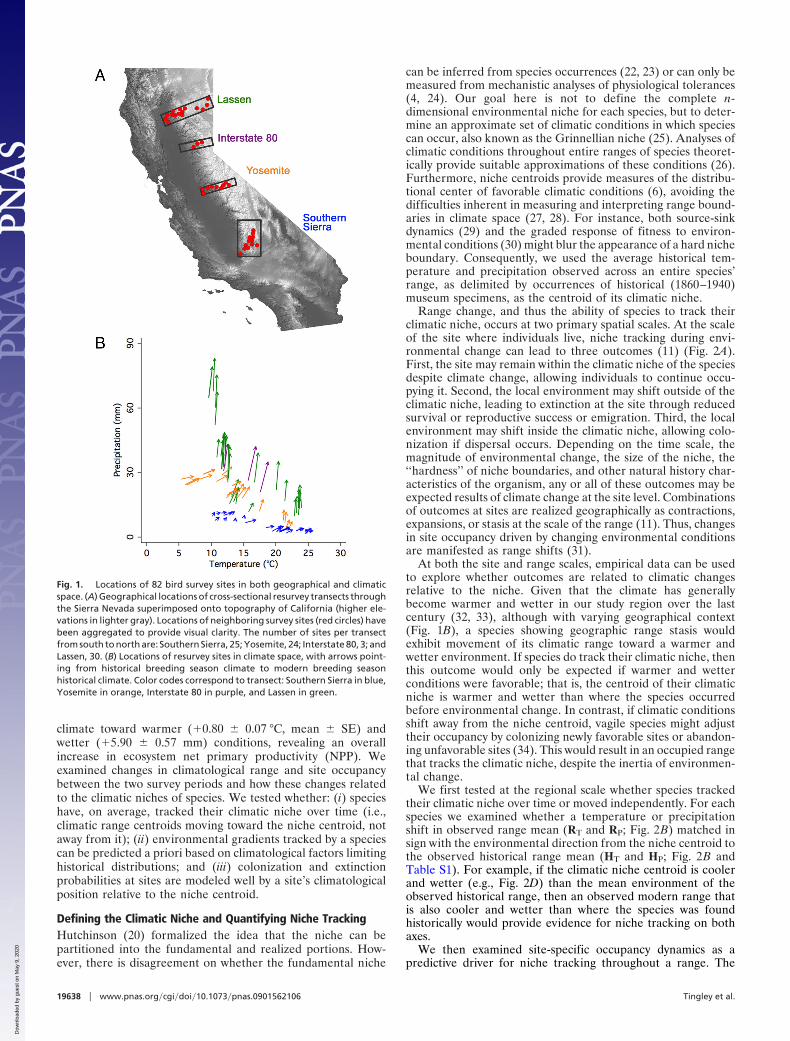
climate toward warmer (�0.80 � 0.07 °C, mean � SE) andwetter (�5.90 � 0.57 mm) conditions, revealing an overallincrease in ecosystem net primary productivity (NPP). Weexamined changes in climatological range and site occupancybetween the two survey periods and how these changes relatedto the climatic niches of species. We tested whether: (i) specieshave, on average, tracked their climatic niche over time (i.e.,climatic range centroids moving toward the niche centroid, notaway from it); (ii) environmental gradients tracked by a speciescan be predicted a priori based on climatological factors limitinghistorical distributions; and (iii) colonization and extinctionprobabilities at sites are modeled well by a site’s climatologicalposition relative to the niche centroid.
Defining the Climatic Niche and Quantifying Niche TrackingHutchinson (20) formalized the idea that the niche can bepartitioned into the fundamental and realized portions. How-ever, there is disagreement on whether the fundamental niche
can be inferred from species occurrences (22, 23) or can only bemeasured from mechanistic analyses of physiological tolerances(4, 24). Our goal here is not to define the complete n-dimensional environmental niche for each species, but to deter-mine an approximate set of climatic conditions in which speciescan occur, also known as the Grinnellian niche (25). Analyses ofclimatic conditions throughout entire ranges of species theoret-ically provide suitable approximations of these conditions (26).Furthermore, niche centroids provide measures of the distribu-tional center of favorable climatic conditions (6), avoiding thedifficulties inherent in measuring and interpreting range bound-aries in climate space (27, 28). For instance, both source-sinkdynamics (29) and the graded response of fitness to environ-mental conditions (30) might blur the appearance of a hard nicheboundary. Consequently, we used the average historical tem-perature and precipitation observed across an entire species’range, as delimited by occurrences of historical (1860–1940)museum specimens, as the centroid of its climatic niche.
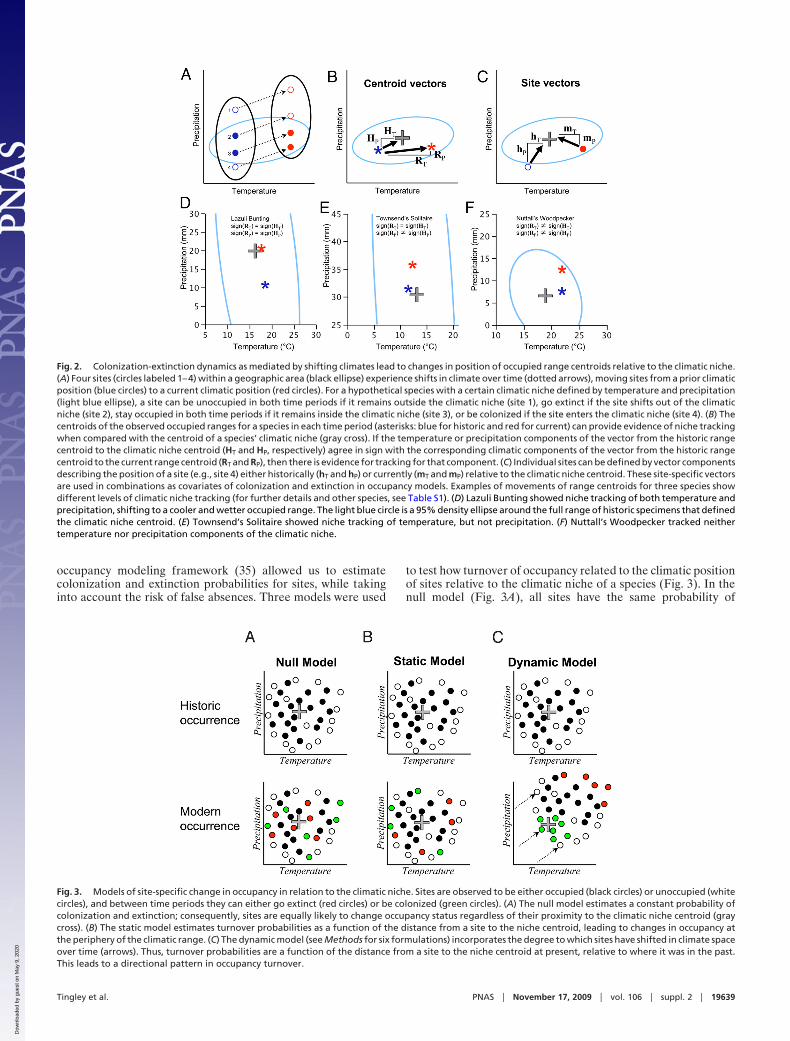
Range change, and thus the ability of species to track theirclimatic niche, occurs at two primary spatial scales. At the scaleof the site where individuals live, niche tracking during envi-ronmental change can lead to three outcomes (11) (Fig. 2A).First, the site may remain within the climatic niche of the speciesdespite climate change, allowing individuals to continue occu-pying it. Second, the local environment may shift outside of theclimatic niche, leading to extinction at the site through reducedsurvival or reproductive success or emigration. Third, the localenvironment may shift inside the climatic niche, allowing colo-nization if dispersal occurs. Depending on the time scale, themagnitude of environmental change, the size of the niche, the‘‘hardness’’ of niche boundaries, and other natural history char-acteristics of the organism, any or all of these outcomes may beexpected results of climate change at the site level. Combinationsof outcomes at sites are realized geographically as contractions,expansions, or stasis at the scale of the range (11). Thus, changesin site occupancy driven by changing environmental conditionsare manifested as range shifts (31).
At both the site and range scales, empirical data can be usedto explore whether outcomes are related to climatic changesrelative to the niche. Given that the climate has generallybecome warmer and wetter in our study region over the lastcentury (32, 33), although with varying geographical context(Fig. 1B), a species showing geographic range stasis wouldexhibit movement of its climatic range toward a warmer andwetter environment. If species do track their climatic niche, thenthis outcome would only be expected if warmer and wetterconditions were favorable; that is, the centroid of their climaticniche is warmer and wetter than where the species occurredbefore environmental change. In contrast, if climatic conditionsshift away from the niche centroid, vagile species might adjusttheir occupancy by colonizing newly favorable sites or abandon-ing unfavorable sites (34). This would result in an occupied rangethat tracks the climatic niche, despite the inertia of environmen-tal change.
We first tested at the regional scale whether species trackedtheir climatic niche over time or moved independently. For eachspecies we examined whether a temperature or precipitationshift in observed range mean (RT and RP; Fig. 2B) matched insign with the environmental direction from the niche centroid tothe observed historical range mean (HT and HP; Fig. 2B andTable S1). For example, if the climatic niche centroid is coolerand wetter (e.g., Fig. 2D) than the mean environment of theobserved historical range, then an observed modern range thatis also cooler and wetter than where the species was foundhistorically would provide evidence for niche tracking on bothaxes.
We then examined site-specific occupancy dynamics as apredictive driver for niche tracking throughout a range. The
Fig. 1. Locations of 82 bird survey sites in both geographical and climaticspace. (A) Geographical locations of cross-sectional resurvey transects throughthe Sierra Nevada superimposed onto topography of California (higher ele-vations in lighter gray). Locations of neighboring survey sites (red circles) havebeen aggregated to provide visual clarity. The number of sites per transectfrom south to north are: Southern Sierra, 25; Yosemite, 24; Interstate 80, 3; andLassen, 30. (B) Locations of resurvey sites in climate space, with arrows point-ing from historical breeding season climate to modern breeding seasonhistorical climate. Color codes correspond to transect: Southern Sierra in blue,Yosemite in orange, Interstate 80 in purple, and Lassen in green.
19638 � www.pnas.org�cgi�doi�10.1073�pnas.0901562106 Tingley et al.
Dow
nloa
ded
by g
uest
on
May
9, 2
020
occupancy modeling framework (35) allowed us to estimatecolonization and extinction probabilities for sites, while takinginto account the risk of false absences. Three models were used
to test how turnover of occupancy related to the climatic positionof sites relative to the climatic niche of a species (Fig. 3). In thenull model (Fig. 3A), all sites have the same probability of
Fig. 2. Colonization-extinction dynamics as mediated by shifting climates lead to changes in position of occupied range centroids relative to the climatic niche.(A) Four sites (circles labeled 1–4) within a geographic area (black ellipse) experience shifts in climate over time (dotted arrows), moving sites from a prior climaticposition (blue circles) to a current climatic position (red circles). For a hypothetical species with a certain climatic niche defined by temperature and precipitation(light blue ellipse), a site can be unoccupied in both time periods if it remains outside the climatic niche (site 1), go extinct if the site shifts out of the climaticniche (site 2), stay occupied in both time periods if it remains inside the climatic niche (site 3), or be colonized if the site enters the climatic niche (site 4). (B) Thecentroids of the observed occupied ranges for a species in each time period (asterisks: blue for historic and red for current) can provide evidence of niche trackingwhen compared with the centroid of a species’ climatic niche (gray cross). If the temperature or precipitation components of the vector from the historic rangecentroid to the climatic niche centroid (HT and HP, respectively) agree in sign with the corresponding climatic components of the vector from the historic rangecentroid to the current range centroid (RT and RP), then there is evidence for tracking for that component. (C) Individual sites can be defined by vector componentsdescribing the position of a site (e.g., site 4) either historically (hT and hP) or currently (mT and mP) relative to the climatic niche centroid. These site-specific vectorsare used in combinations as covariates of colonization and extinction in occupancy models. Examples of movements of range centroids for three species showdifferent levels of climatic niche tracking (for further details and other species, see Table S1). (D) Lazuli Bunting showed niche tracking of both temperature andprecipitation, shifting to a cooler and wetter occupied range. The light blue circle is a 95% density ellipse around the full range of historic specimens that definedthe climatic niche centroid. (E) Townsend’s Solitaire showed niche tracking of temperature, but not precipitation. (F) Nuttall’s Woodpecker tracked neithertemperature nor precipitation components of the climatic niche.
Fig. 3. Models of site-specific change in occupancy in relation to the climatic niche. Sites are observed to be either occupied (black circles) or unoccupied (whitecircles), and between time periods they can either go extinct (red circles) or be colonized (green circles). (A) The null model estimates a constant probability ofcolonization and extinction; consequently, sites are equally likely to change occupancy status regardless of their proximity to the climatic niche centroid (graycross). (B) The static model estimates turnover probabilities as a function of the distance from a site to the niche centroid, leading to changes in occupancy atthe periphery of the climatic range. (C) The dynamic model (see Methods for six formulations) incorporates the degree to which sites have shifted in climate spaceover time (arrows). Thus, turnover probabilities are a function of the distance from a site to the niche centroid at present, relative to where it was in the past.This leads to a directional pattern in occupancy turnover.
Tingley et al. PNAS � November 17, 2009 � vol. 106 � suppl. 2 � 19639
Dow
nloa
ded
by g
uest
on
May
9, 2
020
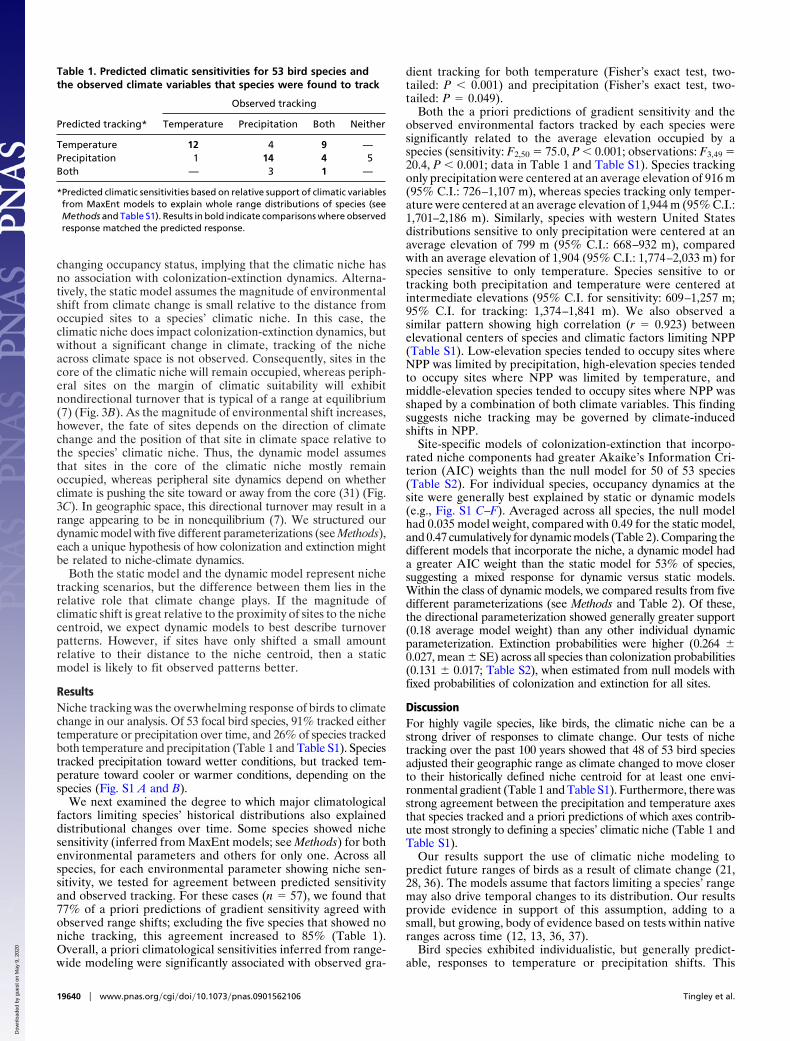
changing occupancy status, implying that the climatic niche hasno association with colonization-extinction dynamics. Alterna-tively, the static model assumes the magnitude of environmentalshift from climate change is small relative to the distance fromoccupied sites to a species’ climatic niche. In this case, theclimatic niche does impact colonization-extinction dynamics, butwithout a significant change in climate, tracking of the nicheacross climate space is not observed. Consequently, sites in thecore of the climatic niche will remain occupied, whereas periph-eral sites on the margin of climatic suitability will exhibitnondirectional turnover that is typical of a range at equilibrium(7) (Fig. 3B). As the magnitude of environmental shift increases,however, the fate of sites depends on the direction of climatechange and the position of that site in climate space relative tothe species’ climatic niche. Thus, the dynamic model assumesthat sites in the core of the climatic niche mostly remainoccupied, whereas peripheral site dynamics depend on whetherclimate is pushing the site toward or away from the core (31) (Fig.3C). In geographic space, this directional turnover may result in arange appearing to be in nonequilibrium (7). We structured ourdynamic model with five different parameterizations (see Methods),each a unique hypothesis of how colonization and extinction mightbe related to niche-climate dynamics.
Both the static model and the dynamic model represent nichetracking scenarios, but the difference between them lies in therelative role that climate change plays. If the magnitude ofclimatic shift is great relative to the proximity of sites to the nichecentroid, we expect dynamic models to best describe turnoverpatterns. However, if sites have only shifted a small amountrelative to their distance to the niche centroid, then a staticmodel is likely to fit observed patterns better.
ResultsNiche tracking was the overwhelming response of birds to climatechange in our analysis. Of 53 focal bird species, 91% tracked eithertemperature or precipitation over time, and 26% of species trackedboth temperature and precipitation (Table 1 and Table S1). Speciestracked precipitation toward wetter conditions, but tracked tem-perature toward cooler or warmer conditions, depending on thespecies (Fig. S1 A and B).
We next examined the degree to which major climatologicalfactors limiting species’ historical distributions also explaineddistributional changes over time. Some species showed nichesensitivity (inferred from MaxEnt models; see Methods) for bothenvironmental parameters and others for only one. Across allspecies, for each environmental parameter showing niche sen-sitivity, we tested for agreement between predicted sensitivityand observed tracking. For these cases (n � 57), we found that77% of a priori predictions of gradient sensitivity agreed withobserved range shifts; excluding the five species that showed noniche tracking, this agreement increased to 85% (Table 1).Overall, a priori climatological sensitivities inferred from range-wide modeling were significantly associated with observed gra-
dient tracking for both temperature (Fisher’s exact test, two-tailed: P � 0.001) and precipitation (Fisher’s exact test, two-tailed: P � 0.049).
Both the a priori predictions of gradient sensitivity and theobserved environmental factors tracked by each species weresignificantly related to the average elevation occupied by aspecies (sensitivity: F2,50 � 75.0, P � 0.001; observations: F3,49 �20.4, P � 0.001; data in Table 1 and Table S1). Species trackingonly precipitation were centered at an average elevation of 916 m(95% C.I.: 726–1,107 m), whereas species tracking only temper-ature were centered at an average elevation of 1,944 m (95% C.I.:1,701–2,186 m). Similarly, species with western United Statesdistributions sensitive to only precipitation were centered at anaverage elevation of 799 m (95% C.I.: 668–932 m), comparedwith an average elevation of 1,904 (95% C.I.: 1,774–2,033 m) forspecies sensitive to only temperature. Species sensitive to ortracking both precipitation and temperature were centered atintermediate elevations (95% C.I. for sensitivity: 609–1,257 m;95% C.I. for tracking: 1,374–1,841 m). We also observed asimilar pattern showing high correlation (r � 0.923) betweenelevational centers of species and climatic factors limiting NPP(Table S1). Low-elevation species tended to occupy sites whereNPP was limited by precipitation, high-elevation species tendedto occupy sites where NPP was limited by temperature, andmiddle-elevation species tended to occupy sites where NPP wasshaped by a combination of both climate variables. This findingsuggests niche tracking may be governed by climate-inducedshifts in NPP.
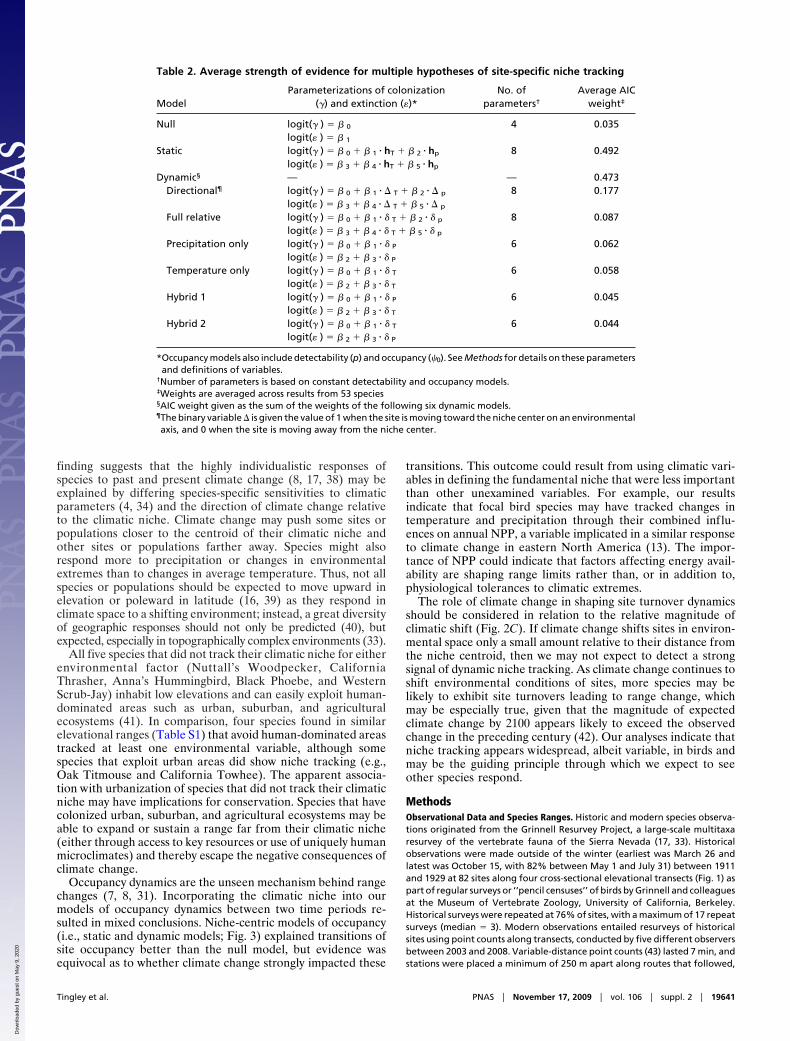
Site-specific models of colonization-extinction that incorpo-rated niche components had greater Akaike’s Information Cri-terion (AIC) weights than the null model for 50 of 53 species(Table S2). For individual species, occupancy dynamics at thesite were generally best explained by static or dynamic models(e.g., Fig. S1 C–F). Averaged across all species, the null modelhad 0.035 model weight, compared with 0.49 for the static model,and 0.47 cumulatively for dynamic models (Table 2). Comparing thedifferent models that incorporate the niche, a dynamic model hada greater AIC weight than the static model for 53% of species,suggesting a mixed response for dynamic versus static models.Within the class of dynamic models, we compared results from fivedifferent parameterizations (see Methods and Table 2). Of these,the directional parameterization showed generally greater support(0.18 average model weight) than any other individual dynamicparameterization. Extinction probabilities were higher (0.264 �0.027, mean � SE) across all species than colonization probabilities(0.131 � 0.017; Table S2), when estimated from null models withfixed probabilities of colonization and extinction for all sites.
DiscussionFor highly vagile species, like birds, the climatic niche can be astrong driver of responses to climate change. Our tests of nichetracking over the past 100 years showed that 48 of 53 bird speciesadjusted their geographic range as climate changed to move closerto their historically defined niche centroid for at least one envi-ronmental gradient (Table 1 and Table S1). Furthermore, there wasstrong agreement between the precipitation and temperature axesthat species tracked and a priori predictions of which axes contrib-ute most strongly to defining a species’ climatic niche (Table 1 andTable S1).
Our results support the use of climatic niche modeling topredict future ranges of birds as a result of climate change (21,28, 36). The models assume that factors limiting a species’ rangemay also drive temporal changes to its distribution. Our resultsprovide evidence in support of this assumption, adding to asmall, but growing, body of evidence based on tests within nativeranges across time (12, 13, 36, 37).
Bird species exhibited individualistic, but generally predict-able, responses to temperature or precipitation shifts. This
Table 1. Predicted climatic sensitivities for 53 bird species andthe observed climate variables that species were found to track
Predicted tracking*
Observed tracking
Temperature Precipitation Both Neither
Temperature 12 4 9 —Precipitation 1 14 4 5Both — 3 1 —
*Predicted climatic sensitivities based on relative support of climatic variablesfrom MaxEnt models to explain whole range distributions of species (seeMethods and Table S1). Results in bold indicate comparisons where observedresponse matched the predicted response.
19640 � www.pnas.org�cgi�doi�10.1073�pnas.0901562106 Tingley et al.
Dow
nloa
ded
by g
uest
on
May
9, 2
020
finding suggests that the highly individualistic responses ofspecies to past and present climate change (8, 17, 38) may beexplained by differing species-specific sensitivities to climaticparameters (4, 34) and the direction of climate change relativeto the climatic niche. Climate change may push some sites orpopulations closer to the centroid of their climatic niche andother sites or populations farther away. Species might alsorespond more to precipitation or changes in environmentalextremes than to changes in average temperature. Thus, not allspecies or populations should be expected to move upward inelevation or poleward in latitude (16, 39) as they respond inclimate space to a shifting environment; instead, a great diversityof geographic responses should not only be predicted (40), butexpected, especially in topographically complex environments (33).
All five species that did not track their climatic niche for eitherenvironmental factor (Nuttall’s Woodpecker, CaliforniaThrasher, Anna’s Hummingbird, Black Phoebe, and WesternScrub-Jay) inhabit low elevations and can easily exploit human-dominated areas such as urban, suburban, and agriculturalecosystems (41). In comparison, four species found in similarelevational ranges (Table S1) that avoid human-dominated areastracked at least one environmental variable, although somespecies that exploit urban areas did show niche tracking (e.g.,Oak Titmouse and California Towhee). The apparent associa-tion with urbanization of species that did not track their climaticniche may have implications for conservation. Species that havecolonized urban, suburban, and agricultural ecosystems may beable to expand or sustain a range far from their climatic niche(either through access to key resources or use of uniquely humanmicroclimates) and thereby escape the negative consequences ofclimate change.
Occupancy dynamics are the unseen mechanism behind rangechanges (7, 8, 31). Incorporating the climatic niche into ourmodels of occupancy dynamics between two time periods re-sulted in mixed conclusions. Niche-centric models of occupancy(i.e., static and dynamic models; Fig. 3) explained transitions ofsite occupancy better than the null model, but evidence wasequivocal as to whether climate change strongly impacted these
transitions. This outcome could result from using climatic vari-ables in defining the fundamental niche that were less importantthan other unexamined variables. For example, our resultsindicate that focal bird species may have tracked changes intemperature and precipitation through their combined influ-ences on annual NPP, a variable implicated in a similar responseto climate change in eastern North America (13). The impor-tance of NPP could indicate that factors affecting energy avail-ability are shaping range limits rather than, or in addition to,physiological tolerances to climatic extremes.
The role of climate change in shaping site turnover dynamicsshould be considered in relation to the relative magnitude ofclimatic shift (Fig. 2C). If climate change shifts sites in environ-mental space only a small amount relative to their distance fromthe niche centroid, then we may not expect to detect a strongsignal of dynamic niche tracking. As climate change continues toshift environmental conditions of sites, more species may belikely to exhibit site turnovers leading to range change, whichmay be especially true, given that the magnitude of expectedclimate change by 2100 appears likely to exceed the observedchange in the preceding century (42). Our analyses indicate thatniche tracking appears widespread, albeit variable, in birds andmay be the guiding principle through which we expect to seeother species respond.
MethodsObservational Data and Species Ranges. Historic and modern species observa-tions originated from the Grinnell Resurvey Project, a large-scale multitaxaresurvey of the vertebrate fauna of the Sierra Nevada (17, 33). Historicalobservations were made outside of the winter (earliest was March 26 andlatest was October 15, with 82% between May 1 and July 31) between 1911and 1929 at 82 sites along four cross-sectional elevational transects (Fig. 1) aspart of regular surveys or ‘‘pencil censuses’’ of birds by Grinnell and colleaguesat the Museum of Vertebrate Zoology, University of California, Berkeley.Historical surveys were repeated at 76% of sites, with a maximum of 17 repeatsurveys (median � 3). Modern observations entailed resurveys of historicalsites using point counts along transects, conducted by five different observersbetween 2003 and 2008. Variable-distance point counts (43) lasted 7 min, andstations were placed a minimum of 250 m apart along routes that followed,
Table 2. Average strength of evidence for multiple hypotheses of site-specific niche tracking
ModelParameterizations of colonization
(�) and extinction (�)*No. of
parameters†
Average AICweight‡
Null logit(� ) � � 0
logit(� ) � � 1
4 0.035
Static logit(� ) � � 0 � � 1 � hT � � 2 � hp
logit(� ) � � 3 � � 4 � hT � � 5 � hp
8 0.492
Dynamic§ — — 0.473Directional¶ logit(� ) � � 0 � � 1 � � T � � 2 � � p
logit(� ) � � 3 � � 4 � � T � � 5 � � p
8 0.177
Full relative logit(� ) � � 0 � � 1 � � T � � 2 � � p
logit(� ) � � 3 � � 4 � � T � � 5 � � p
8 0.087
Precipitation only logit(� ) � � 0 � � 1 � � P
logit(� ) � � 2 � � 3 � � P
6 0.062
Temperature only logit(� ) � � 0 � � 1 � � T
logit(� ) � � 2 � � 3 � � T
6 0.058
Hybrid 1 logit(� ) � � 0 � � 1 � � P
logit(� ) � � 2 � � 3 � � T
6 0.045
Hybrid 2 logit(� ) � � 0 � � 1 � � T
logit(� ) � � 2 � � 3 � � P
6 0.044
*Occupancy models also include detectability (p) and occupancy (�0). See Methods for details on these parametersand definitions of variables.
†Number of parameters is based on constant detectability and occupancy models.‡Weights are averaged across results from 53 species§AIC weight given as the sum of the weights of the following six dynamic models.¶The binary variable � is given the value of 1 when the site is moving toward the niche center on an environmentalaxis, and 0 when the site is moving away from the niche center.
Tingley et al. PNAS � November 17, 2009 � vol. 106 � suppl. 2 � 19641
Dow
nloa
ded
by g
uest
on
May
9, 2
020
as closely as possible, to historic survey paths. Sites were repeatedly surveyeda maximum of five times (median � 3) between May 4 and August 25.
Ofthe240totalbirdspeciesdetectedduringhistoricalandmodernsurveys,weselected 53 focal species that matched desired criteria. First, we selected speciesthat were restricted primarily to the western United States. Two western-restricted subspecies, formerly considered full species, ‘‘Audubon’s’’ Yellow-Rumped Warbler (see Table S1 for taxonomy) and the ‘‘red-shafted’’ NorthernFlicker, were also included. Second, species had to occur during both samplingerasatnineormoresurvey sites,with fourexceptions thatwereaddedapriori fortheir strong association to the western United States and the Sierra Nevada:American Dipper (11 historic sites, 6 modern sites), Anna’s Hummingbird (5 sites,37 sites), California Thrasher (7 sites, 6 sites), and Pacific-Slope Flycatcher (7 sites,10sites).Ourfinalgroupof53specieswasdistributedacrosstheelevational range(see Table S1 for average elevations of each species).
Specimen Data and the Climatic Niche. Historical specimen data (1860–1940)used to estimate the climatic niche were assembled from museum collectionsaccessed through ORNIS (http://olla.berkeley.edu/ornisnet). ORNIS is a dataportal that facilitates easy access to �35 million unique bird records (specimenand observational) housed by 45 different providers. We downloaded allavailable specimen records for each species. Specimens without georefer-ences, or with low coordinate precision (�3 decimal places, in decimal de-grees), were excluded, as were records post-1940 and specimens collectedoutside of the breeding season (breeding in California generally occurs be-tween March and August for resident species and between May and July formigrants). Most specimens from most museums do not yet have estimates ofgeoreference uncertainty (44), so uncertainty was not used as a criterion forinclusion. Obvious outliers, including vagrants or incorrect georeferences,were also excluded. With the exceptions described previously, all subspecies ofeach species were used, providing thorough coverage of the entire knowngeographic range for each species. Geographic coordinates were sortedwithin species, and duplicate coordinates were eliminated to reduce samplingbias. The average number of unique specimen localities for species was 148(SD � 63). We used these historical species locations to calculate the centroidof the climatic niche for each species.
Climate Data. Monthly mean minimum temperature, mean maximum tem-perature, and total precipitation were obtained from the parameter-elevation regressions on independent slopes model (PRISM). PRISM is a knowl-edge-based system that generates monthly by yearly climate surfaces usingmathematical interpolation and expert knowledge (45, 46). PRISM data aremade freely available at 2.5-arc-min spatial resolution (�4 � 4 km), a scalereasonable for both the specimen and observational data. We used themonthly variables to compute mean estimates of temperature and precipita-tion during the breeding season (May through July) sampled in both eras(1910–1930 and 1986–2006). We also used estimates of historical annual meantemperature (T) and annual precipitation (P) to determine which of the twooriginal climate variables limited NPP under the Miami model (47), where
NPP � min� 3,0001 � e1.3150.1197�T , 3,0001 � e0.000664�P�� .
Historical and modern climate values were extracted for locations of specimenand observational data for use in analyses. While the average breeding seasonprecipitation in the Sierra Nevada is relatively low (maximum � 83 mm), thisvariable was highly correlated with average annual precipitation for our sites(r � 0.96 for historical; r � 0.94 for modern). Breeding season temperature wasalso highly correlated with annual mean temperature (r � 0.99 for historical;r � 0.99 for modern). Breeding season values were used for site-specificclimate values, because they provided direct a priori links to changes in avianbreeding season occurrence.
A Priori Hypotheses of Niche Tracking. We used a maximum entropy techniqueimplemented in MaxEnt (48, 49) to determine a priori whether each species’historical range-wide distribution was shaped more by temperature or pre-cipitation. MaxEnt models were developed by using standard default settingsin version 3.2.1 of the program (automatic selection of response functions;maximum number of background points, 10,000; background, conterminous
United States). Climate variables were historical breeding season estimates ofmean temperature and precipitation. Models were developed by using allspatially unique historical specimen localities for each species. We used thepercentage contribution of each variable to the model to develop testablehypotheses of species’ niche sensitivity to breeding season temperature versusprecipitation. Absolute scores of contribution to variables were not directlycomparable within species, so scores were standardized relative to the mediancontribution of each variable across all species. A species with, for example, aprecipitation contribution greater than the median precipitation contribu-tion across all species, would have precipitation selected as an a priori predic-tor of niche sensitivity. All species had either a temperature or a precipitationscore greater than the median, and four species had both.
Occupancy Modeling. Multiseason occupancy models (35) were built to exam-ine site-specific occupancy dynamics as a predictive driver for niche trackingthroughout a range. Multiseason occupancy models simultaneously estimatea probability of detection (p), an initial probability of occupancy (�0), aprobability of colonization (�), and a probability of extinction (�) based onhistories of presence and nondetection at sites over time. The strength ofthese models lies in being able to estimate occupancy parameters while takinginto account the probability that a species was present and went undetectedat each site, which is critical when dealing with historical occurrence data (17).
We fit covariates to occupancy parameters in two stages, following ref. 17.First, we ran four detectability models for each species (allowing detectabilityto vary by survey era or Julian day) with constant (no covariates) models for �0,�, and �. Models were compared by using AIC (50). The best detectabilitymodel (highest AIC weight, wi) for each species was used to parameterize p forall subsequent colonization and extinction models for that species.
Second, eight occupancy models were compared by using different com-binations of covariates for � and � (35). The null model (Table 2 and Fig. 3A)had no covariates (i.e., constant probability of � and �). The static model (Table2 and Fig. 3B) used the temperature and precipitation vectors hT and hP (Fig.2C), which measure the distance from each site’s historic climatic location toeach species’ niche centroid, as covariates for � and �. The dynamic models (Table2 and Fig. 3C) were divided into two different sets based on covariates ofcolonization and extinction. The first set (directional dynamic) used only whetherclimate change pushed a site toward or away from the climatic niche centroid(represented by a binary variable, �). The second set (relative dynamic) used arelative distance index, �, to examine how climate pushed a site relative to itsstarting and ending proximity to the climatic niche centroid. We defined:
�T � e��mT�
�hT� � and �P � e��mP�
�hP� � ,
where mT and mP are the temperature and precipitation components of thevector from the modern climate at a site to the niche centroid (Fig. 2C). Thisindex, �, approaches zero when a site is located very close to the climatic nichecentroid and then is moved by climate change very far away. It approaches onewhen a site is located far away from the climatic niche and is moved by climatechange to the centroid of the niche. A site that does not change distance (i.e.,no climate change) from the niche mean would have a value of � equal to 0.37(e1). We tested five different types of relative dynamic models (Table 2): a fullmodel where �T and �P were covariates of both � and �, and the four possiblecombinations of either �T or �P as single covariates of � and �.
All eight occupancy models were compared and ranked by AIC weight,which gives an estimate of the weight of evidence from the data in supportof a particular model (50). To compare directly among hypotheses, the AICweight of each model in the model set was calculated. The cumulativeweight for all dynamic models (50) was compared with the static andrandom models.
ACKNOWLEDGMENTS. We thank Andrew Rush, Allison Shultz, Teresa Feo,Pascal Title, Paul Newsam, Nadje Najar, Felix Ratcliff, Andrew Greene, KarenRowe, and Sara Weinstein for assistance with data collection; Orien Richmond,Jen Wang, Philippe Girard, and three anonymous reviewers for helpful com-ments that improved earlier drafts of the article; and Michelle Koo and PhilipBlumenshine for graphical help. This work, a contribution of the GrinnellResurvey Project, was supported by National Science Foundation Grant DEB0640859 and the Yosemite Foundation.
1. Grinnell J (1917) The niche relationship of the California thrasher. Auk 34:427–433.2. Grinnell J (1917) Field tests of theories concerning distributional control. Am Nat
51:115–128.3. Root TL (1988) Energy constraints on avian distributions and abundances. Ecology
69:330–339.
4. Davis AJ, Lawton JH, Shorrocks B, Jenkinson LS (1998) Individualistic species responsesinvalidate simple physiological models of community dynamics under global environ-mental change. J Anim Ecol 67:600–612.
5. Suttle KB, Thomsen MA, Power ME (2007) Species interactions reverse grasslandresponses to changing climate. Science 315:640–642.
19642 � www.pnas.org�cgi�doi�10.1073�pnas.0901562106 Tingley et al.
Dow
nloa
ded
by g
uest
on
May
9, 2
020

6. Broennimann O, et al. (2007) Evidence of climatic niche shift during biological invasion.Ecol Lett 10:701–709.
7. Holt RD, Keitt TH, Lewis MA, Maurer BA, Taper ML (2005) Theoretical models of species’borders: Single-species approaches. Oikos 108:18–27.
8. Brown JH, Stevens GC, Kaufman DM (1996) The geographic range: Size, shape, bound-aries, and internal structure. Annu Rev Ecol Syst 27:597–623.
9. Peterson AT (2003) Projected climate change effects on Rocky Mountain Great Plainsbirds: Generalities of biodiversity consequences. Glob Change Biol 9:647–655.
10. Graham RW, et al. (1996) Spatial response of mammals to late quaternary environ-mental fluctuations. Science 272:1601–1606.
11. Jackson ST, Overpeck JT (2000) Responses of plant populations and communities toenvironmental changes of the late Quaternary. Paleobiology 26(Suppl):194–220.
12. Martinez-Meyer E, Peterson AT, Hargrove WW (2004) Ecological niches as stabledistributional constraints on mammal species, with implications for Pleistocene extinc-tions and climate change projections for biodiversity. Glob Ecol Biogeogr 13:305–314.
13. Monahan WB, Hijmans RJ (2008) Ecophysiological constraints shape autumn migratoryresponse to climate change in the North American field sparrow. Biol Lett 4:595–598.
14. Root TL, et al. (2003) Fingerprints of global warming on wild animals and plants. Nature421:57–60.
15. Parmesan C, et al. (2005) Empirical perspectives on species borders: From traditionalbiogeography to global change. Oikos 108:58–75.
16. Parmesan C, Yohe G (2003) A globally coherent fingerprint of climate change impactsacross natural systems. Nature 421:37–42.
17. Moritz C, et al. (2008) Impact of a century of climate change on small-mammalcommunities in Yosemite National Park, USA. Science 322:261–264.
18. Parmesan C (2006) Ecological and evolutionary responses to recent climate change.Annu Rev Ecol Evol Syst 37:637–669.
19. Chase JM, Leibold MA (2003) Ecological Niches: Linking Classical and ContemporaryApproaches (Univ Chicago Press, Chicago).
20. Hutchinson GE (1957) Concluding remarks. Cold Spring Harbor Symp Quant Biol22:415–427.
21. Wiens JJ, Graham CH (2005) Niche conservatism: Integrating evolution, ecology, andconservation biology. Annu Rev Ecol Evol Syst 36:519–539.
22. Peterson AT, Soberon J, Sanchez-Cordero V (1999) Conservatism of ecological niches inevolutionary time. Science 285:1265–1267.
23. Soberon J, Peterson AT (2005) Interpretation of models of fundamental ecologicalniches and species’ distributional areas. Biodiversity Informatics 2:1–10.
24. Kearney M, Porter WP (2009) Mechanistic niche modeling: Combining physiologicaland spatial data to predict species’ ranges. Ecol Lett 12:334–350.
25. Soberon J (2007) Grinnellian and Eltonian niches and geographic distributions ofspecies. Ecol Lett 10:1115–1123.
26. Araujo MB, Guisan A (2006) Five (or so) challenges for species distribution modelling.J Biogeogr 33:1677–1688.
27. Guisan A, Thuiller W (2005) Predicting species distribution: Offering more than simplehabitat models. Ecol Lett 8:993–1009.
28. Kearney M (2006) Habitat, environment, and niche: What are we modeling? Oikos115:186–191.
29. Pulliam HR (2000) On the relationship between niche and distribution. Ecol Lett3:349–361.
30. Holt RD, Gaines MS (1992) Analysis of adaptation in heterogenous landscapes: Impli-cations for the evolution of fundamental niches. Evol Ecol 6:433–447.
31. Anderson BJ, et al. (2009) Dynamics of range margins for metapopulations underclimate change. Proc R Soc London Ser B 276:1415–1420.
32. Bonfils C, et al. (2008) Identification of external influences on temperatures in Cali-fornia. Climatic Change 87:43–55.
33. Parra JL, Monahan WB (2008) Variability in 20th century climate change reconstruc-tions and its consequences for predicting geographic responses of California mammals.Glob Change Biol 14:1–17.
34. Araujo MB, Thuiller W, Pearson RG (2006) Climate warming and the decline ofamphibians and reptiles in Europe. J Biogeogr 33:1712–1728.
35. MacKenzie DI, et al. (2006) Occupancy Estimation and Modeling (Academic, Burling-ton, MA).
36. Araujo MB, Pearson RG, Thuiller W, Erhard M (2005) Validation of species-climateimpact models under climate change. Glob Change Biol 11:1504–1513.
37. Martinez-Meyer E, Peterson AT (2006) Conservatism of ecological niche characteristicsin North American plant species over the Pleistocene-to-recent transition. J Biogeogr33:1779–1789.
38. Taper ML, Bohning-Gaese K, Brown JH (1995) Individualistic responses of bird speciesto environmental change. Oecologia 101:478–486.
39. Peters RL, Darling JDS (1985) The greenhouse effect and nature reserves. Bioscience35:707–717.
40. Peterson AT, et al. (2002) Future projections for Mexican faunas under global climatechange scenarios. Nature 416:626–629.
41. Blair RB (1996) Land use and avian species diversity along an urban gradient. Ecol Appl6:506–519.
42. Intergovernmental Panel on Climate Change (2007) Climate Change 2007: SynthesisReport. Contribution of Working Groups I, II and III to the Fourth Assessment Reportof the Intergovernmental Panel on Climate Change, eds Pachauri RK, Reisinger A(Intergovernmental Panel on Climate Change, Geneva), p 104.
43. Ralph CJ, Droege S, Sauer JR (1995) Managing and monitoring birds using point counts:Standards and applications. Monitoring Bird Populations by Point Counts, eds RalphCJ, Droege S, Sauer JR (U.S. Departure of Agriculture Forest Service, Washington, DC),General Technical Report PSW-GTR-149, pp 161–170.
44. Wieczorek J, Guo QG, Hijmans RJ (2004) The point-radius method for georeferencinglocality descriptions and calculating associated uncertainty. Int J Geogr Inf Sci 18:745–767.
45. Daly C, Gibson WP, Taylor GH, Johnson GL, Pasteris P (2002) A knowledge-basedapproach to the statistical mapping of climate. Climate Res 22:99–113.
46. Daly C, Neilson RP, Phillips D (1994) A statistical-topographic model for mappingclimatological precipitation over mountainous terrain. J Appl Meteorol 33:140–158.
47. Leith H (1975) Primary Productivity of the Biosphere, eds Leith H, Whittaker RH(Springer, New York, NY), pp 237–263.
48. Elith J, et al. (2006) Novel methods improve prediction of species’ distributions fromoccurrence data. Ecography 29:129–151.
49. Phillips SJ, Anderson RP, Schapire RE (2006) Maximum entropy modeling of speciesgeographic distributions. Ecol Model 190:231–259.
50. Burnham KP, Anderson DR (2002) Model Selection and Multimodel Inference(Springer, New York).
Tingley et al. PNAS � November 17, 2009 � vol. 106 � suppl. 2 � 19643
Dow
nloa
ded
by g
uest
on
May
9, 2
020