Embed Size (px)
Citation preview

Birmingham Labour Market Update Q2 2020
Economic Research & Policy Inclusive Growth Directorate

77,380 14.5% +494 +0.1% points
15,344 18.3% +304 +0.4% points
472,900 64.6% -3,500 -0.6% points
205,500 28.0% -2,700 -0.4% points
Youth 18-24
Labour Market Dashboard
Claimant Count Unemployment - June 2020 Seasonally Adjusted
Resident Employment 16-64 - Q1 2020
16-64 Economic Inactivity - Q1 2020

Important Notice - Universal Credit Roll Out Impact on Claimant Count
The Claimant Count is the number of people claiming Jobseeker's Allowance plus those who claim Universal Credit and are required to seek work and be available for work. It is the new headline measure of those claiming benefits principally for the reason of being unemployed.
The full service roll out of Universal Credit in the city between Nov 17 and Feb 18 has led to an increase in the claimant count in the city (as it has done in other full service areas), this is for two main reasons:
• Universal Credit requires a broader span of people to look for work than was the case for existing benefits such as ESA.
• New claimants who are awaiting or appealing Work Capability Assessments are being required to look for work and thus being counted as unemployed rather than economically inactive.
Claimant Count Unemployment June 2020
UK
2,625,475
35,865
7.8%
2
Birmingham
30,685
-140
6.1%
B'ham
78,735
+1,105
14.7%
Seasonally Adjusted Unemployment The latest claimant unemployment figures released by the Office for National Statistics (ONS) show that seasonally adjusted claimant unemployment in Birmingham increased by 494 in June 2020 to stand at 77,380; the rate increased to 14.5%. The rate of growth in the claimant count has however slowed sharply in June as the economy reopened.
Unadjusted Unemployment In Birmingham, the unadjusted claimant count increased by 1,105 to 78,735 in June 2020. The unadjusted rate increased to 14.7%. Unadjusted unemployment decreased marginally for the WMCA (3 LEPs) and the UK as a whole last month.
0.0%
2.0%
4.0%
6.0%
8.0%
10.0%
12.0%
14.0%
16.0%Chart 1: Seasonally Adjusted Unemployment
Birmingham West Midlands UK
Table 1 - Seasonally Adjusted Claimant Unemployment June 2020
Area Total
Number Claimant Rate
United Kingdom 2,631,384 7.8%
West Midlands Region 261,658 9.0%
Birmingham 77,380 14.5%
77,380 +494
14.5% +0.1% Point
Seasonally adjusted claimant count unemployment decreased in the West Midlands and nationally last month. Chart 1 illustrates that after falling sharply to return to pre recession levels unemployment in the city had been relatively stable but began to increase during 2018 due to the benefit eligibility changes associated with the roll out of Universal Credit. The impact of the Covid-19 outbreak can clearly be seen with the sharp spike in unemployment from March 2020 onwards.
WMCA
206,735
-135
10.1%

Unadjusted Unemployment - Core Cities
Table 2 shows that Birmingham has a comparatively high claimant unemployment rate. At 14.7%, Birmingham’s claimant unemployment rate is the highest of the core cities - significantly above the core city average of 11.1%. Unadjusted claimant count unemployment increased in 6 of the 10 core cities last month.
Birmingham Constituencies
Table 3—Unadjusted Unemployment by Constituency June 2020
Constituency JSA
Claimants
Out of Work UC
Claimants
Total Claimant Unemployed
Number Claimant
Rate Claimant
Proportion
Edgbaston 746
5,254 6,000 8.5% 10.0%
Erdington 990
7,115 8,105 12.3% 15.8%
Hall Green 852
8,038 8,890 11.5% 21.3%
Hodge Hill 1,154
9,466 10,620 13.5% 20.8%
Ladywood 1,555
12,330 13,885 13.2% 23.2%
Northfield 750
5,640 6,390 10.1% 14.5%
Perry Barr 965
8,265 9,230 12.7% 16.6%
Selly Oak 641
4,744 5,385 7.2% 11.4%
Sutton Coldfield 400
2,110 2,510 4.5% 3.8%
Yardley 843
6,882 7,725 11.0% 13.0%
Birmingham 8,896
69,839 78,735 10.7% 14.7%
Table 3 shows claimant unemployment data relating to the constituencies. Ward data is shown on page 5.
The constituency of Ladywood has the highest claimant unemployment rate (23.2%). The Sutton Coldfield constituency has the lowest unemployment rate (3.8%).
Cla
ima
nt C
ou
nt U
ne
mp
loym
en
t
Table 2 - Unadjusted Claimant Unemployed: Core Cities June 2020
Area JSA
Claimants
Total Claimant Unemployed Out of Work UC
Claimants Number Claimant
Proportion Claimant
Rate
Birmingham 8,896 69,839 78,735 10.7% 14.7%
Manchester 2,421 31,719 34,140 8.9% 12.2%
Liverpool 3,209 26,091 29,300 8.7% 12.1%
Glasgow 4,675 31,845 36,520 8.3% 11.7%
Nottingham 2,672 15,153 17,825 7.7% 11.2%
Newcastle 1,227 14,138 15,365 7.5% 10.6%
Leeds 5,072 30,538 35,610 6.9% 8.6%
Cardiff 1,518 14,132 15,650 6.4% 7.8%
Bristol 2,098 17,852 19,950 6.3% 7.6%
Sheffield 3,238 19,527 22,765 5.9% 7.5%
Core Cities 35,026 270,834 305,860 8.1% 11.1%
WMCA (3 LEPs) 25,195 181,540 206,735 7.9% 10.1%
GBS LEP Area 12,711 96,259 108,970 8.5% 11.0%
Greater London 50,299 408,671 458,970 7.6% 9.4%
United Kingdom 311,880 2,313,595 2,625,475 6.3% 7.8%
Claimant proportion: claimants divided by working age population
Claimant rate: claimants divided by economically active working age residents.
WMCA
7.8%
Core Cities
11.1%
Birmingham
147%
3

Birmingham Wards
Table 4, on page 5, shows claimant unemployment data for the Birmingham wards. The ward unemployment proportions vary widely with the Sutton wards having the lowest proportions and Birchfield (20.1%) and Handsworth (18.9%) and Lozells (18.8%) the highest .
Table 4 also shows the monthly change in claimant count unemployment at ward level. 49 of the city’s 69 wards experienced an increase in claimant count unemployment between May and June 2020.
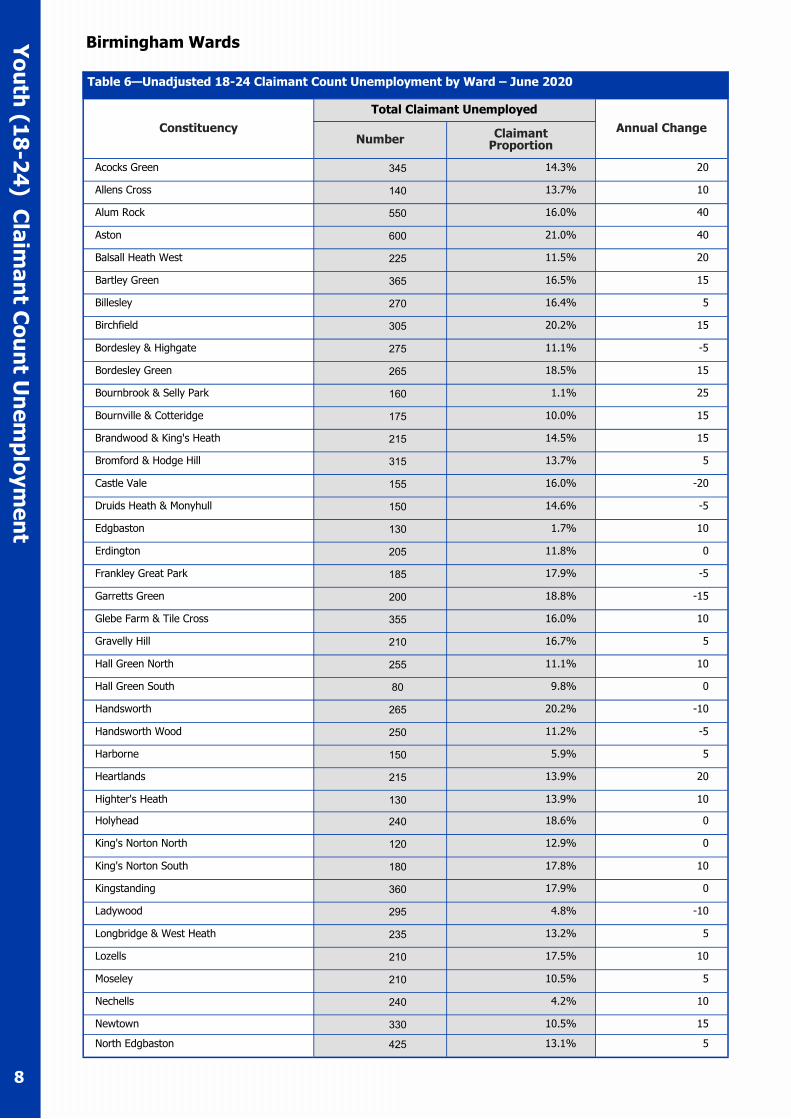
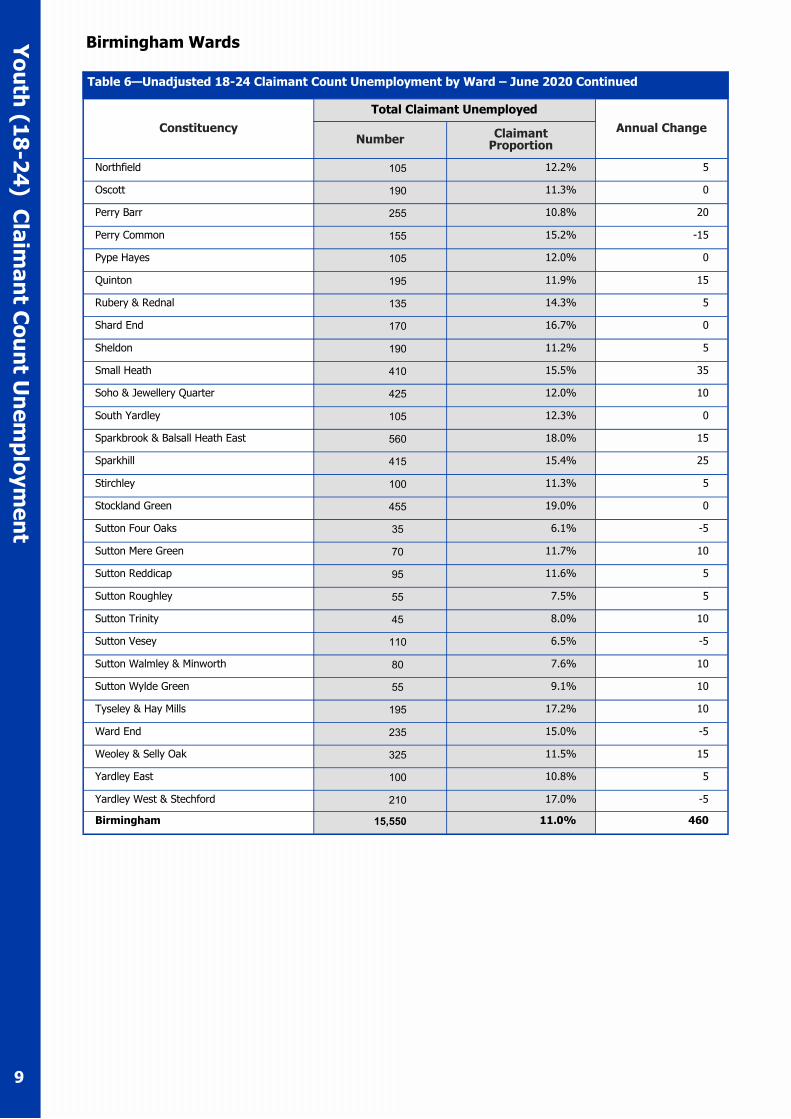
The number of youth (18-24) claimants in each ward is also contained in Table 4. Aston ward (600) and Sparkbrook & Balsall Heath East (560) have the highest number of youth claimants in Birmingham. Sutton Four Oaks (35) has the fewest.
Map 1 below displays claimant unemployment in Birmingham by Super Output Area (SOA). It shows that the highest levels of unemployment are largely concentrated in the inner city areas of Birmingham with some pockets in outer city areas.
Cla
ima
nt C
ou
nt U
ne
mp
loym
en
t
4

Table 4— Ward Claimant Unemployment – June 2020
Ward
Total Claimant Unemployed
Monthly Changer
Annual Change
18-24 Claimants
Number Claimant
Proportion
Acocks Green 1,700 11.0% 25 785 345
Allens Cross 695 10.5% 5 280 140
Alum Rock 2,655 15.8% 135 1,065 550
Aston 2,830 18.4% 105 1,155 600
Balsall Heath West 1,080 13.3% 55 455 225
Bartley Green 1,680 12.0% -30 585 365
Billesley 1,285 10.6% -25 555 270
Birchfield 1,660 20.1% 60 615 305
Bordesley & Highgate 1,470 13.6% 5 555 275
Bordesley Green 1,315 17.0% 60 560 265
Bournbrook & Selly Park 670 3.1% 5 205 160
Bournville & Cotteridge 710 6.5% -15 240 175
Brandwood & King's Heath 1,005 8.2% -25 415 215
Bromford & Hodge Hill 1,465 11.2% 25 670 315
Castle Vale 685 11.3% -10 260 155
Druids Heath & Monyhull 820 11.2% -30 260 150
Edgbaston 755 4.5% 30 295 130
Erdington 1,350 10.5% 25 580 205
Frankley Great Park 875 12.0% -20 365 185
Garretts Green 820 12.6% -25 315 200
Glebe Farm & Tile Cross 1,855 12.8% 35 725 355
Gravelly Hill 1,085 14.8% 10 355 210
Hall Green North 1,250 8.8% 25 650 255
Hall Green South 340 5.4% - 205 80
Handsworth 1,560 18.9% 35 530 265
Handsworth Wood 1,370 9.9% 30 655 250
Harborne 1,105 7.0% 10 440 150
Heartlands 1,070 13.5% 80 480 215
Highter's Heath 615 8.7% -30 310 130
Holyhead 1,190 14.8% 60 595 240
King's Norton North 590 8.4% 5 250 120
King's Norton South 845 12.7% 5 310 180
Kingstanding 1,535 11.8% 15 640 360
Ladywood 2,075 8.9% 25 815 295
Longbridge & West Heath 1,200 9.5% -20 480 235
Lozells 1,160 18.8% 15 435 210
Moseley 1,420 9.7% 5 530 210
Nechells 1,250 10.2% 15 370 240
Newtown 1,665 17.0% 35 580 330
North Edgbaston 2,275 13.2% 55 960 425
Cla
ima
nt C
ou
nt U
ne
mp
loym
en
t
5

Table 4— Ward Claimant Unemployment – June 2020 Continued
Ward
Total Claimant Unemployed Monthly
Changer 18-24
Claimants Annual Change
Number Claimant
Proportion
Northfield
480 7.5% - 5 205 105
Oscott
960 7.6% - 35 455 190
Perry Barr
1,155 8.7% 30 575 255
Perry Common
790 11.0%
5
325 155
Pype Hayes
650 9.6% 30 245 105
Quinton
1,120 8.9% 20 455 195
Rubery & Rednal
650 9.8%
5
205 135
Shard End
945 12.7%
5
395 170
Sheldon
960 7.9% - 20 465 190
Small Heath
1,780 13.7% 75 910 410
Soho & Jewellery Quarter
2,505 12.7% 85 1,030 425
South Yardley
585 8.6%
5
275 105
Sparkbrook & Balsall Heath East
2,715 16.3% 60 1,035 560
Sparkhill
1,885 13.7% 35 895 415
Stirchley
535 7.9% - 25 200 100
Stockland Green
2,235 14.0% 30 845 455
Sutton Four Oaks
190 3.7% - 125 35
Sutton Mere Green
225 4.1%
5
120 70
Sutton Reddicap
465 7.6% - 10 240 95
Sutton Roughley
250 3.7% - 25 180 55
Sutton Trinity
215 4.0% 15 110 45
Sutton Vesey
560 4.6% - 50 305 110
Sutton Walmley & Minworth
430 4.5% 15 235 80
Sutton Wylde Green
170 3.3%
5
85 55
Tyseley & Hay Mills
1,050 13.9% 30 530 195
Ward End
1,165 14.0% 40 515 235
Weoley & Selly Oak
1,515 10.2%
5
530 325
Yardley East
535 8.5% 10 205 100
Yardley West & Stechford
1,020 13.3% - 25 420 210
Birmingham
78,735 10.7% 1,105 32,655 15,550
Cla
ima
nt C
ou
nt U
ne
mp
loym
en
t
6
Seasonally Adjusted Youth (18-24) Unemployment The latest seasonally adjusted youth (18-24) claimant unemployment figures released by the Office for National Statistics (ONS) show that seasonally adjusted youth claimant unemployment in Birmingham increased by 304 in June 2020 to stand at 15,344; the rate rose to 18.3%.
.
Seasonally adjusted claimant count unemployment for young people increased in the WMCA and the UK last month. Chart 1 illustrates that after falling sharply to return to pre recession levels youth unemployment in the city had been relatively stable but has been increasing since early 2018, again in part driven by changes in benefit eligibility associated with the roll out of Universal Credit. Youth unemployment has risen sharply since March as a result of the pandemic but the rate of increase did slow in June compared to the previous two months.
Unadjusted Youth Unemployment In Birmingham, the unadjusted youth claimant count increased by 460 to 15,550 in June. The unadjusted rate increased to 18.6%. The unadjusted 18-24 count also increased for the WMCA (3 LEPs) and at a UK level last month.
15,344 +304
18.3% +0.4% points
Yo
uth
(18
-24
) Cla
ima
nt C
ou
nt U
ne
mp
loym
en
t
Table 5 - Seasonally Adjusted Youth Claimant Unemployment - June 2020
Number Claimant Rate
Claimant Proportion
Birmingham 15,344 18.3% 10.9%
WMCA (3 LEP Area) 41,474 16.4% 10.4%
Core City Average 59,430 15.1% 7.6%
United Kingdom 515,262 13.6% 9.0%
0.0%2.0%4.0%6.0%8.0%
10.0%12.0%14.0%16.0%18.0%20.0%
Seasonally Adjusted Youth Claimant Count Unemployment rate
Birmingham WMCA Core Cities UK
7
WMCA
41,735
+1,215
16.5%
UK
514,770
+18,595
13.6%
8%
Birmingham
15,550
+460
18.6%
Yo
uth
(18
-24
) Cla
ima
nt C
ou
nt U
ne
mp
loym
en
t
Table 6—Unadjusted 18-24 Claimant Count Unemployment by Ward – June 2020
Constituency
Total Claimant Unemployed
Annual Change Number
Claimant Proportion
Acocks Green 345 14.3% 20
Allens Cross 140 13.7% 10
Alum Rock 550 16.0% 40
Aston 600 21.0% 40
Balsall Heath West 225 11.5% 20
Bartley Green 365 16.5% 15
Billesley 270 16.4% 5
Birchfield 305 20.2% 15
Bordesley & Highgate 275 11.1% -5
Bordesley Green 265 18.5% 15
Bournbrook & Selly Park 160 1.1% 25
Bournville & Cotteridge 175 10.0% 15
Brandwood & King's Heath 215 14.5% 15
Bromford & Hodge Hill 315 13.7% 5
Castle Vale 155 16.0% -20
Druids Heath & Monyhull 150 14.6% -5
Edgbaston 130 1.7% 10
Erdington 205 11.8% 0
Frankley Great Park 185 17.9% -5
Garretts Green 200 18.8% -15
Glebe Farm & Tile Cross 355 16.0% 10
Gravelly Hill 210 16.7% 5
Hall Green North 255 11.1% 10
Hall Green South 80 9.8% 0
Handsworth 265 20.2% -10
Handsworth Wood 250 11.2% -5
Harborne 150 5.9% 5
Heartlands 215 13.9% 20
Highter's Heath 130 13.9% 10
Holyhead 240 18.6% 0
King's Norton North 120 12.9% 0
King's Norton South 180 17.8% 10
Kingstanding 360 17.9% 0
Ladywood 295 4.8% -10
Longbridge & West Heath 235 13.2% 5
Lozells 210 17.5% 10
Moseley 210 10.5% 5
Nechells 240 4.2% 10
Newtown 330 10.5% 15
North Edgbaston 425 13.1% 5
Birmingham Wards
8
Yo
uth
(18
-24
) Cla
ima
nt C
ou
nt U
ne
mp
loym
en
t
Table 6—Unadjusted 18-24 Claimant Count Unemployment by Ward – June 2020 Continued
Constituency
Total Claimant Unemployed
Annual Change Number
Claimant Proportion
Northfield 105 12.2% 5
Oscott 190 11.3% 0
Perry Barr 255 10.8% 20
Perry Common 155 15.2% -15
Pype Hayes 105 12.0% 0
Quinton 195 11.9% 15
Rubery & Rednal 135 14.3% 5
Shard End 170 16.7% 0
Sheldon 190 11.2% 5
Small Heath 410 15.5% 35
Soho & Jewellery Quarter 425 12.0% 10
South Yardley 105 12.3% 0
Sparkbrook & Balsall Heath East 560 18.0% 15
Sparkhill 415 15.4% 25
Stirchley 100 11.3% 5
Stockland Green 455 19.0% 0
Sutton Four Oaks 35 6.1% -5
Sutton Mere Green 70 11.7% 10
Sutton Reddicap 95 11.6% 5
Sutton Roughley 55 7.5% 5
Sutton Trinity 45 8.0% 10
Sutton Vesey 110 6.5% -5
Sutton Walmley & Minworth 80 7.6% 10
Sutton Wylde Green 55 9.1% 10
Tyseley & Hay Mills 195 17.2% 10
Ward End 235 15.0% -5
Weoley & Selly Oak 325 11.5% 15
Yardley East 100 10.8% 5
Yardley West & Stechford 210 17.0% -5
Birmingham 15,550 11.0% 460
Birmingham Wards
9
Employment & Skills
10
Latest Resident Employment
16-64 Employed
472,900 -3,500 Employment Rate
64.6% -0.6pp
16-64 Employed
2.71m -11,600 Employment Rate
74.9% -0.4pp
16-64 Employed
31.6m -49,300 Employment Rate
76.4% -0.2pp
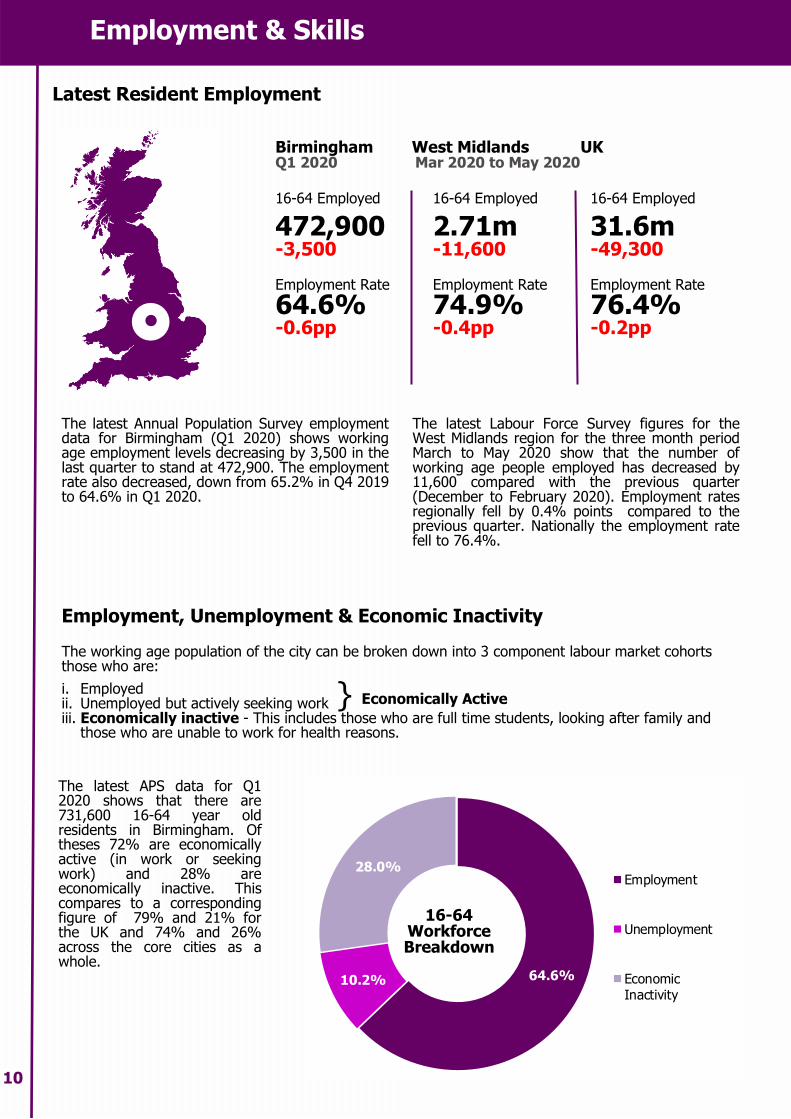
The latest Annual Population Survey employment data for Birmingham (Q1 2020) shows working age employment levels decreasing by 3,500 in the last quarter to stand at 472,900. The employment rate also decreased, down from 65.2% in Q4 2019 to 64.6% in Q1 2020.
The latest Labour Force Survey figures for the West Midlands region for the three month period March to May 2020 show that the number of working age people employed has decreased by 11,600 compared with the previous quarter (December to February 2020). Employment rates regionally fell by 0.4% points compared to the previous quarter. Nationally the employment rate fell to 76.4%.
Birmingham West Midlands UK Q1 2020 Mar 2020 to May 2020
}
Economically Active
Employment, Unemployment & Economic Inactivity The working age population of the city can be broken down into 3 component labour market cohorts those who are:
i. Employed ii. Unemployed but actively seeking work iii. Economically inactive - This includes those who are full time students, looking after family and
those who are unable to work for health reasons.
The latest APS data for Q1 2020 shows that there are 731,600 16-64 year old residents in Birmingham. Of theses 72% are economically active (in work or seeking work) and 28% are economically inactive. This compares to a corresponding figure of 79% and 21% for the UK and 74% and 26% across the core cities as a whole.
64.6%10.2%
28.0%Employment
Unemployment
EconomicInactivity
16-64 Workforce Breakdown

Em
plo
ym
en
t & S
kills
11
51.3%
12.9%
53.7%
10.0%
51.3%
11.3%
59.0%
10.1%
58.4%
7.9%
0%
10%
20%
30%
40%
50%
60%
70%
NVQ3+ No Quals
Chart 4: Qualification Levels - 2019
Birmingham GBSLEP WMCA Core Cities UK
On the supply side comparatively high unemployment and low employment rates in the city are linked to the skills gap that exists locally with residents having lower skills and qualification levels than the national average.
The chart below highlights this showing how Birmingham (12.9%) has a greater proportion of working age residents with no qualifications compared to the UK (7.9%) and the core city average (10.1%).
The city (51.3%) also has a correspondingly lower proportion of residents with NVQ3+ qualifications than the UK (58.4%) and core city average (59.0%).
ILO Unemployment - Q4 2019 ILO Unemployment
An alternative and widely used measure which defines unemployment as those who are not in employment but actively seeking work, regardless of benefit eligibility (see page 11 for further details) The latest available local data form the APS shows that in Q1 2020 there were 53,700 working age Birmingham residents who declared themselves as unemployed an unemployment rate of 10.2%. Unemployment in the city was above the national and core city average and also increased by 7,700 on the previous quarter with the rate up by 1.4 percentage points.
Skill Levels
Guidance Notes
11
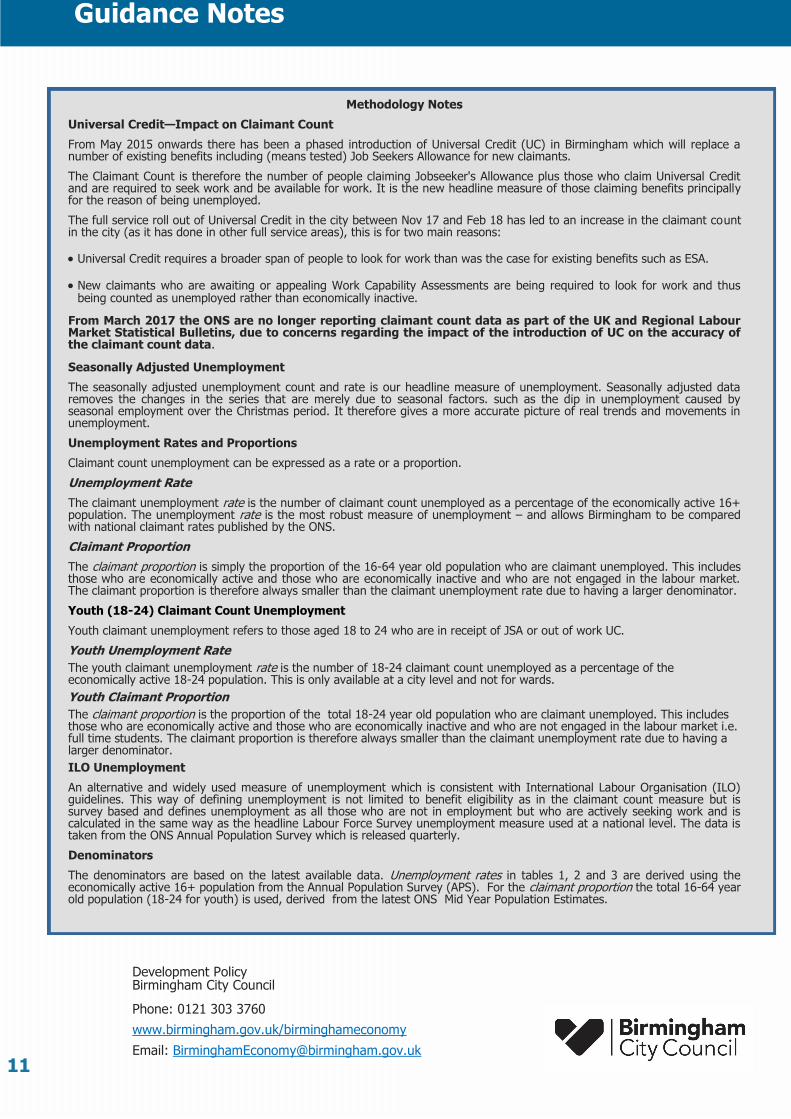
Methodology Notes
Universal Credit—Impact on Claimant Count
From May 2015 onwards there has been a phased introduction of Universal Credit (UC) in Birmingham which will replace a number of existing benefits including (means tested) Job Seekers Allowance for new claimants.
The Claimant Count is therefore the number of people claiming Jobseeker's Allowance plus those who claim Universal Credit and are required to seek work and be available for work. It is the new headline measure of those claiming benefits principally for the reason of being unemployed.
The full service roll out of Universal Credit in the city between Nov 17 and Feb 18 has led to an increase in the claimant count in the city (as it has done in other full service areas), this is for two main reasons:
• Universal Credit requires a broader span of people to look for work than was the case for existing benefits such as ESA.
• New claimants who are awaiting or appealing Work Capability Assessments are being required to look for work and thus being counted as unemployed rather than economically inactive.
From March 2017 the ONS are no longer reporting claimant count data as part of the UK and Regional Labour Market Statistical Bulletins, due to concerns regarding the impact of the introduction of UC on the accuracy of the claimant count data.
Seasonally Adjusted Unemployment
The seasonally adjusted unemployment count and rate is our headline measure of unemployment. Seasonally adjusted data removes the changes in the series that are merely due to seasonal factors. such as the dip in unemployment caused by seasonal employment over the Christmas period. It therefore gives a more accurate picture of real trends and movements in unemployment.
Unemployment Rates and Proportions
Claimant count unemployment can be expressed as a rate or a proportion.
Unemployment Rate
The claimant unemployment rate is the number of claimant count unemployed as a percentage of the economically active 16+ population. The unemployment rate is the most robust measure of unemployment – and allows Birmingham to be compared with national claimant rates published by the ONS.
Claimant Proportion
The claimant proportion is simply the proportion of the 16-64 year old population who are claimant unemployed. This includes those who are economically active and those who are economically inactive and who are not engaged in the labour market. The claimant proportion is therefore always smaller than the claimant unemployment rate due to having a larger denominator.
Youth (18-24) Claimant Count Unemployment
Youth claimant unemployment refers to those aged 18 to 24 who are in receipt of JSA or out of work UC.
Youth Unemployment Rate
The youth claimant unemployment rate is the number of 18-24 claimant count unemployed as a percentage of the economically active 18-24 population. This is only available at a city level and not for wards.
Youth Claimant Proportion
The claimant proportion is the proportion of the total 18-24 year old population who are claimant unemployed. This includes those who are economically active and those who are economically inactive and who are not engaged in the labour market i.e. full time students. The claimant proportion is therefore always smaller than the claimant unemployment rate due to having a larger denominator.
ILO Unemployment
An alternative and widely used measure of unemployment which is consistent with International Labour Organisation (ILO) guidelines. This way of defining unemployment is not limited to benefit eligibility as in the claimant count measure but is survey based and defines unemployment as all those who are not in employment but who are actively seeking work and is calculated in the same way as the headline Labour Force Survey unemployment measure used at a national level. The data is taken from the ONS Annual Population Survey which is released quarterly.
Denominators
The denominators are based on the latest available data. Unemployment rates in tables 1, 2 and 3 are derived using the economically active 16+ population from the Annual Population Survey (APS). For the claimant proportion the total 16-64 year old population (18-24 for youth) is used, derived from the latest ONS Mid Year Population Estimates.
Development Policy Birmingham City Council Phone: 0121 303 3760
www.birmingham.gov.uk/birminghameconomy
Email: [email protected]