Embed Size (px)
Citation preview
TAMK University of Applied SciencesDegree Program in Environmental EngineeringKevin THIEN.
Bis-phenol A: origin, fate, dilemma and the effects of increased background organics on its adsorption by powdered activated carbon.Final Thesis
Supervisor Head of the Chemical Engineering Program, TAMKLic. Tech. Maarit Korhonen
Commissioned by Professor Hong Song Ho, Department of Water treatment research, Soongsil University, Seoul - South Korea.
Tampere 01/2009
Author Mr Kevin THIEN
Name of the report Bis-phenol A: origin, fate, dilemma and the effects of increasedbackground organics on its adsorption by powdered activated carbon.
Number of pages 41
Evaluation date February 2009
Thesis supervisor Lic. Tech. Maarit Korhonen
Commissioned by Professor Hong Song Ho - SoongsilUniversity - Seoul
ABSTRACT
This study was conducted to simply observe whether or not background organics hadan effect on the adsorption of Bisphenol A (BPA) by powdered activated carbon (PAC),and to what degree. Bisphenol A is an endocrine disruptor used in many applications,for which sanitary issues are still in controversial debate. In this experiment weobserved that under natural levels of organic matter (River Han of Seoul with a DOC of2.38 ppm), double amount of PAC is required to adsorb BPA to the levels it would havebeen adsorbed without competing background organics. A contact time of 240 minuteswas proven to be a minimum in reaching adsorption equilibrium. We can determinefrom this experiment that BPA is very well adsorbed by activated carbon, but inpresence of heavy organic competition (Double DOC with Humic acid), the adsorptionsees its efficiency considerably reduced (ca. 20% for a 200% increase in backgroundorganics), and shall then be taken into account in water treatment facilities by using anadequate amount of PAC and reasonable contact time. The values expressed in thisreport should not be used in practice unless a thorough study is done. This report hasanswered whether or not background organics had an effect on BPA's adsorption, as abasis for conducting further studies such as dynamic column studies, to determine therequirements of a water treatment system (Activated carbon) of a specific size, incontact time and PAC concentration. Thus it falls in the qualitative category of reportand should not be used as if it were a quantitative work. In addition to genuineexperiments, a selection of scientific reports belabors the concern of BPA's ubiquity inour environment, its toxicity in low concentrations and difficulty of its monitoring inthe environment as well as in closed systems (detection limits).
Key words Bisphenol A, BPA, Powdered activated carbon, PAC, Background organics, Water treatment, Endocrine disruptor, EDC, Adsorption, Humic acid, HPLC, Isotherm, Freundlich isotherm fit, surface water, river, Han, Seoul.
Foreword
This work was conducted in Soongsil University (Seoul – South Korea), in addition to the duties I had to perform during my internship in professor Hong Song Ho's postgraduate water treatment research laboratory.
The topicality and controversy of Bisphenol A, fueled my curiosity and eagerness to uncover information about a subject I was not aware of. I have learned a tremendous amount of skills and knowledge on conducting an experiment from start to end, and yet understand how superficial the work I did actually is.
The more one knows about a subject, the more one understands how vast is the unknown. In the realm of environmentalism, the former statement extends to knowing how grim and dire the state of the Earth is, under current impetuous and unethical corporatocratic management.
I would like to thank my colleagues and friends of the laboratory, as well as all who supported me during my stay in Korea, for their help, scientific knowledge, and true kindness. The help they offered me is simply unmeasurable, without which I would still be working on the many problems I encountered.
More precisely I would like to thank Professor Hong Song Ho for kindly welcoming me in his department, as well as Soul, Yoon and Sun for their infinite kindness.
Kevin Thien - Tampere, 2009.
Table of Contents
Terms and symbols.......................................................................................................... 5
1.Introduction................................................................................................................. 6
2.Theoretical Background .............................................................................................7
2.1.Polymerization using BPA..................................................................................... 7
a)Bisphenol A..........................................................................................................7
b)Epoxy resin.......................................................................................................... 7
c)Polycarbonate.......................................................................................................9
d)Other sources of BPA.........................................................................................10
2.2.Environmental Toxicity........................................................................................10
a)In aquatic ecosystems........................................................................................10
b)In terrestrial ecosystems.....................................................................................12
2.3.BPA's safety: a real dilemma............................................................................... 12
2.4.Activated carbon filtration.................................................................................. 13
3.Experimental section................................................................................................. 14
3.1.Reagents and materials....................................................................................... 14
a)In table form.......................................................................................................14
b)Detailed explanation.......................................................................................... 15Bisphenol A....................................................................................................... 15Activated Carbon...............................................................................................16Natural water..................................................................................................... 16Humic acid........................................................................................................ 16
3.2.Instruments.......................................................................................................... 17
a)DOC analyzer.....................................................................................................17
b)HPLC method and calibration........................................................................... 18Internal Standardization.................................................................................... 20Detection limits................................................................................................. 21
3.3.Method.................................................................................................................22
a)Preliminary test.................................................................................................. 22
b)Contact time and adsorption.............................................................................. 23
c)Isotherm tests..................................................................................................... 25
4.Results and discussion............................................................................................... 26
4.1.Contact time vs concentration of adsorptive....................................................... 27
4.2.Isotherm test........................................................................................................ 29
4.Conclusion.................................................................................................................. 33
5.References...................................................................................................................35
6.Appendices................................................................................................................. 40
Terms and symbols
BPA: Bisphenol A
HCl: Hydrochloric acid
CO2: Carbon dioxide
US or USA: United States of America
UV: Ultraviolet
PC: Polycarbonate
PTFE: Polytetrafluoroethylene, also known as Teflon®
PVC: Polyvinyl chloride
DOC: Dissolved organic carbon
DW: Deionized water
RW: River water
HA: Humic acid
EDC: Endocrine Disrupting Chemical
VTG: Vitellogenin
PAC: Powdered activated carbon
HPLC: High Precision Liquid Chromatograph
v/v% : Volume per volume percentage
Endocrine: Relative to endocrine system; release of hormones controlling growth, sex, mood,...
RT: Retention time (time at which a certain molecule crosses the UV detector in HPLC)
Units
ml = 10-3 liter; µl = 10-6 liter; nl = 10-9 liter
ppm = part per million, usually 1 ppm = 1 mg/l (depending on specific gravity)
ppb = part per billion; 1 ppm = 1000 ppb
psi: pounds per square inch; 1 psi = 6.894757 kPa
TAMK - University of Applied Sciences Final ThesisEnvironmental Engineering Kevin THIEN
1. Introduction
Bisphenol A a major compound (monomer) in the fabrication of canned food resin
liners, polycarbonate and PVC, has recently been of particular concern as it has proven
to leach from its polymerous form under high temperature or caustic environment.
Known to be an endocrine disruptor since the 1930s, Bisphenol A had also been used as
a pesticide.
A few years ago, growing concerns about the endocrine disruption function of BPA
arose, as baby bottles made of PC could leach the estrogen-like chemical into infant's
diet, having tremendous effects on their growth especially their reproductive system. In
2008, Canada declared a ban on BPA use in baby bottles and infant products. However,
the ubiquity of the toxic compound in our environment and in the market (2 million tons
produced in 2003), creates room for information and disinformation.
The toxicity of BPA as an endocrine disruptor is said to be maximal at very low dosage
which is ironically very difficult to detect on an industrial scale (food analysis, waste
water analysis,...).
BPA does not have a long half-life (1 to 10 days under aerated conditions), however its
ubiquity in our environment is of rising concern especially for industrial waste waters
containing BPA. Aquatic fauna (e.g. fish) could well be affected by the presence of BPA
and thus affect a long ecological chain.
Also, BPA has been proved to disrupt the roots of leguminous plants in their intake of
nutrients. Although easily decomposed in nature, BPA has been found to remain for
years in river sediments, a typical oxygen deprived environment. The presence of BPA
in industrial effluents is of growing concern, especially in the fabrication of thermal
papers, thus infecting the wastewater of pulp and paper factories.
This study focuses on natural waters and the possibility of BPA being present in surface
waters used for drinking purposes. Thus, the primary question of concern is whether
background organics offer “resistance” to the correct adsorption and efficiency of
activated carbon filtration, and to what extent. Such study could also be of concern to
TAMK - University of Applied Sciences Final Thesis p.7/41Environmental Engineering Kevin THIEN
industries rejecting organic wastes containing BPA, such as chemical plants, paper
plants, etc...
This study will try to answer the following question: “Is carbon filtration efficient in
removing BPA, and how an increased background organic concentration affects its
adsorption.”
2. Theoretical Background
2.1. Polymerization using BPA
a) Bisphenol A
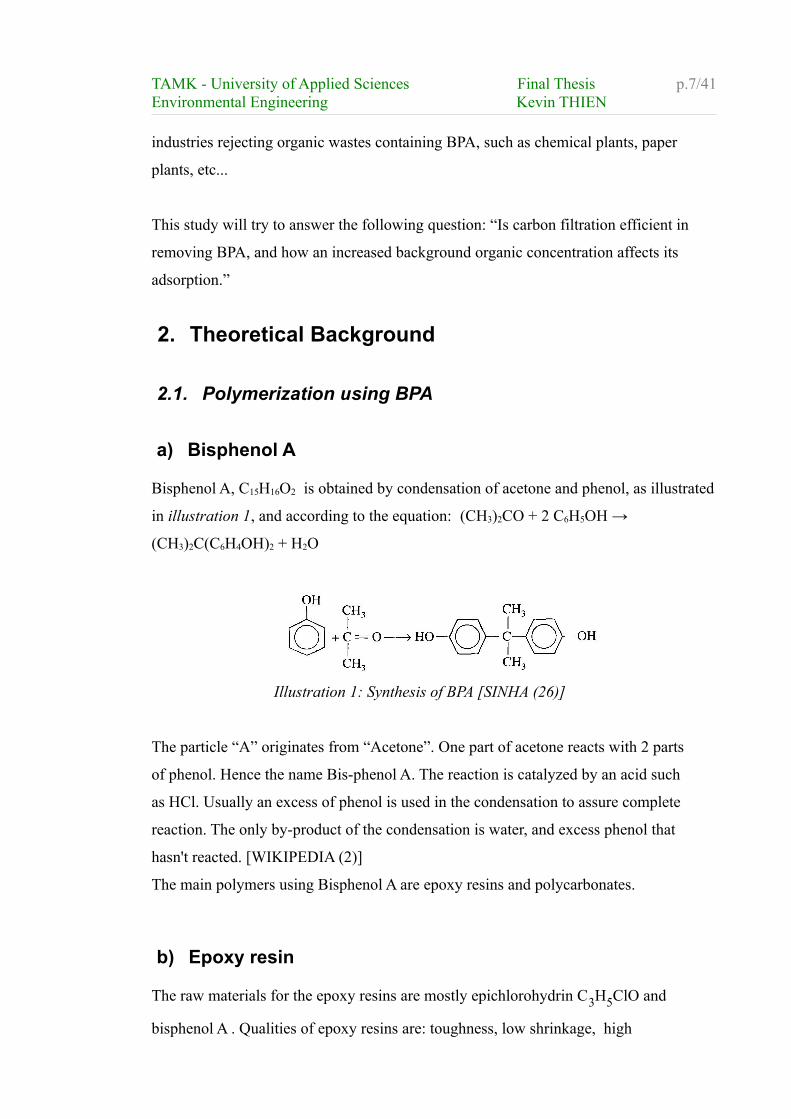
Bisphenol A, C15H16O2 is obtained by condensation of acetone and phenol, as illustrated
in illustration 1, and according to the equation: (CH3)2CO + 2 C6H5OH →
(CH3)2C(C6H4OH)2 + H2O
The particle “A” originates from “Acetone”. One part of acetone reacts with 2 parts
of phenol. Hence the name Bis-phenol A. The reaction is catalyzed by an acid such
as HCl. Usually an excess of phenol is used in the condensation to assure complete
reaction. The only by-product of the condensation is water, and excess phenol that
hasn't reacted. [WIKIPEDIA (2)]
The main polymers using Bisphenol A are epoxy resins and polycarbonates.
b) Epoxy resin
The raw materials for the epoxy resins are mostly epichlorohydrin C3H5ClO and
bisphenol A . Qualities of epoxy resins are: toughness, low shrinkage, high
Illustration 1: Synthesis of BPA [SINHA (26)]
TAMK - University of Applied Sciences Final Thesis p.8/41Environmental Engineering Kevin THIEN
adhesion to many substrates and good alkali resistance. Epoxy resins may be
prepared by reacting epichlorohydrin and a dihydric phenol. But these raw materials
are expensive. Therefore the most common type of phenol used for the industrial
production is bisphenol A.[SINHA (26)]
In a typical process, 1 mole of bisphenol A is taken with 4 moles of epichlorohydrin
in a batch reactor and heated to a temperature of about 100°C under nitrogen
atmosphere. This process called condensation has an organic layer separated from
the rest upon completion, which is then dried with sodium sulphate, and vacuum
distilled to remove the unconverted monomers. [SINHA (26)]
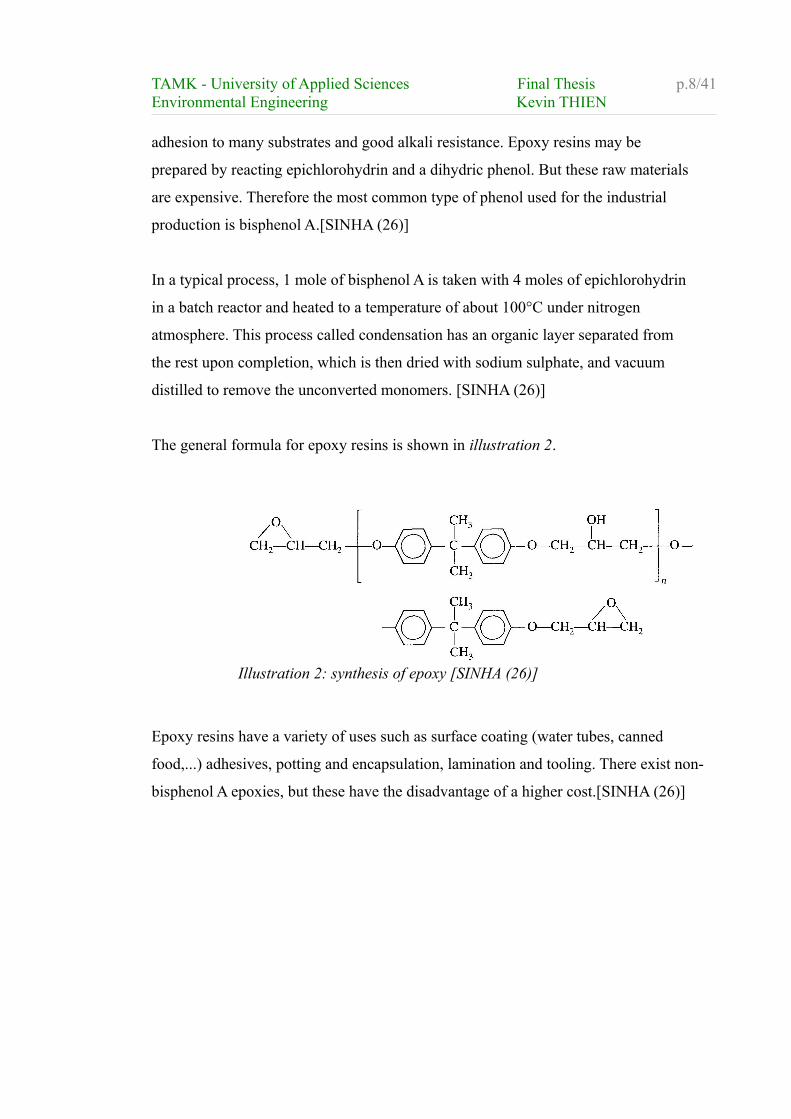
The general formula for epoxy resins is shown in illustration 2.
Epoxy resins have a variety of uses such as surface coating (water tubes, canned
food,...) adhesives, potting and encapsulation, lamination and tooling. There exist non-
bisphenol A epoxies, but these have the disadvantage of a higher cost.[SINHA (26)]
Illustration 2: synthesis of epoxy [SINHA (26)]
TAMK - University of Applied Sciences Final Thesis p.9/41Environmental Engineering Kevin THIEN
c) Polycarbonate
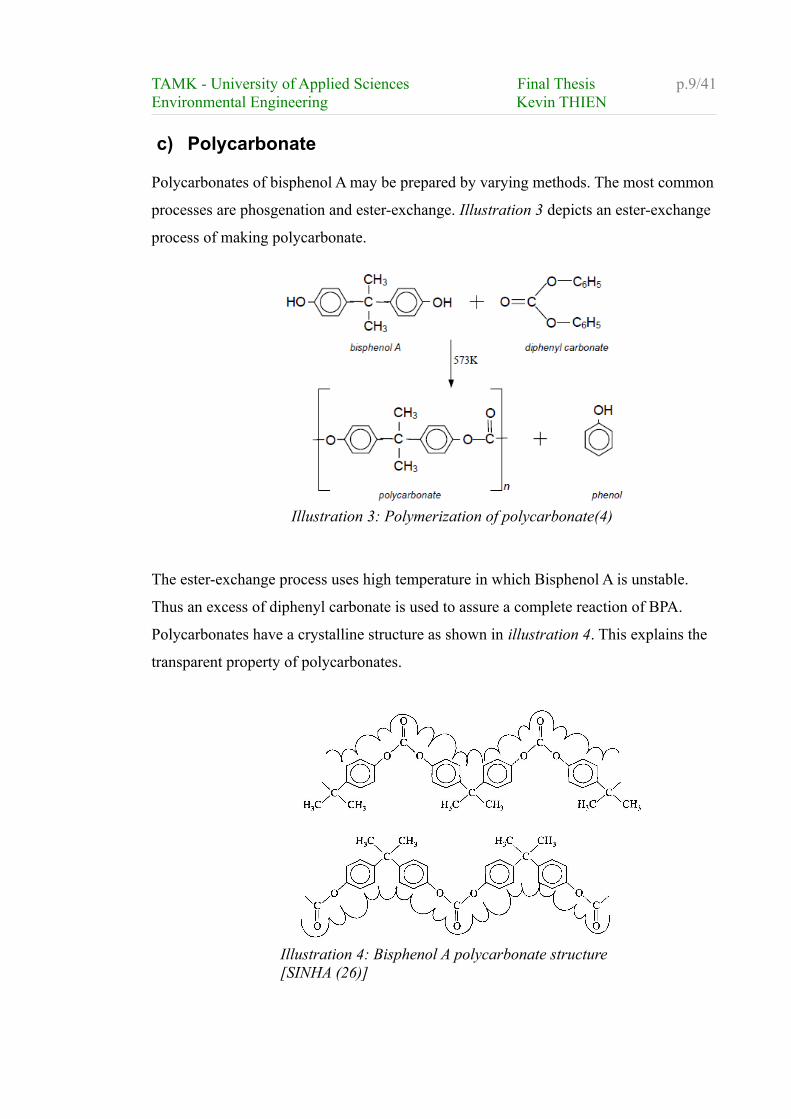
Polycarbonates of bisphenol A may be prepared by varying methods. The most common
processes are phosgenation and ester-exchange. Illustration 3 depicts an ester-exchange
process of making polycarbonate.
The ester-exchange process uses high temperature in which Bisphenol A is unstable.
Thus an excess of diphenyl carbonate is used to assure a complete reaction of BPA.
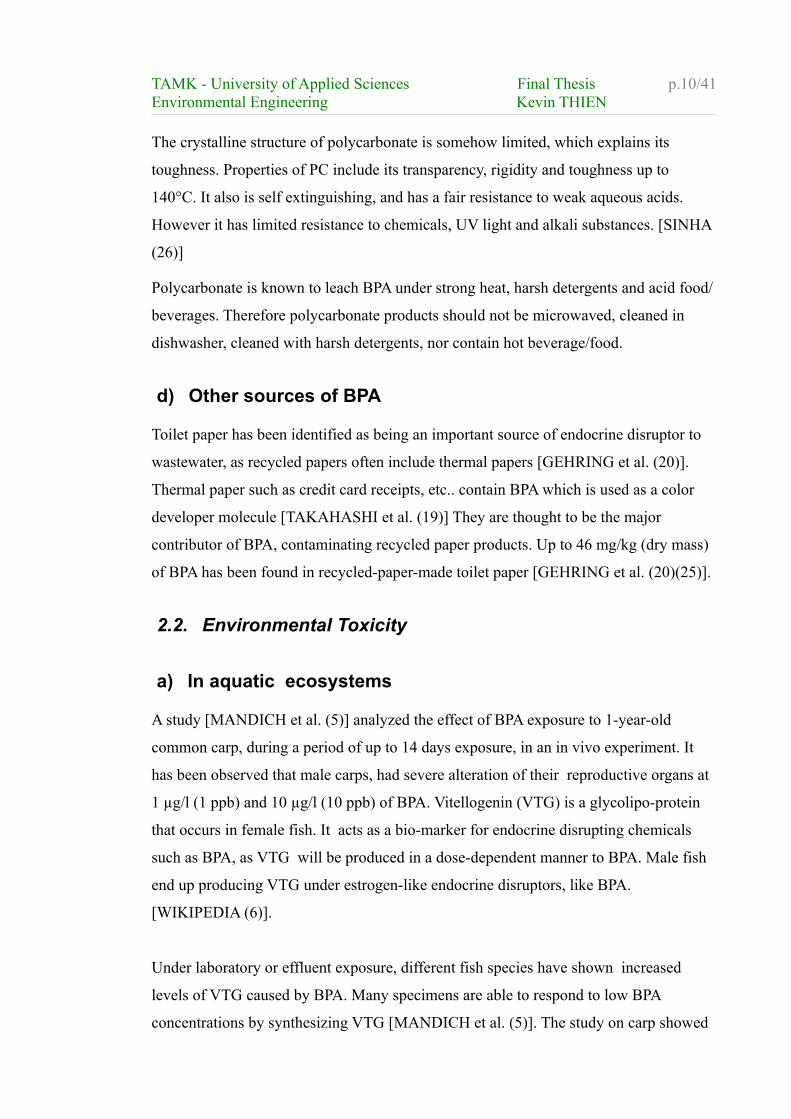
Polycarbonates have a crystalline structure as shown in illustration 4. This explains the
transparent property of polycarbonates.
Illustration 3: Polymerization of polycarbonate(4)
Illustration 4: Bisphenol A polycarbonate structure [SINHA (26)]
TAMK - University of Applied Sciences Final Thesis p.10/41Environmental Engineering Kevin THIEN
The crystalline structure of polycarbonate is somehow limited, which explains its
toughness. Properties of PC include its transparency, rigidity and toughness up to
140°C. It also is self extinguishing, and has a fair resistance to weak aqueous acids.
However it has limited resistance to chemicals, UV light and alkali substances. [SINHA
(26)]
Polycarbonate is known to leach BPA under strong heat, harsh detergents and acid food/
beverages. Therefore polycarbonate products should not be microwaved, cleaned in
dishwasher, cleaned with harsh detergents, nor contain hot beverage/food.
d) Other sources of BPA
Toilet paper has been identified as being an important source of endocrine disruptor to
wastewater, as recycled papers often include thermal papers [GEHRING et al. (20)].
Thermal paper such as credit card receipts, etc.. contain BPA which is used as a color
developer molecule [TAKAHASHI et al. (19)] They are thought to be the major
contributor of BPA, contaminating recycled paper products. Up to 46 mg/kg (dry mass)
of BPA has been found in recycled-paper-made toilet paper [GEHRING et al. (20)(25)].
2.2. Environmental Toxicity
a) In aquatic ecosystems
A study [MANDICH et al. (5)] analyzed the effect of BPA exposure to 1-year-old
common carp, during a period of up to 14 days exposure, in an in vivo experiment. It
has been observed that male carps, had severe alteration of their reproductive organs at
1 µg/l (1 ppb) and 10 µg/l (10 ppb) of BPA. Vitellogenin (VTG) is a glycolipo-protein
that occurs in female fish. It acts as a bio-marker for endocrine disrupting chemicals
such as BPA, as VTG will be produced in a dose-dependent manner to BPA. Male fish
end up producing VTG under estrogen-like endocrine disruptors, like BPA.
[WIKIPEDIA (6)].
Under laboratory or effluent exposure, different fish species have shown increased
levels of VTG caused by BPA. Many specimens are able to respond to low BPA
concentrations by synthesizing VTG [MANDICH et al. (5)]. The study on carp showed
TAMK - University of Applied Sciences Final Thesis p.11/41Environmental Engineering Kevin THIEN
that 9.1% of males were vitellogenic (showing VTG concentrations >11,000 ng/ml)
after 14 day of exposure to 1 ppb, and 42.9% of them with 10 ppb.[MANDICH et al.
(5)] This stresses the fact that small doses, do have an effect on the environment.
On the other hand, Dutch field research [BELFROID et al. (7)] rejected the risk of BPA
at levels that would trigger VTG (i.e. an estrogenic response), in natural areas such as
coastal sea or surface water. BPA has been detected in fish liver and muscle, but
concentration was apparently 100 times less than that which triggers a clear VTG
response in a laboratory experiment.
However, the study showed that levels of BPA were changing over time and thus the
effect on the environment was variable. Also, as fish and shellfish migrate from point to
point, it is difficult to underline a clear dose-response to pollution of BPA at a certain
time.
Nevertheless, in opposition to a concentration of BPA in solution (i.e. water) that
fluctuates as it naturally degrades, BPA has been shown to accumulate and remain
unoxidized in sediments [ ZENG et al. (11)]. Benthic fauna that lives and feeds on these
sediments could accumulate BPA from it; thus species of shellfish that feed on this
benthic fauna, could be exposed to BPA on a chronic basis via such a secondary
pollution channel.[BELFROID et al. (7)]
Apart from being accumulated by living tissues, BPA can be either photo-oxidized, bio-
degraded or adsorbed to sediments [SUN et al. (12)]. However, a Japanese study
[NAKAJIMA et al.(10)] shows that freshwater micro-algae can metabolize BPA to their
glycosides, in a process called glycosylation. Glycosides are molecules in which a
chemical part is bound to a sugar part. [WIKIPEDIA, (8)]. The concentration of BPA
falsely diminishes, as it is not only oxidized or degraded, but could be stored as
glycosides. That study reveals that BPA can accumulate in plants and algae in a neutral
form, but can then be digested back to BPA, when plants or algae containing BPA
glycosides, are consumed. [NAKAJIMA et al.(10)]
TAMK - University of Applied Sciences Final Thesis p.12/41Environmental Engineering Kevin THIEN
b) In terrestrial ecosystems
Along with other remaining chemicals, BPA can be found in waste water sludges. It has
been observed that BPA disrupts the nitrogen fixing capacity of leguminous plants such
as Alfalfa, and then may considerably delay the harvest times of fields using
contaminated wastewater sludge. [FOX et al. (13)].
The study of Dresden university of technology on recycled papers being contaminated
with BPA from thermal paper waste, warns of the mixing of such paper with biological
waste intended to be used as organic fertilizer, for the reasons stated above. [GEHRING
et al. (25)].
2.3. BPA's safety: a real dilemma
Information, disinformation or incomplete mentioning of the experimental settings in
which testings take place, are omnipresent. [MYERS et al.(14)]. Many groups and
associations financed by plastic making corporations are often set to refute the
frightening scientific discoveries or psychosis that settle in public opinion, as the
following excerpt illustrates:
“BPA is one of the most extensively tested of all substances and has been used safely for
over 50 years. BPA safety has been widely studied. Based on the weight of the scientific
evidence, health authorities throughout the world conclude that BPA-based materials
are safe in their intended uses, both in consumer and industrial applications.”
[PlasticsEurope (22)]
The scientific debate over BPA is constant. The European Union and the U.S. Food and
Drug Administration say the chemical is safe, as a recent European commission risk
assessment report of 392 pages affirms [IHCP (23)]. BPA production is of tremendous
commercial importance. The main producers of BPA are USA, Japan, Brazil, Russia,
Germany, Belgium, Spain, the Netherlands and Thailand. With 1.1 million tons of BPA
produced in USA alone [PALMER et al. (21)].
Interestingly Canada, a country that recently banned BPA-containing baby products,
does not belong to the list of countries producing the most BPA. Hence it seems that
economical reasons are motives for softening or impeding the discrimination of BPA
TAMK - University of Applied Sciences Final Thesis p.13/41Environmental Engineering Kevin THIEN
products and their potential risk on the Environment.
2.4. Activated carbon filtration
Activated carbon filtration is in simple words: a small amount of carbon that offers a
great surface to which molecules will adhere, and therefore be removed from a liquid.
Coal (lignite and sub bituminous), wood (sawdust) and coconut shells but also organic
waste products such as coffee bean shells, banana skins, bark from tree felling, straw,
fruit stones, which all on carbonization produce porous carbons, which can be activated
to an appropriate porosity. [ MARSH et al. (28)]
The porosity of a carbon as it is, is not sufficient. Therefore we speak of activating
carbon in an effort to increase porosity. First, takes place a physical and thermal
activation by gasification of the carbon with water vapor or CO2 at 800 to 900°C ,
which creates more porosity. Then, comes a chemical activation. Three chemical
processes purify the activated carbon: zinc chloride promotes extraction of water,
phosphoric acid combines chemically and lastly, potassium hydroxide provokes a kind
of internal explosion of the structure, similar to a grain of corn popping to a popcorn.
[ MARSH et al. (27)]
Important characteristics of an adsorbent are parameters such as pore size distribution,
surface chemistry (functionality) and mineral matter content. Adsorption capacity
depends on accessibility of the organic molecules to microporosity which is dependent
on their size. Thus, under appropriate experimental conditions, small molecules such as
phenol can access micropores; natural organic matter (NOM) can access mesopores and
lastly bacteria, have access to macropores. [ MARSH et al. (29)]
The terminology in adsorption is rather confusing, therefore it is important to recall that:
● an adsorptive is a molecule in a solution that is to be adsorbed (e.g. BPA in
solution).
● an adsorbate is a molecule that has been adsorbed by activated carbon (e.g.
BPA on PAC)
TAMK - University of Applied Sciences Final Thesis p.14/41Environmental Engineering Kevin THIEN
● an adsorbent is what activated carbon is, a highly porous matter that adsorbs
molecules (e.g. PAC) [ MARSH et al. (28)]
It is said that “an increase in activated carbon's surface acidity after an oxidation,
causes a decrease in phenol adsorption from dilute aqueous solution.” [ MARSH et al.
(29)]. Therefore in this study, we will try to answer whether carbon filtration is efficient
in removing BPA, and how an increased background organic concentration affects its
adsorption.
3. Experimental section
3.1. Reagents and materials
a) In table form
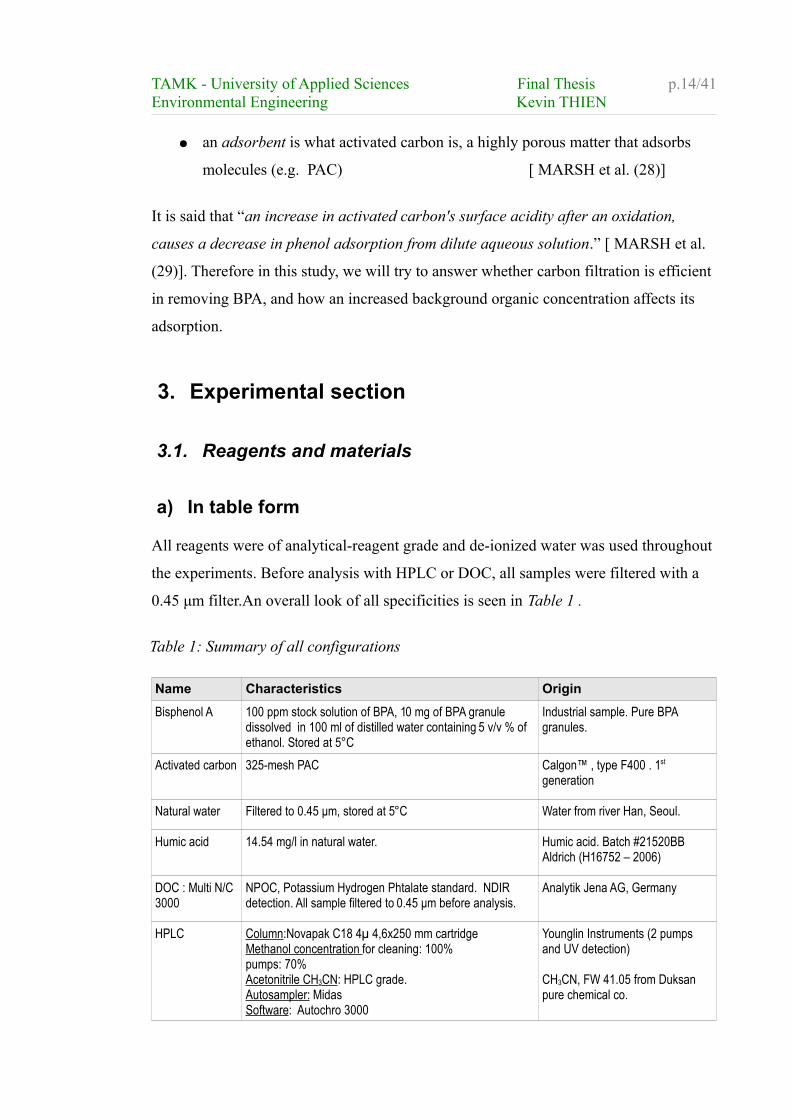
All reagents were of analytical-reagent grade and de-ionized water was used throughout
the experiments. Before analysis with HPLC or DOC, all samples were filtered with a
0.45 μm filter.An overall look of all specificities is seen in Table 1 .
Name Characteristics Origin
Bisphenol A 100 ppm stock solution of BPA, 10 mg of BPA granule dissolved in 100 ml of distilled water containing 5 v/v % of ethanol. Stored at 5°C
Industrial sample. Pure BPA granules.
Activated carbon 325-mesh PAC Calgon™ , type F400 . 1st
generation
Natural water Filtered to 0.45 μm, stored at 5°C Water from river Han, Seoul.
Humic acid 14.54 mg/l in natural water. Humic acid. Batch #21520BB Aldrich (H16752 – 2006)
DOC : Multi N/C 3000
NPOC, Potassium Hydrogen Phtalate standard. NDIR detection. All sample filtered to 0.45 μm before analysis.
Analytik Jena AG, Germany
HPLC Column:Novapak C18 4µ 4,6x250 mm cartridgeMethanol concentration for cleaning: 100%pumps: 70%Acetonitrile CH3CN: HPLC grade. Autosampler: MidasSoftware: Autochro 3000
Younglin Instruments (2 pumps and UV detection)
CH3CN, FW 41.05 from Duksan pure chemical co.
Table 1: Summary of all configurations
TAMK - University of Applied Sciences Final Thesis p.15/41Environmental Engineering Kevin THIEN
b) Detailed explanation
• Bisphenol A
Bisphenol A was provided as solid granules of pure BPA, as used in industrial
polymerization.
BPA has a relatively low solubility in water, that ranges from 120 to 300 ppm at 21,5°C
[WIKIPEDIA (2)]. A method of dissolving BPA with a certain amount of ethanol was
found from a study made by Akira Motoyama [MOTOYAMA et al. (1)]. In order to
make a 100 ppm stock solution of BPA, 10 mg of BPA granules are dissolved in 100 ml
of distilled water containing 5 v/v % of ethanol (100 mg/ml).
Thus, with the use of a micro-pipette we inject 100 µl of ethanol into 100 ml of stock
solution containing 10 mg of BPA into a volumetric flask. The flask is stirred with a
magnetic rod and kept at a constant mild temperature (30°C ), for a day. The ethanol's
density makes its input negligible in the calculation of concentrations: thus the specific
gravity is unchanged. 100 µl of ethanol (100 mg/l) is equivalent to a concentration of
100 ppm.
These stock solutions were stored at 5°C upon complete dissolution of BPA. When
necessary, the stock solutions were further diluted with distilled water to give final
concentrations such as 10 mg/ml (10 ppb), or else as desired. It is important to note that
the presence of ethanol would disturb the results given by DOC tests, as they will not
directly correspond to the concentration of BPA alone, but that of 24 g/mol of carbon
from ethanol (C2H6O : 2 molecules of carbon at 12 g/mol each ) and 180 g/mol of
carbon from BPA (C15H16O2: 15 molecules of carbon at 12 g/mol each) in their
respective concentration. Fortunately, ethanol is not adsorbed by activated carbon and
will thus not impede on the results.
• Activated Carbon
In order to increase the adsorption surface, hence efficiency, activated carbon needs to
TAMK - University of Applied Sciences Final Thesis p.16/41Environmental Engineering Kevin THIEN
be converted to Powdered Activated Carbon: PAC. Activated carbon was provided by
Calgon™ (Calgon carbon corporatum (Pittsburgh, PA. USA.)) and was of type F400
(Filtrasorb 400), first generation. Reducing the Activated carbon to powder (PAC)
requires crushing it with a mortar at slow speed and mortar pressure. It is then meshed
down with sieves of different mesh size. In order to qualify for PAC quality, the mesh
should be greater than 80-mesh sieve (0,177 mm) [WIKIPEDIA (24)].
In this experiment we used a 325-mesh sieve, which translates as having 325 lines in a
square inch. PAC is then refined through a succession of washing and purification
processes. Fine sieved powder is washed at least 3 times with DW; particles are left to
settle down on the bottom and the remaining “dust” on top or suspended in the liquid, is
thrown away. This process is repeated until only clear black matter remains on the
bottom in clear water. Dissolved air is expelled out under vacuum. The solution is
stirred and the vacuum is repeated, until no air remains trapped in the PAC or dissolved
in the DW. PAC is then drained and dried in an oven for at least 24 hours at 120°C.
• Natural water
The natural water used for our experimentation was that of the river Han, Seoul. A total
of 80 liters (2 times 40) was collected in May. This water was filtered to up to 0.45 μm,
in several filtering steps to remove coarse particles first and finer last. Filters of 0.45 μm
were made of glass microfiber from Whatman® Schleicher & Schuell, GF/C category
number 1822110. The filtered water was then stored at 5°C prior to usage. When
referring to this natural water we will use the letters “RW”, standing for “river water”.
• Humic acid
In order to assess the efficiency of BPA removal by PAC in an organic-rich
environment, Humic acid was used to increase the organic concentration. The Humic
acid used was the following: Humic acid. Batch #21520BB Aldrich (H16752 – 2006)
“Humic acid, sodium salt, tech”
We need to assess how much dissolved organics are present in our sample river water
(RW). Then we need to determine the effect of added humic acid on the final DOC. The
required increased background organics that we wished to analyze is at least double that
of the natural DOC of our river water.
TAMK - University of Applied Sciences Final Thesis p.17/41Environmental Engineering Kevin THIEN
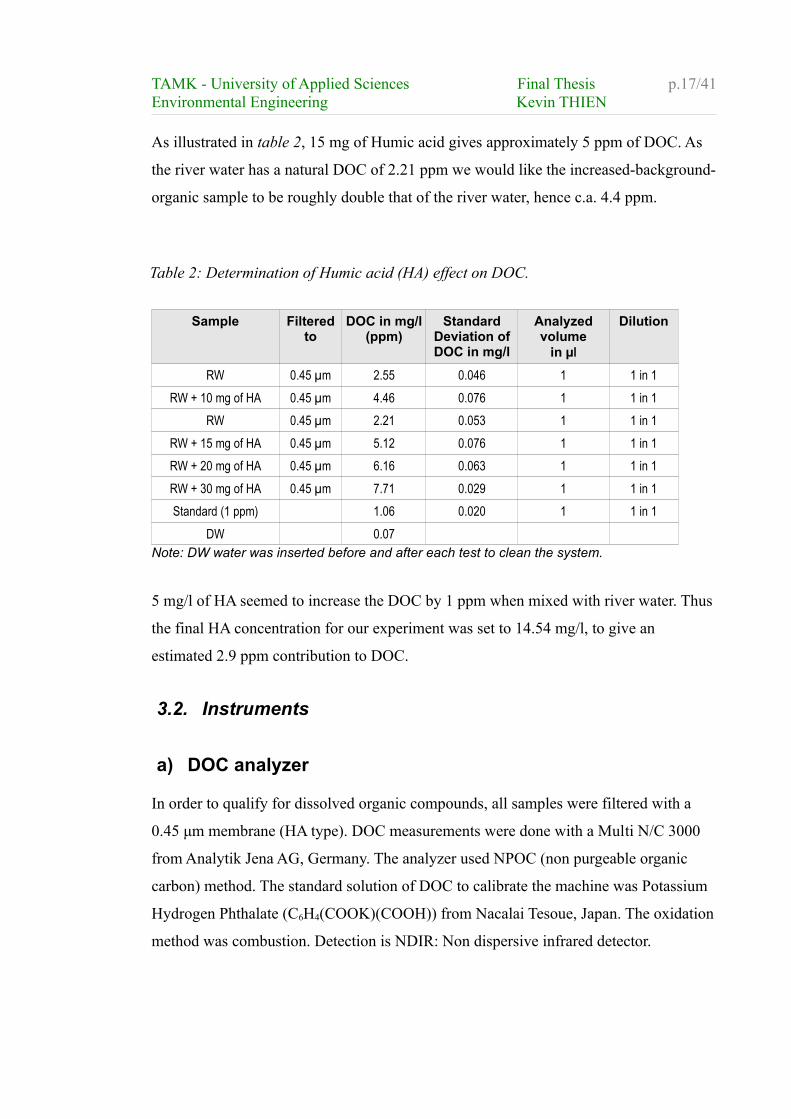
As illustrated in table 2, 15 mg of Humic acid gives approximately 5 ppm of DOC. As
the river water has a natural DOC of 2.21 ppm we would like the increased-background-
organic sample to be roughly double that of the river water, hence c.a. 4.4 ppm.
Sample Filteredto
DOC in mg/l (ppm)
Standard Deviation of DOC in mg/l
Analyzed volume
in µl
Dilution
RW 0.45 µm 2.55 0.046 1 1 in 1
RW + 10 mg of HA 0.45 µm 4.46 0.076 1 1 in 1
RW 0.45 µm 2.21 0.053 1 1 in 1
RW + 15 mg of HA 0.45 µm 5.12 0.076 1 1 in 1
RW + 20 mg of HA 0.45 µm 6.16 0.063 1 1 in 1
RW + 30 mg of HA 0.45 µm 7.71 0.029 1 1 in 1
Standard (1 ppm) 1.06 0.020 1 1 in 1
DW 0.07Note: DW water was inserted before and after each test to clean the system.
5 mg/l of HA seemed to increase the DOC by 1 ppm when mixed with river water. Thus
the final HA concentration for our experiment was set to 14.54 mg/l, to give an
estimated 2.9 ppm contribution to DOC.
3.2. Instruments
a) DOC analyzer
In order to qualify for dissolved organic compounds, all samples were filtered with a
0.45 μm membrane (HA type). DOC measurements were done with a Multi N/C 3000
from Analytik Jena AG, Germany. The analyzer used NPOC (non purgeable organic
carbon) method. The standard solution of DOC to calibrate the machine was Potassium
Hydrogen Phthalate (C6H4(COOK)(COOH)) from Nacalai Tesoue, Japan. The oxidation
method was combustion. Detection is NDIR: Non dispersive infrared detector.
Table 2: Determination of Humic acid (HA) effect on DOC.
TAMK - University of Applied Sciences Final Thesis p.18/41Environmental Engineering Kevin THIEN
b) HPLC method and calibration
HPLC characteristics: Younglin Instruments (2 pump and UV detection)
Column:Novapak C18 4µ 4,6x250 mm cartridge
Methanol concentration for cleaning: 100%
pumps: 70%
Acetonitrile CH3CN: HPLC grade. FW 41.05 from
Duksan pure chemical co.
Autosampler: Midas
Software: Autochro 3000
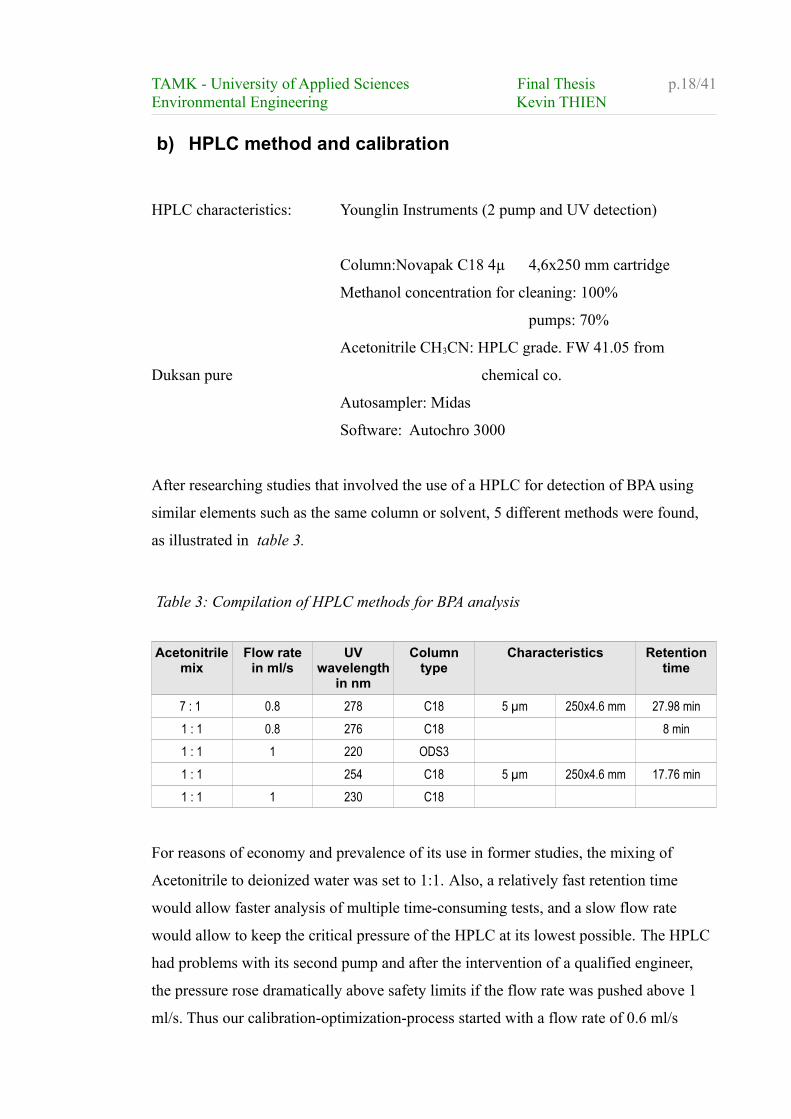
After researching studies that involved the use of a HPLC for detection of BPA using
similar elements such as the same column or solvent, 5 different methods were found,
as illustrated in table 3.
Acetonitrile mix
Flow rate in ml/s
UV wavelength
in nm
Column type
Characteristics Retention time
7 : 1 0.8 278 C18 5 µm 250x4.6 mm 27.98 min
1 : 1 0.8 276 C18 8 min
1 : 1 1 220 ODS3
1 : 1 254 C18 5 µm 250x4.6 mm 17.76 min
1 : 1 1 230 C18
For reasons of economy and prevalence of its use in former studies, the mixing of
Acetonitrile to deionized water was set to 1:1. Also, a relatively fast retention time
would allow faster analysis of multiple time-consuming tests, and a slow flow rate
would allow to keep the critical pressure of the HPLC at its lowest possible. The HPLC
had problems with its second pump and after the intervention of a qualified engineer,
the pressure rose dramatically above safety limits if the flow rate was pushed above 1
ml/s. Thus our calibration-optimization-process started with a flow rate of 0.6 ml/s
Table 3: Compilation of HPLC methods for BPA analysis
TAMK - University of Applied Sciences Final Thesis p.19/41Environmental Engineering Kevin THIEN
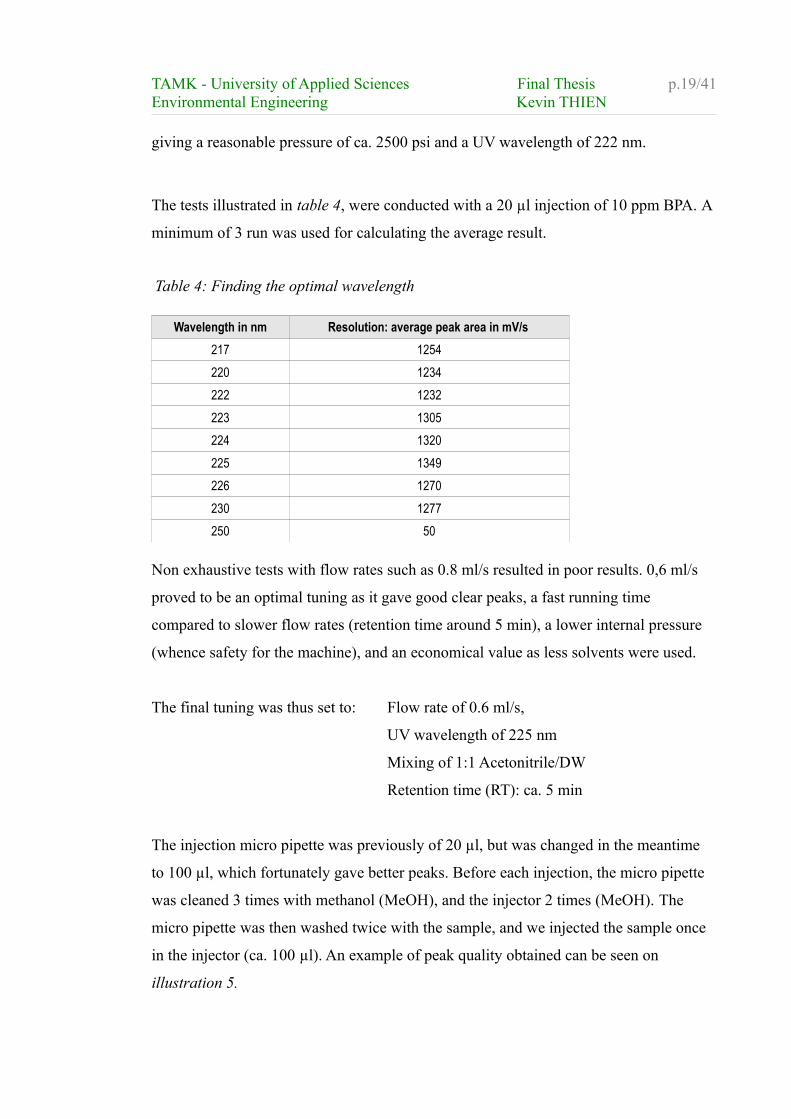
giving a reasonable pressure of ca. 2500 psi and a UV wavelength of 222 nm.
The tests illustrated in table 4, were conducted with a 20 µl injection of 10 ppm BPA. A
minimum of 3 run was used for calculating the average result.
Wavelength in nm Resolution: average peak area in mV/s
217 1254
220 1234
222 1232
223 1305
224 1320
225 1349
226 1270
230 1277
250 50
Non exhaustive tests with flow rates such as 0.8 ml/s resulted in poor results. 0,6 ml/s
proved to be an optimal tuning as it gave good clear peaks, a fast running time
compared to slower flow rates (retention time around 5 min), a lower internal pressure
(whence safety for the machine), and an economical value as less solvents were used.
The final tuning was thus set to: Flow rate of 0.6 ml/s,
UV wavelength of 225 nm
Mixing of 1:1 Acetonitrile/DW
Retention time (RT): ca. 5 min
The injection micro pipette was previously of 20 µl, but was changed in the meantime
to 100 µl, which fortunately gave better peaks. Before each injection, the micro pipette
was cleaned 3 times with methanol (MeOH), and the injector 2 times (MeOH). The
micro pipette was then washed twice with the sample, and we injected the sample once
in the injector (ca. 100 µl). An example of peak quality obtained can be seen on
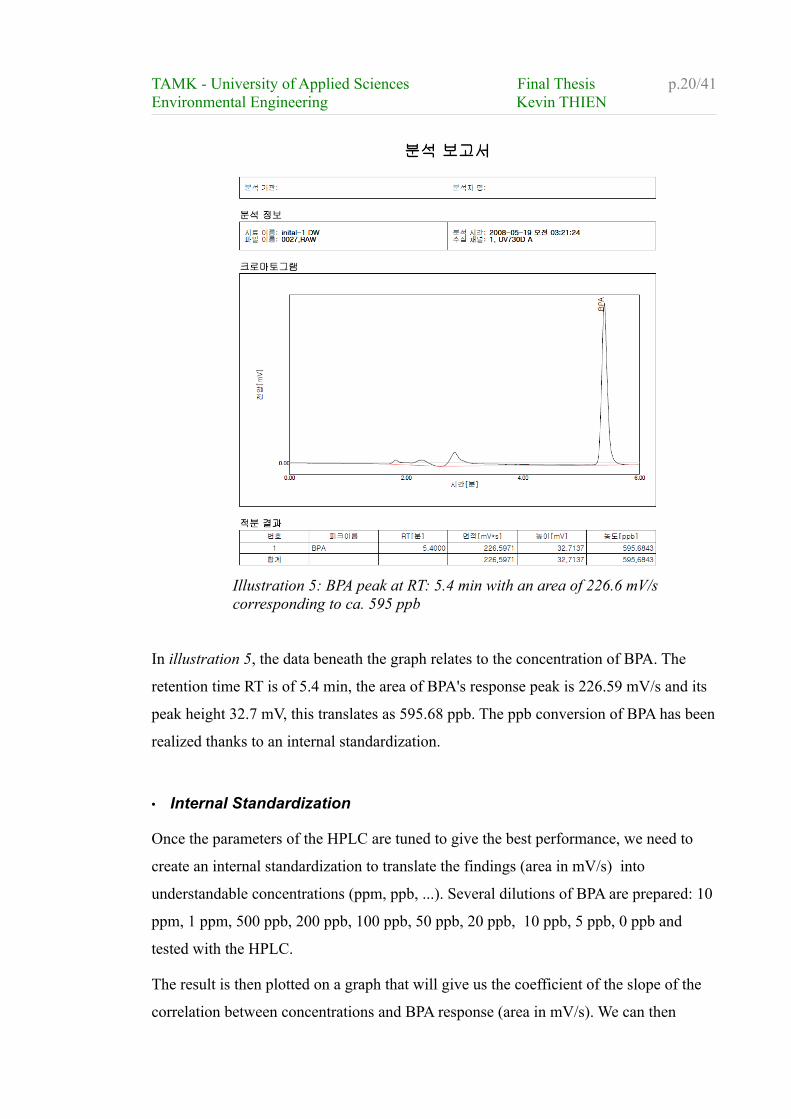
illustration 5.
Table 4: Finding the optimal wavelength
TAMK - University of Applied Sciences Final Thesis p.20/41Environmental Engineering Kevin THIEN
In illustration 5, the data beneath the graph relates to the concentration of BPA. The
retention time RT is of 5.4 min, the area of BPA's response peak is 226.59 mV/s and its
peak height 32.7 mV, this translates as 595.68 ppb. The ppb conversion of BPA has been
realized thanks to an internal standardization.
• Internal Standardization
Once the parameters of the HPLC are tuned to give the best performance, we need to
create an internal standardization to translate the findings (area in mV/s) into
understandable concentrations (ppm, ppb, ...). Several dilutions of BPA are prepared: 10
ppm, 1 ppm, 500 ppb, 200 ppb, 100 ppb, 50 ppb, 20 ppb, 10 ppb, 5 ppb, 0 ppb and
tested with the HPLC.
The result is then plotted on a graph that will give us the coefficient of the slope of the
correlation between concentrations and BPA response (area in mV/s). We can then
Illustration 5: BPA peak at RT: 5.4 min with an area of 226.6 mV/s corresponding to ca. 595 ppb
TAMK - University of Applied Sciences Final Thesis p.21/41Environmental Engineering Kevin THIEN
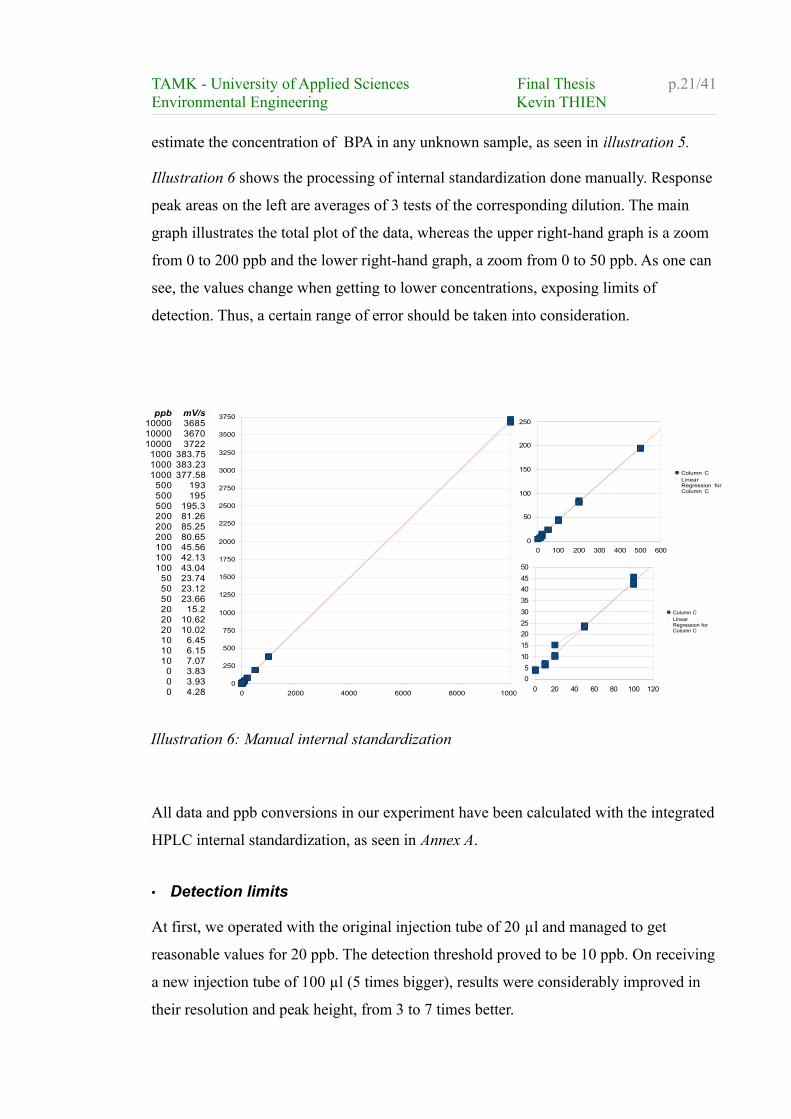
estimate the concentration of BPA in any unknown sample, as seen in illustration 5.
Illustration 6 shows the processing of internal standardization done manually. Response
peak areas on the left are averages of 3 tests of the corresponding dilution. The main
graph illustrates the total plot of the data, whereas the upper right-hand graph is a zoom
from 0 to 200 ppb and the lower right-hand graph, a zoom from 0 to 50 ppb. As one can
see, the values change when getting to lower concentrations, exposing limits of
detection. Thus, a certain range of error should be taken into consideration.
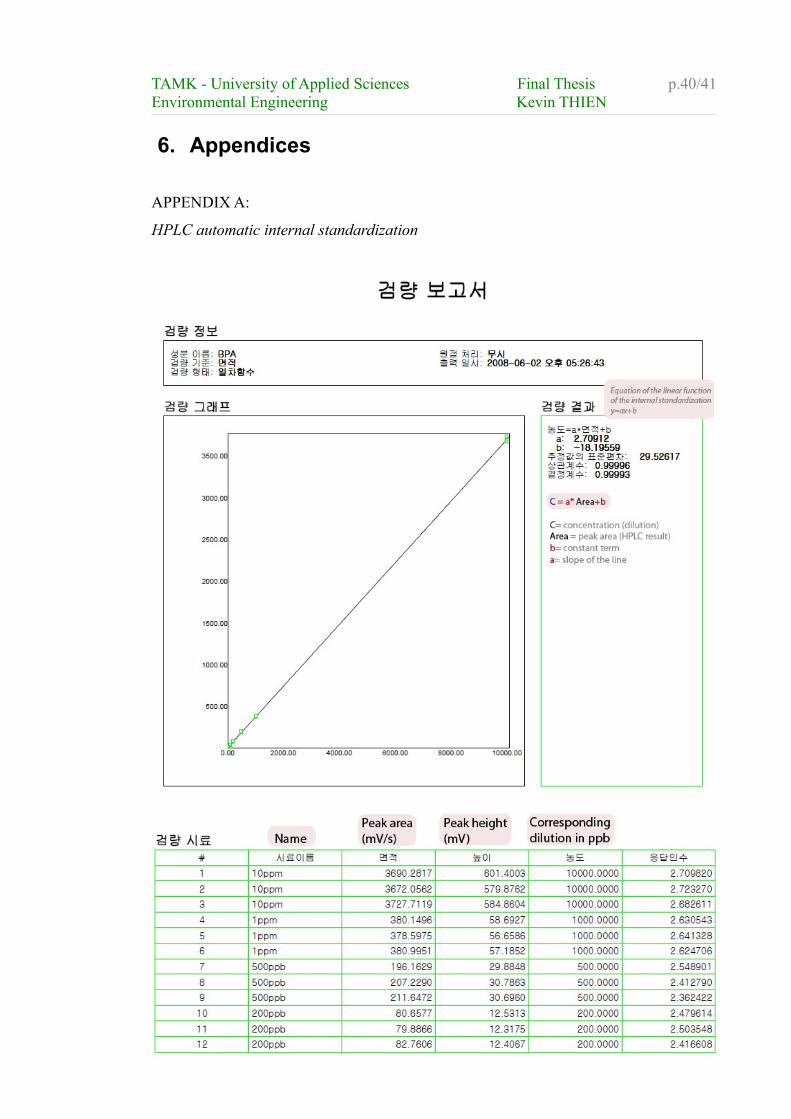
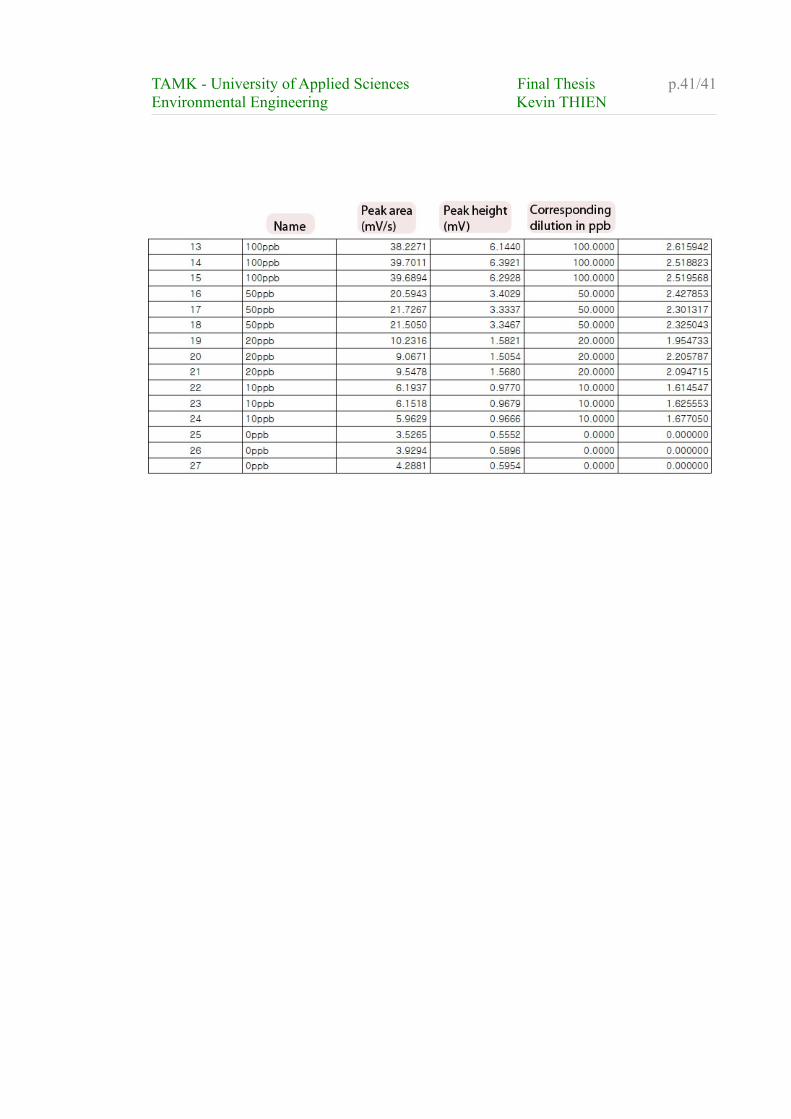
All data and ppb conversions in our experiment have been calculated with the integrated
HPLC internal standardization, as seen in Annex A.
• Detection limits
At first, we operated with the original injection tube of 20 µl and managed to get
reasonable values for 20 ppb. The detection threshold proved to be 10 ppb. On receiving
a new injection tube of 100 µl (5 times bigger), results were considerably improved in
their resolution and peak height, from 3 to 7 times better.
Illustration 6: Manual internal standardization
ppb mV/s10000 368510000 367010000 37221000 383.751000 383.231000 377.58
500 193500 195500 195.3200 81.26200 85.25200 80.65100 45.56100 42.13100 43.04
50 23.7450 23.1250 23.6620 15.220 10.6220 10.0210 6.4510 6.1510 7.07
0 3.830 3.930 4.28 0 2000 4000 6000 8000 10000
0
250
500
750
1000
1250
1500
1750
2000
2250
2500
2750
3000
3250
3500
3750
mV/s
Linear regression, mV/s
0 20 40 60 80 100 120
0
5
10
15
20
25
30
35
40
45
50
Column CLinear Regression for Column C
0 100 200 300 400 500 600
0
50
100
150
200
250
Column CLinear Regression for Column C
TAMK - University of Applied Sciences Final Thesis p.22/41Environmental Engineering Kevin THIEN
Conducting non exhaustive experiments on low concentrations, the new detection limit
proved to be 2.5 ppb. However, the authenticity of the dilution remains questionable at
such a low concentration, and it is therefore safer to say that the HPLC could give
credible results for up to 20 ppb. Since our resolution was not optimal, the design of the
experiment took the former statement into consideration. High concentrations of BPA
exposed to low amounts of PAC, would not ensure complete removal of all detectable
BPA, but reach equilibrium. Equilibrium is reached when the given activated carbon
concentration has adsorbed the maximum amount of molecules it can adsorb, and
therefore all remaining molecules in solution will not be removed.
According to studies on the limits of detection of BPA with HPLC, a noticeably similar
configuration could obtain detection limits of up to 0.2 µg/ml, which corresponds to 0.2
mg/l (200 ppb) without sample preparation [RYKOWSKA et al. (4)]. This underlines
the difficulty of monitoring low concentration of BPA as a British study points out by
saying that : “Occurrence and low-level treatability of EDCs would require more
advanced analytical instrumentation and preconcentration strategies.” [YEOMIN et al.
(8)]
3.3. Method
Before conducting time-consuming tests, we needed to determine in what “time-frame”
the complete adsorption of BPA by PAC occurs. The first tests performed were non-
exhaustive tests that took place on a long time-scale, in order to determine the
maximum time required for equilibrium (maximum adsorption possible for PAC of a
given concentration of BPA). Then knowing the time required for process, an
experimentation on the adsorption kinetics versus contact time for a set concentration
of PAC will be conducted, followed by an isothermal test.
a) Preliminary test
A preliminary test will help us determine a time frame of complete adsorption /
saturation of PAC adsorptive property. Therefore we base our target on a 5 day
TAMK - University of Applied Sciences Final Thesis p.23/41Environmental Engineering Kevin THIEN
experiment in which every day consist of an analysis. Bottles of 330 ml are used for the
test. These have been thoroughly cleaned in a solution containing sulfuric acid (H2SO4),
and dried in an oven for at least a full day at 120℃.
Deionized water (DW) containing 500 ppb of BPA solution is analyzed. Five different
concentrations of PAC are used: 20, 50, 100, 200, 400 mg/l. As the experiment is set to
last for 5 days with an analysis every 24 hours, this makes 5 analyses per day, hence 25
bottles. One extra bottle containing no PAC but DW+BPA will be used as a control
bottle to attest that the concentration is not affected by other parameters.
The preliminary test revealed that the complete adsorption by PAC of BPA up to the
capacity of PAC (i.e. equilibrium), occurred within 24 hours. It is essential to know this
time frame in order to conduct the two following experiments: “kinetic of adsorption vs
contact time” and “isotherm”.
b) Contact time and adsorption
We would like to observe the evolution of adsorption of BPA by PAC, when exposed to
different amounts of PAC as well as different environments such as natural background
organics (RW). In this experiment, we arbitrarily chose to take 3 different amounts of
PAC: 15 mg/l, 24 mg/l and 45 mg/l. We also chose to lead the experiment with only two
waters: RW and DW, all containing 600 ppb of BPA.
We chose to analyze the samples at 6 different times: 0 min, 15 min, 30 min, 60 min,
120 min and 240 min. The maximum time 240 min (4 hours), is often encountered in
scientific articles dealing with the adsorption of BPA, as being the equilibrium time.
Zero minutes corresponds to the analysis of the sample without contact to PAC, thus
having 600 ppb BPA. A graphic summary of the different samples and their samplings is
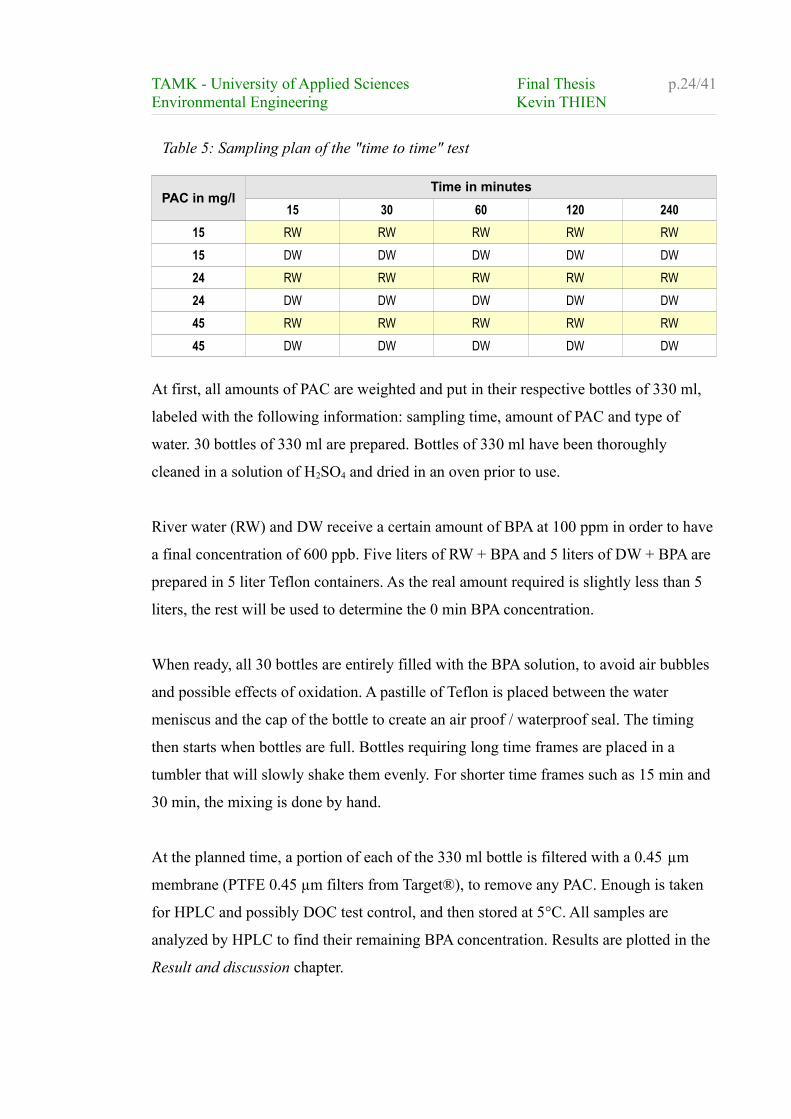
illustrated in table 5.
TAMK - University of Applied Sciences Final Thesis p.24/41Environmental Engineering Kevin THIEN
PAC in mg/lTime in minutes
15 30 60 120 240
15 RW RW RW RW RW
15 DW DW DW DW DW
24 RW RW RW RW RW
24 DW DW DW DW DW
45 RW RW RW RW RW
45 DW DW DW DW DW
At first, all amounts of PAC are weighted and put in their respective bottles of 330 ml,
labeled with the following information: sampling time, amount of PAC and type of
water. 30 bottles of 330 ml are prepared. Bottles of 330 ml have been thoroughly
cleaned in a solution of H2SO4 and dried in an oven prior to use.
River water (RW) and DW receive a certain amount of BPA at 100 ppm in order to have
a final concentration of 600 ppb. Five liters of RW + BPA and 5 liters of DW + BPA are
prepared in 5 liter Teflon containers. As the real amount required is slightly less than 5
liters, the rest will be used to determine the 0 min BPA concentration.
When ready, all 30 bottles are entirely filled with the BPA solution, to avoid air bubbles
and possible effects of oxidation. A pastille of Teflon is placed between the water
meniscus and the cap of the bottle to create an air proof / waterproof seal. The timing
then starts when bottles are full. Bottles requiring long time frames are placed in a
tumbler that will slowly shake them evenly. For shorter time frames such as 15 min and
30 min, the mixing is done by hand.
At the planned time, a portion of each of the 330 ml bottle is filtered with a 0.45 µm
membrane (PTFE 0.45 µm filters from Target®), to remove any PAC. Enough is taken
for HPLC and possibly DOC test control, and then stored at 5°C. All samples are
analyzed by HPLC to find their remaining BPA concentration. Results are plotted in the
Result and discussion chapter.
Table 5: Sampling plan of the "time to time" test
TAMK - University of Applied Sciences Final Thesis p.25/41Environmental Engineering Kevin THIEN
c) Isotherm tests
Adsorption is often described with isotherms. Adsorption isotherms are normally
developed to evaluate the capacity of Activated Carbon for adsorption of a particular
molecule.[ MARSH et al. (29)]. Because adsorption is relative to temperature, in order
to assess the adsorption of a certain molecule, experiments are done at an identical,
constant temperature: hence “isotherm”. In an effort of normalization and ease of
comparison between different types of adsorbent, quantities adsorbed are usually
expressed in the unit mass of the adsorbent. [WIKIPEDIA (3)]
Isothermal adsorption tests will demonstrate how much adsorbate (BPA, organic
matter,...) on the adsorbent (PAC) has accumulated at equilibrium (time where no more
adsorption takes place). In this experiment the contact time is set to 24 hours for all
samples, in order to make sure that the equilibrium is reached. Thus, only the
concentration of PAC will be the variable here.
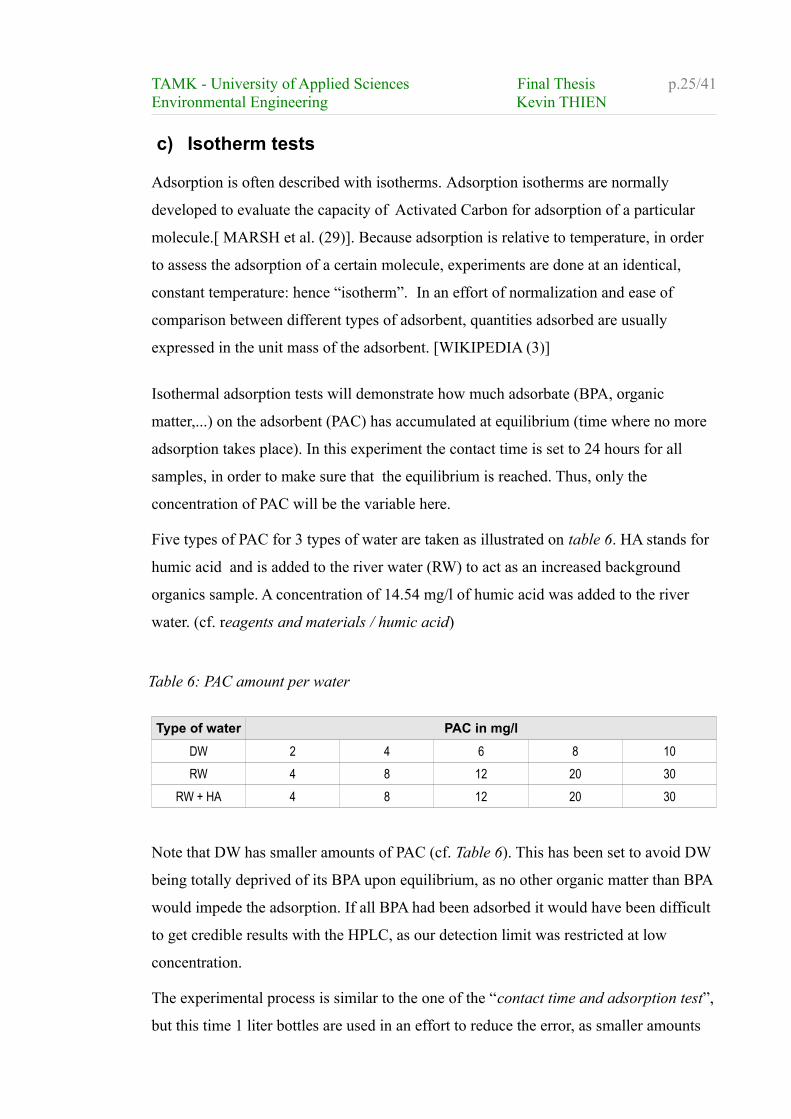
Five types of PAC for 3 types of water are taken as illustrated on table 6. HA stands for
humic acid and is added to the river water (RW) to act as an increased background
organics sample. A concentration of 14.54 mg/l of humic acid was added to the river
water. (cf. reagents and materials / humic acid)
Type of water PAC in mg/l
DW 2 4 6 8 10
RW 4 8 12 20 30
RW + HA 4 8 12 20 30
Note that DW has smaller amounts of PAC (cf. Table 6). This has been set to avoid DW
being totally deprived of its BPA upon equilibrium, as no other organic matter than BPA
would impede the adsorption. If all BPA had been adsorbed it would have been difficult
to get credible results with the HPLC, as our detection limit was restricted at low
concentration.
The experimental process is similar to the one of the “contact time and adsorption test”,
but this time 1 liter bottles are used in an effort to reduce the error, as smaller amounts
Table 6: PAC amount per water
TAMK - University of Applied Sciences Final Thesis p.26/41Environmental Engineering Kevin THIEN
of PAC are required. Bottles have also been thoroughly cleaned in a solution of H2SO4
and dried in an oven prior to usage.
All 15 bottles + 1 control bottle containing BPA and DW but no PAC, are put in a
mixing tumbler at constant temperature and left for 24 hours. All samples are then
filtered at 0.45 µm, controlled for DOC and stored at 5°C until HPLC analysis. All
samples are analyzed by HPLC to find their remaining BPA concentration. Results are
plotted in the Result and discussion chapter.
4. Results and discussion
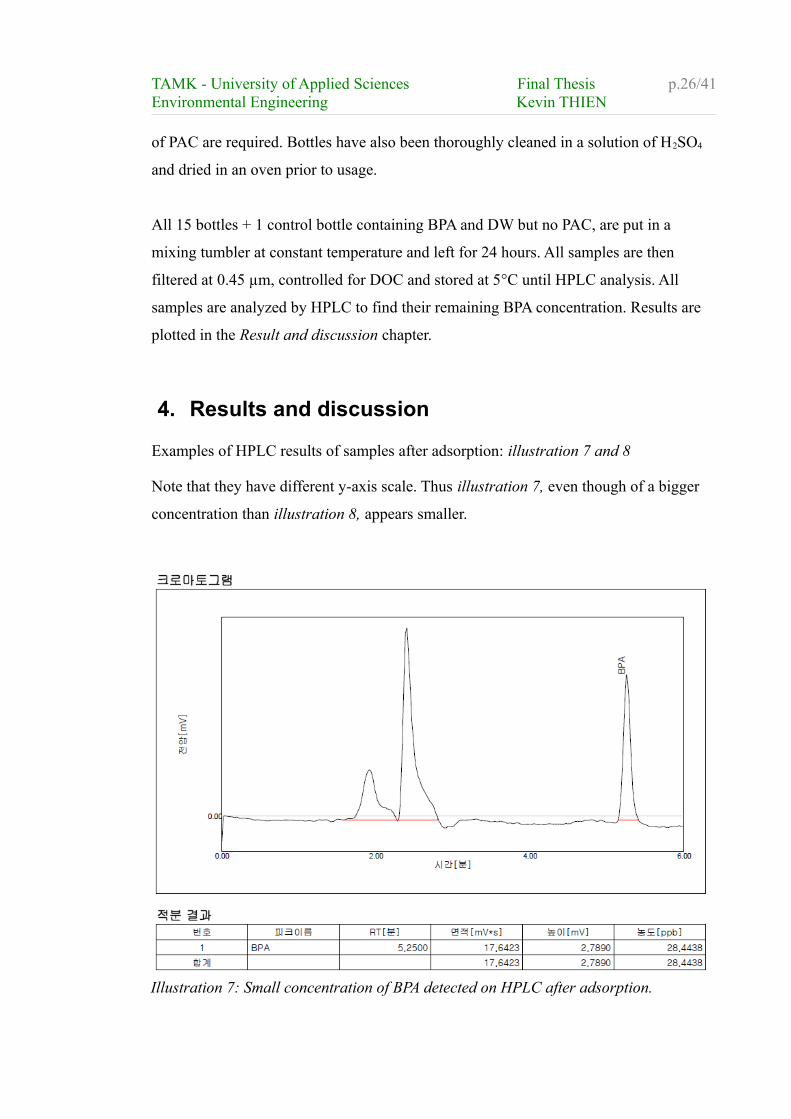
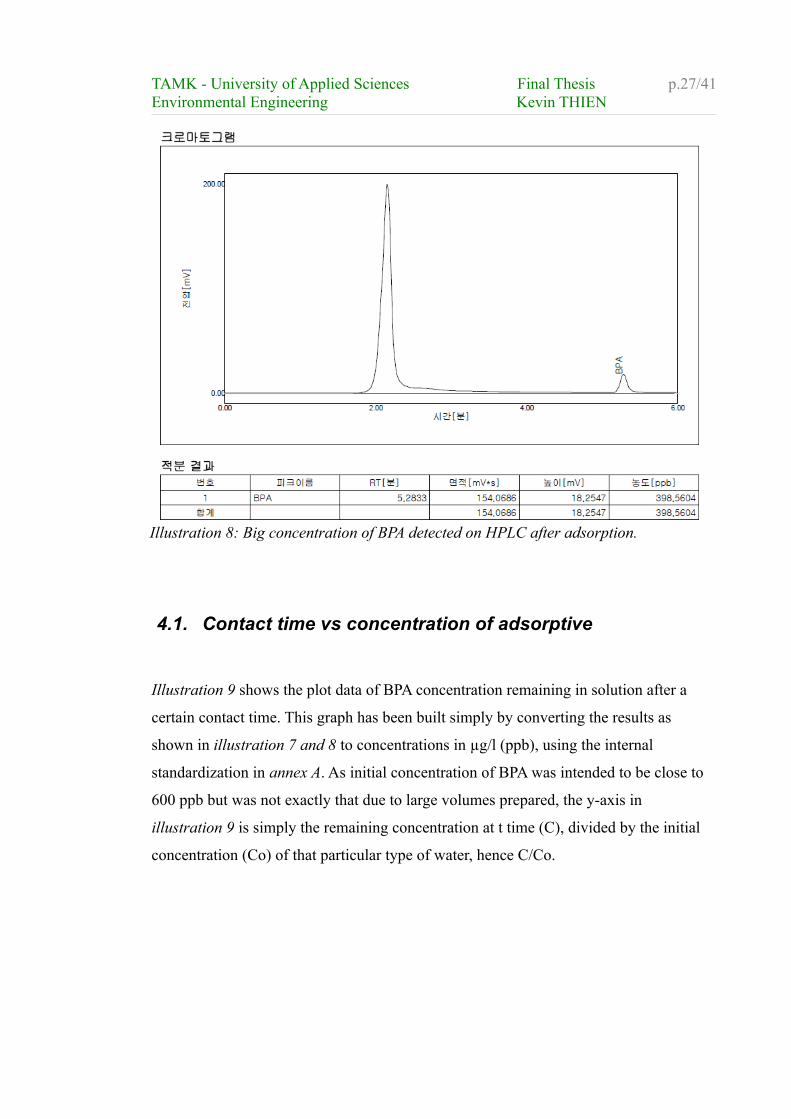
Examples of HPLC results of samples after adsorption: illustration 7 and 8
Note that they have different y-axis scale. Thus illustration 7, even though of a bigger
concentration than illustration 8, appears smaller.
Illustration 7: Small concentration of BPA detected on HPLC after adsorption.
TAMK - University of Applied Sciences Final Thesis p.27/41Environmental Engineering Kevin THIEN
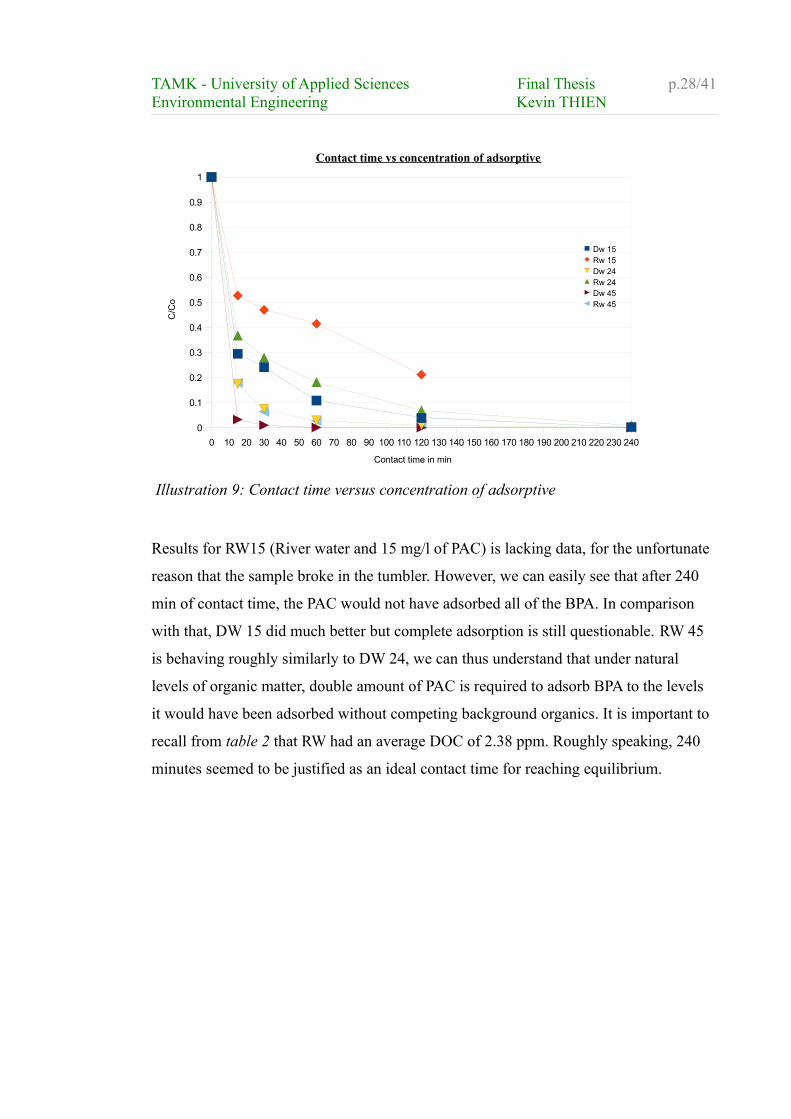
4.1. Contact time vs concentration of adsorptive
Illustration 9 shows the plot data of BPA concentration remaining in solution after a
certain contact time. This graph has been built simply by converting the results as
shown in illustration 7 and 8 to concentrations in µg/l (ppb), using the internal
standardization in annex A. As initial concentration of BPA was intended to be close to
600 ppb but was not exactly that due to large volumes prepared, the y-axis in
illustration 9 is simply the remaining concentration at t time (C), divided by the initial
concentration (Co) of that particular type of water, hence C/Co.
Illustration 8: Big concentration of BPA detected on HPLC after adsorption.
TAMK - University of Applied Sciences Final Thesis p.28/41Environmental Engineering Kevin THIEN
Results for RW15 (River water and 15 mg/l of PAC) is lacking data, for the unfortunate
reason that the sample broke in the tumbler. However, we can easily see that after 240
min of contact time, the PAC would not have adsorbed all of the BPA. In comparison
with that, DW 15 did much better but complete adsorption is still questionable. RW 45
is behaving roughly similarly to DW 24, we can thus understand that under natural
levels of organic matter, double amount of PAC is required to adsorb BPA to the levels
it would have been adsorbed without competing background organics. It is important to
recall from table 2 that RW had an average DOC of 2.38 ppm. Roughly speaking, 240
minutes seemed to be justified as an ideal contact time for reaching equilibrium.
Illustration 9: Contact time versus concentration of adsorptive
0 10 20 30 40 50 60 70 80 90 100 110 120 130 140 150 160 170 180 190 200 210 220 230 240
0
0.1
0.2
0.3
0.4
0.5
0.6
0.7
0.8
0.9
1
Contact time vs concentration of adsorptive
Dw 15Rw 15Dw 24Rw 24Dw 45Rw 45
Contact time in min
C/C
o
TAMK - University of Applied Sciences Final Thesis p.29/41Environmental Engineering Kevin THIEN
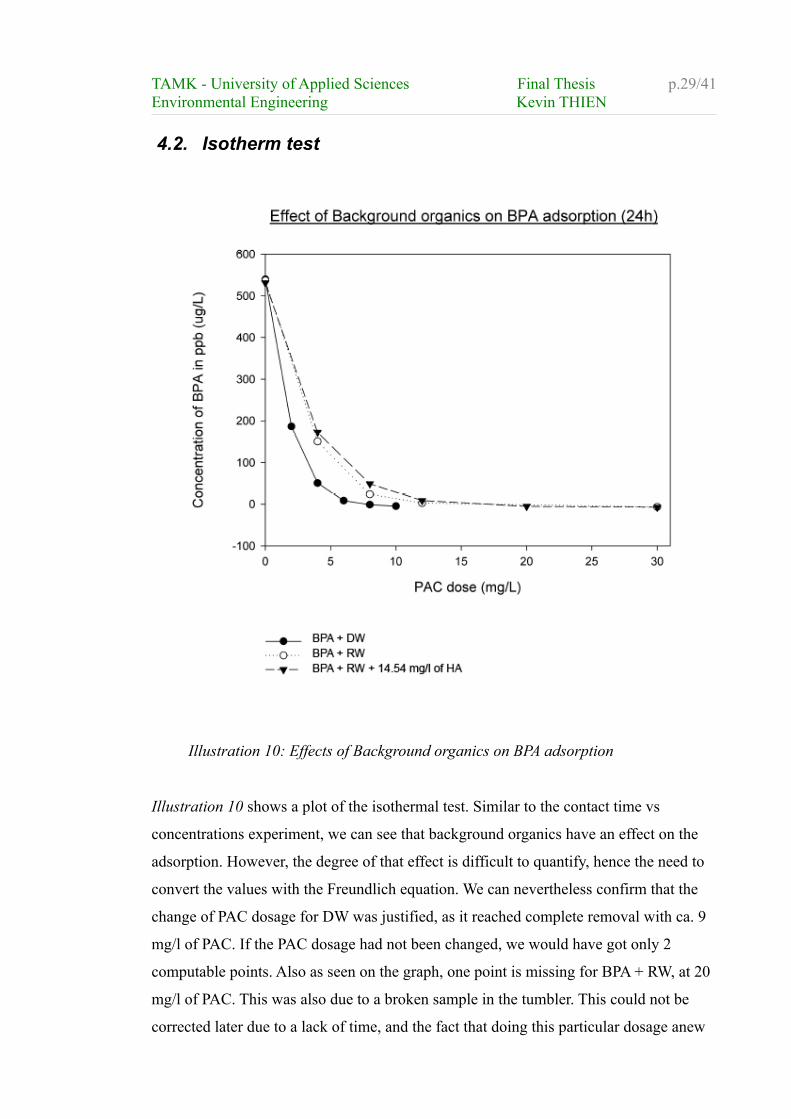
4.2. Isotherm test
Illustration 10 shows a plot of the isothermal test. Similar to the contact time vs
concentrations experiment, we can see that background organics have an effect on the
adsorption. However, the degree of that effect is difficult to quantify, hence the need to
convert the values with the Freundlich equation. We can nevertheless confirm that the
change of PAC dosage for DW was justified, as it reached complete removal with ca. 9
mg/l of PAC. If the PAC dosage had not been changed, we would have got only 2
computable points. Also as seen on the graph, one point is missing for BPA + RW, at 20
mg/l of PAC. This was also due to a broken sample in the tumbler. This could not be
corrected later due to a lack of time, and the fact that doing this particular dosage anew
Illustration 10: Effects of Background organics on BPA adsorption
TAMK - University of Applied Sciences Final Thesis p.30/41Environmental Engineering Kevin THIEN
would have had a different initial concentration and temperature, hence different results.
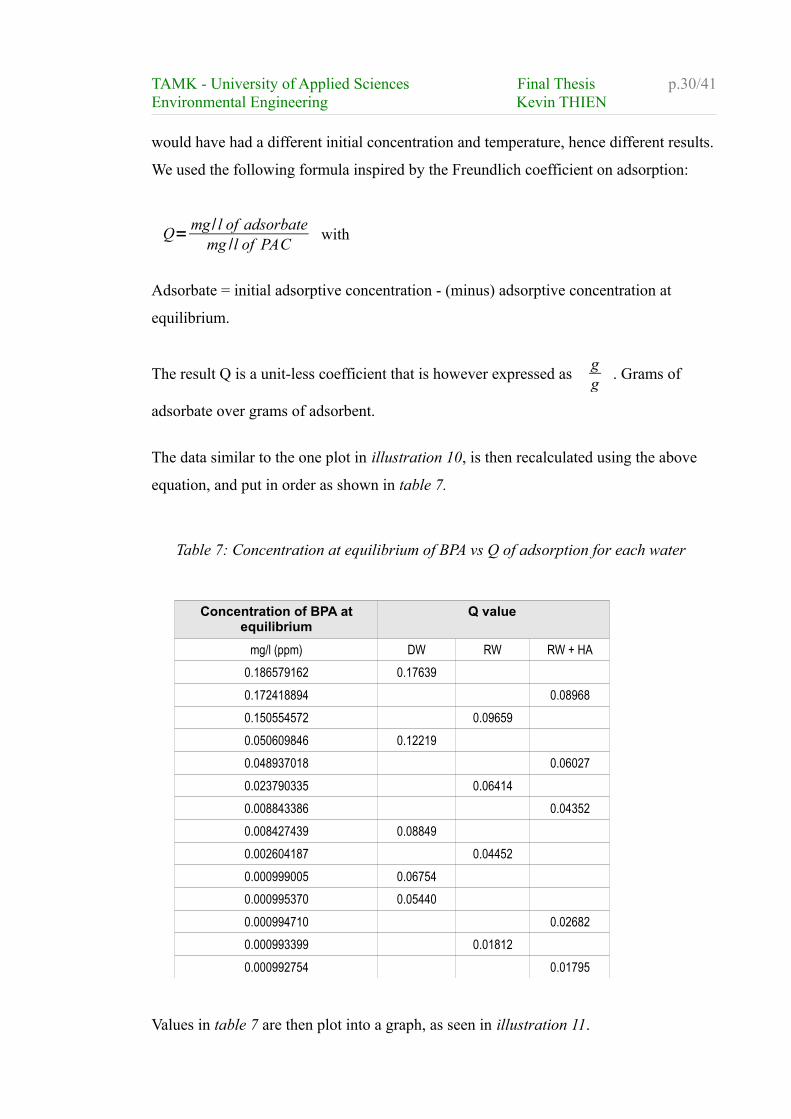
We used the following formula inspired by the Freundlich coefficient on adsorption:
Q= mg / l of adsorbatemg /l of PAC
with
Adsorbate = initial adsorptive concentration - (minus) adsorptive concentration at
equilibrium.
The result Q is a unit-less coefficient that is however expressed as gg
. Grams of
adsorbate over grams of adsorbent.
The data similar to the one plot in illustration 10, is then recalculated using the above
equation, and put in order as shown in table 7.
Concentration of BPA at equilibrium
Q value
mg/l (ppm) DW RW RW + HA
0.186579162 0.17639
0.172418894 0.08968
0.150554572 0.09659
0.050609846 0.12219
0.048937018 0.06027
0.023790335 0.06414
0.008843386 0.04352
0.008427439 0.08849
0.002604187 0.04452
0.000999005 0.06754
0.000995370 0.05440
0.000994710 0.02682
0.000993399 0.01812
0.000992754 0.01795
Values in table 7 are then plot into a graph, as seen in illustration 11.
Table 7: Concentration at equilibrium of BPA vs Q of adsorption for each water
TAMK - University of Applied Sciences Final Thesis p.31/41Environmental Engineering Kevin THIEN
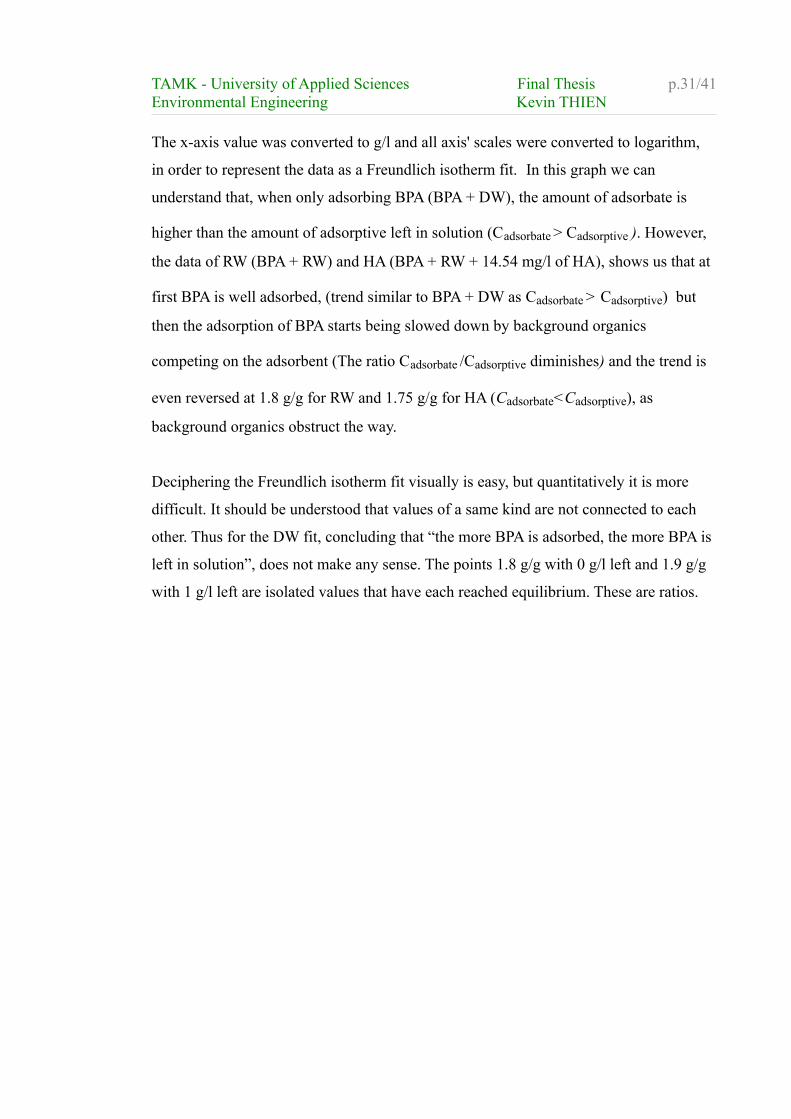
The x-axis value was converted to g/l and all axis' scales were converted to logarithm,
in order to represent the data as a Freundlich isotherm fit. In this graph we can
understand that, when only adsorbing BPA (BPA + DW), the amount of adsorbate is
higher than the amount of adsorptive left in solution (Cadsorbate > Cadsorptive ). However,
the data of RW (BPA + RW) and HA (BPA + RW + 14.54 mg/l of HA), shows us that at
first BPA is well adsorbed, (trend similar to BPA + DW as Cadsorbate > Cadsorptive) but
then the adsorption of BPA starts being slowed down by background organics
competing on the adsorbent (The ratio Cadsorbate /Cadsorptive diminishes) and the trend is
even reversed at 1.8 g/g for RW and 1.75 g/g for HA (Cadsorbate<Cadsorptive), as
background organics obstruct the way.
Deciphering the Freundlich isotherm fit visually is easy, but quantitatively it is more
difficult. It should be understood that values of a same kind are not connected to each
other. Thus for the DW fit, concluding that “the more BPA is adsorbed, the more BPA is
left in solution”, does not make any sense. The points 1.8 g/g with 0 g/l left and 1.9 g/g
with 1 g/l left are isolated values that have each reached equilibrium. These are ratios.
TAMK - University of Applied Sciences Final Thesis p.32/41Environmental Engineering Kevin THIEN
At equal amounts of BPA on adsorbent (e.g. 1.8 g/g), the DW fit has no BPA left in
solution (ca. 0 g/l) but RW has ca. 1.45 g/l and HA ca. 1.75 g/l. We can thus deduce that
with an increase of 200% in background organics (HA's DOC is double that of RW's
DOC), the efficiency of the adsorption is reduced by 20%.
Further analysis would have been required to clearly determine the amount required for
practical usage. A breakthrough curve, is often used to determine water treatment
(Activated carbon) system size requirements, contact time and carbon usage rates. This
is usually done with dynamic column studies. However, the results of this experiment
were conclusive to answer whether or not background organics had an effect on the
Illustration 11: Freundlich isotherm fit
TAMK - University of Applied Sciences Final Thesis p.33/41Environmental Engineering Kevin THIEN
adsorption of BPA, and to which degree it did impede it.
4. Conclusion
With this study we have observed that under natural levels of organic matter (RW's
DOC is ca. 2.38 ppm), double amount of PAC is required to adsorb BPA to the levels it
would have been adsorbed without competing background organics. Also, 240 minutes
seemed to be justified as being the minimum contact time to reaching equilibrium.
We can determine from this experiment that BPA is very well adsorbed by activated
carbon, but in presence of heavy organic competition, the adsorption sees its efficiency
considerably reduced (ca. 20% for a 200% increase in background organics), and shall
then be taken into account both by the amount of PAC used, and the contact time chosen
(as seen thanks to the “contact time vs concentration” experiment).
The values expressed in this report should not be used in practice unless a thorough
study is done. This report has answered whether or not background organics had an
effect on BPA's adsorption, as a basis for conducting further studies such as dynamic
column studies, to determine a water treatment system's (Activated carbon) size
requirements, contact time and PAC concentration. Thus it falls in the qualitative kind
of report and should not be used as if it were a quantitative work.
This study has modestly demonstrated the extent to which background organics are
impeding the adsorption and removal of BPA. However, studies enumerated earlier in
this study, demonstrated the importance and alarming effect of BPA at very low
concentrations. The limit of detection in our experiment was essentially handicapped by
a combined lack of knowledge, material and time.
Nevertheless, this demonstrates the concern where routine checking of the efficiency of
carbon filtration in the removal of EDCs, can never be certain of absolute removal, or of
its removal to certain standards, as BPA's capacity to be filtrated will fluctuate with
background organics present in effluents, not to mention the difficulty of detecting low
concentrations.
TAMK - University of Applied Sciences Final Thesis p.34/41Environmental Engineering Kevin THIEN
Low dosages that are easily encountered in the environment, the toxicity of which many
refuted, do indeed have effects such as:
● the possibility of developing prostate cancer when exposed during
development (infancy) [HO et al. (15)]
● oversized growth of female snails [OEHLMANN et al. (16)]
● increase in obesity potential [MASUNO et al. (17)]
● altered behavior and brain structure [KUBO et al. (18)]
It is thus important to stress that despite the many ways in which BPA and EDCs can be
removed, and activated carbon being one efficient method, it is impossible to claim
certainty of its complete removal and claim that safe dosage has been reached, as the
toxicity of these compounds are not simply reduced to a dose-response relationship.
Indeed, research has yet to confirm the role of lower dosages in overall toxicity,
compared to bigger amounts. BPA is technically non persistent, and degrades easily, but
its ubiquity is of major concern for the perennation of species and the entire ecosystem.
Finally, I would like to share the following quote from Rykowska's study, as it illustrates
well the dilemma which we are facing : “It must also be kept in mind that humans are
exposed not only to this one compound but to many potentially risky materials in the
environment. Therefore, even if the concentration of each hazardous compound is below
a safe limit, their sum can exceed the level tolerated by an organism and trigger
negative effects. “ [RYKOWSKA et al. (4)]
TAMK - University of Applied Sciences Final Thesis p.35/41Environmental Engineering Kevin THIEN
5. References
(1) MOTOYAMA Akira , SUZUKi Ayako , SHIROTA Osamu and NAMBA
Ryujiro, “Direct Determination of Bisphenol A and Nonylphenol in River Water by
Column-switching Semi-microcolumn Liquid Chromatography/Electrospray Mass
Spectrometry” Rapid Communications in Mass Spectrometry, Volume 13, Issue 21,
Pages 2204-2208. Published Online: 18 Oct 1999. Available online:
http://www3.interscience.wiley.com/journal/66002931/abstract?CRETRY=1&SRETRY=0
[accessed 10 April 2008]
(2) Wikipedia contributors, 'Bisphenol A', Wikipedia, The Free Encyclopedia, 29
November 2008, 21:40 UTC, http://en.wikipedia.org/w/index.php?
title=Bisphenol_A&oldid=254860105 [accessed 1 December 2008]
(3) Wikipedia contributors, 'Adsorption', Wikipedia, The Free Encyclopedia, 29
November 2008, 13:38 UTC, http://en.wikipedia.org/w/index.php?
title=Adsorption&oldid=254784547 [accessed 1 December 2008]
(4) RYKOWSKA I., WASIAK W. “Properties, threats, and methods of analysis of
bisphenol A, and its derivatives.” Acta chromatographica, no. 16, 2006. Institute of
Chemistry, University of Silesia, Katowice, Poland. Article available on the worldwide
web: http://livewww.us.edu.pl/uniwersytet/jednostki/wydzialy/chemia/acta/ac16/zrodla/01_AC16.pdf
(accessed 1 December 2008)
(5) MANDICH A., BOTTERO S., BENFENATI E., CEVASCO A., ERRATICO C.,
MAGGIONI S., MASSARI A., PEDEMONTE F., VIGANÒ L. “In vivo exposure of
carp to graded concentrations of bisphenol A” General and Comparative
Endocrinology. Volume 153, Issues 1-3, August-September 2007, Pages 15-24. Science
Direct article. Available on line : http://www.sciencedirect.com/ (accessed 1 December 2008)
TAMK - University of Applied Sciences Final Thesis p.36/41Environmental Engineering Kevin THIEN
(6) Wikipedia contributors, 'Vitellogenin', Wikipedia, The Free Encyclopedia, 15
September 2008, 00:20 UTC, http://en.wikipedia.org/w/index.php?
title=Vitellogenin&oldid=238472794 [accessed 3 December 2008]
(7) BELFROID A., VAN VELZEN M., VAN DER HORST B., VETHAAK D.
“Occurrence of bisphenol A in surface water and uptake in fish: evaluation of field
measurements” Chemosphere, Volume 49, Issue 1, October 2002, Pages 97-103.
Science Direct article. Available on line : http://www.sciencedirect.com/
(accessed 1 December 2008)
(8) YEOMIN Y.,WESTERHOFF P., SNYDER S. A., ESPARZA M., HONG C.,
“HPLC-fluorescence detection and adsorption of bisphenol A,17b-estradiol, and 17a-
ethynyl estradiol on powdered activated carbon”. Water research journal ISSN 0043-
1354 CODEN WATRAG. 2003, Volume 37, n.14, pages 3530-3540. Elsevier science,
Oxfor, United kingdom.
(9) Wikipedia contributors, 'Glycoside', Wikipedia, The Free Encyclopedia, 8
October 2008, 20:22 UTC, http://en.wikipedia.org/w/index.php?title=Glycoside&oldid=243979186
[accessed 7 December 2008]
(10) NAKAJIMA N., TERAMOTO T., KASAI F., SANO T., TAMAOKI M., AONO
M., KUBO A., KAMADA H., AZUMI Y., SAJI H., “Glycosylation of bisphenol A by
freshwater microalgae” Chemosphere, Volume 69, Issue 6, October 2007, Pages 934-
941. Science Direct article. Available on line : http://www.sciencedirect.com/
(accessed 1 December 2008)
(11) ZENG G., ZHANG C., HUANG G., YU J., WANG Q., LI J., XI B., LIU H.,
“Adsorption behavior of bisphenol A on sediments in Xiangjiang River, Central-south
China” Chemosphere, Volume 65, Issue 9, November 2006, Pages 1490-1499. Science
Direct article. Available on line : http://www.sciencedirect.com/
(accessed 1 December 2008)
TAMK - University of Applied Sciences Final Thesis p.37/41Environmental Engineering Kevin THIEN
(12) SUN W.L., NI J.R., O'BRIEN K.C., HAO P.P. and SUN L.Y. “Adsorption of
Bisphenol A on Sediments in the Yellow River “ Water, Air, & Soil Pollution, Volume
167, Numbers 1-4 / October, 2005. Springerlink article. Available on line:
http://www.springerlink.com (accessed 1 December 2008)
(13) Fox, JE, M Starcevic, KY Kow, ME Burow and JA McLachlan. “Nitrogen
fixation: Endocrine disrupters and flavonoid signalling.” 2001, Nature 413: 128-129.
Available on the internet on http://www.ourstolenfuture.org/NEWSCIENCE/wildlife/2001-
0913foxonrhizobium.htm
(accessed 1 December 2008)
(14) MYERS J.P., VOM SAAL F., “Flawed analysis of Bisphenol A”, Our stolen
future website, 6 April 2008. Available online:
http://www.ourstolenfuture.org/NewScience/oncompounds/bisphenola/2008/2008-0406willhiteetal.html
(accessed 1 December 2008)
(15) HO S.M., TANG W.Y., DE FRAUSTO J.B., PRINS G.S., “Developmental
Exposure to Estradiol and Bisphenol A Increases Susceptibility to Prostate
Carcinogenesis and Epigenetically Regulates Phosphodiesterase Type 4 Variant 4”.
Cancer Research 66: 5624-5632. June 1st 2006. American Association for Cancer
Reasearch. Available online: http://cancerres.aacrjournals.org/cgi/content/abstract/66/11/5624
(accessed 1 December 2008)
(16) OEHLMANN, SCHULTE-OEHLMANN U., TILLMANN M., MARKERT B.,
“Effects of endocrine disruptors on Prosobranch snails (Mollusca: Gastropoda) in the
laboratory. Part I: Bisphenol A and Octylphenol as xenoestrogens.”Ecotoxicology 9:383-
397, 2000. Available on line: http:www.springerlink.com
(accessed 1 December 2008)
TAMK - University of Applied Sciences Final Thesis p.38/41Environmental Engineering Kevin THIEN
(17) MASUNO H., KIDANI T., SEKIYA K., SAKAYAMA K., SHIOSAKA T.,
YAMAMOTO H., HONDA K.,”Bisphenol A in combination with insulin can accelerate
the conversion of 3T3-L1 fibroblasts to adipocytes”. Journal of Lipid Research 3:676-
684, 2002.Available online: http://www.jlr.org/cgi/content/abstract/43/5/676
(accessed 1 December 2008)
(18) KUBO K., ARAI O., OMURA M., WATANABE R., OGATA R., AOU S., “Low
dose effects of bisphenol A on sexual differentiation of the brain and behavior in rats.”
Neuroscience Research, Volume 45, Issue 3, March 2003, Pages 345-356 Available on
line : http://www.sciencedirect.com/ (accessed 1 December 2008)
(19) TAKAHASHI Y., SHIRAI A., SEGAWA T., TAKAHASHI T., SAKAKIBARA
K., “Why does a color-developing phenomenon occur on thermal paper comprising of a
fluoran dye and a color developer molecule?” Bulletin of the Chemical Society of Japan.
ISSN 0009-2673, 2002, vol.75, no10,pp.2225-2231. Available online:
http://cat.inist.fr/ aModele=afficheN&cpsidt=14367319
(Accessed 1 December 2008)
(20) GEHRING M., VOGEL D., TENNHARDT L., WELTIN D.,BILITEWSKI
B.,“Bisphenol A contamination of wastepaper, cellulose and recycled paper products”
2004. Wessex Institute. DOI: 10.2495/WM040291. Available online:
http://library.witpress.com/pages/PaperInfo.asp?PaperID=14382
(Accessed 1 December 2008)
(21) PALMER R.B., PHILLIPS S.D., “Epoxides and epoxy resins” Chapter 209 of
Medical Toxicology, DART Richard C.(editor), Lippincott Williams & Wilkins; Third
Edition edition (December 1, 2003). ISBN: 0781728452. Preview available online on
Google book search: http://books.google.fi
(accessed 1 December 2008)
TAMK - University of Applied Sciences Final Thesis p.39/41Environmental Engineering Kevin THIEN
(22) PlasticsEurope “Bisphenol A Europe”, Polycarbonate/Bisphenol A (BPA) group
of the industry association PlasticsEurope. Website. Available online http://www.bisphenol-
a-europe.org/ (accessed 1 December 2008)
(23) IHCP “Updated European Risk Assessment Report 4,4’-
ISOPROPYLIDENEDIPHENOL (BISPHENOL-A)” European commission joint
research center. Institute for health and consumer protection.(IHCP). June 2008. CAS
Number: 80-05-7. EINECS Number: 201-245-8. Available online: http://ecb.jrc.it/documents/Existing-Chemicals/RISK_ASSESSMENT/ADDENDUM/bisphenola_add_325.pdf
(accessed 1 December 2008)
(24) Wikipedia contributors, 'Activated carbon', Wikipedia, The Free Encyclopedia, 7
December 2008, 06:08 UTC, Available online: http://en.wikipedia.org/w/index.php?
title=Activated_carbon&oldid=256372776 (accessed 7 December 2008)
(25) GEHRING M., VOGEL D., TENNHARDT L., WELTIN D.,BILITEWSKI B.
“Recycled paper distinctly contributes to the bisphenol a, nonylphenol ethoxylate, and
nonylphenol load of municipal wastewater”. Dresden university of technology, Dept. of
waste management. Germany. Available online: http://rcswww.urz.tu-
dresden.de/~gehring/deutsch/dt/poster/030331g2.pdf
(accessed 7 December 2008)
(26) SINHA R., Outline of polymer technology: manufacture of polymers, Prentice
Hall, New Delhi, 2000. ISBN 81-203-1728-9
(27) MARSH H., RODRIGUEZ-REINOSO F., “Introduction to the scope of the
text”, Activated Carbon. Elsevier edition, 2006. ISBN: 0-08-044463-6
(28) MARSH H., RODRIGUEZ-REINOSO F., “Characterization of Activated
carbon”, Activated Carbon. Elsevier edition, 2006. ISBN: 0-08-044463-6
(29) MARSH H., RODRIGUEZ-REINOSO F., “Applicability of activated carbon”,
Activated Carbon. Elsevier edition, 2006. ISBN: 0-08-044463-6
TAMK - University of Applied Sciences Final Thesis p.40/41Environmental Engineering Kevin THIEN
6. Appendices
APPENDIX A:
HPLC automatic internal standardization
TAMK - University of Applied Sciences Final Thesis p.41/41Environmental Engineering Kevin THIEN