Embed Size (px)
Citation preview

BIS Working PapersNo 470
The Impact of Liquidity Regulation on Banks by Ryan N. Banerjee and Hitoshi Mio
Monetary and Economic Department
October 2014
JEL classification: E32, E51, F30, G21, G28
Keywords: Banking, Liquidity regulation, Average treatment effect
BIS Working Papers are written by members of the Monetary and Economic Department of the Bank for International Settlements, and from time to time by other economists, and are published by the Bank. The papers are on subjects of topical interest and are technical in character. The views expressed in them are those of their authors and not necessarily the views of the BIS.
This publication is available on the BIS website (www.bis.org).
© Bank for International Settlements 2014. All rights reserved. Brief excerpts may be reproduced or translated provided the source is stated.
ISSN 1020-0959 (print) ISSN 1682-7678 (online)
1
The Impact of Liquidity Regulation on Banks
Ryan N. Banerjee and Hitoshi Mio
20th October 2014
Abstract:
To the best of our knowledge, this is the first study to estimate the effect of liquidity regulation on bank balance sheets. It takes advantage of the fact that not all banks were made subject to tighter liquidity regulation by the UK Financial Services Authority (FSA) in 2010. Under this new regulation a subset of banks operating in the UK were required to hold a sufficient stock of high quality liquid assets (HQLA) to withstand two scenarios of stressed funding conditions. We find that banks adjusted both their asset and liability structures to meet tighter liquidity requirements. Banks increased the share of HQLA and funding from more stable UK non-financial deposits while reducing the share of short-term intra-financial loans and short-term wholesale funding. We do not find evidence that the tightening of liquidity regulation had an impact on the overall size of bank balance sheets or a detrimental impact on lending to the non-financial sector either through reduced lending supply or higher interest rates on loans. Overall, in response to tougher liquidity regulation, banks replaced claims on other financial institutions with cash, central bank reserves and government bonds – and so reduced the interconnectedness of the banking sector without affecting lending to the real economy.
JEL Classification: E32, E51, F30, G21, G28
Keywords: Banking, Liquidity regulation, Average treatment effect
This paper was completed while Hitoshi Mio was on secondment at the Bank of England. We would like to thank David Aikman, Oliver Bush, Stephen Cecchetti, John Cunningham, Dietrich Domanski, Marc Farag, Rodrigo Guimaraes, Leo de Haan, Damian Harland, John Jackson, Sujit Kapadia, Michael Kiley, Antoine Lallour, Vasileios Madouros, Benjamin Nelson, Stephen Reynolds, May Rostom, Victoria Saporta, George Speight, Misa Tanaka, Philip Turner, Mark Walsh, Iain de Weymarn, Tomasz Wieladek, Matthew Willison and seminar participants at the Bank of England, Bank for International Settlements, De Nederlandsche Bank and Federal Reserve Board for the helpful comments and suggestions. Excellent data and research support was provided by Kirsty Rodwell and by the staff of Statistics and Regulatory Data Division of the Bank. All remaining errors are our own and the usual disclaimers apply. Corresponding author. Bank for International Settlements, Centralbahnplatz 2, CH-4002 Basel, Switzerland. Tel: +41 61 280 8305. Fax: +41 61 280 9100. Email: [email protected] Bank of Japan. Email: [email protected]
2
I. Introduction
During the international financial crisis which started in mid-2007, liquidity in short-term money markets dried up and banks suffered severe funding problems, including secured funding for highly-rated assets. By September 2007, Northern Rock experienced the first bank run by retail depositors in the UK since 1878. The significant reduction in market liquidity forced major central banks across the globe to provide huge amounts of liquidity assistance to their banking systems.
In 2010 the UK Financial Services Authority (FSA) introduced a new liquidity regulation called the Individual Liquidity Guidance (ILG). Internationally the Basel Committee on Banking Supervision agreed on a Liquidity Coverage Ratio (LCR) in 2013, which is similar in design to the ILG. The ILG aims to make the banking system more resilient to liquidity shocks by requiring banks to hold a minimum quantity of high quality liquid assets (HQLA) consisting of cash, central bank reserves and government bonds to cover net outflows of liabilities under two specific stress scenarios lasting 14 days and 3 months respectively. In these scenarios, it is assumed that banks that are more heavily dependent on short-term wholesale funding, especially from foreign counterparts would experience greater funding outflows and therefore need to hold higher ratios of HQLA to total assets to ensure immediate survival in stressed funding conditions.
Although more stringent liquidity regulation can reduce the risk of bank runs and freezing of the interbank market, there has been a vigorous debate about the negative impact of liquidity regulation due to its impact on bank lending to the non-financial economy and bank profitability. The ILG is designed to encourage banks to either increase the ratio of HQLA to other assets, decrease the ratio of short-term wholesale funding to more stable deposit and equity funding or a combination of the two. Beyond that, the design does not provide predictions about how banks will respond along other dimensions such as the impact on the size of bank balance sheets.
Banks can respond in a myriad of ways along these other dimensions to meet the ILG requirement which are likely to have significantly different implications for the real economy. For example a bank could increase the ratio of HQLA to stressed liability outflows by shrinking its balance sheet through a reduction in lending to the non-financial sector. Or a bank could attract more stable household deposit funding and use the proceeds to acquire HQLA, increasing the size of its bank balance. Banks could also meet the regulation without changing balance sheet size but instead increasing the share of HQLA to other assets by substituting liquidity held as intra-financial loans to government bonds without affecting lending to the non-financial sector while simultaneously increasing the share of funding from more stable household deposits and reducing short-term wholesale funding. In short, there are many possible ways for banks to meet tighter liquidity requirements.
There are few historical episodes to evaluate the response of banks to a tightening of liquidity regulation. This has created a wide range of views about the impact of liquidity regulation. Financial industry groups have argued that liquidity regulation will substantially increase the cost of bank funding and damage the real economy as banks pass on higher costs and reduce credit supply to the real economy (IIF, 2010). Others have argued that liquidity regulation will have a more limited impact (MAG, 2010).
This paper seeks to empirically identify the dimensions along which banks respond to liquidity regulation and thus shed light on the consequences for the broader economy. We estimate the average treatment effect of liquidity regulation on banks along multiple
3
dimensions by exploiting the heterogeneous implementation of tighter liquidity regulation in the UK. In particular, when the FSA introduced the ILG in 2010 it exempted some banks from this new regulation. The granting of ILG waivers provides a control group which enables identification of the average effect. To the best of our knowledge, this is the first empirical study to estimate the causal effect of liquidity regulation on bank balance sheets.
Additional consistency checks are applied to our estimates. We first estimate the average treatment effect on the shares of different asset and liability categories one-by-one. Because bank balance sheets must add-up any increase in the share of bank assets (liabilities) in one category must be offset by an equal and offsetting decrease in the shares of other assets (liabilities). If they did not, it would indicate that our estimates of the average treatment effect along the different dimensions are not internally consistent.
We find that banks adjusted both their asset and liability structures to meet tighter liquidity regulation. However, we do not find evidence that the tightening of liquidity regulation had an impact on the overall size of bank balance sheets or a detrimental impact on lending to the non-financial sector. Despite each of our estimates being derived from separately estimated equations, we do find overall consistency across our results with equal and offsetting changes in the composition of assets and liability components.
On the asset side of bank balance sheets, on average banks subject to the ILG increased the share of HQLA to total assets by 12 percentage points relative to those with waivers. The increased share of HQLA was matched by an almost equal reduction in the share of short-term intra-financial loans. Therefore, banks replaced private liquidity with official sector liquidity. Within the possible menu of HQLA, banks chose to hold central bank liabilities with over 75% of the increase in cash and central bank reserves and only a small fraction in UK T-bills and longer-maturity gilts. We do not find evidence that banks reduced their lending to the non-financial sector.
On the liability side of bank balance sheets, banks increased funding from sources considered more stable under the ILG such as UK non-financial deposits and reduced their dependence on less stable short-term wholesale funding and non-resident deposits by a similar magnitude.
Turning to the price impact of the ILG, for the limited balance sheet items for which data are available, we find that there is little evidence that banks increased interest rates on loans to the non-financial sector. Although ILG banks increased the share of funding from more stable UK non-financial deposits, surprisingly we do not find evidence that ILG banks increased the interest rate paid to attract those deposits.
Our finding that the ILG had a significant impact on balance sheet composition but only a limited interest rate impact suggests that tougher liquidity regulation affects bank profitability primarily through the substitution towards lower yielding HQLA and more expensive non-financial deposit funding.
Because the ILG significantly reduced intra-financial claims without having a measurable impact on the price or quantity of lending to the real economy, our results suggest that liquidity regulation could be a useful macro-prudential tool for reducing the transmission of shocks through a highly interconnected financial sector; an important factor that led to the evaporation of confidence in interbank markets during the 2007-08 financial crisis (Caballero and Simsek, 2009; Adrian and Shin, 2010). Furthermore, because the ILG encouraged banks

4
to replace private sector liquid asset buffers with official sector assets this is likely to improve welfare in the presence of aggregate shocks (Holmstrom and Tirole, 1998).
Because banks chose to meet their liquidity requirements in large part by increasing their holdings of central bank reserves, it is important to consider the influence of operational procedures related to the quantitative easing (QE) programme when interpreting our results. Changes to Bank of England operational procedures allowed commercial banks to deposit an unlimited quantity of reserves at the Bank of England that were remunerated at Bank rate. This facility created a perfectly elastic HQLA supply curve. If this facility had not existed, the tightening of liquidity regulation could have been more costly as the higher demand for other forms of HQLA such as T-bills and gilts would have increased the prices of those assets.
There has only been limited empirical research which evaluates the impact of liquidity regulation on banks. The principal reason is the scarcity of recent instances of demanding prudential liquidity regulation. For example liquidity regulation was excluded from both Basel I and Basel II regulations. A notable exception is the Dutch Liquidity Ratio introduced in 2003 (DNB, 2003). Although there are a number of recent studies which have analysed this regulation, unlike our paper, none have examined the impact of policy interventions which changed liquidity regulation.
Bonner (2012) and Bonner and Eijffinger (2012) test how the Dutch Liquidity Ratio affects corporate lending rates and interbank funding costs by exploiting the variation between banks that are just above or below their regulatory liquidity requirements. Consistent with our results they find that banks below their liquidity requirements do not charge higher interest rates on corporate loans. They also find that banks below their liquidity requirements pay higher interest rates on unsecured interbank loans, even though there is no public disclosure of this regulatory information. These studies, however, potentially suffer from endogeneity problems because the difference in behaviour between banks that comply and do not comply with existing regulation is crucially dependent on the preferences of bank supervisors to tolerate non-compliance of the regulation.
Duijm and Wierts (2014) use a panel error correction framework to test how banks adjust their balance sheets to meet the Dutch Liquidity Ratio following liquidity shocks. They find that when the gap between a bank’s actual liquidity ratio and its required ratio is below its long-term average, banks adjust their balance sheets by increasing the share of stable forms of funding, while the response of liquid assets is insignificant. This result is broadly in line with our study although we find adjustment to be more symmetric following a tightening of liquidity regulation, affecting both the composition of assets and liabilities.
Other microeconomic studies about bank liquidity management have also examined liquidity regulation and bank cash holdings, Bonner et. al. (2013); the maturity transformation of banks, De Haan and van den End (2013a); the liquidity transformation of banks, Berger and Bouwman (2009), regulatory intervention and liquidity transformation, Berger et. al. (2014); the management of reserve requirements, Barotolini et. al. (2001), Jallath-Coria et al. (2005); and holdings of cash and liquid securities, Freedman and Click (2009), Acharya and Merrouche (2013) and De Haan and van den End (2013b).
The remainder of the paper is organised as follows, Section II describes the institutional background and Section III the data. Sections IV and V present our empirical methodology and our main results. Section VI presents robustness checks and Section VII concludes.
5
II. UK Liquidity Regulation
The financial crisis of 2007-08 exposed the inadequacy of existing liquidity regulation. Liquidity problems in funding markets resulted in a run on Northern Rock and caused widespread liquidity hoarding across the entire banking system that eventually resulted in the Bank of England intermediating flows within the financial sector in 2008. In this section we outline the recent history of liquidity regulation in the UK prior to the financial crisis and the FSA’s introduction of the ILG in 2010, highlighting important elements for our identification strategy.
Before the 1980s, a central focus of bank regulators had been on various liquidity ratios. Banks had to provide regular reports on the maturity profiles of their assets and liabilities. Regulators paid particular attention to asset liquidity. Indeed, in 1975 George Blunden, the first Chairman of the Basel Committee on Banking Standards (BCBS) and head of banking supervision at the Bank of England stated that “… the [Basel] Committee’s main objective was to help ensure bank solvency and liquidity.” (p.317 Goodhart, 2011).
During the 1980s, however, the emphasis on liquidity ratios waned. Monetary policy implementation became more centred on short-term interest rates and less on liquidity ratios. The Bank of England recognised that the abolition of bank reserve asset ratios left a prudential gap noting that … “the Bank will seek to develop the single comprehensive measurement [of the overall liquidity of banks]” (p.40 Bank of England, 1981). However, this “single comprehensive measurement” proved to be elusive. Similarly, there was no agreement on international liquidity standards in Basel I and II. As Goodhart (2011) notes, “If one takes the twenty years from 1967 until 1987, both capital and liquidity ratios were declining sharply in most countries. If one takes the next twenty years from 1987 until mid-2007, capital ratios recovered, but liquidity ratios continued to plummet.” Goodhart (2011) goes on to discuss that a key reason for the neglect of liquidity regulation relative to solvency regulation was the absence of banking liquidity crises during this period.
At the time of the 2007-08 financial crisis, liquidity regulation in the UK consisted of three different regimes depending on the type of financial institution. The Sterling Stock Liquidity Regime applied to the major sterling clearing banks. It required banks to hold a stock of Bank of England eligible assets to meet wholesale sterling outflows over the next five days and cover 5% of maturing retail deposits withdrawable over the same period. Allowable certificates of deposit could be used to offset wholesale sterling liabilities by up to 10% with a 15% haircut. The Mismatch Liquidity Regime applied to all other banks which included most foreign banks operating in the UK. Under the Mismatch Regime, the FSA reviewed bank cashflows to determine the required stock of liquid assets. Liquid assets were defined as assets having regularly quoted prices which are regularly traded and can be readily sold for cash. Banks were able to determine the type of liquid assets on a case-by-case basis with the supervisor. The Building Society Regime required building societies to hold 3.5% of liabilities in high quality marketable assets, which extended beyond the Bank of England’s eligible collateral list to include commercial paper from Sterling Stock banks. In addition, some UK branches of non-resident banks received Global Liquidity Concessions (GLC) which transferred day-to-day supervision of liquidity to the home state regulator.
In early 2007, prior to the financial crisis, the FSA had already commenced a review of existing liquidity regulation. In August 2007, there was a significant reduction in short-term money market liquidity which caused severe funding difficulties for many banks. On 14th September 2007, Northern Rock experienced a run by retail depositors, the first in the
6
UK since 1878. These liquidity problems in funding markets added extra impetus to the existing review with the FSA publishing Discussion Paper (07/7) in December 2007, examining the liquidity requirements of banks and building societies (FSA, 2007). The discussion paper outlined preliminary ideas for the reform of UK liquidity regulation and indicated that it would consist of a quantitative liquidity requirement that measured maturity mismatch and would require a buffer of highly-liquid assets to ensure the immediate survival of banks in stressed funding conditions. The paper also indicated that liquidity regulation would be extended to a wider range of banks. The discussion paper solicited feedback on the proposals.
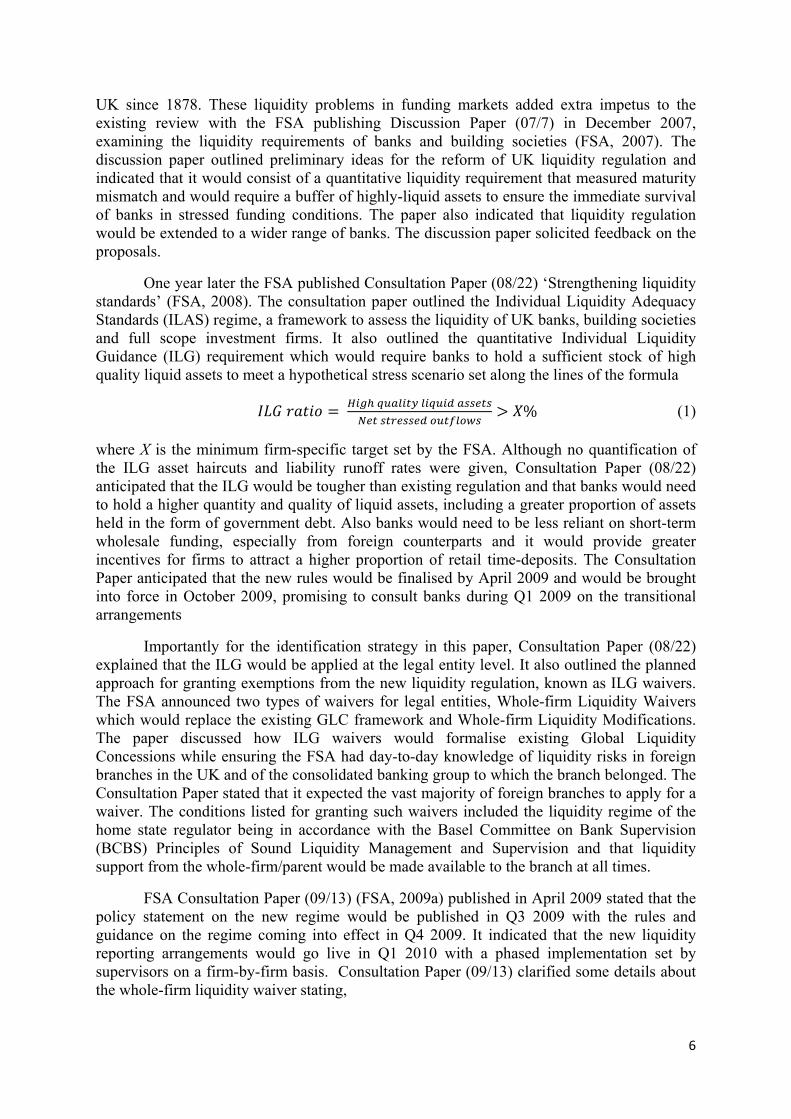
One year later the FSA published Consultation Paper (08/22) ‘Strengthening liquidity standards’ (FSA, 2008). The consultation paper outlined the Individual Liquidity Adequacy Standards (ILAS) regime, a framework to assess the liquidity of UK banks, building societies and full scope investment firms. It also outlined the quantitative Individual Liquidity Guidance (ILG) requirement which would require banks to hold a sufficient stock of high quality liquid assets to meet a hypothetical stress scenario set along the lines of the formula
= > % (1)
where X is the minimum firm-specific target set by the FSA. Although no quantification of the ILG asset haircuts and liability runoff rates were given, Consultation Paper (08/22) anticipated that the ILG would be tougher than existing regulation and that banks would need to hold a higher quantity and quality of liquid assets, including a greater proportion of assets held in the form of government debt. Also banks would need to be less reliant on short-term wholesale funding, especially from foreign counterparts and it would provide greater incentives for firms to attract a higher proportion of retail time-deposits. The Consultation Paper anticipated that the new rules would be finalised by April 2009 and would be brought into force in October 2009, promising to consult banks during Q1 2009 on the transitional arrangements
Importantly for the identification strategy in this paper, Consultation Paper (08/22) explained that the ILG would be applied at the legal entity level. It also outlined the planned approach for granting exemptions from the new liquidity regulation, known as ILG waivers. The FSA announced two types of waivers for legal entities, Whole-firm Liquidity Waivers which would replace the existing GLC framework and Whole-firm Liquidity Modifications. The paper discussed how ILG waivers would formalise existing Global Liquidity Concessions while ensuring the FSA had day-to-day knowledge of liquidity risks in foreign branches in the UK and of the consolidated banking group to which the branch belonged. The Consultation Paper stated that it expected the vast majority of foreign branches to apply for a waiver. The conditions listed for granting such waivers included the liquidity regime of the home state regulator being in accordance with the Basel Committee on Bank Supervision (BCBS) Principles of Sound Liquidity Management and Supervision and that liquidity support from the whole-firm/parent would be made available to the branch at all times.
FSA Consultation Paper (09/13) (FSA, 2009a) published in April 2009 stated that the policy statement on the new regime would be published in Q3 2009 with the rules and guidance on the regime coming into effect in Q4 2009. It indicated that the new liquidity reporting arrangements would go live in Q1 2010 with a phased implementation set by supervisors on a firm-by-firm basis. Consultation Paper (09/13) clarified some details about the whole-firm liquidity waiver stating,

7
‘… all elements of the proposed regime would be switched off. However, in granting the waiver we intend to request whole-firm liquidity data at a frequency and format acceptable to us.’ (p. 29 FSA, 2009a).
Nevertheless, the feedback from banks on Consultation Paper (09/14) (FSA 2009b) documented in Policy Statement (09/16) (FSA 2009c) indicated that at this stage there was still considerable uncertainty about the FSA’s policy for granting ILG waivers.
Finally in October 2009, the FSA published Policy Statement (09/16) ‘Strengthening Liquidity Standards’ (FSA, 2009c) which finalised the far-reaching overhaul of the UK framework on liquidity regulation. The policy statement stated that banks were required to hold a sufficient stock of high quality liquid assets (HQLA) to withstand two scenarios of stressed funding conditions, an acute bank specific funding shock lasting 14 days and less acute but more generalised deterioration in funding conditions lasting 3 months. The policy statement further clarified that a waiver would exempt branches almost entirely from the new tougher liquidity regime,
‘[t]he overall effect of a whole-firm liquidity modification will be that a branch will no longer be subject to our quantitative Individual Liquidity Adequacy Standards (ILAS) regime and systems and control requirements, as set out in BIRPU 12.3 – 12.5 of the final rules.’ (p. 54 FSA PS09/16)
The Policy Statement also announced that the final timetable for the new regime would be pushed back slightly from April 2010 to 1st June 2010 for sterling stock banks and standard ILAS building societies, to 1st October for banks under the existing Liquidity Mismatch regime and banks and building societies subject to the simplified ILAS and to 1st November 2010 for investment firms and branches. This timetable was followed during the implementation period.
FIGURE I Sterling liquid assets relative to total asset holdings of UK banking sector(a)
Sources: Bank of England and Bank calculations (a) Cash + Bank of England balances + money at call + eligible bills + UK gilts
Figure I illustrates the decline in liquidity ratios discussed in Goodhart (2011). Between 1968 and the early 1980s HQLA declined from around 30% to less than 5% of total assets. There was a further reduction after 1996 when the liquidity regime which prevailed at
0
5
10
15
20
25
30
35
1968 1973 1978 1983 1988 1993 1998 2003 2008
% of total assets

8
the time of the financial crisis was introduced.1 However, since 2008, the share of HQLA to total assets has increased substantially.
Independent of tighter liquidity regulation, there are a number of reasons which might have contributed to the post 2008 increase in HQLA. In the aftermath of the financial crisis, banks endogenously increased their liquid asset buffers to meet stressed outflows, a widespread phenomenon that has been documented in other banking systems that did not experience changes in liquidity regulation (e.g. den Haan and van den End, 2013b). Also, asset purchases from the Bank of England’s QE programme, which started in 2009, mechanically increased the quantity of central bank reserves in the UK banking system. Despite these other influences, because our identification strategy uses banks that were granted waivers from the ILG requirement as a control group, we are able to isolate the contribution of tighter liquidity regulation on bank balance sheets from these other factors.
III. DATA
Our dataset is mainly constructed from entity level statistical returns collected for the production of the Bank of England’s monetary statistics. Because the ILG regulation is applied at the legal entity level (e.g. branch or subsidiary) this data source accurately captures the entity subject to the regulation unlike data collected at the consolidated bank-level. However, because many of the legal entities considered are not separately capitalised, interpreting the full impact of liquidity regulation on the liability structure is not possible. We do however, control for the effects of bank capitalisation in our regression by using the ratio of Tier 1 capital to risk-weighted assets of the entity’s consolidated banking group which is collected from Bankscope and regulatory returns from the FSA.
For banks that were allowed to pool liquidity across some of their UK entities, we aggregate the entity level statistical data into groups that are defined as separate entities for UK liquidity regulation (we call these entities banks hereinafter). Our entity-level data are derived from three specific forms. Form BT covers basic balance sheet information and has the largest coverage of more than 300 banks. However, Form BT does not record information on the sectoral decompositions for UK loans and deposits such as UK loans to and UK deposits from households and PNFCs. To extract sectoral decompositions, we use Form BE, which has more limited coverage of around 100 larger banks. Form PL contains information about the interest income and interest payable by banks and has the most restrictive coverage among the three forms. Forms PL and BE are used to calculate the average interest rate on UK non-financial loans and the average interest rate on UK non-financial deposits.
Due to constraints on data availability, we analyse the impact of liquidity on sterling balance sheets. The focus on sterling balance sheets alone is not necessarily problematic because the ILG requires banks to consider currency mismatches. Moreover, in terms of the ILG impact on the domestic UK economy, the sterling balance sheet is likely to be the most important. The Data Appendix shows the list of dependent variables and explains the data sources used in this analysis.
1 From December 2004, the FSA also required banks to undertake stress testing and scenario analysis of their liquidity needs, develop contingency plans and document their liquidity risk management.

9
FIGURE II Sterling HQLA relative to total assets in ILG and non-ILG banks(a)
Sources: Bank of England and authors’ calculations (a) HQLA = Cash + T bills + UK gilts. See the data appendix.
Examining the descriptive statistics about the control and treatment groups, Figure II
shows the evolution of HQLA in banks prior to and after the implementation of the ILG. In 2008, the mean share of HQLA to total sterling assets were very similar in banks that would become subject to the ILG regulation and those that would be granted waivers. During 2009, when the FSA finalised the key details of the tougher ILG requirements and uncertainty remained about the granting of ILG waivers, the mean share of HQLA to total assets in both the treatment and control groups increased at a similar rate to around 4%. However, in early 2010, soon after the FSA had clarified which banks would be subject to the requirement and which would receive waivers, a persistent divergence emerged between the two groups. Mean HQLA for banks subject to the ILG increased to 8% of total assets by Q4 2010, while mean HQLA for banks with ILG waivers remained virtually unchanged. Between Q1 2011 and Q1 2012 banks subject to the ILG increased HQLA by a further 3 percentage points as more banks received specific quantitative ILG targets from the FSA.2 The evolution of HQLA to total assets suggests that before the ILG, the behaviour of banks in both the treatment and control groups was broadly similar and that when the ILG was introduced it had a significant impact on banks in the treatment group relative to banks in the control group.
In 2010/Q1 just before the introduction of the ILG, our sample consists of 171 banks after truncations, of which 90 are subject to the ILG while 81 received ILG waivers.3 The distribution of key variables of the ILG and non-ILG banks in Q1 2010 are summarised in Table I. It shows that the size distribution, given by log total assets of ILG banks and non-ILG banks prior to the ILG was broadly similar except for the 90th percentile which shows that there are larger banks in the treatment group. The distribution of Tier 1 capital shows that
2 There was a second source of heterogeneity because supervisors staggered the setting of ILG ratios across banks due to the strain on resources during this period. Unfortunately we were unable to obtain the exact timing when individual ILG ratios were set for each bank. 3 To eliminate extreme banks, a bank is truncated if the data is from: (i) a small bank, i.e. UK sterling assets less than £100m; (ii) a bank which doubled/halved UK sterling assets from the previous year; or (iii) a bank that has a ratio of sterling assets to liabilities greater than 200% or less than 50%. In addition for the interest rate estimations, a bank is truncated if the average interest rate change over any quarter is greater than 200bps.
0%
2%
4%
6%
8%
10%
12%
08/Q
108
/Q2
08/Q
308
/Q4
09/Q
109
/Q2
09/Q
309
/Q4
10/Q
110
/Q2
10/Q
310
/Q4
11/Q
111
/Q2
11/Q
311
/Q4
12/Q
1
ILG (mean) Non-ILG (mean)
ILGintroduction
PolicyStatement
per cent

10
capital is in general higher in ILG banks compared to non-ILG banks. Turning to balance sheet composition, the distribution of HQLA to total assets across the two groups is broadly similar. However, ILG banks have a greater share of loans to UK non-banks and smaller share of short-term financial loans than non-ILG banks. There are also important differences on the liability side: ILG banks have a greater share of funding from UK non-bank deposits and a smaller share of non-UK deposits funding than non-ILG banks. Overall, these descriptive statistics indicate that there are differences in the concentration on the UK businesses between ILG banks and non-ILG banks. Below we discuss our regression adjustment method to control for the different concentration of UK business when estimating the average treatment effect. We also perform robustness checks to determine the sensitivity of our results to these differences.
TABLE I Distribution of key variables by group (2010/Q1)
ILG banks: 90 banks mean 90%tile 75%tile median 25%tile 10%tile Total assets (in log) 7.20 10.08 8.47 6.60 5.72 5.15 Tier I capital adequacy ratio 15.3% 21.5% 17.0% 14.0% 11.5% 10.1% Asset composites (% share to the total assets) HQLAs 5.3% 11.6% 8.0% 2.9% 0.0% 0.0% Short-term intra-financial loans 27.0% 54.0% 36.5% 22.5% 10.7% 3.6% UK non-bank loans 55.5% 77.0% 74.1% 66.4% 41.4% 10.4%
Liability composites (% share to the total liabilities) Short-term wholesale funding 4.4% 11.4% 6.1% 2.5% 0.0% 0.0% Non-UK deposits 9.7% 40.4% 7.0% 0.6% 0.1% 0.0% UK non-bank deposits 67.1% 90.7% 86.0% 80.8% 54.3% 11.7%
Non-ILG banks: 81 banks mean 90%tile 75%tile median 25%tile 10%tile Total assets (in log) 7.42 9.39 8.77 7.39 6.24 5.33 Tier I capital adequacy ratio 12.0% 16.3% 13.0% 10.7% 9.2% 8.3% Asset composites (% share to the total assets) HQLAs 5.8% 20.6% 0.3% 0.0% 0.0% 0.0% Short-term intra-financial loans 37.2% 93.9% 67.4% 26.3% 7.6% 1.2% UK non-bank loans 38.3% 76.5% 60.4% 39.5% 14.2% 2.0%
Liability composites (% share to the total liabilities) Short-term wholesale funding 14.9% 48.8% 20.3% 8.0% 0.2% 0.0% Non-UK deposits 37.5% 67.6% 55.5% 35.2% 15.0% 4.1% UK non-bank deposits 26.5% 60.2% 40.2% 20.3% 7.7% 1.4%
11
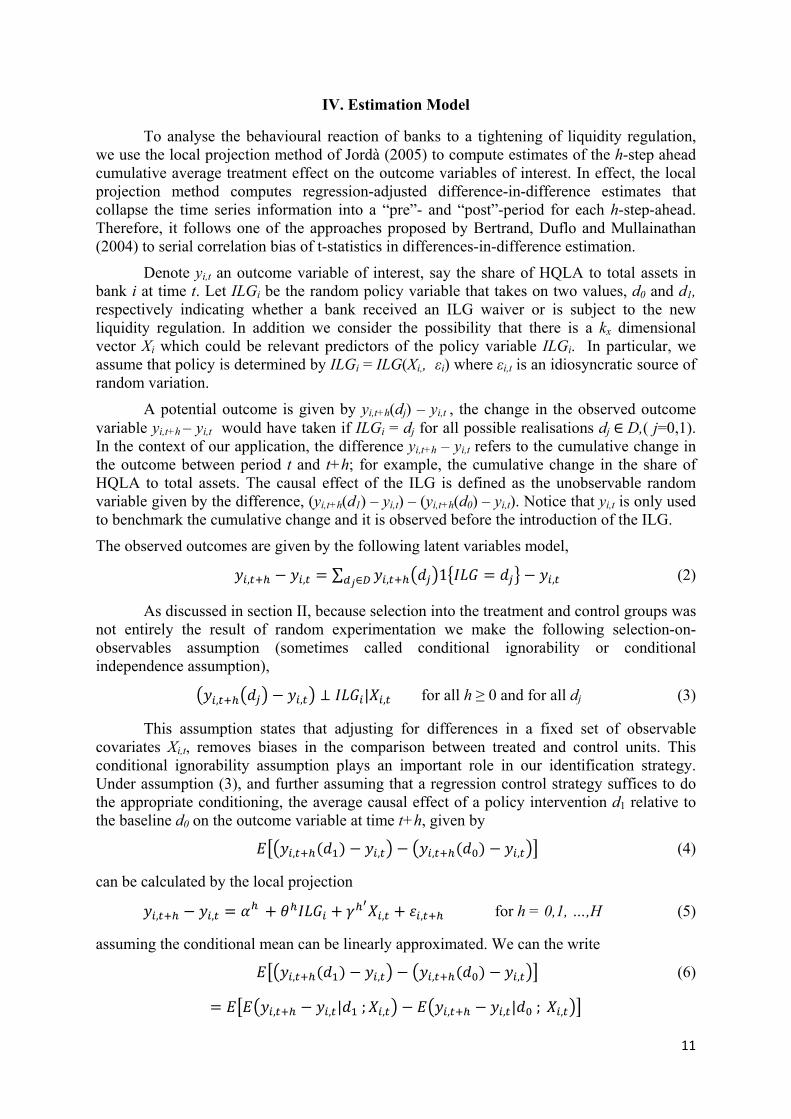
IV. Estimation Model
To analyse the behavioural reaction of banks to a tightening of liquidity regulation, we use the local projection method of Jordà (2005) to compute estimates of the h-step ahead cumulative average treatment effect on the outcome variables of interest. In effect, the local projection method computes regression-adjusted difference-in-difference estimates that collapse the time series information into a “pre”- and “post”-period for each h-step-ahead. Therefore, it follows one of the approaches proposed by Bertrand, Duflo and Mullainathan (2004) to serial correlation bias of t-statistics in differences-in-difference estimation.
Denote yi,t an outcome variable of interest, say the share of HQLA to total assets in bank i at time t. Let ILGi be the random policy variable that takes on two values, d0 and d1, respectively indicating whether a bank received an ILG waiver or is subject to the new liquidity regulation. In addition we consider the possibility that there is a kx dimensional vector Xi which could be relevant predictors of the policy variable ILGi. In particular, we assume that policy is determined by ILGi = ILG(Xi,, εi) where εi,t is an idiosyncratic source of random variation.
A potential outcome is given by yi,t+h(dj) – yi,t , the change in the observed outcome variable yi,t+h – yi,t would have taken if ILGi = dj for all possible realisations dj ∈ D,( j=0,1). In the context of our application, the difference yi,t+h – yi,t refers to the cumulative change in the outcome between period t and t+h; for example, the cumulative change in the share of HQLA to total assets. The causal effect of the ILG is defined as the unobservable random variable given by the difference, (yi,t+h(d1) – yi,t) – (yi,t+h(d0) – yi,t). Notice that yi,t is only used to benchmark the cumulative change and it is observed before the introduction of the ILG. The observed outcomes are given by the following latent variables model,
, − , = ∑ , 1 = − ,∈ (2)
As discussed in section II, because selection into the treatment and control groups was not entirely the result of random experimentation we make the following selection-on-observables assumption (sometimes called conditional ignorability or conditional independence assumption),
, − , ⊥ | , for all h ≥ 0 and for all dj (3)
This assumption states that adjusting for differences in a fixed set of observable covariates Xi,t, removes biases in the comparison between treated and control units. This conditional ignorability assumption plays an important role in our identification strategy. Under assumption (3), and further assuming that a regression control strategy suffices to do the appropriate conditioning, the average causal effect of a policy intervention d1 relative to the baseline d0 on the outcome variable at time t+h, given by
, ( ) − , − , ( ) − , (4)
can be calculated by the local projection
, − , = + + , + , for h = 0,1, …,H (5)
assuming the conditional mean can be linearly approximated. We can the write
, ( ) − , − , ( ) − , (6) = , − , | ; , − , − , | ; ,

12
= ( − ) Note that the average treatment effect, can be easily estimated using OLS in
expression (5). The local projection directly conditions on observables (under the assumption of linearity) and facilitates the computation of (6).
Our empirical strategy is to estimate, one-by-one, the average treatment effect of the ILG along different dimensions by which banks can adjust. This analysis along multiple dimensions allows us to not only examine the impact of the regulation on specific balance sheet components but also to provides an overview of how the overall asset and liability management choices of banks were affected by the ILG. The analysis over multiple dimensions also provides an additional consistency check on our overall results. Because bank balance sheets must add-up to total assets (liabilities), the estimated average treatment effects on the changes in shares of different asset (liability) categories should sum to zero.
IV.A Selection of Conditioning Variables
As discussed in section II, to estimate the average treatment effect, we make a selection-on-observables assumption to control for the fact that selection of banks into the ILG treatment group was not random but rather largely determined by bank type. To operationalise the selection-on-observables assumption we estimated probit regressions predicting selection into the treatment group for the 1023 possible combination of the 10 covariates we considered and used the Akaike Information Criterion to select the optimal set of controls Xi,t that predict selection into the treatment group.4
TABLE II Probit regression of ILG treatment prediction ILG treatment dummy
ln(£assets) 0.128 (0.089)
Tier I capital adequacy ratio 4.627 * (2.494)
HQLA/total assets Excluded in optimal model
Short-term intra-financial loans /total assets -1.326 *** (0.465)
UK non-bank loans/total assets Excluded in optimal model
Short-term wholesale funding/total liabilities -4.045 *** (1.527)
Non-UK deposits/total liabilities -1.572 *** (0.610)
UK non-bank deposits/total liabilities 1.914 *** (0.507)
£assets growth (08q3-09q3) 1.381 ** (0.643)
£assets growth (08q4-09q4) -1.108 (0.727)
Const -1.235 (0.912)
Pseudo r2 0.438 AIC 151.0198 N 171 Standard errors in the parentheses, *** indicates significance at the 1% level; ** at the 5% level; * at the 10% level.
4 Changing the criteria to the Bayesian Information Criterion alters the preferred set of control variables but does not change our main results.

13
Table II lists the vector of controls Xi,t, considered and the estimated probit coefficients for the optimal prediction model, which consist of the following variables at the entity level: size (measured by log total sterling assets), the ratio of Tier 1 capital to risk-weighted assets of the consolidated parent of the entity; exposure to the short-term wholesale market (measured by share of short-term intra financial loans to total assets and the share of short-term wholesale funding to total liabilities); the UK focus of the entity (measured by the share of non-UK deposits to total liabilities and share of UK non-bank deposits to total liabilities); and the pre-ILG trends in balance sheet growth and rates of change (measured by asset growth between 2008/Q3 and 2009/Q3 and the growth between 2008/Q4 and 2009/Q4). The signs of the coefficients confirm the descriptive statistics in Table I: large banks were more likely to be subject to the ILG, there are important differences in the liability structure between ILG and non-ILG banks and that ILG banks had on average a greater UK focus. Interestingly, the share of HQLA to total assets is never an important variable predicting selection into ILG treatment and the share of UK non-bank loans to total assets is driven out from the optimal prediction model by the share of UK non-bank deposits. IV.B Estimating the Average Treatment Effect on Bank Interest Rates
Some extra care is needed to analyse the average treatment effect of the ILG on bank interest rates because data on interest rates are averages over baskets of heterogeneous assets (liabilities). Differences in the initial composition of baskets between the treatment and control groups can contaminate estimates of the ILG impact on the average interest rate receivable (payable) on the overall balance sheet of a bank. To see this, note that the definition of the average interest rate receivable on a basket of bank assets (or similarly a basket of bank liabilities) is given by
, ≡ , ,
where, , is the average interest rate on the basket of assets (liabilities), ai,t is the share of each asset (liability) on the balance sheet, ri,t the interest rate on each asset (liability) and N is the number of assets with different interest rates. The change in the average interest rate receivable on the basket between period t and t+h can be written as,
∆ , = ∆ , , + ∆ , , + ∆ , ∆ , (7) where Δxt+h = xt+h – xt. Equation (7) shows that the change in the average interest rate on the basket of assets can be decomposed into the sum of the interest rate changes holding the asset shares constant (within-asset component) and the sum of the share changes holding the initial interest rates constant (between-asset component) and the product of changes in asset shares and interest rates.
Because of the systematic differences in the initial composition of assets and liabilities in the treatment and control groups (Table I), equation (7) indicates that the overall change in the average interest rate on a basket of assets ∆ , would be influenced by differences in the pre-ILG asset (liability) composition ( , ) or interest rates ( , ) in the treatment and control groups, which are presumably independent of the ILG treatment. To minimise this concern we restrict our analysis to estimating the change in the average interest
14
rates on the narrowest asset (liability) baskets (∆ , ) that the data allow, which are the average interest rates on UK non-financial loans and UK non-bank deposits.
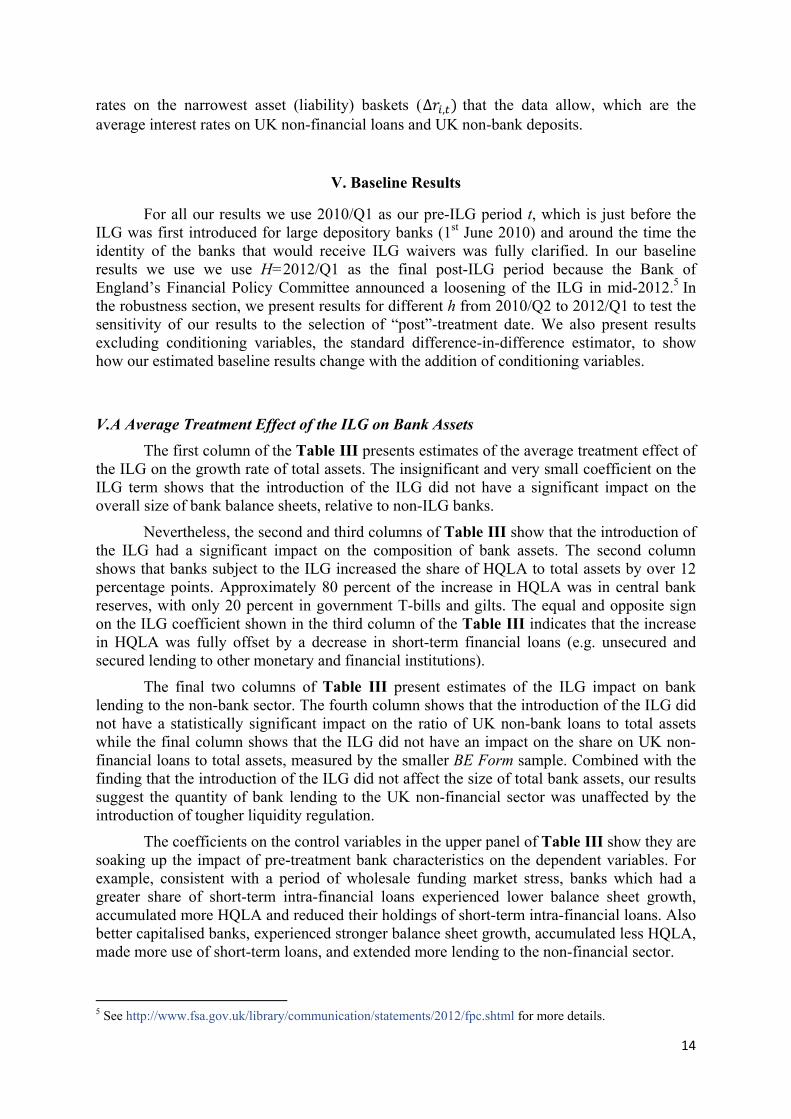
V. Baseline Results
For all our results we use 2010/Q1 as our pre-ILG period t, which is just before the ILG was first introduced for large depository banks (1st June 2010) and around the time the identity of the banks that would receive ILG waivers was fully clarified. In our baseline results we use we use H=2012/Q1 as the final post-ILG period because the Bank of England’s Financial Policy Committee announced a loosening of the ILG in mid-2012.5 In the robustness section, we present results for different h from 2010/Q2 to 2012/Q1 to test the sensitivity of our results to the selection of “post”-treatment date. We also present results excluding conditioning variables, the standard difference-in-difference estimator, to show how our estimated baseline results change with the addition of conditioning variables.
V.A Average Treatment Effect of the ILG on Bank Assets The first column of the Table III presents estimates of the average treatment effect of
the ILG on the growth rate of total assets. The insignificant and very small coefficient on the ILG term shows that the introduction of the ILG did not have a significant impact on the overall size of bank balance sheets, relative to non-ILG banks.
Nevertheless, the second and third columns of Table III show that the introduction of the ILG had a significant impact on the composition of bank assets. The second column shows that banks subject to the ILG increased the share of HQLA to total assets by over 12 percentage points. Approximately 80 percent of the increase in HQLA was in central bank reserves, with only 20 percent in government T-bills and gilts. The equal and opposite sign on the ILG coefficient shown in the third column of the Table III indicates that the increase in HQLA was fully offset by a decrease in short-term financial loans (e.g. unsecured and secured lending to other monetary and financial institutions).
The final two columns of Table III present estimates of the ILG impact on bank lending to the non-bank sector. The fourth column shows that the introduction of the ILG did not have a statistically significant impact on the ratio of UK non-bank loans to total assets while the final column shows that the ILG did not have an impact on the share on UK non-financial loans to total assets, measured by the smaller BE Form sample. Combined with the finding that the introduction of the ILG did not affect the size of total bank assets, our results suggest the quantity of bank lending to the UK non-financial sector was unaffected by the introduction of tougher liquidity regulation.
The coefficients on the control variables in the upper panel of Table III show they are soaking up the impact of pre-treatment bank characteristics on the dependent variables. For example, consistent with a period of wholesale funding market stress, banks which had a greater share of short-term intra-financial loans experienced lower balance sheet growth, accumulated more HQLA and reduced their holdings of short-term intra-financial loans. Also better capitalised banks, experienced stronger balance sheet growth, accumulated less HQLA, made more use of short-term loans, and extended more lending to the non-financial sector.
5 See http://www.fsa.gov.uk/library/communication/statements/2012/fpc.shtml for more details.

15
TABLE III Baseline ILG impact on the asset size and asset shares With control variables
Δln(total assets)
As a share of total assets
HQLA
Short-term intra-financial
loans
UK non-bank loans
UK non-financial
loans (BE)
ILG -0.005 0.121 *** -0.123 *** 0.000 -0.017 (0.078) (0.031) (0.044) (0.023) (0.035)
ln(£assets) -0.035 *** -0.004 0.010 * 0.000 0.002 (0.012) (0.005) (0.005) (0.004) (0.008)
Tier I capital adequacy ratio
0.469 -0.194 0.241 -0.048 0.032 (0.310) (0.156) (0.228) (0.089) (0.243)
Short-term intra-financial loans/TA
-0.046 0.129 *** -0.227 *** 0.062 ** 0.023 (0.107) (0.044) (0.063) (0.026) (0.049)
Short-term wholesale funding/TL
0.001 0.018 -0.020 0.030 -0.013 (0.251) (0.108) (0.141) (0.089) (0.147)
Non-UK deposits/TL -0.237 -0.035 0.083 -0.013 -0.044 (0.155) (0.049) (0.078) (0.048) (0.067)
UK non-bank deposits/TL
-0.155 -0.100 * 0.102 0.045 0.010 (0.111) (0.051) (0.075) (0.041) (0.072)
£assets growth (08q3-09q3)
0.335 * -0.010 0.103 -0.072 0.054 (0.188) (0.046) (0.066) (0.054) (0.054)
£assets growth (08q4-09q4)
0.122 -0.122 ** 0.007 0.121 ** -0.038 (0.204) (0.058) (0.076) (0.050) (0.063)
Const 0.346 ** 0.049 -0.087 -0.031 -0.007 (0.149) (0.058) (0.073) (0.047) (0.089)
r2 0.184 0.284 0.243 0.093 0.031 N 160 160 160 160 85 Without control variables
Δln(total assets)
As a share of total assets
HQLA Short-term
intra-financial loans
UK non-bank loans
UK non-financial
loans (BE)
ILG 0.037 0.064 *** -0.061 ** 0.008 0.001 (0.050) (0.018) (0.026) (0.016) (0.020)
Const -0.011 0.011 -0.022 -0.004 -0.002 (0.044) (0.012) (0.018) (0.014) (0.017)
r2 0.004 0.072 0.034 0.002 0.000 N 160 160 160 160 85 *** indicates significance at the 1% level; ** at the 5% level; * at the 10% level. Standard errors in the parentheses are the White robust standard errors.
The lower panel of Table III, which presents estimates excluding conditioning
variables, shows that the broad story remains unaltered: insignificant change in bank balance sheet size, one-to-one substitution from short-term financial exposures to HQLA and no impact on lending to the non-bank and non-financial sectors. The conditioning variables do, however, increase the estimated size of the substitution towards HQLA from short-term financial loans.
16
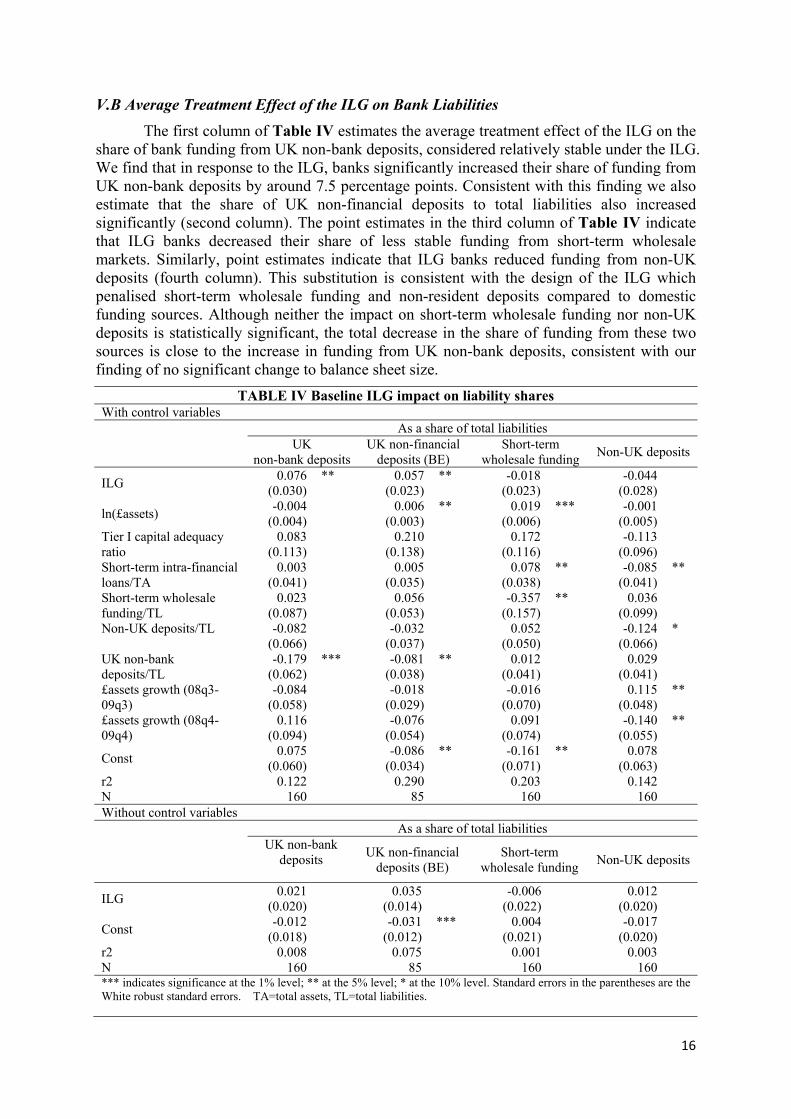
V.B Average Treatment Effect of the ILG on Bank Liabilities The first column of Table IV estimates the average treatment effect of the ILG on the
share of bank funding from UK non-bank deposits, considered relatively stable under the ILG. We find that in response to the ILG, banks significantly increased their share of funding from UK non-bank deposits by around 7.5 percentage points. Consistent with this finding we also estimate that the share of UK non-financial deposits to total liabilities also increased significantly (second column). The point estimates in the third column of Table IV indicate that ILG banks decreased their share of less stable funding from short-term wholesale markets. Similarly, point estimates indicate that ILG banks reduced funding from non-UK deposits (fourth column). This substitution is consistent with the design of the ILG which penalised short-term wholesale funding and non-resident deposits compared to domestic funding sources. Although neither the impact on short-term wholesale funding nor non-UK deposits is statistically significant, the total decrease in the share of funding from these two sources is close to the increase in funding from UK non-bank deposits, consistent with our finding of no significant change to balance sheet size.
TABLE IV Baseline ILG impact on liability shares With control variables As a share of total liabilities
UK
non-bank depositsUK non-financial
deposits (BE) Short-term
wholesale funding Non-UK deposits
ILG 0.076 ** 0.057 ** -0.018 -0.044 (0.030) (0.023) (0.023) (0.028)
ln(£assets) -0.004 0.006 ** 0.019 *** -0.001 (0.004) (0.003) (0.006) (0.005)
Tier I capital adequacy ratio
0.083 0.210 0.172 -0.113 (0.113) (0.138) (0.116) (0.096)
Short-term intra-financial loans/TA
0.003 0.005 0.078 ** -0.085 ** (0.041) (0.035) (0.038) (0.041)
Short-term wholesale funding/TL
0.023 0.056 -0.357 ** 0.036 (0.087) (0.053) (0.157) (0.099)
Non-UK deposits/TL -0.082 -0.032 0.052 -0.124 * (0.066) (0.037) (0.050) (0.066)
UK non-bank deposits/TL
-0.179 *** -0.081 ** 0.012 0.029 (0.062) (0.038) (0.041) (0.041)
£assets growth (08q3-09q3)
-0.084 -0.018 -0.016 0.115 ** (0.058) (0.029) (0.070) (0.048)
£assets growth (08q4-09q4)
0.116 -0.076 0.091 -0.140 ** (0.094) (0.054) (0.074) (0.055)
Const 0.075 -0.086 ** -0.161 ** 0.078 (0.060) (0.034) (0.071) (0.063)
r2 0.122 0.290 0.203 0.142 N 160 85 160 160 Without control variables As a share of total liabilities
UK non-bank
deposits
UK non-financial deposits (BE)
Short-term wholesale funding Non-UK deposits
ILG 0.021 0.035 -0.006 0.012 (0.020) (0.014) (0.022) (0.020)
Const -0.012 -0.031 *** 0.004 -0.017 (0.018) (0.012) (0.021) (0.020)
r2 0.008 0.075 0.001 0.003 N 160 85 160 160 *** indicates significance at the 1% level; ** at the 5% level; * at the 10% level. Standard errors in the parentheses are the White robust standard errors. TA=total assets, TL=total liabilities.
17
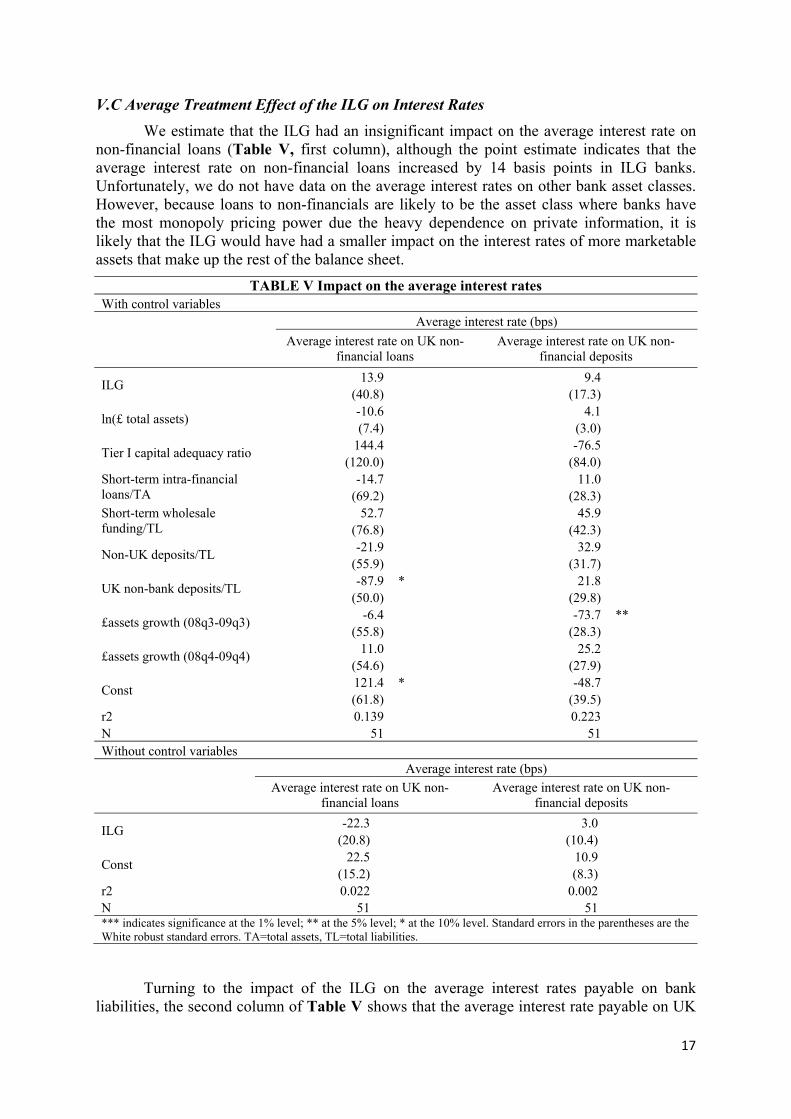
V.C Average Treatment Effect of the ILG on Interest Rates We estimate that the ILG had an insignificant impact on the average interest rate on
non-financial loans (Table V, first column), although the point estimate indicates that the average interest rate on non-financial loans increased by 14 basis points in ILG banks. Unfortunately, we do not have data on the average interest rates on other bank asset classes. However, because loans to non-financials are likely to be the asset class where banks have the most monopoly pricing power due the heavy dependence on private information, it is likely that the ILG would have had a smaller impact on the interest rates of more marketable assets that make up the rest of the balance sheet.
TABLE V Impact on the average interest rates With control variables
Average interest rate (bps) Average interest rate on UK non-
financial loans Average interest rate on UK non-
financial deposits
ILG 13.9 9.4 (40.8) (17.3)
ln(£ total assets) -10.6 4.1 (7.4) (3.0)
Tier I capital adequacy ratio 144.4 -76.5 (120.0) (84.0)
Short-term intra-financial loans/TA
-14.7 11.0 (69.2) (28.3)
Short-term wholesale funding/TL
52.7 45.9 (76.8) (42.3)
Non-UK deposits/TL -21.9 32.9 (55.9) (31.7)
UK non-bank deposits/TL -87.9 * 21.8 (50.0) (29.8)
£assets growth (08q3-09q3) -6.4 -73.7 ** (55.8) (28.3)
£assets growth (08q4-09q4) 11.0 25.2 (54.6) (27.9)
Const 121.4 * -48.7 (61.8) (39.5)
r2 0.139 0.223 N 51 51 Without control variables Average interest rate (bps)
Average interest rate on UK non-financial loans
Average interest rate on UK non-financial deposits
ILG -22.3 3.0 (20.8) (10.4)
Const 22.5 10.9 (15.2) (8.3)
r2 0.022 0.002 N 51 51 *** indicates significance at the 1% level; ** at the 5% level; * at the 10% level. Standard errors in the parentheses are the White robust standard errors. TA=total assets, TL=total liabilities.
Turning to the impact of the ILG on the average interest rates payable on bank
liabilities, the second column of Table V shows that the average interest rate payable on UK

18
non-financial deposits was broadly unaffected by the ILG. Given the significant shift in bank funding towards UK non-financial deposits in ILG banks, it is somewhat surprising that they managed to attract such a significant increase in non-financial deposit funding without a significantly increasing the average interest rate on deposits relative to banks with waivers.
Our admittedly limited results on the interest rate impact of the ILG suggest that it had little impact on bank interest rates. Therefore, the overall impact of liquidity regulation on bank profitability is likely to have been driven by the asset substitution towards HQLA and from the substitution of bank funding towards UK non-bank deposits. V.D Interaction Between Liquidity Regulation and Bank Capital
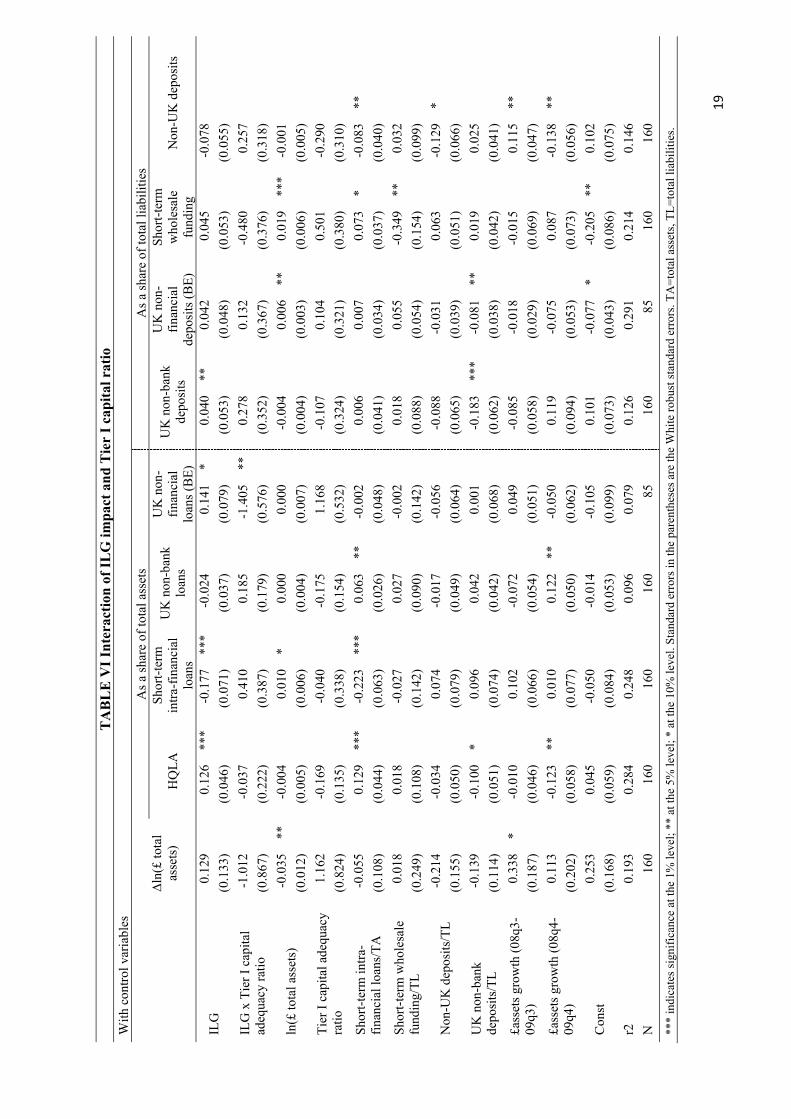
To examine the interaction between the tightening of liquidity regulation and bank capital, we extend our baseline regression specification by including an interaction term between the ILG treatment variable and the regulatory Tier 1 capital ratio of the entity’s consolidated banking group in 2009, the year prior to the ILG’s introduction. Overall, we find little evidence of any significant interaction between the impact of the ILG and bank capitalisation.
The first column Table VI shows that our baseline regression results on the ILG’s impact on balance sheet growth is broadly unaffected, with both the ILG dummy and interaction with Tier 1 capital being insignificant. Similarly there is almost no impact from including the interaction term on the ILG impact on the accumulation of HQLA and reduction in short-term intra-financial assets with point estimates on the ILG dummy variable remaining significant and broadly unchanged while Tier 1 capital interaction terms with the ILG are insignificant. We also do not find any impact on our estimates of the ILG’s impact on UK non-bank loans. However, the inclusion of the interaction term does change our estimates of the ILG impact on UK non-financial loans that requires careful interpretation. The significant negative coefficient on the interaction between the ILG dummy and capital ratio could be interpreted as suggesting that the ILG had a greater impact on non-financial lending in better capitalised banks. However, the significant and similar sized coefficient on the uninteracted Tier 1 capital ratio term indicates that it is rather better capitalised non-ILG banks which increased lending to the UK non-financial sector. While the reaction of ILG banks, which is given by the sum of the Tier 1 capital ratio and (Tier 1 capital ratio x ILG) coefficients suggests that the impact of the ILG was largely independent of bank Tier 1 capital in ILG banks. Furthermore, the very large positive and significant coefficient on the ILG term indicates that there is no evidence that the ILG depressed bank lending to non-financials, consistent our baseline regression results.
We find little impact from the inclusion of the Tier 1 capital ratio interaction term on the liability categories. The coefficients on the interaction term are insignificant in all the regressions and the coefficient of the ILG impact on UK non-bank deposits remains positive and significant, although slightly smaller than our baseline regression. However, the ILG dummy variable on UK non-financial deposits does not remain significant but the size remains consistent with our baseline results.
19
TABL
E V
I Int
erac
tion
of IL
G im
pact
and
Tie
r I c
apita
l rat
io
With
con
trol v
aria
bles
l
n(£
tota
l as
sets)
As a
shar
e of
tota
l ass
ets
As a
shar
e of
tota
l lia
bilit
ies
H
QLA
Sh
ort-t
erm
in
tra-fi
nanc
ial
loan
s
UK
non
-ban
k lo
ans
UK
non
-fin
anci
al
loan
s (BE
)
UK
non
-ban
k de
posit
s
UK
non
-fin
anci
al
depo
sits (
BE)
Shor
t-ter
m
who
lesa
le
fund
ing
Non
-UK
dep
osits
ILG
0.
129
0.
126
***
-0.1
77
***
-0.0
24
0.
141
* 0.
040
**
0.04
2
0.04
5
-0.0
78
(0
.133
)
(0.0
46)
(0
.071
)
(0.0
37)
(0
.079
)
(0.0
53)
(0
.048
)
(0.0
53)
(0
.055
)
ILG
x T
ier I
cap
ital
adeq
uacy
ratio
-1
.012
-0.0
37
0.
410
0.
185
-1
.405
**
0.
278
0.
132
-0
.480
0.25
7
(0.8
67)
(0
.222
)
(0.3
87)
(0
.179
)
(0.5
76)
(0
.352
)
(0.3
67)
(0
.376
)
(0.3
18)
ln(£
tota
l ass
ets)
-0
.035
**
-0
.004
0.01
0 *
0.00
0
0.00
0
-0.0
04
0.
006
**
0.01
9 **
* -0
.001
(0.0
12)
(0
.005
)
(0.0
06)
(0
.004
)
(0.0
07)
(0
.004
)
(0.0
03)
(0
.006
)
(0.0
05)
Ti
er I
capi
tal a
dequ
acy
ratio
1.
162
-0
.169
-0.0
40
-0
.175
1.16
8
-0.1
07
0.
104
0.
501
-0
.290
(0.8
24)
(0
.135
)
(0.3
38)
(0
.154
)
(0.5
32)
(0
.324
)
(0.3
21)
(0
.380
)
(0.3
10)
Sh
ort-t
erm
intra
-fin
anci
al lo
ans/T
A
-0.0
55
0.
129
***
-0.2
23
***
0.06
3 **
-0
.002
0.00
6
0.00
7
0.07
3 *
-0.0
83
**
(0.1
08)
(0
.044
)
(0.0
63)
(0
.026
)
(0.0
48)
(0
.041
)
(0.0
34)
(0
.037
)
(0.0
40)
Sh
ort-t
erm
who
lesa
le
fund
ing/
TL
0.01
8
0.01
8
-0.0
27
0.
027
-0
.002
0.01
8
0.05
5
-0.3
49
**
0.03
2
(0.2
49)
(0
.108
)
(0.1
42)
(0
.090
)
(0.1
42)
(0
.088
)
(0.0
54)
(0
.154
)
(0.0
99)
Non
-UK
dep
osits
/TL
-0.2
14
-0
.034
0.07
4
-0.0
17
-0
.056
-0.0
88
-0
.031
0.06
3
-0.1
29
* (0
.155
)
(0.0
50)
(0
.079
)
(0.0
49)
(0
.064
)
(0.0
65)
(0
.039
)
(0.0
51)
(0
.066
)
UK
non
-ban
k de
posit
s/TL
-0.1
39
-0
.100
*
0.09
6
0.04
2
0.00
1
-0.1
83
***
-0.0
81
**
0.01
9
0.02
5
(0.1
14)
(0
.051
)
(0.0
74)
(0
.042
)
(0.0
68)
(0
.062
)
(0.0
38)
(0
.042
)
(0.0
41)
£a
sset
s gro
wth
(08q
3-09
q3)
0.33
8 *
-0.0
10
0.
102
-0
.072
0.04
9
-0.0
85
-0
.018
-0.0
15
0.
115
**
(0.1
87)
(0
.046
)
(0.0
66)
(0
.054
)
(0.0
51)
(0
.058
)
(0.0
29)
(0
.069
)
(0.0
47)
£a
sset
s gro
wth
(08q
4-09
q4)
0.11
3
-0.1
23
**
0.01
0
0.12
2 **
-0
.050
0.11
9
-0.0
75
0.
087
-0
.138
**
(0
.202
)
(0.0
58)
(0
.077
)
(0.0
50)
(0
.062
)
(0.0
94)
(0
.053
)
(0.0
73)
(0
.056
)
Cons
t 0.
253
0.
045
-0
.050
-0.0
14
-0
.105
0.10
1
-0.0
77
* -0
.205
**
0.
102
(0
.168
)
(0.0
59)
(0
.084
)
(0.0
53)
(0
.099
)
(0.0
73)
(0
.043
)
(0.0
86)
(0
.075
)
r2
0.19
3
0.28
4
0.24
8
0.09
6
0.07
9
0.12
6
0.29
1
0.21
4
0.14
6
N
160
16
0
160
16
0
85
16
0
85
16
0
160
**
* in
dica
tes s
igni
fican
ce a
t the
1%
leve
l; **
at t
he 5
% le
vel;
* at
the
10%
leve
l. St
anda
rd e
rrors
in th
e pa
rent
hese
s are
the
Whi
te ro
bust
stand
ard
erro
rs. T
A=t
otal
ass
ets,
TL=t
otal
liab
ilitie
s.
20
VI. Robustness Results
In this section we examine the robustness of our baseline results. During our estimation window when the ILG was introduced there were significant stresses in the banking sector. We conduct rolling regressions over the ILG treatment window to check the robustness of the baseline results to our choice of treatment window. Also, given the non-random selection into the treatment group by bank entity type – which largely reflects the UK focus of banks, we re-estimate our baseline regressions excluding UK banks from our dataset, comparing the impact of the ILG on treated foreign subsidiaries relative to foreign branches with ILG waivers. VI.A Rolling Regressions
In Figures III to VI we present estimates of the average treatment effect from rolling regressions which move the “post”-ILG date h by one quarter at a time between 2010/Q2 to 2012/Q2. To consistently find significance over treatment windows of different lengths is a particularly demanding test, given the finding by Betrand, Duflo and Mullainathan (2004) that time aggregation into just a “pre”- and “post”-period has low power.
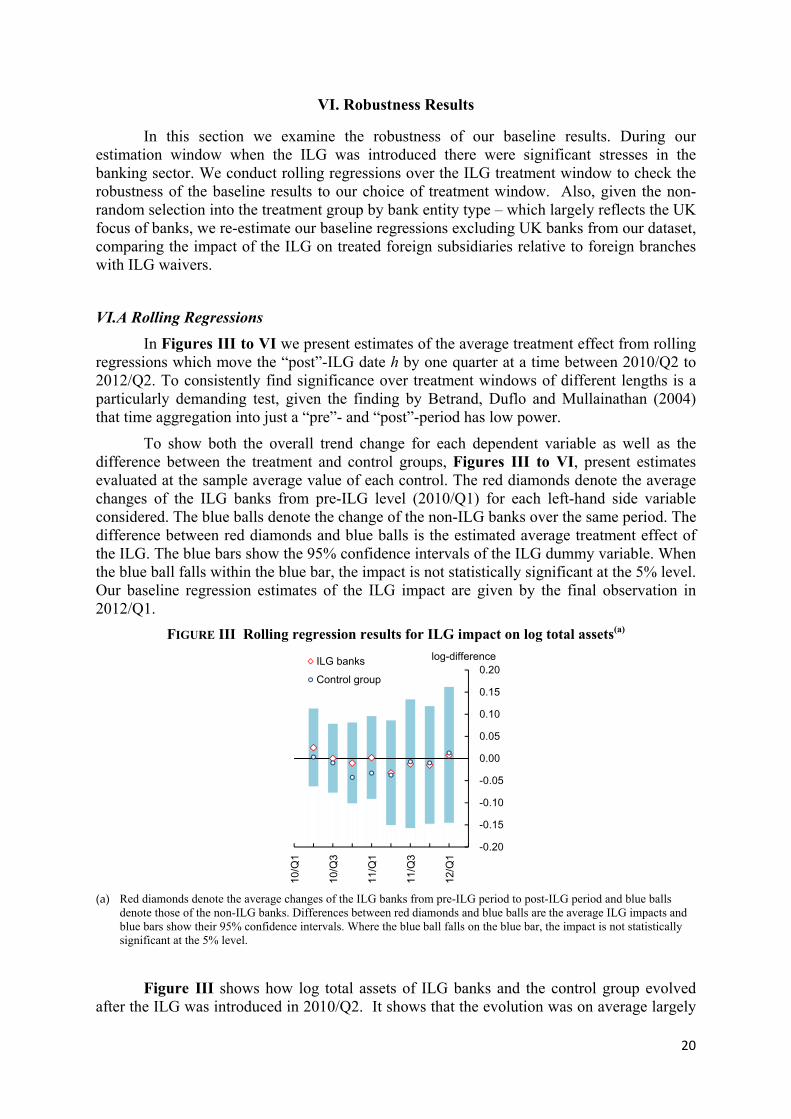
To show both the overall trend change for each dependent variable as well as the difference between the treatment and control groups, Figures III to VI, present estimates evaluated at the sample average value of each control. The red diamonds denote the average changes of the ILG banks from pre-ILG level (2010/Q1) for each left-hand side variable considered. The blue balls denote the change of the non-ILG banks over the same period. The difference between red diamonds and blue balls is the estimated average treatment effect of the ILG. The blue bars show the 95% confidence intervals of the ILG dummy variable. When the blue ball falls within the blue bar, the impact is not statistically significant at the 5% level. Our baseline regression estimates of the ILG impact are given by the final observation in 2012/Q1.
FIGURE III Rolling regression results for ILG impact on log total assets(a)
(a) Red diamonds denote the average changes of the ILG banks from pre-ILG period to post-ILG period and blue balls denote those of the non-ILG banks. Differences between red diamonds and blue balls are the average ILG impacts and blue bars show their 95% confidence intervals. Where the blue ball falls on the blue bar, the impact is not statistically significant at the 5% level.
Figure III shows how log total assets of ILG banks and the control group evolved after the ILG was introduced in 2010/Q2. It shows that the evolution was on average largely
-0.20
-0.15
-0.10
-0.05
0.00
0.05
0.10
0.15
0.20
10/Q
1
10/Q
3
11/Q
1
11/Q
3
12/Q
1
ILG banksControl group
log-difference
21
flat for both groups and the differences between the two groups, which measure the impact of the ILG, never became statistically significant during the estimation period.
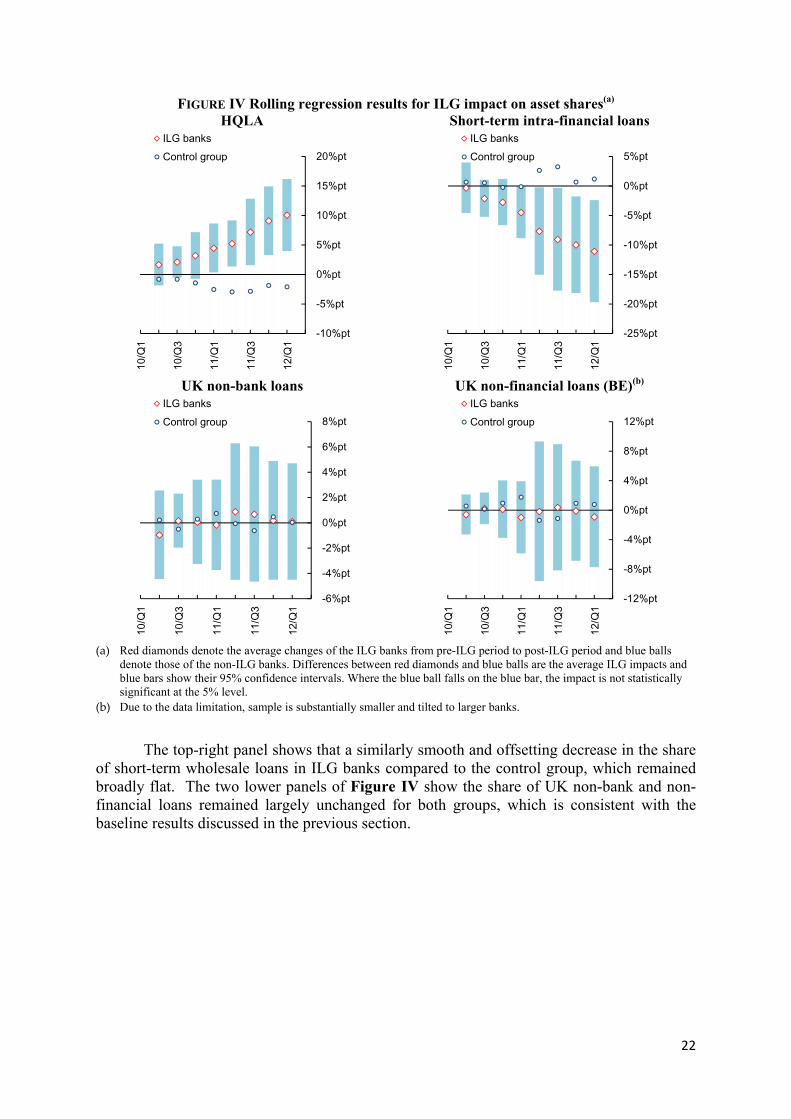
Figure IV summarises the evolution in bank asset composition. The top left panel highlights the smooth increase in HQLA as a share of total assets relative to the control group over the treatment period. Due to the data limitations in our treatment identification we have assumed that all ILG banks were subject to the ILG from 2010/Q2.6 In fact, the majority of ILG banks only became officially subject to the ILG in October 2010 (e.g. banks under the previous Liquidity Mismatch Regime and smaller building societies) and some of those banks were formally set their ILG ratios after 2010/Q4. The observed gradual increase in HQLA is consistent with the gradual introduction of ILG requirements.
The top-left panel of Figure IV also allows us to examine the contribution of QE to the accumulation of HQLA in banks. At various points between 2009 and 2012, the Bank of England conducted purchases of UK gilts from the private sector through the quantitative easing programme, mostly from non-banks financed by the creation of central bank reserves.7 At some point these newly created central bank reserves must be deposited at a bank with reserve accounts at the Bank of England. One may be concerned that the impact of the ILG on HQLA might be overestimated due to the effect of quantitative easing (QE) asset purchases mechanically increasing central bank reserves in the banking system. This would be the case if the following three conditions are satisfied. First, QE tends to concentrate liquid assets in the banking sector. Second, banks which have reserve accounts at the Bank of England are mostly ILG banks. Third, the timing of the ILG introduction and QE asset purchases are closely correlated. Data show the latter condition is not satisfied. The majority of the estimated impact on HQLAs was observed sufficiently far after the first round of asset purchases that started in March 2009 and ended January 2010, yet prior to the second round of asset purchases in 2011/Q4. For this reason, we do not think the estimates are seriously contaminated by asset purchases under the QE programme.
6 Our ILG/Non-ILG identifiers are based on banks’ ILG status at the beginning of October 2012. 7 See Mclaren, Banerjee and Latto (2014) for more details.
22
FIGURE IV Rolling regression results for ILG impact on asset shares(a) HQLA Short-term intra-financial loans
UK non-bank loans UK non-financial loans (BE)(b)
(a) Red diamonds denote the average changes of the ILG banks from pre-ILG period to post-ILG period and blue balls denote those of the non-ILG banks. Differences between red diamonds and blue balls are the average ILG impacts and blue bars show their 95% confidence intervals. Where the blue ball falls on the blue bar, the impact is not statistically significant at the 5% level.
(b) Due to the data limitation, sample is substantially smaller and tilted to larger banks. The top-right panel shows that a similarly smooth and offsetting decrease in the share
of short-term wholesale loans in ILG banks compared to the control group, which remained broadly flat. The two lower panels of Figure IV show the share of UK non-bank and non-financial loans remained largely unchanged for both groups, which is consistent with the baseline results discussed in the previous section.
-10%pt
-5%pt
0%pt
5%pt
10%pt
15%pt
20%pt10
/Q1
10/Q
3
11/Q
1
11/Q
3
12/Q
1
ILG banksControl group
-25%pt
-20%pt
-15%pt
-10%pt
-5%pt
0%pt
5%pt
10/Q
1
10/Q
3
11/Q
1
11/Q
3
12/Q
1
ILG banksControl group
-6%pt
-4%pt
-2%pt
0%pt
2%pt
4%pt
6%pt
8%pt
10/Q
1
10/Q
3
11/Q
1
11/Q
3
12/Q
1
ILG banksControl group
-12%pt
-8%pt
-4%pt
0%pt
4%pt
8%pt
12%pt
10/Q
1
10/Q
3
11/Q
1
11/Q
3
12/Q
1
ILG banksControl group

23
FIGURE V Rolling regression results for ILG impact on liability shares(a) UK non-bank deposits UK non-financial deposits (BE)(b)
Short-term wholesale funding Non-UK deposits
(a) Red diamonds denote the average changes of the ILG banks from pre-ILG period to post-ILG period and blue balls denote those of the non-ILG banks. Differences between red diamonds and blue balls are the average ILG impacts and blue bars show their 95% confidence intervals. Where the blue ball falls on the blue bar, the impact is not statistically significant at the 5% level.
(b) Due to the data limitation, sample is substantially smaller and tilted to larger banks.
On the liability side, Figure V confirms that the ILG caused banks to increase their reliance on UK non-bank deposits, including non-financial deposits for ILG banks, with the impact being greater towards the end of the treatment period. For short-term wholesale funding, the dynamics suggest that ILG banks initially decreased their share of short-term wholesale funding, with a significant treatment effect between 2010/Q4 and 2011/Q2, but that once they had accumulated sufficient HQLA they increased their use of wholesale funding, resulting in an insignificant change by the end of our treatment window. The rolling regressions also indicate that ILG banks decreased funding from non-UK deposits which are considered less stable under the ILG.
-6%pt
-3%pt
0%pt
3%pt
6%pt
9%pt
12%pt10
/Q1
10/Q
3
11/Q
1
11/Q
3
12/Q
1
ILG banksControl group
-6%pt
-4%pt
-2%pt
0%pt
2%pt
4%pt
6%pt
8%pt
10/Q
1
10/Q
3
11/Q
1
11/Q
3
12/Q
1
ILG banksControl group
-8%pt
-6%pt
-4%pt
-2%pt
0%pt
2%pt
4%pt
6%pt
10/Q
1
10/Q
3
11/Q
1
11/Q
3
12/Q
1
ILG banksControl group
-10%pt
-8%pt
-6%pt
-4%pt
-2%pt
0%pt
2%pt
4%pt
6%pt
10/Q
1
10/Q
3
11/Q
1
11/Q
3
12/Q
1
ILG banksControl group
24
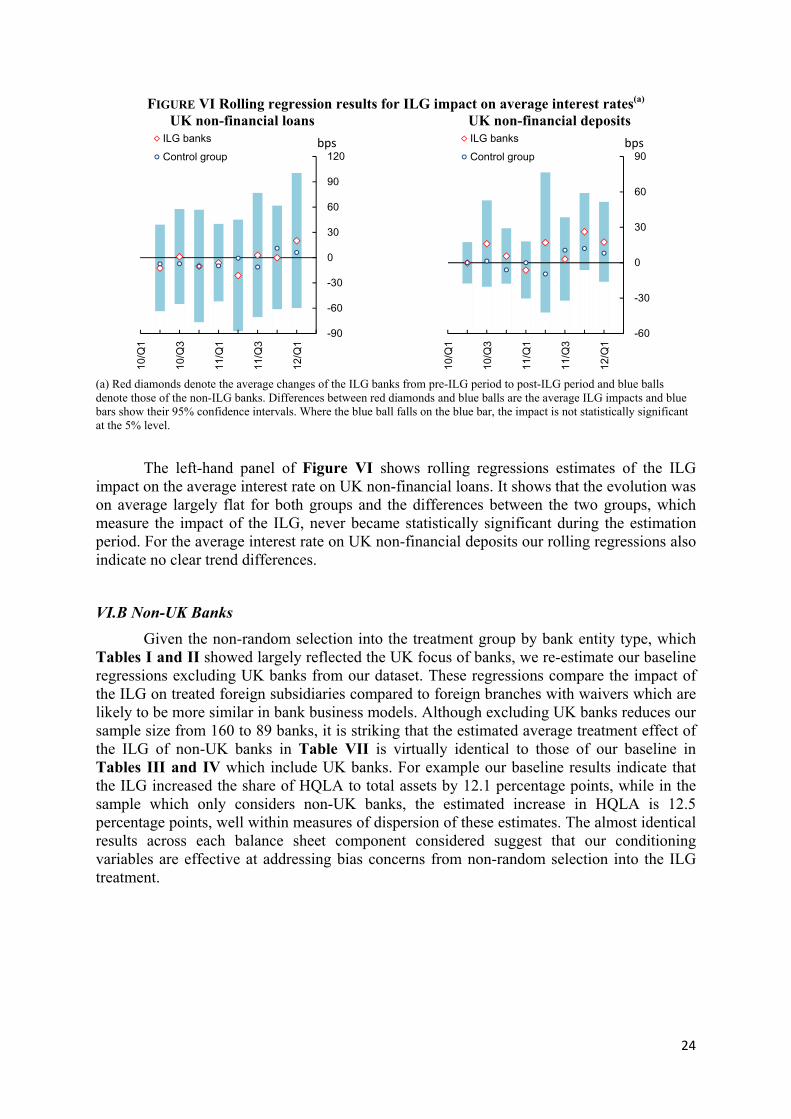
FIGURE VI Rolling regression results for ILG impact on average interest rates(a) UK non-financial loans UK non-financial deposits
(a) Red diamonds denote the average changes of the ILG banks from pre-ILG period to post-ILG period and blue balls denote those of the non-ILG banks. Differences between red diamonds and blue balls are the average ILG impacts and blue bars show their 95% confidence intervals. Where the blue ball falls on the blue bar, the impact is not statistically significant at the 5% level.
The left-hand panel of Figure VI shows rolling regressions estimates of the ILG impact on the average interest rate on UK non-financial loans. It shows that the evolution was on average largely flat for both groups and the differences between the two groups, which measure the impact of the ILG, never became statistically significant during the estimation period. For the average interest rate on UK non-financial deposits our rolling regressions also indicate no clear trend differences. VI.B Non-UK Banks
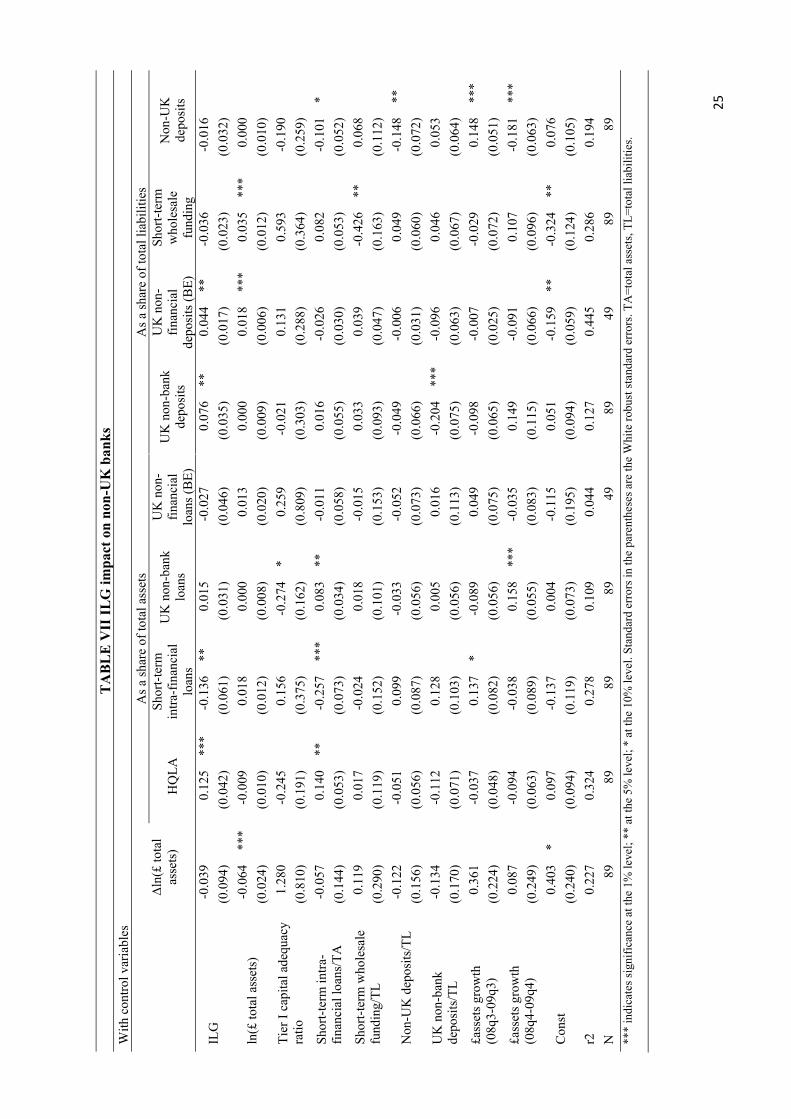
Given the non-random selection into the treatment group by bank entity type, which Tables I and II showed largely reflected the UK focus of banks, we re-estimate our baseline regressions excluding UK banks from our dataset. These regressions compare the impact of the ILG on treated foreign subsidiaries compared to foreign branches with waivers which are likely to be more similar in bank business models. Although excluding UK banks reduces our sample size from 160 to 89 banks, it is striking that the estimated average treatment effect of the ILG of non-UK banks in Table VII is virtually identical to those of our baseline in Tables III and IV which include UK banks. For example our baseline results indicate that the ILG increased the share of HQLA to total assets by 12.1 percentage points, while in the sample which only considers non-UK banks, the estimated increase in HQLA is 12.5 percentage points, well within measures of dispersion of these estimates. The almost identical results across each balance sheet component considered suggest that our conditioning variables are effective at addressing bias concerns from non-random selection into the ILG treatment.
-90
-60
-30
0
30
60
90
12010
/Q1
10/Q
3
11/Q
1
11/Q
3
12/Q
1
ILG banksControl group
bps
-60
-30
0
30
60
90
10/Q
1
10/Q
3
11/Q
1
11/Q
3
12/Q
1
ILG banksControl group
bps
25
TABL
E V
II IL
G im
pact
on
non-
UK
ban
ks
With
con
trol v
aria
bles
l
n(£
tota
l as
sets)
As a
shar
e of
tota
l ass
ets
As a
shar
e of
tota
l lia
bilit
ies
H
QLA
Sh
ort-t
erm
in
tra-fi
nanc
ial
loan
s
UK
non
-ban
k lo
ans
UK
non
-fin
anci
al
loan
s (BE
)
UK
non
-ban
k de
posit
s
UK
non
-fin
anci
al
depo
sits (
BE)
Shor
t-ter
m
who
lesa
le
fund
ing
Non
-UK
de
posit
s
ILG
-0
.039
0.12
5 **
* -0
.136
**
0.
015
-0
.027
0.07
6 **
0.
044
**
-0.0
36
-0
.016
(0.0
94)
(0
.042
)
(0.0
61)
(0
.031
)
(0.0
46)
(0
.035
)
(0.0
17)
(0
.023
)
(0.0
32)
ln(£
tota
l ass
ets)
-0
.064
**
* -0
.009
0.01
8
0.00
0
0.01
3
0.00
0
0.01
8 **
* 0.
035
***
0.00
0
(0.0
24)
(0
.010
)
(0.0
12)
(0
.008
)
(0.0
20)
(0
.009
)
(0.0
06)
(0
.012
)
(0.0
10)
Ti
er I
capi
tal a
dequ
acy
ratio
1.
280
-0
.245
0.15
6
-0.2
74
* 0.
259
-0
.021
0.13
1
0.59
3
-0.1
90
(0
.810
)
(0.1
91)
(0
.375
)
(0.1
62)
(0
.809
)
(0.3
03)
(0
.288
)
(0.3
64)
(0
.259
)
Shor
t-ter
m in
tra-
finan
cial
loan
s/TA
-0
.057
0.14
0 **
-0
.257
**
* 0.
083
**
-0.0
11
0.
016
-0
.026
0.08
2
-0.1
01
* (0
.144
)
(0.0
53)
(0
.073
)
(0.0
34)
(0
.058
)
(0.0
55)
(0
.030
)
(0.0
53)
(0
.052
)
Shor
t-ter
m w
hole
sale
fu
ndin
g/TL
0.
119
0.
017
-0
.024
0.01
8
-0.0
15
0.
033
0.
039
-0
.426
**
0.
068
(0
.290
)
(0.1
19)
(0
.152
)
(0.1
01)
(0
.153
)
(0.0
93)
(0
.047
)
(0.1
63)
(0
.112
)
Non
-UK
dep
osits
/TL
-0.1
22
-0
.051
0.09
9
-0.0
33
-0
.052
-0.0
49
-0
.006
0.04
9
-0.1
48
**
(0.1
56)
(0
.056
)
(0.0
87)
(0
.056
)
(0.0
73)
(0
.066
)
(0.0
31)
(0
.060
)
(0.0
72)
U
K n
on-b
ank
depo
sits/T
L -0
.134
-0.1
12
0.
128
0.
005
0.
016
-0
.204
**
* -0
.096
0.04
6
0.05
3
(0.1
70)
(0
.071
)
(0.1
03)
(0
.056
)
(0.1
13)
(0
.075
)
(0.0
63)
(0
.067
)
(0.0
64)
£a
sset
s gro
wth
(0
8q3-
09q3
) 0.
361
-0
.037
0.13
7 *
-0.0
89
0.
049
-0
.098
-0.0
07
-0
.029
0.14
8 **
* (0
.224
)
(0.0
48)
(0
.082
)
(0.0
56)
(0
.075
)
(0.0
65)
(0
.025
)
(0.0
72)
(0
.051
)
£ass
ets g
row
th
(08q
4-09
q4)
0.08
7
-0.0
94
-0
.038
0.15
8 **
* -0
.035
0.14
9
-0.0
91
0.
107
-0
.181
**
* (0
.249
)
(0.0
63)
(0
.089
)
(0.0
55)
(0
.083
)
(0.1
15)
(0
.066
)
(0.0
96)
(0
.063
)
Cons
t 0.
403
* 0.
097
-0
.137
0.00
4
-0.1
15
0.
051
-0
.159
**
-0
.324
**
0.
076
(0
.240
)
(0.0
94)
(0
.119
)
(0.0
73)
(0
.195
)
(0.0
94)
(0
.059
)
(0.1
24)
(0
.105
)
r2
0.22
7
0.32
4
0.27
8
0.10
9
0.04
4
0.12
7
0.44
5
0.28
6
0.19
4
N
89
89
89
89
49
89
49
89
89
**
* in
dica
tes s
igni
fican
ce a
t the
1%
leve
l; **
at t
he 5
% le
vel;
* at
the
10%
leve
l. St
anda
rd e
rrors
in th
e pa
rent
hese
s are
the
Whi
te ro
bust
stand
ard
erro
rs. T
A=t
otal
ass
ets,
TL=t
otal
liab
ilitie
s.
26
VII. Conclusion
This study empirically investigates how banks responded to tighter liquidity regulation in the United Kingdom. We use the heterogeneous implementation of the Individual Liquidity Guidance (ILG) regulation in the United Kingdom in 2010 to estimate the average treatment effect of tighter liquidity regulation on banks across a number of dimensions. Overall, we find that banks subject to the ILG did not adjust the size of their balance sheets to meet tighter liquidity regulation but rather altered the composition of both their assets and liabilities. On the asset side, banks significantly increased the share of HQLA to total assets by around 12 percentage points following the introduction of the ILG. We find that adjustment in the share of HQLA to total assets was entirely offset by an equal and opposite reduction in the share of short-term financial loans, with the share of other assets remaining unaffected. On the liability side, ILG banks increased funding from more stable non-bank and non-financial corporation deposits and decreased their reliance on less stable short-term wholesale and non-UK funding.
In terms of the price impact, we do not find strong evidence that tightening liquidity regulation increased the interest rate on loans to the non-financial sector or the interest rate paid on UK non-financial deposits.
Overall, our results suggest that when the new more stringent liquidity regulation was introduced in the United Kingdom, it was a constraint on the composition of banks’ intra-financial sector assets and liabilities. However, we do not find evidence that the introduction of the ILG had a negative impact on bank lending to the non-financial sector, either in terms of both the quantity or price of lending. Our finding that liquidity regulation has a significant impact on the interbank market raises a number of future research questions. Because the ILG significantly reduced intra-financial claims without having a measurable impact on the price or quantity of lending to the real economy, our results suggest that liquidity regulation could be a useful macro-prudential tool. It could weaken the transmission of shocks through a highly interconnected financial sector, an important factor that led to a loss of confidence in interbank markets during the 2007-08 financial crisis (Caballero and Simsek, 2009; Adrian and Shin, 2010).
By reducing the size of the interbank market, our results also suggest that liquidity regulation could have implications for the monetary policy transmission mechanism. Because liquidity regulation encourages banks to become more reliant on longer-term deposits and less reliant on short-term money market funding (where monetary authorities have historically intervened to set policy rates), it might alter the transmission between policy rates and broader monetary conditions.
An open question is the influence of operational procedures related to the QE programme on our estimates of the impact of tighter liquidity regulation. Given the significant quantity of remunerated excess reserves in the banking system which could be used as HQLA to meet the ILG requirement, it is possible that in the absence of these facilities banks would have chosen to meet the ILG along different dimensions, relying less on the accumulation of HQLA.

27
DATA APPENDIX
Following are the data source and definition of our analysis.
1. Balance sheet data (except for the ratio of tier1 capital to risk-weighted assets): collected from individual bank returns used to compile the Bank’s monetary statistics. (Form BT, BE). Definitions are found at http://www.bankofengland.co.uk/statistics/Pages/reporters/defs/default.aspx
2. The ratio of tier1 capital to risk-weighted assets of the entity’s consolidated banking group: collected from Bankscope and regulatory returns from the FSA (FSA003).
3. Interest rate data: constructed from interest rate receivable and payable divided by the stock of UK non-financial loans (private non-financial corporations (PNFC), individuals and others) and UK non-financial deposits (PNFCs, individuals and others) at the beginning of the period. Both the numerators and the denominators are collected from individual bank returns used to compile the Bank’s monetary statistics. (Form PL, BE). Definitions are found at http://www.bankofengland.co.uk/statistics/Pages/reporters/defs/default.aspx
4. Banks’ waiver status on the ILG regulation is collected from a regulatory database. Lists of rule modifications granted for individual banks are publicly available and found at Prudential Sourcebook for Banks, Building Societies and Investment Firms (Waivers): www.fca.org.uk/static/fca/documents/waivers/bipru-waivers.pdf
The boxcodes used for the calculation of the balance sheet variables (except for the ratio of tier1 capital to risk-weighted assets) are as follows: Total sterling assets: BT£40 Total sterling liabilities: BT£20 HQLA: Cash + T-bills & Gilts (BT£21+BT£26A+ BT£32D) Short-term intra-financial loans: Market loans + Reverse repos ex. public sectors (BT£23 +BT£30B +BT£30C +BT£30D +BT£30H +BT£30J) UK non-bank loans: BT£29D UK non-financial loans: BE£29DA2 +BE£29DB2 +BE£29DA3A +BE£29DA3B +BE£29DB3A1 +BE£29DB3A2 +BE£29DB3A3 +BE£29DB3A4 +BE£29DB3B Short-term wholesale funding: Deposits from the UK Monetary Financial Institutions + Certificate of deposits and commercial paper issued + Repos ex. public sectors (BT£2B +BT£2C +BT£2D +BT£3B +BT£3C +BT£3D +BT£4 +BT£5A +BT£6B +BT£6C +BT£6D +BT£6H +BT£6J) UK non-bank deposits: BT£2H+BT£3H UK non-financial deposits: BT£2H+BT£3H-BE£2H1-BE£3H1-BE£2H4-BE£3H4 Non-UK deposits: BT£2J+BT£3J Interest receivable from UK non-financial loans: PL£1BJ +PL£1BK Interest payable for UK non-financial deposits: PL£2BJ+PL£2BK

28
REFERENCES
Acharya, Viral V. and Ouarda Merrouche, "Precautionary Hoarding of Liquidity and Inter-Bank Markets: Evidence from the Sub-prime Crisis," Review of Finance, 17 (2013) 107-160. Adrian, Tobias and Hyun S. Shin, “The Changing Nature of Financial Intermediation and the Financial Crisis of 2007-09,” Annual Review of Economics, 2 (2010) 603-618. Bank of England, “The liquidity of banks” Bank of England Quarterly Bulletin, March 40-41. Bank of England, “Record of the Interim Financial Policy Committee – 14 September 2012” (http://www.bankofengland.co.uk/publications/Documents/records/fpc/pdf/2012/record1209.PDF) Bartolini, Leonardo, Giuseppe Bertola and Alessandro Prati, “Banks’ reserve management, transaction costs, and the timing of Federal Reserve intervention,” Journal of Banking and Finance, 25 (2001) 1287–1317. Berger, Allen. N. and Christa H. S. Bouwman “Bank liquidity creation,” Review of Financial Studies, 22 (2009) 3779-3837. Berger, Allen. N., Christa H. S. Bouwman, Thomas Kick and Klaus Schaeck (2014). “Bank risk taking and liquidity creation following regulatory interventions and capital support.” Discussion Paper Series 2, Deutsche Bundesbank, No. 05/2010 Bertrand, Marianne, Ester Duflo and Sendhil Mullainathan, “How Much Should We Trust Differences-In-Differences Estimates?” The Quarterly Journal of Economics 119 (2004) 249-275. Bonner, Clemens, "Liquidity Regulation, Funding Costs and Corporate Lending," DNB Working Papers 361, 2012. Bonner, Clemens. and Sylvester Eijffinger, "The Impact of the LCR on the Interbank Money Market," CEPR Discussion Paper 9142, 2012. Bonner, Clemens, Iman van Lelyveld and Robert Zymek. “Banks’ Liquidity Buffers and the Role of Liquidity Regulation,” DNB Working Papers 393, 2013. de Haan, Leo. and Jan Willem van den End, “Bank liquidity, the maturity ladder, and regulation.” Journal of Banking & Finance, 37 (2013a) 3930-3950. ——, “Banks’ responses to funding liquidity shocks: Lending adjustment, liquidity hoarding and fire sales.” Journal of International Financial Markets, Institutions and Money, vol. 26 (2013b), 152-174. DNB “Regulation on Liquidity under the Wft.” De Nederlandsche Bank, 2003. Duijm, Patty. and Peter Wierts, “The effects of liquidity regulation on bank assets and liabilities,” DSF/TI Discussion Paper no. 72, 2014 FSA, “Review of the liquidity requirements for banks and building societies,” Discussion Paper 07/7, 2007. ——, “Strengthening liquidity standards” Consultation Paper 08/22, 2008. ——, “Strengthening liquidity standards 2: Liquidity reporting” Consultation Paper 09/13, 2009a. ——, “Strengthening liquidity standards 3: Liquidity transitional measures” Consultation Paper 09/14, 2009b.

29
——, “Strengthening liquidity standards, including feedback on CP08/22, CP09/13, CP09/14” Policy Statement 09/16, 2009c. Freedman, Paul L., and Reid W. Click, “Banks that don’t lend? Unlocking credit to spur growth in developing countries,” Development Policy Review, 24 (2009) 279–302. Goodhart, Charles .A.E. “The Basel Committee on Banking Supervision” (Cambridge University Press, Cambridge, UK, 2011). Holmstrom, Bengt. and Jean Tirole, “Private and Public Supply of Liquidity” Journal of Political Economy, 106 (1998) 1-40. IIF “The Cumulative Impact on the Global Economy of Changes in the Financial Regulatory Framework.” Institute of International Finance, 2011. Jallath-Coria, Eduardo, Tridas Mukhopadhyay and Amir Yaron “How well do Mexian banks manage their reserves?” Journal of Money Credit and Banking, 34 (2005) 623-643. Jorda, Oscar. “Estimation and Inference of Impulse Responses by Local Projections,” American Economic Review, 95 (2005) 161-182, March. MAG “Interim Report - Assessing the macroeconomic impact of the transition to stronger capital and liquidity requirements.” Financial Stability Board and Basel Committee on Banking Supervision (Macroeconomic Assessment Group, 2010).