Embed Size (px)
Citation preview
BIS Working PapersNo 492
Assessing the CNH-CNY pricing differential: role of fundamentals, contagion and policy
by Michael Funke, Chang Shu, Xiaoqiang Cheng and Sercan Eraslan
Monetary and Economic Department
February 2015
JEL classification: F31, C22, C52
Keywords: renminbi exchange rates, China, onshore and offshore markets, GARCH models
BIS Working Papers are written by members of the Monetary and Economic Department of the Bank for International Settlements, and from time to time by other economists, and are published by the Bank. The papers are on subjects of topical interest and are technical in character. The views expressed in them are those of their authors and not necessarily the views of the BIS.
This publication is available on the BIS website (www.bis.org).
© Bank for International Settlements 2015. All rights reserved. Brief excerpts may be reproduced or translated provided the source is stated.
ISSN 1020-0959 (print) ISSN 1682-7678 (online)
WP491 Assessing the CNH-CNY pricing differential: role of fundamentals, contagion and policy i
Assessing the CNH-CNY pricing differential: role of fundamentals, contagion and policy1
Michael Funke, Chang Shu, Xiaoqiang Cheng and Sercan Eraslan2
Abstract
Renminbi internationalisation has brought about an active offshore market where the exchange rate frequently diverges from the onshore market. Using extended GARCH models, we explore the role of fundamentals, global factors and policies related to renminbi internationalisation in driving the pricing differential between the onshore and offshore exchange rates. Differences in the liquidity of the two markets play an important role in explaining the level of the differential, while rises in global risk aversion tend to increase the differential’s volatility. On the policy front, measures permitting cross-border renminbi outflows have a particularly discernible impact in reducing the volatility of the pricing gap between the two markets.
Keywords: renminbi exchange rates, China, onshore and offshore markets, GARCH models.
JEL classification: F31, C22, C52.
1 The views expressed in this paper are those of the authors, and do not represent the views of the
Bank for International Settlements or the Hong Kong Monetary Authority. Michael Funke would like to gratefully acknowledge the financial support of the Bank for International Settlements. We would like to thank Menzie Chinn, Torsten Ehlers, Risto Herrala, Jiandong Ju, Robert McCauley, Frank Packer, Philip Turner and James Yetman for helpful comments and discussions, although we take full responsibility for the conclusions reached. We also appreciate other useful comments received at the 2014 Columbia-Tsinghua Conference in International Economics, the Bank of Finland Conference on China’s Financial Market Liberalization, and the 2014 Annual Conference of the Money, Macro & Finance Group. We would like to thank Jimmy Shek for excellent research support.
2 Michael Funke: Hamburg University, [email protected]; Chang Shu: Bank for International Settlements, [email protected]; Xiaoqiang Cheng: Hong Kong Monetary Authority, [email protected]; Sercan Eraslan: Hamburg University, [email protected].
WP491 Assessing the CNH-CNY pricing differential: role of fundamentals, contagion and policy iii
Contents
Assessing the CNH-CNY pricing differential: role of fundamentals, contagion and policy ...................................................................................................................................................... i
Introduction ............................................................................................................................................... 1
Institutional background ...................................................................................................................... 3
Renminbi internationalisation and development of the CNH market ...................... 3
Growth of offshore renminbi use ............................................................................................. 4
Onshore and offshore FX markets ........................................................................................... 4
CNH and CNY rate differentials: a snapshot ....................................................................... 6
Measuring fundamentals, contagion and policy ........................................................................ 7
Macroeconomic fundamentals and market liquidity ....................................................... 7
Global market contagion............................................................................................................. 8
Measuring market segmentation using policy variables ................................................ 9
Trading constraints ............................................................................................................... 9
Current account measures: cross-border renminbi trade settlement .............. 9
Capital account: inward and outward renminbi flows .......................................... 10
Liquidity facilities ................................................................................................................. 10
Empirical framework ............................................................................................................................. 12
Empirical results ..................................................................................................................................... 14
Basic GARCH(1,1) model ........................................................................................................... 14
Extended GARCH(1,1) models ................................................................................................. 16
Macroeconomic fundamentals, market liquidity and global factors .............. 16
Policy variables ..................................................................................................................... 16
Concluding remarks and policy discussion ................................................................................. 20
References ................................................................................................................................................ 21
WP491 Assessing the CNH-CNY pricing differential: role of fundamentals, contagion and policy 1
Introduction
The renminbi’s presence and influence have been growing in recent years, as the Chinese economy expands and its external linkages increase. According to the BIS Triennial Central Bank Survey on the foreign exchange market, the renminbi now ranks as the world’s ninth most traded currency with a daily turnover of USD 119.6 billion. Its role in Asia is becoming increasingly prominent, as a significant part of its turnover is generated offshore within the region (Ehlers and Packer (2013)). Some studies have found that renminbi movements have an impact on regional currencies (Shu, Chow and Chan (2007), Fratzscher and Mehl (2011), Henning (2012), Subramanian and Kessler (2012), and Shu, He and Cheng (2015)).
One important aspect of the renminbi’s growth has been the development of offshore renminbi foreign exchange markets. Renminbi FX spot and derivatives transactions have increasingly taken place in offshore locations, with Hong Kong, London, Singapore and New York being the top centres. In this paper, we examine the prices of spot FX transactions in the offshore, or CNH, market.3 The daily turnover of spot transactions traded offshore was USD 13.9 billion at the time of the 2013 BIS survey, equivalent to about 70% of the 20.0 billion renminbi spot turnover in the onshore, or CNY, market. Unlike the CNY market, the CNH market is not subject to the central bank’s intervention or its stipulation of a daily trading band for the rate movement.
Persistent deviations exist between the CNH and CNY rates, attesting to the effectiveness of capital controls and the restrictions on arbitrage. Yet this pricing gap can be quite volatile. To take one example, while on 24 January 2014 the offshore rate of 6.0391 renminbi to the US dollar was 97 pips below the onshore rate of 6.0488, by 7 February the gap had widened to nearly 400 pips (6.0259 offshore vs 6.0634 onshore). But only a few weeks later, the differential had fallen back to 21 pips. This study seeks to identify the factors that have determined both the size and volatility of the CNY-CNH gap since the offshore market was established.
Two general sets of factors can potentially influence the gap: those related to capital market liberalisation policies; and those related to general market and economic conditions. As for the first, China has introduced a series of measures in recent years to foster the development of both onshore and offshore renminbi markets. To the extent that they increase the degree of integration between the two markets, we would expect these measures to be associated with declines in the size and volatility of the CNH-CNY differential. Second, the two markets tend to have different investor bases and liquidity conditions. Thus, the two markets might respond differently to changes in economic conditions and global financial markets, leading to changes in the size and volatility of the CNH-CNY deviation.
3 The CNH market initially referred to offshore renminbi FX trading in Hong Kong SAR where such
trading first took place. Over time, this term has become a more general reference to offshore renminbi trading, covering trading in both Hong Kong and other locations. Our paper does not examine the pricing of renminbi FX derivatives such as deliverable and non-deliverable forwards (NDF). See McCauley, Shu and Ma (2014) for a discussion of the location and deliverability of forward trading, as well as the pricing in various markets.
2 WP491 Assessing the CNH-CNY pricing differential: role of fundamentals, contagion and policy
Little research has been undertaken in this area.4 The study closest to ours is by Craig, Hua, Ng and Yuen (2013), who attribute the CNH-CNY differential to onshore investor risk sentiment and capital account liberalisation. However, our study considers a much wider set of potential factors of influence. In particular, we compile a series of policy variables that capture the change in the degree of market segmentation between onshore and offshore markets, including the relaxation of barriers to renminbi trade settlement and cross-border renminbi fund flows, the widening of the onshore trading bands, and conversion quotas. We use extended GARCH models to study the impact of these policy factors, together with macroeconomic fundamentals, liquidity conditions as well as contagion from the global market, on both the level and volatility of the CNH-CNY deviation.
Our study finds that market liquidity in the offshore market plays an important role in explaining the size of the CNH-CNY differential. In this light, policymakers, both within and outside China, who seek to extract information about the fundamental value of the renminbi from the two rates may wish to discount the offshore markets during periods of high market stress. At the same time, we find that, while rising risk aversion globally is associated with an increase in the pricing gap’s volatility, the size of the gap is not significantly affected.
We also document significant differences among the liberalisation policies in fostering exchange market integration. Liberalisation has had a greater impact when focused on increasing liquidity in the offshore markets, such as the measures permitting cross-border renminbi funds to flow from the onshore to the offshore market. Such measures have noticeably reduced the volatility of the offshore-onshore spread; by contrast, measures allowing renminbi funds to flow back to the onshore market, and the loosening of the trading band have had less effect. These findings suggest that, during the early stages of the offshore market’s development, the expansion of liquidity and the deepening of offshore markets may have played an important part in facilitating the integration of onshore and offshore markets.
The remainder of the paper is organised as follows. Section 2 lays out the institutional background that gives rise to the segmentation of the onshore and offshore markets. Section 3 discusses the fundamental, global and policy factors that affect the deviations between the two exchange rates. GARCH and extended GARCH models employed for assessing the determinants of the CNY-CNH differential are outlined in Section 4, and empirical results are reported in Section 5. Section 6 considers the policy implications from our work.
4 Studies investigating the pricing differential of China’s onshore and offshore equities include Peng,
Miao and Chow (2007). Existing studies on China’s onshore and offshore foreign exchange markets tend to focus on causality between the two, eg Cheung and Rime (2014), Wu and Pei (2012) and Maziad and Kang (2012). One study that looks at the factors causing the onshore and offshore market pricing differential compares the CNY forward rates with NDF rates (Li, Hui and Chung (2012)).
WP491 Assessing the CNH-CNY pricing differential: role of fundamentals, contagion and policy 3
Institutional background
Renminbi internationalisation and development of the CNH market
China has considerably increased the flexibility of its exchange rate over the past decade. The People’s Bank of China (PBoC) took an important step in 2005 when it announced the implementation of a managed floating exchange rate system in which the exchange rate is determined in reference to a basket of currencies, instead of the US dollar alone. The daily trading band against the US dollar was increased from 0.3% to 0.5% in 2007, and further to 1% in 2010. The band was widened again to 2% in March 2014.
Another significant development in China’s currency policy over the last few years has been the renminbi’s internationalisation, which has been largely connected with current and capital account liberalisation. Measures to promote the renminbi’s external use first applied to current account transactions. Cross-border renminbi settlement for trade was launched on a trial basis in July 2009. While initially restricted to selected firms in five regions in mainland China for trading with Hong Kong SAR, Macao SAR and ASEAN countries, the scheme was quickly broadened over the next three years. In June 2012, this trial scheme ended, and all mainland firms and all current account transactions became eligible for invoicing and settlement in renminbi.
Although China’s capital account has been ranked among the least open in the world according to the Chinn-Ito index, a widely used indicator for capital account openness (Chinn and Ito (2006)), policies to liberalise it have been introduced in recent years.5 Several measures permit offshore renminbi funds to flow back to the mainland. In August 2010, the PBoC announced a pilot scheme for eligible offshore financial institutions to use their renminbi funds to invest in the onshore interbank bond market. In October 2011, administrative rules were introduced for foreign firms seeking to undertake renminbi-denominated foreign direct investments in mainland China. A further channel for renminbi flows back to mainland China was opened up when the renminbi Qualified Foreign Institutional Investor scheme, widely referred to as the R-QFII, was rolled out in December 2011. Under this scheme, Hong Kong-based brokerage firms can, subject to an aggregate quota, offer non-Chinese residents renminbi investment products that are invested in onshore bond and stock markets. Mainland entities are also permitted to raise renminbi funds offshore and use the proceeds on the mainland. After the China Development Bank and the Ministry of Finance started to issue offshore renminbi bonds in 2007 and 2009, respectively, onshore non-financial corporations were authorised to follow suit in May 2012. For renminbi outflows, mainland firms were allowed to apply to take renminbi offshore for overseas direct investment from January 2011, and mainland banks were allowed to extend renminbi loans to domestic enterprises approved for overseas investment from March 2012.
5 This measure was first introduced by Chinn and Ito (2006). Updates of the measure can be found on
http://web.pdx.edu/~ito/Chinn-Ito_website.htm.
4 WP491 Assessing the CNH-CNY pricing differential: role of fundamentals, contagion and policy
Growth of offshore renminbi use
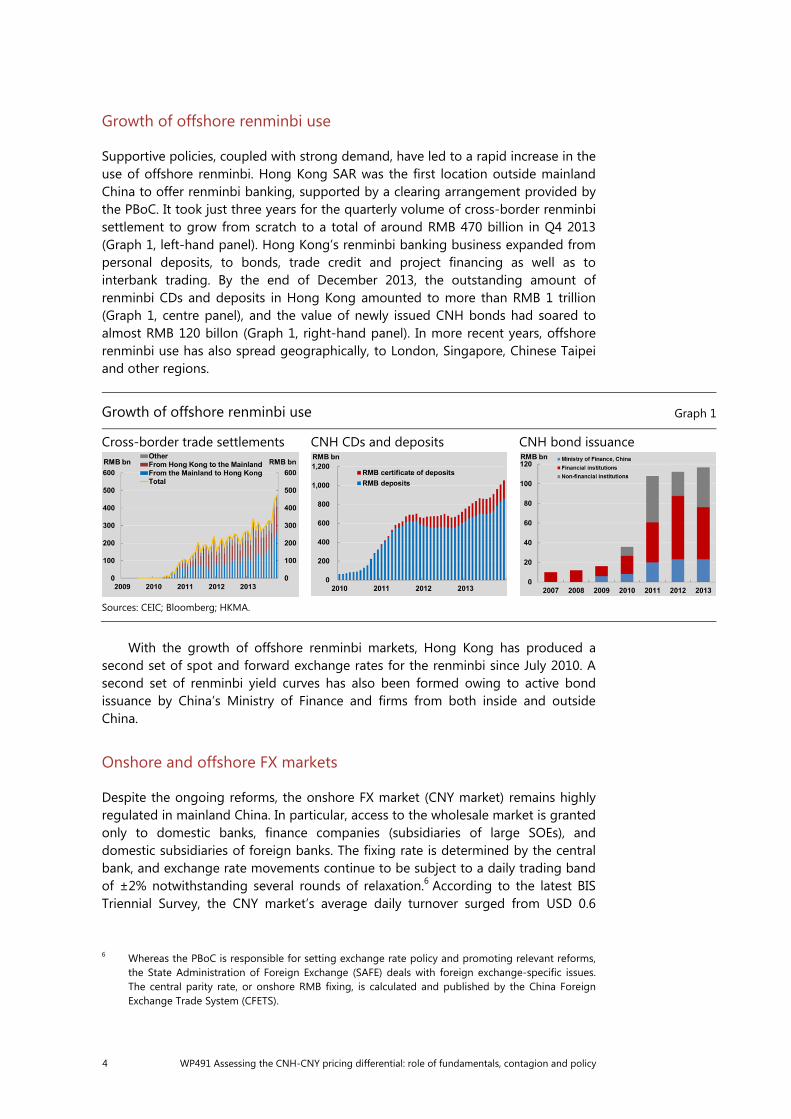
Supportive policies, coupled with strong demand, have led to a rapid increase in the use of offshore renminbi. Hong Kong SAR was the first location outside mainland China to offer renminbi banking, supported by a clearing arrangement provided by the PBoC. It took just three years for the quarterly volume of cross-border renminbi settlement to grow from scratch to a total of around RMB 470 billion in Q4 2013 (Graph 1, left-hand panel). Hong Kong’s renminbi banking business expanded from personal deposits, to bonds, trade credit and project financing as well as to interbank trading. By the end of December 2013, the outstanding amount of renminbi CDs and deposits in Hong Kong amounted to more than RMB 1 trillion (Graph 1, centre panel), and the value of newly issued CNH bonds had soared to almost RMB 120 billon (Graph 1, right-hand panel). In more recent years, offshore renminbi use has also spread geographically, to London, Singapore, Chinese Taipei and other regions.
With the growth of offshore renminbi markets, Hong Kong has produced a second set of spot and forward exchange rates for the renminbi since July 2010. A second set of renminbi yield curves has also been formed owing to active bond issuance by China’s Ministry of Finance and firms from both inside and outside China.
Onshore and offshore FX markets
Despite the ongoing reforms, the onshore FX market (CNY market) remains highly regulated in mainland China. In particular, access to the wholesale market is granted only to domestic banks, finance companies (subsidiaries of large SOEs), and domestic subsidiaries of foreign banks. The fixing rate is determined by the central bank, and exchange rate movements continue to be subject to a daily trading band of ±2% notwithstanding several rounds of relaxation.6 According to the latest BIS Triennial Survey, the CNY market’s average daily turnover surged from USD 0.6
6 Whereas the PBoC is responsible for setting exchange rate policy and promoting relevant reforms,
the State Administration of Foreign Exchange (SAFE) deals with foreign exchange-specific issues. The central parity rate, or onshore RMB fixing, is calculated and published by the China Foreign Exchange Trade System (CFETS).
Growth of offshore renminbi use Graph 1
Cross-border trade settlements CNH CDs and deposits CNH bond issuance
Sources: CEIC; Bloomberg; HKMA.
WP491 Assessing the CNH-CNY pricing differential: role of fundamentals, contagion and policy 5
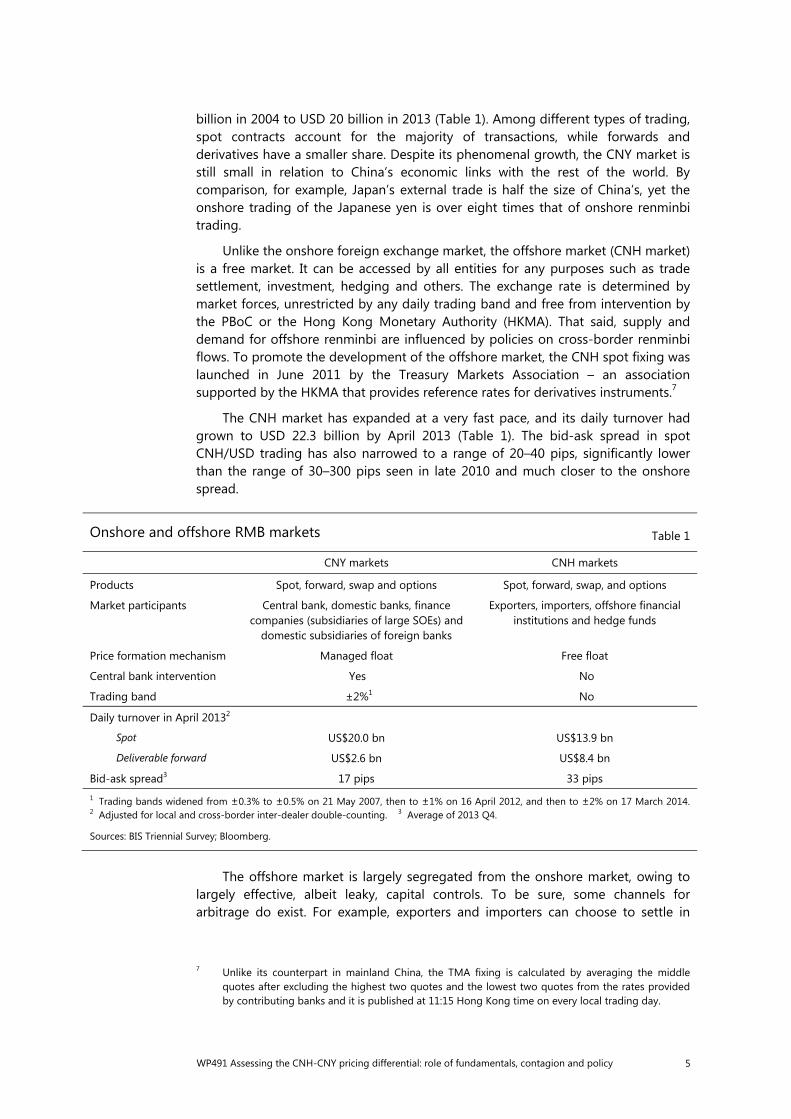
billion in 2004 to USD 20 billion in 2013 (Table 1). Among different types of trading, spot contracts account for the majority of transactions, while forwards and derivatives have a smaller share. Despite its phenomenal growth, the CNY market is still small in relation to China’s economic links with the rest of the world. By comparison, for example, Japan’s external trade is half the size of China’s, yet the onshore trading of the Japanese yen is over eight times that of onshore renminbi trading.
Unlike the onshore foreign exchange market, the offshore market (CNH market) is a free market. It can be accessed by all entities for any purposes such as trade settlement, investment, hedging and others. The exchange rate is determined by market forces, unrestricted by any daily trading band and free from intervention by the PBoC or the Hong Kong Monetary Authority (HKMA). That said, supply and demand for offshore renminbi are influenced by policies on cross-border renminbi flows. To promote the development of the offshore market, the CNH spot fixing was launched in June 2011 by the Treasury Markets Association – an association supported by the HKMA that provides reference rates for derivatives instruments.7
The CNH market has expanded at a very fast pace, and its daily turnover had grown to USD 22.3 billion by April 2013 (Table 1). The bid-ask spread in spot CNH/USD trading has also narrowed to a range of 20–40 pips, significantly lower than the range of 30–300 pips seen in late 2010 and much closer to the onshore spread.
The offshore market is largely segregated from the onshore market, owing to largely effective, albeit leaky, capital controls. To be sure, some channels for arbitrage do exist. For example, exporters and importers can choose to settle in
7 Unlike its counterpart in mainland China, the TMA fixing is calculated by averaging the middle
quotes after excluding the highest two quotes and the lowest two quotes from the rates provided by contributing banks and it is published at 11:15 Hong Kong time on every local trading day.
Onshore and offshore RMB markets Table 1
CNY markets CNH markets
Products Spot, forward, swap and options Spot, forward, swap, and options
Market participants Central bank, domestic banks, finance companies (subsidiaries of large SOEs) and
domestic subsidiaries of foreign banks
Exporters, importers, offshore financial institutions and hedge funds
Price formation mechanism Managed float Free float
Central bank intervention Yes No
Trading band ±2%1 No
Daily turnover in April 20132
Spot US$20.0 bn US$13.9 bn
Deliverable forward US$2.6 bn US$8.4 bn
Bid-ask spread3 17 pips 33 pips 1 Trading bands widened from ±0.3% to ±0.5% on 21 May 2007, then to ±1% on 16 April 2012, and then to ±2% on 17 March 2014. 2 Adjusted for local and cross-border inter-dealer double-counting. 3 Average of 2013 Q4.
Sources: BIS Triennial Survey; Bloomberg.
6 WP491 Assessing the CNH-CNY pricing differential: role of fundamentals, contagion and policy
renminbi at the most advantageous rate, either onshore or onshore. The widening channels for capital account transactions using the renminbi provide additional arbitrage opportunities. Nonetheless, arbitrage between the two markets remains incomplete: the onshore and offshore markets remain largely distinct liquidity pools, and the two exchange rates frequently diverge significantly.
CNH and CNY rate differentials: a snapshot
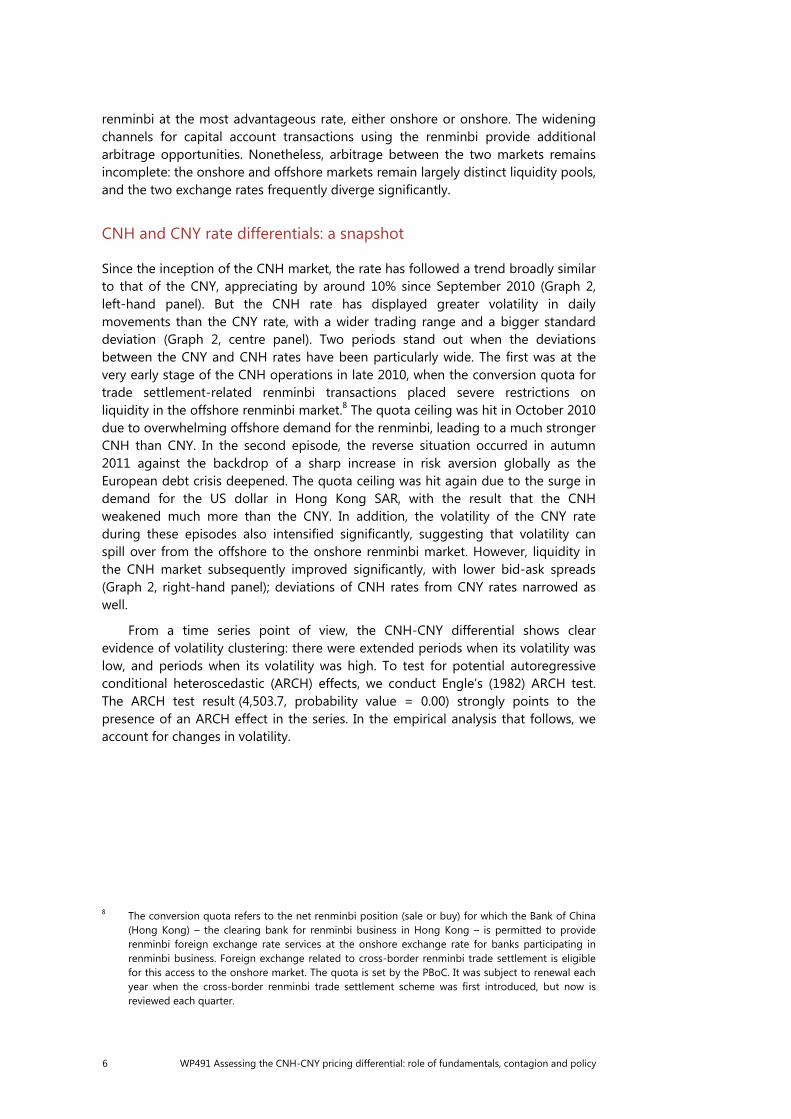
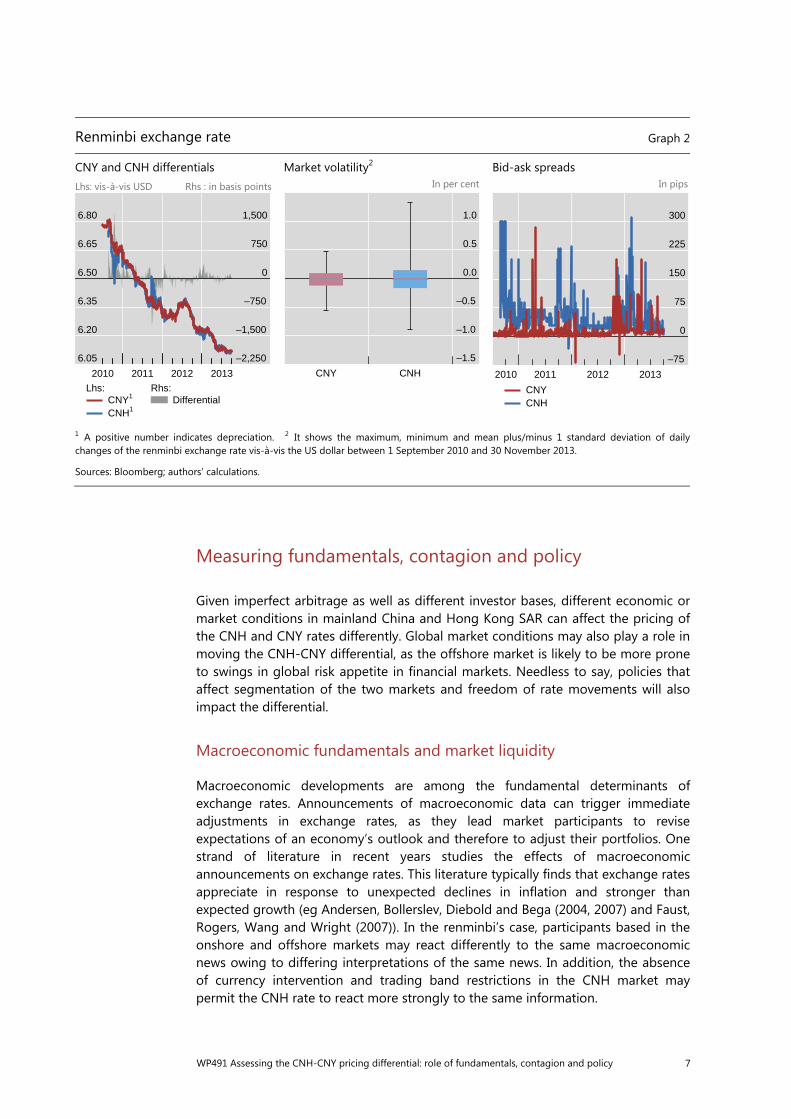
Since the inception of the CNH market, the rate has followed a trend broadly similar to that of the CNY, appreciating by around 10% since September 2010 (Graph 2, left-hand panel). But the CNH rate has displayed greater volatility in daily movements than the CNY rate, with a wider trading range and a bigger standard deviation (Graph 2, centre panel). Two periods stand out when the deviations between the CNY and CNH rates have been particularly wide. The first was at the very early stage of the CNH operations in late 2010, when the conversion quota for trade settlement-related renminbi transactions placed severe restrictions on liquidity in the offshore renminbi market.8 The quota ceiling was hit in October 2010 due to overwhelming offshore demand for the renminbi, leading to a much stronger CNH than CNY. In the second episode, the reverse situation occurred in autumn 2011 against the backdrop of a sharp increase in risk aversion globally as the European debt crisis deepened. The quota ceiling was hit again due to the surge in demand for the US dollar in Hong Kong SAR, with the result that the CNH weakened much more than the CNY. In addition, the volatility of the CNY rate during these episodes also intensified significantly, suggesting that volatility can spill over from the offshore to the onshore renminbi market. However, liquidity in the CNH market subsequently improved significantly, with lower bid-ask spreads (Graph 2, right-hand panel); deviations of CNH rates from CNY rates narrowed as well.
From a time series point of view, the CNH-CNY differential shows clear evidence of volatility clustering: there were extended periods when its volatility was low, and periods when its volatility was high. To test for potential autoregressive conditional heteroscedastic (ARCH) effects, we conduct Engle’s (1982) ARCH test. The ARCH test result (4,503.7, probability value = 0.00) strongly points to the presence of an ARCH effect in the series. In the empirical analysis that follows, we account for changes in volatility.
8 The conversion quota refers to the net renminbi position (sale or buy) for which the Bank of China
(Hong Kong) – the clearing bank for renminbi business in Hong Kong – is permitted to provide renminbi foreign exchange rate services at the onshore exchange rate for banks participating in renminbi business. Foreign exchange related to cross-border renminbi trade settlement is eligible for this access to the onshore market. The quota is set by the PBoC. It was subject to renewal each year when the cross-border renminbi trade settlement scheme was first introduced, but now is reviewed each quarter.
WP491 Assessing the CNH-CNY pricing differential: role of fundamentals, contagion and policy 7
Measuring fundamentals, contagion and policy
Given imperfect arbitrage as well as different investor bases, different economic or market conditions in mainland China and Hong Kong SAR can affect the pricing of the CNH and CNY rates differently. Global market conditions may also play a role in moving the CNH-CNY differential, as the offshore market is likely to be more prone to swings in global risk appetite in financial markets. Needless to say, policies that affect segmentation of the two markets and freedom of rate movements will also impact the differential.
Macroeconomic fundamentals and market liquidity
Macroeconomic developments are among the fundamental determinants of exchange rates. Announcements of macroeconomic data can trigger immediate adjustments in exchange rates, as they lead market participants to revise expectations of an economy’s outlook and therefore to adjust their portfolios. One strand of literature in recent years studies the effects of macroeconomic announcements on exchange rates. This literature typically finds that exchange rates appreciate in response to unexpected declines in inflation and stronger than expected growth (eg Andersen, Bollerslev, Diebold and Bega (2004, 2007) and Faust, Rogers, Wang and Wright (2007)). In the renminbi’s case, participants based in the onshore and offshore markets may react differently to the same macroeconomic news owing to differing interpretations of the same news. In addition, the absence of currency intervention and trading band restrictions in the CNH market may permit the CNH rate to react more strongly to the same information.
Renminbi exchange rate Graph 2
CNY and CNH differentials Market volatility2 Bid-ask spreads Lhs: vis-à-vis USD Rhs : in basis points In per cent In pips
1 A positive number indicates depreciation. 2 It shows the maximum, minimum and mean plus/minus 1 standard deviation of dailychanges of the renminbi exchange rate vis-à-vis the US dollar between 1 September 2010 and 30 November 2013.
Sources: Bloomberg; authors’ calculations.
6.05
6.20
6.35
6.50
6.65
6.80
–2,250
–1,500
–750
0
750
1,500
2010 2011 2012 2013
CNY1
CNH1
Lhs:Differential
Rhs:
–1.5
–1.0
–0.5
0.0
0.5
1.0
CNY CNH–75
0
75
150
225
300
2010 2011 2012 2013
CNYCNH
8 WP491 Assessing the CNH-CNY pricing differential: role of fundamentals, contagion and policy
To capture the impact of macroeconomic fundamentals, two types of variable are considered in this study. The first type is derived from macroeconomic forecast surveys. The surprise elements in key macroeconomic indicators are taken as deviations of their outturns from projections obtained from Bloomberg. The indicators considered are GDP growth, industrial production growth, the Purchasing Manager Index (PMI), inflation and export growth. The advantage of measuring surprises in macroeconomic fundamentals in this way is that it does not rely upon an estimated model and therefore the estimates are uncontaminated by the so-called generated regressor problem (Pagan (1984)).
The second type is derived from stock indices as an indirect measure of economic fundamentals.9 We use the ratio of the Hong Kong and mainland equity prices to capture the relative impact on macroeconomic conditions in the offshore market versus the onshore market. The mainland equity price is represented by the Shanghai stock exchange composite index, and that of Hong Kong by the Hang Seng sub-index covering dual-listed companies (ie those listed both in the mainland and Hong Kong).
Differences between onshore and offshore specific renminbi FX market conditions are also important drivers for CNH-CNY pricing differentials. As discussed earlier, the onshore spot market remains deeper and more liquid than the offshore market, but the latter is growing rapidly. We use the ratio between the CNH and CNY bid-ask spreads to capture the impact of the evolution of offshore liquidity conditions. Higher spreads in the CNH market or a higher ratio between the two markets indicate worsening liquidity conditions in the CNH market. It is recognised that poor liquidity can lead to discounts in the price of a financial asset (Amihud and Mendelson (1986)).
Global market contagion
Apart from domestic conditions, external conditions of a global nature can influence the offshore-onshore renminbi differential. Exchange rates in emerging markets are in general affected by global conditions: global liquidity and risk appetite can drive the direction and magnitudes of capital flows to emerging markets in “risk-on, risk-off” cycles, which in turn affect exchange rates.10 The influence of such external conditions is likely to be bigger for the CNH market, which is more connected with global financial markets, while largely effective, albeit leaky, capital controls insulate the CNY market more effectively from external shocks. In this fashion, global financial shocks might drive a wedge between the CNH and CNY rates.
We consider two types of indicators – global liquidity and investor risk appetite. There are several price-based or quantity-based measures of global liquidity in the
9 Nonetheless, it should be noted that equity prices may also be moved by factors not related to
macroeconomic conditions, such as market liquidity and investor risk appetite.
10 For more on the cyclical behaviour of capital flows to emerging markets, see BIS (2011), McCauley (2012), He and McCauley (2013), and Rey (2013). For how the monetary policy of the advanced economies, particularly that of the United States, can drive global liquidity, see Bekaert et al (2012); on how global banking and the bond market can be the mechanisms for propagating global liquidity, see Bruno and Shin (2013) and Shin (2013).
WP491 Assessing the CNH-CNY pricing differential: role of fundamentals, contagion and policy 9
literature.11 High-frequency price-based indicators, namely 10-year US Treasury bond yields and US five-year swap rates, are used in this study. Investor risk appetite is proxied by the VIX, an implied volatility index that measures the market’s expectation for 30-day S&P 500 volatility priced in S&P 500 options. The VIX is a commonly used barometer of investor sentiment and market volatility.
Measuring market segmentation using policy variables
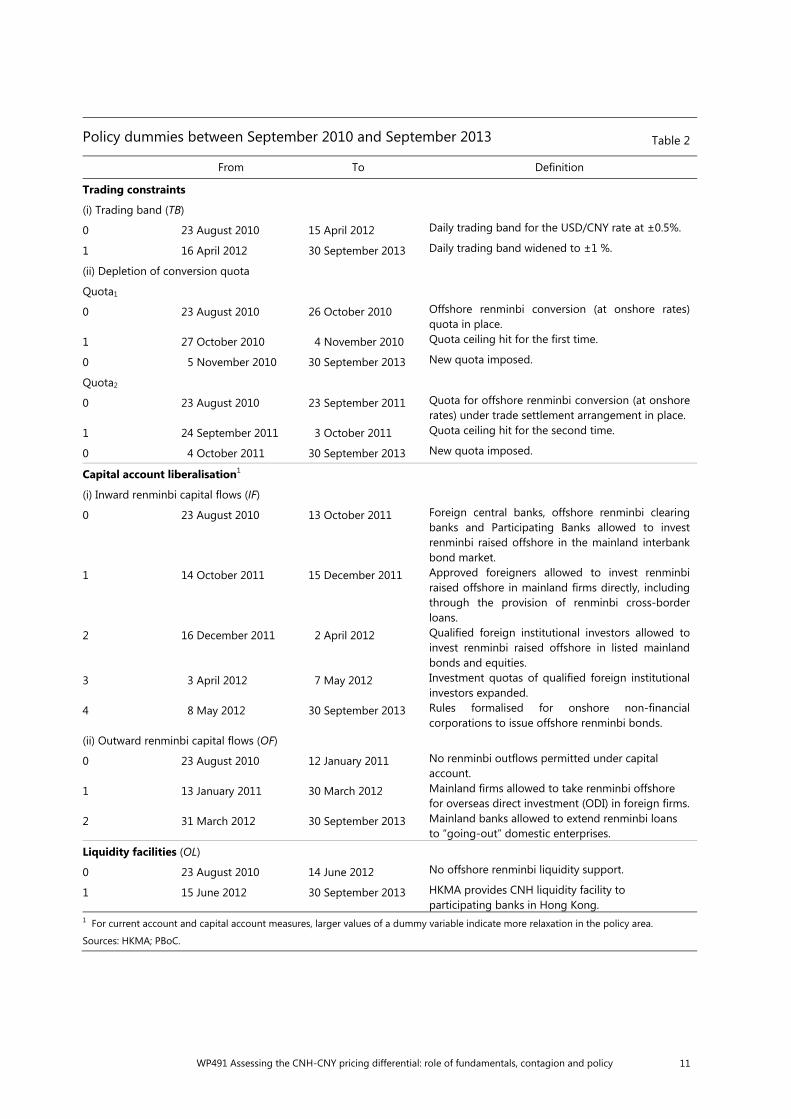
Policies that constrain free pricing or enforce segmentation of the two markets will hinder the closing of the CNH-CNY pricing gap. In contrast, policies that remove pricing constraints, enhance market functioning and facilitate cross-border renminbi flows should help reduce the gap. We consider the policies in four broad categories: (a) trading constraints; (b) current account liberalisation; (c) capital account liberalisation; and (d) liquidity facilities (Table 2). In measuring policies, we use actual data in the case of renminbi trade settlement. We code other policies as dummy variables based on the time of implementation.
Trading constraints
One example of trading restrictions is the daily trading band in the onshore market. It constrains the responsiveness of the CNY rate to changes in economic and market conditions. Greater exchange rate flexibility would allow the CNY market to be priced more in line with economic and market fundamentals as well as with sentiment. This in turn would allow the onshore and offshore rates to move in a more consistent way, thus reducing the differential between the two. A policy dummy reflecting the gradual widening of the trading band is considered to see whether it actually lowered the volatility of the CNH-CNY differential. A greater value of the dummy variable represents a further step in relaxing the trading band constraint.
For the CNH market, the conversion quota constitutes a constraint at the early stages of market development when the market was particularly thin. Hitting the quota ceiling would be expected to greatly affect market liquidity, and widen the CNH-CNY differential. We introduce two dummies to capture the two periods when the quota was filled, in late 2010 and late 2011, respectively (Table 2).
Current account measures: cross-border renminbi trade settlement
The cross-border renminbi trade settlement scheme was introduced in July 2009 on a trial basis, allowing selected importers and exporters in five mainland cities to settle trade with counterparts in Hong Kong, Macau and ASEAN countries. The trial scheme was subsequently widened several times, and eventually closed in March 2012 when it became possible for all external trade to be settled in renminbi. This signified the complete removal of restrictions on the use of the renminbi for current account transactions. On the surface, the trade settlement scheme legally allows Chinese firms to use the renminbi to settle their cross-border trade transactions; in reality, firms are known to use the scheme to channel funds across the border between mainland China and Hong Kong, and conduct exchange rate arbitrage.
11 See Committee on the Global Financial System (2011) for a summary discussion of concepts and
measurements of global liquidity.
10 WP491 Assessing the CNH-CNY pricing differential: role of fundamentals, contagion and policy
Capital account: inward and outward renminbi flows
A series of measures have been announced since the second half of 2010 that encourage cross-border renminbi flows under the capital account. The major channels opened for offshore renminbi flows back to mainland China include: (a) eligible offshore financial institutions investing offshore renminbi funds in the mainland interbank bond market; (b) foreigners undertaking direct investment in mainland China using offshore renminbi; (c) qualified foreign institutional investors investing offshore renminbi in mainland stock and bond markets; and (d) onshore entities raising renminbi funds offshore and repatriating those funds to mainland China. There are fewer channels for renminbi outflows. These include mainland firms using the renminbi to undertake overseas direct investment and mainland banks extending renminbi loans to domestic enterprises for operating overseas.
Two dummies for policies on renminbi inward and outward flows are compiled. Higher values of the dummy variables stand for further liberalisation for inflows or outflows.
Liquidity facilities
To improve liquidity conditions in the offshore renminbi market, the HKMA launched the renminbi liquidity facility in mid-2012. We compile a dummy variable for this facility to gauge its effectiveness in improving liquidity and thus reducing volatility of the CNH-CNY pricing differentials.
Among the institutional variables compiled in this subsection, while hitting the conversion quota limit might have immediate effects on the CNH-CNY differential, others may have a longer-term impact. Most notably, the policies for cross-border renminbi flows should increase the efficiency of the offshore renminbi market, and thus reduce the volatility of the CNH-CNY differential. Renminbi trade settlement and policies for renminbi outflows should help expand the pool of offshore renminbi and deepen the market. While policies facilitating renminbi flows back to the mainland may take funds out of the offshore renminbi pool, they may also encourage the use of the CNH market.
The widening channels for renminbi flows also increase arbitrage opportunities. For example, a merchant can choose to settle trade either onshore or offshore depending on which exchange rate is more favourable. Similar opportunities are also becoming possible under capital account transactions. Over a longer horizon, both markets will become more efficient as larger cross-border renminbi flows facilitate price discovery in the two markets. Taking into account all these effects, it is uncertain whether these policies will induce a change in the relative pricing of the CNH to CNY rate in a specific direction. However, they are likely to reduce the volatility of the differential.
WP491 Assessing the CNH-CNY pricing differential: role of fundamentals, contagion and policy 11
Policy dummies between September 2010 and September 2013 Table 2
From To Definition
Trading constraints
(i) Trading band (TB)
0 23 August 2010 15 April 2012 Daily trading band for the USD/CNY rate at ±0.5%.
1 16 April 2012 30 September 2013 Daily trading band widened to ±1 %.
(ii) Depletion of conversion quota
Quota1
0 23 August 2010 26 October 2010 Offshore renminbi conversion (at onshore rates) quota in place.
1 27 October 2010 4 November 2010 Quota ceiling hit for the first time.
0 5 November 2010 30 September 2013 New quota imposed.
Quota2
0 23 August 2010 23 September 2011 Quota for offshore renminbi conversion (at onshore rates) under trade settlement arrangement in place.
1 24 September 2011 3 October 2011 Quota ceiling hit for the second time.
0 4 October 2011 30 September 2013 New quota imposed.
Capital account liberalisation1
(i) Inward renminbi capital flows (IF)
0 23 August 2010 13 October 2011 Foreign central banks, offshore renminbi clearing banks and Participating Banks allowed to invest renminbi raised offshore in the mainland interbank bond market.
1 14 October 2011 15 December 2011 Approved foreigners allowed to invest renminbi raised offshore in mainland firms directly, including through the provision of renminbi cross-border loans.
2 16 December 2011 2 April 2012 Qualified foreign institutional investors allowed to invest renminbi raised offshore in listed mainland bonds and equities.
3 3 April 2012 7 May 2012 Investment quotas of qualified foreign institutional investors expanded.
4 8 May 2012 30 September 2013 Rules formalised for onshore non-financial corporations to issue offshore renminbi bonds.
(ii) Outward renminbi capital flows (OF)
0 23 August 2010 12 January 2011 No renminbi outflows permitted under capital account.
1 13 January 2011 30 March 2012 Mainland firms allowed to take renminbi offshore for overseas direct investment (ODI) in foreign firms.
2 31 March 2012 30 September 2013 Mainland banks allowed to extend renminbi loans to “going-out” domestic enterprises.
Liquidity facilities (OL)
0 23 August 2010 14 June 2012 No offshore renminbi liquidity support.
1 15 June 2012 30 September 2013 HKMA provides CNH liquidity facility to participating banks in Hong Kong.
1 For current account and capital account measures, larger values of a dummy variable indicate more relaxation in the policy area.
Sources: HKMA; PBoC.
12 WP491 Assessing the CNH-CNY pricing differential: role of fundamentals, contagion and policy
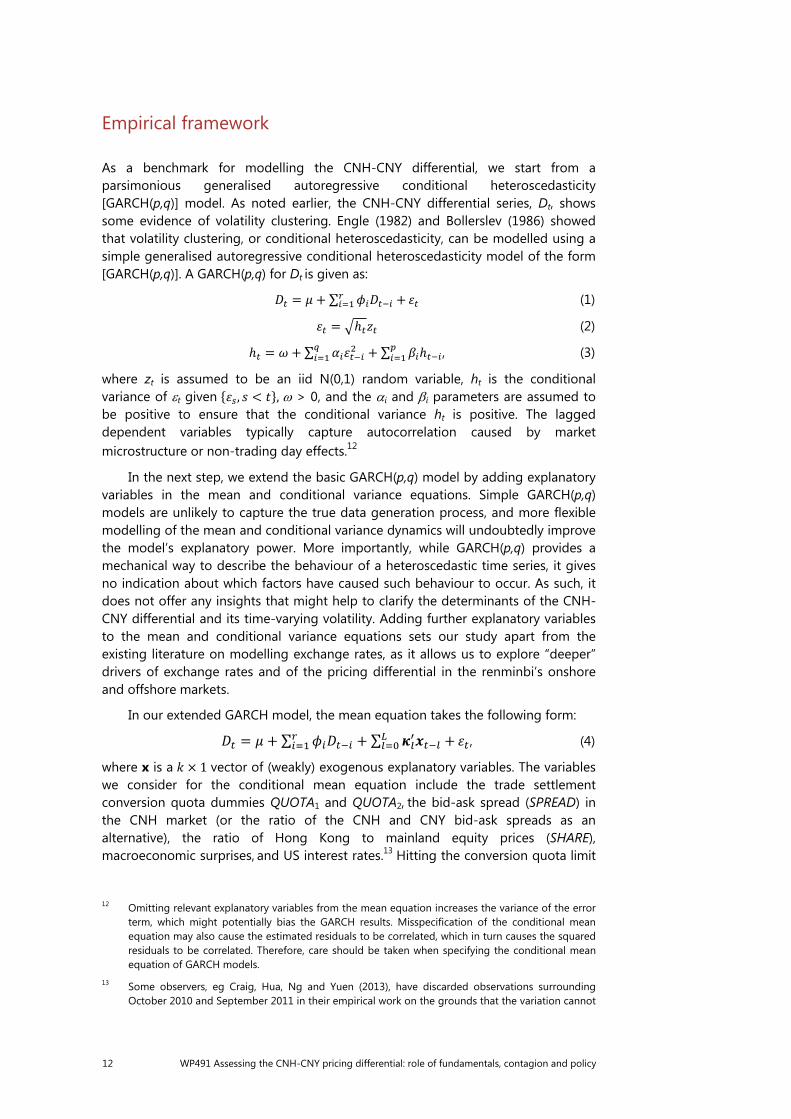
Empirical framework
As a benchmark for modelling the CNH-CNY differential, we start from a parsimonious generalised autoregressive conditional heteroscedasticity [GARCH(p,q)] model. As noted earlier, the CNH-CNY differential series, Dt, shows some evidence of volatility clustering. Engle (1982) and Bollerslev (1986) showed that volatility clustering, or conditional heteroscedasticity, can be modelled using a simple generalised autoregressive conditional heteroscedasticity model of the form [GARCH(p,q)]. A GARCH(p,q) for Dt is given as:
= + ∑ + (1)
= ℎ (2)
ℎ = + ∑ + ∑ ℎ , (3)
where zt is assumed to be an iid N(0,1) random variable, ht is the conditional variance of t given , < , > 0, and the i and i parameters are assumed to be positive to ensure that the conditional variance ht is positive. The lagged dependent variables typically capture autocorrelation caused by market microstructure or non-trading day effects.12
In the next step, we extend the basic GARCH(p,q) model by adding explanatory variables in the mean and conditional variance equations. Simple GARCH(p,q) models are unlikely to capture the true data generation process, and more flexible modelling of the mean and conditional variance dynamics will undoubtedly improve the model’s explanatory power. More importantly, while GARCH(p,q) provides a mechanical way to describe the behaviour of a heteroscedastic time series, it gives no indication about which factors have caused such behaviour to occur. As such, it does not offer any insights that might help to clarify the determinants of the CNH-CNY differential and its time-varying volatility. Adding further explanatory variables to the mean and conditional variance equations sets our study apart from the existing literature on modelling exchange rates, as it allows us to explore “deeper” drivers of exchange rates and of the pricing differential in the renminbi’s onshore and offshore markets.
In our extended GARCH model, the mean equation takes the following form:
= + ∑ + ∑ + , (4)
where x is a × 1 vector of (weakly) exogenous explanatory variables. The variables we consider for the conditional mean equation include the trade settlement conversion quota dummies QUOTA1 and QUOTA2, the bid-ask spread (SPREAD) in the CNH market (or the ratio of the CNH and CNY bid-ask spreads as an alternative), the ratio of Hong Kong to mainland equity prices (SHARE), macroeconomic surprises, and US interest rates.13 Hitting the conversion quota limit
12 Omitting relevant explanatory variables from the mean equation increases the variance of the error
term, which might potentially bias the GARCH results. Misspecification of the conditional mean equation may also cause the estimated residuals to be correlated, which in turn causes the squared residuals to be correlated. Therefore, care should be taken when specifying the conditional mean equation of GARCH models.
13 Some observers, eg Craig, Hua, Ng and Yuen (2013), have discarded observations surrounding October 2010 and September 2011 in their empirical work on the grounds that the variation cannot
WP491 Assessing the CNH-CNY pricing differential: role of fundamentals, contagion and policy 13
is expected to lead to a sharp, although temporary widening of the differential. The dummy for the quota for late 2010 is expected to have a negative sign. The CNH rate carried a premium over the CNY rate at the time, ie the CNH rate had a smaller value than the CNY rate, implying greater strength vis-à-vis the US dollar. The opposite is true for the period in late 2011, and the coefficient on the quota dummy is expected to be positive. A positive sign is anticipated for the coefficient on the US interest rates, ie tighter global liquidity conditions, as reflected in higher US interest rates, might lead to a sharper weakening of the CNH rate compared with the CNY rate. The bid-ask spread variables are viewed as likely to carry a positive sign, as relatively worse CNH liquidity should lead to a greater discount of the CNH rate relative to the CNY rate.
Just as further explanatory variables may be added to the conditional mean equation, weakly exogenous explanatory variables may also be added to the conditional variance equation in a straightforward way, giving:
ℎ = + ∑ + ∑ ℎ + ∑ , (5)
where w is an × 1 vector of (weakly) exogenous variables that may account for the heteroscedastic nature of the disturbances. The variables we consider for the conditional variance equation include the policy variables for cross-border renminbi settlement (TS), inward and outward renminbi flows (IF and OF), the offshore renminbi liquidity facility (OL), trading band relaxation of the CNY market (TB) and the global risk measure VIX.
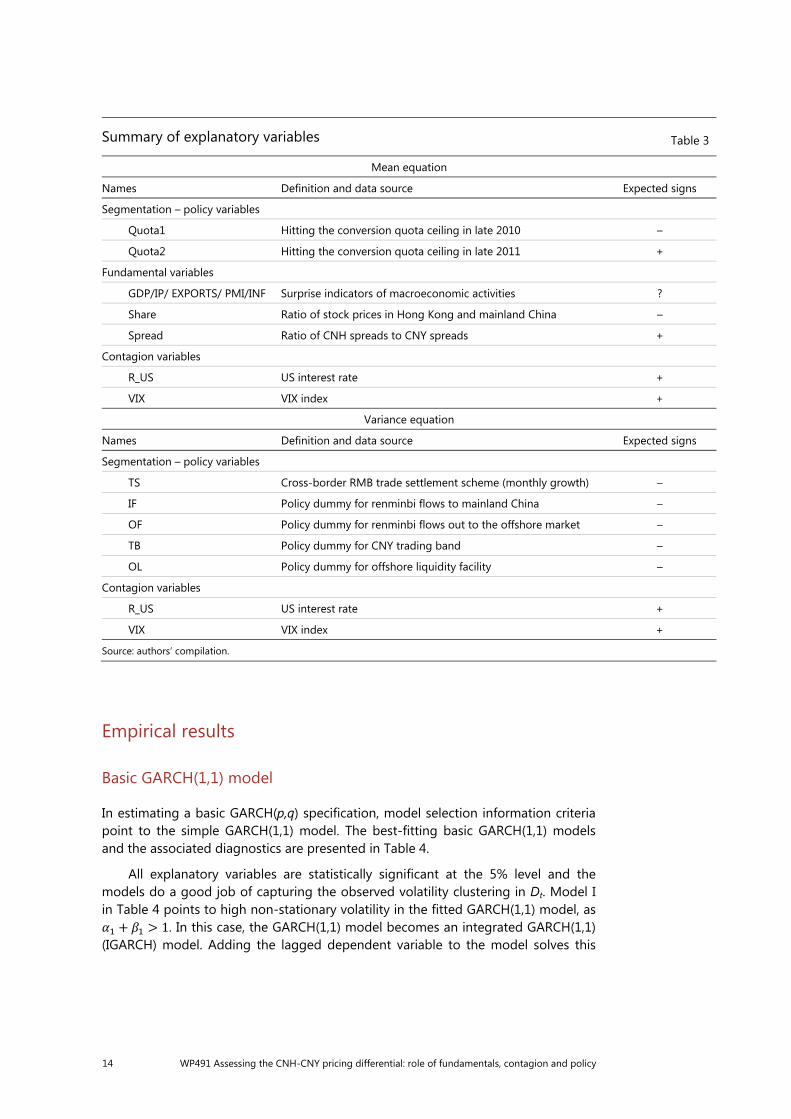
To summarise the discussion in this section, Table 3 lists the variables with their definitions and expected signs.
For the estimation, daily (close-of-business) data from August 2010 (when quotes for the CNH rate became regular) to September 2013 are used, excluding weekends and other non-trading days such as holidays.
It is worth noting that estimating GARCH models with additional dummy variables entails some non-trivial risks and poses challenges in the computation. Doornik and Ooms (2008) have demonstrated that regression-GARCH models with dummy variables in the conditional mean equation may lead to multimodality likelihood functions. Since reaching a global maximum of the log-likelihood function is not guaranteed using standard optimisation techniques such as the BFGS algorithm, estimation has to be treated with care. In the light of this problem, we have explored the surface of the log-likelihood by experimenting with the starting values and re-estimating the GARCH parameters. In order to avoid similar pitfalls in modelling the variance, we have also followed Doornik and Ooms (2008) in adding a corresponding dummy in the conditional variance equation as a robustness check.14
be encompassed in a general modelling framework. On the contrary, we believe that a satisfactory model should be able to capture these episodes.
14 The estimation methodology looks straightforward, although it is in fact complex because of the large number of parameters to be estimated. Computational tractability requires appropriate starting values in order to achieve convergence to the global maximum. To achieve this, appropriate starting values were obtained using the simplex algorithm. The preliminary iterations avoid problems with the multimodality and/or discontinuity of the likelihood function.
14 WP491 Assessing the CNH-CNY pricing differential: role of fundamentals, contagion and policy
Empirical results
Basic GARCH(1,1) model
In estimating a basic GARCH(p,q) specification, model selection information criteria point to the simple GARCH(1,1) model. The best-fitting basic GARCH(1,1) models and the associated diagnostics are presented in Table 4.
All explanatory variables are statistically significant at the 5% level and the models do a good job of capturing the observed volatility clustering in Dt. Model I in Table 4 points to high non-stationary volatility in the fitted GARCH(1,1) model, as + > 1. In this case, the GARCH(1,1) model becomes an integrated GARCH(1,1) (IGARCH) model. Adding the lagged dependent variable to the model solves this
Summary of explanatory variables Table 3
Mean equation
Names Definition and data source Expected signs
Segmentation – policy variables
Quota1 Hitting the conversion quota ceiling in late 2010 –
Quota2 Hitting the conversion quota ceiling in late 2011 +
Fundamental variables
GDP/IP/ EXPORTS/ PMI/INF Surprise indicators of macroeconomic activities ?
Share Ratio of stock prices in Hong Kong and mainland China –
Spread Ratio of CNH spreads to CNY spreads +
Contagion variables
R_US US interest rate +
VIX VIX index +
Variance equation
Names Definition and data source Expected signs
Segmentation – policy variables
TS Cross-border RMB trade settlement scheme (monthly growth) –
IF Policy dummy for renminbi flows to mainland China –
OF Policy dummy for renminbi flows out to the offshore market –
TB Policy dummy for CNY trading band –
OL Policy dummy for offshore liquidity facility –
Contagion variables
R_US US interest rate +
VIX VIX index +
Source: authors’ compilation.
WP491 Assessing the CNH-CNY pricing differential: role of fundamentals, contagion and policy 15
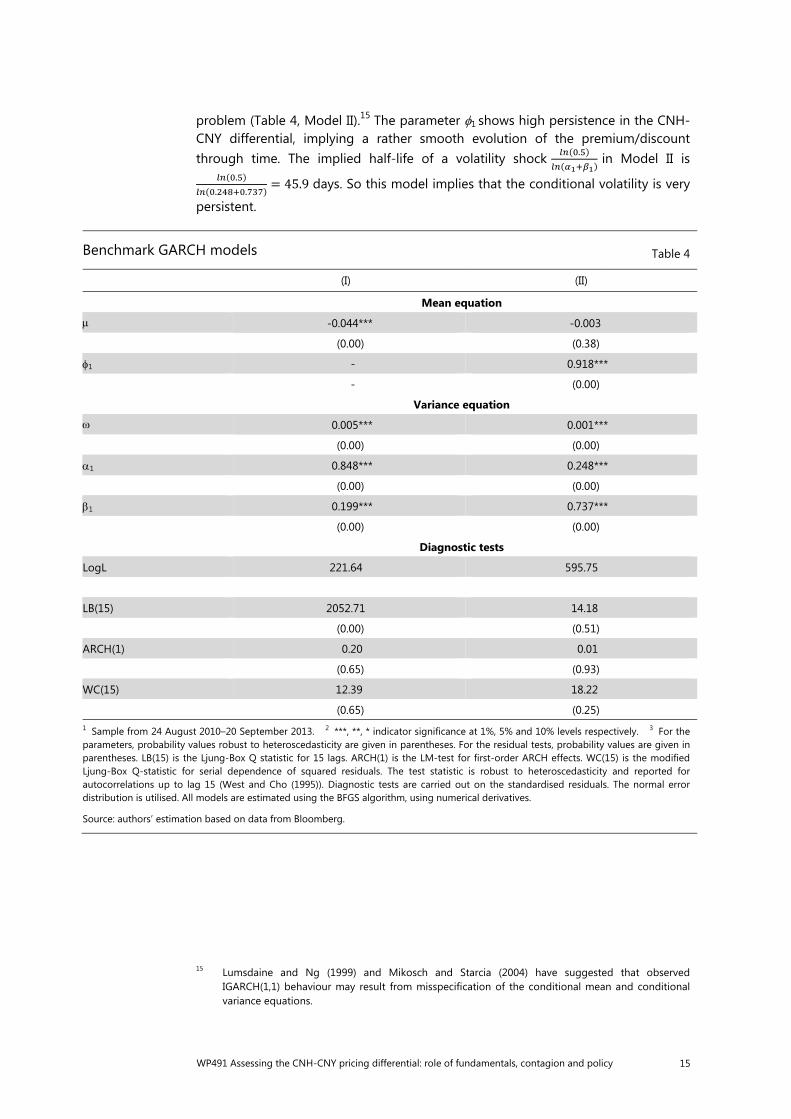
problem (Table 4, Model II).15 The parameter 1 shows high persistence in the CNH-CNY differential, implying a rather smooth evolution of the premium/discount through time. The implied half-life of a volatility shock . in Model II is .. . = 45.9 days. So this model implies that the conditional volatility is very
persistent.
15 Lumsdaine and Ng (1999) and Mikosch and Starcia (2004) have suggested that observed
IGARCH(1,1) behaviour may result from misspecification of the conditional mean and conditional variance equations.
Benchmark GARCH models Table 4
(I) (II)
Mean equation
-0.044*** -0.003
(0.00) (0.38)
1 - 0.918***
- (0.00)
Variance equation
0.005*** 0.001***
(0.00) (0.00)
1 0.848*** 0.248***
(0.00) (0.00)
1 0.199*** 0.737***
(0.00) (0.00)
Diagnostic tests
LogL 221.64 595.75
LB(15) 2052.71 14.18
(0.00) (0.51)
ARCH(1) 0.20 0.01
(0.65) (0.93)
WC(15) 12.39 18.22
(0.65) (0.25) 1 Sample from 24 August 2010–20 September 2013. 2 ***, **, * indicator significance at 1%, 5% and 10% levels respectively. 3 For the parameters, probability values robust to heteroscedasticity are given in parentheses. For the residual tests, probability values are given in parentheses. LB(15) is the Ljung-Box Q statistic for 15 lags. ARCH(1) is the LM-test for first-order ARCH effects. WC(15) is the modified Ljung-Box Q-statistic for serial dependence of squared residuals. The test statistic is robust to heteroscedasticity and reported for autocorrelations up to lag 15 (West and Cho (1995)). Diagnostic tests are carried out on the standardised residuals. The normal error distribution is utilised. All models are estimated using the BFGS algorithm, using numerical derivatives.
Source: authors’ estimation based on data from Bloomberg.
16 WP491 Assessing the CNH-CNY pricing differential: role of fundamentals, contagion and policy
Extended GARCH(1,1) models
The extended GARCH models retain the GARCH(1,1) specification, but add fundamental, global and policy factors. Hansen and Lunde (2004) have provided compelling evidence that it is difficult to find volatility models that are better than the plain GARCH(1,1).16
Macroeconomic fundamentals, market liquidity and global factors
Among the variables, market liquidity (SPREAD) and share prices (SHARE) play an important role in explaining the onshore-offshore renminbi pricing differential in the conditional mean equation (Table 5). For instance, greater bid-ask spreads in the CNH market (relative to those of the CNY market) tend to result in a discount of the offshore renminbi relative to its onshore counterpart, in line with findings in the literature that market illiquidity may discourage players from holding the underlying financial asset. Higher prices of dual-listed shares in Hong Kong compared to those in mainland China lead to greater appreciation of the renminbi in the CNH relative to the CNY market.
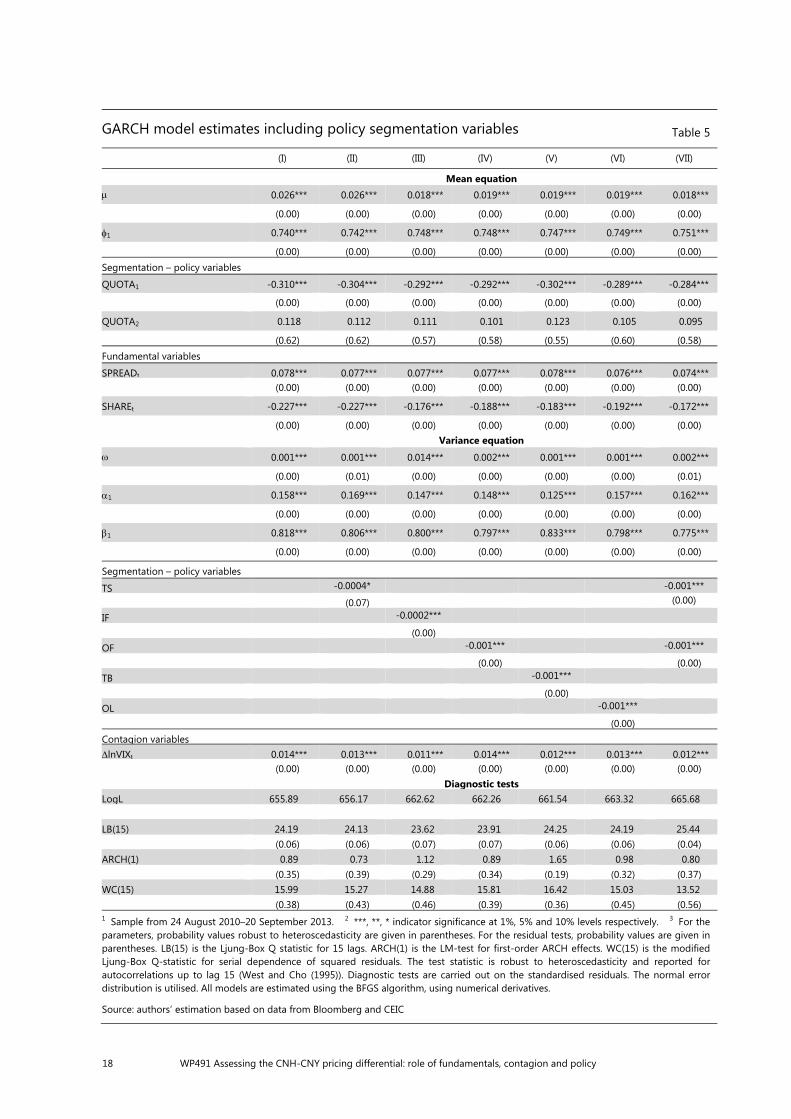
Most macroeconomic variables are not significant (Table 6). The only significant macroeconomic surprise variable is GDP growth. Some other key macroeconomic indicators (eg industrial production, PMI, inflation and export growth – all in the form of surprises, and a summary surprise index compiled by Citibank) have also been tested. These are either insignificant or not robust. It is possible that the other variables such as SHARE incorporate most of the impact of macroeconomic conditions.
Global market contagion represented by risk appetite can drive the volatility of the CNH-CNY differential. Global liquidity, measured either by the 10-year US treasury bond yield or as five-year swap rates, are not significant in any specification. In the interest of parsimony, these are omitted in the tables reporting estimation results. By comparison, the VIX variable, the risk aversion indicator, is highly significant in all specifications in its impact on volatility. It carries a positive sign, and one interpretation is that, as the CNH market is more closely linked with global markets than the CNY market, a rise in risk aversion globally increases the volatility of the differential between the two rates.
Policy variables
Among the policy variables, hitting the conversion quota ceiling has both a statistically and economically significant impact on daily CNH-CNY pricing differentials in the conditional mean equation. In particular, ceteris paribus, the CNY was priced around 30% more expensively than the CNH during the first episode of quota depletion in late 2010. By comparison, the impact of hitting the quota limit the second time seems to have had little impact on the pricing differential in most specifications. However, exploring with specifications with a different dynamic structure, it is found that QUOTA2 has an impact on the CNH-CNY differential with a
16 In these extended GARCH models, the impact of fundamentals, and global market contagion on
both the mean and volatility of CNH-CNY pricing differentials are largely in line with our expectations.
WP491 Assessing the CNH-CNY pricing differential: role of fundamentals, contagion and policy 17
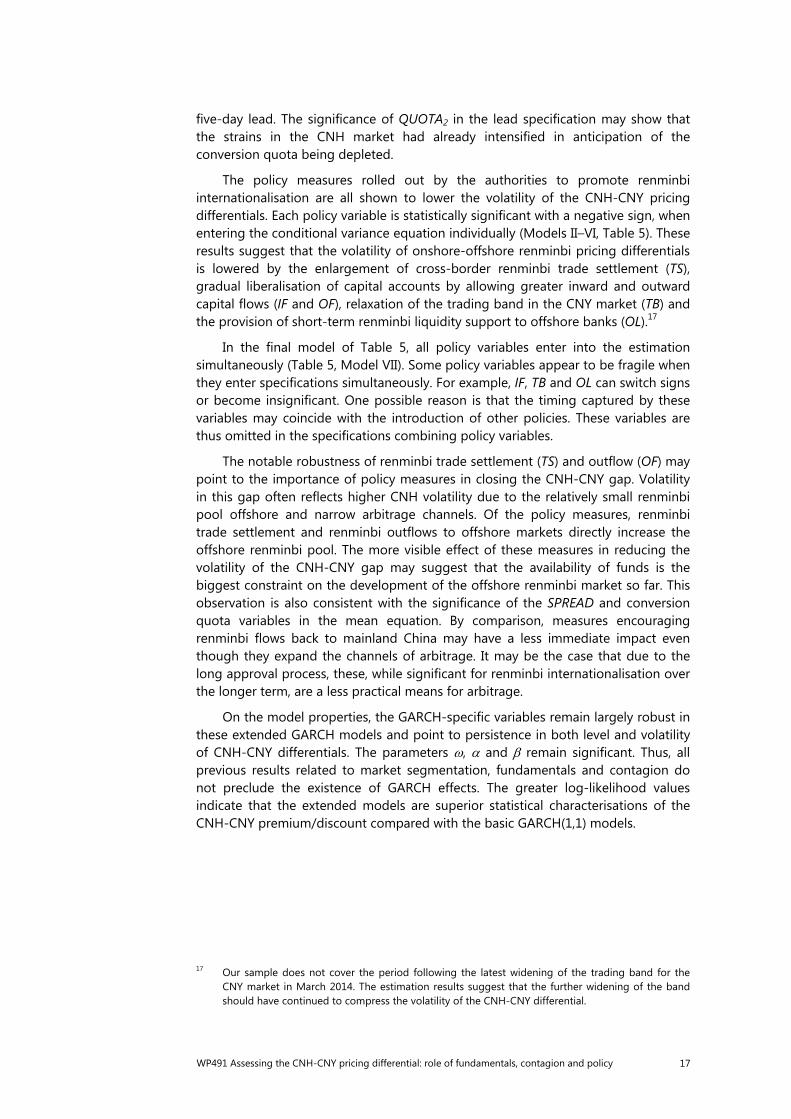
five-day lead. The significance of QUOTA2 in the lead specification may show that the strains in the CNH market had already intensified in anticipation of the conversion quota being depleted.
The policy measures rolled out by the authorities to promote renminbi internationalisation are all shown to lower the volatility of the CNH-CNY pricing differentials. Each policy variable is statistically significant with a negative sign, when entering the conditional variance equation individually (Models II–VI, Table 5). These results suggest that the volatility of onshore-offshore renminbi pricing differentials is lowered by the enlargement of cross-border renminbi trade settlement (TS), gradual liberalisation of capital accounts by allowing greater inward and outward capital flows (IF and OF), relaxation of the trading band in the CNY market (TB) and the provision of short-term renminbi liquidity support to offshore banks (OL).17
In the final model of Table 5, all policy variables enter into the estimation simultaneously (Table 5, Model VII). Some policy variables appear to be fragile when they enter specifications simultaneously. For example, IF, TB and OL can switch signs or become insignificant. One possible reason is that the timing captured by these variables may coincide with the introduction of other policies. These variables are thus omitted in the specifications combining policy variables.
The notable robustness of renminbi trade settlement (TS) and outflow (OF) may point to the importance of policy measures in closing the CNH-CNY gap. Volatility in this gap often reflects higher CNH volatility due to the relatively small renminbi pool offshore and narrow arbitrage channels. Of the policy measures, renminbi trade settlement and renminbi outflows to offshore markets directly increase the offshore renminbi pool. The more visible effect of these measures in reducing the volatility of the CNH-CNY gap may suggest that the availability of funds is the biggest constraint on the development of the offshore renminbi market so far. This observation is also consistent with the significance of the SPREAD and conversion quota variables in the mean equation. By comparison, measures encouraging renminbi flows back to mainland China may have a less immediate impact even though they expand the channels of arbitrage. It may be the case that due to the long approval process, these, while significant for renminbi internationalisation over the longer term, are a less practical means for arbitrage.
On the model properties, the GARCH-specific variables remain largely robust in these extended GARCH models and point to persistence in both level and volatility of CNH-CNY differentials. The parameters , and remain significant. Thus, all previous results related to market segmentation, fundamentals and contagion do not preclude the existence of GARCH effects. The greater log-likelihood values indicate that the extended models are superior statistical characterisations of the CNH-CNY premium/discount compared with the basic GARCH(1,1) models.
17 Our sample does not cover the period following the latest widening of the trading band for the
CNY market in March 2014. The estimation results suggest that the further widening of the band should have continued to compress the volatility of the CNH-CNY differential.
18 WP491 Assessing the CNH-CNY pricing differential: role of fundamentals, contagion and policy
GARCH model estimates including policy segmentation variables Table 5
(I) (II) (III) (IV) (V) (VI) (VII)
Mean equation 0.026*** 0.026*** 0.018*** 0.019*** 0.019*** 0.019*** 0.018***
(0.00) (0.00) (0.00) (0.00) (0.00) (0.00) (0.00)
1 0.740*** 0.742*** 0.748*** 0.748*** 0.747*** 0.749*** 0.751***
(0.00) (0.00) (0.00) (0.00) (0.00) (0.00) (0.00)Segmentation – policy variables
QUOTA1 -0.310*** -0.304*** -0.292*** -0.292*** -0.302*** -0.289*** -0.284***
(0.00) (0.00) (0.00) (0.00) (0.00) (0.00) (0.00)
QUOTA2 0.118 0.112 0.111 0.101 0.123 0.105 0.095
(0.62) (0.62) (0.57) (0.58) (0.55) (0.60) (0.58)Fundamental variables
SPREADt 0.078*** 0.077*** 0.077*** 0.077*** 0.078*** 0.076*** 0.074*** (0.00) (0.00) (0.00) (0.00) (0.00) (0.00) (0.00)
SHAREt -0.227*** -0.227*** -0.176*** -0.188*** -0.183*** -0.192*** -0.172***
(0.00) (0.00) (0.00) (0.00) (0.00) (0.00) (0.00) Variance equation 0.001*** 0.001*** 0.014*** 0.002*** 0.001*** 0.001*** 0.002***
(0.00) (0.01) (0.00) (0.00) (0.00) (0.00) (0.01)
1 0.158*** 0.169*** 0.147*** 0.148*** 0.125*** 0.157*** 0.162***
(0.00) (0.00) (0.00) (0.00) (0.00) (0.00) (0.00)
1 0.818*** 0.806*** 0.800*** 0.797*** 0.833*** 0.798*** 0.775***
(0.00) (0.00) (0.00) (0.00) (0.00) (0.00) (0.00)
Segmentation – policy variables
TS -0.0004* -0.001***
(0.07) (0.00)
IF -0.0002***
(0.00) OF -0.001*** -0.001***
(0.00) (0.00)TB -0.001*** (0.00) OL -0.001***
(0.00) Contagion variables
lnVIXt 0.014*** 0.013*** 0.011*** 0.014*** 0.012*** 0.013*** 0.012*** (0.00) (0.00) (0.00) (0.00) (0.00) (0.00) (0.00) Diagnostic testsLogL 655.89 656.17 662.62 662.26 661.54 663.32 665.68 LB(15) 24.19 24.13 23.62 23.91 24.25 24.19 25.44 (0.06) (0.06) (0.07) (0.07) (0.06) (0.06) (0.04)ARCH(1) 0.89 0.73 1.12 0.89 1.65 0.98 0.80 (0.35) (0.39) (0.29) (0.34) (0.19) (0.32) (0.37)WC(15) 15.99 15.27 14.88 15.81 16.42 15.03 13.52 (0.38) (0.43) (0.46) (0.39) (0.36) (0.45) (0.56)1 Sample from 24 August 2010–20 September 2013. 2 ***, **, * indicator significance at 1%, 5% and 10% levels respectively. 3 For the parameters, probability values robust to heteroscedasticity are given in parentheses. For the residual tests, probability values are given in parentheses. LB(15) is the Ljung-Box Q statistic for 15 lags. ARCH(1) is the LM-test for first-order ARCH effects. WC(15) is the modified Ljung-Box Q-statistic for serial dependence of squared residuals. The test statistic is robust to heteroscedasticity and reported for autocorrelations up to lag 15 (West and Cho (1995)). Diagnostic tests are carried out on the standardised residuals. The normal error distribution is utilised. All models are estimated using the BFGS algorithm, using numerical derivatives.
Source: authors’ estimation based on data from Bloomberg and CEIC
WP491 Assessing the CNH-CNY pricing differential: role of fundamentals, contagion and policy 19
GARCH model estimates including macroeconomic surprise variables Table 6
(I) (II) (III) (IV)
Mean equation 0.028*** 0.029*** 0.018** 0.031***
(0.00) (0.00) (0.01) (0.00) 1 0.775*** 0.777*** 0.751*** 0.774***
(0.00) (0.00) (0.00) (0.00) Segmentation – policy variables
QUOTA1 -0.324*** -0.327*** -0.283*** -0.335***
(0.00) (0.00) (0.00) (0.00) QUOTA2 0.215 0.236 0.091 0.239*
(0.29) (0.14) (0.67) (0.10) Fundamental variables
SPREADt 0.063*** 0.062*** 0.073*** 0.061***
(0.00) (0.00) (0.00) (0.00) SHAREt -0.265*** -0.269*** -0.176*** -0.289***
(0.00) (0.00) (0.01) (0.00) IP-S 0.017 0.013
(0.46) (0.43) GDP-S 0.264** 0.251**
(0.03) (0.04) PMI-S 0.017 0.030
(0.49) (0.19) Variance equation
0.007*** 0.009*** 0.002*** 0.009*** (0.01) (0.00) (0.01) (0.00)
1 0.350*** 0.387*** 0.163*** 0.411*** (0.00) (0.00) (0.00) (0.00)
1 0.455*** 0.387*** 0.772*** 0.361*** (0.00) (0.01) (0.00) (0.00) Segmentation – policy variables
TS -0.003*** -0.003*** -0.001*** -0.003*** (0.00) (0.01) (0.00) (0.00)
OF -0.003*** -0.003*** -0.001*** -0.003** (0.00) (0.01) (0.00) (0.01)
Contagion variables
lnVIXt 0.015*** 0.017*** 0.012*** 0.015*** (0.00) (0.00) (0.00) (0.00) Diagnostic tests
LogL 663.35 665.13 665.89 666.25
LB(15) 22.22 23.43 25.33 23.71 (0.10) (0.08) (0.05) (0.07)
ARCH(1) 0.00 0.00 0.77 0.01 (0.97) (0.97) (0.38) (0.93)
WC(15) 9.88 8.60 13.55 9.03 (0.83) (0.89) (0.56) (0.87) 1 Sample from 24 August 2010–20 September 2013. 2 ***, **, * indicator significance at 1%, 5% and 10% levels respectively. 3 For the parameters, probability values robust to heteroscedasticity are given in parentheses. For the residual tests, probability values are given in parentheses. LB(15) is the Ljung-Box Q statistic for 15 lags. ARCH(1) is the LM-test for first-order ARCH effects. WC(15) is the modified Ljung-Box Q-statistic for serial dependence of squared residuals. The test statistic is robust to heteroscedasticity and reported for autocorrelations up to lag 15 (West and Cho (1995)). Diagnostic tests are carried out on the standardised residuals. The normal error distribution is utilised. All models are estimated using the BFGS algorithm, using numerical derivatives.
Source: authors’ estimation based on data from Bloomberg and CEIC
20 WP491 Assessing the CNH-CNY pricing differential: role of fundamentals, contagion and policy
Concluding remarks and policy discussion
The renminbi exchange rate is closely watched both domestically and internationally. At the same time, the development of the offshore markets has created a new dimension of complexity for those who seek to understand renminbi movements, given that the offshore rates differ significantly from their onshore counterparts. This can reflect capital controls, but also differences in the investor composition between the two markets, and the different sensitivities of these investors to the same shocks. So far, however, little research has been undertaken to explain the deviations between the onshore and offshore renminbi rates. We have examined the degree to which this differential is driven by fundamentals and global factors, as opposed to capital market liberalisation measures. We model the differential using an extended GARCH framework, allowing us to analyse the impact of various factors on both the level and volatility of the differential.
The analysis highlights the significance of market liquidity in affecting the differential. This suggests that policymakers interested in the renminbi’s fundamental valuation might wish to discount the information emanating from the less liquid market – the CNH market – in these periods. At the same time, the volatility of the differential is affected by global risk aversion.
The empirical findings of this study underscore the role of policy in facilitating the development of renminbi markets and the importance of further capital market liberalisation. As we might expect, the pricing difference between onshore and offshore rates to a large extent reflects restrictions on onshore foreign exchange trading and barriers to cross-border renminbi movements, and loosening these restrictions will tend to lower the level and volatility of the differential. Conceivably, when the two renminbi markets are fully integrated over the longer term, the renminbi FX markets will evolve to look like those for the US dollar, in which the location of trading is immaterial, and the onshore and offshore rates give consistent pricing signals.
Segmentation of the two markets does not necessarily contain volatility in the offshore market. In fact, our evidence suggests that removing impediments to cross-border flows to the offshore market reduces the volatility of the CNH-CNY differential (as does increased liquidity in the offshore market). Increased outflows may have enabled the much deeper onshore market to anchor the exchange rate and better absorb volatility in both markets.
From a modelling perspective, alternative frameworks may be possible for enriching our understanding of the CNH-CNY differential. The adjustment of the differential may have certain regularities, and differ depending on whether the CNH is at a premium or discount to the CNY. More generalised threshold GARCH models could be employed to capture these phenomena. Complex dynamics in onshore and offshore interaction may even call for further extensions of the GARCH framework such as the Markov-switching GARCH model (see, for example, Chen, So and Lin (2009)) and double-threshold GARCH model (see, for example, Brooks (2001), and Chen and So (2006)). These analytical alternatives may be considered in our future research.
WP491 Assessing the CNH-CNY pricing differential: role of fundamentals, contagion and policy 21
References
Amihud, Y and H Mendelson (1986): “Asset pricing and the bid-ask spread”, Journal of Financial Economics, no 17, pp 223–49.
Andersen, T, T Bollerslev, F Diebold and C Vega (2003): “Micro effects of macro announcements: real-time price discovery in foreign exchange”, American Economic Review, no 93, pp 38–62.
——— (2007): “Real-time price discovery in stock, bond and foreign exchange markets”, Journal of International Economics, no 73, pp 251–77.
Balasubramaniam, V, I Patnaik and A Shah (2011): “Who cares about the Chinese yuan?”, National Institute of Public Finance and Policy, New Delhi, Working Paper, 2011-89, May.
Bollerslev, T (1986): “Generalized autoregressive conditional heteroscedasticity”, Journal of Econometrics, no 31, pp 307–27.
Brockwell, P and R Davis (2002): Introduction to Time Series and Forecasting, Springer.
Brooks, C (2001): “A double-threshold GARCH model for the French franc/deutschmark exchange rate”, Journal of Forecasting, no 20, pp 135–43.
Chen, C and M So (2006): “On a threshold heteroscedastic model”, International Journal of Forecasting, no 22, pp 73–89.
Chen, C, M So and E Lin (2009): “Volatility forecasting with double Markov-switching GARCH models”, Journal of Forecasting, no 28, pp 681–97.
Chen, S-W and C-H Shen (2004): “GARCH, jumps and permanent and transitory components of volatility: the case of the Taiwan exchange rate”, Mathematics and Computers in Simulation, no 67, pp 201–16.
Cheung, Y and D Rime (2014): “The offshore renminbi exchange rate: microstructure and links to the onshore market”, CESifo Working Paper, no 4850.
Chinn, M and H Ito (2006): “What matters for financial development? Capital controls, institutions, and interactions”, Journal of Development Economics, vol 81, no 1, pp 163–92.
Committee on the Global Financial System (2011): “Global liquidity – concept, measurement and policy implications”, CGFS Papers, no 45.
Craig, R, C Hua, P Ng and R Yuen (2013): “Chinese capital account liberalization and the internationalization of the renminbi”, IMF Working Paper, WP/13/268.
Doornik, J and M Ooms (2008): “Multimodality in GARCH regression models”, International Journal of Forecasting, no 24, pp 432–48.
Engle, R (1982): “Autoregressive conditional heteroscedasticity with estimates of the variance of UK inflation”, Econometrica, no 50, pp 987–1007.
Faust, J, J Rogers, S-Y Wang and J Wright (2007): “The high-frequency response of exchange rates and interest rates to macroeconomic announcements”, Journal of Monetary Economics, no 54, pp 1051–68.
Fratzscher, M and A Mehl (2011): “China’s dominance hypothesis and the emergence of a tri-polar global currency system”, CEPR Discussion Paper, no 8671, November.
22 WP491 Assessing the CNH-CNY pricing differential: role of fundamentals, contagion and policy
Hansen, P and A Lunde (2004): “A forecast comparison of volatility models: does anything beat a GARCH(1,1) model?”, Journal of Applied Econometrics, no 20, pp 873–89.
Henning, C (2012): “Choice and coercion in East Asian exchange rate regimes”, Peterson Institute for International Economics, Working Paper, no 12-15.
Lahaye, J, S Laurent and C Neely (2011): “Jumps, cojumps and macro announcements”, Journal of Applied Econometrics, no 26, pp 893–921.
Levy, D, M Bergen, S Dutta and R Venables (1997): “The magnitude of menu costs: direct evidence from large U.S. supermarket chains”, Quarterly Journal of Economics, no 112, pp 791–825.
Li, K, C Hui and T Chung (2012): “Determinants and dynamics of price disparity in onshore and offshore renminbi forward exchange rate markets”, Hong Kong Institute for Monetary Research Working Paper, no 24/2012.
Lumsdaine, R and S Ng (1999): “Testing for ARCH in the presence of a possibly misspecified conditional mean”, Journal of Econometrics, no 93, pp 257–79.
Maziad, S and J Kang (2012): “RMB internationalization: onshore/offshore links”, IMF Working Paper, WP/12/133, Washington.
McCauley, R, C Shu and G Ma (2014): “Non-deliverable forwards: 2013 and beyond”, BIS Quarterly Review, March, pp 75–88.
Mikosch, T and C Starcia (2004): “Non-stationarities in financial time series, the long-range dependence and the EGARCH effects”, Review of Economics and Statistics, no 86, pp 378–84.
Minikin, R and K Lau (2013): The offshore renminbi, John Wiley.
Pagan, A (1984): “Econometric issues in the analysis of regressions with generated regressors”, International Economic Review, no 25, pp 221–47.
Peng, W, H Miao and N Chow (2007): “Price convergence between dual-listed A and H shares”, Hong Kong Monetary Authority, China Economic Issues, no 6/07.
Shiller, R (1981): “The use of volatility measures in assessing market efficiency”, The Journal of Finance, no 36, pp 291–304.
Shu, C, N Chow and J-Y Chan (2007): “Impact of the renminbi exchange rate on Asian currencies”, China Economic Issues, no 3/07, Hong Kong Monetary Authority, January.
Shu, C, D He and X-Q Cheng (2015): “One currency, two markets: the renminbi’s growing influence in Asia-Pacific”, China Economic Review, 33 (April), pp 163-78.
Subramanian, A and M Kessler (2012): “The renminbi bloc is here: Asia down, rest of the world to go?”, Peterson Institute for International Economics, Working Paper, no 12-19.
West, K and D Cho (1995): “The predictive ability of several models of exchange rate volatility”, Journal of Econometrics, no 69, pp 367–91.
Wu, G and C Pei (2012): “Quantitative analysis of the pricing relationship between onshore and offshore renminbi exchange rates”, Finance Research, no 387, pp 45–56 (in Chinese).