Embed Size (px)
DESCRIPTION
Bisnode has prepared an analysis of wather influence on the economy. What are the losses incurred due to the high temperatures, how much the hurricane costs, what is the correlation between weather conditions and the economic situation of countries in the world and many more interesting conclusions.
Citation preview
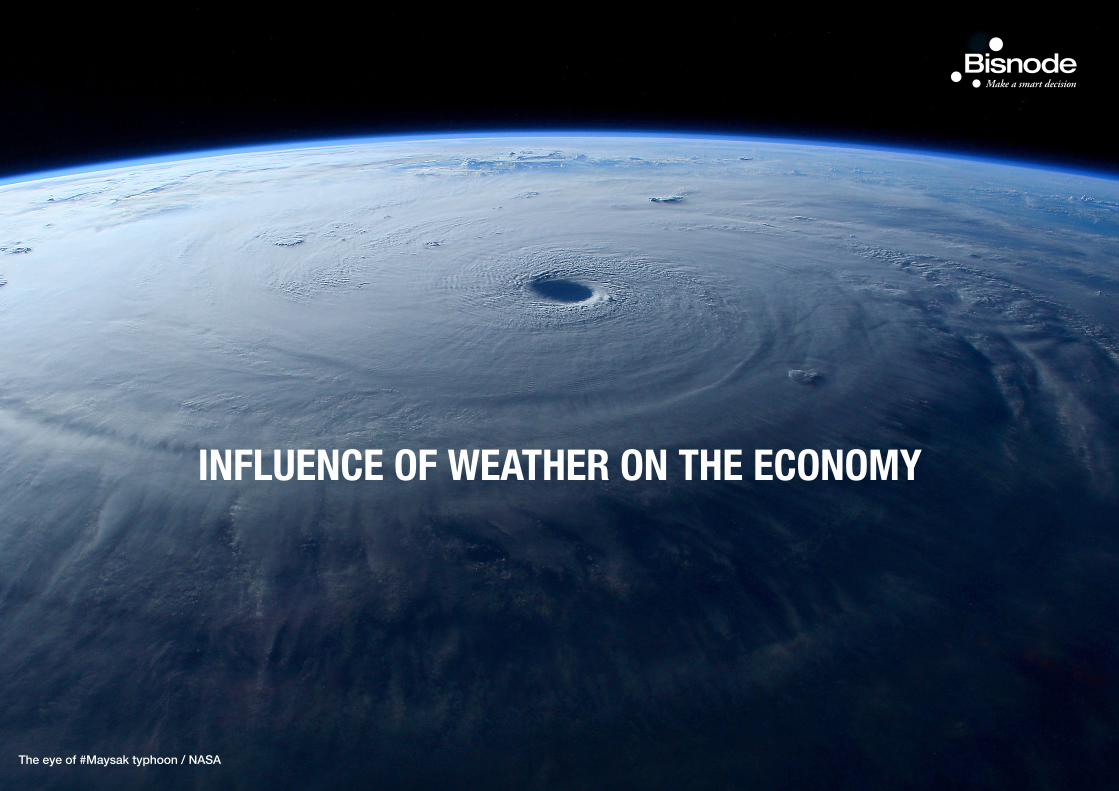
The eye of #Maysak typhoon / NASA
INFLUENCE OF WEATHER ON THE ECONOMY

We all know how the weather affects people’s mood. When it is sunny and warm, similar feeling stir in people and they start to feel happy and are in a good mood. On the other hand, people are often cranky and in a bad mood when it is gloomy and rainy outside.
This is a result of hormones affecting the human body. Melatonin levels, the hormone that causes sleepiness, rise when cloudy skies darken and this sends signals to the brain stimulating the need for sleep. The hormone serotonin has a completely opposite effect.It increases activity, gives stamina and maintains a good mood. Its levels rise according to the amount of sunlight available.
People are usually aware of this meteorological influence, but sometimes we forget that the weather can also influence the economy.Extremely bad weather may entice people to behave in an interesting way - to stockpile - which increases consumer demand, the opposite of what would be expected of bad weather. Because of this impulse for stockpiling people gather supplies and means
of protection in the event such products become unavailable in the time to come, meaning shops, hardware stores and similar businesses see a rise in business.
INTRODUCTION
AGRICULTURE TOURISM
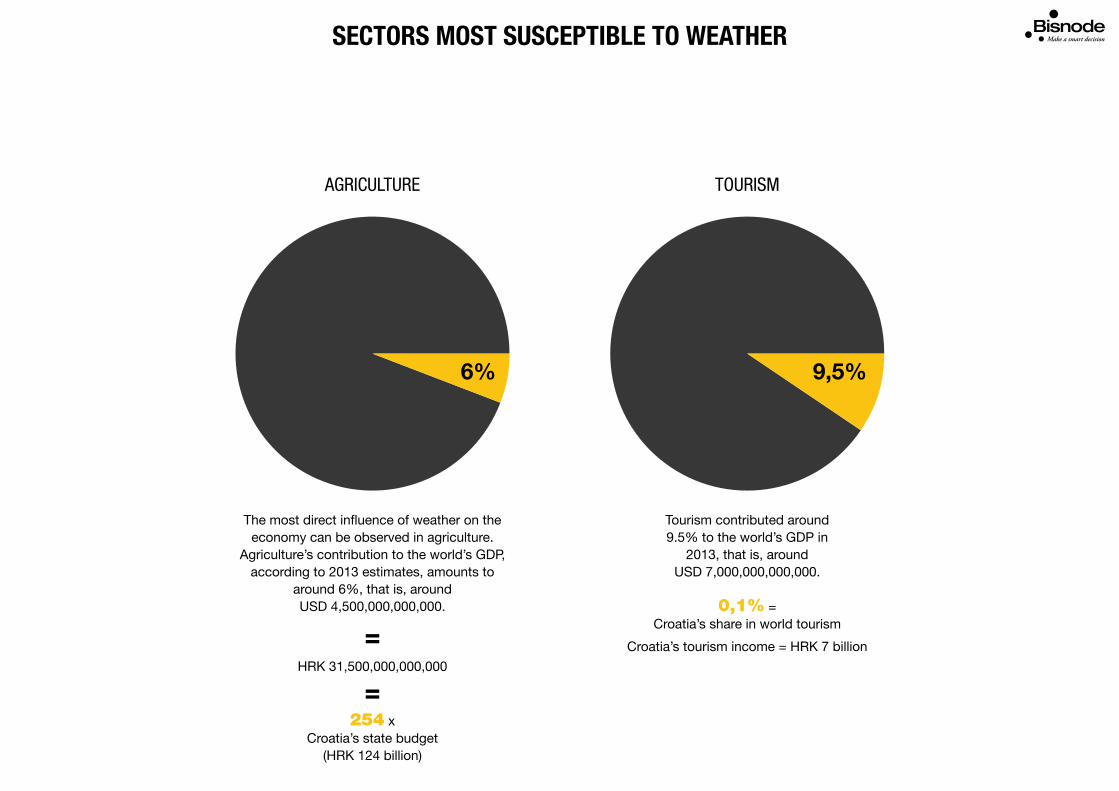
The most direct influence of weather on the economy can be observed in agriculture.
Agriculture’s contribution to the world’s GDP, according to 2013 estimates, amounts to
around 6%, that is, around USD 4,500,000,000,000.
6% 9,5%
Tourism contributed around 9.5% to the world’s GDP in
2013, that is, around USD 7,000,000,000,000.
254 x Croatia’s state budget
(HRK 124 billion)
HRK 31,500,000,000,000
0,1% =Croatia’s share in world tourism
Croatia’s tourism income = HRK 7 billion
SECTORS MOST SUSCEPTIBLE TO WEATHER
=
=
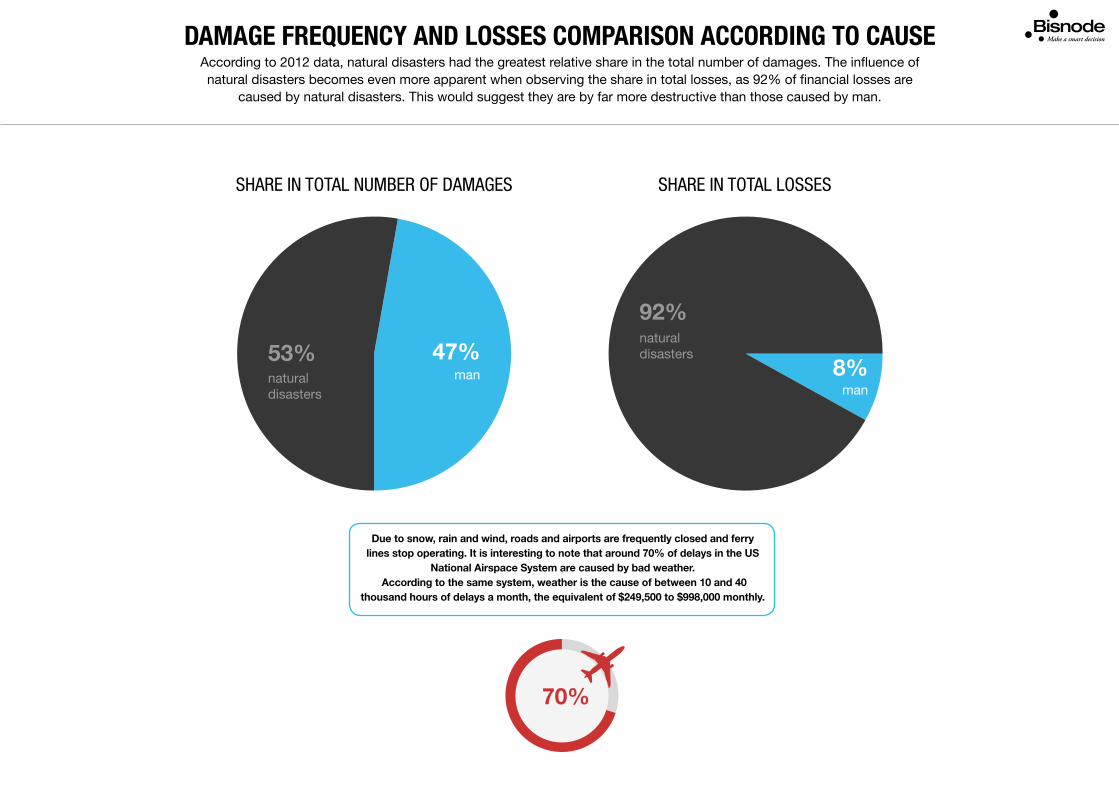
According to 2012 data, natural disasters had the greatest relative share in the total number of damages. The influence of natural disasters becomes even more apparent when observing the share in total losses, as 92% of financial losses are
caused by natural disasters. This would suggest they are by far more destructive than those caused by man.
DAMAGE FREQUENCY AND LOSSES COMPARISON ACCORDING TO CAUSE
SHARE IN TOTAL NUMBER OF DAMAGES SHARE IN TOTAL LOSSES
47%8%
53%
92%
natural disasters
natural disasters
manman
Due to snow, rain and wind, roads and airports are frequently closed and ferry lines stop operating. It is interesting to note that around 70% of delays in the US
National Airspace System are caused by bad weather. According to the same system, weather is the cause of between 10 and 40
thousand hours of delays a month, the equivalent of $249,500 to $998,000 monthly.
70%
mlrd $
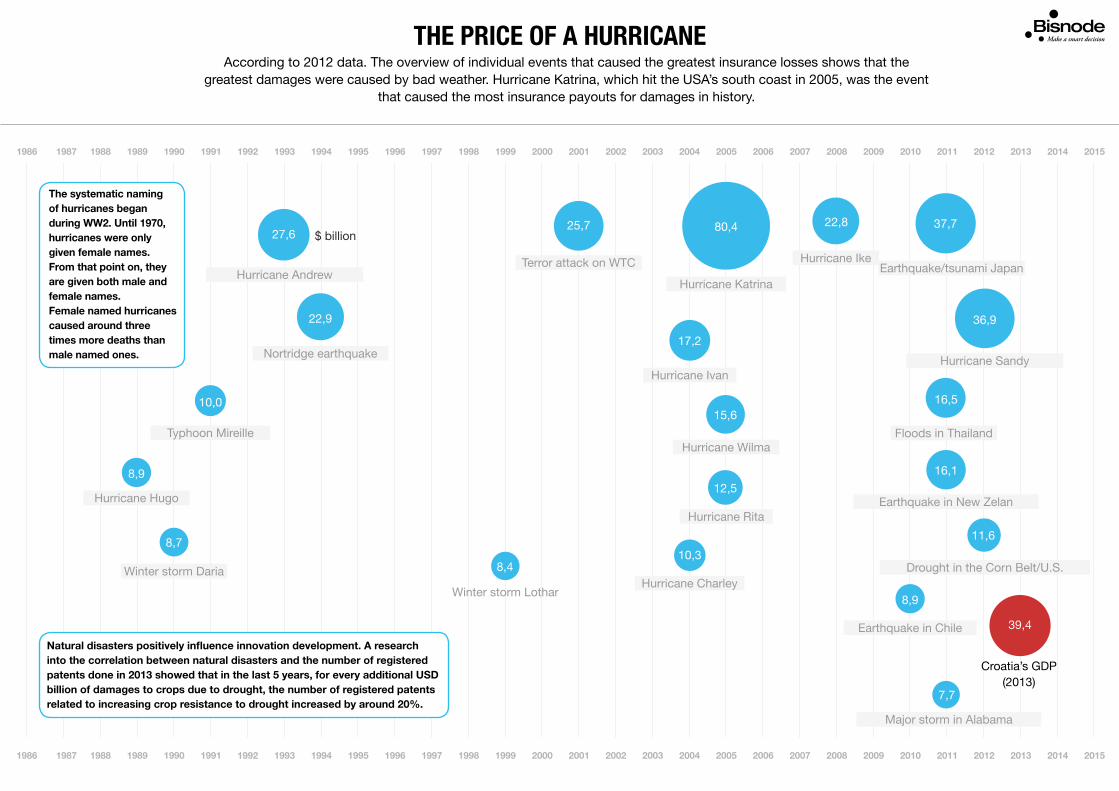
According to 2012 data. The overview of individual events that caused the greatest insurance losses shows that the greatest damages were caused by bad weather. Hurricane Katrina, which hit the USA’s south coast in 2005, was the event
that caused the most insurance payouts for damages in history.
THE PRICE OF A HURRICANE
Hurricane Katrina
80,425,7
Earthquake/tsunami Japan
Earthquake in New Zelan
Earthquake in Chile
Winter storm Daria
Croatia’s GDP (2013)
Winter storm Lothar
Major storm in Alabama
Hurricane Sandy
Hurricane AndrewTerror attack on WTC
Nortridge earthquake
Hurricane Ike
Hurricane Ivan
Hurricane Wilma
Hurricane Charley
Hurricane Hugo
Typhoon Mireille
Hurricane Rita
Drought in the Corn Belt/U.S.
Floods in Thailand
1986 1987 1988 1989 1990 1991 1992 1993 1994 1995 1996 1997 1998 1999 2000 2001 2002 2003 2004 2005 2006 2007 2008 2009 2010 2011 2012 2013 2014 2015
1986 1987 1988 1989 1990 1991 1992 1993 1994 1995 1996 1997 1998 1999 2000 2001 2002 2003 2004 2005 2006 2007 2008 2009 2010 2011 2012 2013 2014 2015
37,727,6
22,9
22,8
17,2
16,5
16,1
11,6
10,3
10,0
8,9
8,7
8,4
7,7
8,9
15,6
12,5
39,4
36,9
The systematic naming of hurricanes began during WW2. Until 1970, hurricanes were only given female names. From that point on, they are given both male and female names.Female named hurricanes caused around three times more deaths than male named ones.
Natural disasters positively influence innovation development. A research into the correlation between natural disasters and the number of registered patents done in 2013 showed that in the last 5 years, for every additional USD billion of damages to crops due to drought, the number of registered patents related to increasing crop resistance to drought increased by around 20%.
$ billion
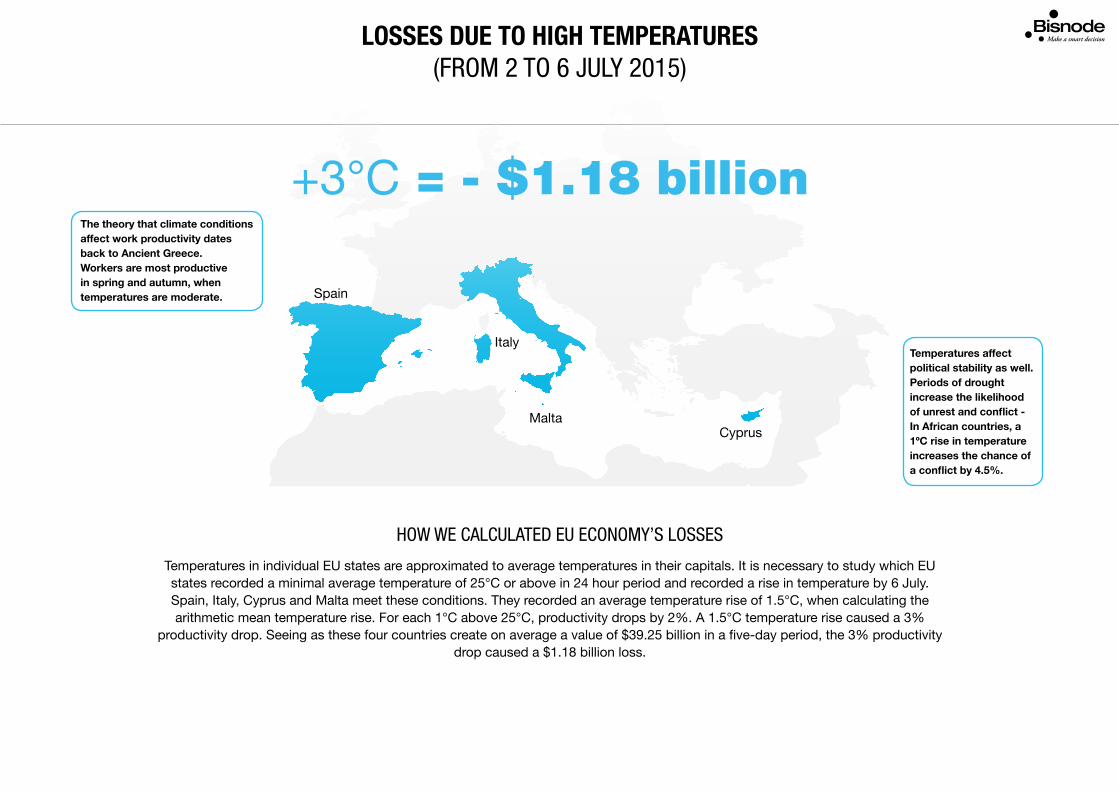
+3°C = - $1.18 billion
LOSSES DUE TO HIGH TEMPERATURES(FROM 2 TO 6 JULY 2015)
HOW WE CALCULATED EU ECONOMY’S LOSSES
Temperatures in individual EU states are approximated to average temperatures in their capitals. It is necessary to study which EU states recorded a minimal average temperature of 25°C or above in 24 hour period and recorded a rise in temperature by 6 July. Spain, Italy, Cyprus and Malta meet these conditions. They recorded an average temperature rise of 1.5°C, when calculating the arithmetic mean temperature rise. For each 1°C above 25°C, productivity drops by 2%. A 1.5°C temperature rise caused a 3%
productivity drop. Seeing as these four countries create on average a value of $39.25 billion in a five-day period, the 3% productivity drop caused a $1.18 billion loss.
Spain
Italy
MaltaCyprus
The theory that climate conditions affect work productivity dates back to Ancient Greece.Workers are most productive in spring and autumn, when temperatures are moderate.
Temperatures affect political stability as well.Periods of drought increase the likelihood of unrest and conflict - In African countries, a 1ºC rise in temperature increases the chance of a conflict by 4.5%.
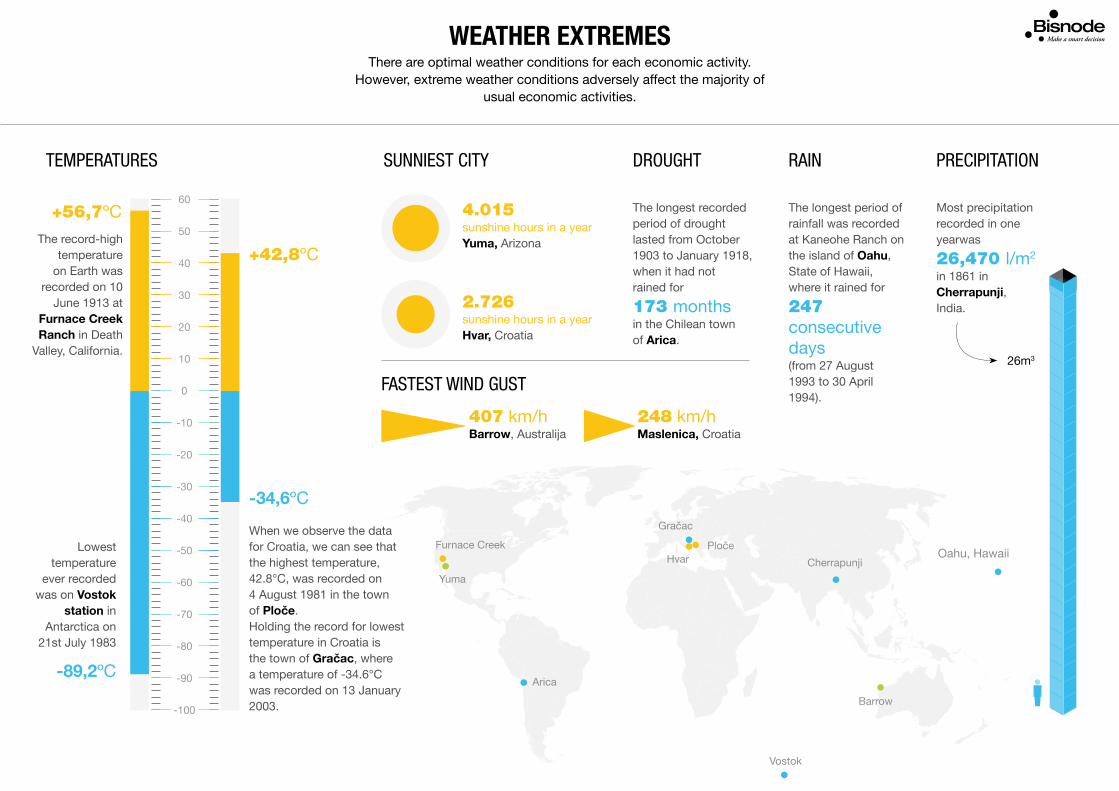
Vostok
Barrow
There are optimal weather conditions for each economic activity. However, extreme weather conditions adversely affect the majority of
usual economic activities.
WEATHER EXTREMES
TEMPERATURES
60
50
40
30
20
10
0
-10
-20
-30
-40
-50
-60
-70
-80
-90
-100
+56,7ºC
+42,8ºC
-89,2ºC
-34,6ºC
The record-high temperature
on Earth was recorded on 10
June 1913 at Furnace Creek Ranch in Death
Valley, California.
Furnace Creek
Gračac
HvarPloče
Yuma
Arica
Lowest temperature
ever recorded was on Vostok
station in Antarctica on
21st July 1983
Cherrapunji
When we observe the data for Croatia, we can see that the highest temperature, 42.8°C, was recorded on 4 August 1981 in the town of Ploče.Holding the record for lowest temperature in Croatia is the town of Gračac, where a temperature of -34.6°C was recorded on 13 January 2003.
The longest recorded period of drought lasted from October 1903 to January 1918, when it had not rained for
173 months in the Chilean town of Arica.
The longest period of rainfall was recorded at Kaneohe Ranch on the island of Oahu, State of Hawaii, where it rained for
247consecutive days(from 27 August 1993 to 30 April 1994).
Oahu, Hawaii
SUNNIEST CITY DROUGHT RAIN
4.015 sunshine hours in a yearYuma, Arizona
2.726 sunshine hours in a yearHvar, Croatia
PRECIPITATION
FASTEST WIND GUST
248 km/h Maslenica, Croatia
407 km/h Barrow, Australija
Most precipitation recorded in one yearwas
26,470 l/m2
in 1861 in Cherrapunji,India.
26m3
Earth
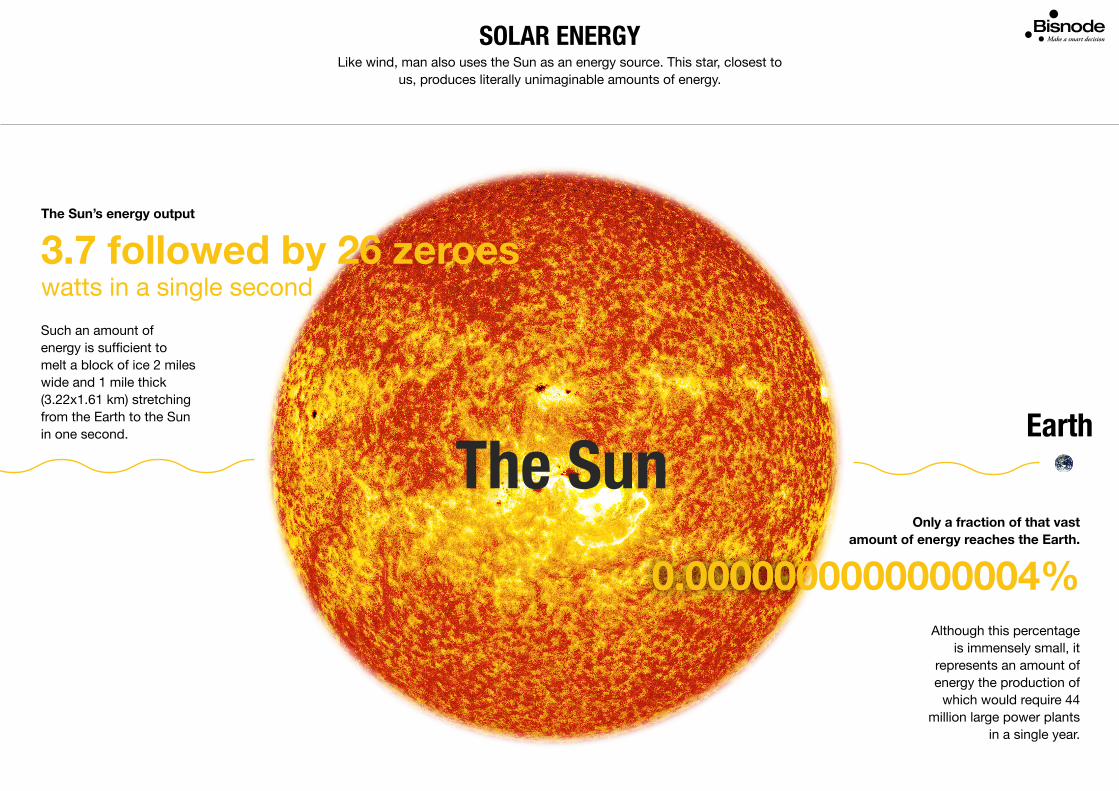
Like wind, man also uses the Sun as an energy source. This star, closest to us, produces literally unimaginable amounts of energy.
SOLAR ENERGY
The Sun’s energy output
Although this percentage is immensely small, it
represents an amount of energy the production of
which would require 44 million large power plants
in a single year.
3.7 followed by 26 zeroeswatts in a single second
Such an amount of energy is sufficient to melt a block of ice 2 miles wide and 1 mile thick (3.22x1.61 km) stretching from the Earth to the Sun in one second.
Only a fraction of that vast amount of energy reaches the Earth.
The Sun
0.000000.0000000000000004%
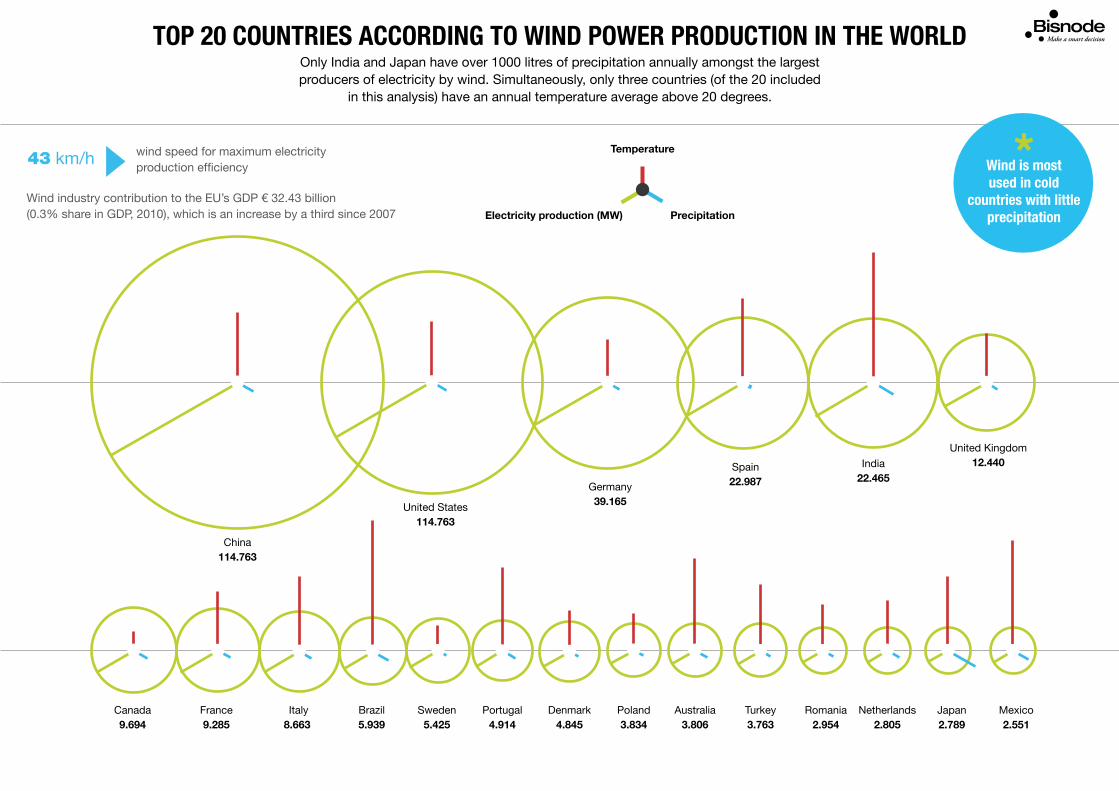
Only India and Japan have over 1000 litres of precipitation annually amongst the largest producers of electricity by wind. Simultaneously, only three countries (of the 20 included
in this analysis) have an annual temperature average above 20 degrees.
TOP 20 COUNTRIES ACCORDING TO WIND POWER PRODUCTION IN THE WORLD
China114.763
United States114.763
Germany39.165
Spain22.987
India22.465
United Kingdom12.440
Canada9.694
France9.285
Italy8.663
Brazil5.939
Sweden5.425
Portugal4.914
Denmark4.845
Poland3.834
Australia3.806
Turkey3.763
Romania2.954
Netherlands2.805
Japan2.789
Mexico2.551
Temperature
PrecipitationElectricity production (MW)
Wind is most used in cold
countries with little precipitation
Wind industry contribution to the EU’s GDP € 32.43 billion(0.3% share in GDP, 2010), which is an increase by a third since 2007
43 km/h wind speed for maximum electricity production efficiency
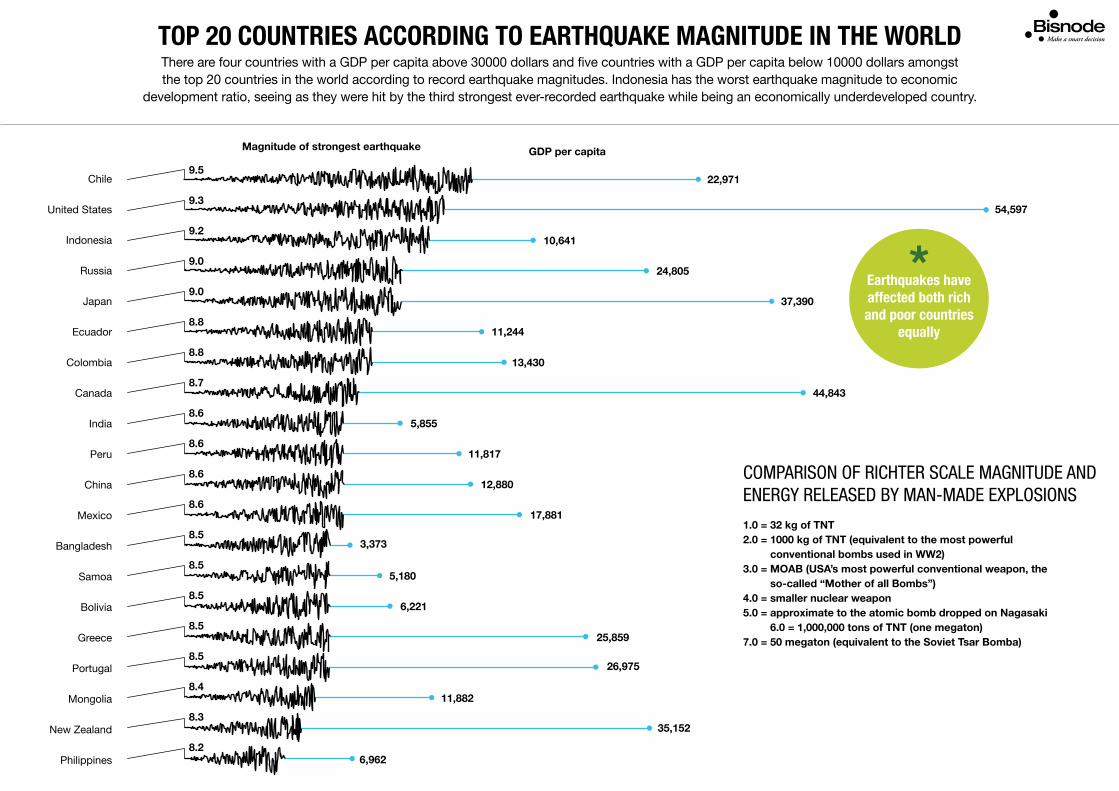
There are four countries with a GDP per capita above 30000 dollars and five countries with a GDP per capita below 10000 dollars amongst the top 20 countries in the world according to record earthquake magnitudes. Indonesia has the worst earthquake magnitude to economic
development ratio, seeing as they were hit by the third strongest ever-recorded earthquake while being an economically underdeveloped country.
TOP 20 COUNTRIES ACCORDING TO EARTHQUAKE MAGNITUDE IN THE WORLD
Earthquakes have affected both rich and poor countries
equally
Chile
United States
Indonesia
Russia
Japan
Ecuador
Colombia
Canada
India
Peru
China
Mexico
Bangladesh
Samoa
Bolivia
Greece
Portugal
Mongolia
New Zealand
Philippines
9.5
9.3
9.2
9.0
9.0
8.8
8.8
8.7
8.6
8.6
8.6
8.6
8.5
8.5
8.5
8.5
8.5
8.4
8.3
8.2
GDP per capitaMagnitude of strongest earthquake
22,971
54,597
10,641
24,805
37,390
11,244
13,430
44,843
5,855
11,817
12,880
17,881
3,373
5,180
6,221
25,859
26,975
11,882
35,152
6,962
1.0 = 32 kg of TNT2.0 = 1000 kg of TNT (equivalent to the most powerful
conventional bombs used in WW2)3.0 = MOAB (USA’s most powerful conventional weapon, the
so-called “Mother of all Bombs”)4.0 = smaller nuclear weapon5.0 = approximate to the atomic bomb dropped on Nagasaki
6.0 = 1,000,000 tons of TNT (one megaton)7.0 = 50 megaton (equivalent to the Soviet Tsar Bomba)
COMPARISON OF RICHTER SCALE MAGNITUDE ANDENERGY RELEASED BY MAN-MADE EXPLOSIONS
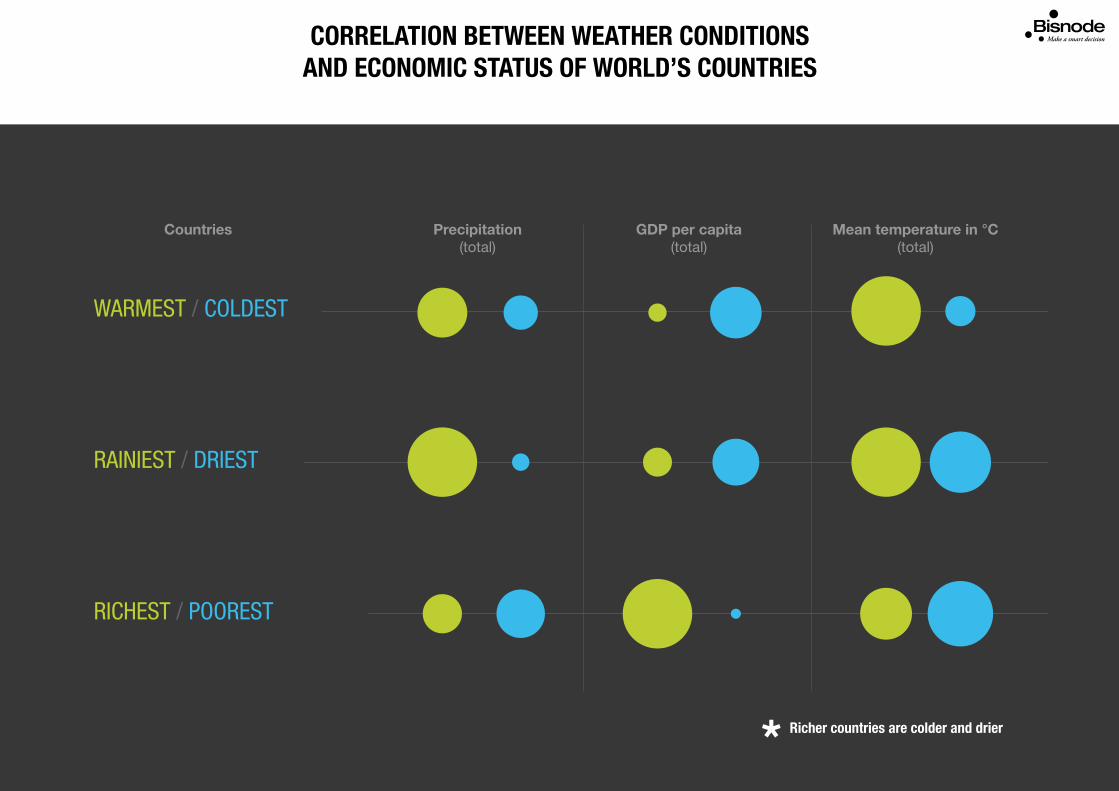
CORRELATION BETWEEN WEATHER CONDITIONSAND ECONOMIC STATUS OF WORLD’S COUNTRIES
WARMEST / COLDEST
RAINIEST / DRIEST
RICHEST / POOREST
GDP per capita(total)
Precipitation(total)
Countries Mean temperature in °C(total)
Richer countries are colder and drier
-0.6 Russia
0.2 Mongolia
2.6 Finland
3.4 Iceland
3.6 Canada
4.4 Norway
4.7 Sweden
5.5 Estonia
5.9 Kazakhstan
5.9 Belarus
6.0 Switzerland
6.0 Latvia
6.2 Slovakia
6.2 Lithuania
6.8 Czech Republic
6.9 Poland
7.0 Austria
7.2 Armenia
7.5 Denmark
7.8 Germany
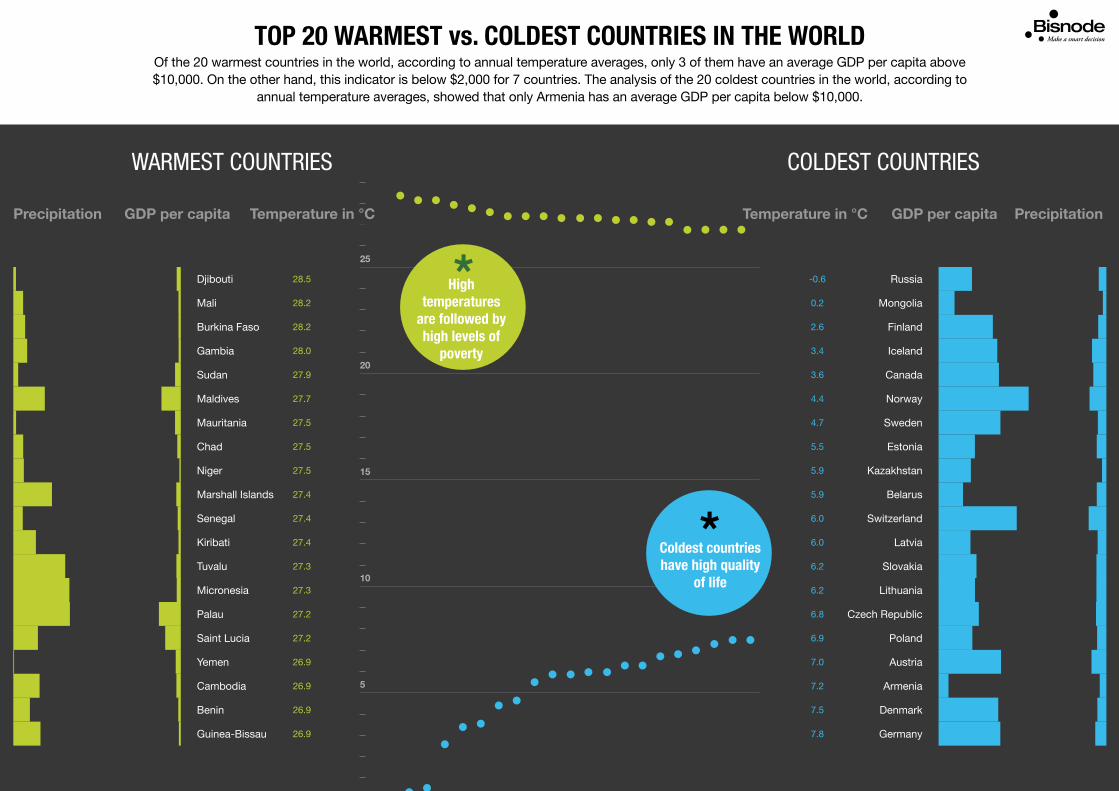
Of the 20 warmest countries in the world, according to annual temperature averages, only 3 of them have an average GDP per capita above $10,000. On the other hand, this indicator is below $2,000 for 7 countries. The analysis of the 20 coldest countries in the world, according to
annual temperature averages, showed that only Armenia has an average GDP per capita below $10,000.
TOP 20 WARMEST vs. COLDEST COUNTRIES IN THE WORLD
Djibouti 28.5
Mali 28.2
Burkina Faso 28.2
Gambia 28.0
Sudan 27.9
Maldives 27.7
Mauritania 27.5
Chad 27.5
Niger 27.5
Marshall Islands 27.4
Senegal 27.4
Kiribati 27.4
Tuvalu 27.3
Micronesia 27.3
Palau 27.2
Saint Lucia 27.2
Yemen 26.9
Cambodia 26.9
Benin 26.9
Guinea-Bissau 26.9
WARMEST COUNTRIES COLDEST COUNTRIES
GDP per capitaPrecipitation PrecipitationGDP per capitaTemperature in °C Temperature in °C
25
20
15
10
5
High temperatures
are followed by high levels of
poverty
Coldest countries have high quality
of life
21.7 Egypt
26.9 Yemen
25.5 Bahrain
26.8 Qatar
26.4 Oman
24.7 Kuwait
26.8 UAE
25.2 Saudi Arabia
15.4 Turkmenistan
28.5 Djibouti
22.6 Cape Verde
20.1 Libya
27.5 Mauritania
18.5 Jordan
22.4 Iraq
0.2 Mongolia
5.9 Kazakhstan
14.0 Uzbekistan
20.1 Namibia
27.9 Sudan
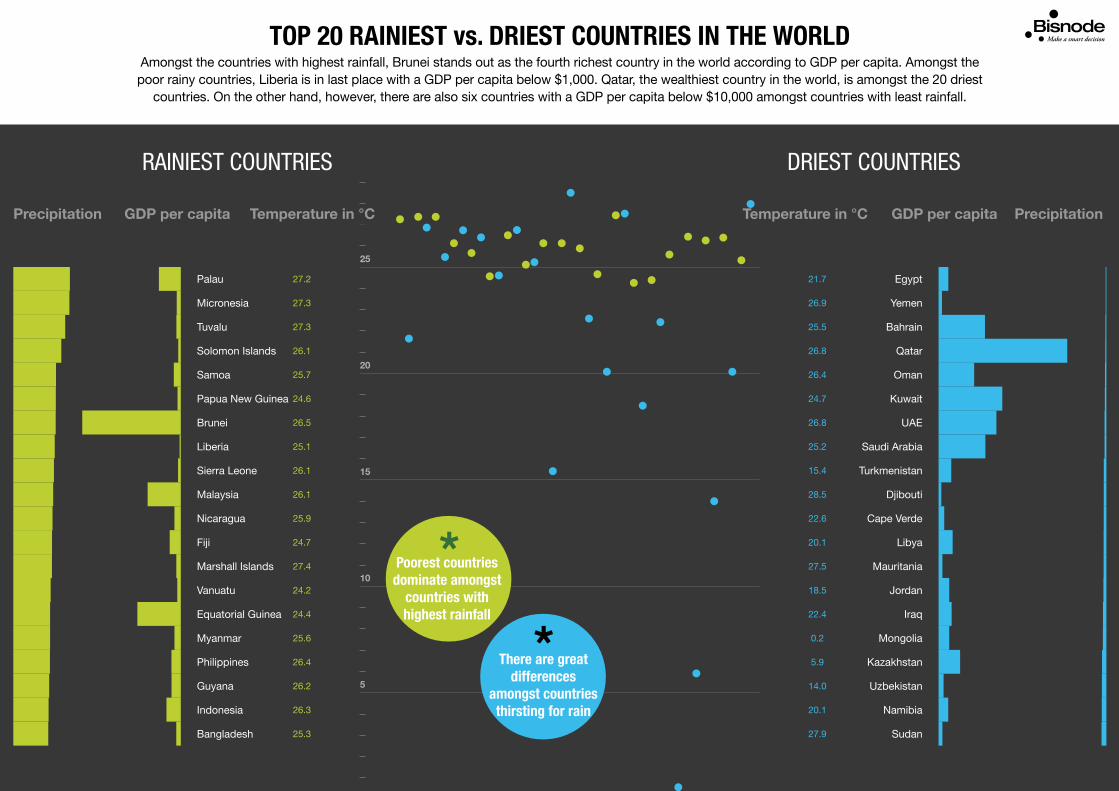
Amongst the countries with highest rainfall, Brunei stands out as the fourth richest country in the world according to GDP per capita. Amongst the poor rainy countries, Liberia is in last place with a GDP per capita below $1,000. Qatar, the wealthiest country in the world, is amongst the 20 driest
countries. On the other hand, however, there are also six countries with a GDP per capita below $10,000 amongst countries with least rainfall.
TOP 20 RAINIEST vs. DRIEST COUNTRIES IN THE WORLD
RAINIEST COUNTRIES DRIEST COUNTRIES
Palau 27.2
Micronesia 27.3
Tuvalu 27.3
Solomon Islands 26.1
Samoa 25.7
Papua New Guinea 24.6
Brunei 26.5
Liberia 25.1
Sierra Leone 26.1
Malaysia 26.1
Nicaragua 25.9
Fiji 24.7
Marshall Islands 27.4
Vanuatu 24.2
Equatorial Guinea 24.4
Myanmar 25.6
Philippines 26.4
Guyana 26.2
Indonesia 26.3
Bangladesh 25.3
25
20
15
10
5
GDP per capitaPrecipitation PrecipitationGDP per capitaTemperature in °C Temperature in °C
Poorest countries dominate amongst
countries with highest rainfall
There are great differences
amongst countries thirsting for rain
24.9 Cent. African Rep.
23.5 Congo, Dem. Rep.
21.4 Malawi
25.1 Liberia
20.0 Burundi
27.5 Niger
23.6 Mozambique
23.3 Eritrea
25.5 Guinea
26.9 Guinea-Bissau
21.8 Madagascar
26.4 Togo
23.7 Comoros
19.3 Ethiopia
28.0 Gambia, The
28.2 Burkina Faso
19.0 Rwanda
27.4 Kiribati
28.2 Mali
24.8 Haiti
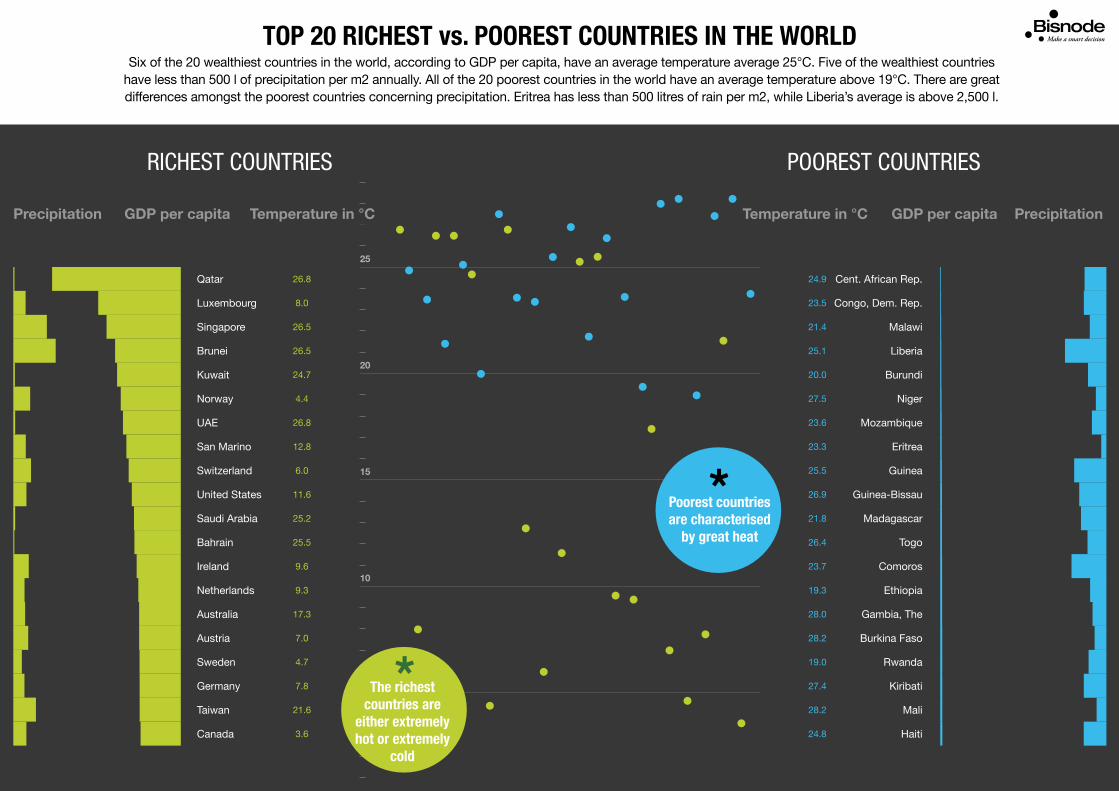
Six of the 20 wealthiest countries in the world, according to GDP per capita, have an average temperature average 25°C. Five of the wealthiest countries have less than 500 l of precipitation per m2 annually. All of the 20 poorest countries in the world have an average temperature above 19°C. There are great differences amongst the poorest countries concerning precipitation. Eritrea has less than 500 litres of rain per m2, while Liberia’s average is above 2,500 l.
TOP 20 RICHEST vs. POOREST COUNTRIES IN THE WORLD
Qatar 26.8
Luxembourg 8.0
Singapore 26.5
Brunei 26.5
Kuwait 24.7
Norway 4.4
UAE 26.8
San Marino 12.8
Switzerland 6.0
United States 11.6
Saudi Arabia 25.2
Bahrain 25.5
Ireland 9.6
Netherlands 9.3
Australia 17.3
Austria 7.0
Sweden 4.7
Germany 7.8
Taiwan 21.6
Canada 3.6
RICHEST COUNTRIES POOREST COUNTRIES
25
20
15
10
5
GDP per capitaPrecipitation PrecipitationGDP per capitaTemperature in °C Temperature in °C
The richest countries are
either extremely hot or extremely
cold
Poorest countries are characterised
by great heat

Time elf Branimir KovačićThe elf in charge is 185 cm tall and likes long, sunny days the most. When taking a break from making analyses, he
likes to eat ice cream, blue and pink one the most.
Time elf Ivan DomšićAs he was born during winter, he prefers cold, snowy days. He is 190 cm tall, weighing 105 kg and loves
chocolate ice cream. With chocolate sauce, of course. :)