Embed Size (px)
Citation preview
Bit by Bit: Tapping into Big Data
Andrea Fox, OSI Intern
Dartmouth College
3/12/2014
1
TABLE OF CONTENTS
Introduction ......................................................................................................................................2
Digital Collections and Their N-grams ............................................................................................2
Linguistic Use of N-grams ...........................................................................................................4
Cultural Use of N-grams ..............................................................................................................7
Text Mining and Beyond .................................................................................................................9
Conclusion .....................................................................................................................................11
References ......................................................................................................................................12
Further Reading .............................................................................................................................15
2
INTRODUCTION
Whether one sees it as a tool for scholarship or as a new science in itself, “big data” is booming.
Individuals and institutions who contribute to the stock of digitized texts are also developing
methods for its study, and publicly available programs for computational analysis now allow
even the amateur user to parse data. In the last ten years Google Books has digitized 30 million
volumes, an amount rivalling the Library of Congress’ physical collection of 36 million
(Eichenlaub; “Fascinating Facts”). In the big data pond, however, the biggest fish do not subdue
the smaller.
Beginning with the Google Ngram Viewer—a tool developed at Harvard that graphs the
statistics of Google Books—this report summarizes how digitized texts are made accessible and
how researchers find answers among the data with machine-scale analysis (Google). Their
methods include superficial n-gram searches that track when words appear in a collection over
time, as well as the mining of texts for deeper trends with techniques such as topic modeling.
DIGITAL COLLECTIONS AND THEIR N-GRAMS
In creating the first version of the Ngram Viewer in 2010, a team worked with Google to recast
over 500 billion words into n-grams, each consisting of n sets of successive characters (Michel).
For example, 3.14 and chocolaty would be 1-grams, whole milk a 2-gram, Little Miss Muffet a 3-
gram, etc. Google structured its corpus in 1- to 5-grams, creating “a shadow dataset” with tallies
for each n-gram that trace when and at what rate it pops up in the texts (Aiden 65). The texts
themselves, 5 million of Google’s most well digitized books, are under copyright and
unavailable to the public. We do know they span eight languages and date back to the early
1500s.
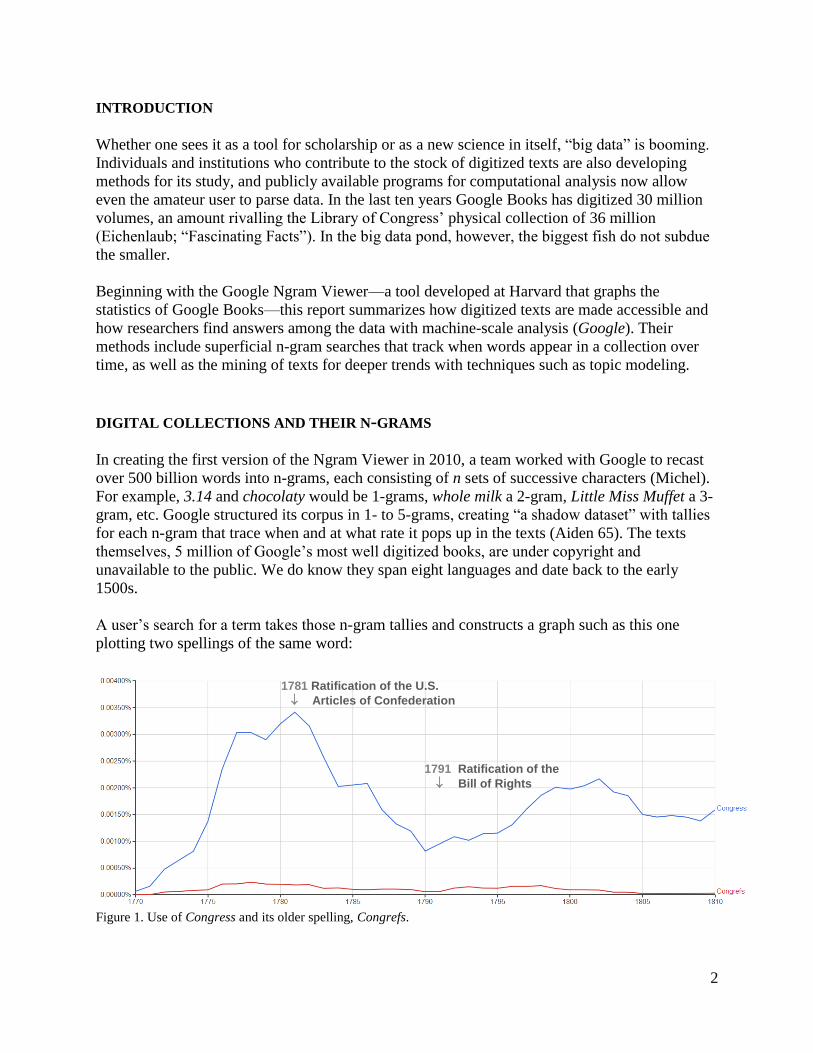
A user’s search for a term takes those n-gram tallies and constructs a graph such as this one
plotting two spellings of the same word:
Figure 1. Use of Congress and its older spelling, Congrefs.
1781 Ratification of the U.S.
Articles of Confederation
1791 Ratification of the
Bill of Rights
3
The user can adjust the start and end year of the search and choose from more than twenty
corpora that are, for the most part, divided by language. The comparison above shows how the
archaic Congrefs appears at a low percentage beside its newer spelling, highlighting an issue
with the blanket approach to textual analysis. Google has adjusted its Optical Character
Recognition (OCR), the process of making text machine-readable, to interpret the outdated
character ſ (the long s) as s rather than f. Nevertheless, several a ferpent can be seen slithering in
and out beneath the serpents of the pre-1800 era, after which the custom started to fade (“FAQ”).
Even without such orthographic oddities, however, OCR software may not properly scan a word.
The flaws may be minor, but the user would still prefer to know if the Linco1ns did not make it
onto the graph of Lincolns (Torget).
False dating also skews results. If an n-gram peak occurs long before expected, the system has
most likely tagged a book with the wrong publication date or supplied a default year of, say, the
nearest decade or century, for an unknown date.
Though some have bashed Google Books’ metadata precision, the company’s OCR leads in the
field and provides good reliability considering the bulk of its texts (Nunberg). Those behind the
Google Ngram Viewer have collaborated on a similar visualization tool, bookworm, that allows
n-gram searches of more workable corpora (bookworm, “Google N-gram”). In contrast to
Google, a bookworm graph provides access to the original context of the n-gram. The user can
click through to read a congressional bill, an academic article from the Cornell University
Library, or even a page from a pre-1923 newspaper in the Library of Congress’ Chronicling
America collection.
Full-access viewers like bookworm ChronAm may not provide the sweeping results of Google’s,
but each hit leads the researcher to original material and perhaps new insights. The isolating
nature of the n-gram search that makes it invaluable to the researcher, however, can also isolate
texts sharing a common theme but not containing the given search word. As most n-gram
viewers do not include subject descriptors for their texts, documents concerning tigresses,
ocelots, or tabbies but not mentioning cats would be lost in a broader search. The user can mimic
concept searching by entering these subcategories, but viewers limit the number of entries.
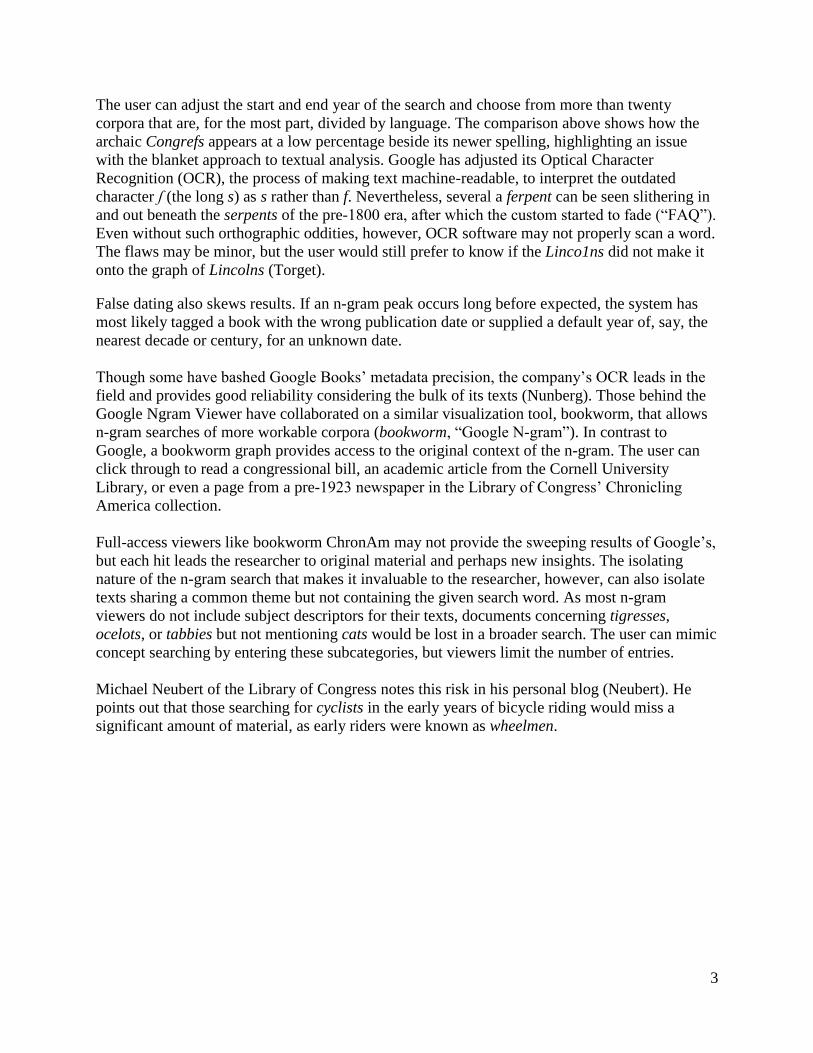
Michael Neubert of the Library of Congress notes this risk in his personal blog (Neubert). He
points out that those searching for cyclists in the early years of bicycle riding would miss a
significant amount of material, as early riders were known as wheelmen.
4
Figure 2. Recreation of Michael Neubert’s graph showing the use of wheelman/men versus (bi)cyclist.
Even with one’s wheelmen and Congrefses in a row, there is no avoiding the broader limitations
of a viewer like Google’s that bars access to source material. Without knowing the books’
origins, one may not be able to determine if a term on the rise is enjoying more public attention
or simply greater popularity among librarians who single out the books (“FAQ”). Nevertheless,
the rise of n-gram viewers affords researchers novel ways to put words to good use.
The Google team defines two categories of use: linguistic and cultural.
LINGUISTIC USE OF N-GRAMS
At first glance, n-gram viewers may seem better suited to purely linguistic research. Google’s
researchers, for instance, having sampled their multibillion-word corpus and estimated the
number of words in English, present a method that could help lexicographers identify “lexical
‘dark matter’” that does not appear in any dictionary. They also examine verb regularization, a
patternless process in which a verb’s regular past tense (such as chided) overtakes the irregular
form (chid).
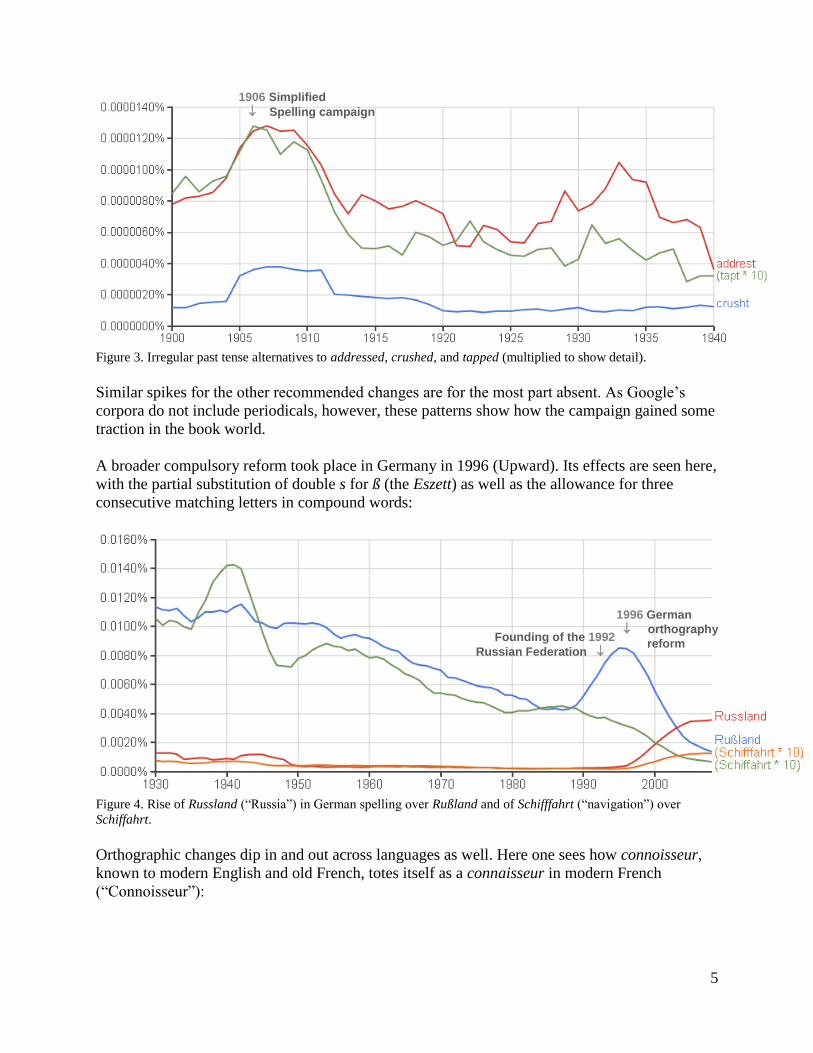
Following the Google team’s lead, one can track this change in tense not only by verb but also
by event. In 1906 the short-lived Simplified Spelling Board distributed a list of simplified forms
to be adopted by the American public (“Start the Campaign”). Three verbs from their list show
an uptick around that time:
5
Figure 3. Irregular past tense alternatives to addressed, crushed, and tapped (multiplied to show detail).
Similar spikes for the other recommended changes are for the most part absent. As Google’s
corpora do not include periodicals, however, these patterns show how the campaign gained some
traction in the book world.
A broader compulsory reform took place in Germany in 1996 (Upward). Its effects are seen here,
with the partial substitution of double s for ß (the Eszett) as well as the allowance for three
consecutive matching letters in compound words:
Figure 4. Rise of Russland (“Russia”) in German spelling over Rußland and of Schifffahrt (“navigation”) over
Schiffahrt.
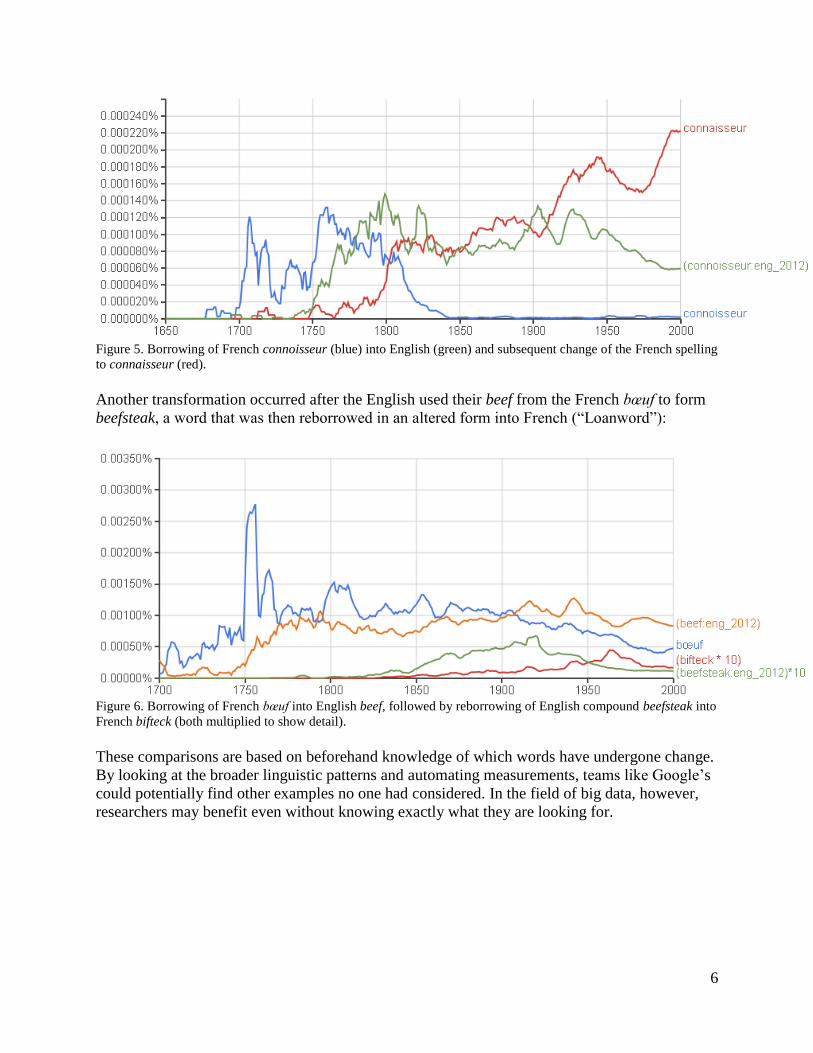
Orthographic changes dip in and out across languages as well. Here one sees how connoisseur,
known to modern English and old French, totes itself as a connaisseur in modern French
(“Connoisseur”):
1906 Simplified
Spelling campaign
1996 German
orthography
reform
Founding of the 1992
Russian Federation
6
Figure 5. Borrowing of French connoisseur (blue) into English (green) and subsequent change of the French spelling
to connaisseur (red).
Another transformation occurred after the English used their beef from the French bœuf to form
beefsteak, a word that was then reborrowed in an altered form into French (“Loanword”):
Figure 6. Borrowing of French bœuf into English beef, followed by reborrowing of English compound beefsteak into
French bifteck (both multiplied to show detail).
These comparisons are based on beforehand knowledge of which words have undergone change.
By looking at the broader linguistic patterns and automating measurements, teams like Google’s
could potentially find other examples no one had considered. In the field of big data, however,
researchers may benefit even without knowing exactly what they are looking for.
7
CULTURAL USE OF N-GRAMS
“Culturomics”—the Google team’s term for gathering data on a large scale and combing it for
insights on history and culture—may prove itself as an increasingly reliable tool that speeds and
enriches research. In using it to measure differences and trends, one can standardize the process
of comparison to bring up undiscovered matches.
The researchers at Google took this next step with a simple benchmark. Looking at the German
corpus, they compared the n-gram frequencies of writers’ names between 1933 and 1945 with
their frequencies in the years before and after that period. The results yield a “suppression index”
that indicates probable censorship. Among the ten percent of people whose popularity remained
stable in English but plunged in German during the Nazi regime are Pablo Picasso and Walter
Gropius. Several Nazi officials enjoyed a propaganda-fed boost in ratings.
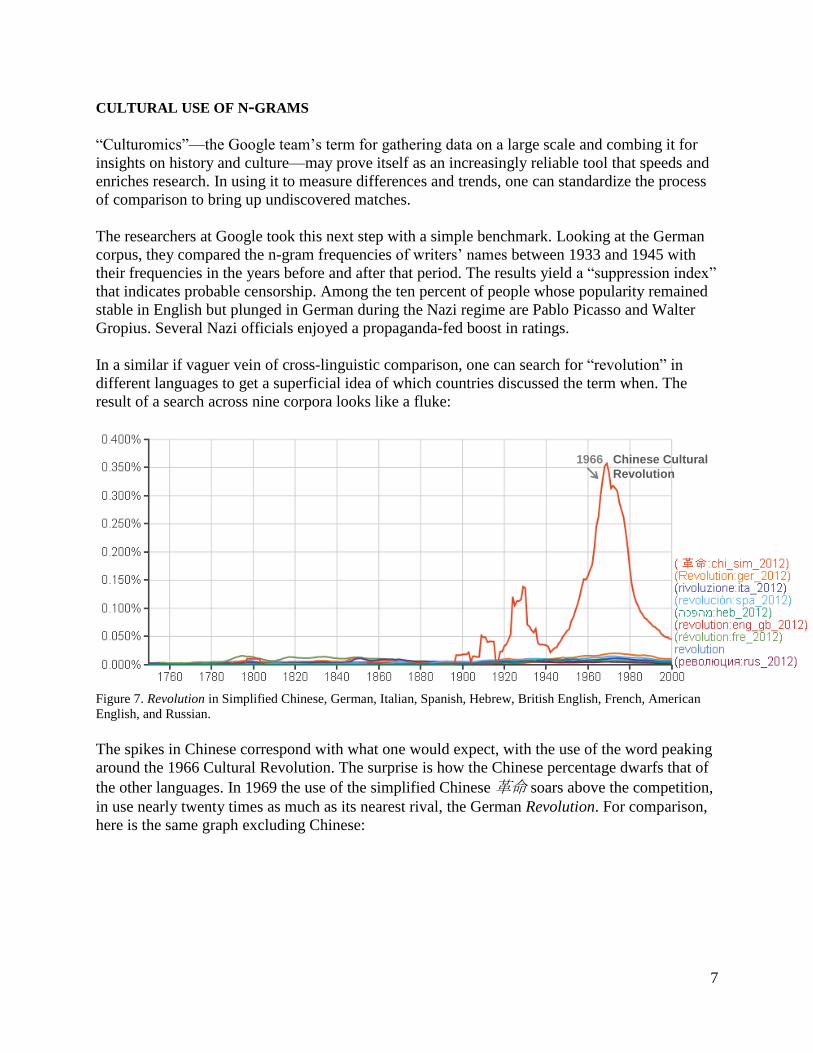
In a similar if vaguer vein of cross-linguistic comparison, one can search for “revolution” in
different languages to get a superficial idea of which countries discussed the term when. The
result of a search across nine corpora looks like a fluke:
Figure 7. Revolution in Simplified Chinese, German, Italian, Spanish, Hebrew, British English, French, American
English, and Russian.
The spikes in Chinese correspond with what one would expect, with the use of the word peaking
around the 1966 Cultural Revolution. The surprise is how the Chinese percentage dwarfs that of
the other languages. In 1969 the use of the simplified Chinese 革命 soars above the competition,
in use nearly twenty times as much as its nearest rival, the German Revolution. For comparison,
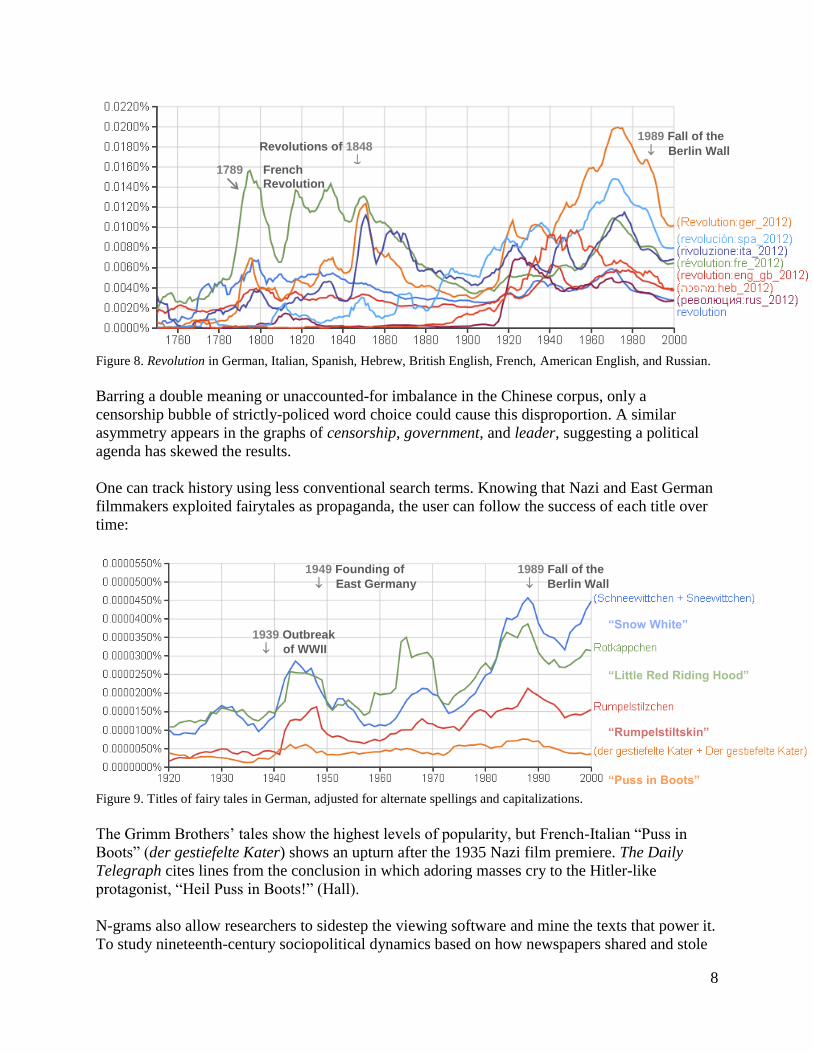
here is the same graph excluding Chinese:
1966 Chinese Cultural
Revolution
8
Figure 8. Revolution in German, Italian, Spanish, Hebrew, British English, French, American English, and Russian.
Barring a double meaning or unaccounted-for imbalance in the Chinese corpus, only a
censorship bubble of strictly-policed word choice could cause this disproportion. A similar
asymmetry appears in the graphs of censorship, government, and leader, suggesting a political
agenda has skewed the results.
One can track history using less conventional search terms. Knowing that Nazi and East German
filmmakers exploited fairytales as propaganda, the user can follow the success of each title over
time:
Figure 9. Titles of fairy tales in German, adjusted for alternate spellings and capitalizations.
The Grimm Brothers’ tales show the highest levels of popularity, but French-Italian “Puss in
Boots” (der gestiefelte Kater) shows an upturn after the 1935 Nazi film premiere. The Daily
Telegraph cites lines from the conclusion in which adoring masses cry to the Hitler-like
protagonist, “Heil Puss in Boots!” (Hall).
N-grams also allow researchers to sidestep the viewing software and mine the texts that power it.
To study nineteenth-century sociopolitical dynamics based on how newspapers shared and stole
“Snow White”
“Little Red Riding Hood”
“Rumpelstiltskin”
“Puss in Boots”
1939 Outbreak
of WWII
1949 Founding of 1989 Fall of the
East Germany Berlin Wall
Revolutions of 1848
1789 French Revolution
1989 Fall of the
Berlin Wall
9
content, professors at Northeastern University scoured the Chronicling America collection for
stories, poems, and reports that editors recycled without permission (Smith). They found
probable matches by arranging documents in the form of n-grams and seeing which n-grams of a
certain size “shingle,” or overlap. Fixing the length of the n-gram and the number of times it
must appear in the corpus to register (for instance, 5-grams that occur fewer than 100 times)
helps to single out pieces with longer strings of words in common. It also prevents too many
matching texts that differ slightly due to edits or OCR errors from slipping through the filter.
It turns out nineteenth-century editors churned out chart-toppers like James Buchanan’s
Inaugural Address, a piece by Edward Bulwer-Lytton contemplating the passing beauty of a
“rainbow and clouds,” the treaty declaring peace after the Mexican-American War, and a
clothing starch recipe (Okrent). Readers may have also frequently come across Washington’s
Farewell Address, excerpts of which fit well with the antebellum discourse on sectionalism.
These samples represent just a few of the findings that shed light on the journalistic web of
influence in nineteenth-century America. In an interview with the National Endowment for the
Humanities, project director Ryan Cordell speaks about researchers’ emerging ability to
“uncover system-wide phenomena” that escape notice issue by issue (Collins). His team has
developed maps that show which newspapers served as the hubs of certain “viral texts,”
including those in cities not commonly noted. The public will soon have the chance to explore a
database of reprinted texts, and further notes on the political preferences of certain publishers
could add depth to analysis. With this tool Cordell hopes to spare researchers “many lifetimes”
of rifling and clicking through old pages. Other teams foresee the same, though their projects
depart from n-grams into the broader realm of text mining.
TEXT MINING AND BEYOND
To get the big ideas out of big data, researchers at Virginia Tech went to Chronicling America’s
newspapers to study how reporters handled the Spanish flu pandemic of 1918 (Ewing). The team
relied on topic modeling, a technique that recognizes distinct “topics,” each with its own cluster
of related words, based on the likelihood of these words appearing near one another. Working off
of hand-corrected data and pre-determined topics like flu, influenza, and epidemic, these
algorithms pinpointed different stages of coverage, each characterized by its word clusters.
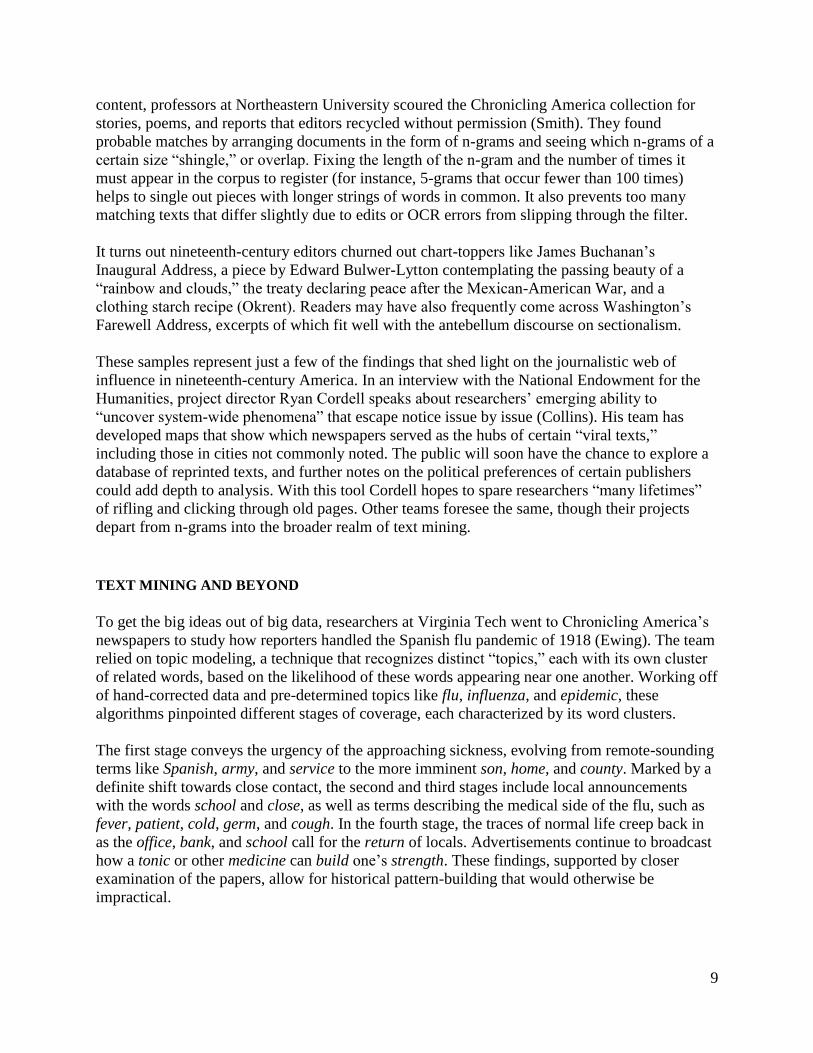
The first stage conveys the urgency of the approaching sickness, evolving from remote-sounding
terms like Spanish, army, and service to the more imminent son, home, and county. Marked by a
definite shift towards close contact, the second and third stages include local announcements
with the words school and close, as well as terms describing the medical side of the flu, such as
fever, patient, cold, germ, and cough. In the fourth stage, the traces of normal life creep back in
as the office, bank, and school call for the return of locals. Advertisements continue to broadcast
how a tonic or other medicine can build one’s strength. These findings, supported by closer
examination of the papers, allow for historical pattern-building that would otherwise be
impractical.
10
Mapping Texts, a project of the University of North Texas and Stanford, harnesses pages from
Chronicling America into two visualization tools that let users track linguistic patterns and
variations in the digitization quality of Texas newspapers dating from 1829 to 2008 (“Home”).
The team ran basic tests on the corpus using University of Massachusetts Amherst’s topic
modeling program, MALLET (MAchine Learning for LanguagE Toolkit) (Torget). As expected,
they found many references to the cotton trade, including grading terms like good, middling, and
ordinary, as well as Liverpool, a common overseas destination. One cluster, houston april
general hero san, took a historian to identify as the Battle of San Jacinto of 1836. The topic
appeared in newspapers between 1865 and 1901, challenging the long-held belief that Texans did
not widely discuss the concluding battle of the Texas Revolution until the twentieth century.
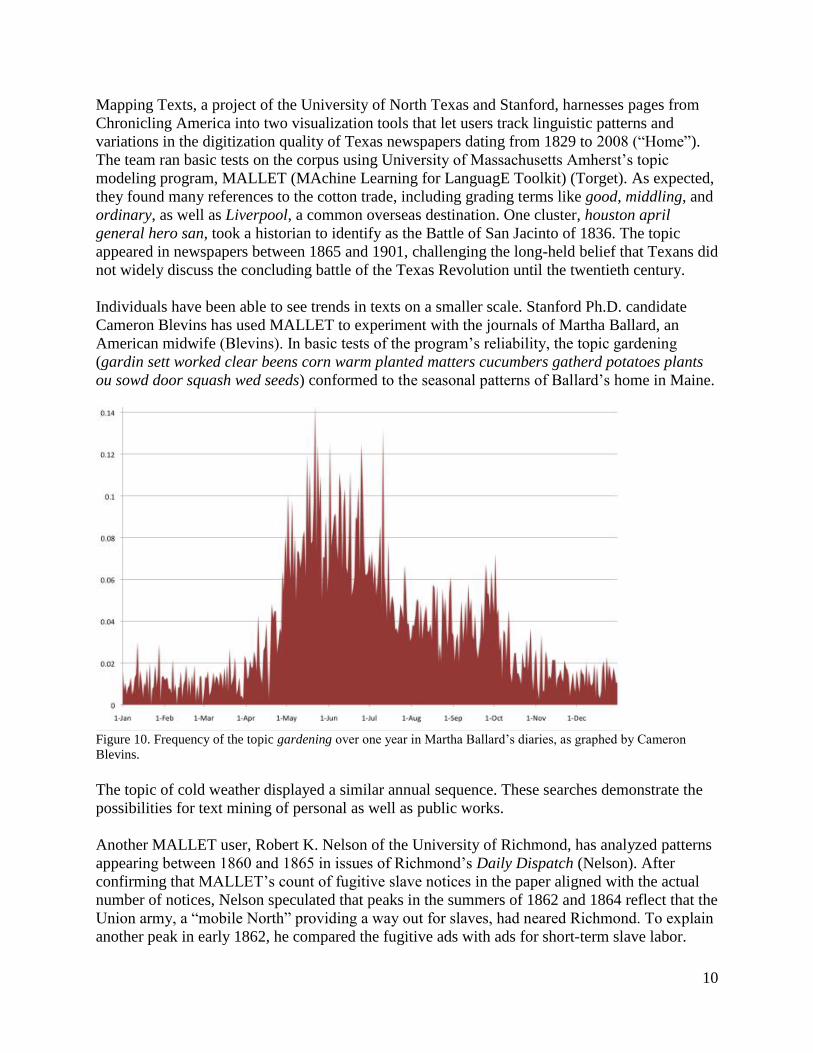
Individuals have been able to see trends in texts on a smaller scale. Stanford Ph.D. candidate
Cameron Blevins has used MALLET to experiment with the journals of Martha Ballard, an
American midwife (Blevins). In basic tests of the program’s reliability, the topic gardening
(gardin sett worked clear beens corn warm planted matters cucumbers gatherd potatoes plants
ou sowd door squash wed seeds) conformed to the seasonal patterns of Ballard’s home in Maine.
Figure 10. Frequency of the topic gardening over one year in Martha Ballard’s diaries, as graphed by Cameron
Blevins.
The topic of cold weather displayed a similar annual sequence. These searches demonstrate the
possibilities for text mining of personal as well as public works.
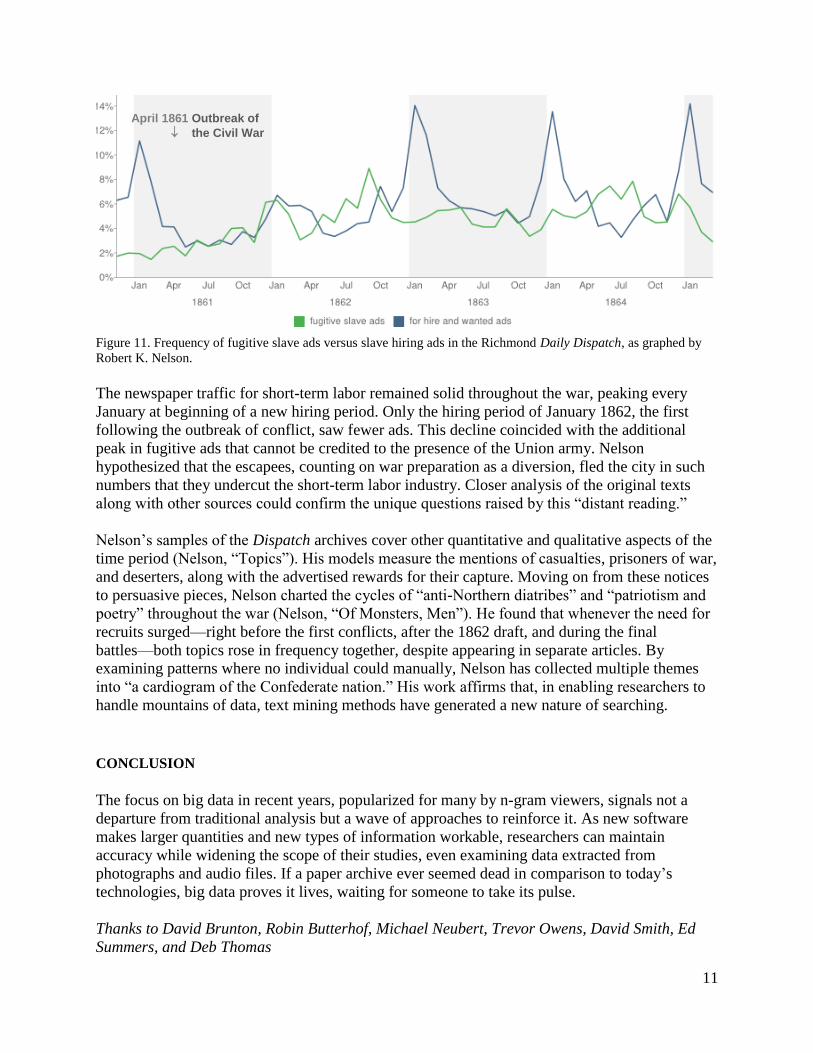
Another MALLET user, Robert K. Nelson of the University of Richmond, has analyzed patterns
appearing between 1860 and 1865 in issues of Richmond’s Daily Dispatch (Nelson). After
confirming that MALLET’s count of fugitive slave notices in the paper aligned with the actual
number of notices, Nelson speculated that peaks in the summers of 1862 and 1864 reflect that the
Union army, a “mobile North” providing a way out for slaves, had neared Richmond. To explain
another peak in early 1862, he compared the fugitive ads with ads for short-term slave labor.
11
Figure 11. Frequency of fugitive slave ads versus slave hiring ads in the Richmond Daily Dispatch, as graphed by
Robert K. Nelson.
The newspaper traffic for short-term labor remained solid throughout the war, peaking every
January at beginning of a new hiring period. Only the hiring period of January 1862, the first
following the outbreak of conflict, saw fewer ads. This decline coincided with the additional
peak in fugitive ads that cannot be credited to the presence of the Union army. Nelson
hypothesized that the escapees, counting on war preparation as a diversion, fled the city in such
numbers that they undercut the short-term labor industry. Closer analysis of the original texts
along with other sources could confirm the unique questions raised by this “distant reading.”
Nelson’s samples of the Dispatch archives cover other quantitative and qualitative aspects of the
time period (Nelson, “Topics”). His models measure the mentions of casualties, prisoners of war,
and deserters, along with the advertised rewards for their capture. Moving on from these notices
to persuasive pieces, Nelson charted the cycles of “anti-Northern diatribes” and “patriotism and
poetry” throughout the war (Nelson, “Of Monsters, Men”). He found that whenever the need for
recruits surged—right before the first conflicts, after the 1862 draft, and during the final
battles—both topics rose in frequency together, despite appearing in separate articles. By
examining patterns where no individual could manually, Nelson has collected multiple themes
into “a cardiogram of the Confederate nation.” His work affirms that, in enabling researchers to
handle mountains of data, text mining methods have generated a new nature of searching.
CONCLUSION
The focus on big data in recent years, popularized for many by n-gram viewers, signals not a
departure from traditional analysis but a wave of approaches to reinforce it. As new software
makes larger quantities and new types of information workable, researchers can maintain
accuracy while widening the scope of their studies, even examining data extracted from
photographs and audio files. If a paper archive ever seemed dead in comparison to today’s
technologies, big data proves it lives, waiting for someone to take its pulse.
Thanks to David Brunton, Robin Butterhof, Michael Neubert, Trevor Owens, David Smith, Ed
Summers, and Deb Thomas
April 1861 Outbreak of
the Civil War
12
REFERENCES
Aiden, Erez, and Jean-Baptiste Michel. Uncharted: Big Data as a Lens on Human Culture. New
York: Riverhead, 2013. Print.
“Assessing Digitization Quality: Scans of Texas Newspapers, 1829-2008.” Map. Mapping Texts.
Stanford and the U of North Texas, n.d. Web. 4 Mar. 2014.
<http://mappingtexts.org/quality/>.
“Assessing Language Patterns: A Look At Texas Newspapers, 1829-2008.” Map. Mapping
Texts. Stanford and the U of North Texas, n.d. Web. 4 Mar. 2014.
<http://language.mappingtexts.org/>.
Blevins, Cameron. “Topic Modeling Martha Ballard’s Diary.” historying. N.p., 1 Apr. 2010.
Web. 4 Mar. 2014. <http://historying.org/2010/04/01/>.
bookworm ChronAm. Harvard Cultural Observatory and Open Science Data Cloud, n.d. Web. 4
Mar. 2014. <http://arxiv.culturomics.org/ChronAm/>.
Collins, Perry. “ODH Project Director Q&A: Ryan Cordell.” National Endowment for the
Humanities. NEH, 29 July 2013. Web. 4 Mar. 2014.
<http://www.neh.gov/divisions/odh/featured-project/odh-project-director-qa-ryan-
cordell>.
“Connoisseur.” Merriam-Webster. N.p.: n.p., 2014. Merriam-Webster. Web. 4 Mar. 2014.
<http://www.merriam-webster.com/dictionary/connoisseur>.
Eichenlaub, Naomi. “Checking In With Google Books, HathiTrust, and the DPLA.” Computers
in Libraries Nov. 2013: 4-9. Information Today, Inc. Web. 4 Mar. 2014.
<http://www.infotoday.com/cilmag/nov13/Eichenlaub--Checking-In-With-Google-
Books.shtml>.
Ewing, E. Thomas, et al. “Mining Coverage of the Flu: Big Data’s Insights into an Epidemic.”
Perspectives on History Jan. 2014: n. pag. American Historical Association. Web. 4 Mar.
2014. <http://www.historians.org/publications-and-directories/perspectives-on-
history/january-2014/mining-coverage-of-the-flu-big-data%E2%80%99s-insights-into-
an-epidemic>.
“FAQ.” Culturomics. Google, n.d. Web. 4 Mar. 2014.
<http://www.culturomics.org/Resources/faq>.
“Fascinating Facts.” Library of Congress. Library of Congress, n.d. Web. 4 Mar. 2014.
<http://www.loc.gov/about/facts.html>.
“Figure 1.” Google Ngram Viewer. Google, n.d. Web. 4 Mar. 2014.
< http://tinyurl.com/nms2wmr>.
13
“Figure 3.” Google Ngram Viewer. Google, n.d. Web. 4 Mar. 2014.
< http://tinyurl.com/okpejsq>.
“Figure 4.” Google Ngram Viewer. Google, n.d. Web. 4 Mar. 2014.
< http://tinyurl.com/nzlutob>.
“Figure 5.” Google Ngram Viewer. Google, n.d. Web. 4 Mar. 2014.
< http://tinyurl.com/qfc8byj>.
“Figure 6.” Google Ngram Viewer. Google, n.d. Web. 4 Mar. 2014.
< http://tinyurl.com/q6vkcr2>.
“Figure 7.” Google Ngram Viewer. Google, n.d. Web. 4 Mar. 2014.
< http://tinyurl.com/qex586y>.
“Figure 8.” Google Ngram Viewer. Google, n.d. Web. 4 Mar. 2014.
< http://tinyurl.com/opxqlxs>.
“Figure 9.” Google Ngram Viewer. Google, n.d. Web. 4 Mar. 2014.
< http://tinyurl.com/pf3w7aw>.
“Google N-gram Viewer.” Culturomics. Google, n.d. Web. 4 Mar. 2014.
<http://www.culturomics.org/Resources/A-users-guide-to-culturomics>.
Google Ngram Viewer. Google, 2013. Web. 4 Mar. 2014.
<https://books.google.com/ngrams/info>.
Hall, Allan. “Nazi fairy tales paint Hitler as Little Red Riding Hood’s saviour.” Telegraph 15
Apr. 2010: n. pag. The Telegraph. Web. 4 Mar. 2014.
<http://www.telegraph.co.uk/history/world-war-two/7594061/Nazi-fairy-tales-paint-
Hitler-as-Little-Red-Riding-Hoods-saviour.html>.
“Home.” Mapping Texts. Stanford and the U of North Texas, 2011. Web. 4 Mar. 2014.
<http://mappingtexts.org/>.
“Loanword: Changes in spelling when loaned.” Wikipedia. Wikimedia Foundation, Inc., 2014.
Web. 4 Mar. 2014.
<http://en.wikipedia.org/wiki/Loanword#Changes_in_spelling_when_loaned>.
Michel, Jean-Baptiste, et al. “Quantitative Analysis of Culture Using Millions of Digitized
Books.” Science 331.176 (2011): 176-82. Steven Pinker: Department of Psychology,
Harvard University. Web. 4 Mar. 2014.
<http://pinker.wjh.harvard.edu/articles/papers/Michel%20et%20al%20Quantitative%20a
nalysis%20of%20culture%20Science%202011.pdf>.
14
Nelson, Robert K. “Introduction.” Mining the Dispatch. U of Richmond Digital Scholarship Lab,
n.d. Web. 4 Mar. 2014. <http://dsl.richmond.edu/dispatch/pages/intro>.
- - -. “Of Monsters, Men — And Topic Modeling.” Opinionator. New York Times, 29 May
2011. Web. 4 Mar. 2014. <http://opinionator.blogs.nytimes.com/2011/05/29/of-monsters-
men-and-topic-modeling/?_php=true&_type=blogs&_r=0>.
- - -. “Topics.” Mining the Dispatch. U of Richmond Digital Scholarship Lab, n.d. Web. 4 Mar.
2014. <http://dsl.richmond.edu/dispatch/Topics>.
Neubert, Michael. “Wheelmen - Rise and Fall (of the Use of That Word).” From Wheels to
Bikes. N.p., 7 Dec. 2013. Web. 4 Mar. 2014.
<http://wheelbike.blogspot.com/2013/12/wheelmen-rise-and-fall-of-use-of-that.html >.
Nunberg, Geoff. “Google Books: A Metadata Train Wreck.” Language Log. U of Pennsylvania,
Aug. 2009. Web. 4 Mar. 2014. <http://languagelog.ldc.upenn.edu/nll/?p=1701>.
Okrent, Arika. “10 viral hits (from the 19th century).” Week 2 Oct. 2013: n. pag. The Week. Web.
4 Mar. 2014. <http://theweek.com/article/index/250382/10-viral-hits-from-the-19th-
century>.
Smith, David A., Ryan Cordell, and Elizabeth Maddock Dillon. Infectious Texts: Modeling Text
Reuse in Nineteenth-Century Newspapers. N.p.: n.p., 2013. Viral Texts. Web. 4 Mar.
2014. <http://www.viraltexts.org/infect-bighum-2013.pdf>.
“Start the Campaign for Simple Spelling.” New York Times 1 Apr. 1906: n. pag. New York
Times. Web. 4 Mar. 2014. <http://query.nytimes.com/mem/archive-
free/pdf?res=9A0CE7DD113EE733A25752C0A9629C946797D6CF>.
Torget, Andrew J., et al. Mapping Texts: Combining Text-Mining and Geo-Visualization to
Unlock the Research Potential of Historical Newspapers. N.p.: n.p., 2011. Mapping
Texts. Web. 4 Mar. 2014.
<http://mappingtexts.org/whitepaper/MappingTexts_WhitePaper.pdf>.
Upward, Chris. “Spelling Reform in German.” Journal of the Simplified Spelling Society J21 ser.
36.1 (1997): 22-24. The English Spelling Society. Web. 4 Mar. 2014.
<http://www.spellingsociety.org/journals/j21/german.php>.
15
FURTHER READING
“About the Project.” Mapping the Republic of Letters. Stanford U, 2013. Web. 5 Mar. 2014.
<http://republicofletters.stanford.edu/index.html>.
These maps track the communications of Enlightenment thinkers. By seeing how people and their
letters traveled across Europe and the United States in the eighteenth century, one can uncover
patterns that even the authors of the correspondences could not see.
Banerjee, Kyle, and Maija Anderson. “Batch metadata assignment to archival photograph
collections using facial recognition software.” Code4Lib 21 (2013): n. pag. Web. 5 Mar.
2014. <http://journal.code4lib.org/articles/8486>.
With advancements in facial recognition software, libraries can now efficiently extract metadata
from their archived photographs as well as assign it in preparation for public access.
Davies, Mark. “Corpora.” corpus.byu.edu. Brigham Young U, n.d. Web. 5 Mar. 2014.
<http://corpus.byu.edu/corpora.asp>.
This n-gram viewer provides access to the original context of a search term. In the Corpus of
Historical American English one can search by root or suffix, follow broader concepts with
built-in synonyms, track changes in nearby words to determine changes in meaning, and search
by mode and genre of publication.
“N-gram Search.” UK Web Archive. British Library, n.d. Web. 5 Mar. 2014.
<http://www.webarchive.org.uk/ukwa/ngram/>.
The British Library has designed an n-gram viewer showing the appearance of words and
phrases in the UK Web Archive over the past ten years.
Owens, Trevor. “Machine Scale Analysis of Digital Collections: An Interview with Lisa Green
of Common Crawl.” The Signal. Library of Congress, 29 Jan. 2014. Web. 5 Mar. 2014.
<http://blogs.loc.gov/digitalpreservation/2014/01/machine-scale-analysis-of-digital-
collections-an-interview-with-lisa-green-of-common-crawl/>.
Lisa Green discusses how libraries can realistically approach machine-scale analysis of their
archives. The storage and compute capacity required for the task makes it more efficient for
some institutions to share resources.
Schmidt, Benjamin M. “Reading digital sources: a case study in ship’s logs.” Sapping Attention.
N.p., 15 Nov. 2012. Web. 5 Mar. 2014.
<http://sappingattention.blogspot.com/2012/11/reading-digital-sources-case-study-
in.html>.
One of the designers of bookworm has developed visuals of ship logs, demonstrating the insights
afforded by unconventional documents.