Embed Size (px)
Citation preview

AKAMAI.COM
BIT RATE ANDBUSINESS MODEL The science behind how our bodies react to video quality
02 Executive Summary
04 Introduction
07How Resolution and Re-Buffering Impact Engagement
09 How Business Model Impacts Engagement
13Brand Perception and The Engagement Equation
16A Clear Link Between Experience, Perception, Business Success
14 Buffering Damages Brand Image
17 Conclusion: Quality Is Not A Novelty
15Business Model Changes How Quality Impacts Brand Image
TABLE OF CONTENTS
2
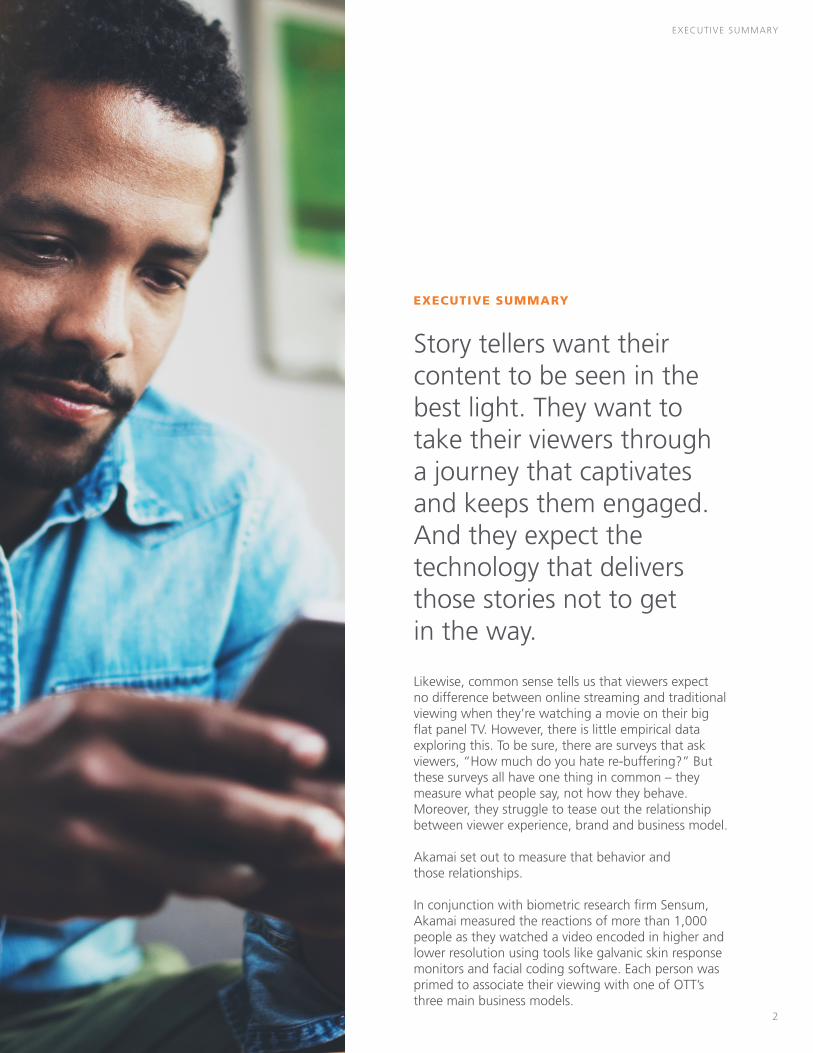
EXECUTIVE SUMMARY
Story tellers want their content to be seen in the best light. They want to take their viewers through a journey that captivates and keeps them engaged. And they expect the technology that delivers those stories not to get in the way.
Likewise, common sense tells us that viewers expect no difference between online streaming and traditional viewing when they’re watching a movie on their big flat panel TV. However, there is little empirical data exploring this. To be sure, there are surveys that ask viewers, “How much do you hate re-buffering?” But these surveys all have one thing in common – they measure what people say, not how they behave. Moreover, they struggle to tease out the relationship between viewer experience, brand and business model.
Akamai set out to measure that behavior and those relationships.
In conjunction with biometric research firm Sensum, Akamai measured the reactions of more than 1,000 people as they watched a video encoded in higher and lower resolution using tools like galvanic skin response monitors and facial coding software. Each person was primed to associate their viewing with one of OTT’s three main business models.
EXECUTIVE SUMMARY
3
EXECUTIVE SUMMARY
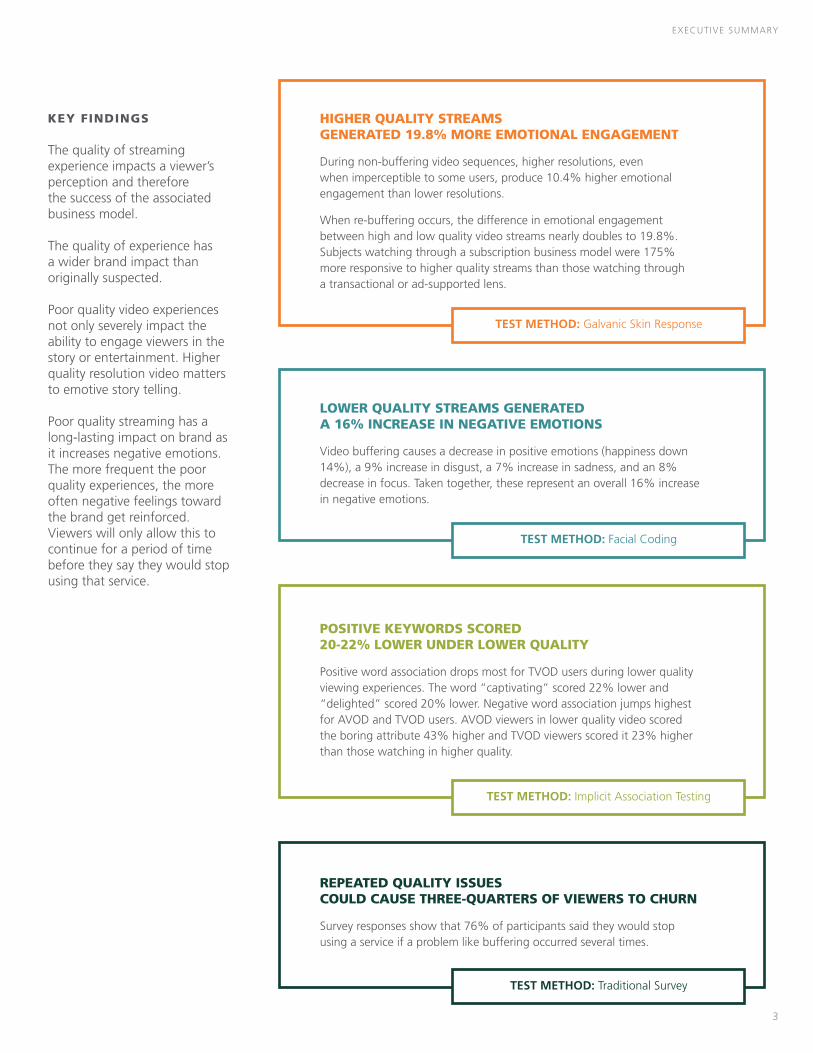
HIGHER QUALITY STREAMS GENERATED 19.8% MORE EMOTIONAL ENGAGEMENT
During non-buffering video sequences, higher resolutions, even when imperceptible to some users, produce 10.4% higher emotional engagement than lower resolutions.
When re-buffering occurs, the difference in emotional engagement between high and low quality video streams nearly doubles to 19.8%. Subjects watching through a subscription business model were 175% more responsive to higher quality streams than those watching through a transactional or ad-supported lens.
TEST METHOD: Galvanic Skin Response
LOWER QUALITY STREAMS GENERATED A 16% INCREASE IN NEGATIVE EMOTIONS
Video buffering causes a decrease in positive emotions (happiness down 14%), a 9% increase in disgust, a 7% increase in sadness, and an 8% decrease in focus. Taken together, these represent an overall 16% increase in negative emotions.
TEST METHOD: Facial Coding
KEY FINDINGS
The quality of streaming experience impacts a viewer’s perception and therefore the success of the associated business model.
The quality of experience has a wider brand impact than originally suspected.
Poor quality video experiences not only severely impact the ability to engage viewers in the story or entertainment. Higher quality resolution video matters to emotive story telling.
Poor quality streaming has a long-lasting impact on brand as it increases negative emotions. The more frequent the poor quality experiences, the more often negative feelings toward the brand get reinforced. Viewers will only allow this to continue for a period of time before they say they would stop using that service.
POSITIVE KEYWORDS SCORED 20-22% LOWER UNDER LOWER QUALITY
Positive word association drops most for TVOD users during lower quality viewing experiences. The word “captivating” scored 22% lower and “delighted” scored 20% lower. Negative word association jumps highest for AVOD and TVOD users. AVOD viewers in lower quality video scored the boring attribute 43% higher and TVOD viewers scored it 23% higher than those watching in higher quality.
TEST METHOD: Implicit Association Testing
REPEATED QUALITY ISSUES COULD CAUSE THREE-QUARTERS OF VIEWERS TO CHURN
Survey responses show that 76% of participants said they would stop using a service if a problem like buffering occurred several times.
TEST METHOD: Traditional Survey
4
INTRODUCTION
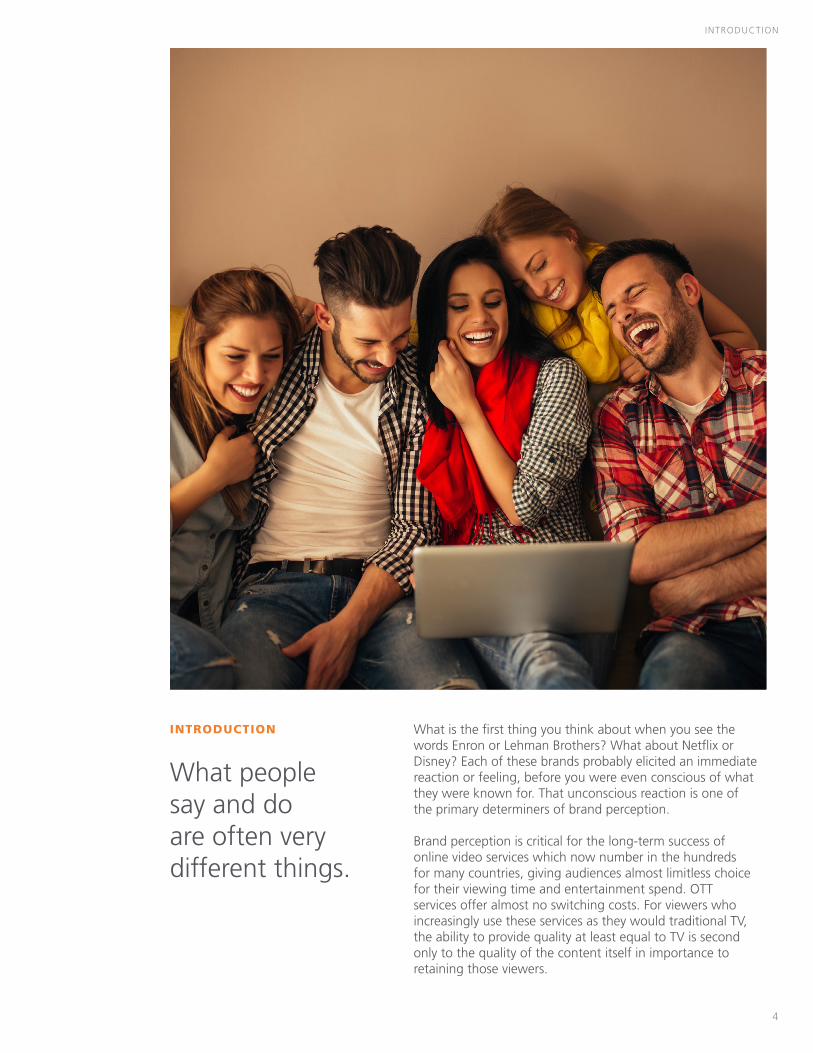
What people say and do are often very different things.
What is the first thing you think about when you see the words Enron or Lehman Brothers? What about Netflix or Disney? Each of these brands probably elicited an immediate reaction or feeling, before you were even conscious of what they were known for. That unconscious reaction is one of the primary determiners of brand perception.
Brand perception is critical for the long-term success of online video services which now number in the hundreds for many countries, giving audiences almost limitless choice for their viewing time and entertainment spend. OTT services offer almost no switching costs. For viewers who increasingly use these services as they would traditional TV, the ability to provide quality at least equal to TV is second only to the quality of the content itself in importance to retaining those viewers.
INTRODUCTION
5
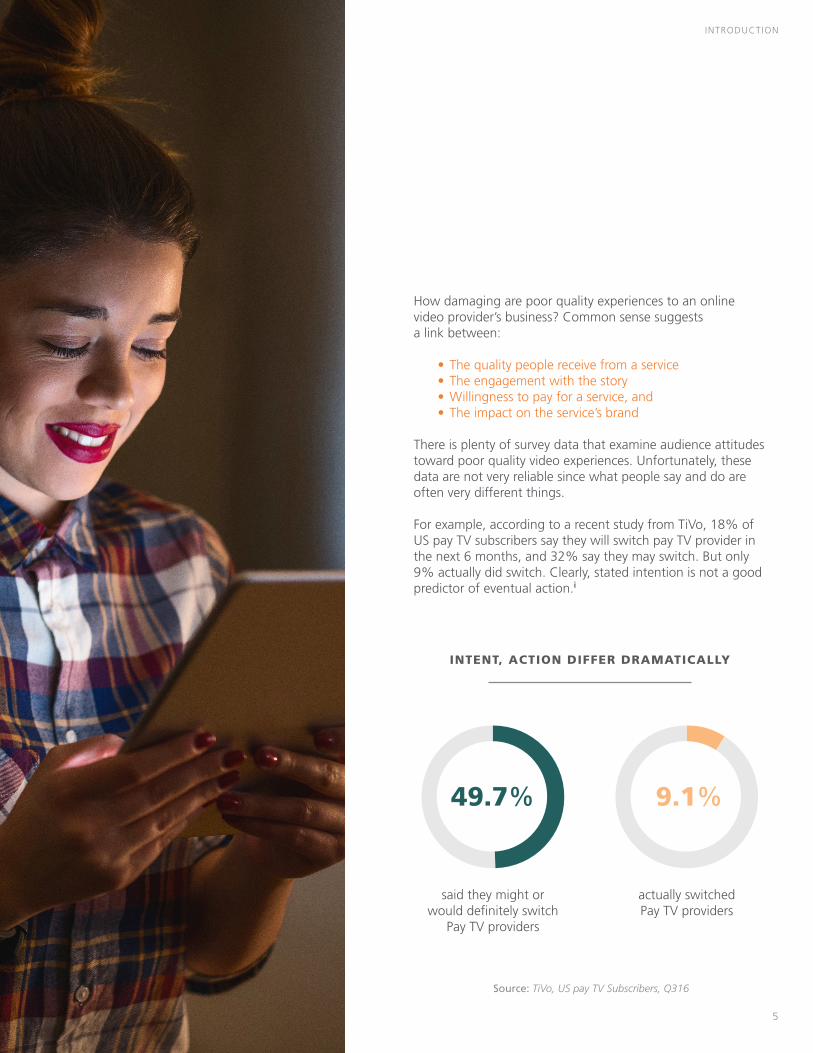
How damaging are poor quality experiences to an online video provider’s business? Common sense suggests a link between:
• The quality people receive from a service • The engagement with the story • Willingness to pay for a service, and • The impact on the service’s brand
There is plenty of survey data that examine audience attitudes toward poor quality video experiences. Unfortunately, these data are not very reliable since what people say and do are often very different things.
For example, according to a recent study from TiVo, 18% of US pay TV subscribers say they will switch pay TV provider in the next 6 months, and 32% say they may switch. But only 9% actually did switch. Clearly, stated intention is not a good predictor of eventual action.i
INTENT, ACTION DIFFER DRAMATICALLY
said they might or would definitely switch
Pay TV providers
actually switched Pay TV providers
49.7% 9.1%
INTRODUCTION
Source: TiVo, US pay TV Subscribers, Q316
6
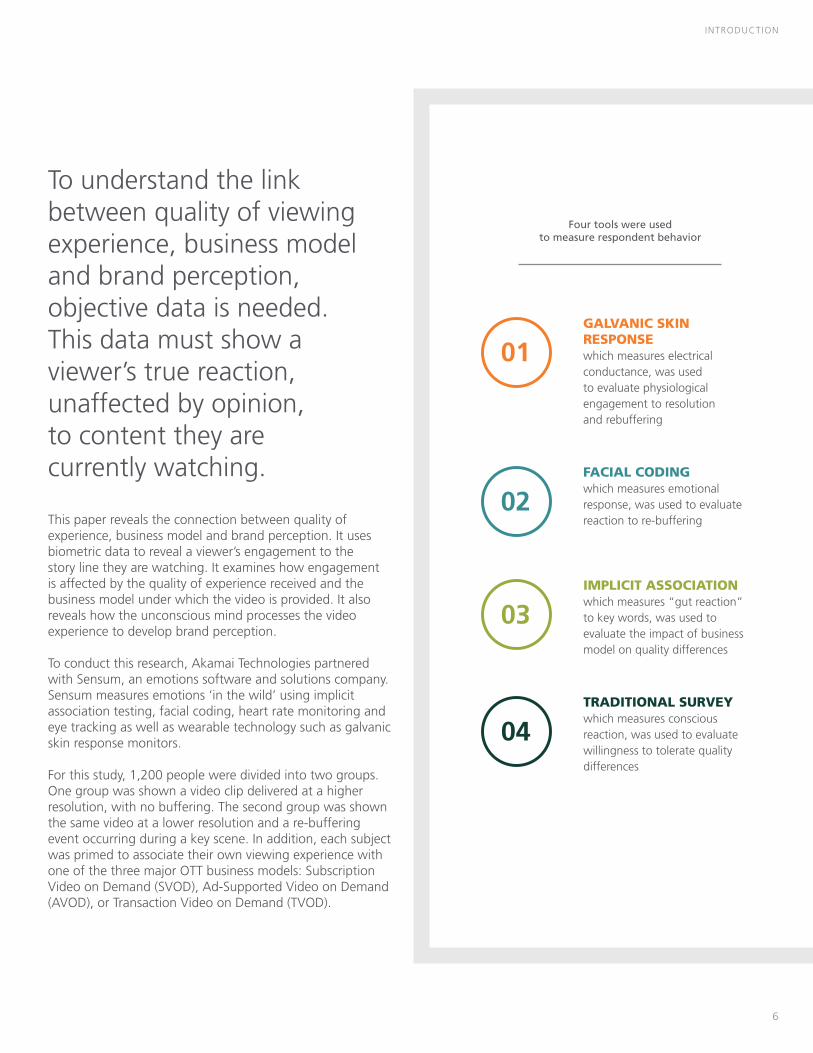
GALVANIC SKIN RESPONSE which measures electrical conductance, was used to evaluate physiological engagement to resolution and rebuffering
01
FACIAL CODING which measures emotional response, was used to evaluate reaction to re-buffering
02
IMPLICIT ASSOCIATION which measures “gut reaction” to key words, was used to evaluate the impact of business model on quality differences
03
TRADITIONAL SURVEY which measures conscious reaction, was used to evaluate willingness to tolerate quality differences
04
To understand the link between quality of viewing experience, business model and brand perception, objective data is needed. This data must show a viewer’s true reaction, unaffected by opinion, to content they arecurrently watching.
This paper reveals the connection between quality of experience, business model and brand perception. It uses biometric data to reveal a viewer’s engagement to the story line they are watching. It examines how engagement is affected by the quality of experience received and the business model under which the video is provided. It also reveals how the unconscious mind processes the video experience to develop brand perception.
To conduct this research, Akamai Technologies partnered with Sensum, an emotions software and solutions company. Sensum measures emotions ‘in the wild’ using implicit association testing, facial coding, heart rate monitoring and eye tracking as well as wearable technology such as galvanic skin response monitors.
For this study, 1,200 people were divided into two groups. One group was shown a video clip delivered at a higher resolution, with no buffering. The second group was shown the same video at a lower resolution and a re-buffering event occurring during a key scene. In addition, each subject was primed to associate their own viewing experience with one of the three major OTT business models: Subscription Video on Demand (SVOD), Ad-Supported Video on Demand (AVOD), or Transaction Video on Demand (TVOD).
Four tools were used to measure respondent behavior
INTRODUCTION
7
Higher Quality Viewing
Lower Quality Viewing
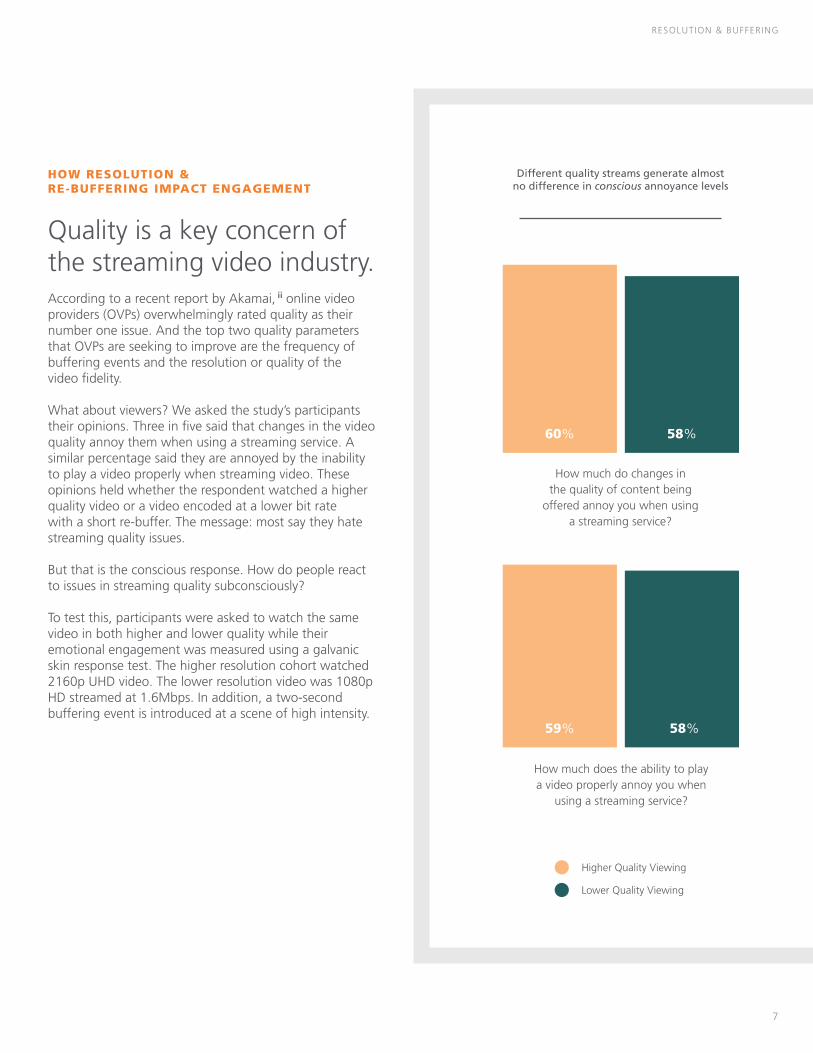
60% 58%
How much do changes in the quality of content being
offered annoy you when using a streaming service?
59% 58%
How much does the ability to play a video properly annoy you when
using a streaming service?
HOW RESOLUTION & RE-BUFFERING IMPACT ENGAGEMENT
Quality is a key concern of the streaming video industry. According to a recent report by Akamai, ii online video providers (OVPs) overwhelmingly rated quality as their number one issue. And the top two quality parameters that OVPs are seeking to improve are the frequency of buffering events and the resolution or quality of the video fidelity.
What about viewers? We asked the study’s participants their opinions. Three in five said that changes in the video quality annoy them when using a streaming service. A similar percentage said they are annoyed by the inability to play a video properly when streaming video. These opinions held whether the respondent watched a higher quality video or a video encoded at a lower bit rate with a short re-buffer. The message: most say they hate streaming quality issues.
But that is the conscious response. How do people react to issues in streaming quality subconsciously?
To test this, participants were asked to watch the same video in both higher and lower quality while their emotional engagement was measured using a galvanic skin response test. The higher resolution cohort watched 2160p UHD video. The lower resolution video was 1080p HD streamed at 1.6Mbps. In addition, a two-second buffering event is introduced at a scene of high intensity.
RESOLUTION & BUFFERING
Different quality streams generate almost no difference in conscious annoyance levels
8
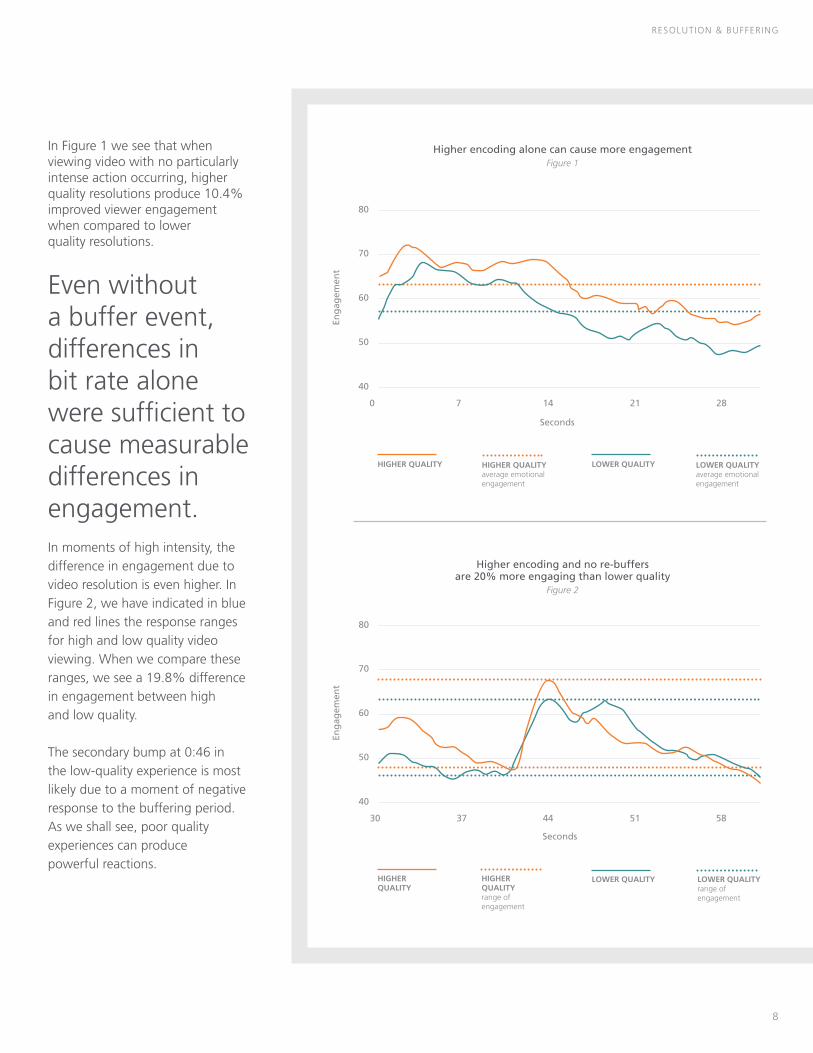
In Figure 1 we see that when viewing video with no particularly intense action occurring, higher quality resolutions produce 10.4% improved viewer engagement when compared to lower quality resolutions.
Even without a buffer event, differences in bit rate alone were sufficient to cause measurable differences in engagement.In moments of high intensity, the difference in engagement due to video resolution is even higher. In Figure 2, we have indicated in blue and red lines the response ranges for high and low quality video viewing. When we compare these ranges, we see a 19.8% difference in engagement between high and low quality.
The secondary bump at 0:46 in the low-quality experience is most likely due to a moment of negative response to the buffering period. As we shall see, poor quality experiences can produce powerful reactions.
Higher encoding alone can cause more engagementFigure 1
Higher encoding and no re-buffers are 20% more engaging than lower quality
Figure 2
HIGHER QUALITYaverage emotional engagement
HIGHER QUALITY LOWER QUALITYaverage emotional engagement
LOWER QUALITY
80
70
60
50
40
0 7 14 21 28
Enga
gem
ent
Seconds
HIGHER QUALITYrange of engagement
HIGHER QUALITY
LOWER QUALITYrange of engagement
LOWER QUALITY
80
70
60
50
40
30 37 44 51 58
Enga
gem
ent
Seconds
RESOLUTION & BUFFERING
9
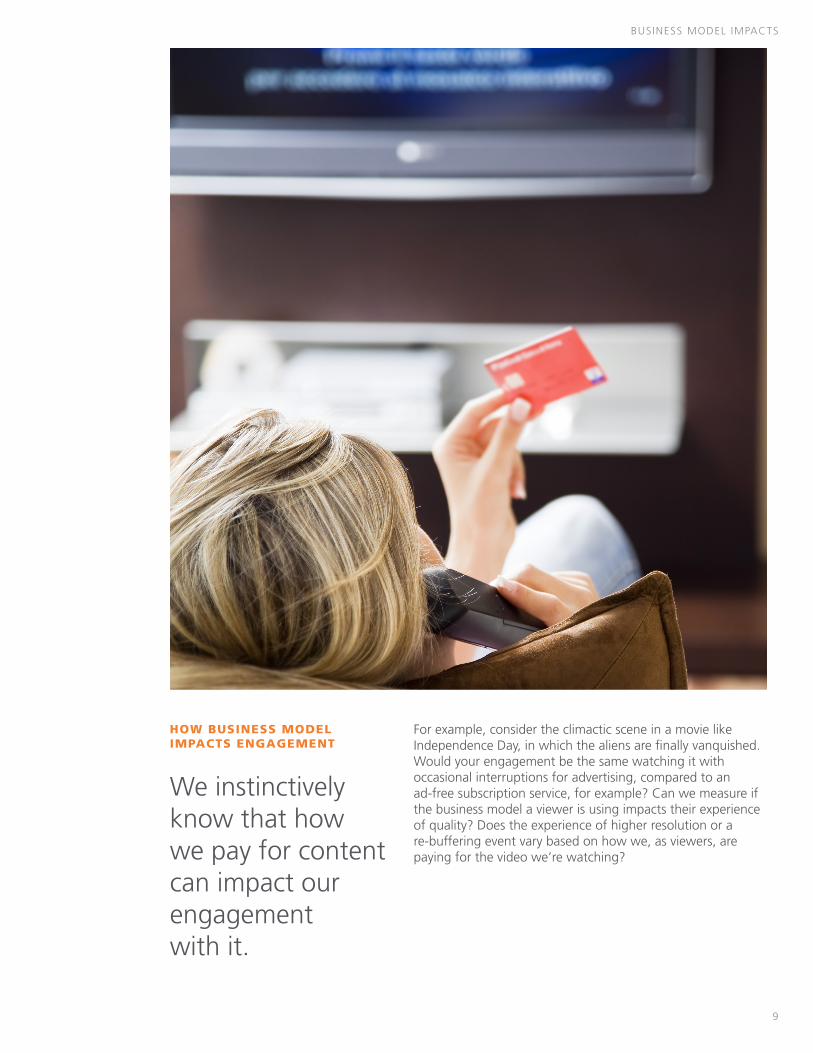
HOW BUSINESS MODEL IMPACTS ENGAGEMENT
We instinctively know that how we pay for content can impact our engagement with it.
For example, consider the climactic scene in a movie like Independence Day, in which the aliens are finally vanquished. Would your engagement be the same watching it with occasional interruptions for advertising, compared to an ad-free subscription service, for example? Can we measure if the business model a viewer is using impacts their experience of quality? Does the experience of higher resolution or a re-buffering event vary based on how we, as viewers, are paying for the video we’re watching?
BUSINESS MODEL IMPACTS
10
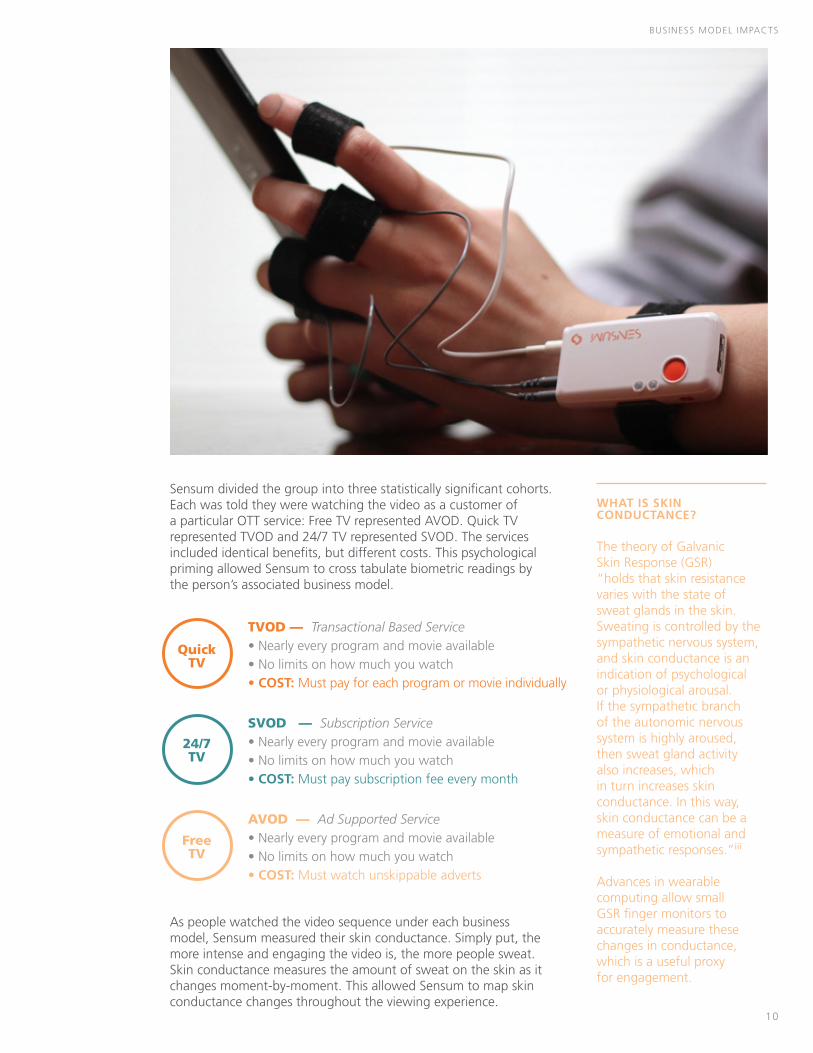
WHAT IS SKIN CONDUCTANCE? The theory of Galvanic Skin Response (GSR) “holds that skin resistance varies with the state of sweat glands in the skin. Sweating is controlled by the sympathetic nervous system, and skin conductance is an indication of psychological or physiological arousal. If the sympathetic branch of the autonomic nervous system is highly aroused, then sweat gland activity also increases, which in turn increases skin conductance. In this way, skin conductance can be a measure of emotional and sympathetic responses.”iii Advances in wearable computing allow small GSR finger monitors to accurately measure these changes in conductance, which is a useful proxy for engagement.
TVOD — Transactional Based Service• Nearly every program and movie available• No limits on how much you watch • COST: Must pay for each program or movie individually
QuickTV
SVOD — Subscription Service• Nearly every program and movie available• No limits on how much you watch• COST: Must pay subscription fee every month
24/7TV
AVOD — Ad Supported Service• Nearly every program and movie available• No limits on how much you watch• COST: Must watch unskippable adverts
FreeTV
Sensum divided the group into three statistically significant cohorts. Each was told they were watching the video as a customer of a particular OTT service: Free TV represented AVOD. Quick TV represented TVOD and 24/7 TV represented SVOD. The services included identical benefits, but different costs. This psychological priming allowed Sensum to cross tabulate biometric readings by the person’s associated business model.
As people watched the video sequence under each business model, Sensum measured their skin conductance. Simply put, the more intense and engaging the video is, the more people sweat. Skin conductance measures the amount of sweat on the skin as it changes moment-by-moment. This allowed Sensum to map skin conductance changes throughout the viewing experience.
BUSINESS MODEL IMPACTS
11
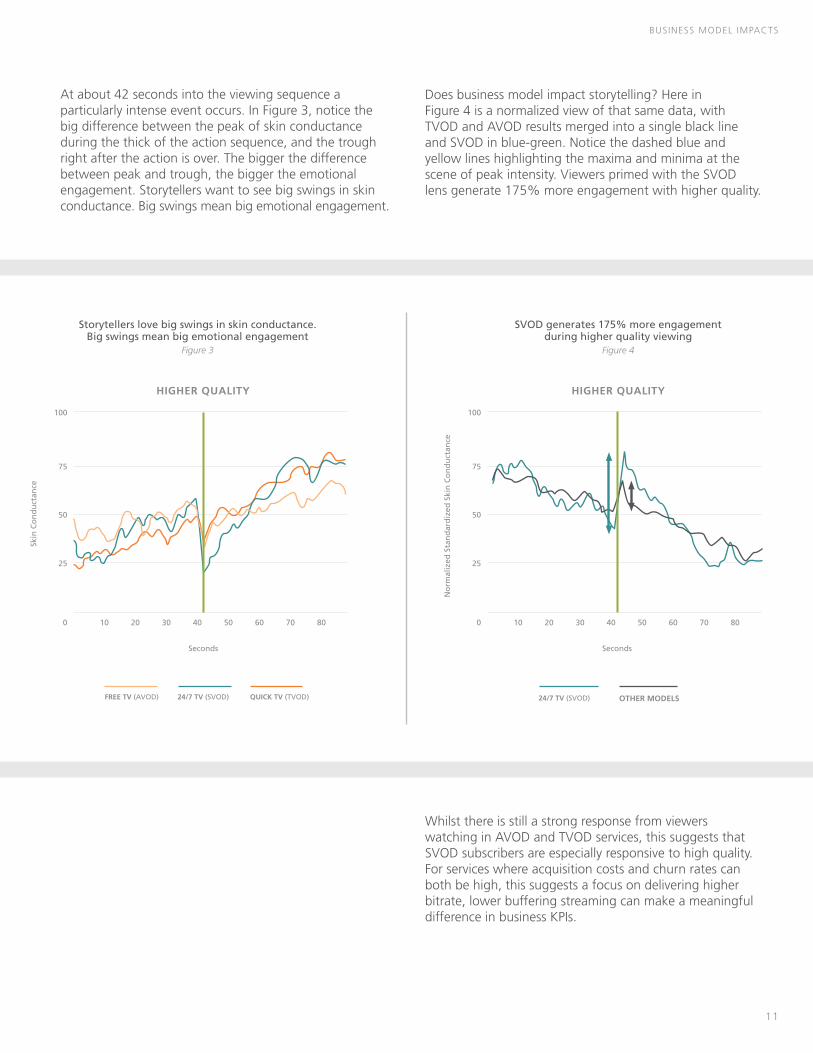
At about 42 seconds into the viewing sequence a particularly intense event occurs. In Figure 3, notice the big difference between the peak of skin conductance during the thick of the action sequence, and the trough right after the action is over. The bigger the difference between peak and trough, the bigger the emotional engagement. Storytellers want to see big swings in skin conductance. Big swings mean big emotional engagement.
Does business model impact storytelling? Here in Figure 4 is a normalized view of that same data, with TVOD and AVOD results merged into a single black line and SVOD in blue-green. Notice the dashed blue and yellow lines highlighting the maxima and minima at the scene of peak intensity. Viewers primed with the SVOD lens generate 175% more engagement with higher quality.
Storytellers love big swings in skin conductance. Big swings mean big emotional engagement
Figure 3
24/7 TV (SVOD)FREE TV (AVOD) QUICK TV (TVOD)
0 10 20 30 40 50 60 70 80
25
50
75
100
HIGHER QUALITY
Skin
Con
duct
ance
Seconds
SVOD generates 175% more engagement during higher quality viewing
Figure 4
24/7 TV (SVOD) OTHER MODELS
70 800 10 20 30 40 50 60
25
50
75
100
HIGHER QUALITY
Nor
mal
ized
Sta
ndar
dize
d Sk
in C
ondu
ctan
ce
Seconds
Whilst there is still a strong response from viewers watching in AVOD and TVOD services, this suggests that SVOD subscribers are especially responsive to high quality. For services where acquisition costs and churn rates can both be high, this suggests a focus on delivering higher bitrate, lower buffering streaming can make a meaningful difference in business KPIs.
BUSINESS MODEL IMPACTS
12
80
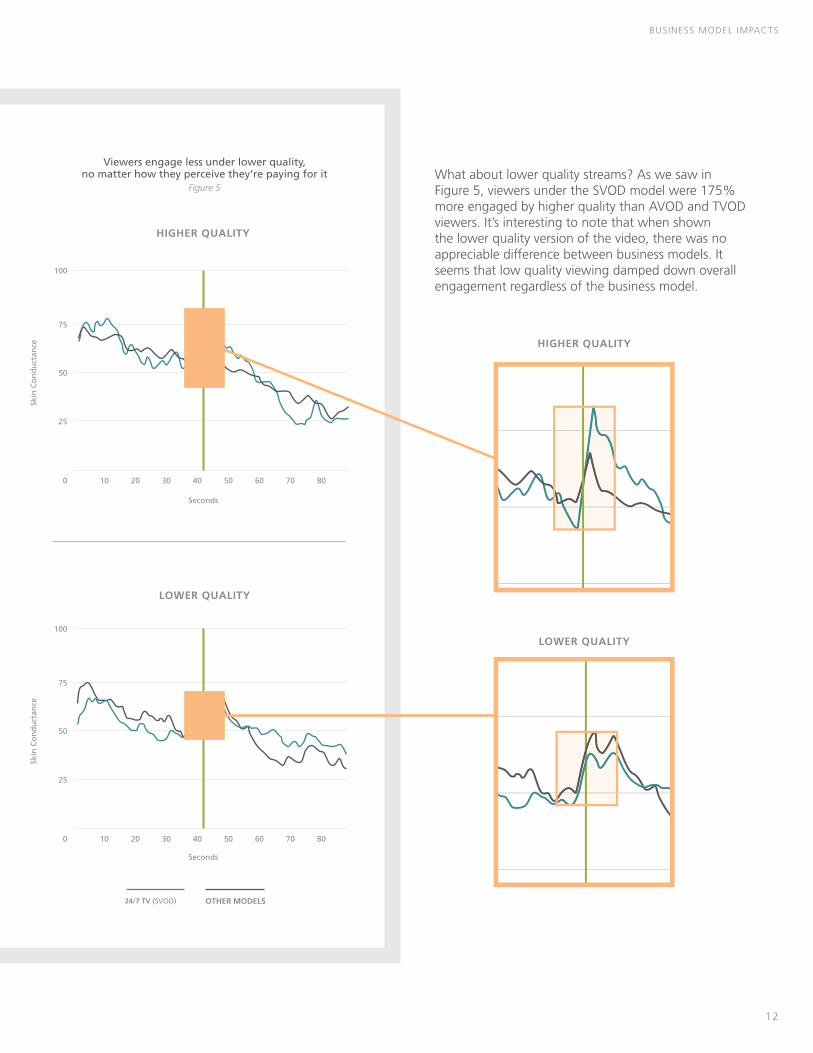
What about lower quality streams? As we saw in Figure 5, viewers under the SVOD model were 175% more engaged by higher quality than AVOD and TVOD viewers. It’s interesting to note that when shown the lower quality version of the video, there was no appreciable difference between business models. It seems that low quality viewing damped down overall engagement regardless of the business model.
70
70
80
80
HIGHER QUALITY
HIGHER QUALITY
LOWER QUALITY
0
0
10
10
20
20
30
30
40
40
50
50
60
60
25
25
50
50
75
75
100
100
24/7 TV (SVOD) OTHER MODELS
LOWER QUALITY
Viewers engage less under lower quality, no matter how they perceive they’re paying for it
Figure 5
Skin
Con
duct
ance
Skin
Con
duct
ance
Seconds
Seconds
BUSINESS MODEL IMPACTS
13
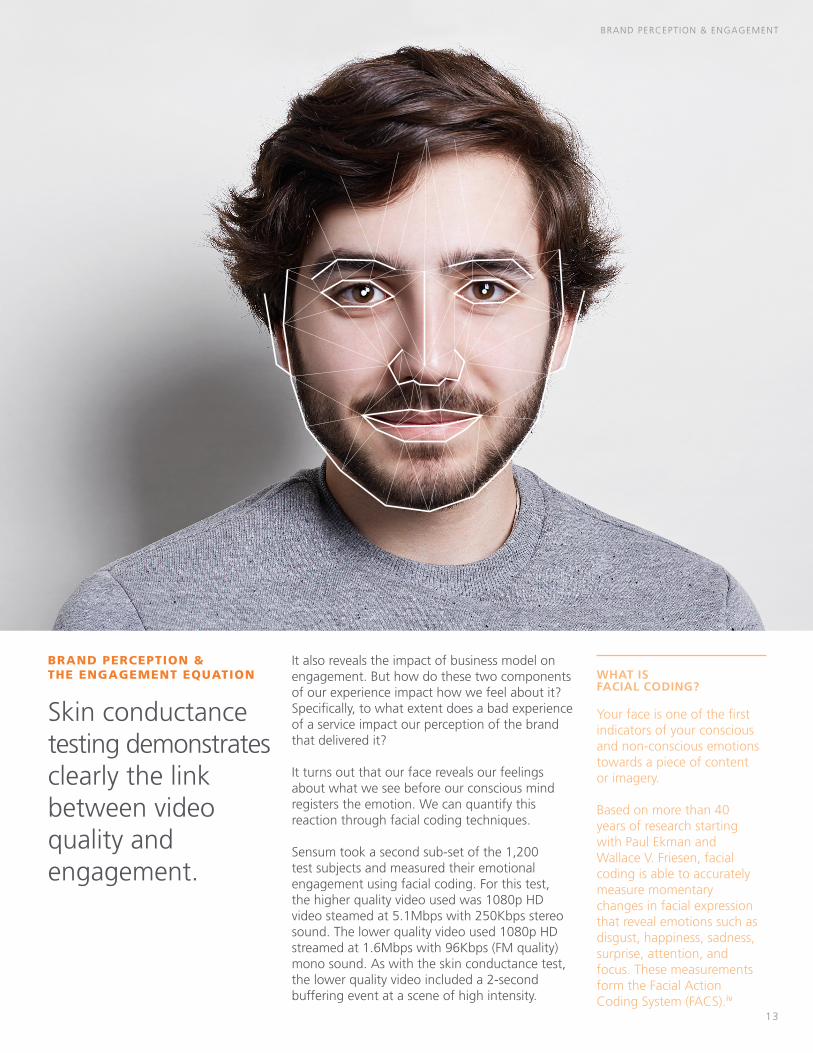
Skin conductance testing demonstrates clearly the link between video quality and engagement.
It also reveals the impact of business model on engagement. But how do these two components of our experience impact how we feel about it? Specifically, to what extent does a bad experience of a service impact our perception of the brand that delivered it?
It turns out that our face reveals our feelings about what we see before our conscious mind registers the emotion. We can quantify this reaction through facial coding techniques.
Sensum took a second sub-set of the 1,200 test subjects and measured their emotional engagement using facial coding. For this test, the higher quality video used was 1080p HD video steamed at 5.1Mbps with 250Kbps stereo sound. The lower quality video used 1080p HD streamed at 1.6Mbps with 96Kbps (FM quality) mono sound. As with the skin conductance test, the lower quality video included a 2-second buffering event at a scene of high intensity.
BRAND PERCEPTION & THE ENGAGEMENT EQUATION WHAT IS
FACIAL CODING?
Your face is one of the first indicators of your conscious and non-conscious emotions towards a piece of content or imagery.
Based on more than 40 years of research starting with Paul Ekman and Wallace V. Friesen, facial coding is able to accurately measure momentary changes in facial expression that reveal emotions such as disgust, happiness, sadness, surprise, attention, and focus. These measurements form the Facial Action Coding System (FACS).iv
BRAND PERCEPTION & ENGAGEMENT
14
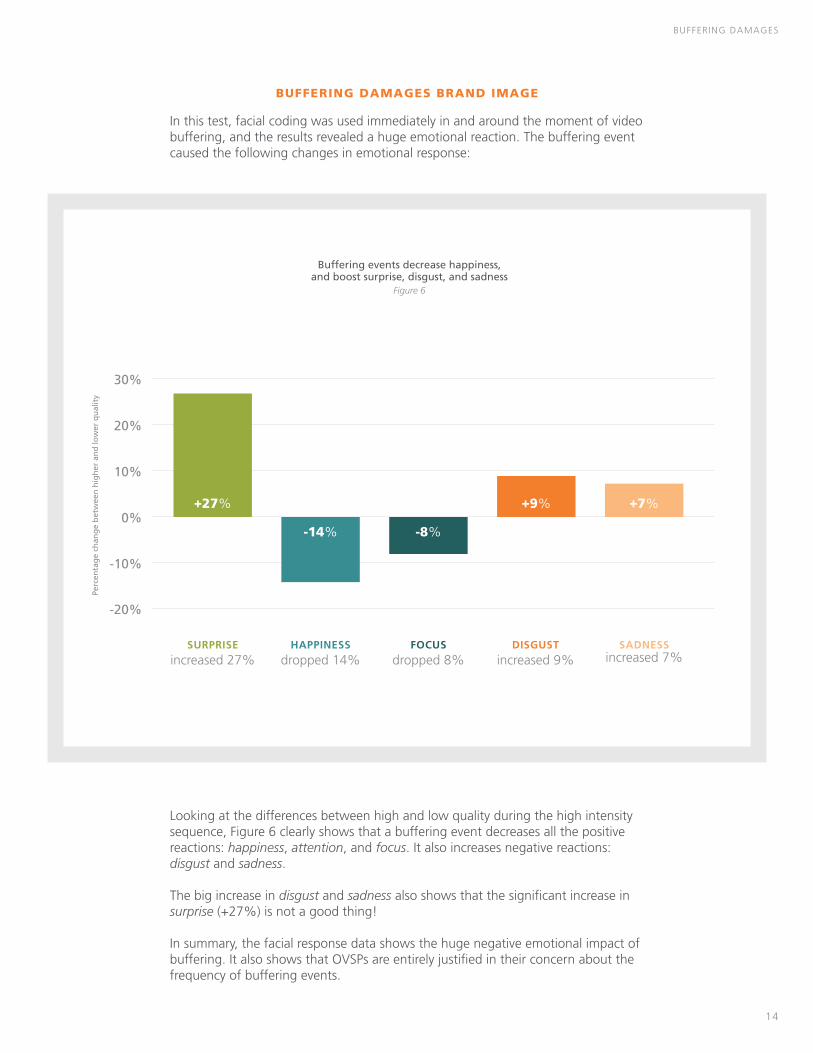
BUFFERING DAMAGES BRAND IMAGE
In this test, facial coding was used immediately in and around the moment of video buffering, and the results revealed a huge emotional reaction. The buffering event caused the following changes in emotional response:
Looking at the differences between high and low quality during the high intensity sequence, Figure 6 clearly shows that a buffering event decreases all the positive reactions: happiness, attention, and focus. It also increases negative reactions: disgust and sadness.
The big increase in disgust and sadness also shows that the significant increase in surprise (+27%) is not a good thing!
In summary, the facial response data shows the huge negative emotional impact of buffering. It also shows that OVSPs are entirely justified in their concern about the frequency of buffering events.
-20%
-10%
0%
10%
20%
30%
SURPRISEincreased 27%
HAPPINESSdropped 14%
FOCUSdropped 8%
SADNESSincreased 7%
DISGUST increased 9%
+27%
-14% -8%
+7%+9%
Perc
enta
ge c
hang
e be
twee
n hi
gher
and
low
er q
ualit
y
BUFFERING DAMAGES
Buffering events decrease happiness, and boost surprise, disgust, and sadness
Figure 6
15
14.0
BUSINESS MODEL CHANGES HOW QUALITY IMPACTS BRAND IMAGE
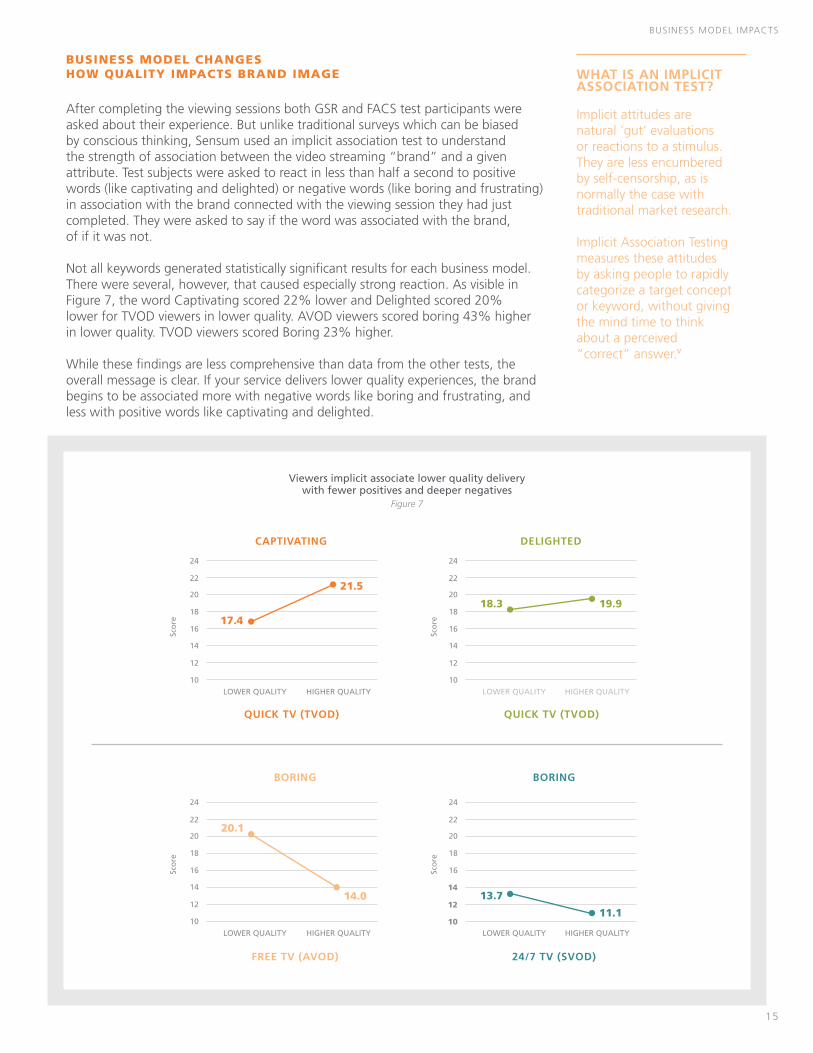
After completing the viewing sessions both GSR and FACS test participants were asked about their experience. But unlike traditional surveys which can be biased by conscious thinking, Sensum used an implicit association test to understand the strength of association between the video streaming “brand” and a given attribute. Test subjects were asked to react in less than half a second to positive words (like captivating and delighted) or negative words (like boring and frustrating) in association with the brand connected with the viewing session they had just completed. They were asked to say if the word was associated with the brand, of if it was not.
Not all keywords generated statistically significant results for each business model. There were several, however, that caused especially strong reaction. As visible in Figure 7, the word Captivating scored 22% lower and Delighted scored 20% lower for TVOD viewers in lower quality. AVOD viewers scored boring 43% higher in lower quality. TVOD viewers scored Boring 23% higher. While these findings are less comprehensive than data from the other tests, the overall message is clear. If your service delivers lower quality experiences, the brand begins to be associated more with negative words like boring and frustrating, and less with positive words like captivating and delighted.
QUICK TV (TVOD)
CAPTIVATING
LOWER QUALITY HIGHER QUALITY10
12
14
16
18
20
22
24
21.5
17.4
Scor
e
QUICK TV (TVOD)
DELIGHTED
LOWER QUALITY HIGHER QUALITY10
12
14
16
18
20
22
24
19.918.3
Scor
e
FREE TV (AVOD)
BORING
LOWER QUALITY HIGHER QUALITY10
12
14
16
18
20
22
24
20.1
Scor
e
24/7 TV (SVOD)
BORING
LOWER QUALITY HIGHER QUALITY10
12
14
16
18
20
22
24
11.1
13.7
Scor
e
WHAT IS AN IMPLICIT ASSOCIATION TEST?
Implicit attitudes are natural ‘gut’ evaluations or reactions to a stimulus. They are less encumbered by self-censorship, as is normally the case with traditional market research.
Implicit Association Testing measures these attitudes by asking people to rapidly categorize a target concept or keyword, without giving the mind time to think about a perceived “correct” answer.v
BUSINESS MODEL IMPACTS
Viewers implicit associate lower quality delivery with fewer positives and deeper negatives
Figure 7
16
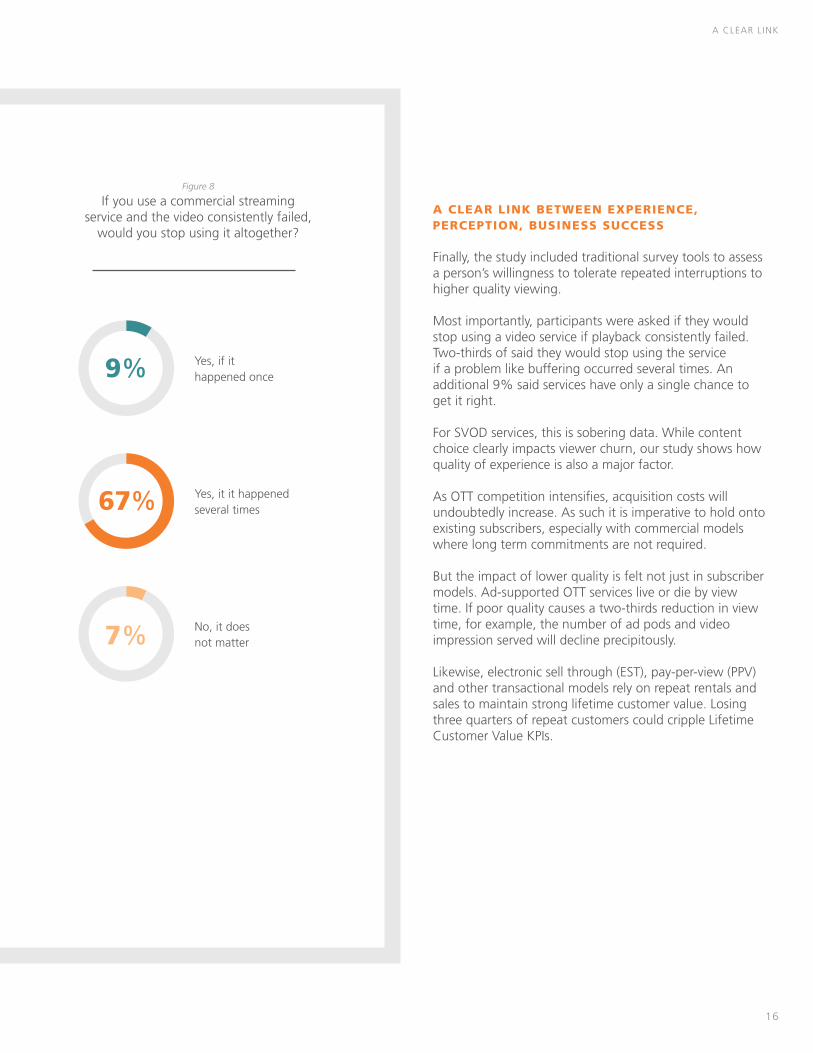
A CLEAR LINK BETWEEN EXPERIENCE, PERCEPTION, BUSINESS SUCCESS
Finally, the study included traditional survey tools to assess a person’s willingness to tolerate repeated interruptions to higher quality viewing.
Most importantly, participants were asked if they would stop using a video service if playback consistently failed. Two-thirds of said they would stop using the service if a problem like buffering occurred several times. An additional 9% said services have only a single chance to get it right.
For SVOD services, this is sobering data. While content choice clearly impacts viewer churn, our study shows how quality of experience is also a major factor.
As OTT competition intensifies, acquisition costs will undoubtedly increase. As such it is imperative to hold onto existing subscribers, especially with commercial models where long term commitments are not required.
But the impact of lower quality is felt not just in subscriber models. Ad-supported OTT services live or die by view time. If poor quality causes a two-thirds reduction in view time, for example, the number of ad pods and video impression served will decline precipitously.
Likewise, electronic sell through (EST), pay-per-view (PPV) and other transactional models rely on repeat rentals and sales to maintain strong lifetime customer value. Losing three quarters of repeat customers could cripple Lifetime Customer Value KPIs.
Yes, if it happened once9%
Yes, it it happened several times67%
No, it does not matter7%
A CLEAR L INK
Figure 8
If you use a commercial streaming service and the video consistently failed,
would you stop using it altogether?
CONCLUSION: QUALITY IS NOT A NOVELTY
Reversing the negative effects on brand caused by quality problems can be difficult. By far the best strategy is to keep quality where it needs to be.
CONCLUSION
17
18
VEE 2017
STORY TELLING SUFFERS
One thing is also very clear from the research: it is not only the video service brand that suffers when viewers have a bad experience. Perception of the video they are watching suffers too. Story tellers want to take their viewers on a journey that captivates and enthralls them. Unfortunately, our research shows how a low-quality experience can completely derail the story-telling process. The data shows a 16% increase in negative emotions toward the content engendered by a poor viewing experience. And that happens regardless of the business model under which the video was provided to the viewer. This has the negative impact of reducing the potential return on investment for original productions or the return on rights acquired.
For video service providers, it is imperative to deliver a video service with an experience commensurate with the quality of the video content. Akamai is ready to help you achieve the quality goals you need.
With the most distributed, scalable network in the industry, we can optimize the bitrate of the video delivered to achieve the best quality on any device. At the same time, our highly-distributed network will minimize the incidence of buffering events. Together, this can keep your viewers happy and engaged in what they are watching, and allow positive feelings to continue to enhance the value of your brand.
CONCLUSION
Conventional wisdom says that consumer expectations around quality have matured, from a willingness to tolerate poor quality experiences because of the “magic” of OTT, to an expectation today that OTT should be no different than traditional broadcast television.
This research confirms that those expectations are now dramatically higher, perhaps even higher than those of viewers of traditional over-the-air, satellite and cable transmission.
Results from the testing show that the quality of streaming experience directly impacts the viewer’s perception of what they are watching. Specifically, it shows us how damaging buffering can be to viewer engagement and therefore story telling. And degraded engagement can have a potentially disastrous impact on an online video service’s bottom line.
Poor engagement has a serious downside for all video business models, though SVOD services are likely most vulnerable to the negative effects of buffering. As we saw, two-thirds of participants said they would stop using the service if a problem like buffering occurred several times.
OTT services have been shown to churn significant numbers of viewers with an estimated 20% leaving over the last 12 months as people experiment with different services. vi Whilst content choice clearly impacts viewer churn, our study shows how quality of experience is also a major factor.
Subscriber churn in OTT services not only has implications for revenue generation but also subscriber acquisition costs. As markets mature and competition intensifies acquisition costs will undoubtedly increase. As such it is imperative to hold onto existing subscribers especially with commercial models where long term commitments are not required.
QUALITY HAS LONG-LASTING IMPACT ON BRAND
In the end, the damage poor quality delivery can inflict on a service’s brand is the most troubling for online video providers. For a TVOD provider, the immediate impact of a bad streaming experience is having to issue a refund of the viewers rental fee. However, facial coding and implicit response testing show a deeper, darker story. Poor quality experiences work to increase negative feelings like disgust and sadness. These, in turn, increase negative word associations with the brand. And the more frequent the bad quality experiences, the more often those negative feelings and brand associations get reinforced.
Reversing the negative effects on brand caused by quality problems can be difficult. By far the best strategy is to keep quality where it needs to be. Do that and the brand will enjoy the fruits of positive feelings and word associations.

END NOTES
i Q4 2016 Video Trends Report, TiVo, March 2017, 19, http://dm4.tivo.com/4q16_trends (accessed on 3/14/17)
ii Stream it Clean: Quality is the Key to Video Service Success, NewBay Media, Q4 2016 https://www.akamai.com/us/en/multimedia/documents/report/quality-is-the-key- to-video-service-success-report.pdf
iii https://en.wikipedia.org/wiki/Electrodermal_activity
iv https://en.wikipedia.org/wiki/facial_action_coding_system
v https://en.wikipedia.org/wiki/Implicit-association_test
vi https://www.parksassociates.com/blog/article/pr-02012017

© 2017 Akamai Technologies, Inc. All Rights Reserved. Reproduction in whole or in part in any form or medium without express written permission is prohibited. Akamai and the Akamai wave logo are registered trademarks. Other trademarks contained herein are the property of their respective owners. Akamis believes that the information in this publication is accurate as of its publication date; such information is subject to change without notice. Published XX/17