Embed Size (px)
Citation preview
To Reduce the DPSA defects related to Functional parts problem at Road Test
- ADDC Noise
Six Sigma-Black Belt Project
Six Sigma Black Belt :- Pradip Kumar
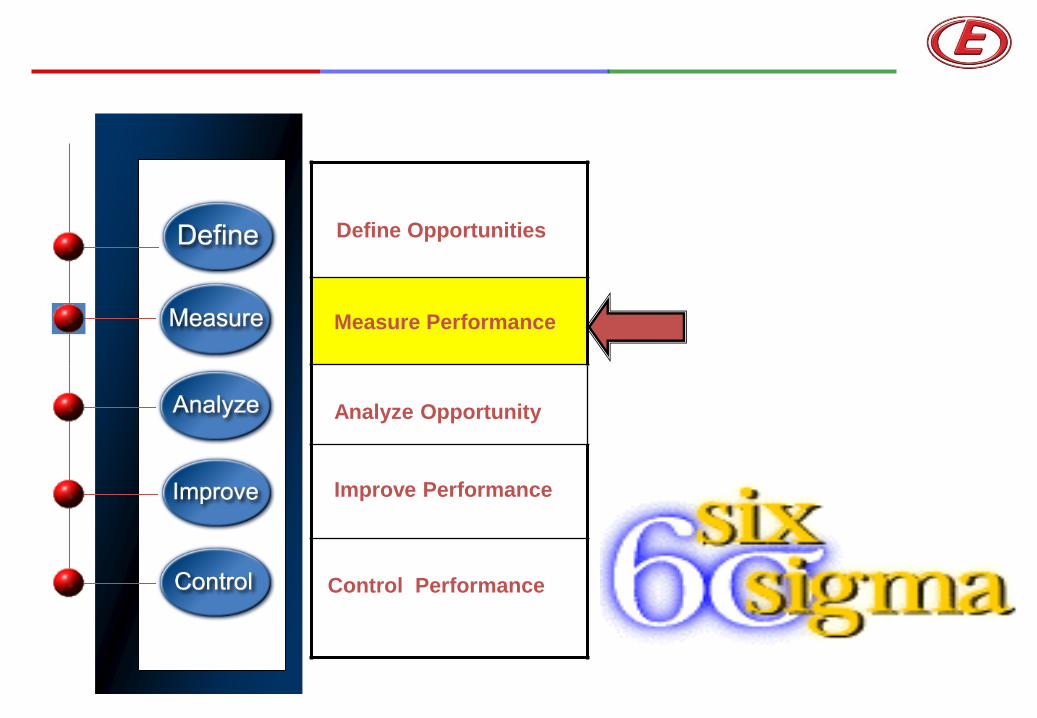
Define Opportunities
Measure Performance
Analyze Opportunity
Improve Performance
Control Performance
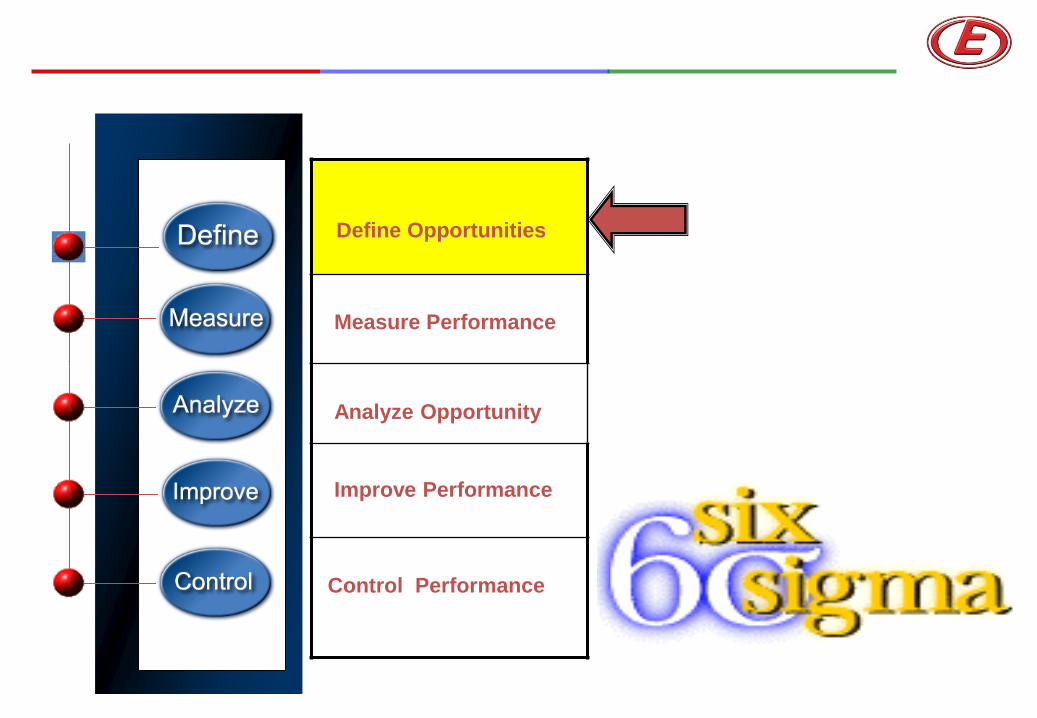
DPSA –Road Test ( Feb - April,13)
Road Test- Defect Distribution
Functional 56%
Leakage 16%
Appearance 16%
Noise 8%
Fitment 3%
Handling 1%
DPSA Defects-Contribution Part Commodities No of defects % Contribution
Functional 160 55.6
Leakage 46 16.0
Appearance 46 16.0
Noise 24 8.3
Fitment 8 2.8
Handling 4 1.4
Total 288 100
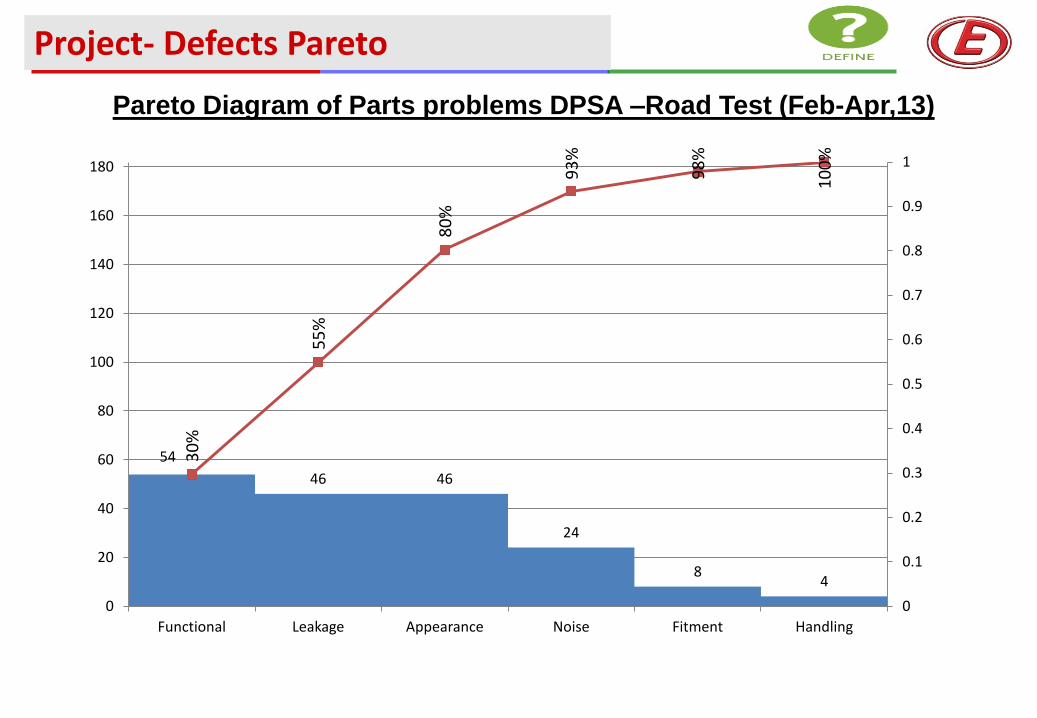
Pareto Diagram of Parts problems DPSA –Road Test (Feb-Apr,13)
Project- Defects Pareto
54
46 46
24
8 4
30
%
55
%
80
%
93
%
98
%
10
0%
0
0.1
0.2
0.3
0.4
0.5
0.6
0.7
0.8
0.9
1
0
20
40
60
80
100
120
140
160
180
Functional Leakage Appearance Noise Fitment Handling
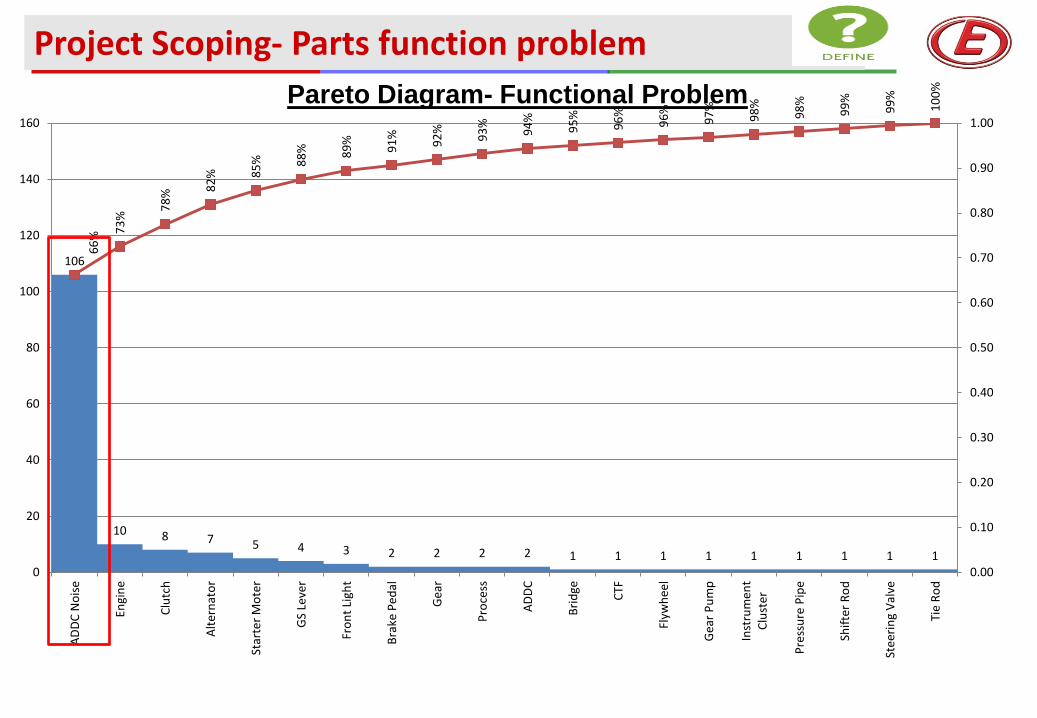
Pareto Diagram- Functional Problem
Project Scoping- Parts function problem
106
10 8 7 5 4 3 2 2 2 2 1 1 1 1 1 1 1 1 1
66
% 73
% 7
8%
82
%
85
%
88
%
89
%
91
%
92
%
93
%
94
%
95
%
96
%
96
%
97
%
98
%
98
%
99
%
99
%
10
0%
0.00
0.10
0.20
0.30
0.40
0.50
0.60
0.70
0.80
0.90
1.00
0
20
40
60
80
100
120
140
160
AD
DC
No
ise
Engi
ne
Clu
tch
Alt
ern
ato
r
Star
ter
Mo
ter
GS
Leve
r
Fro
nt
Ligh
t
Bra
ke P
edal
Gea
r
Pro
cess
AD
DC
Bri
dge
CTF
Flyw
hee
l
Gea
r P
um
p
Inst
rum
ent
Clu
ster
Pre
ssu
re P
ipe
Shif
ter
Ro
d
Stee
rin
g V
alve
Tie
Ro
d
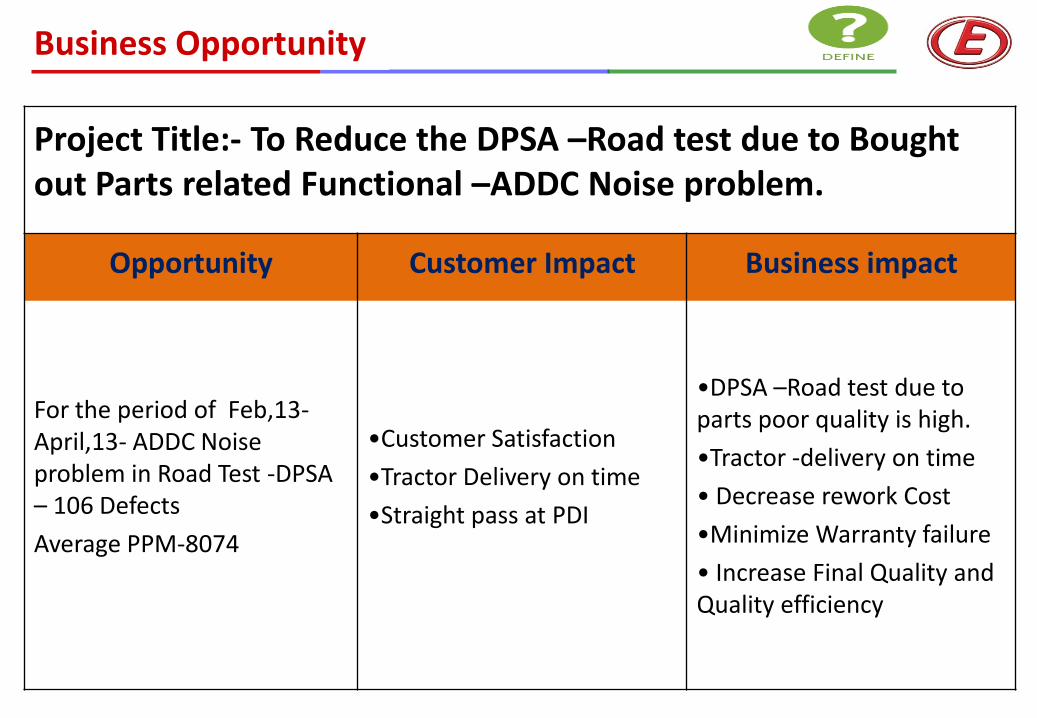
Project Title:- To Reduce the DPSA –Road test due to Bought out Parts related Functional –ADDC Noise problem.
Opportunity Customer Impact Business impact
For the period of Feb,13- April,13- ADDC Noise problem in Road Test -DPSA – 106 Defects
Average PPM-8074
•Customer Satisfaction
•Tractor Delivery on time
•Straight pass at PDI
•DPSA –Road test due to parts poor quality is high.
•Tractor -delivery on time
• Decrease rework Cost
•Minimize Warranty failure
• Increase Final Quality and Quality efficiency
Business Opportunity
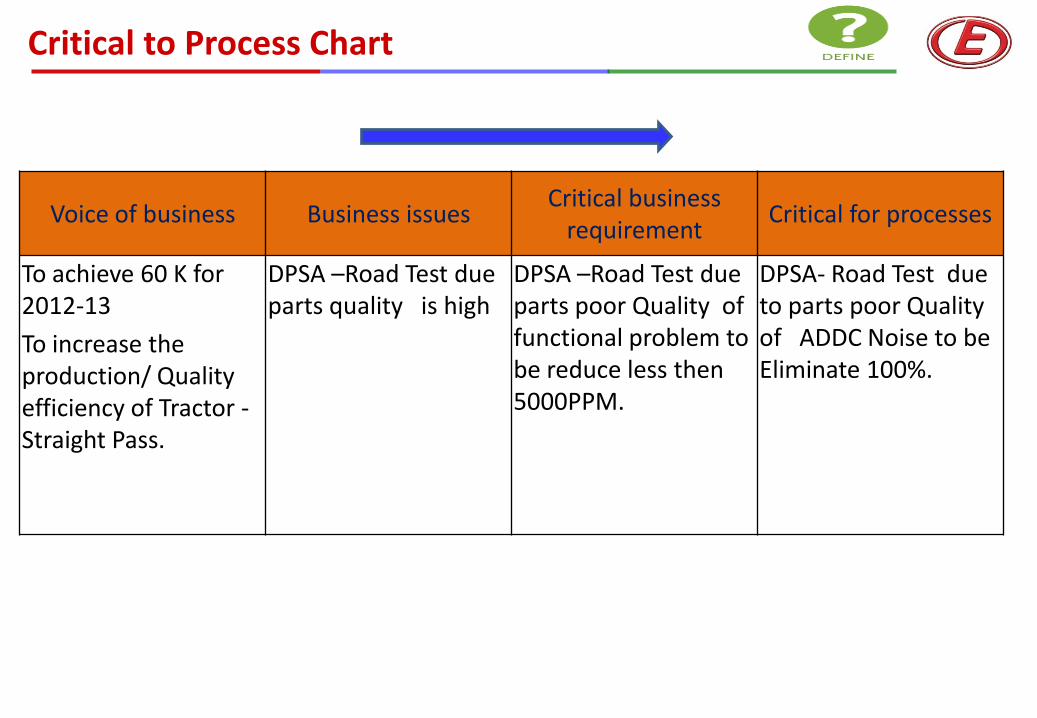
Critical to Process Chart
Voice of business Business issues Critical business
requirement Critical for processes
To achieve 60 K for 2012-13
To increase the production/ Quality efficiency of Tractor -Straight Pass.
DPSA –Road Test due parts quality is high
DPSA –Road Test due parts poor Quality of functional problem to be reduce less then 5000PPM.
DPSA- Road Test due to parts poor Quality of ADDC Noise to be Eliminate 100%.
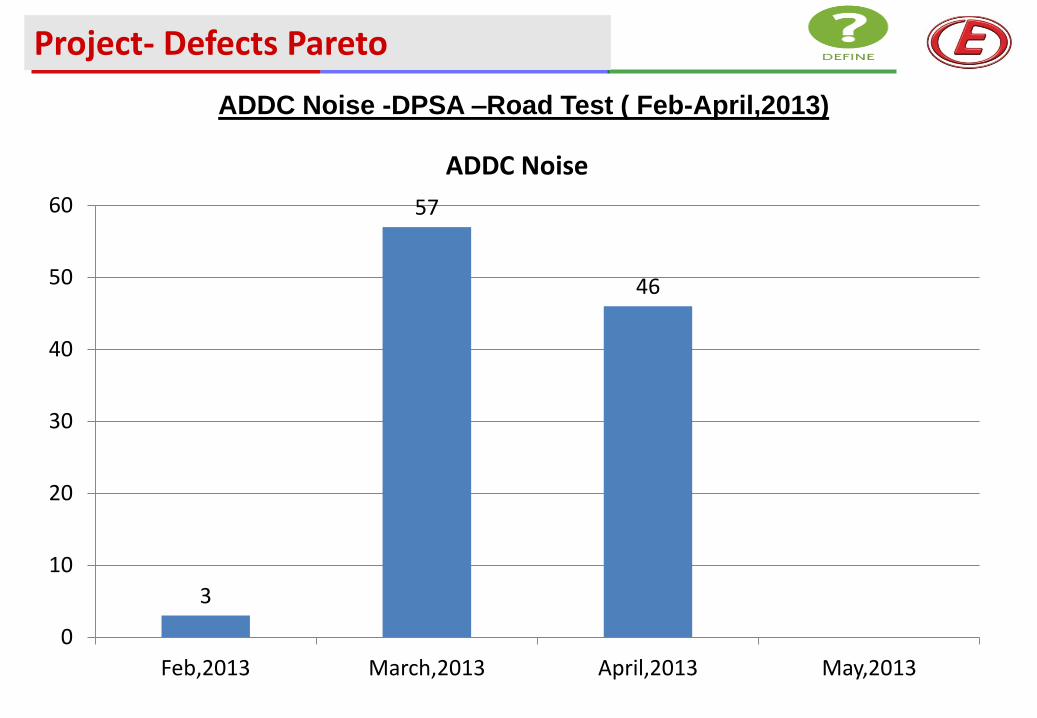
ADDC Noise -DPSA –Road Test ( Feb-April,2013)
Project- Defects Pareto
3
57
46
0
10
20
30
40
50
60
Feb,2013 March,2013 April,2013 May,2013
ADDC Noise
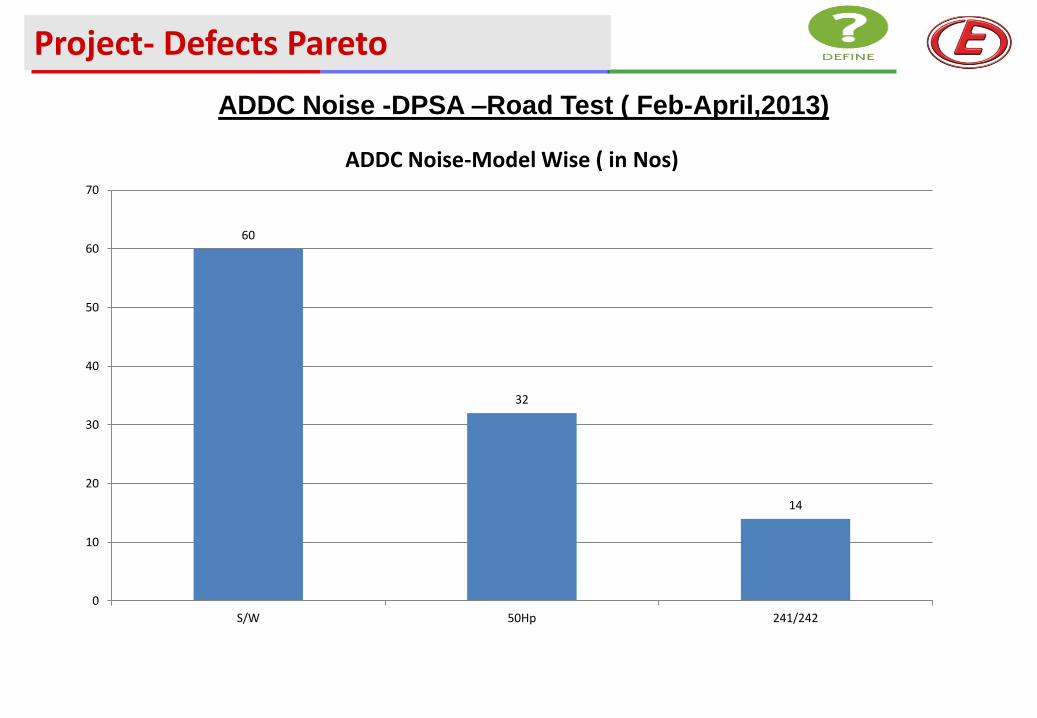
ADDC Noise -DPSA –Road Test ( Feb-April,2013)
Project- Defects Pareto
60
32
14
0
10
20
30
40
50
60
70
S/W 50Hp 241/242
ADDC Noise-Model Wise ( in Nos)
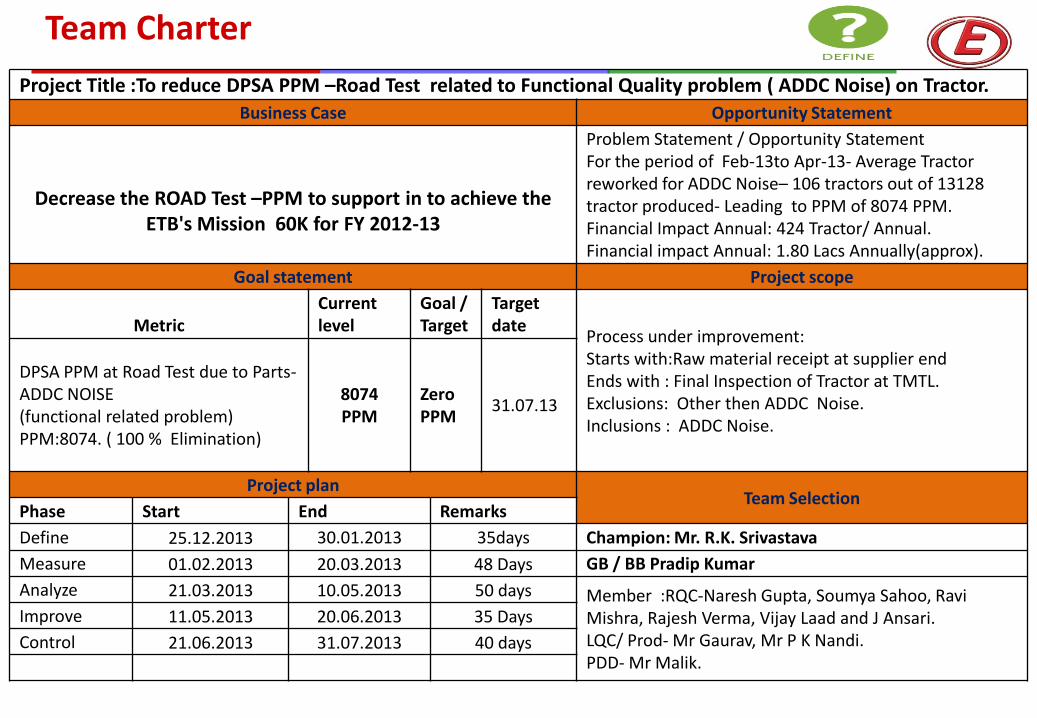
Team Charter
Project Title :To reduce DPSA PPM –Road Test related to Functional Quality problem ( ADDC Noise) on Tractor.
Business Case Opportunity Statement
Decrease the ROAD Test –PPM to support in to achieve the ETB's Mission 60K for FY 2012-13
Problem Statement / Opportunity Statement For the period of Feb-13to Apr-13- Average Tractor reworked for ADDC Noise– 106 tractors out of 13128 tractor produced- Leading to PPM of 8074 PPM. Financial Impact Annual: 424 Tractor/ Annual. Financial impact Annual: 1.80 Lacs Annually(approx).
Goal statement Project scope
Metric Current level
Goal / Target
Target date
Process under improvement: Starts with:Raw material receipt at supplier end Ends with : Final Inspection of Tractor at TMTL. Exclusions: Other then ADDC Noise. Inclusions : ADDC Noise.
DPSA PPM at Road Test due to Parts- ADDC NOISE (functional related problem) PPM:8074. ( 100 % Elimination)
8074 PPM
Zero PPM
31.07.13
Project plan Team Selection
Phase Start End Remarks
Define 25.12.2013 30.01.2013 35days Champion: Mr. R.K. Srivastava
Measure 01.02.2013 20.03.2013 48 Days GB / BB Pradip Kumar
Analyze 21.03.2013 10.05.2013 50 days Member :RQC-Naresh Gupta, Soumya Sahoo, Ravi Mishra, Rajesh Verma, Vijay Laad and J Ansari. LQC/ Prod- Mr Gaurav, Mr P K Nandi. PDD- Mr Malik.
Improve 11.05.2013 20.06.2013 35 Days
Control 21.06.2013 31.07.2013 40 days
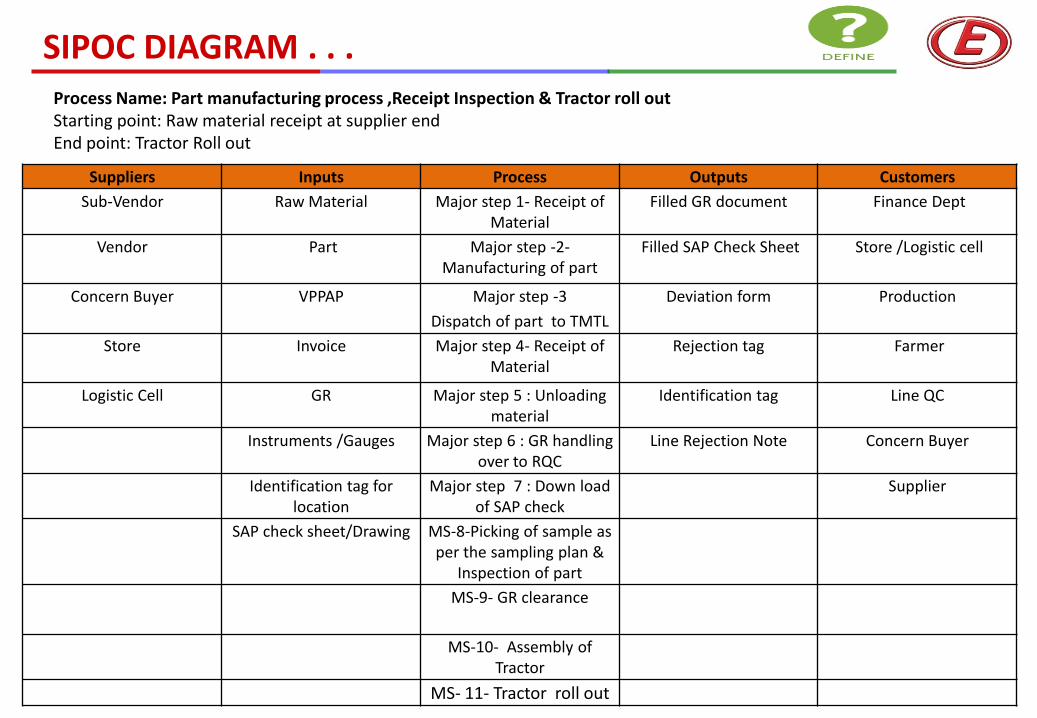
SIPOC DIAGRAM . . . Process Name: Part manufacturing process ,Receipt Inspection & Tractor roll out Starting point: Raw material receipt at supplier end End point: Tractor Roll out
Suppliers Inputs Process Outputs Customers
Sub-Vendor Raw Material Major step 1- Receipt of Material
Filled GR document Finance Dept
Vendor Part
Major step -2-Manufacturing of part
Filled SAP Check Sheet Store /Logistic cell
Concern Buyer VPPAP
Major step -3
Dispatch of part to TMTL
Deviation form Production
Store Invoice
Major step 4- Receipt of Material
Rejection tag Farmer
Logistic Cell GR Major step 5 : Unloading material
Identification tag Line QC
Instruments /Gauges Major step 6 : GR handling over to RQC
Line Rejection Note Concern Buyer
Identification tag for location
Major step 7 : Down load of SAP check
Supplier
SAP check sheet/Drawing MS-8-Picking of sample as per the sampling plan &
Inspection of part
MS-9- GR clearance
MS-10- Assembly of Tractor
MS- 11- Tractor roll out
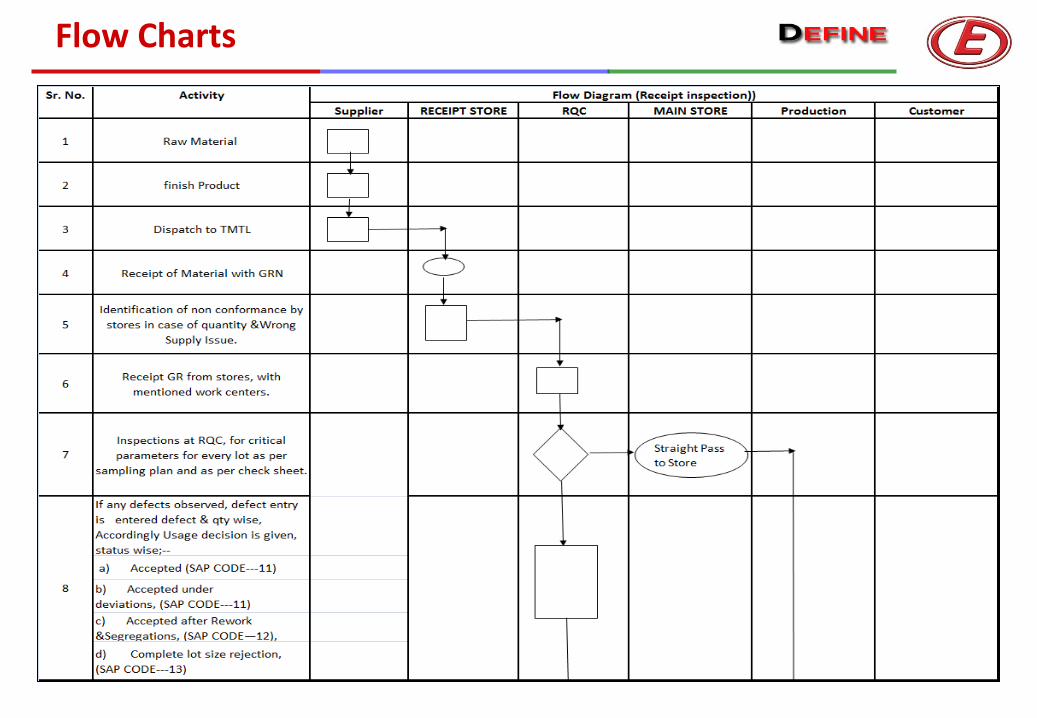
Flow Charts
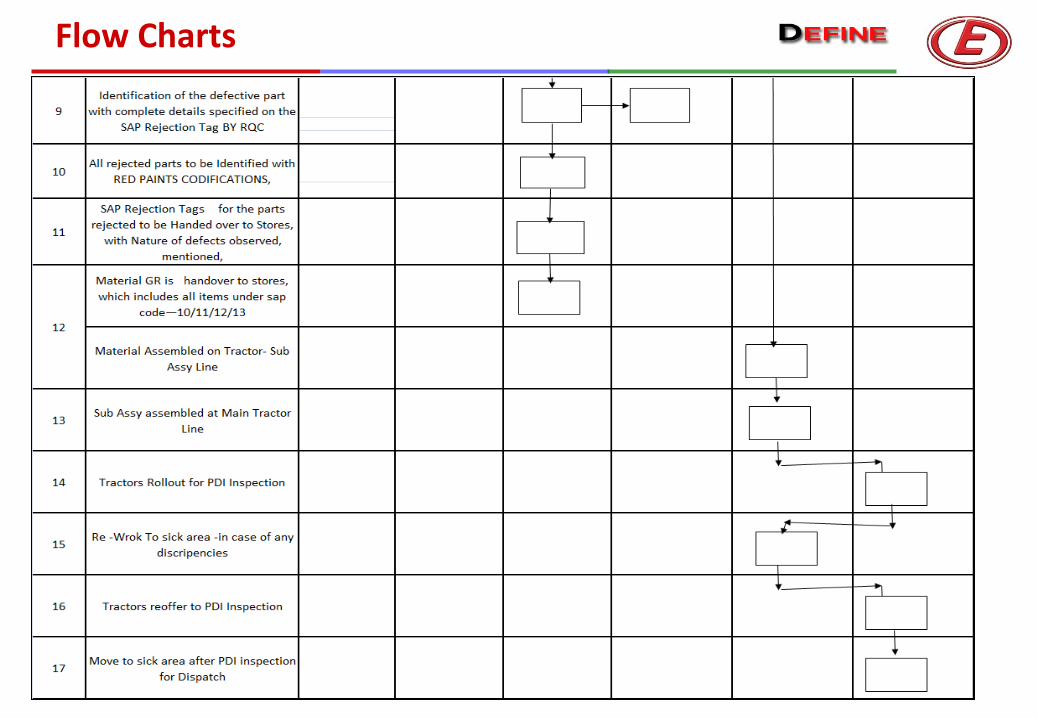
Flow Charts
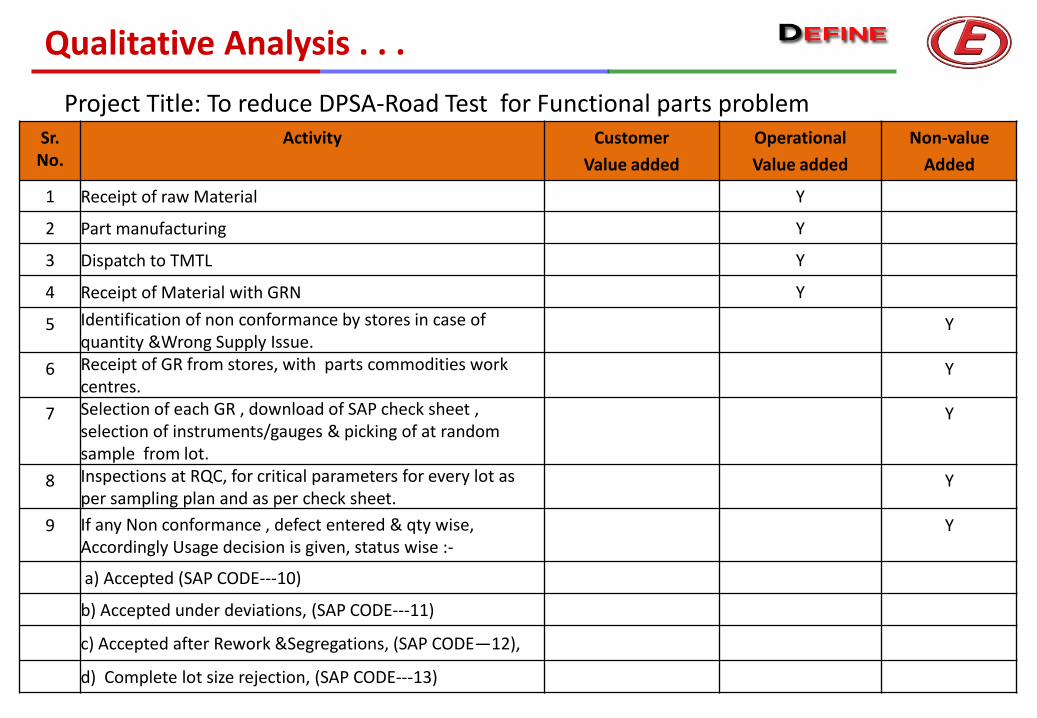
Qualitative Analysis . . .
Sr. No.
Activity Customer
Value added
Operational
Value added
Non-value
Added
1 Receipt of raw Material Y
2 Part manufacturing Y
3 Dispatch to TMTL Y
4 Receipt of Material with GRN Y
5 Identification of non conformance by stores in case of quantity &Wrong Supply Issue.
Y
6 Receipt of GR from stores, with parts commodities work centres.
Y
7 Selection of each GR , download of SAP check sheet , selection of instruments/gauges & picking of at random sample from lot.
Y
8 Inspections at RQC, for critical parameters for every lot as per sampling plan and as per check sheet.
Y
9 If any Non conformance , defect entered & qty wise, Accordingly Usage decision is given, status wise :-
Y
a) Accepted (SAP CODE---10)
b) Accepted under deviations, (SAP CODE---11)
c) Accepted after Rework &Segregations, (SAP CODE—12),
d) Complete lot size rejection, (SAP CODE---13)
Project Title: To reduce DPSA-Road Test for Functional parts problem
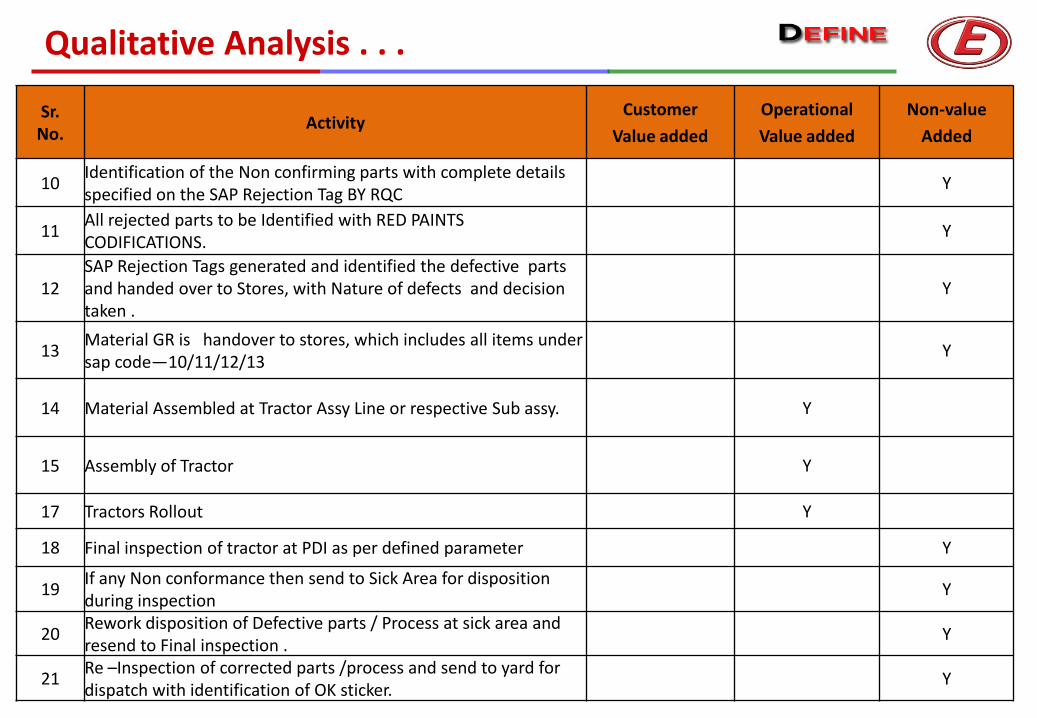
Sr. No.
Activity Customer
Value added
Operational
Value added
Non-value
Added
10 Identification of the Non confirming parts with complete details specified on the SAP Rejection Tag BY RQC
Y
11 All rejected parts to be Identified with RED PAINTS CODIFICATIONS.
Y
12 SAP Rejection Tags generated and identified the defective parts and handed over to Stores, with Nature of defects and decision taken .
Y
13 Material GR is handover to stores, which includes all items under sap code—10/11/12/13
Y
14 Material Assembled at Tractor Assy Line or respective Sub assy. Y
15 Assembly of Tractor Y
17 Tractors Rollout Y
18 Final inspection of tractor at PDI as per defined parameter Y
19 If any Non conformance then send to Sick Area for disposition during inspection
Y
20 Rework disposition of Defective parts / Process at sick area and resend to Final inspection .
Y
21 Re –Inspection of corrected parts /process and send to yard for dispatch with identification of OK sticker.
Y
Qualitative Analysis . . .
Define Opportunities
Measure Performance
Analyze Opportunity
Improve Performance
Control Performance
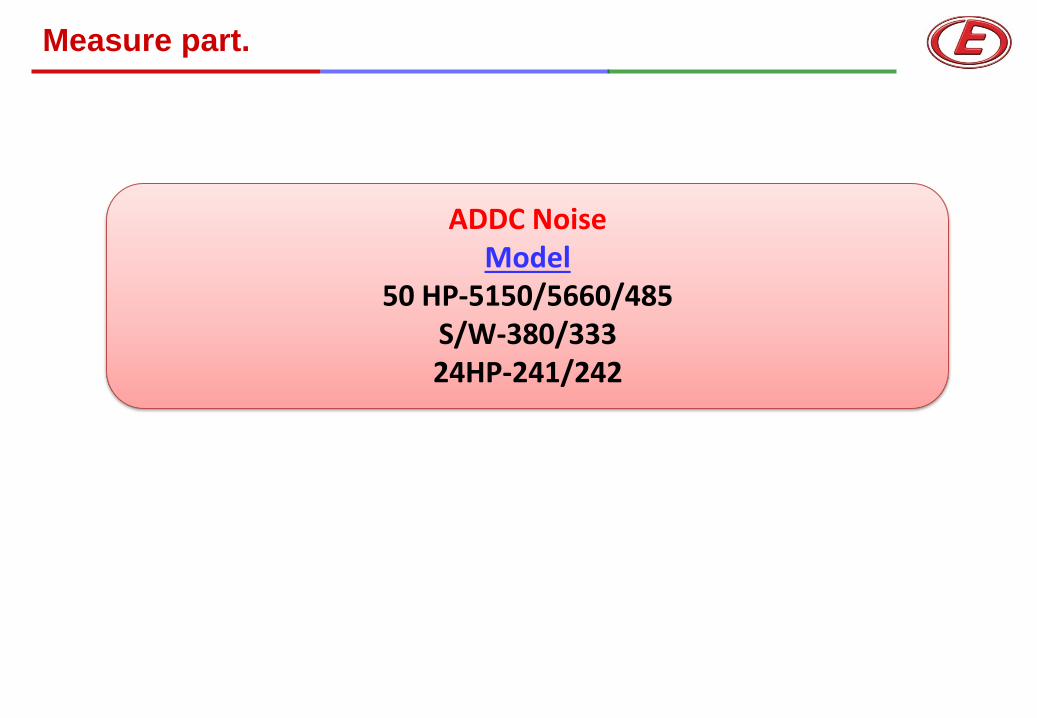
ADDC Noise Model
50 HP-5150/5660/485 S/W-380/333 24HP-241/242
Measure part.
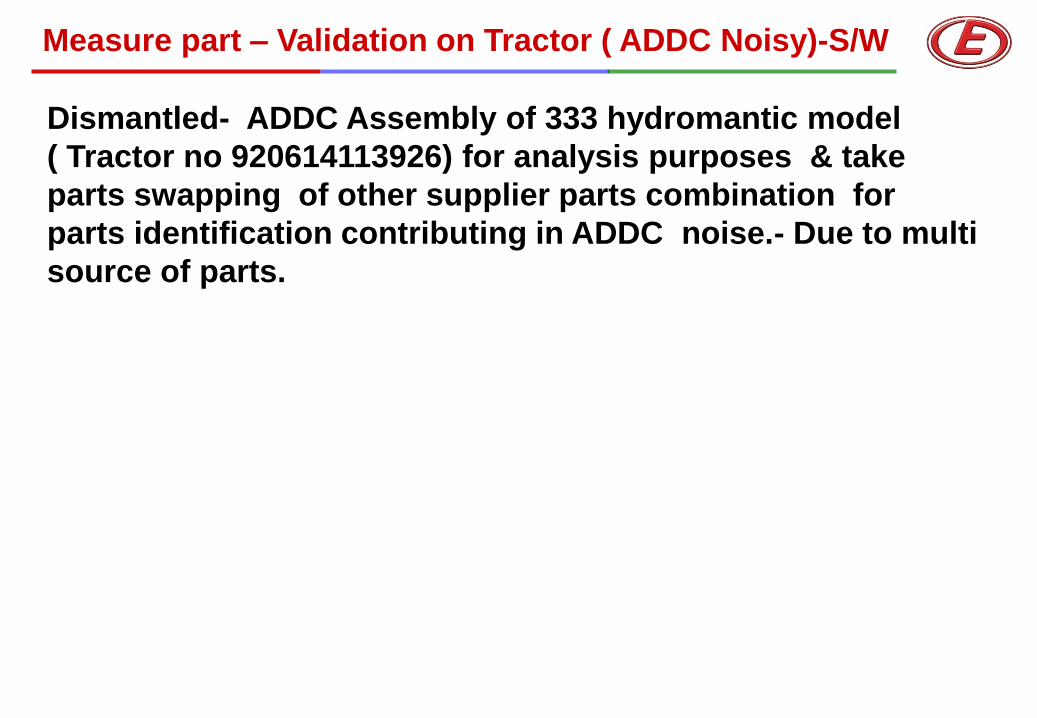
Measure part – Validation on Tractor ( ADDC Noisy)-S/W
Dismantled- ADDC Assembly of 333 hydromantic model
( Tractor no 920614113926) for analysis purposes & take
parts swapping of other supplier parts combination for
parts identification contributing in ADDC noise.- Due to multi
source of parts.
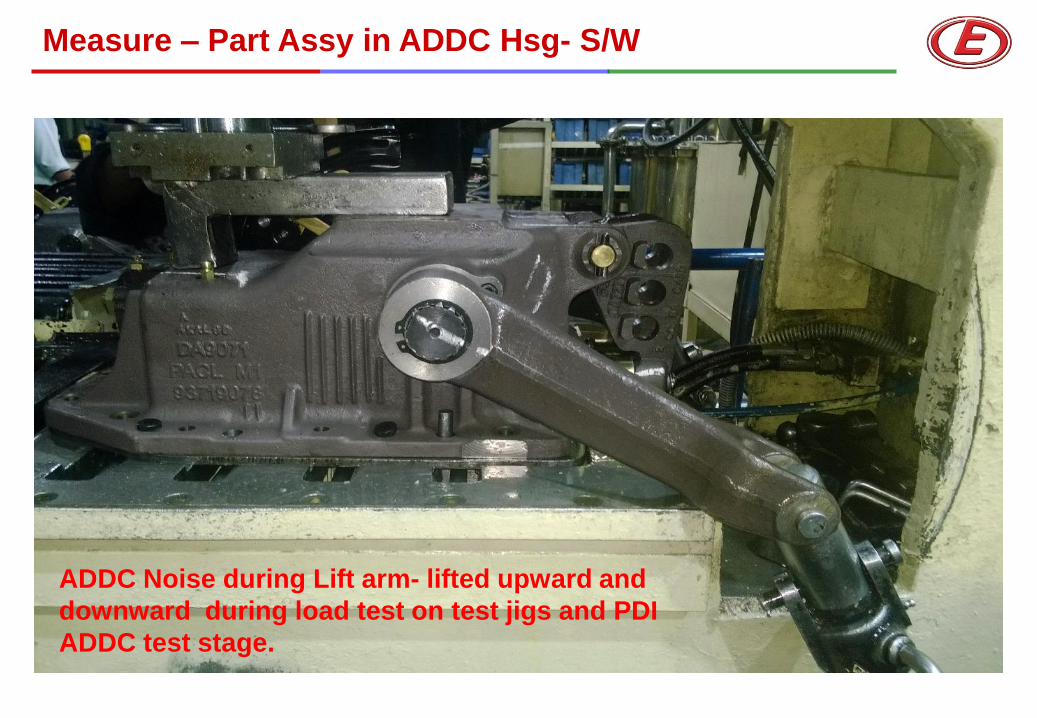
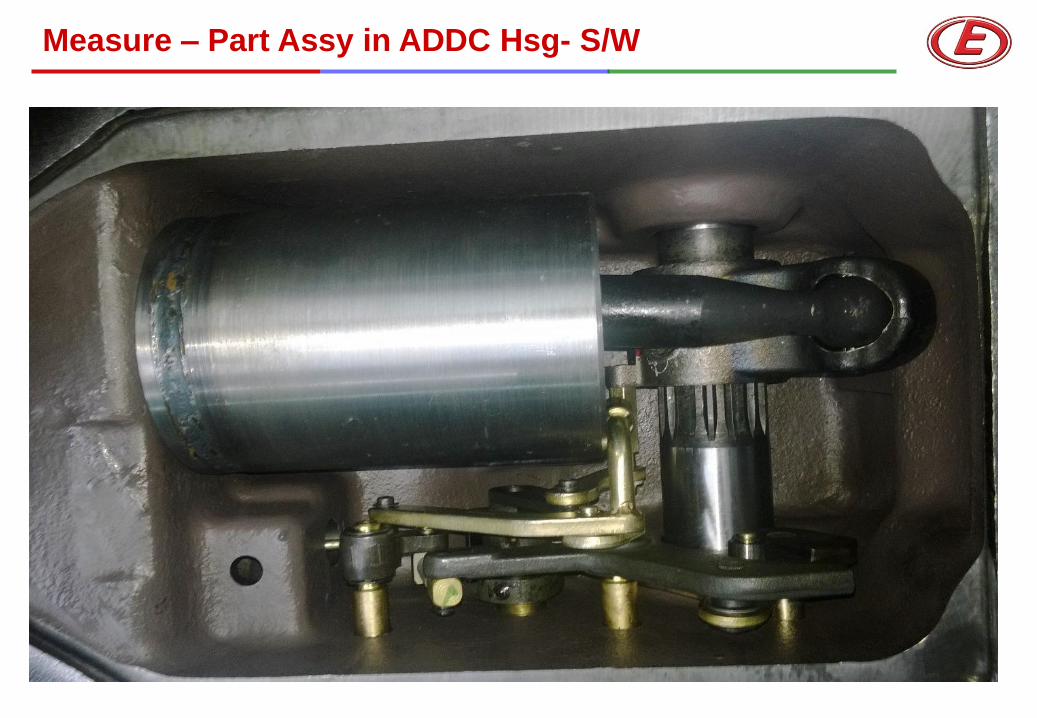
Measure – Part Assy in ADDC Hsg- S/W
ADDC Noise during Lift arm- lifted upward and
downward during load test on test jigs and PDI
ADDC test stage.
Measure – Part Assy in ADDC Hsg- S/W
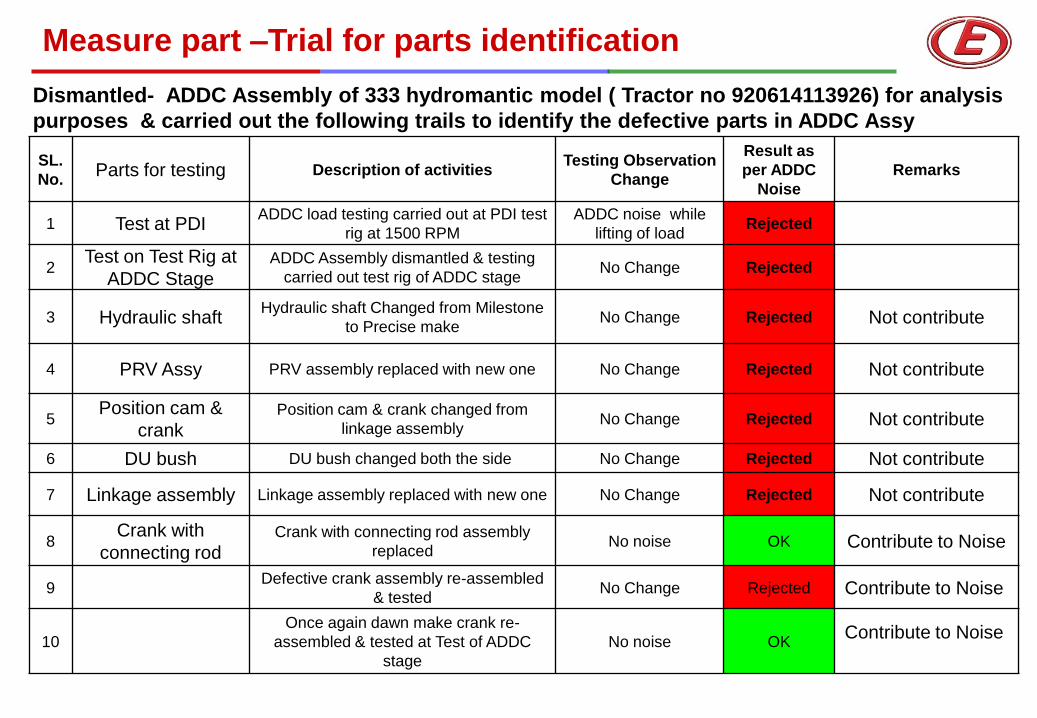
SL.
No. Parts for testing Description of activities
Testing Observation
Change
Result as
per ADDC
Noise
Remarks
1 Test at PDI ADDC load testing carried out at PDI test
rig at 1500 RPM
ADDC noise while
lifting of load Rejected
2 Test on Test Rig at
ADDC Stage ADDC Assembly dismantled & testing
carried out test rig of ADDC stage No Change Rejected
3 Hydraulic shaft Hydraulic shaft Changed from Milestone
to Precise make No Change Rejected Not contribute
4 PRV Assy PRV assembly replaced with new one No Change Rejected Not contribute
5 Position cam &
crank Position cam & crank changed from
linkage assembly No Change Rejected Not contribute
6 DU bush DU bush changed both the side No Change Rejected Not contribute
7 Linkage assembly Linkage assembly replaced with new one No Change Rejected Not contribute
8 Crank with
connecting rod Crank with connecting rod assembly
replaced No noise OK Contribute to Noise
9 Defective crank assembly re-assembled
& tested No Change Rejected Contribute to Noise
10
Once again dawn make crank re-
assembled & tested at Test of ADDC
stage
No noise OK Contribute to Noise
Dismantled- ADDC Assembly of 333 hydromantic model ( Tractor no 920614113926) for analysis
purposes & carried out the following trails to identify the defective parts in ADDC Assy
Measure part –Trial for parts identification
Two numbers of Defective tractors of 380 hydromantic
( 920613113975 & 920613114030 ) dismantled
& defective crank assembly of Osho forge make replaced by
Dawn Motors make crank & tested the tractors at Hydraulic testing
( RPM -1500 )
at PDI stage Both the tractors found OK- No ADDC noise.
Measure part – Conclusion after Validation on Tractor
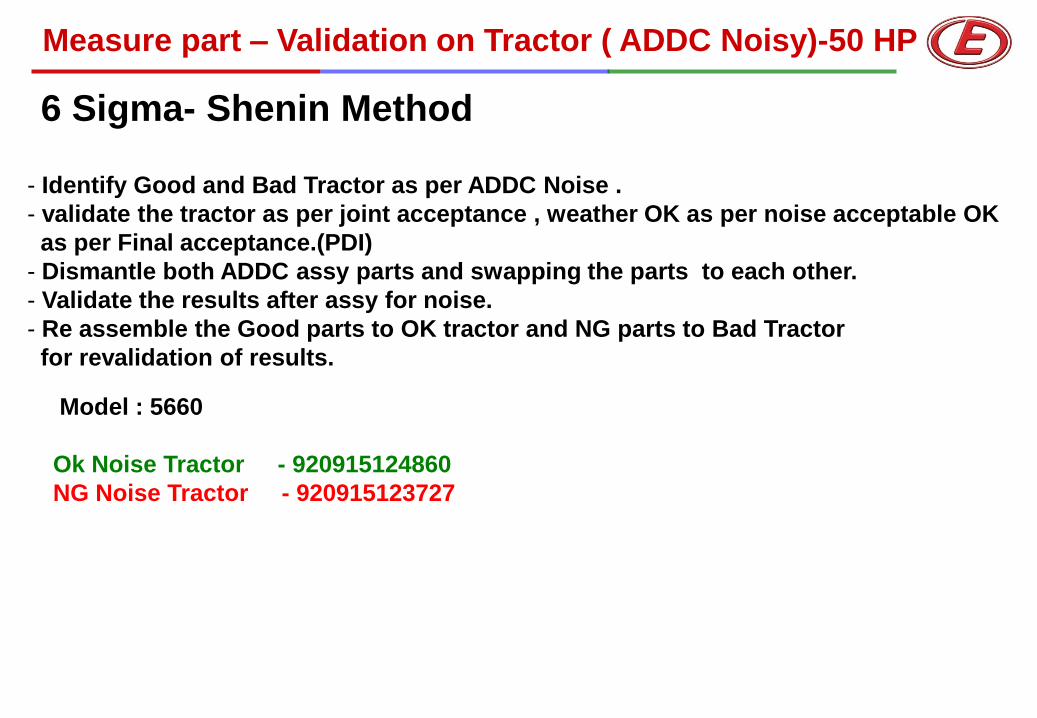
6 Sigma- Shenin Method
- Identify Good and Bad Tractor as per ADDC Noise .
- validate the tractor as per joint acceptance , weather OK as per noise acceptable OK
as per Final acceptance.(PDI)
- Dismantle both ADDC assy parts and swapping the parts to each other.
- Validate the results after assy for noise.
- Re assemble the Good parts to OK tractor and NG parts to Bad Tractor
for revalidation of results.
Model : 5660
Ok Noise Tractor - 920915124860
NG Noise Tractor - 920915123727
Measure part – Validation on Tractor ( ADDC Noisy)-50 HP
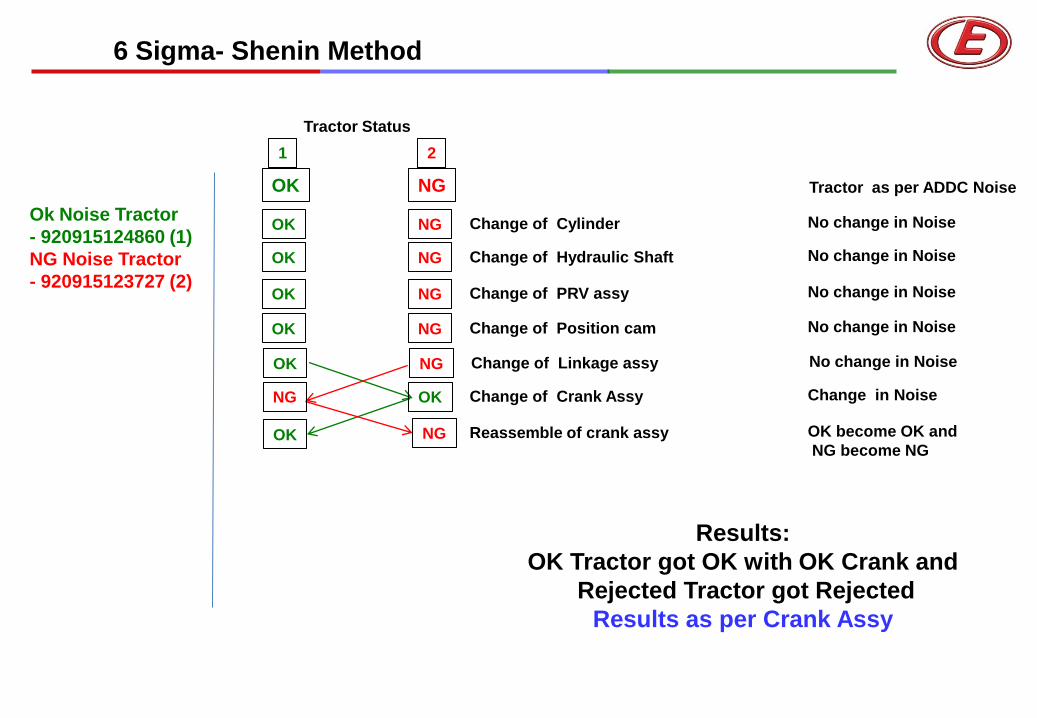
6 Sigma- Shenin Method
Ok Noise Tractor
- 920915124860 (1)
NG Noise Tractor
- 920915123727 (2)
OK NG
Tractor Status
1 2
Results:
OK Tractor got OK with OK Crank and
Rejected Tractor got Rejected
Results as per Crank Assy
OK NG
OK NG
OK NG
Tractor as per ADDC Noise
No change in Noise Change of Cylinder OK NG
No change in Noise Change of Hydraulic Shaft OK NG
No change in Noise Change of PRV assy OK NG
No change in Noise Change of Position cam
OK NG No change in Noise Change of Linkage assy
Change in Noise Change of Crank Assy
OK become OK and
NG become NG Reassemble of crank assy

6 Sigma- Shenin Method
- Make comparison report through the layout inspection for each identified critical parameter
for OK and Rejected Tractor Crank.
- Validate the results as per Drawing specification Vs results.
Observation:
NG Crank- Sphere depth found More Spec: 20 +0.15/- 0- Obs: 21.19.
Sphere Diameter 40 - found Over Size up to 41.74mm .
OK Crank- Sphere depth found Ok as per specification ,
Sphere depth found More Spec: 20 +0.15/- 0- Obs: 20.13.
Sphere Diameter 40 - found Over Size up to 40.10mm .
.
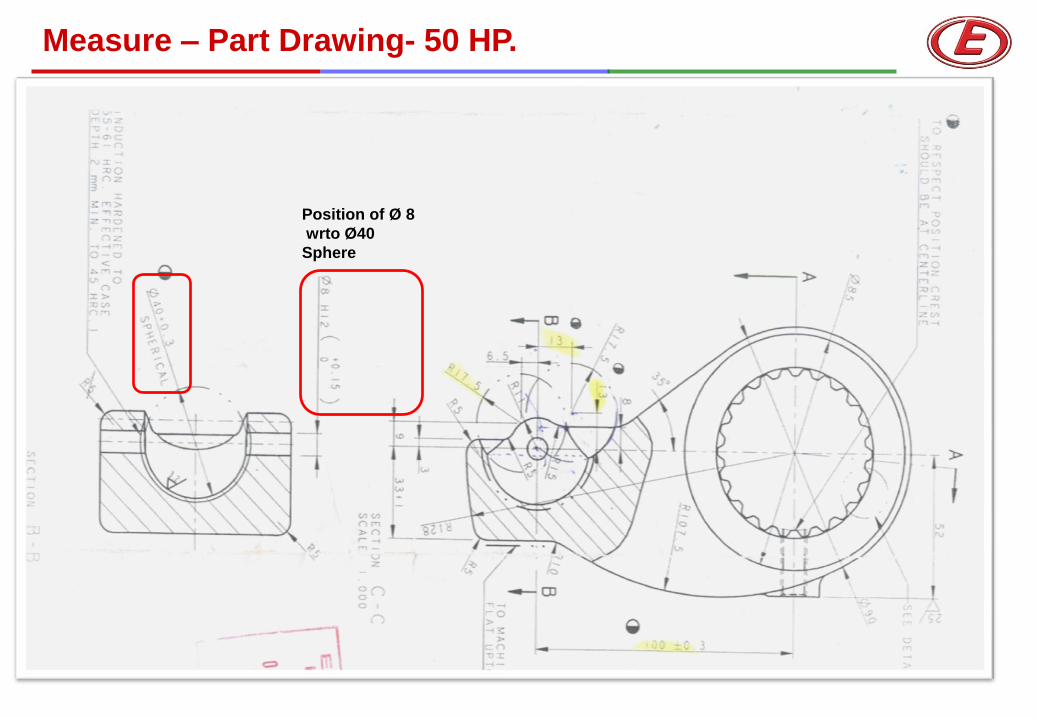
Measure – Part Drawing- 50 HP.
Position of Ø 8
wrto Ø40
Sphere
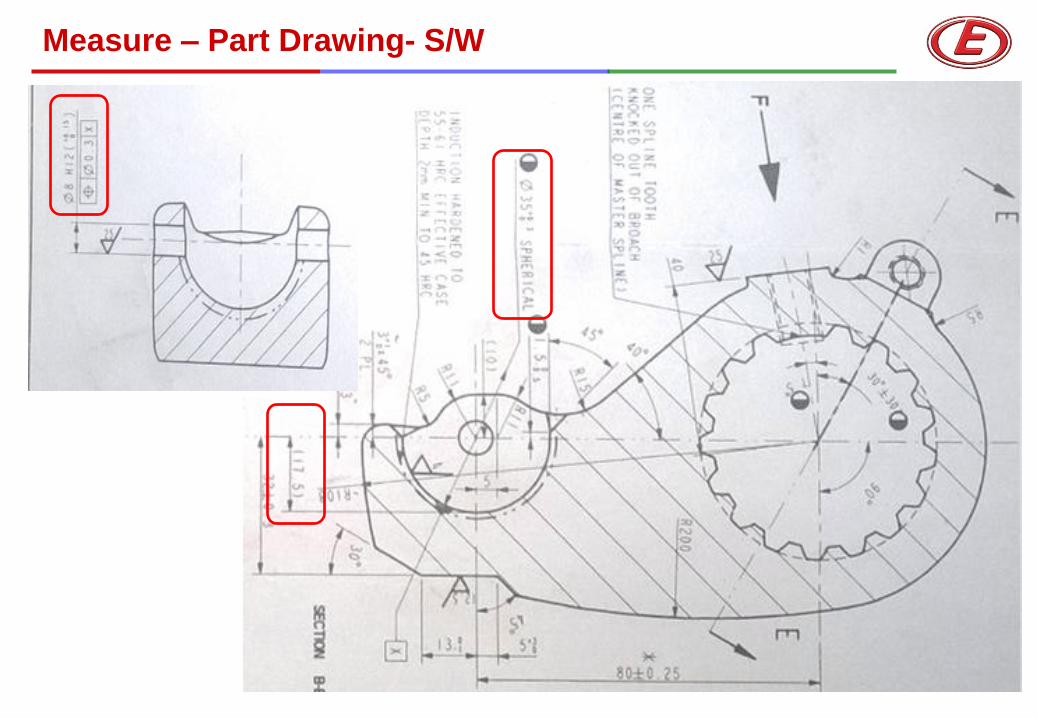
Measure – Part Drawing- S/W
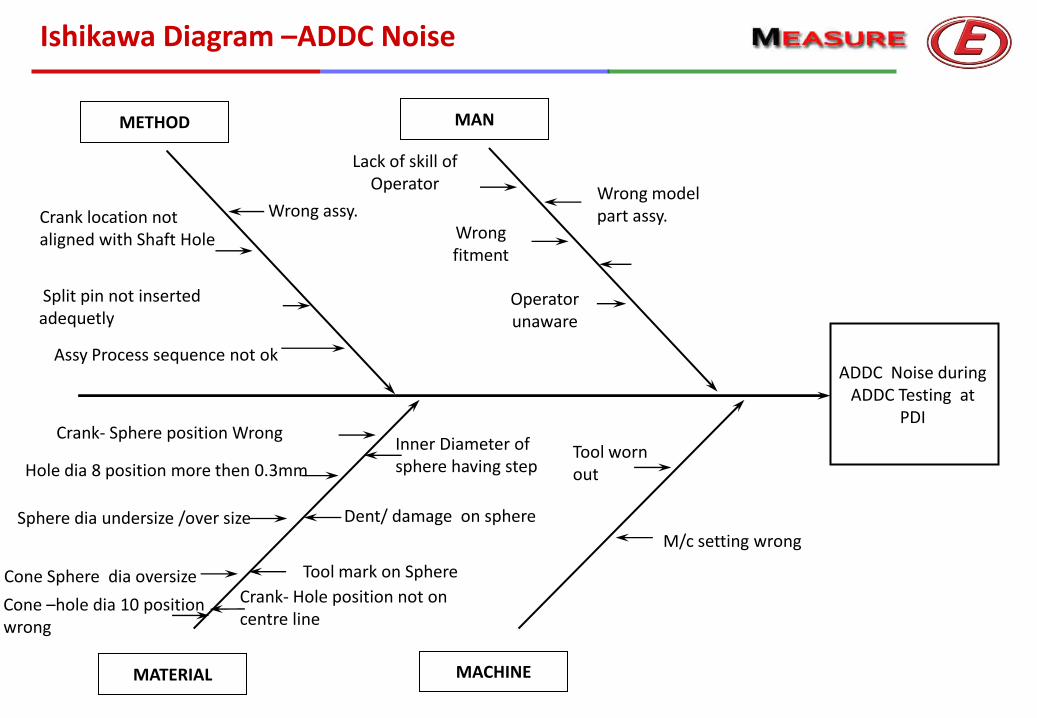
Ishikawa Diagram –ADDC Noise
ADDC Noise during ADDC Testing at
PDI
METHOD MAN
MACHINE MATERIAL
Wrong model part assy.
Lack of skill of Operator
Wrong fitment
Operator unaware
Wrong assy. Crank location not aligned with Shaft Hole
Assy Process sequence not ok
M/c setting wrong
Tool worn out
Tool mark on Sphere
Dent/ damage on sphere
Inner Diameter of sphere having step Hole dia 8 position more then 0.3mm
Sphere dia undersize /over size
Crank- Sphere position Wrong
Split pin not inserted adequetly
Cone Sphere dia oversize Crank- Hole position not on centre line
Cone –hole dia 10 position wrong
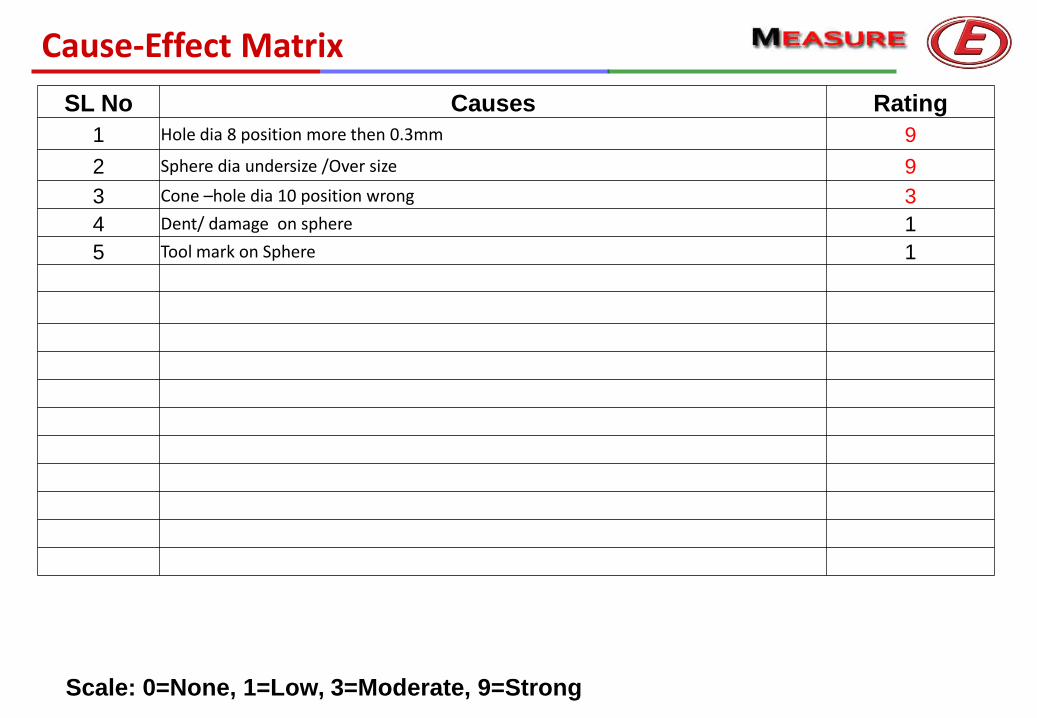
Cause-Effect Matrix
SL No Causes Rating
1 Hole dia 8 position more then 0.3mm 9
2 Sphere dia undersize /Over size 9
3 Cone –hole dia 10 position wrong 3
4 Dent/ damage on sphere 1
5 Tool mark on Sphere 1
Scale: 0=None, 1=Low, 3=Moderate, 9=Strong
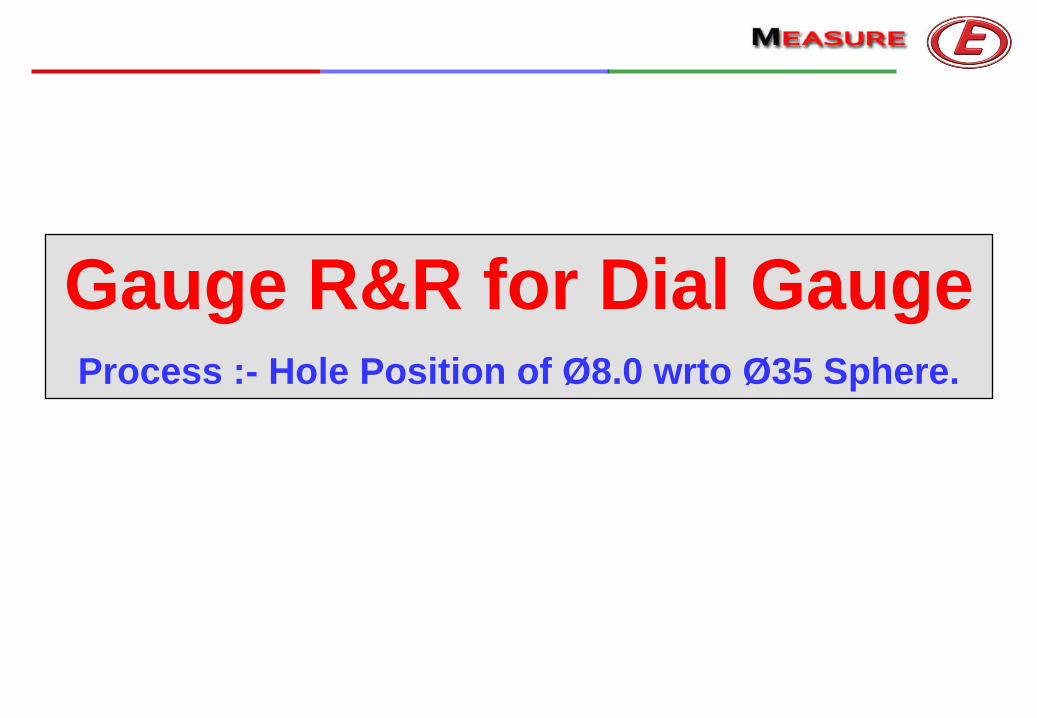
Gauge R&R for Dial Gauge Process :- Hole Position of Ø8.0 wrto Ø35 Sphere.
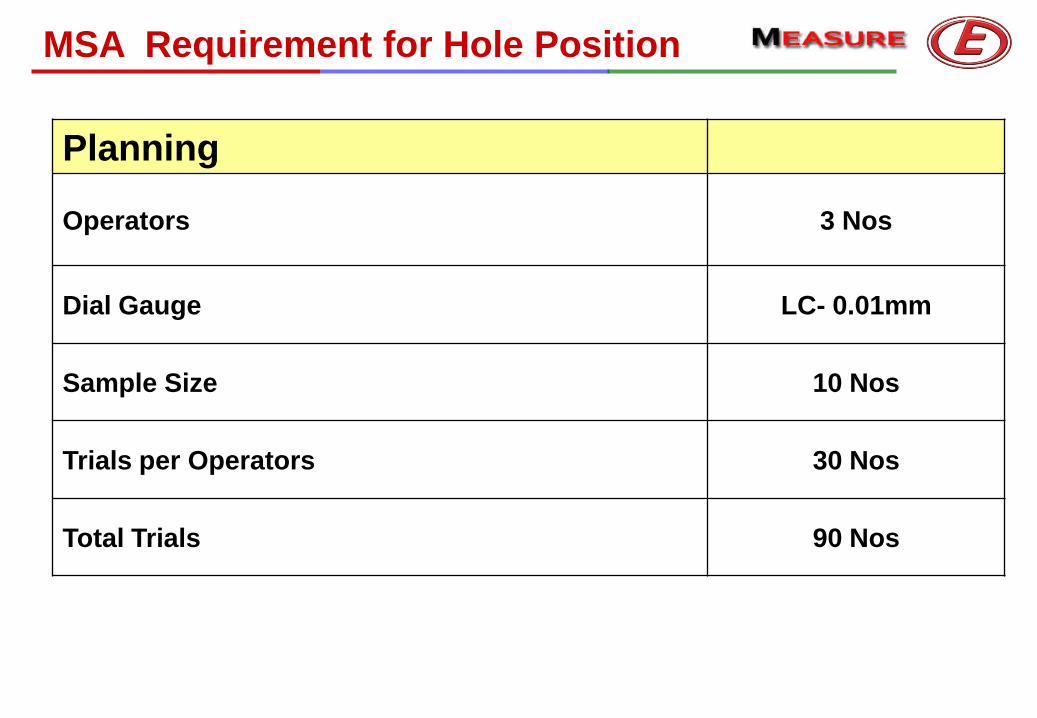
Planning
Operators 3 Nos
Dial Gauge LC- 0.01mm
Sample Size 10 Nos
Trials per Operators 30 Nos
Total Trials 90 Nos
MSA Requirement for Hole Position
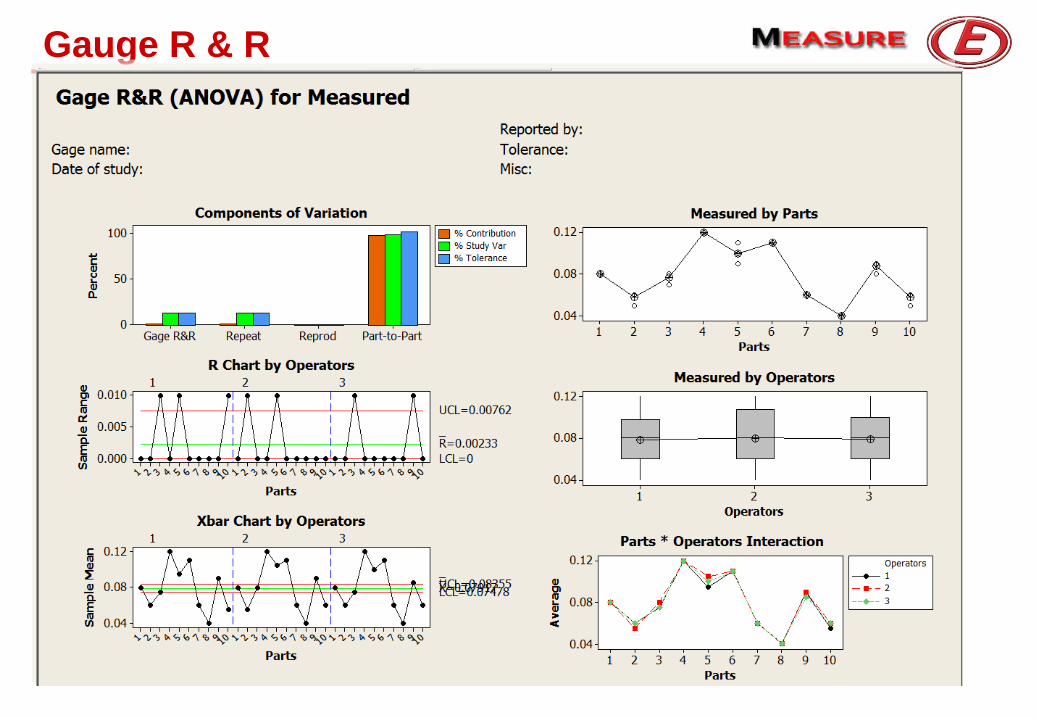
Gauge R & R
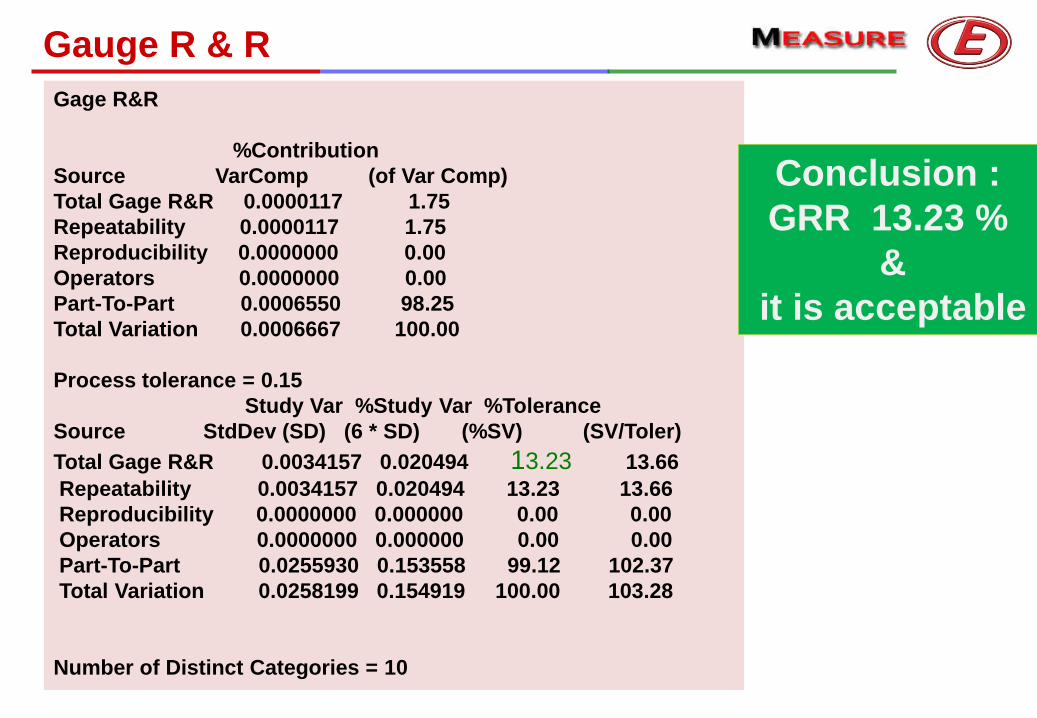
Gauge R & R
Gage R&R
%Contribution
Source VarComp (of Var Comp)
Total Gage R&R 0.0000117 1.75
Repeatability 0.0000117 1.75
Reproducibility 0.0000000 0.00
Operators 0.0000000 0.00
Part-To-Part 0.0006550 98.25
Total Variation 0.0006667 100.00
Process tolerance = 0.15
Study Var %Study Var %Tolerance
Source StdDev (SD) (6 * SD) (%SV) (SV/Toler)
Total Gage R&R 0.0034157 0.020494 13.23 13.66
Repeatability 0.0034157 0.020494 13.23 13.66
Reproducibility 0.0000000 0.000000 0.00 0.00
Operators 0.0000000 0.000000 0.00 0.00
Part-To-Part 0.0255930 0.153558 99.12 102.37
Total Variation 0.0258199 0.154919 100.00 103.28
Number of Distinct Categories = 10
Conclusion :
GRR 13.23 %
&
it is acceptable
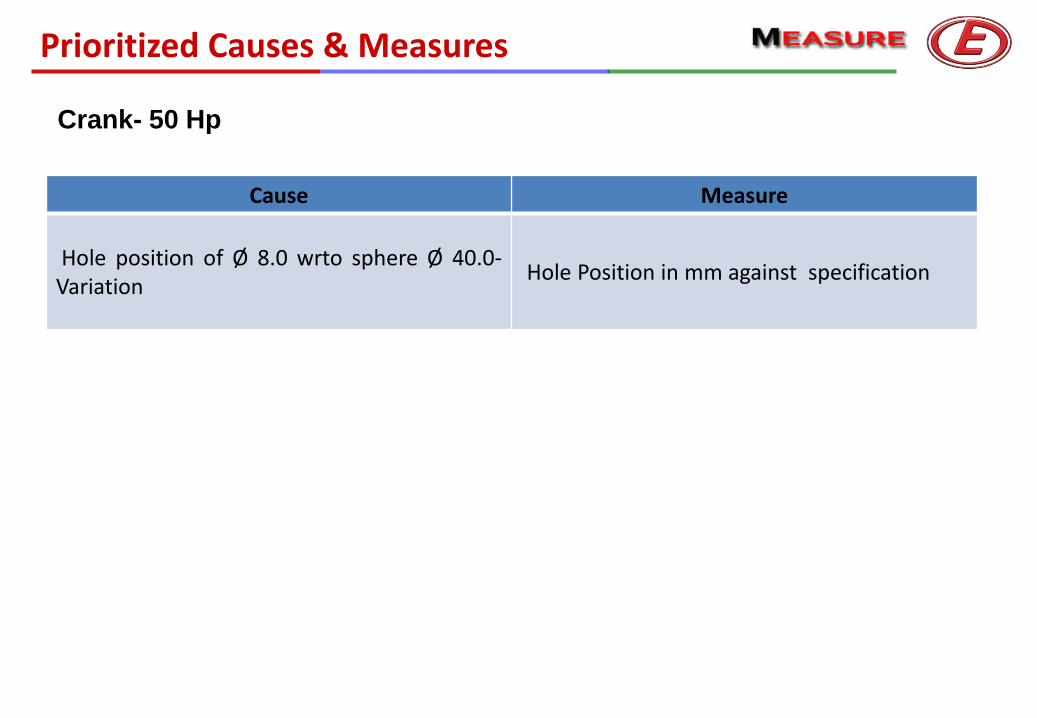
Prioritized Causes & Measures
Cause Measure
Hole position of Ø 8.0 wrto sphere Ø 40.0- Variation
Hole Position in mm against specification
Crank- 50 Hp
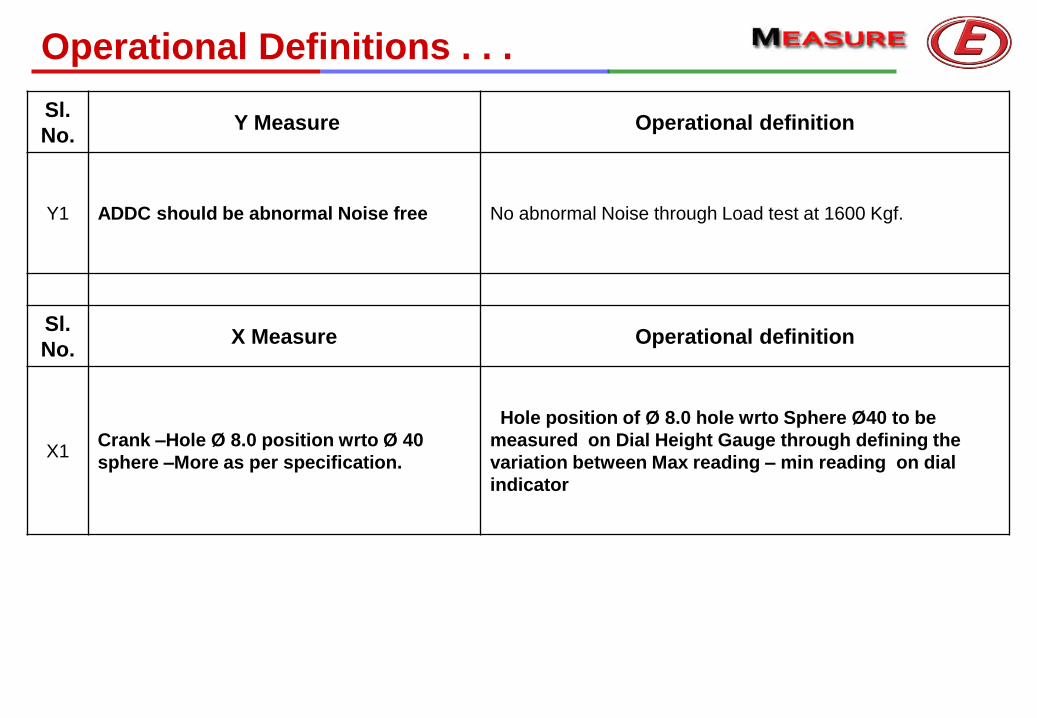
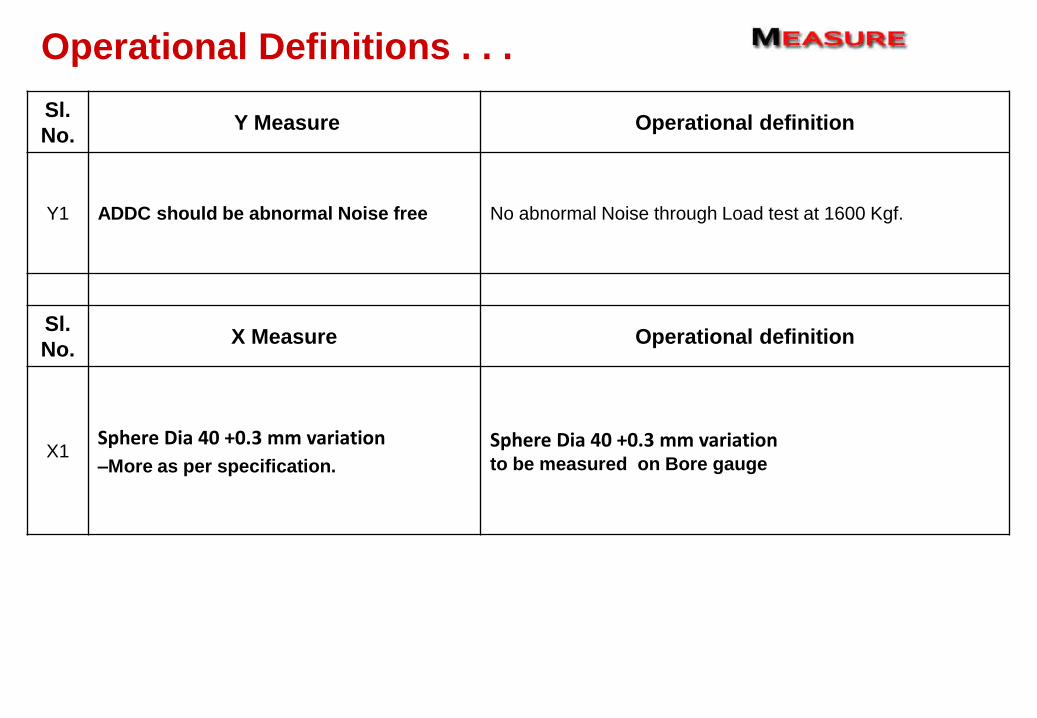
Sl.
No. Y Measure Operational definition
Y1 ADDC should be abnormal Noise free No abnormal Noise through Load test at 1600 Kgf.
Sl.
No. X Measure Operational definition
X1 Crank –Hole Ø 8.0 position wrto Ø 40
sphere –More as per specification.
Hole position of Ø 8.0 hole wrto Sphere Ø40 to be
measured on Dial Height Gauge through defining the
variation between Max reading – min reading on dial
indicator
Operational Definitions . . .
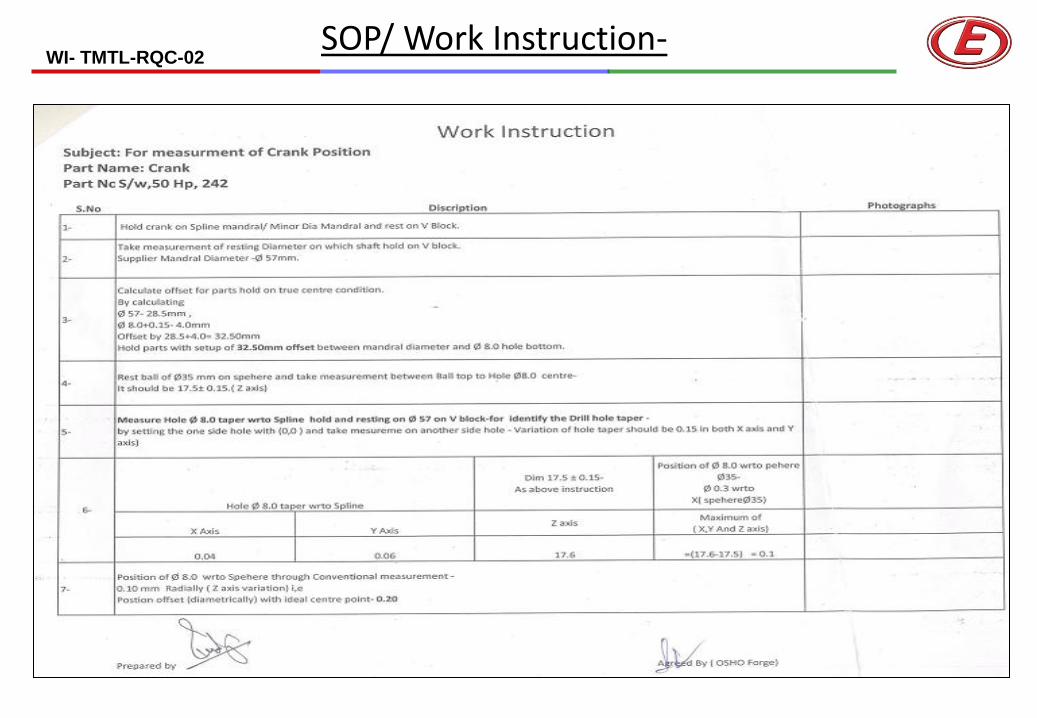
SOP/ Work Instruction- WI- TMTL-RQC-02
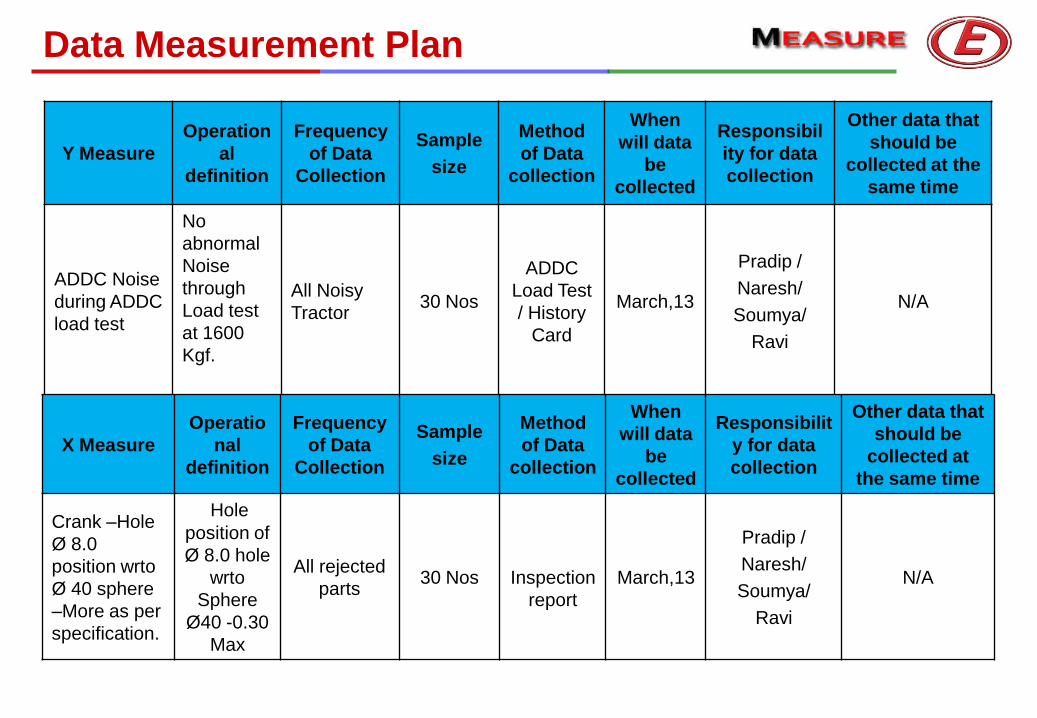
Data Measurement Plan
Y Measure
Operation
al
definition
Frequency
of Data
Collection
Sample
size
Method
of Data
collection
When
will data
be
collected
Responsibil
ity for data
collection
Other data that
should be
collected at the
same time
ADDC Noise
during ADDC
load test
No
abnormal
Noise
through
Load test
at 1600
Kgf.
All Noisy
Tractor 30 Nos
ADDC
Load Test
/ History
Card
March,13
Pradip /
Naresh/
Soumya/
Ravi
N/A
X Measure
Operatio
nal
definition
Frequency
of Data
Collection
Sample
size
Method
of Data
collection
When
will data
be
collected
Responsibilit
y for data
collection
Other data that
should be
collected at
the same time
Crank –Hole
Ø 8.0
position wrto
Ø 40 sphere
–More as per
specification.
Hole
position of
Ø 8.0 hole
wrto
Sphere
Ø40 -0.30
Max
All rejected
parts 30 Nos
Inspection
report
March,13
Pradip /
Naresh/
Soumya/
Ravi
N/A
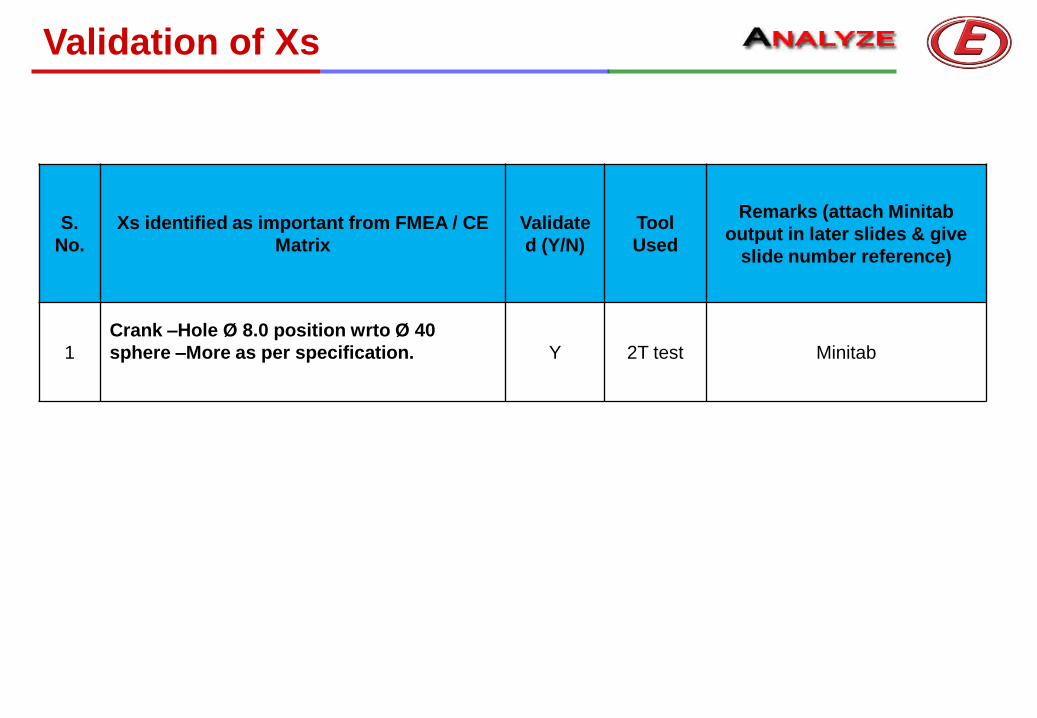
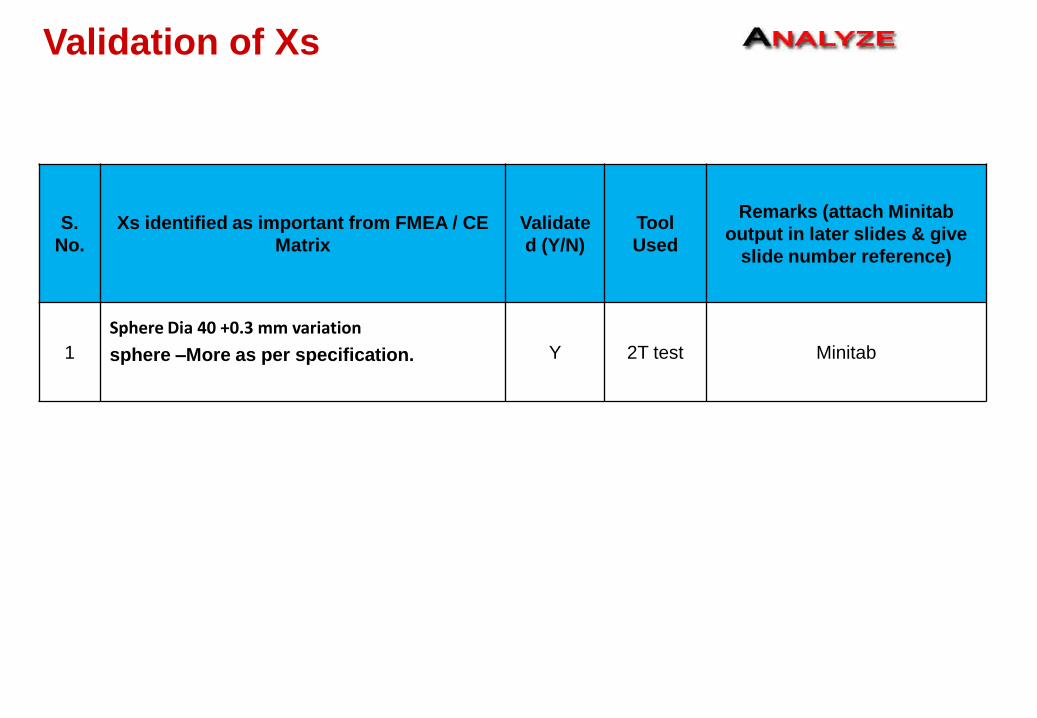
Validation of Xs
S.
No.
Xs identified as important from FMEA / CE
Matrix
Validate
d (Y/N)
Tool
Used
Remarks (attach Minitab
output in later slides & give
slide number reference)
1
Crank –Hole Ø 8.0 position wrto Ø 40
sphere –More as per specification.
Y 2T test Minitab

Crank –Hole Ø 8.0 position wrto Ø 40 sphere More.
Conclusion : As per p value is close to 0.05, we suspect hole position
more then 0.15 is contributing to noise ,but we need to further investigate
H0 : There is no Abnormal Noise with position within limit.
HA : There is Noise if crank having position more then Specification.
Two-Sample T-Test and CI: Hole position, Results
Two-sample T for Hole position
Results N Mean St Dev SE Mean
Noise 2 0.2300 0.0424 0.030
OK 28 0.0929 0.0292 0.0055
Difference = mu (Noise) - mu (OK)
Estimate for difference: 0.1371
95% lower bound for difference: -0.0554
T-Test of difference = 0 (vs >): T-Value = 4.50
P-Value = 0.070 DF = 1
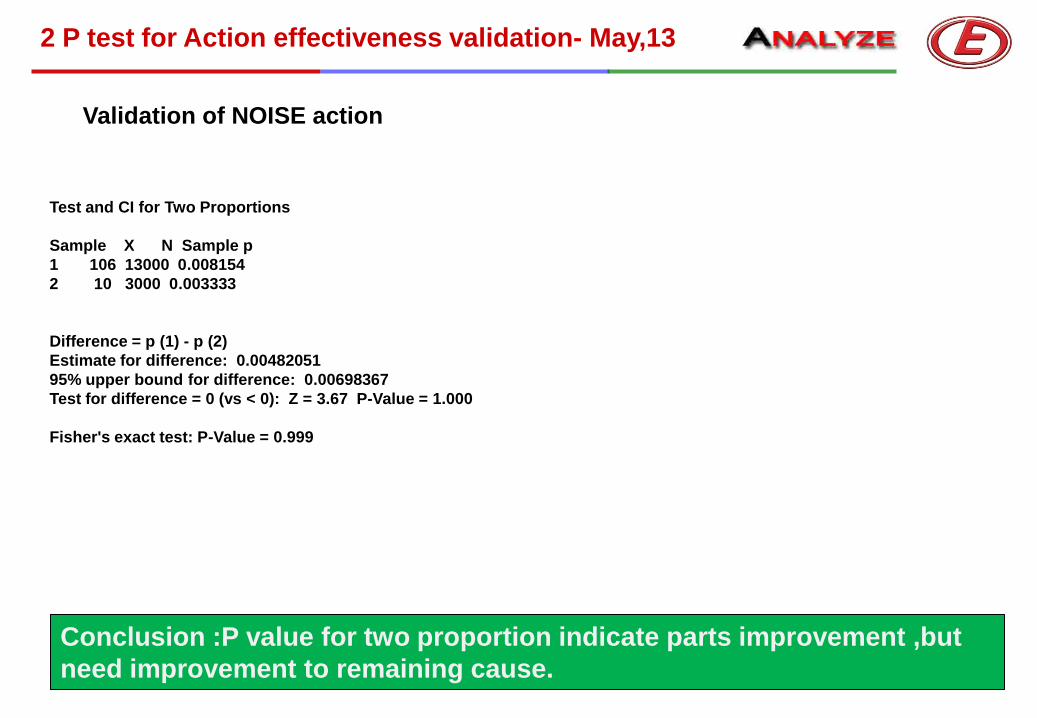
2 P test for Action effectiveness validation- May,13
Conclusion :P value for two proportion indicate parts improvement ,but
need improvement to remaining cause.
Test and CI for Two Proportions
Sample X N Sample p
1 106 13000 0.008154
2 10 3000 0.003333
Difference = p (1) - p (2)
Estimate for difference: 0.00482051
95% upper bound for difference: 0.00698367
Test for difference = 0 (vs < 0): Z = 3.67 P-Value = 1.000
Fisher's exact test: P-Value = 0.999
Validation of NOISE action
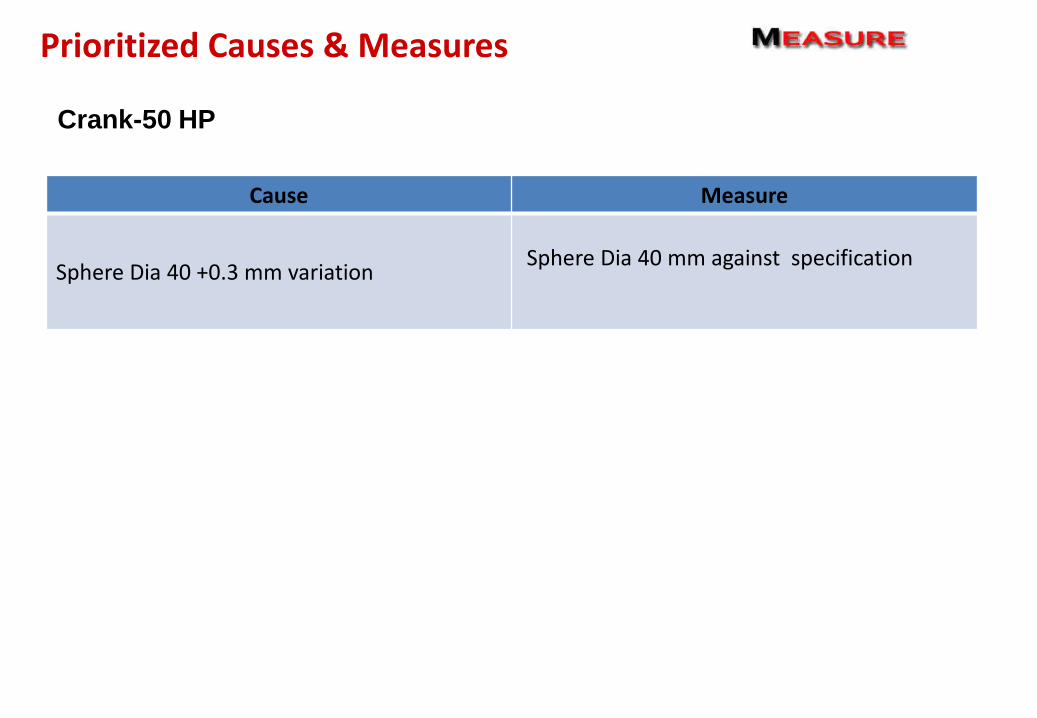
Prioritized Causes & Measures
Cause Measure
Sphere Dia 40 +0.3 mm variation Sphere Dia 40 mm against specification
Crank-50 HP
Sl.
No. Y Measure Operational definition
Y1 ADDC should be abnormal Noise free No abnormal Noise through Load test at 1600 Kgf.
Sl.
No. X Measure Operational definition
X1 Sphere Dia 40 +0.3 mm variation
–More as per specification.
Sphere Dia 40 +0.3 mm variation to be measured on Bore gauge
Operational Definitions . . .
Validation of Xs
S.
No.
Xs identified as important from FMEA / CE
Matrix
Validate
d (Y/N)
Tool
Used
Remarks (attach Minitab
output in later slides & give
slide number reference)
1
Sphere Dia 40 +0.3 mm variation
sphere –More as per specification.
Y 2T test Minitab
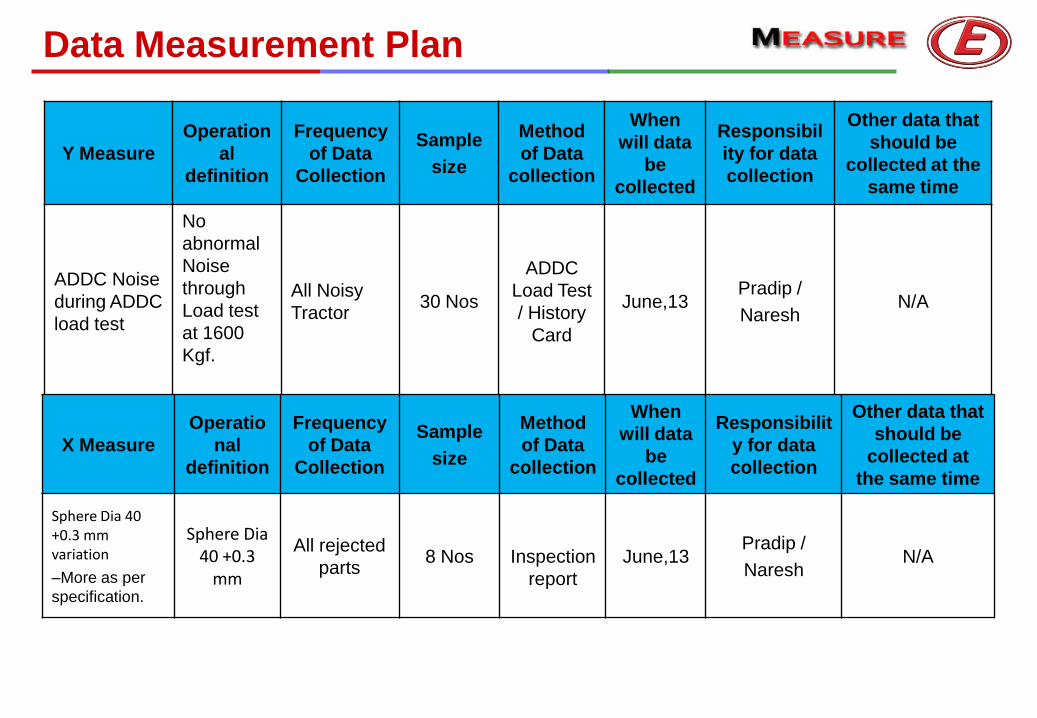
Data Measurement Plan
Y Measure
Operation
al
definition
Frequency
of Data
Collection
Sample
size
Method
of Data
collection
When
will data
be
collected
Responsibil
ity for data
collection
Other data that
should be
collected at the
same time
ADDC Noise
during ADDC
load test
No
abnormal
Noise
through
Load test
at 1600
Kgf.
All Noisy
Tractor 30 Nos
ADDC
Load Test
/ History
Card
June,13 Pradip /
Naresh N/A
X Measure
Operatio
nal
definition
Frequency
of Data
Collection
Sample
size
Method
of Data
collection
When
will data
be
collected
Responsibilit
y for data
collection
Other data that
should be
collected at
the same time
Sphere Dia 40 +0.3 mm variation
–More as per
specification.
Sphere Dia 40 +0.3
mm
All rejected
parts 8 Nos
Inspection
report
June,13 Pradip /
Naresh N/A
Crank –Sphere Dia 40 +0.3 mm variation
H0 : There is no Abnormal Noise with position within limit.
HA : There is Noise if crank having position more then Specification.
Two-Sample T-Test and CI: Noise, ok
Two-sample T for Noise vs ok
N Mean StDev SE Mean
Noise 3 40.3867 0.0115 0.0067
ok 27 40.2593 0.0320 0.0062
Difference = mu (Noise) - mu (ok)
Estimate for difference: 0.12741
95% CI for difference: (0.10521, 0.14961)
T-Test of difference = 0 (vs not =): T-Value = 14.04
P-Value = 0.000 DF = 6
Box plot of Noise, ok
Conclusion : Reject Null Hypothesis, there is significant difference in Spehre mean of
Noisy and OK crank , And it is higher with Noisy Crank based on box plot.

2 P test for Action effectiveness validation- May,13
Conclusion :P value for two proportion indicate parts improvement ,but
need improvement to remaining cause.
Test and CI for Two Proportions
Sample X N Sample p
1 106 13000 0.008154
2 10 3000 0.003333
Difference = p (1) - p (2)
Estimate for difference: 0.00482051
95% upper bound for difference: 0.00698367
Test for difference = 0 (vs < 0): Z = 3.67 P-Value = 1.000
Fisher's exact test: P-Value = 0.999
Validation of NOISE action
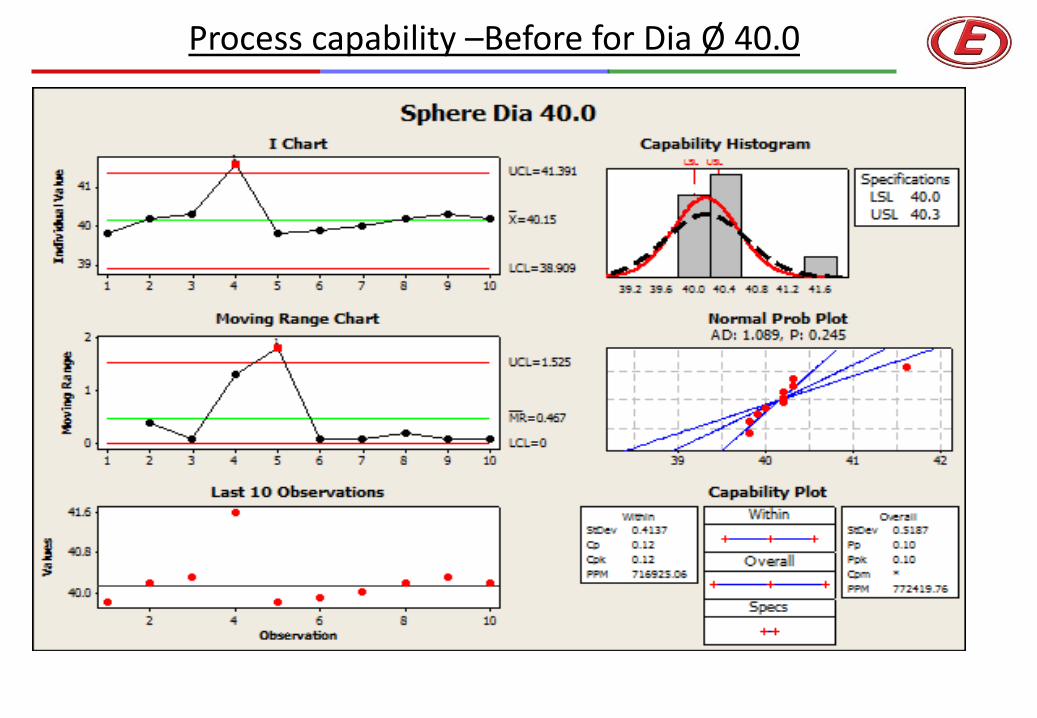
Process capability –Before for Dia Ø 40.0
Define Opportunities
Measure Performance
Analyze Opportunity
Improve Performance
Control Performance
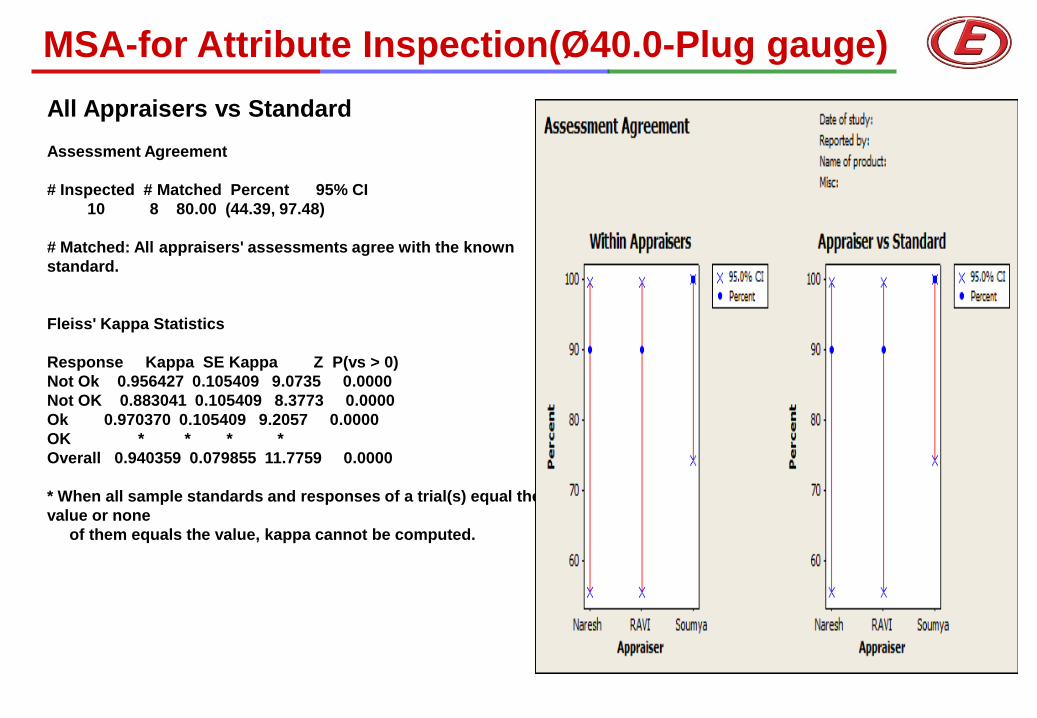
MSA-for Attribute Inspection(Ø40.0-Plug gauge)
All Appraisers vs Standard
Assessment Agreement
# Inspected # Matched Percent 95% CI
10 8 80.00 (44.39, 97.48)
# Matched: All appraisers' assessments agree with the known
standard.
Fleiss' Kappa Statistics
Response Kappa SE Kappa Z P(vs > 0)
Not Ok 0.956427 0.105409 9.0735 0.0000
Not OK 0.883041 0.105409 8.3773 0.0000
Ok 0.970370 0.105409 9.2057 0.0000
OK * * * *
Overall 0.940359 0.079855 11.7759 0.0000
* When all sample standards and responses of a trial(s) equal the
value or none
of them equals the value, kappa cannot be computed.
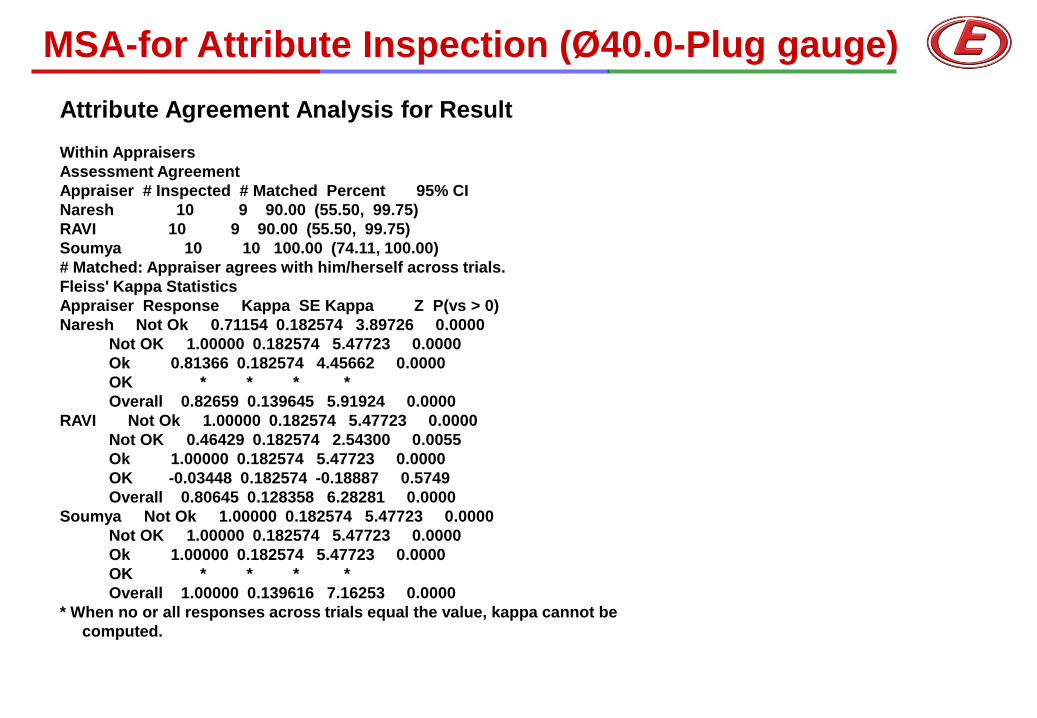
MSA-for Attribute Inspection (Ø40.0-Plug gauge)
Attribute Agreement Analysis for Result
Within Appraisers
Assessment Agreement
Appraiser # Inspected # Matched Percent 95% CI
Naresh 10 9 90.00 (55.50, 99.75)
RAVI 10 9 90.00 (55.50, 99.75)
Soumya 10 10 100.00 (74.11, 100.00)
# Matched: Appraiser agrees with him/herself across trials.
Fleiss' Kappa Statistics
Appraiser Response Kappa SE Kappa Z P(vs > 0)
Naresh Not Ok 0.71154 0.182574 3.89726 0.0000
Not OK 1.00000 0.182574 5.47723 0.0000
Ok 0.81366 0.182574 4.45662 0.0000
OK * * * *
Overall 0.82659 0.139645 5.91924 0.0000
RAVI Not Ok 1.00000 0.182574 5.47723 0.0000
Not OK 0.46429 0.182574 2.54300 0.0055
Ok 1.00000 0.182574 5.47723 0.0000
OK -0.03448 0.182574 -0.18887 0.5749
Overall 0.80645 0.128358 6.28281 0.0000
Soumya Not Ok 1.00000 0.182574 5.47723 0.0000
Not OK 1.00000 0.182574 5.47723 0.0000
Ok 1.00000 0.182574 5.47723 0.0000
OK * * * *
Overall 1.00000 0.139616 7.16253 0.0000
* When no or all responses across trials equal the value, kappa cannot be
computed.
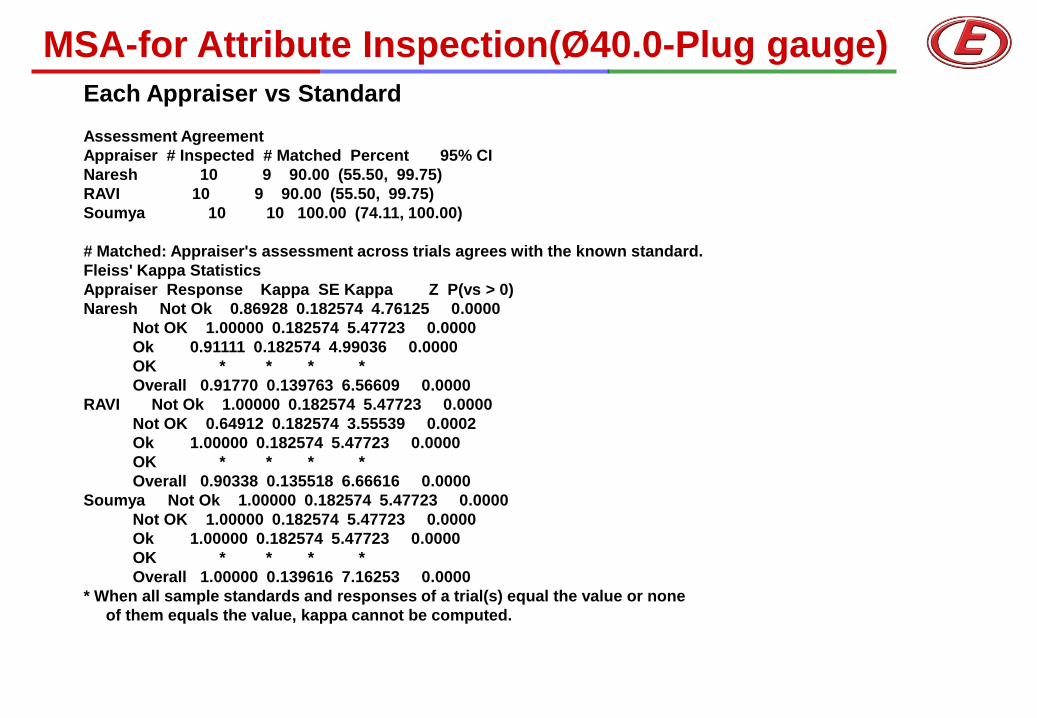
MSA-for Attribute Inspection(Ø40.0-Plug gauge)
Each Appraiser vs Standard
Assessment Agreement
Appraiser # Inspected # Matched Percent 95% CI
Naresh 10 9 90.00 (55.50, 99.75)
RAVI 10 9 90.00 (55.50, 99.75)
Soumya 10 10 100.00 (74.11, 100.00)
# Matched: Appraiser's assessment across trials agrees with the known standard.
Fleiss' Kappa Statistics
Appraiser Response Kappa SE Kappa Z P(vs > 0)
Naresh Not Ok 0.86928 0.182574 4.76125 0.0000
Not OK 1.00000 0.182574 5.47723 0.0000
Ok 0.91111 0.182574 4.99036 0.0000
OK * * * *
Overall 0.91770 0.139763 6.56609 0.0000
RAVI Not Ok 1.00000 0.182574 5.47723 0.0000
Not OK 0.64912 0.182574 3.55539 0.0002
Ok 1.00000 0.182574 5.47723 0.0000
OK * * * *
Overall 0.90338 0.135518 6.66616 0.0000
Soumya Not Ok 1.00000 0.182574 5.47723 0.0000
Not OK 1.00000 0.182574 5.47723 0.0000
Ok 1.00000 0.182574 5.47723 0.0000
OK * * * *
Overall 1.00000 0.139616 7.16253 0.0000
* When all sample standards and responses of a trial(s) equal the value or none
of them equals the value, kappa cannot be computed.
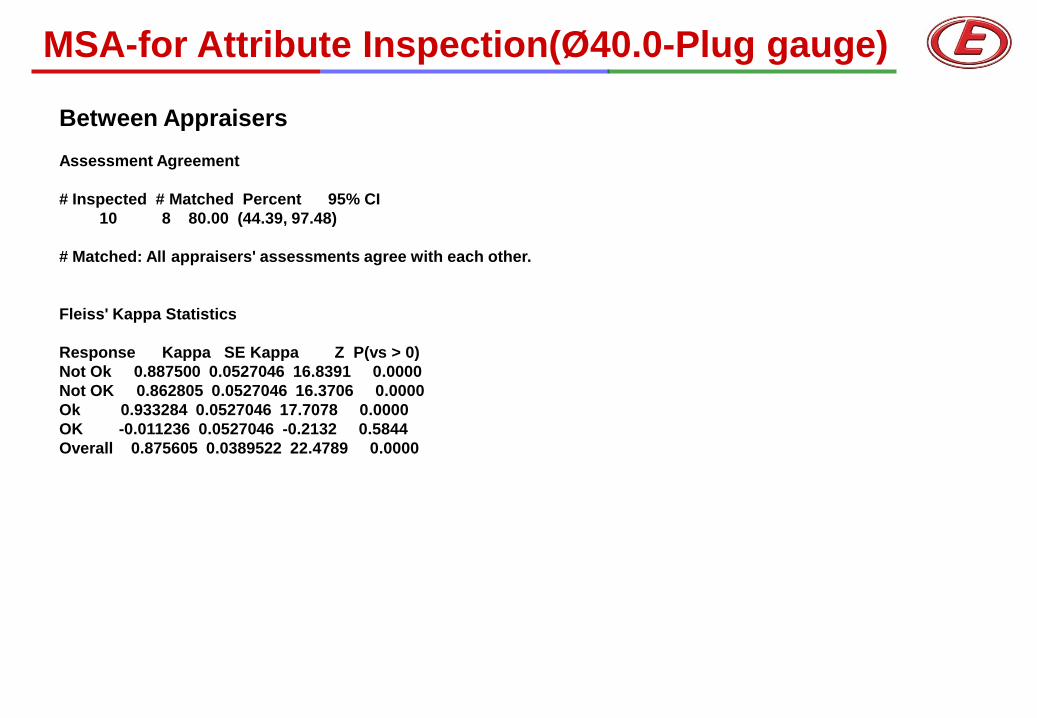
MSA-for Attribute Inspection(Ø40.0-Plug gauge)
Between Appraisers
Assessment Agreement
# Inspected # Matched Percent 95% CI
10 8 80.00 (44.39, 97.48)
# Matched: All appraisers' assessments agree with each other.
Fleiss' Kappa Statistics
Response Kappa SE Kappa Z P(vs > 0)
Not Ok 0.887500 0.0527046 16.8391 0.0000
Not OK 0.862805 0.0527046 16.3706 0.0000
Ok 0.933284 0.0527046 17.7078 0.0000
OK -0.011236 0.0527046 -0.2132 0.5844
Overall 0.875605 0.0389522 22.4789 0.0000
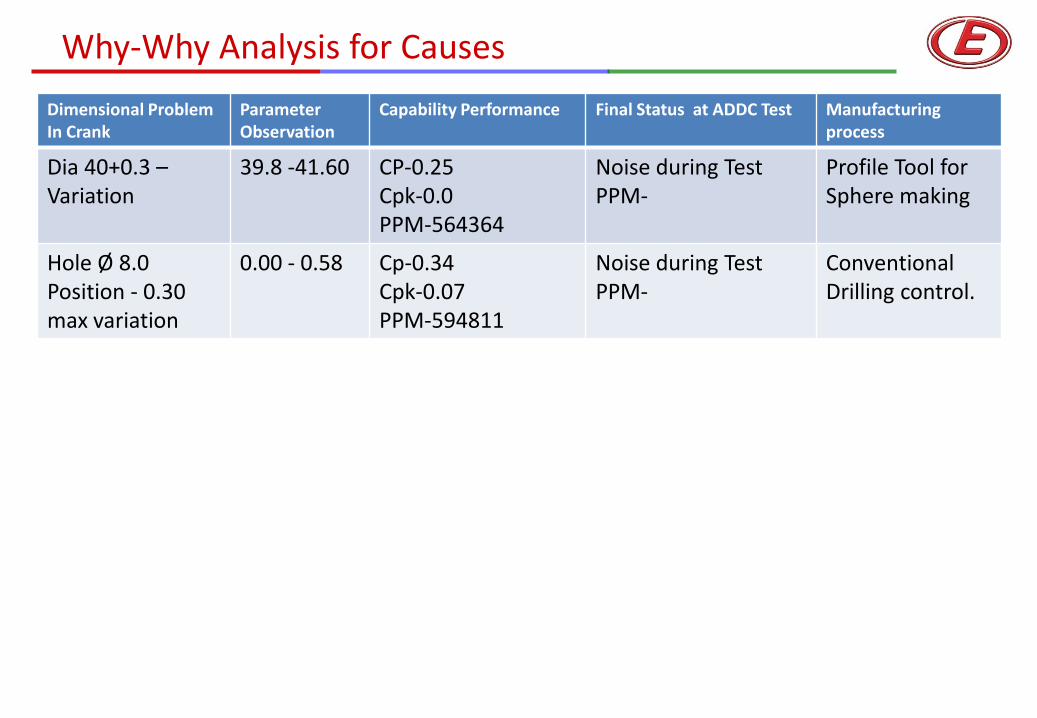
Why-Why Analysis for Causes
Dimensional Problem In Crank
Parameter Observation
Capability Performance Final Status at ADDC Test Manufacturing process
Dia 40+0.3 – Variation
39.8 -41.60 CP-0.25 Cpk-0.0 PPM-564364
Noise during Test PPM-
Profile Tool for Sphere making
Hole Ø 8.0 Position - 0.30 max variation
0.00 - 0.58 Cp-0.34 Cpk-0.07 PPM-594811
Noise during Test PPM-
Conventional Drilling control.
Probable Cause
Cause's Dia Ø40.0+0.3- variation ( 39.8-41.60)
WHY 1 Process Unstable as per capability standard
(CP-0.25, Cpk-0.0)
WHY 2 Sphere profile having variation ( Normal Cause)
WHY 3
Sphere Ø 40.0 manufacturing through sphere profile tools
and conventional Drilling Machine.
WHY 4
Adopted Manufacturing process for sphere making does not have
consistency
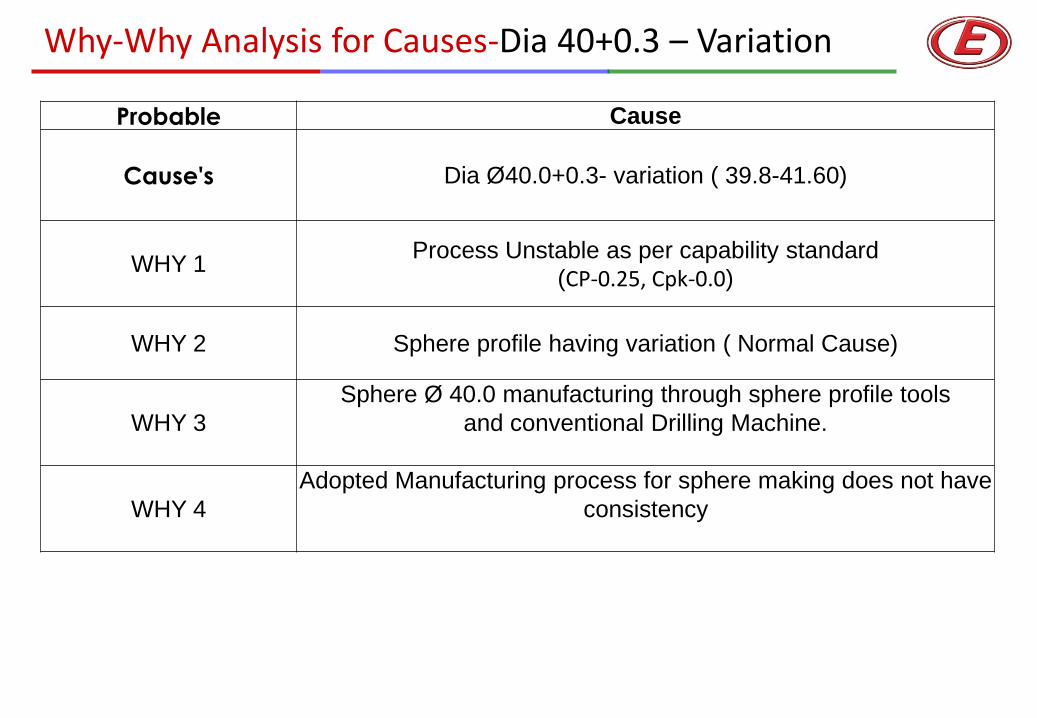
Why-Why Analysis for Causes-Dia 40+0.3 – Variation
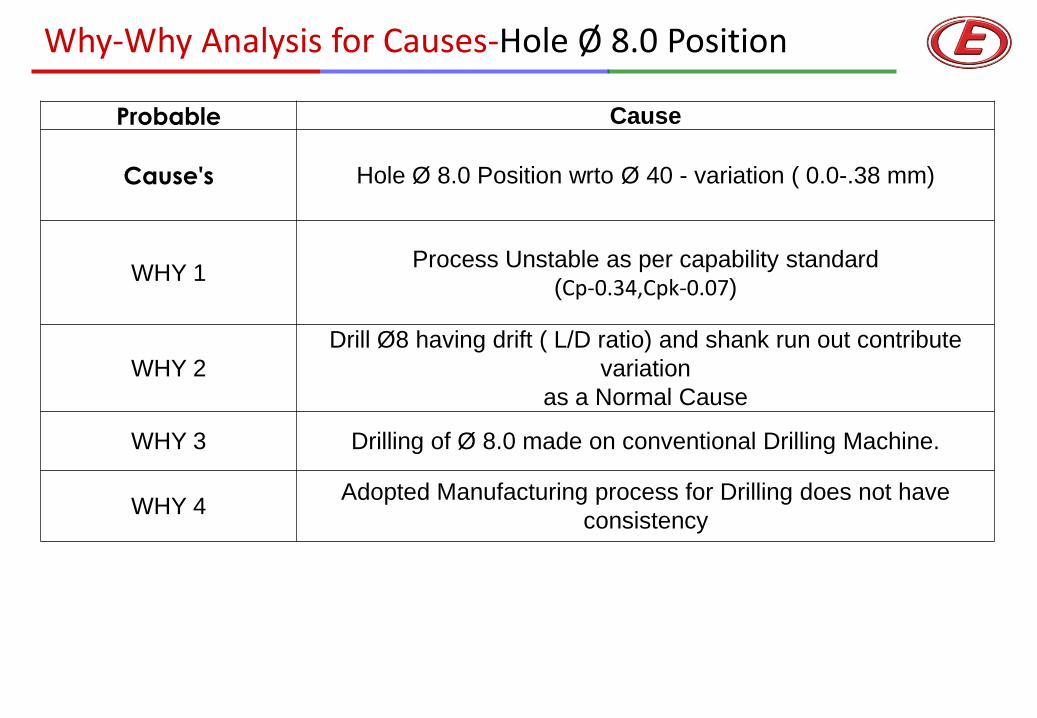
Probable Cause
Cause's Hole Ø 8.0 Position wrto Ø 40 - variation ( 0.0-.38 mm)
WHY 1 Process Unstable as per capability standard
(Cp-0.34,Cpk-0.07)
WHY 2
Drill Ø8 having drift ( L/D ratio) and shank run out contribute
variation
as a Normal Cause
WHY 3 Drilling of Ø 8.0 made on conventional Drilling Machine.
WHY 4 Adopted Manufacturing process for Drilling does not have
consistency
Why-Why Analysis for Causes-Hole Ø 8.0 Position
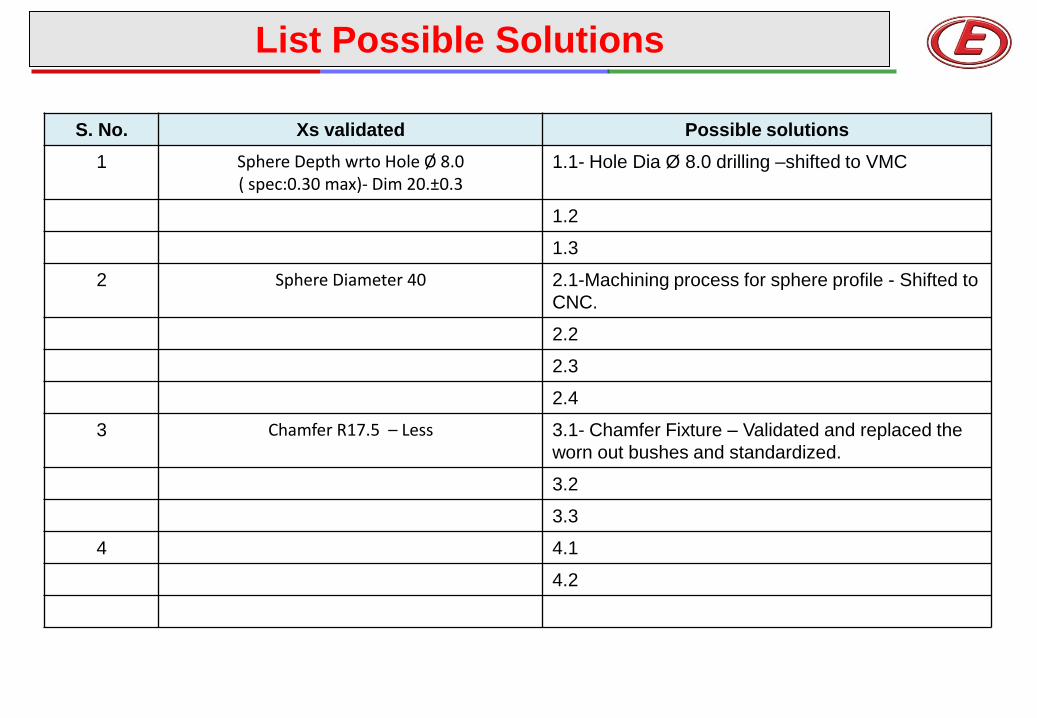
List Possible Solutions
S. No. Xs validated Possible solutions
1 Sphere Depth wrto Hole Ø 8.0 ( spec:0.30 max)- Dim 20.±0.3
1.1- Hole Dia Ø 8.0 drilling –shifted to VMC
1.2
1.3
2 Sphere Diameter 40 2.1-Machining process for sphere profile - Shifted to
CNC.
2.2
2.3
2.4
3 Chamfer R17.5 – Less 3.1- Chamfer Fixture – Validated and replaced the
worn out bushes and standardized.
3.2
3.3
4 4.1
4.2
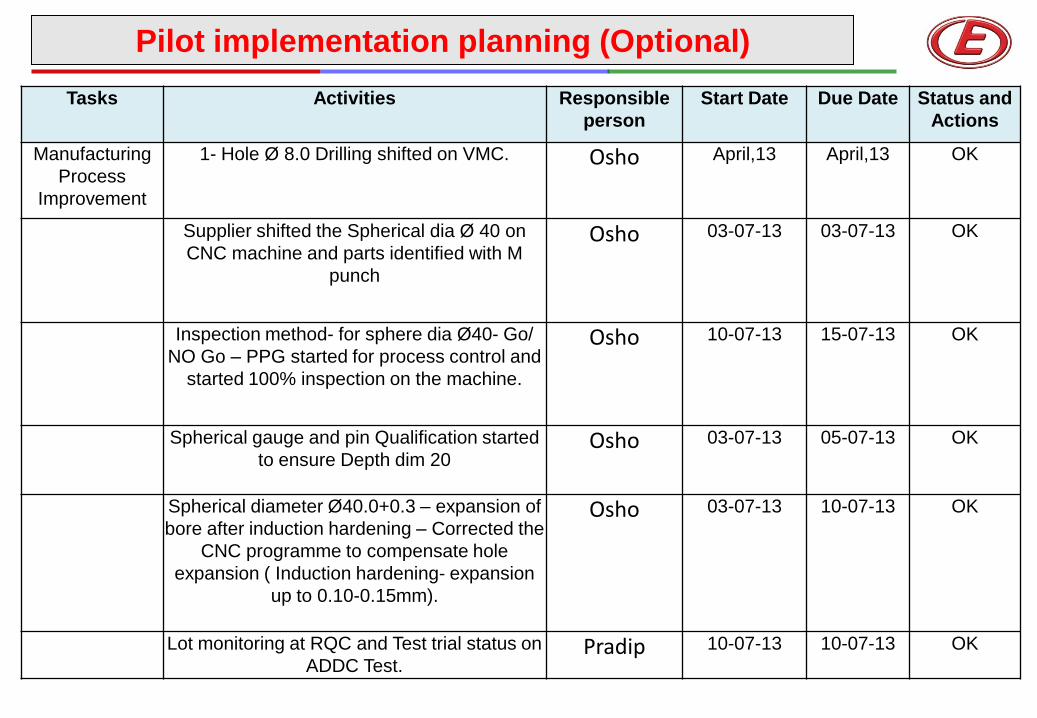
Pilot implementation planning (Optional)
Tasks Activities Responsible
person
Start Date Due Date Status and
Actions
Manufacturing
Process
Improvement
1- Hole Ø 8.0 Drilling shifted on VMC. Osho April,13 April,13 OK
Supplier shifted the Spherical dia Ø 40 on
CNC machine and parts identified with M
punch
Osho 03-07-13 03-07-13 OK
Inspection method- for sphere dia Ø40- Go/
NO Go – PPG started for process control and
started 100% inspection on the machine.
Osho 10-07-13 15-07-13 OK
Spherical gauge and pin Qualification started
to ensure Depth dim 20 Osho 03-07-13 05-07-13 OK
Spherical diameter Ø40.0+0.3 – expansion of
bore after induction hardening – Corrected the
CNC programme to compensate hole
expansion ( Induction hardening- expansion
up to 0.10-0.15mm).
Osho 03-07-13 10-07-13 OK
Lot monitoring at RQC and Test trial status on
ADDC Test. Pradip 10-07-13 10-07-13 OK
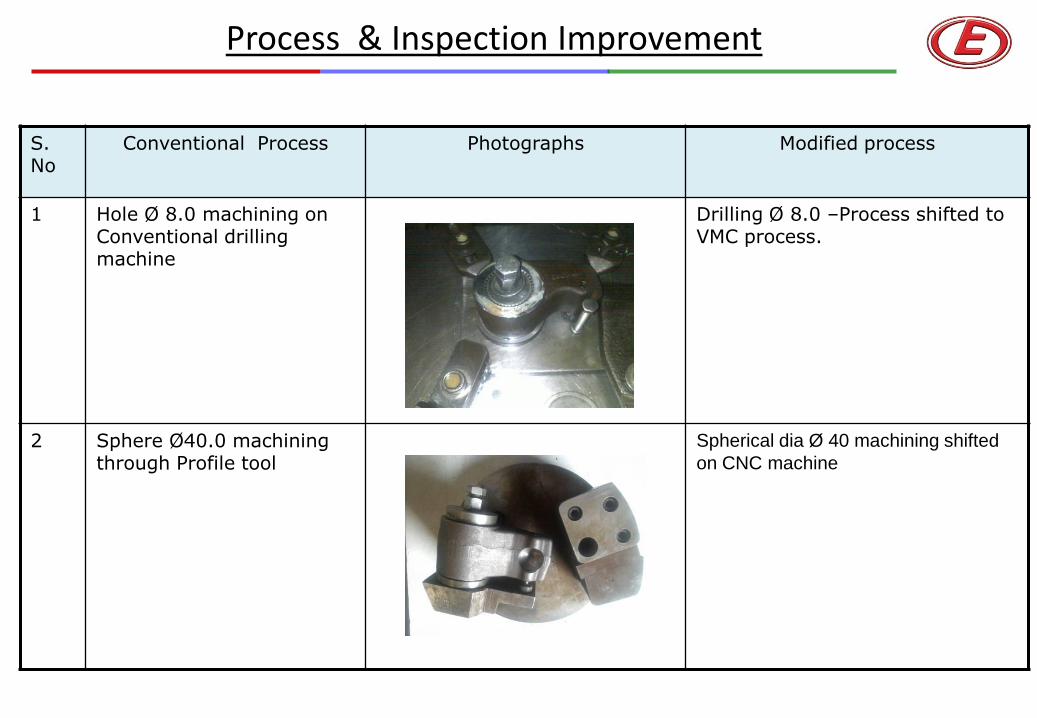
Process & Inspection Improvement
S. No
Conventional Process Photographs Modified process
1 Hole Ø 8.0 machining on Conventional drilling machine
Drilling Ø 8.0 –Process shifted to VMC process.
2 Sphere Ø40.0 machining through Profile tool
Spherical dia Ø 40 machining shifted
on CNC machine
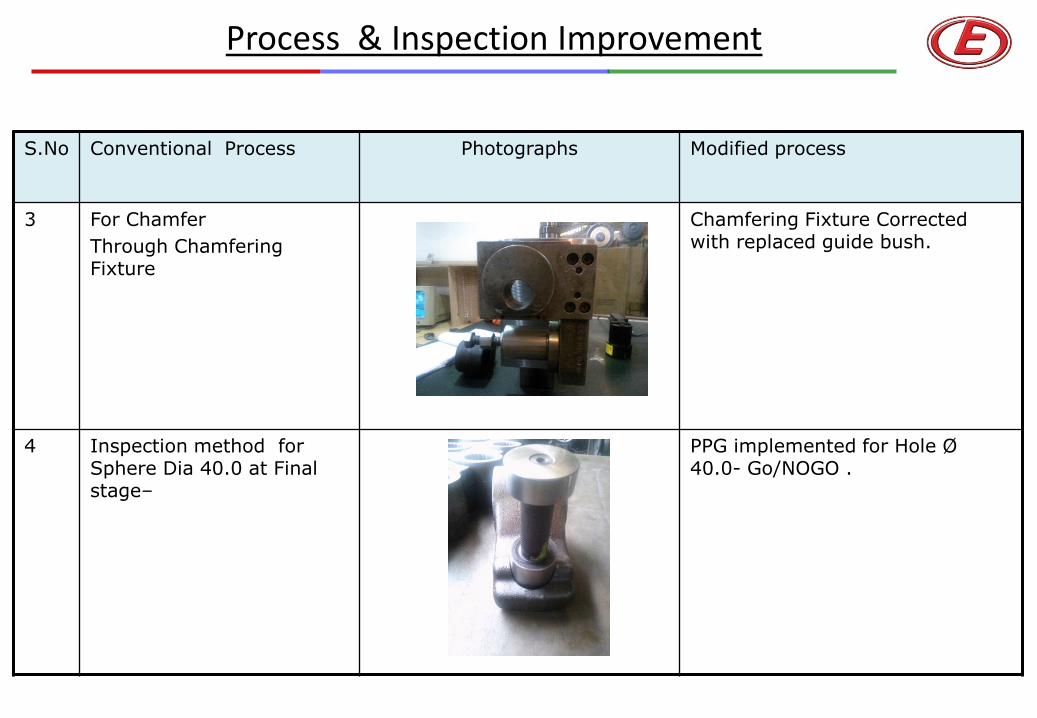
S.No Conventional Process Photographs Modified process
3 For Chamfer
Through Chamfering Fixture
Chamfering Fixture Corrected with replaced guide bush.
4 Inspection method for Sphere Dia 40.0 at Final stage–
PPG implemented for Hole Ø 40.0- Go/NOGO .
Process & Inspection Improvement
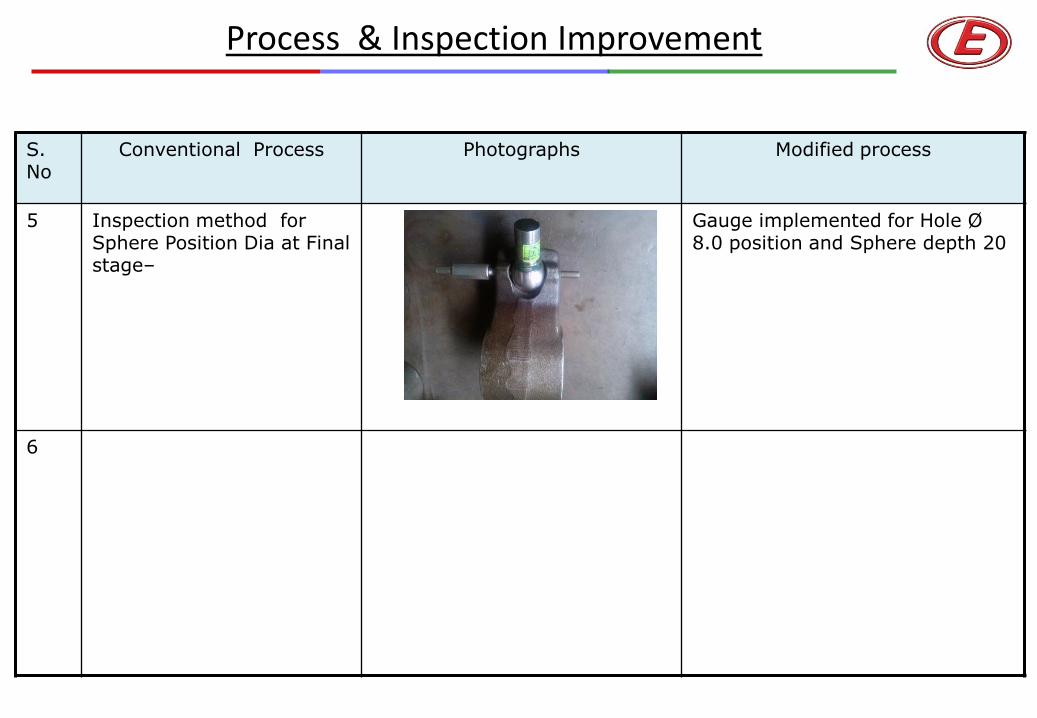
S. No
Conventional Process Photographs Modified process
5 Inspection method for Sphere Position Dia at Final stage–
Gauge implemented for Hole Ø 8.0 position and Sphere depth 20
6
Process & Inspection Improvement
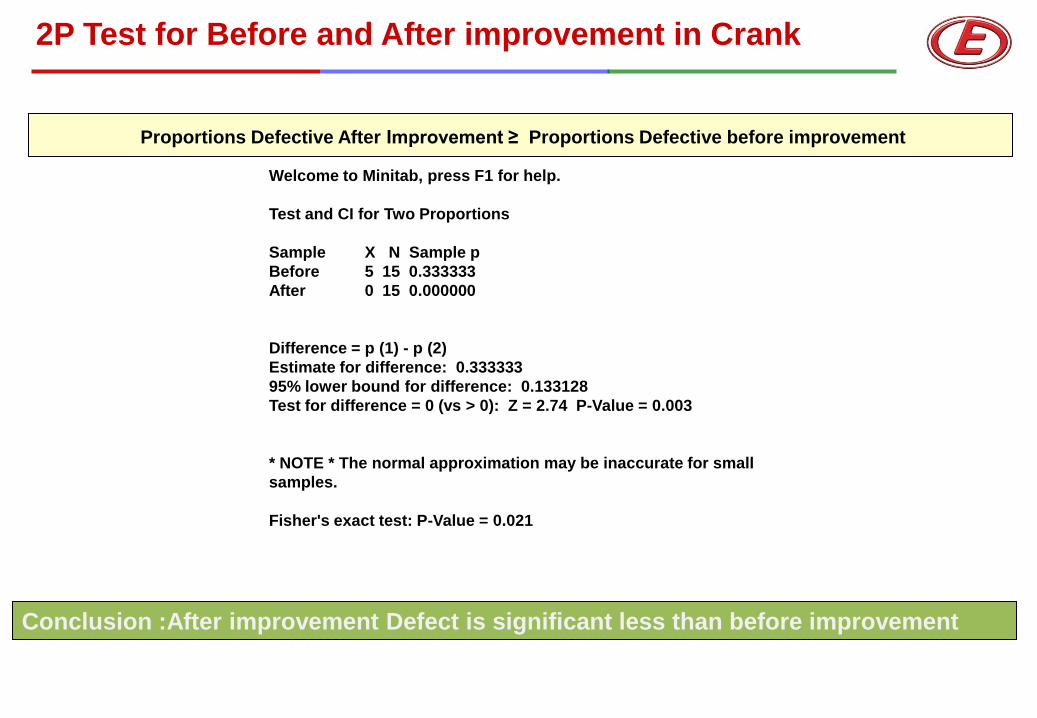
2P Test for Before and After improvement in Crank
Conclusion :After improvement Defect is significant less than before improvement
Proportions Defective After Improvement ≥ Proportions Defective before improvement
Welcome to Minitab, press F1 for help.
Test and CI for Two Proportions
Sample X N Sample p
Before 5 15 0.333333
After 0 15 0.000000
Difference = p (1) - p (2)
Estimate for difference: 0.333333
95% lower bound for difference: 0.133128
Test for difference = 0 (vs > 0): Z = 2.74 P-Value = 0.003
* NOTE * The normal approximation may be inaccurate for small
samples.
Fisher's exact test: P-Value = 0.021
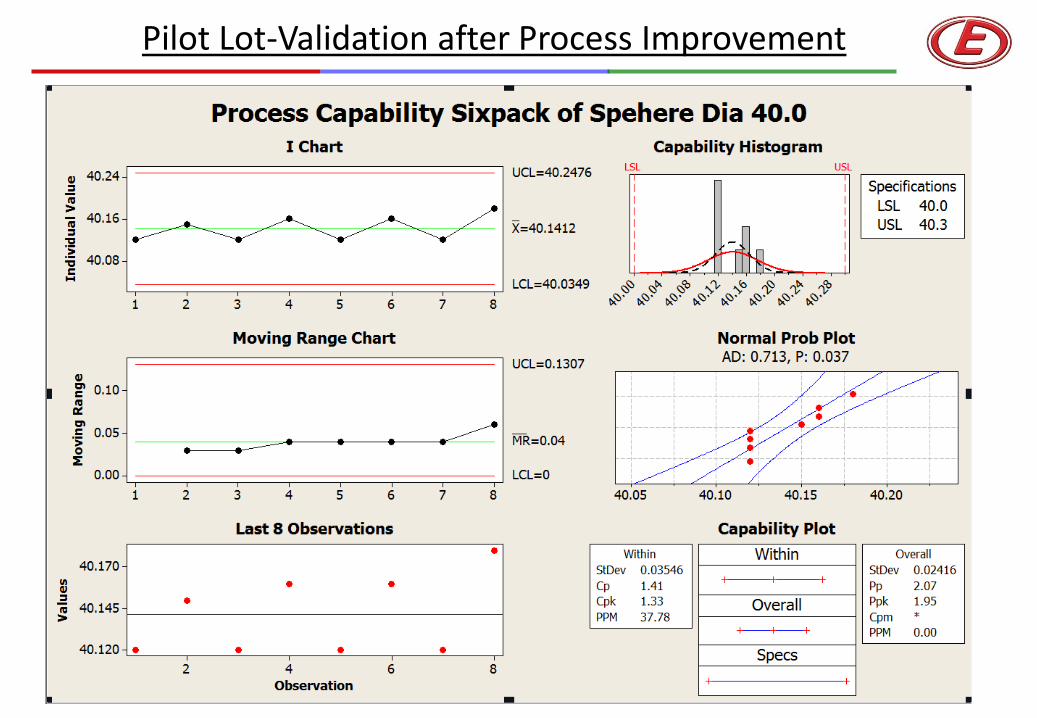
Pilot Lot-Validation after Process Improvement
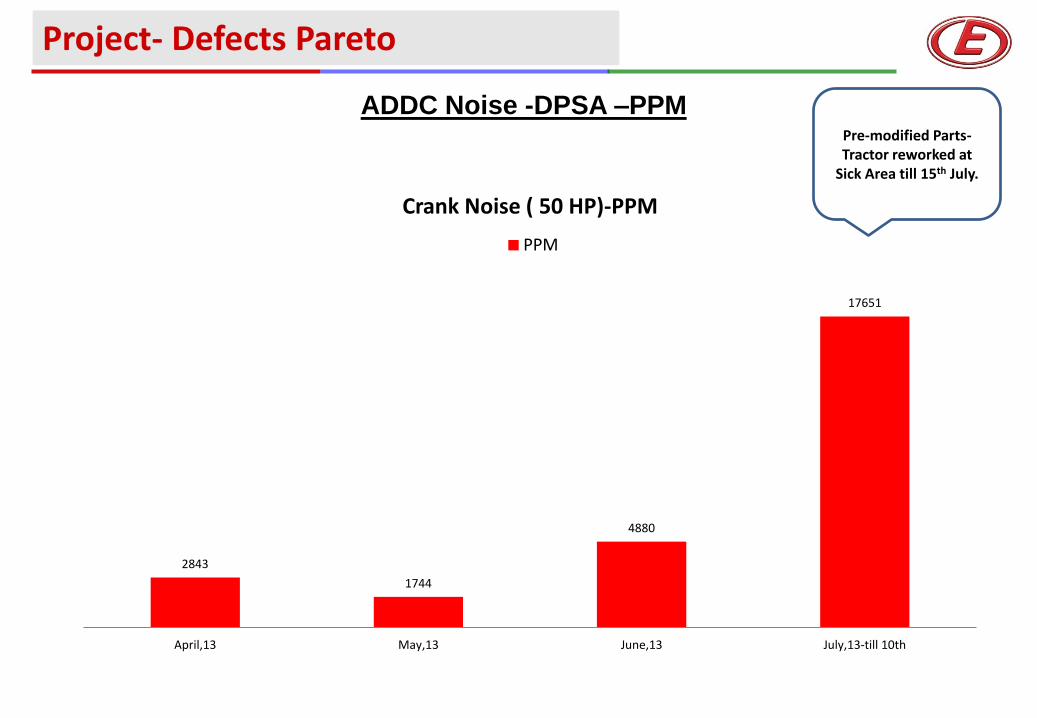
ADDC Noise -DPSA –PPM Pre-modified Parts- Tractor reworked at
Sick Area till 15th July.
2843
1744
4880
17651
April,13 May,13 June,13 July,13-till 10th
Crank Noise ( 50 HP)-PPM
PPM
Project- Defects Pareto
Pilot Results
Improvement cut off Date - 10-07-13
Cut off Chassis No: 921113134609
2843
1744
4880
17651
0
April,13 May,13 June,13 July,13-till 10th July,13-11th-30th
ADDC Noise Trend after Improvement
Define Opportunities
Measure Performance
Analyze Opportunity
Improve Performance
Control Performance
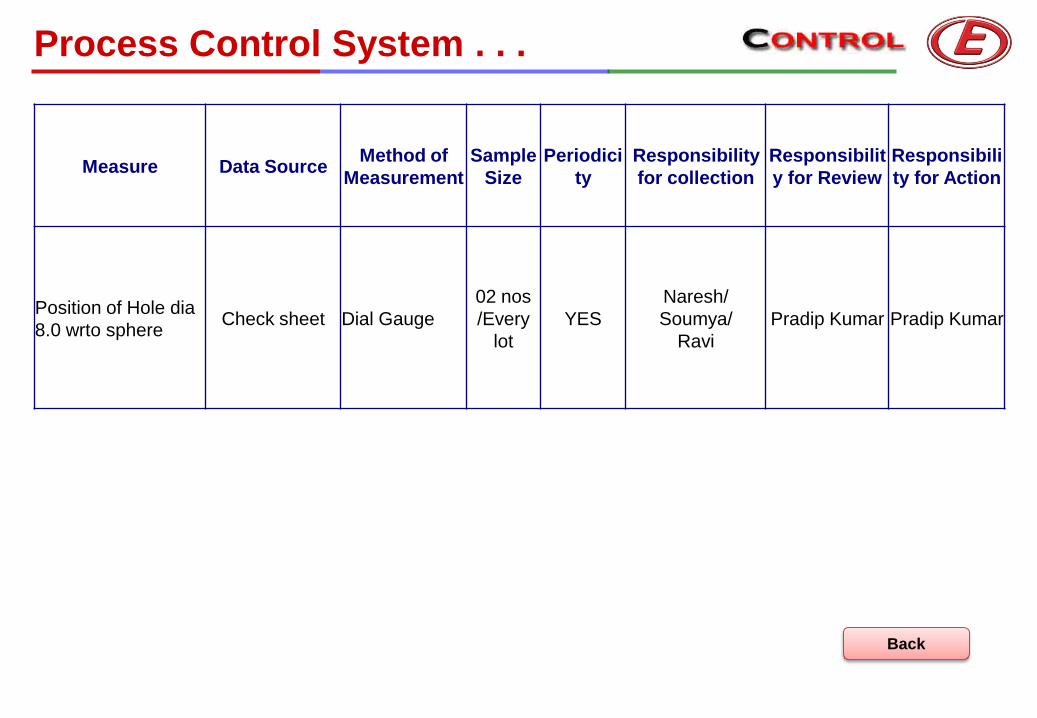
Measure Data Source Method of
Measurement
Sample
Size
Periodici
ty
Responsibility
for collection
Responsibilit
y for Review
Responsibili
ty for Action
Position of Hole dia
8.0 wrto sphere Check sheet Dial Gauge
02 nos
/Every
lot
YES
Naresh/
Soumya/
Ravi
Pradip Kumar Pradip Kumar
Process Control System . . .
Back
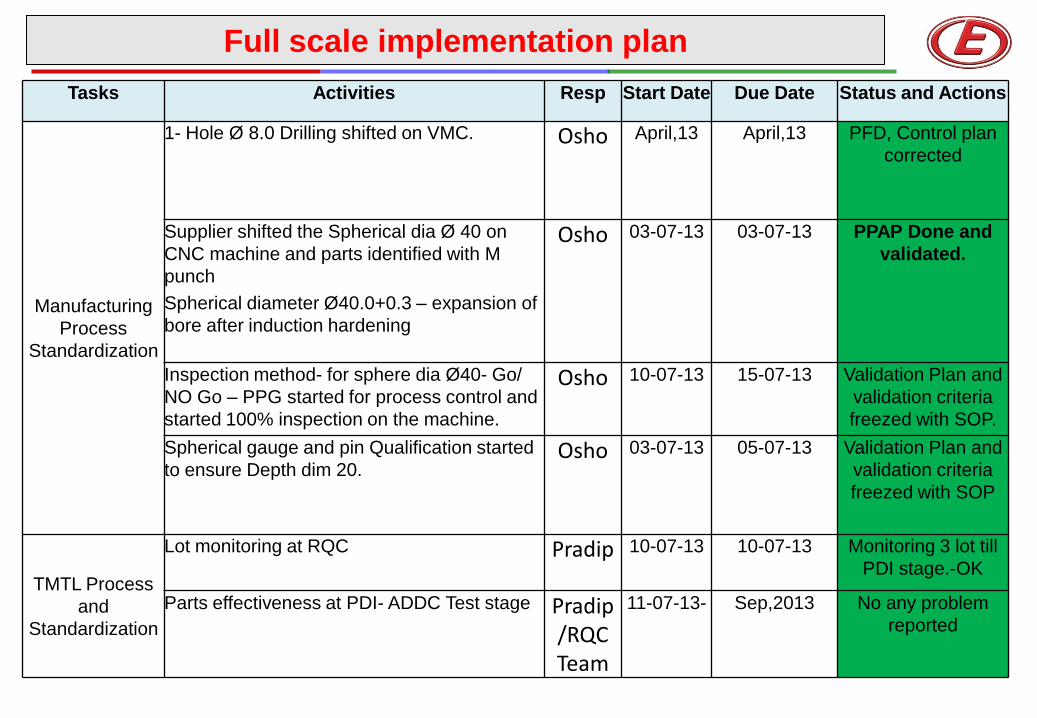
Full scale implementation plan
Tasks Activities Resp Start Date Due Date Status and Actions
Manufacturing
Process
Standardization
1- Hole Ø 8.0 Drilling shifted on VMC. Osho April,13 April,13 PFD, Control plan
corrected
Supplier shifted the Spherical dia Ø 40 on
CNC machine and parts identified with M
punch
Spherical diameter Ø40.0+0.3 – expansion of
bore after induction hardening
Osho 03-07-13 03-07-13 PPAP Done and
validated.
Inspection method- for sphere dia Ø40- Go/
NO Go – PPG started for process control and
started 100% inspection on the machine.
Osho 10-07-13 15-07-13 Validation Plan and
validation criteria
freezed with SOP.
Spherical gauge and pin Qualification started
to ensure Depth dim 20. Osho 03-07-13 05-07-13 Validation Plan and
validation criteria
freezed with SOP
TMTL Process
and
Standardization
Lot monitoring at RQC Pradip 10-07-13 10-07-13 Monitoring 3 lot till
PDI stage.-OK
Parts effectiveness at PDI- ADDC Test stage Pradip /RQC Team
11-07-13- Sep,2013 No any problem
reported
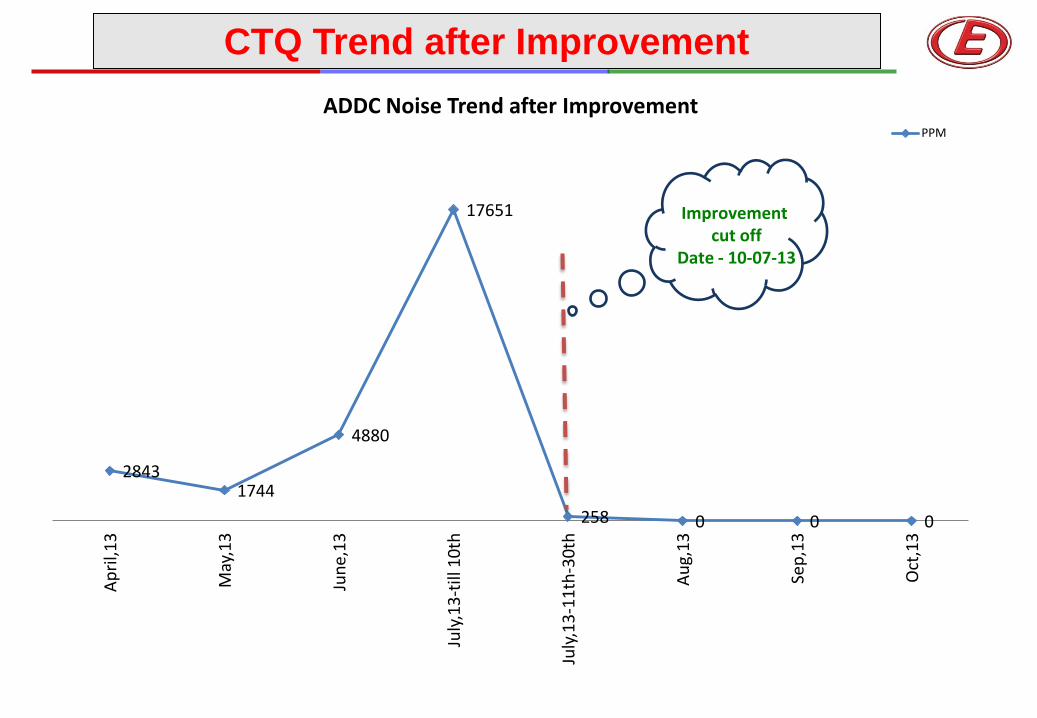
CTQ Trend after Improvement
2843 1744
4880
17651
258 0 0 0
Ap
ril,1
3
May
,13
Jun
e,1
3
July
,13
-till
10
th
July
,13
-11
th-3
0th
Au
g,1
3
Sep
,13
Oct
,13
ADDC Noise Trend after Improvement PPM
Improvement cut off
Date - 10-07-13
Improvement Done
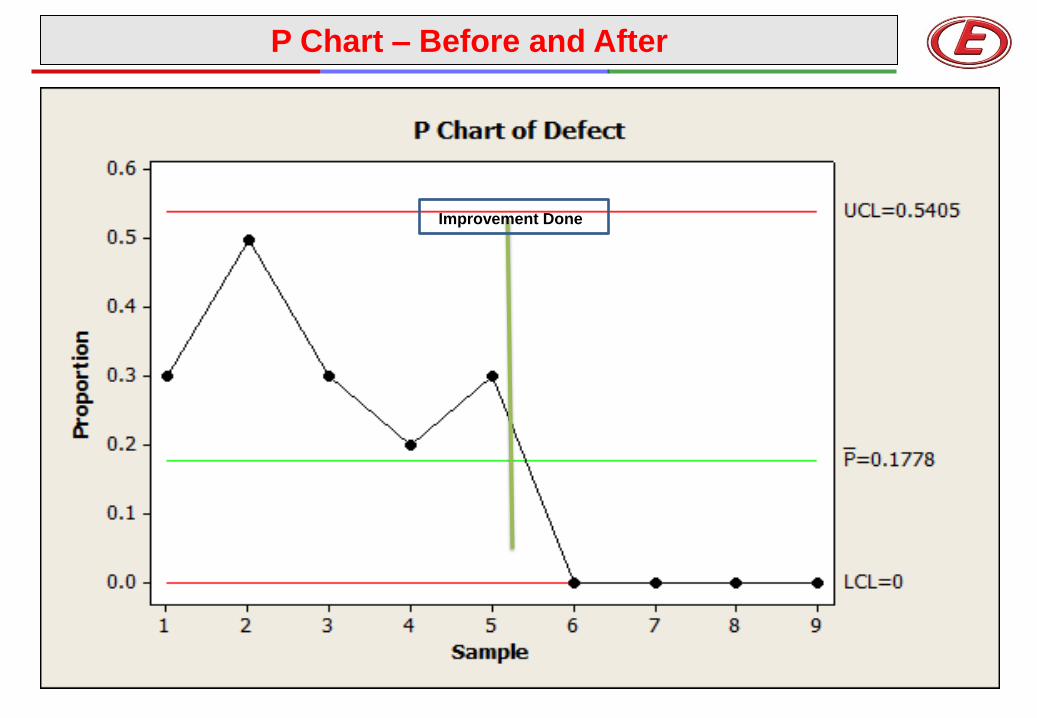
P Chart – Before and After
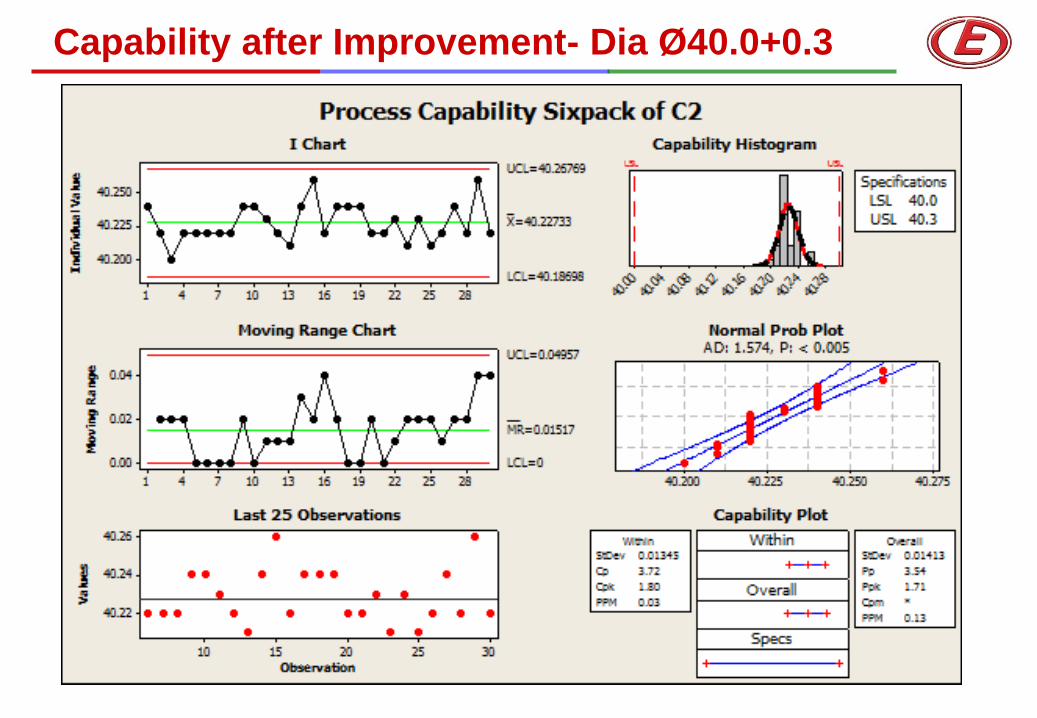
Capability after Improvement- Dia Ø40.0+0.3
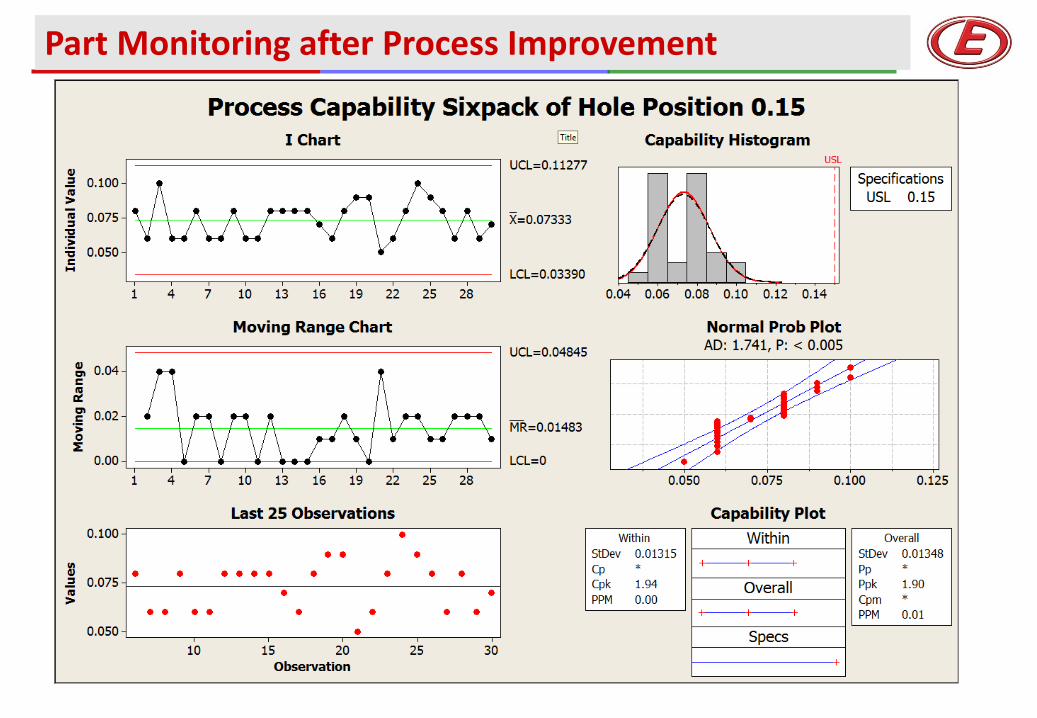
Part Monitoring after Process Improvement
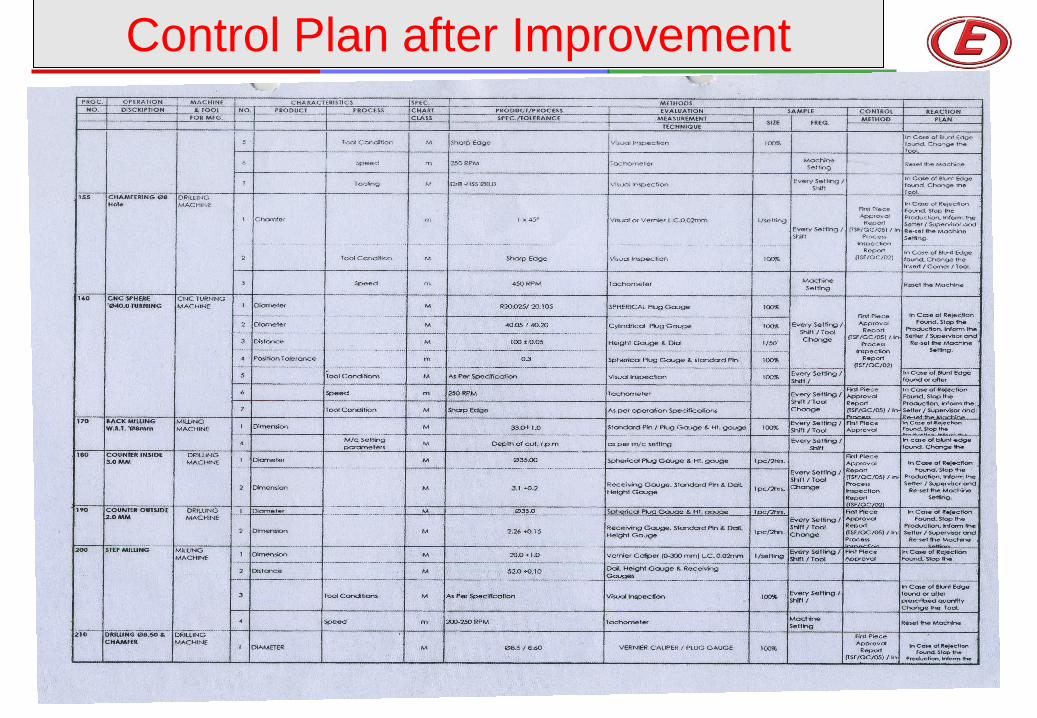
Control Plan after Improvement
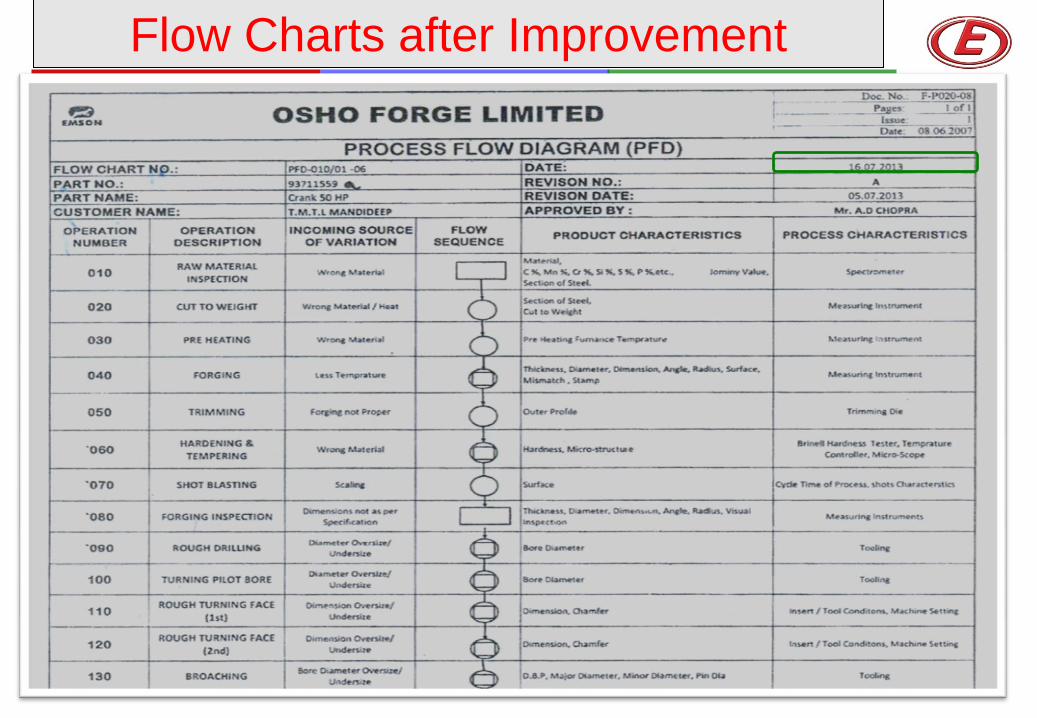
Flow Charts after Improvement
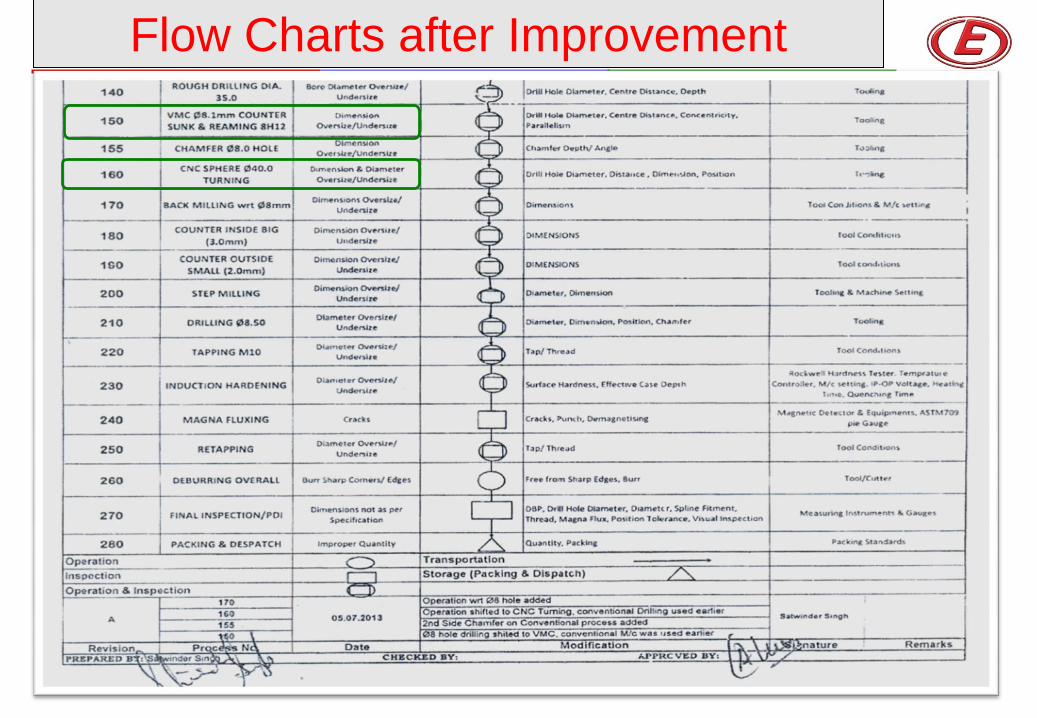
Flow Charts after Improvement
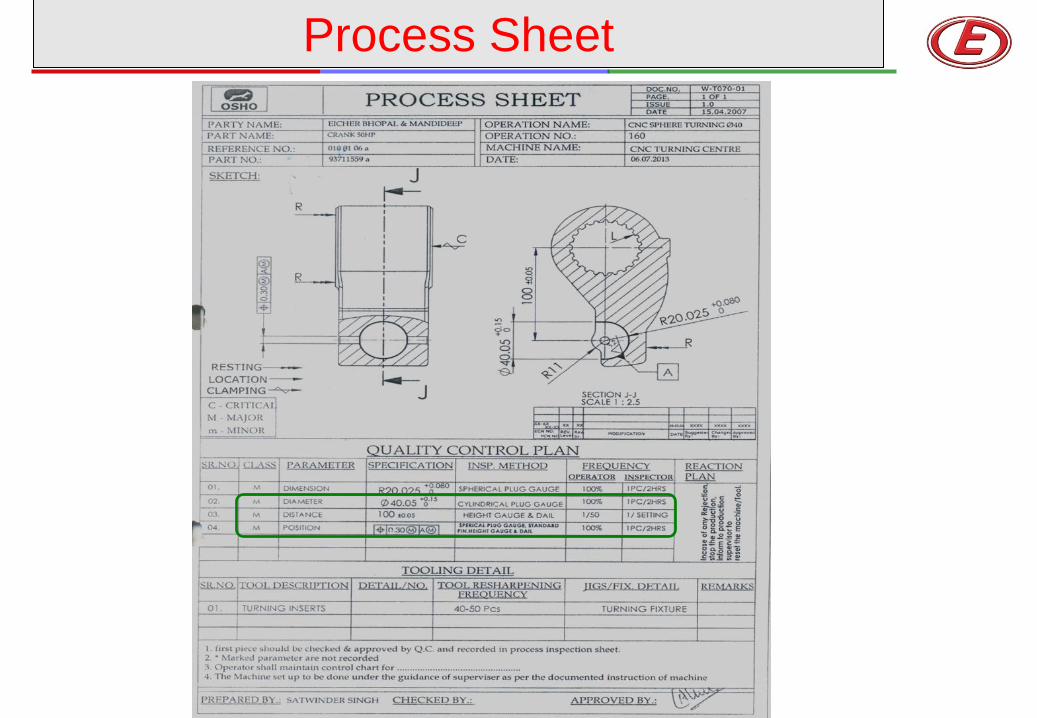
Process Sheet
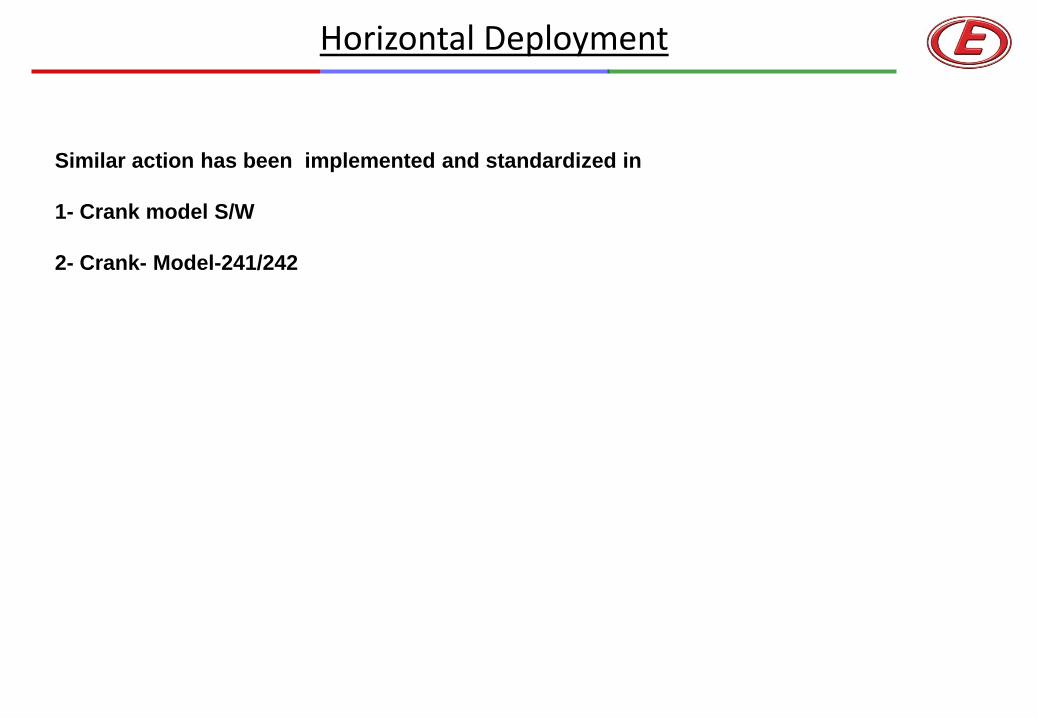
Horizontal Deployment
Similar action has been implemented and standardized in
1- Crank model S/W
2- Crank- Model-241/242
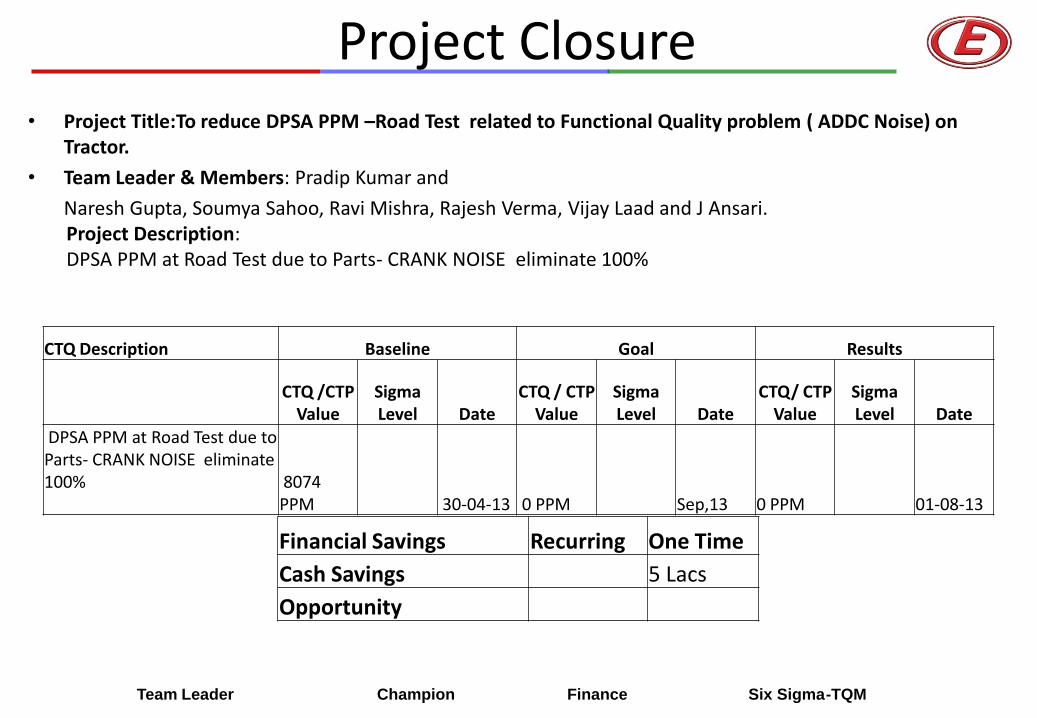
Project Closure • Project Title:To reduce DPSA PPM –Road Test related to Functional Quality problem ( ADDC Noise) on
Tractor.
• Team Leader & Members: Pradip Kumar and
Naresh Gupta, Soumya Sahoo, Ravi Mishra, Rajesh Verma, Vijay Laad and J Ansari. Project Description: DPSA PPM at Road Test due to Parts- CRANK NOISE eliminate 100%
Team Leader Champion Finance Six Sigma-TQM
CTQ Description Baseline Goal Results
CTQ /CTP
Value Sigma Level Date
CTQ / CTP Value
Sigma Level Date
CTQ/ CTP Value
Sigma Level Date
DPSA PPM at Road Test due to Parts- CRANK NOISE eliminate 100%
8074 PPM 30-04-13 0 PPM Sep,13 0 PPM 01-08-13
Financial Savings Recurring One Time
Cash Savings 5 Lacs
Opportunity
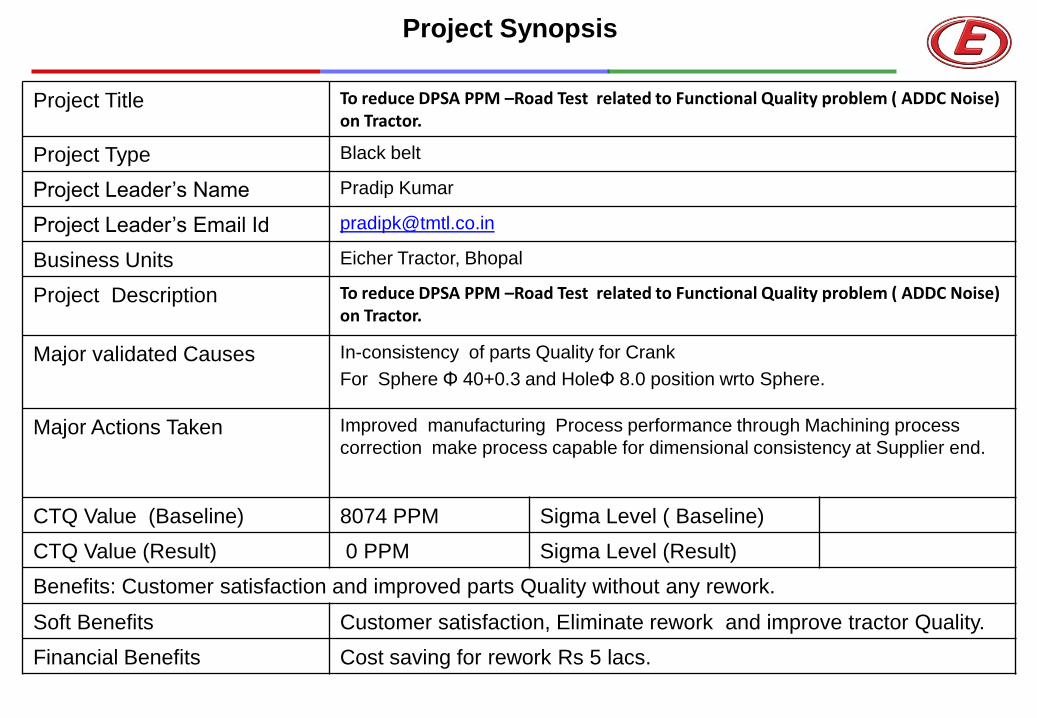
Project Title To reduce DPSA PPM –Road Test related to Functional Quality problem ( ADDC Noise) on Tractor.
Project Type Black belt
Project Leader’s Name Pradip Kumar
Project Leader’s Email Id [email protected]
Business Units Eicher Tractor, Bhopal
Project Description To reduce DPSA PPM –Road Test related to Functional Quality problem ( ADDC Noise) on Tractor.
Major validated Causes In-consistency of parts Quality for Crank
For Sphere Φ 40+0.3 and HoleΦ 8.0 position wrto Sphere.
Major Actions Taken Improved manufacturing Process performance through Machining process
correction make process capable for dimensional consistency at Supplier end.
CTQ Value (Baseline) 8074 PPM Sigma Level ( Baseline)
CTQ Value (Result) 0 PPM Sigma Level (Result)
Benefits: Customer satisfaction and improved parts Quality without any rework.
Soft Benefits Customer satisfaction, Eliminate rework and improve tractor Quality.
Financial Benefits Cost saving for rework Rs 5 lacs.
Project Synopsis