Embed Size (px)
Citation preview
01
Contents
Company Information 02
Director’s Report to the Members 03
Balance Sheet 04
Profit & Loss Account 05
Statement of Comprehensive Income 05
Cash Flow Statement 06
Statement of Changing in Equity 07
Notes to the Financial Statement 08

02
Company Information Chief Executive Mian Muhammad Latif
Mian Muhammad Javaid Iqbal Mr. Muhammad Naeem Mr. Muhammad Faisal Latif Mr. Muhammad Farhan Latif Mr. Muhammad Zeeshan Latif Mst. Shahnaz Latif
Major Bankers Allied Bank Limited. Askari bank Limited AlBaraka Bank (Pakistan) Limited. Citibank, N.A Faysal Bank Limited First Credit & Investment Bank Limited. Habib Bank Limited. Habib Metropolitan Bank Limited. KASB Bank Limited. National Bank of Pakistan. NIB Bank Limited. Orix Leasing (Pakistan)Limited
Pak Oman Investment Company Limited Pak Kuwait Investment Company (pvt)Limited Pak Libya Holding Company (pvt)Limited Saudi Pak Industrial & Agriculturan Invetment Company (pvt)Limited Silk Bank Limited
Standard Chartered Bank (Pakistan) Limited. The Bank of Punjab. United Bank Limited.
Company Secretary/ Chief Financial Officer ` Mr. Muhammad Arshad
Audit Committee Mr. Muhammad Farhan Latif – Chairman Mr. Muhammad Zeeshan Latif Mst. Shahnaz Latif
Auditors Avais Hyder Liaquat Nauman Charted Accountant
Legal Advisor Ch. Shahid Mehmood (Advocate)
Shares Registrar F.D. Registrar Services (SMC-Pvt.) LimitedOffice # 1705, 17th Floor, Saima Trade Tower-A,I.I. Chundrigar Road, Karachi.Tel: 021-32271905-6 / 021-35478192-3
Registered Office Nishatabad, Faisalabad. Tel: +92 41 8754472-8 Fex: +92 41 8752700, 8752400 [email protected] Website Address www.chenabgroup.com
Works -Spinning Unit – Toba Tek Singh -Weaving Unit – Kharianwala, Distt. Sheikhupura. -Weaving Unit – Shahkot, Distt. Nankana Sahib -Processing &
Stitching Units – Nishatabad, Faisalabad.
Mian Muhammad LatifMian Muhammad Javaid IqbalMr. Muhammad NaeemMr. Muhammad Faisal LatifMr. Muhammad Farhan LatifMr. Muhammad Zeeshan LatifMst. Shahnaz LatifAllied Bank Limited.Askari bank LimitedAlBaraka Bank (Pakistan) Limited.Citibank, N.AFaysal Bank LimitedFirst Credit & Investment Bank Limited.Habib Bank Limited.Habib Metropolitan Bank Limited.KASB BKK ank Limited.National Bank of Pakistan.NIB Bank Limited.Orix Leasing (Pakistan)LimitedPak Oman Investment Company LimitedPak Kuwait Investment Company (pvt)LimitedPak Libya Holding Company (pvt)LimitedSaudi Pak Industrial & Agriculturan InvetmentCompany (pvt)LimitedSilk Bank LimitedStandard Chartered Bank (Pakistan) Limited.The Bank of Punjn ab.United Bank Limited.
Mr. Muhammad ArshadMr. Muhammad Farhan Latif – ChairmanMr. Muhammad Zeeshan LatifMst. Shahnaz LatifAvais Hyder Liaquat NaumanCharted AccountantCh. Shahid Mehmood (A(( dvocate)F.D. Registrar Services (SMC-Pvt.) LimitedOffice # 1705, 17th Floor, Saima Trade Tower-A,I.I. Chundrigar Road, Karachi.Tel: 021-32271905-6 / 021-35478192-3
Nishatabad, Faisalabad.Tel: +92 41 8754472-8Fex: +92 41 8752700, [email protected] Unit – Toba Tek Singh-Weaving Unit – Kharianwala, Distt. Sheikhupura.-Weaving Unit – Shahkot, Distt. Nankana Sahib-Processing & Stitching Units – Nishatabad, Faisalabad.
03
MIAN MUHAMMAD LATIF(CHIEF EXECUTIVE OFFICER)
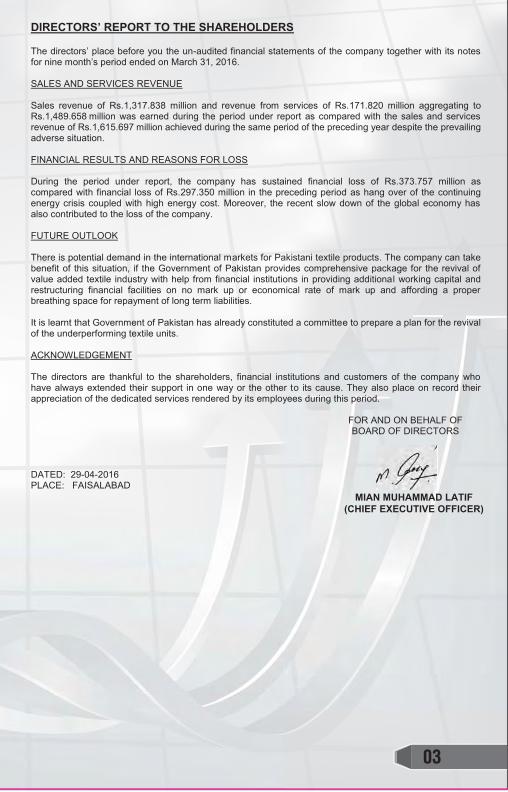
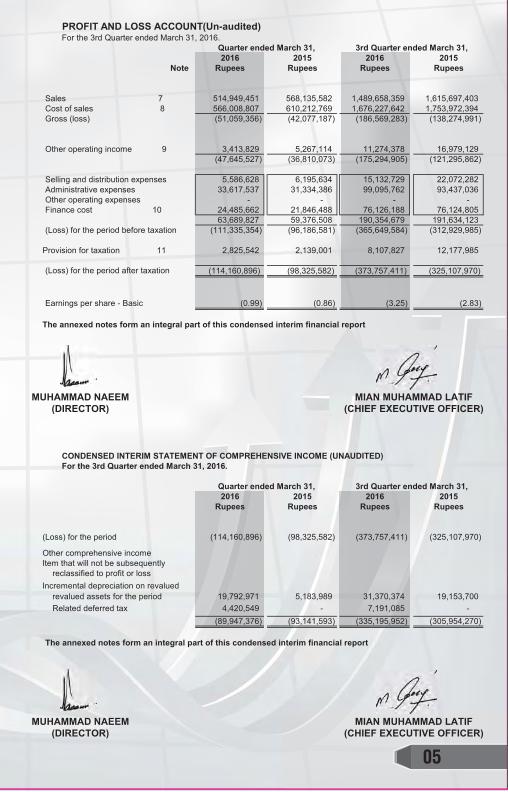
DIRECTORS’ REPORT TO THE SHAREHOLDERS The directors’ place before you the un-audited financial statements of the company together with its notes for nine month’s period ended on March 31, 2016. SALES AND SERVICES REVENUE Sales revenue of Rs.1,317.838 million and revenue from services of Rs.171.820 million aggregating to Rs.1,489.658 million was earned during the period under report as compared with the sales and services revenue of Rs.1,615.697 million achieved during the same period of the preceding year despite the prevailing adverse situation. FINANCIAL RESULTS AND REASONS FOR LOSS During the period under report, the company has sustained financial loss of Rs.373.757 million as compared with financial loss of Rs.297.350 million in the preceding period as hang over of the continuing energy crisis coupled with high energy cost. Moreover, the recent slow down of the global economy has also contributed to the loss of the company. FUTURE OUTLOOK There is potential demand in the international markets for Pakistani textile products. The company can take benefit of this situation, if the Government of Pakistan provides comprehensive package for the revival of value added textile industry with help from financial institutions in providing additional working capital and restructuring financial facilities on no mark up or economical rate of mark up and affording a proper breathing space for repayment of long term liabilities. It is learnt that Government of Pakistan has already constituted a committee to prepare a plan for the revival of the underperforming textile units. ACKNOWLEDGEMENT The directors are thankful to the shareholders, financial institutions and customers of the company who have always extended their support in one way or the other to its cause. They also place on record their appreciation of the dedicated services rendered by its employees during this period.
FOR AND ON BEHALF OF BOARD OF DIRECTORS
DATED: 29-04-2016 PLACE: FAISALABAD
04
MUHAMMAD NAEEM(DIRECTOR)
MIAN MUHAMMAD LATIF(CHIEF EXECUTIVE OFFICER)
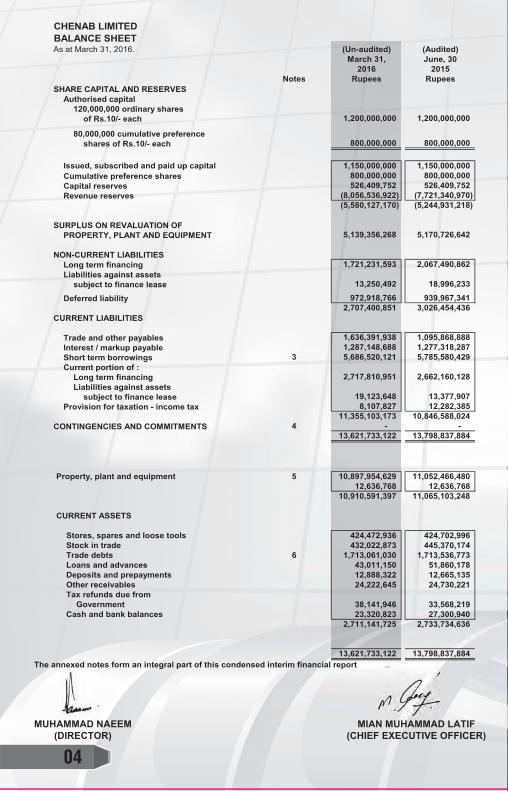
CHENAB LIMITEDBALANCE SHEETAs at March 31, 2016. (Un-audited) (Audited)
March 31, June, 302016 2015
Notes Rupees RupeesSHARE CAPITAL AND RESERVES
Authorised capital120,000,000 ordinary shares
of Rs.10/- each 1,200,000,000 1,200,000,000
80,000,000 cumulative preference shares of Rs.10/- each 800,000,000 800,000,000
Issued, subscribed and paid up capital 1,150,000,000 1,150,000,000Cumulative preference shares 800,000,000 800,000,000Capital reserves 526,409,752 526,409,752Revenue reserves (8,056,536,922) (7,721,340,970)
(5,580,127,170) (5,244,931,218)
SURPLUS ON REVALUATION OF PROPERTY, PLANT AND EQUIPMENT 5,139,356,268 5,170,726,642
NON-CURRENT LIABILITIESLong term financing 1,721,231,593 2,067,490,862Liabilities against assets
subject to finance lease 13,250,492 18,996,233
Deferred liability 972,918,766 939,967,3412,707,400,851 3,026,454,436
CURRENT LIABILITIES
Trade and other payables 1,636,391,938 1,095,868,888Interest / markup payable 1,287,148,688 1,277,318,287Short term borrowings 3 5,686,520,121 5,785,580,429Current portion of :
Long term financing 2,717,810,951 2,662,160,128Liabilities against assets
subject to finance lease 19,123,648 13,377,907Provision for taxation - income tax 8,107,827 12,282,385
11,355,103,173 10,846,588,024CONTINGENCIES AND COMMITMENTS 4 - -
13,621,733,122 13,798,837,884
Property, plant and equipment 5 10,897,954,629 11,052,466,48012,636,768 12,636,768
10,910,591,397 11,065,103,248
CURRENT ASSETS
Stores, spares and loose tools 424,472,936 424,702,996Stock in trade 432,022,873 445,370,174Trade debts 6 1,713,061,030 1,713,536,773Loans and advances 43,011,150 51,860,178Deposits and prepayments 12,888,322 12,665,135Other receivables 24,222,645 24,730,221Tax refunds due from
Government 38,141,946 33,568,219Cash and bank balances 23,320,823 27,300,940
2,711,141,725 2,733,734,636
13,621,733,122 13,798,837,884The annexed notes form an integral part of this condensed interim financial report
05
MUHAMMAD NAEEM(DIRECTOR)
MIAN MUHAMMAD LATIF(CHIEF EXECUTIVE OFFICER)
MUHAMMAD NAEEM(DIRECTOR)
MIAN MUHAMMAD LATIF(CHIEF EXECUTIVE OFFICER)
PROFIT AND LOSS ACCOUNT(Un-audited)For the 3rd Quarter ended March 31, 2016.
2016 2015 2016 2015Note Rupees Rupees Rupees Rupees
Sales 7 514,949,451 568,135,582 1,489,658,359 1,615,697,403Cost of sales 8 566,008,807 610,212,769 1,676,227,642 1,753,972,394Gross (loss) (51,059,356) (42,077,187) (186,569,283) (138,274,991)
Other operating income 9 3,413,829 5,267,114 11,274,378 16,979,129(47,645,527) (36,810,073) (175,294,905) (121,295,862)
Selling and distribution expenses 5,586,628 6,195,634 15,132,729 22,072,282Administrative expenses 33,617,537 31,334,386 99,095,762 93,437,036Other operating expenses - - - -Finance cost 10 24,485,662 21,846,488 76,126,188 76,124,805
63,689,827 59,376,508 190,354,679 191,634,123(Loss) for the period before taxation (111,335,354) (96,186,581) (365,649,584) (312,929,985)
Provision for taxation 11 2,825,542 2,139,001 8,107,827 12,177,985
(Loss) for the period after taxation (114,160,896) (98,325,582) (373,757,411) (325,107,970)
Earnings per share - Basic (0.99) (0.86) (3.25) (2.83)
The annexed notes form an integral part of this condensed interim financial report
CONDENSED INTERIM STATEMENT OF COMPREHENSIVE INCOME (UNAUDITED)For the 3rd Quarter ended March 31, 2016.
2016 2015 2016 2015Rupees Rupees Rupees Rupees
(Loss) for the period (114,160,896) (98,325,582) (373,757,411) (325,107,970)
Other comprehensive incomeItem that will not be subsequently
reclassified to profit or lossIncremental depreciation on revalued
revalued assets for the period 19,792,971 5,183,989 31,370,374 19,153,700Related deferred tax 4,420,549 - 7,191,085 -
(89,947,376) (93,141,593) (335,195,952) (305,954,270)
The annexed notes form an integral part of this condensed interim financial report
Quarter ended March 31, 3rd Quarter ended March 31,
Quarter ended March 31, 3rd Quarter ended March 31,
06
MUHAMMAD NAEEM(DIRECTOR)
MIAN MUHAMMAD LATIF(CHIEF EXECUTIVE OFFICER)
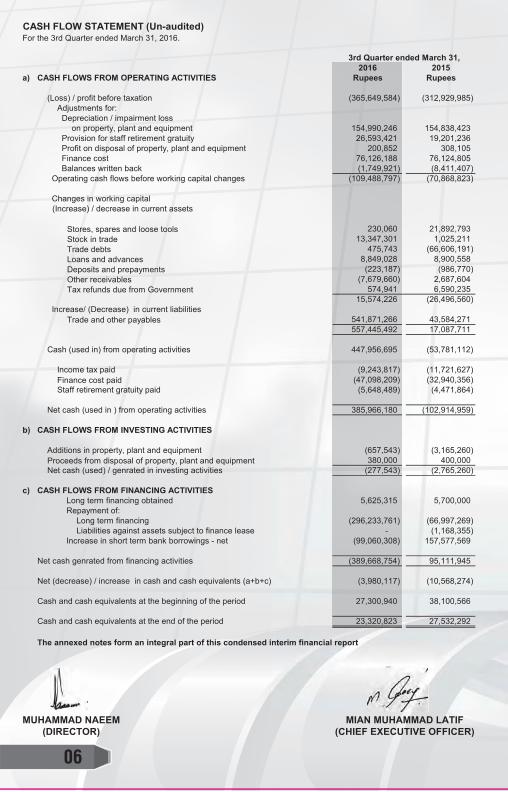
CASH FLOW STATEMENT (Un-audited)For the 3rd Quarter ended March 31, 2016.
2016 2015a) CASH FLOWS FROM OPERATING ACTIVITIES Rupees Rupees
(Loss) / profit before taxation (365,649,584) (312,929,985)Adjustments for: Depreciation / impairment loss
on property, plant and equipment 154,990,246 154,838,423 Provision for staff retirement gratuity 26,593,421 19,201,236 Profit on disposal of property, plant and equipment 200,852 308,105 Finance cost 76,126,188 76,124,805 Balances written back (1,749,921) (8,411,407)
Operating cash flows before working capital changes (109,488,797) (70,868,823)
Changes in working capital (Increase) / decrease in current assets
Stores, spares and loose tools 230,060 21,892,793Stock in trade 13,347,301 1,025,211Trade debts 475,743 (66,606,191)Loans and advances 8,849,028 8,900,558Deposits and prepayments (223,187) (986,770)Other receivables (7,679,660) 2,687,604Tax refunds due from Government 574,941 6,590,235
15,574,226 (26,496,560) Increase/ (Decrease) in current liabilities
Trade and other payables 541,871,266 43,584,271557,445,492 17,087,711
Cash (used in) from operating activities 447,956,695 (53,781,112)
Income tax paid (9,243,817) (11,721,627)Finance cost paid (47,098,209) (32,940,356)Staff retirement gratuity paid (5,648,489) (4,471,864)
Net cash (used in ) from operating activities 385,966,180 (102,914,959)
b) CASH FLOWS FROM INVESTING ACTIVITIES
Additions in property, plant and equipment (657,543) (3,165,260)Proceeds from disposal of property, plant and equipment 380,000 400,000Net cash (used) / genrated in investing activities (277,543) (2,765,260)
c) CASH FLOWS FROM FINANCING ACTIVITIESLong term financing obtained 5,625,315 5,700,000Repayment of:
Long term financing (296,233,761) (66,997,269)Liabilities against assets subject to finance lease - (1,168,355)
Increase in short term bank borrowings - net (99,060,308) 157,577,569
Net cash genrated from financing activities (389,668,754) 95,111,945
Net (decrease) / increase in cash and cash equivalents (a+b+c) (3,980,117) (10,568,274)
Cash and cash equivalents at the beginning of the period 27,300,940 38,100,566
Cash and cash equivalents at the end of the period 23,320,823 27,532,292
The annexed notes form an integral part of this condensed interim financial report
3rd Quarter ended March 31,
07
MU
HA
MM
AD
NA
EEM
(DIR
ECTO
R)
MIA
N M
UH
AM
MA
D L
ATI
F(C
HIE
F EX
ECU
TIVE
OFF
ICER
)
Tota
l
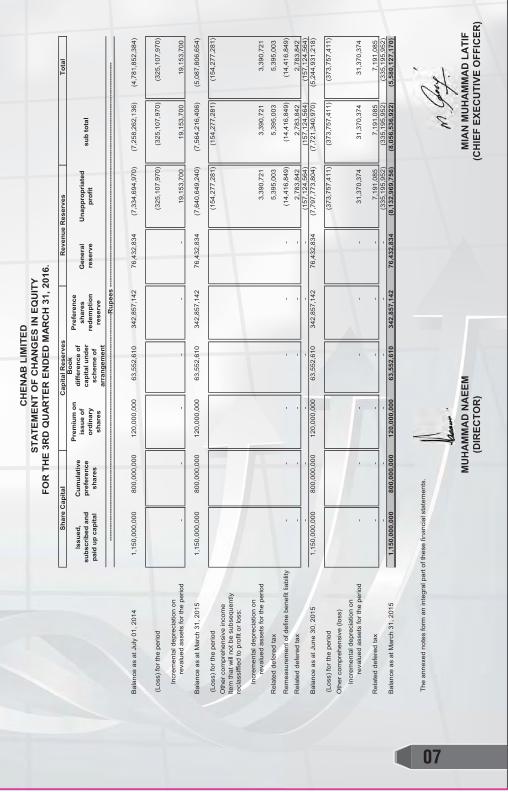
Bal
ance
as
at J
uly
01, 2
014
1,15
0,00
0,00
0
80
0,00
0,00
0
12
0,00
0,00
0
63
,552
,610
342,
857,
142
76,4
32,8
34
(7,3
34,6
94,9
70)
(7,2
58,2
62,1
36)
(4,7
81,8
52,3
84)
(Los
s) fo
r the
per
iod
(325
,107
,970
)
(325
,107
,970
)
(325
,107
,970
)
Incr
emen
tal d
epre
ciat
ion
onre
valu
ed a
sset
s fo
r the
per
iod
-
-
-
-
-
-
19,1
53,7
00
19
,153
,700
19,1
53,7
00
Bal
ance
as
at M
arch
31,
201
51,
150,
000,
000
800,
000,
000
120,
000,
000
63,5
52,6
10
34
2,85
7,14
2
76
,432
,834
(7
,640
,649
,240
)
(7
,564
,216
,406
)
(5
,087
,806
,654
)
(Los
s) fo
r the
per
iod
(154
,277
,281
)
(154
,277
,281
)
(154
,277
,281
)
Oth
er c
ompr
ehen
sive
inco
me
Item
that
will
not b
e su
bseq
uent
lyre
clas
siffi
ed to
pro
fit o
r los
s:
Incr
emen
tal d
epre
ciat
ion
onre
valu
ed a
sset
s fo
r the
per
iod
3,39
0,72
1
3,39
0,72
1
3,39
0,72
1
Rel
ated
def
ered
tax
5,39
5,00
3
5,39
5,00
3
5,39
5,00
3
Rem
easu
rem
ent o
f def
ine
bene
fit li
abilit
y-
-
-
-
-
-
(1
4,41
6,84
9)
(1
4,41
6,84
9)
(1
4,41
6,84
9)
Rel
ated
def
ered
tax
-
-
-
-
-
-
2,78
3,84
2
2,78
3,84
2
2,78
3,84
2
-
-
-
-
-
-
(157
,124
,564
)
(157
,124
,564
)
(157
,124
,564
)
Bal
ance
as
at J
une
30, 2
015
1,15
0,00
0,00
0
80
0,00
0,00
0
12
0,00
0,00
0
63
,552
,610
342,
857,
142
76,4
32,8
34
(7,7
97,7
73,8
04)
(7,7
21,3
40,9
70)
(5,2
44,9
31,2
18)
(Los
s) fo
r the
per
iod
(373
,757
,411
)
(373
,757
,411
)
(373
,757
,411
)
Oth
er c
ompr
ehen
sive
(los
s)
Incr
emen
tal d
epre
ciat
ion
onre
valu
ed a
sset
s fo
r the
per
iod
-
-
-
-
-
-
31,3
70,3
74
31
,370
,374
31,3
70,3
74
Rel
ated
def
ered
tax
-
-
-
-
-
-
7,19
1,08
5
7,19
1,08
5
7,19
1,08
5
-
-
-
-
-
-
(335
,195
,952
)
(335
,195
,952
)
(335
,195
,952
)
Bal
ance
as
at M
arch
31,
201
51,
150,
000,
000
800,
000,
000
120,
000,
000
63,5
52,6
10
34
2,85
7,14
2
76
,432
,834
(8
,132
,969
,756
)
(8
,056
,536
,922
)
(5
,580
,127
,170
)
The
anne
xed
note
s fo
rm a
n in
tegr
al p
art o
f the
se fi
nanc
ial s
tate
men
ts.
----
----
----
----
----
----
----
----
----
----
----
----
----
----
----
----
----
----
----
----
----
----
----
----
---R
upee
s --
----
----
----
----
-----
----
----
----
----
----
----
----
----
----
----
----
----
----
----
----
----
----
----
---
Issu
ed,
subs
crib
ed a
nd
paid
up
capi
tal
Pre
fere
nce
shar
es
rede
mpt
ion
rese
rve
Gen
eral
res
erve
Cum
ulat
ive
pref
eren
ce
shar
es
Pre
miu
m o
n is
sue
of
ordi
nary
sh
ares
Una
ppro
pria
ted
prof
it
Boo
k di
ffer
ence
of
capi
tal u
nder
sc
hem
e of
ar
rang
emen
t
sub
tota
l
CH
EN
AB
LIM
ITE
DS
TATE
ME
NT
OF
CH
AN
GE
S IN
EQ
UIT
YFO
R T
HE
3R
D Q
UA
RTE
R E
ND
ED
MA
RC
H 3
1, 2
016.
Sha
re C
apita
lR
even
ue R
eser
ves
Cap
ital R
eser
ves
08
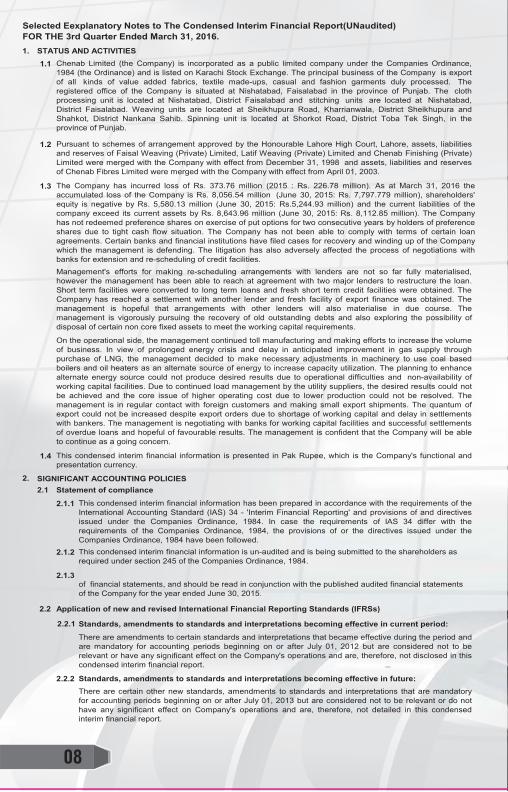
Selected Eexplanatory Notes to The Condensed Interim Financial Report(UNaudited)
1. STATUS AND ACTIVITIES1.1
1.2
1.3
1.4
2.2.1 Statement of compliance
2.1.1
2.1.2
2.1.3
2.2 Application of new and revised International Financial Reporting Standards (IFRSs)
2.2.1
2.2.2
On the operational side, the management continued toll manufacturing and making efforts to increase the volumeof business. In view of prolonged energy crisis and delay in anticipated improvement in gas supply throughpurchase of LNG, the management decided to make necessary adjustments in machinery to use coal basedboilers and oil heaters as an alternate source of energy to increase capacity utilization. The planning to enhancealternate energy source could not produce desired results due to operational difficulties and non-availability ofworking capital facilities. Due to continued load management by the utility suppliers, the desired results could notbe achieved and the core issue of higher operating cost due to lower production could not be resolved. Themanagement is in regular contact with foreign customers and making small export shipments. The quantum ofexport could not be increased despite export orders due to shortage of working capital and delay in settlementswith bankers. The management is negotiating with banks for working capital facilities and successful settlementsof overdue loans and hopeful of favourable results. The management is confident that the Company will be ableto continue as a going concern.
This condensed interim financial information is presented in Pak Rupee, which is the Company's functional andpresentation currency.
Standards, amendments to standards and interpretations becoming effective in current period:
This condensed interim financial information has been prepared in accordance with the requirements of theInternational Accounting Standard (IAS) 34 - 'Interim Financial Reporting' and provisions of and directivesissued under the Companies Ordinance, 1984. In case the requirements of IAS 34 differ with therequirements of the Companies Ordinance, 1984, the provisions of or the directives issued under theCompanies Ordinance, 1984 have been followed.This condensed interim financial information is un-audited and is being submitted to the shareholders as required under section 245 of the Companies Ordinance, 1984.
of financial statements, and should be read in conjunction with the published audited financial statements of the Company for the year ended June 30, 2015.
There are certain other new standards, amendments to standards and interpretations that are mandatoryfor accounting periods beginning on or after July 01, 2013 but are considered not to be relevant or do nothave any significant effect on Company's operations and are, therefore, not detailed in this condensedinterim financial report.
Pursuant to schemes of arrangement approved by the Honourable Lahore High Court, Lahore, assets, liabilitiesand reserves of Faisal Weaving (Private) Limited, Latif Weaving (Private) Limited and Chenab Finishing (Private)Limited were merged with the Company with effect from December 31, 1998 and assets, liabilities and reservesof Chenab Fibres Limited were merged with the Company with effect from April 01, 2003.
The Company has incurred loss of Rs. 373.76 million (2015 : Rs. 226.78 million). As at March 31, 2016 theaccumulated loss of the Company is Rs. 8,056.54 million (June 30, 2015: Rs. 7,797.779 million), shareholders'equity is negative by Rs. 5,580.13 million (June 30, 2015: Rs.5,244.93 million) and the current liabilities of thecompany exceed its current assets by Rs. 8,643.96 million (June 30, 2015: Rs. 8,112.85 million). The Companyhas not redeemed preference shares on exercise of put options for two consecutive years by holders of preferenceshares due to tight cash flow situation. The Company has not been able to comply with terms of certain loanagreements. Certain banks and financial institutions have filed cases for recovery and winding up of the Companywhich the management is defending. The litigation has also adversely affected the process of negotiations withbanks for extension and re-scheduling of credit facilities. Management's efforts for making re-scheduling arrangements with lenders are not so far fully materialised,however the management has been able to reach at agreement with two major lenders to restructure the loan.Short term facilities were converted to long term loans and fresh short term credit facilities were obtained. TheCompany has reached a settlement with another lender and fresh facility of export finance was obtained. Themanagement is hopeful that arrangements with other lenders will also materialise in due course. Themanagement is vigorously pursuing the recovery of old outstanding debts and also exploring the possibility ofdisposal of certain non core fixed assets to meet the working capital requirements.
Standards, amendments to standards and interpretations becoming effective in future:
There are amendments to certain standards and interpretations that became effective during the period andare mandatory for accounting periods beginning on or after July 01, 2012 but are considered not to berelevant or have any significant effect on the Company's operations and are, therefore, not disclosed in thiscondensed interim financial report.
FOR THE 3rd Quarter Ended March 31, 2016.
Chenab Limited (the Company) is incorporated as a public limited company under the Companies Ordinance,1984 (the Ordinance) and is listed on Karachi Stock Exchange. The principal business of the Company is exportof all kinds of value added fabrics, textile made-ups, casual and fashion garments duly processed. Theregistered office of the Company is situated at Nishatabad, Faisalabad in the province of Punjab. The clothprocessing unit is located at Nishatabad, District Faisalabad and stitching units are located at Nishatabad,District Faisalabad. Weaving units are located at Sheikhupura Road, Kharrianwala, District Sheikhupura andShahkot, District Nankana Sahib. Spinning unit is located at Shorkot Road, District Toba Tek Singh, in theprovince of Punjab.
SIGNIFICANT ACCOUNTING POLICIES
09
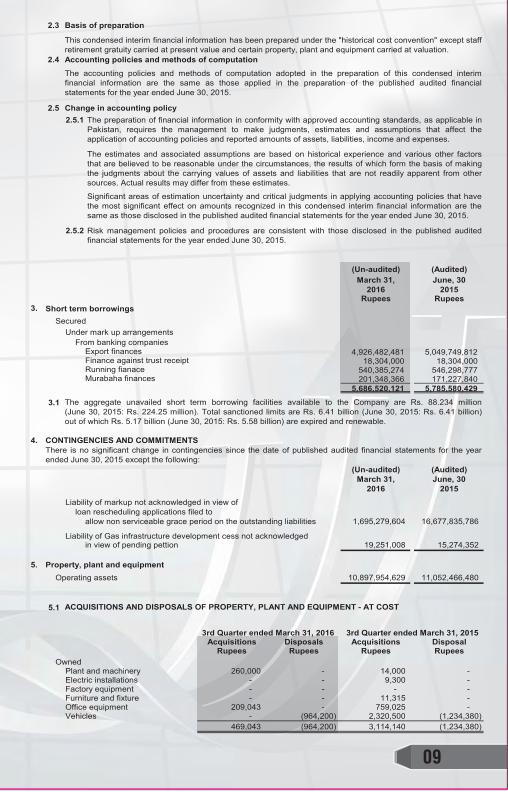
2.3 Basis of preparation
2.4 Accounting policies and methods of computation
2.52.5.1
2.5.2
(Un-audited) (Audited)March 31, June, 30
2016 2015Rupees Rupees
3. Short term borrowingsSecured
Under mark up arrangementsFrom banking companies
Export finances 4,926,482,481 5,049,749,812 Finance against trust receipt 18,304,000 18,304,000 Running fianace 540,385,274 546,298,777 Murabaha finances 201,348,366 171,227,840
5,686,520,121 5,785,580,429
3.1
4. CONTINGENCIES AND COMMITMENTS
(Un-audited) (Audited)March 31, June, 30
2016 2015Liability of markup not acknowledged in view of
loan rescheduling applications filed to allow non serviceable grace period on the outstanding liabilities 1,695,279,604 16,677,835,786
Liability of Gas infrastructure development cess not acknowledgedin view of pending pettion 19,251,008 15,274,352
5. Property, plant and equipmentOperating assets 10,897,954,629 11,052,466,480
5.1 ACQUISITIONS AND DISPOSALS OF PROPERTY, PLANT AND EQUIPMENT - AT COST
Acquisitions Disposals Acquisitions DisposalRupees Rupees Rupees Rupees
OwnedPlant and machinery 260,000 - 14,000 -Electric installations - - 9,300 -Factory equipment - - - -Furniture and fixture - - 11,315 -Office equipment 209,043 - 759,025 -Vehicles - (964,200) 2,320,500 (1,234,380)
469,043 (964,200) 3,114,140 (1,234,380)
Risk management policies and procedures are consistent with those disclosed in the published auditedfinancial statements for the year ended June 30, 2015.
3rd Quarter ended March 31, 2016
This condensed interim financial information has been prepared under the "historical cost convention" except staffretirement gratuity carried at present value and certain property, plant and equipment carried at valuation.
The accounting policies and methods of computation adopted in the preparation of this condensed interimfinancial information are the same as those applied in the preparation of the published audited financialstatements for the year ended June 30, 2015.
There is no significant change in contingencies since the date of published audited financial statements for the yearended June 30, 2015 except the following:
The aggregate unavailed short term borrowing facilities available to the Company are Rs. 88.234 million(June 30, 2015: Rs. 224.25 million). Total sanctioned limits are Rs. 6.41 billion (June 30, 2015: Rs. 6.41 billion)out of which Rs. 5.17 billion (June 30, 2015: Rs. 5.58 billion) are expired and renewable.
The preparation of financial information in conformity with approved accounting standards, as applicable inPakistan, requires the management to make judgments, estimates and assumptions that affect theapplication of accounting policies and reported amounts of assets, liabilities, income and expenses.
The estimates and associated assumptions are based on historical experience and various other factorsthat are believed to be reasonable under the circumstances, the results of which form the basis of makingthe judgments about the carrying values of assets and liabilities that are not readily apparent from othersources. Actual results may differ from these estimates.
Significant areas of estimation uncertainty and critical judgments in applying accounting policies that havethe most significant effect on amounts recognized in this condensed interim financial information are thesame as those disclosed in the published audited financial statements for the year ended June 30, 2015.
Change in accounting policy
3rd Quarter ended March 31, 2015
10
(Un-audited) (Audited)March 31, June, 30
2016 2015Rupees Rupees
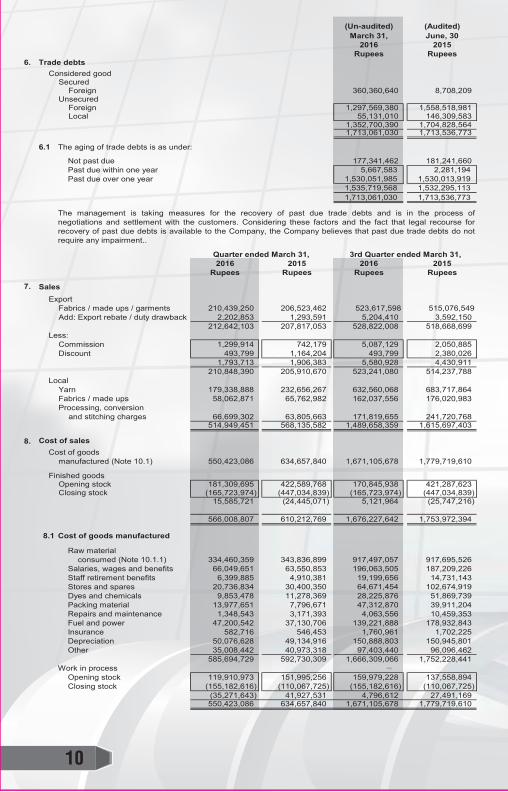
6. Trade debtsConsidered good
SecuredForeign 360,360,640 8,708,209
Unsecured Foreign 1,297,569,380 1,558,518,981Local 55,131,010 146,309,583
1,352,700,390 1,704,828,5641,713,061,030 1,713,536,773
6.1 The aging of trade debts is as under:
Not past due 177,341,462 181,241,660Past due within one year 5,667,583 2,281,194 Past due over one year 1,530,051,985 1,530,013,919
1,535,719,568 1,532,295,113 1,713,061,030 1,713,536,773
2016 2015 2016 2015Rupees Rupees Rupees Rupees
7. SalesExport
Fabrics / made ups / garments 210,439,250 206,523,462 523,617,598 515,076,549Add: Export rebate / duty drawback 2,202,853 1,293,591 5,204,410 3,592,150
212,642,103 207,817,053 528,822,008 518,668,699Less:
Commission 1,299,914 742,179 5,087,129 2,050,885Discount 493,799 1,164,204 493,799 2,380,026
1,793,713 1,906,383 5,580,928 4,430,911210,848,390 205,910,670 523,241,080 514,237,788
Local Yarn 179,338,888 232,656,267 632,560,068 683,717,864Fabrics / made ups 58,062,871 65,762,982 162,037,556 176,020,983Processing, conversion
and stitching charges 66,699,302 63,805,663 171,819,655 241,720,768514,949,451 568,135,582 1,489,658,359 1,615,697,403
8. Cost of salesCost of goods
manufactured (Note 10.1) 550,423,086 634,657,840 1,671,105,678 1,779,719,610
Finished goodsOpening stock 181,309,695 422,589,768 170,845,938 421,287,623Closing stock (165,723,974) (447,034,839) (165,723,974) (447,034,839)
15,585,721 (24,445,071) 5,121,964 (25,747,216)
566,008,807 610,212,769 1,676,227,642 1,753,972,394
Cost of goods manufactured
Raw material consumed (Note 10.1.1) 334,460,359 343,836,899 917,497,057 917,695,526
Salaries, wages and benefits 66,049,651 63,550,853 196,063,505 187,209,226Staff retirement benefits 6,399,885 4,910,381 19,199,656 14,731,143Stores and spares 20,736,834 30,400,350 64,671,454 102,674,919Dyes and chemicals 9,853,478 11,278,369 28,225,876 51,869,739Packing material 13,977,651 7,796,671 47,312,870 39,911,204Repairs and maintenance 1,348,543 3,171,393 4,063,556 10,459,353Fuel and power 47,200,542 37,130,706 139,221,888 178,932,843Insurance 582,716 546,453 1,760,961 1,702,225Depreciation 50,076,628 49,134,916 150,888,803 150,945,801Other 35,008,442 40,973,318 97,403,440 96,096,462
585,694,729 592,730,309 1,666,309,066 1,752,228,441Work in process
Opening stock 119,910,973 151,995,256 159,979,228 137,558,894Closing stock (155,182,616) (110,067,725) (155,182,616) (110,067,725)
(35,271,643) 41,927,531 4,796,612 27,491,169550,423,086 634,657,840 1,671,105,678 1,779,719,610
The management is taking measures for the recovery of past due trade debts and is in the process ofnegotiations and settlement with the customers. Considering these factors and the fact that legal recourse forrecovery of past due debts is available to the Company, the Company believes that past due trade debts do notrequire any impairment..
3rd Quarter ended March 31,
8.1
Quarter ended March 31,
11
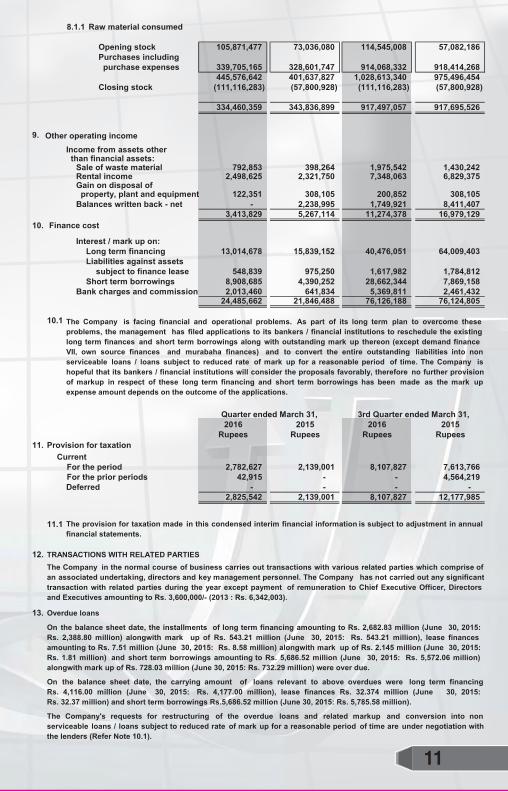
Raw material consumed
Opening stock 105,871,477 73,036,080 114,545,008 57,082,186Purchases including purchase expenses 339,705,165 328,601,747 914,068,332 918,414,268
445,576,642 401,637,827 1,028,613,340 975,496,454Closing stock (111,116,283) (57,800,928) (111,116,283) (57,800,928)
334,460,359 343,836,899 917,497,057 917,695,526
9.Income from assets other than financial assets:
Sale of waste material 792,853 398,264 1,975,542 1,430,242Rental income 2,498,625 2,321,750 7,348,063 6,829,375Gain on disposal of property, plant and equipment 122,351 308,105 200,852 308,105Balances written back - net - 2,238,995 1,749,921 8,411,407
3,413,829 5,267,114 11,274,378 16,979,12910.
Interest / mark up on:Long term financing 13,014,678 15,839,152 40,476,051 64,009,403Liabilities against assets
subject to finance lease 548,839 975,250 1,617,982 1,784,812Short term borrowings 8,908,685 4,390,252 28,662,344 7,869,158
Bank charges and commission 2,013,460 641,834 5,369,811 2,461,43224,485,662 21,846,488 76,126,188 76,124,805
10.1
2016 2015 2016 2015Rupees Rupees Rupees Rupees
11. Provision for taxationCurrent
For the period 2,782,627 2,139,001 8,107,827 7,613,766For the prior periods 42,915 - - 4,564,219Deferred - - - -
2,825,542 2,139,001 8,107,827 12,177,985
11.1
12. TRANSACTIONS WITH RELATED PARTIES
13. Overdue loans
8.1.1
The Company in the normal course of business carries out transactions with various related parties which comprise ofan associated undertaking, directors and key management personnel. The Company has not carried out any significanttransaction with related parties during the year except payment of remuneration to Chief Executive Officer, Directorsand Executives amounting to Rs. 3,600,000/- (2013 : Rs. 6,342,003).
The Company is facing financial and operational problems. As part of its long term plan to overcome theseproblems, the management has filed applications to its bankers / financial institutions to reschedule the existinglong term finances and short term borrowings along with outstanding mark up thereon (except demand financeVII, own source finances and murabaha finances) and to convert the entire outstanding liabilities into nonserviceable loans / loans subject to reduced rate of mark up for a reasonable period of time. The Company ishopeful that its bankers / financial institutions will consider the proposals favorably, therefore no further provisionof markup in respect of these long term financing and short term borrowings has been made as the mark upexpense amount depends on the outcome of the applications.
The Company's requests for restructuring of the overdue loans and related markup and conversion into nonserviceable loans / loans subject to reduced rate of mark up for a reasonable period of time are under negotiation withthe lenders (Refer Note 10.1).
Quarter ended March 31, 3rd Quarter ended March 31,
The provision for taxation made in this condensed interim financial information is subject to adjustment in annualfinancial statements.
On the balance sheet date, the installments of long term financing amounting to Rs. 2,682.83 million (June 30, 2015:Rs. 2,388.80 million) alongwith mark up of Rs. 543.21 million (June 30, 2015: Rs. 543.21 million), lease financesamounting to Rs. 7.51 million (June 30, 2015: Rs. 8.58 million) alongwith mark up of Rs. 2.145 million (June 30, 2015:Rs. 1.81 million) and short term borrowings amounting to Rs. 5,686.52 million (June 30, 2015: Rs. 5,572.06 million)alongwith mark up of Rs. 728.03 million (June 30, 2015: Rs. 732.29 million) were over due.
On the balance sheet date, the carrying amount of loans relevant to above overdues were long term financingRs. 4,116.00 million (June 30, 2015: Rs. 4,177.00 million), lease finances Rs. 32.374 million (June 30, 2015:Rs. 32.37 million) and short term borrowings Rs.5,686.52 million (June 30, 2015: Rs. 5,785.58 million).
Other operating income
Finance cost
12
MUHAMMAD NAEEM(DIRECTOR)
MIAN MUHAMMAD LATIF(CHIEF EXECUTIVE OFFICER)
14. DATE OF AUTHORISATION FOR ISSUE
15. GENERAL(i)
(ii)
(iii) Figures have been rounded off to the nearest Rupee.
This condensed interim financial report was authorised for issue on 29-04-2016 by the Board of Directors of theCompany.
There is no unusual item included in this condensed interim financial report which is affecting liabilities, assets,loss, comprehensive loss, cash flows or equity of the Company.
The provision for taxation made in this condensed interim financial report is subject to adjustment in annualfinancial statements. Deferred tax asset of Rs. 488.12 million (June 30, 2012: Rs. 437.76 million) has not beenrecognised in this condensed interim financial report in view of uncertain future results.