Embed Size (px)
Citation preview
BLACKALL
FLOOD RISK MANAGEMENT STUDY
Prepared for Blackall -Tambo Regional Council By DC Solutions and Yarramine Environmental
Report No: 00580_R1_v7.1
BTRC Project Ref: BRFP&MP
DC Project Ref: 00580
YAR Project Ref: J13_16
APRIL 2014

Blackall Flood Risk
Management Study
The Blackall Flood Risk Management Study is a joint initiative of the Blackall-Tambo Regional Council and the Queensland Government.
GENERAL DISCLAIMER & COPYRIGHT In preparing this document, DC Solutions and Yarramine Environmental may have relied upon certain information and data generated and provided by the client as set out in the terms of engagement agreed for the purposes of this document. Under the terms of engagement, DC Solutions and Yarramine Environmental are not required to verify or test the accuracy and/or completeness of such client information and data. Accordingly, DC Solutions and Yarramine Environmental do not and cannot warrant that the client information and data relied upon for the purpose of this report is accurate and complete. DC Solutions and Yarramine Environmental therefore does not and cannot accept any responsibility, and disclaims any liability for errors, omissions or misstatements contained in this report, which have resulted from DC Solutions and Yarramine Environmental placing reasonable reliance on such client information and data. © 2014 DC Solutions and Yarramine Environmental. All Rights Reserved. Copyright in the whole and every part of this document belongs to DC Solutions and Yarramine Environmental and may not be used, sold, transferred, copied or reproduced in whole or in part in any manner or form or in or on any media to any person without the prior written consent of DC Solutions and Yarramine Environmental.

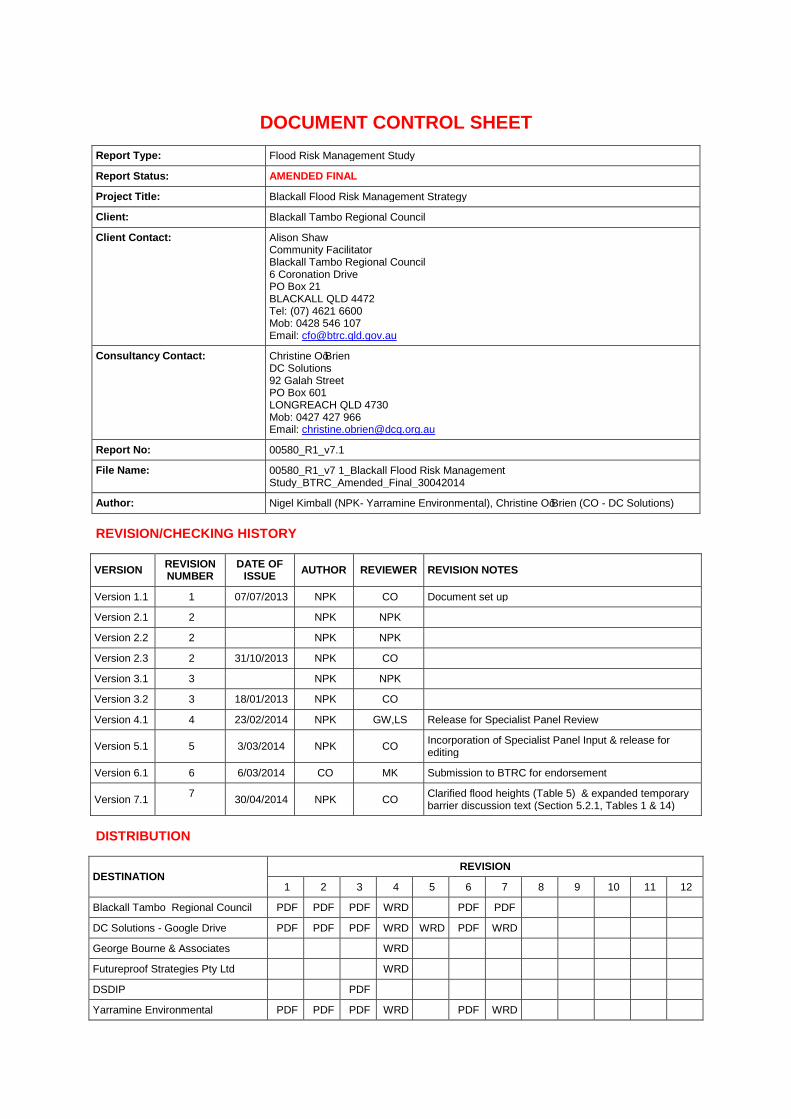
DOCUMENT CONTROL SHEET
Report Type: Flood Risk Management Study
Report Status: AMENDED FINAL
Project Title: Blackall Flood Risk Management Strategy
Client: Blackall Tambo Regional Council
Client Contact: Alison Shaw Community Facilitator Blackall Tambo Regional Council 6 Coronation Drive PO Box 21 BLACKALL QLD 4472 Tel: (07) 4621 6600 Mob: 0428 546 107 Email: [email protected]
Consultancy Contact: Christine O’Brien DC Solutions 92 Galah Street PO Box 601 LONGREACH QLD 4730 Mob: 0427 427 966 Email: [email protected]
Report No: 00580_R1_v7.1
File Name: 00580_R1_v7 1_Blackall Flood Risk Management Study_BTRC_Amended_Final_30042014
Author: Nigel Kimball (NPK- Yarramine Environmental), Christine O’Brien (CO - DC Solutions)
REVISION/CHECKING HISTORY
VERSION REVISION NUMBER
DATE OF ISSUE
AUTHOR REVIEWER REVISION NOTES
Version 1.1 1 07/07/2013 NPK CO Document set up
Version 2.1 2 NPK NPK
Version 2.2 2 NPK NPK
Version 2.3 2 31/10/2013 NPK CO
Version 3.1 3 NPK NPK
Version 3.2 3 18/01/2013 NPK CO
Version 4.1 4 23/02/2014 NPK GW,LS Release for Specialist Panel Review
Version 5.1 5 3/03/2014 NPK CO Incorporation of Specialist Panel Input & release for editing
Version 6.1 6 6/03/2014 CO MK Submission to BTRC for endorsement
Version 7.1 7
30/04/2014 NPK CO Clarified flood heights (Table 5) & expanded temporary barrier discussion text (Section 5.2.1, Tables 1 & 14)
DISTRIBUTION
DESTINATION REVISION
1 2 3 4 5 6 7 8 9 10 11 12
Blackall Tambo Regional Council PDF PDF PDF WRD PDF PDF
DC Solutions - Google Drive PDF PDF PDF WRD WRD PDF WRD
George Bourne & Associates WRD
Futureproof Strategies Pty Ltd WRD
DSDIP PDF
Yarramine Environmental PDF PDF PDF WRD PDF WRD

LIMITATION STATEMENT
The findings of this study are based on the Scope of Work described in this report and provided by
Blackall Tambo Regional Council to DC Solutions and Yarramine Consulting Pty Ltd, trading as
Yarramine Environmental (Yarramine). DC Solutions and Yarramine performed the services in a
manner consistent with the level of care and expertise exercised by members of the environmental
profession.
In conducting this study, DC Solutions and Yarramine have relied on data, surveys, analyses, designs,
plans and other information provided by the Client and other individuals and organisations, most of
which are referred to in the report as ‘the data’.
Except as otherwise stated in the report, DC Solutions and Yarramine have not verified the accuracy or
completeness of the data. To the extent that the statements, opinions, facts, information, conclusions
and/or recommendations in this report (‘conclusions’) are based in whole or part on the data, those
conclusions are contingent upon the accuracy and completeness of the data. DC Solutions and
Yarramine will not be liable in relation to incorrect conclusions should any data, information or condition
be incorrect or have been concealed, withheld, misrepresented or otherwise not fully disclosed to DC
Solutions and Yarramine.
DC Solutions and Yarramine assume no responsibility and will not be liable to any other person or
organisation for, or in relation to, any matter dealt with in this report, or for any loss or damage suffered
by any other person or organisation arising from matters dealt with, or conclusions expressed, in this
report (including, without limitation, matters arising from any negligent act or omission of DC Solutions
and Yarramine or for any loss or damage suffered by any other party relying upon the matters dealt
with or conclusions expressed in this report).
Other parties should not rely upon the report or the accuracy or completeness of any conclusions, and
should make their own inquiries and obtain independent advice in relation to such matters.
To the best of DC Solutions and Yarramine’s knowledge, the study presented and the facts and
matters described in this report as at the time of the study, and from information provided by the Client,
are current. Any changes to this information of which DC Solutions and Yarramine are not aware, and
have not had the opportunity to evaluate cannot, therefore, be considered in this report.
DC Solutions and Yarramine will not be liable to update or revise the report to take into account any
events or emergent circumstances or facts occurring or becoming apparent after the date of the report.
DC Solutions and Yarramine will retain any documents or files in its possession relating to the Scope of
Work for a period of 7 years from the date this report.
YARRAMINE CONSULTING PTY LTD
Nigel Kimball
Managing Director &
Senior Environmental Scientist
April 2014
DC SOLUTIONS LTD
Mark Kleinschmidt
Commercial Services Manager &
Senior Consultant
April 2014
Blackall Flood Risk Management Study Blackall - Tambo Regional Council
Report No: 00580_R1_v7.1 Page i
Executive Summary
The formulation and implementation of a Floodplain Risk Management Plan is the cornerstone of Blackall-Tambo Regional Council’s response to preparing for, managing and addressing flood impact on the township of Blackall well into the future. The Floodplain Risk Management Study is part of Council’s strategic planning approach. During the preparation of this Study, the merits of different management options and their impact on flood risk were assessed. Key to this exercise was the development, utilising flood extent and depth data developed by the Queensland Reconstruction Authority, of a Flood Risk Assessment Map for Blackall. Community involvement in this process was an important element in the development of the Floodplain Risk Management Study. Management options investigated as part of the Floodplain Risk Management Study included:
Flood modification measures (e.g. flood detention basins and drainage channel works);
Property modification measures (e.g. development controls); and
Flood response modification measures (e.g. community awareness and preparedness program).
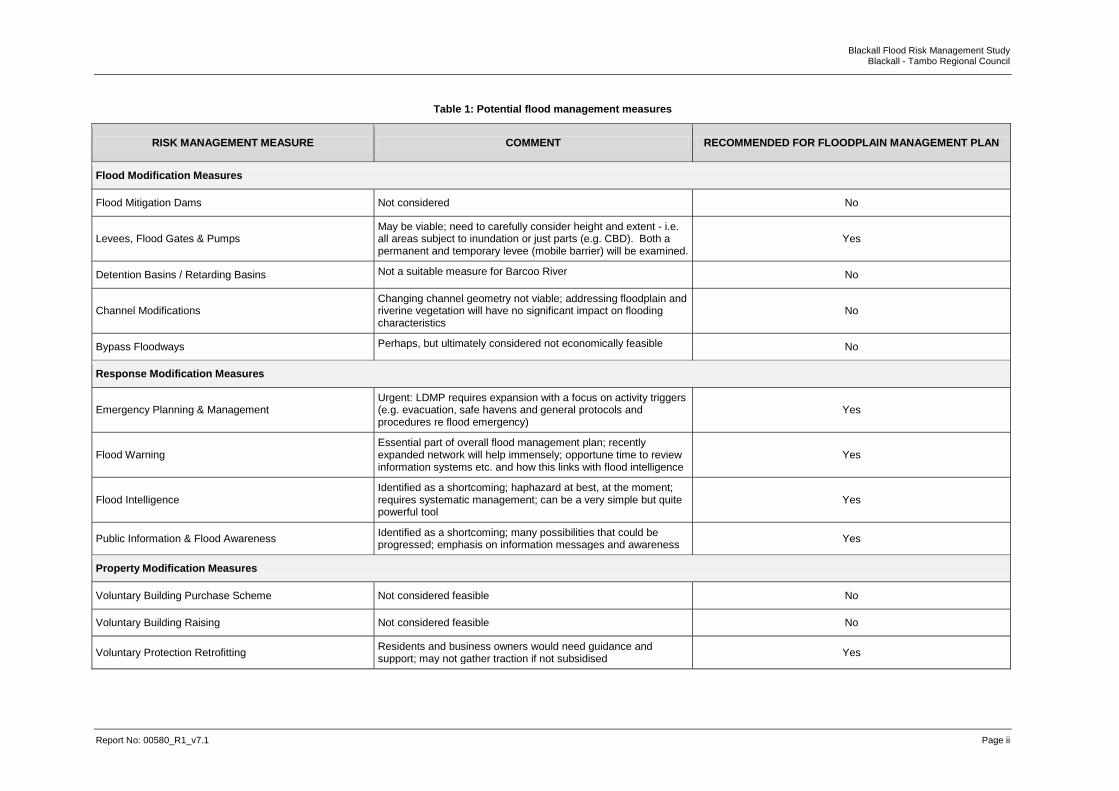
A summary of the floodplain management measures under consideration in this study is presented in Table 1. These measures are summarised in an options assessment matrix which highlights quantifiable impacts, costs and benefits, but also intangible considerations such as social and environmental factors. The matrix can be used to compare options and inform the selection of measures to be adopted for implementation. A number of other measures were considered during the study and documented in this report. Measures, which were not identified to carry forward for inclusion in the yet to be developed Preliminary Flood Risk Management Plan, were found to be not feasible or practicable based.
Blackall Flood Risk Management Study Blackall - Tambo Regional Council
Report No: 00580_R1_v7.1 Page ii
Table 1: Potential flood management measures
RISK MANAGEMENT MEASURE COMMENT RECOMMENDED FOR FLOODPLAIN MANAGEMENT PLAN
Flood Modification Measures
Flood Mitigation Dams Not considered No
Levees, Flood Gates & Pumps May be viable; need to carefully consider height and extent - i.e. all areas subject to inundation or just parts (e.g. CBD). Both a permanent and temporary levee (mobile barrier) will be examined.
Yes
Detention Basins / Retarding Basins Not a suitable measure for Barcoo River No
Channel Modifications Changing channel geometry not viable; addressing floodplain and riverine vegetation will have no significant impact on flooding characteristics
No
Bypass Floodways Perhaps, but ultimately considered not economically feasible No
Response Modification Measures
Emergency Planning & Management Urgent: LDMP requires expansion with a focus on activity triggers (e.g. evacuation, safe havens and general protocols and procedures re flood emergency)
Yes
Flood Warning Essential part of overall flood management plan; recently expanded network will help immensely; opportune time to review information systems etc. and how this links with flood intelligence
Yes
Flood Intelligence Identified as a shortcoming; haphazard at best, at the moment; requires systematic management; can be a very simple but quite powerful tool
Yes
Public Information & Flood Awareness Identified as a shortcoming; many possibilities that could be progressed; emphasis on information messages and awareness
Yes
Property Modification Measures
Voluntary Building Purchase Scheme Not considered feasible No
Voluntary Building Raising Not considered feasible No
Voluntary Protection Retrofitting Residents and business owners would need guidance and support; may not gather traction if not subsidised
Yes
Blackall Flood Risk Management Study Blackall - Tambo Regional Council
Report No: 00580_R1_v7.1 Page iii
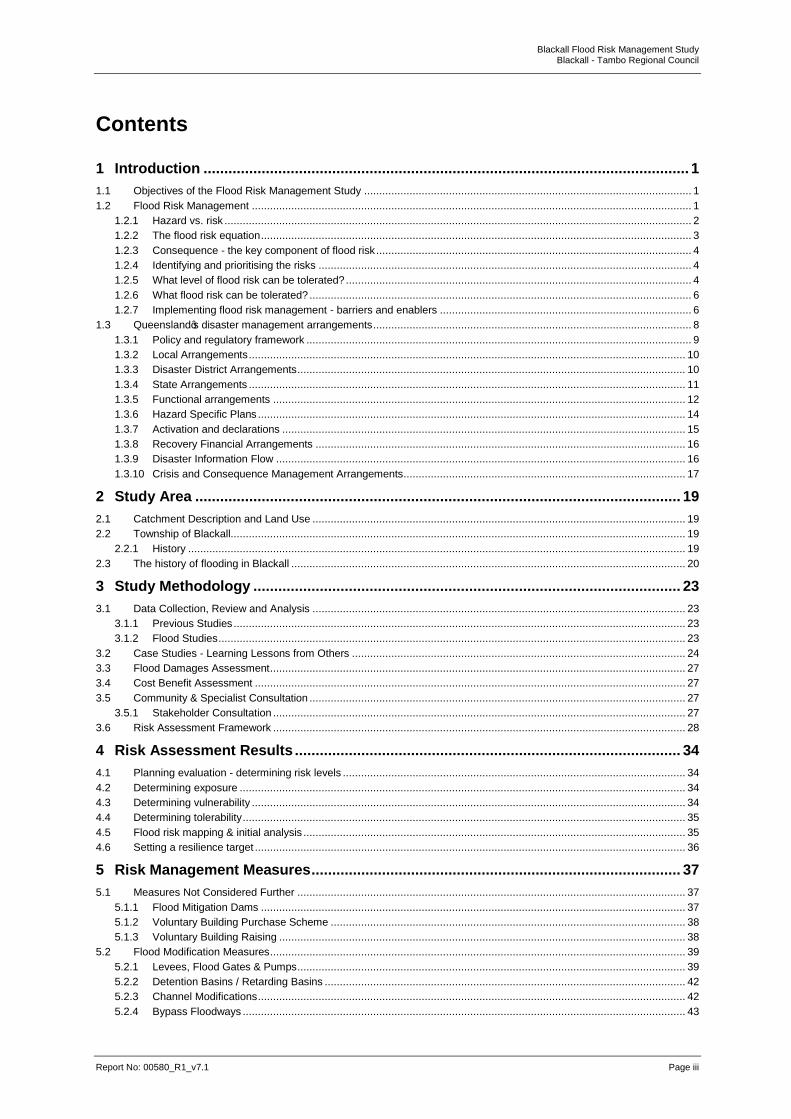
Contents
1 Introduction ..................................................................................................................... 1
1.1 Objectives of the Flood Risk Management Study ............................................................................................................ 1 1.2 Flood Risk Management ................................................................................................................................................. 1
1.2.1 Hazard vs. risk .......................................................................................................................................................... 2 1.2.2 The flood risk equation .............................................................................................................................................. 3 1.2.3 Consequence - the key component of flood risk ........................................................................................................ 4 1.2.4 Identifying and prioritising the risks ........................................................................................................................... 4 1.2.5 What level of flood risk can be tolerated? .................................................................................................................. 4 1.2.6 What flood risk can be tolerated? .............................................................................................................................. 6 1.2.7 Implementing flood risk management - barriers and enablers ................................................................................... 6
1.3 Queensland’s disaster management arrangements ......................................................................................................... 8 1.3.1 Policy and regulatory framework ............................................................................................................................... 9 1.3.2 Local Arrangements ................................................................................................................................................ 10 1.3.3 Disaster District Arrangements ................................................................................................................................ 10 1.3.4 State Arrangements ................................................................................................................................................ 11 1.3.5 Functional arrangements ........................................................................................................................................ 12 1.3.6 Hazard Specific Plans ............................................................................................................................................. 14 1.3.7 Activation and declarations ..................................................................................................................................... 15 1.3.8 Recovery Financial Arrangements .......................................................................................................................... 16 1.3.9 Disaster Information Flow ....................................................................................................................................... 16 1.3.10 Crisis and Consequence Management Arrangements ............................................................................................. 17
2 Study Area ..................................................................................................................... 19
2.1 Catchment Description and Land Use ........................................................................................................................... 19 2.2 Township of Blackall...................................................................................................................................................... 19
2.2.1 History .................................................................................................................................................................... 19 2.3 The history of flooding in Blackall .................................................................................................................................. 20
3 Study Methodology ....................................................................................................... 23
3.1 Data Collection, Review and Analysis ........................................................................................................................... 23 3.1.1 Previous Studies ..................................................................................................................................................... 23 3.1.2 Flood Studies .......................................................................................................................................................... 23
3.2 Case Studies - Learning Lessons from Others .............................................................................................................. 24 3.3 Flood Damages Assessment ......................................................................................................................................... 27 3.4 Cost Benefit Assessment .............................................................................................................................................. 27 3.5 Community & Specialist Consultation ............................................................................................................................ 27
3.5.1 Stakeholder Consultation ........................................................................................................................................ 27 3.6 Risk Assessment Framework ........................................................................................................................................ 28
4 Risk Assessment Results ............................................................................................. 34
4.1 Planning evaluation - determining risk levels ................................................................................................................. 34 4.2 Determining exposure ................................................................................................................................................... 34 4.3 Determining vulnerability ............................................................................................................................................... 34 4.4 Determining tolerability .................................................................................................................................................. 35 4.5 Flood risk mapping & initial analysis .............................................................................................................................. 35 4.6 Setting a resilience target .............................................................................................................................................. 36
5 Risk Management Measures ......................................................................................... 37
5.1 Measures Not Considered Further ................................................................................................................................ 37 5.1.1 Flood Mitigation Dams ............................................................................................................................................ 37 5.1.2 Voluntary Building Purchase Scheme ..................................................................................................................... 38 5.1.3 Voluntary Building Raising ...................................................................................................................................... 38
5.2 Flood Modification Measures ......................................................................................................................................... 39 5.2.1 Levees, Flood Gates & Pumps ................................................................................................................................ 39 5.2.2 Detention Basins / Retarding Basins ....................................................................................................................... 42 5.2.3 Channel Modifications ............................................................................................................................................. 42 5.2.4 Bypass Floodways .................................................................................................................................................. 43
Blackall Flood Risk Management Study Blackall - Tambo Regional Council
Report No: 00580_R1_v7.1 Page iv
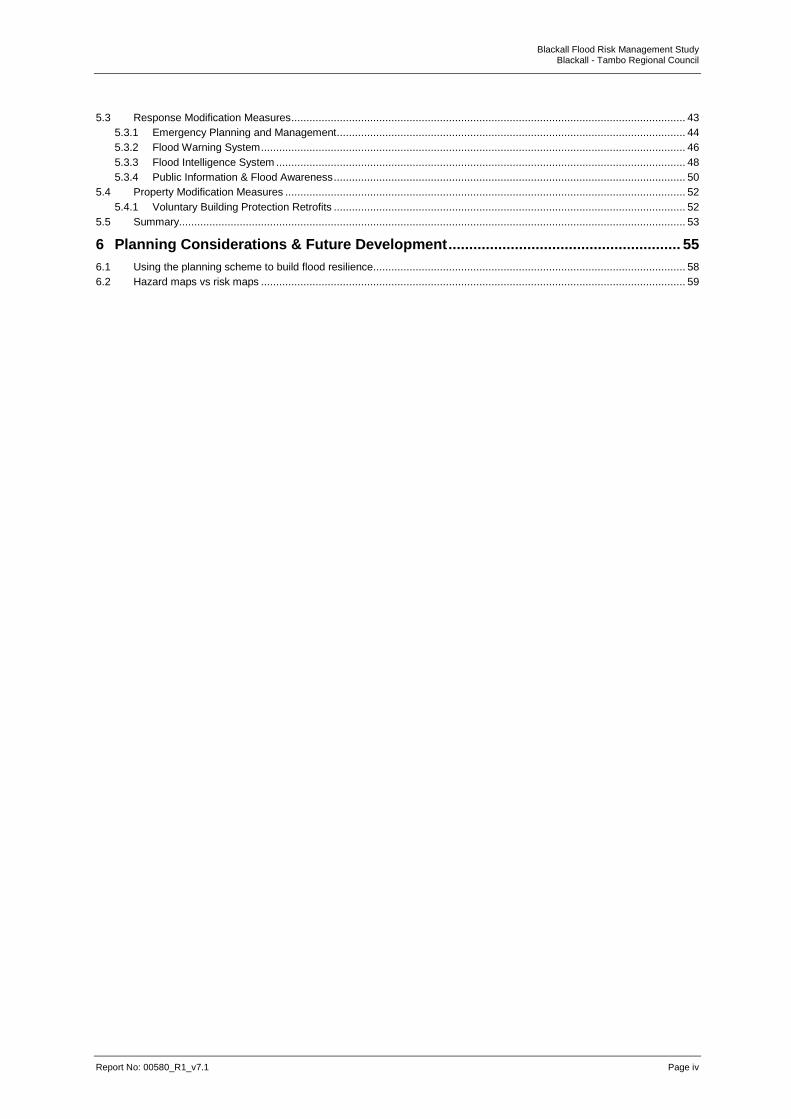
5.3 Response Modification Measures .................................................................................................................................. 43 5.3.1 Emergency Planning and Management ................................................................................................................... 44 5.3.2 Flood Warning System ............................................................................................................................................ 46 5.3.3 Flood Intelligence System ....................................................................................................................................... 48 5.3.4 Public Information & Flood Awareness .................................................................................................................... 50
5.4 Property Modification Measures .................................................................................................................................... 52 5.4.1 Voluntary Building Protection Retrofits .................................................................................................................... 52
5.5 Summary....................................................................................................................................................................... 53
6 Planning Considerations & Future Development ........................................................ 55
6.1 Using the planning scheme to build flood resilience....................................................................................................... 58 6.2 Hazard maps vs risk maps ............................................................................................................................................ 59
Blackall Flood Risk Management Study Blackall - Tambo Regional Council
Report No: 00580_R1_v7.1 Page v
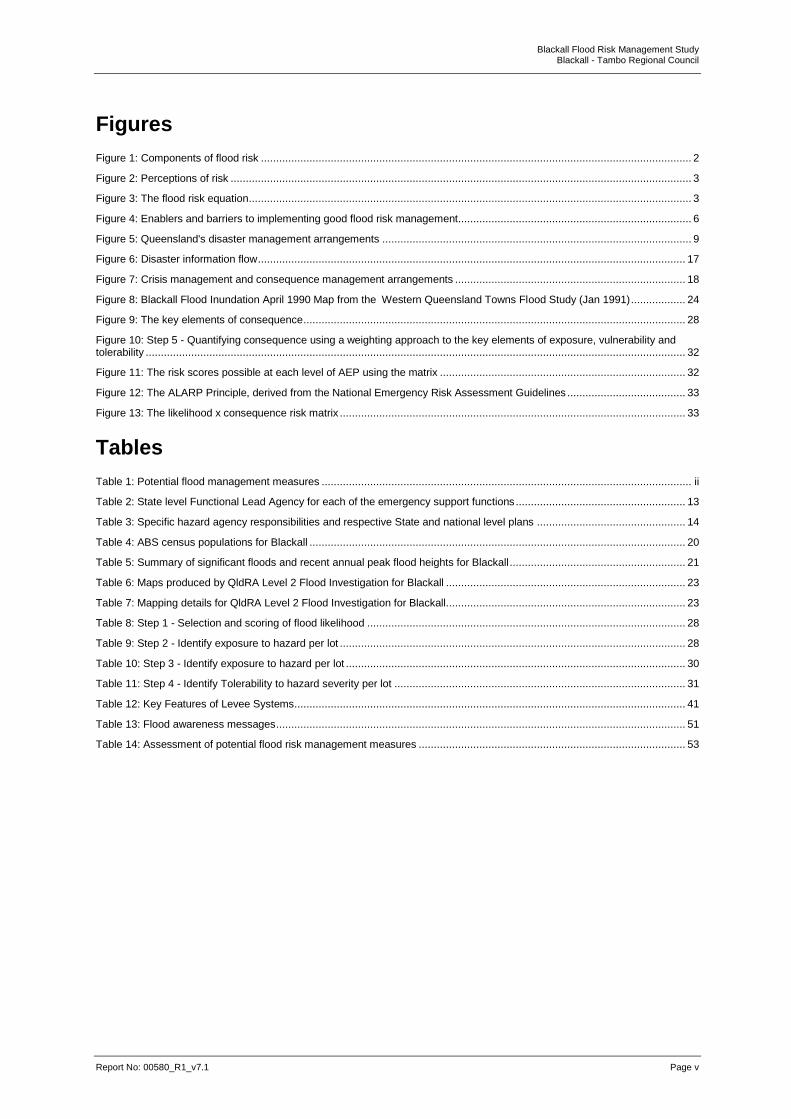
Figures
Figure 1: Components of flood risk .............................................................................................................................................. 2
Figure 2: Perceptions of risk ........................................................................................................................................................ 3
Figure 3: The flood risk equation .................................................................................................................................................. 3
Figure 4: Enablers and barriers to implementing good flood risk management ............................................................................. 6
Figure 5: Queensland's disaster management arrangements ...................................................................................................... 9
Figure 6: Disaster information flow ............................................................................................................................................. 17
Figure 7: Crisis management and consequence management arrangements ............................................................................ 18
Figure 8: Blackall Flood Inundation April 1990 Map from the Western Queensland Towns Flood Study (Jan 1991) .................. 24
Figure 9: The key elements of consequence .............................................................................................................................. 28
Figure 10: Step 5 - Quantifying consequence using a weighting approach to the key elements of exposure, vulnerability and tolerability .................................................................................................................................................................................. 32
Figure 11: The risk scores possible at each level of AEP using the matrix ................................................................................. 32
Figure 12: The ALARP Principle, derived from the National Emergency Risk Assessment Guidelines ....................................... 33
Figure 13: The likelihood x consequence risk matrix .................................................................................................................. 33
Tables
Table 1: Potential flood management measures .......................................................................................................................... ii
Table 2: State level Functional Lead Agency for each of the emergency support functions ........................................................ 13
Table 3: Specific hazard agency responsibilities and respective State and national level plans ................................................. 14
Table 4: ABS census populations for Blackall ............................................................................................................................ 20
Table 5: Summary of significant floods and recent annual peak flood heights for Blackall .......................................................... 21
Table 6: Maps produced by QldRA Level 2 Flood Investigation for Blackall ............................................................................... 23
Table 7: Mapping details for QldRA Level 2 Flood Investigation for Blackall............................................................................... 23
Table 8: Step 1 - Selection and scoring of flood likelihood ......................................................................................................... 28
Table 9: Step 2 - Identify exposure to hazard per lot .................................................................................................................. 28
Table 10: Step 3 - Identify exposure to hazard per lot ................................................................................................................ 30
Table 11: Step 4 - Identify Tolerability to hazard severity per lot ................................................................................................ 31
Table 12: Key Features of Levee Systems ................................................................................................................................. 41
Table 13: Flood awareness messages ....................................................................................................................................... 51
Table 14: Assessment of potential flood risk management measures ........................................................................................ 53

Blackall Flood Risk Management Study Blackall - Tambo Regional Council
Report No: 00580_R1_v7.1 Page vi
Appendices
Appendix A MAP 8: BARCOO RIVER SUB BASIN Appendix B MAP 10: TOWNSHIP OF BLACKALL Appendix C MAPS 1-7: QUEENSLAND RECONSTRUCTION AUTHORITY FLOOD MAPPING Appendix D BLACKALL TAMBO REGIONAL COUNCIL FLOOD MAPPING VALIDATION CORRESPONDENCE Appendix E CASE STUDY REPORT Appendix F FOCUS GROUP REPORT Appendix G MAP 15 - FLOOD RISK ASSESSMENT EVALUATION FOR 2% (1 IN 50 YEARS) FLOOD EVENT Appendix H MAP 11 - BLACKALL PLANNING SCHEME ZONING Appendix I MAP 12 - EXPOSURE EVALUATION FOR 2% (1 IN 50 YEARS) FLOOD EVENT Appendix J MAP 13 - VULNERABILITY EVALUATION FOR 2% (1 IN 50 YEARS) FLOOD EVENT Appendix K MAP 14 - TOLERABILITY EVALUATION FOR 2% (1 IN 50 YEARS) FLOOD EVENT

Blackall Flood Risk Management Study Blackall - Tambo Regional Council
Report No: 00580_R1_v7.1 Page vii
Glossary & Abbreviations
Annual Exceedance Probability (AEP)
The likelihood of a flood of a given size (or larger) in any one year, usually expressed as a percentage. For example, if a peak flood discharge of 500 cubic meters per second has an AEP of 5%, it means that there is a 5% risk (i.e. a probability of 0.05 or a likelihood of 1 in 20) of a peak flood discharge of 500 cubic meters per second or larger occurring in any one year. The AEP of a flood event gives no indication of when a flood of that size will occur next.
Catchment The land area drained by the main stream, as well as tributary streams, to a particular site. It always relates to an area above (upstream of) a specific location.
Defined Flood Event (DFE)
The flood event adopted as a reference point by a local government for the management of development in a particular locality. The DFE is generally not the full extent of the flood-prone land.
Effective warning time
The time from receiving advice of an impending flood until the floodwaters prevent appropriate flood response actions being undertaken. The effective warning time is typically used to move farm equipment, move stock, raise furniture, evacuate people and transport their possessions.
Emergency management
A range of measures to manage risks to communities and the environment. In the flood context, it may include measures to prevent, prepare for, respond to and recover from flooding.
Flash flooding Flooding which is sudden and unexpected. It is often caused by sudden local or nearby heavy rainfall. Often defined as flooding which peaks within six hours of the causative rain.
Flood Relatively high stream flow, which overtops the natural or artificial banks in any part of a stream, river, estuary, lake or dam, and/or local overland flooding, associated with major drainage before entering a watercourse, and/or coastal inundation resulting from super-elevated sea levels and/or waves overtopping coastline defences excluding tsunami.
Flood prone land (FPL)
Land susceptible to flooding by the Probable Maximum Flood (PMF) event. Flood prone land is synonymous with flood liable land.
Flood proofing A combination of measures incorporated in the design, construction and alteration of individual buildings or structures subject to flooding, to reduce or eliminate flood damage.
Flood readiness An ability to react effectively within the effective warning time.
Flood risk Potential danger to personal safety and potential damage to property resulting from flooding. The degree of risk varies with circumstances across the full range of floods. Flood risk in this manual is divided into 3 types: existing, future and continuing risks. They are described below. existing flood risk: the risk a community is exposed to as a result of its location on the floodplain. future flood risk: the risk a community may be exposed to as a result of new development on the floodplain. continuing flood risk: the risk a community is exposed to after floodplain risk management measures have been implemented. For a town protected by levees, the continuing flood risk is the consequences of the levees being overtopped. For an area without any floodplain risk management measures, the continuing flood risk is simply the existence of its flood exposure.
Floodplain An area of land adjacent to a creek, river, estuary, lake, dam or artificial channel, which is subject to inundation from the Probable Maximum Flood (PMF)
Floodway Those areas of the floodplain where a significant discharge of water occurs during the DFE. Floodways are often aligned with naturally defined channels and even if partially blocked would cause a significant redistribution of flood flow, or a significant increase in flood levels. What constitutes a floodway may vary from one floodplain or part of a floodplain to another. Floodways will normally be identified as part of a floodplain management study or flood study where their importance in the overall behaviour of flood flows can be properly taken into account.
Freeboard Usually expressed as a height above the Probable Maximum Flood, and used as the basis for the FPL. It is a factor of safety aimed at incorporating local hydraulic effects, wave action and uncertainties in the design flood levels, and is typically used in relation to the setting of floor levels, levee crest levels, etc.
Hazard A source of potential harm or a situation with a potential to cause loss. In relation to this manual, the hazard is flooding which has the potential to cause damage to the community. Definitions of high and low hazard categories are provided in the Manual.
Hydraulics Term given to the study of water flow in waterways; in particular, the evaluation of flow parameters such as water level and velocity.
Blackall Flood Risk Management Study Blackall - Tambo Regional Council
Report No: 00580_R1_v7.1 Page viii
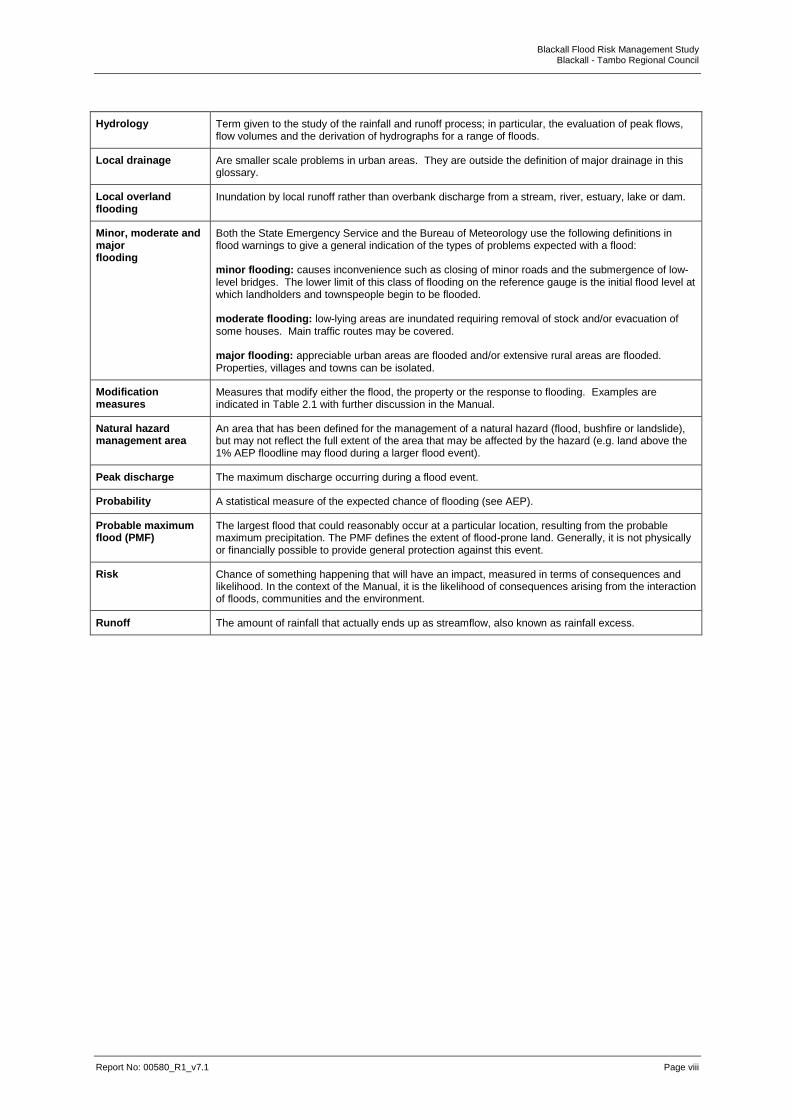
Hydrology Term given to the study of the rainfall and runoff process; in particular, the evaluation of peak flows, flow volumes and the derivation of hydrographs for a range of floods.
Local drainage Are smaller scale problems in urban areas. They are outside the definition of major drainage in this glossary.
Local overland flooding
Inundation by local runoff rather than overbank discharge from a stream, river, estuary, lake or dam.
Minor, moderate and major flooding
Both the State Emergency Service and the Bureau of Meteorology use the following definitions in flood warnings to give a general indication of the types of problems expected with a flood: minor flooding: causes inconvenience such as closing of minor roads and the submergence of low-level bridges. The lower limit of this class of flooding on the reference gauge is the initial flood level at which landholders and townspeople begin to be flooded. moderate flooding: low-lying areas are inundated requiring removal of stock and/or evacuation of some houses. Main traffic routes may be covered. major flooding: appreciable urban areas are flooded and/or extensive rural areas are flooded. Properties, villages and towns can be isolated.
Modification measures
Measures that modify either the flood, the property or the response to flooding. Examples are indicated in Table 2.1 with further discussion in the Manual.
Natural hazard management area
An area that has been defined for the management of a natural hazard (flood, bushfire or landslide), but may not reflect the full extent of the area that may be affected by the hazard (e.g. land above the 1% AEP floodline may flood during a larger flood event).
Peak discharge The maximum discharge occurring during a flood event.
Probability A statistical measure of the expected chance of flooding (see AEP).
Probable maximum flood (PMF)
The largest flood that could reasonably occur at a particular location, resulting from the probable maximum precipitation. The PMF defines the extent of flood-prone land. Generally, it is not physically or financially possible to provide general protection against this event.
Risk Chance of something happening that will have an impact, measured in terms of consequences and likelihood. In the context of the Manual, it is the likelihood of consequences arising from the interaction of floods, communities and the environment.
Runoff The amount of rainfall that actually ends up as streamflow, also known as rainfall excess.
Blackall Flood Risk Management Study Blackall - Tambo Regional Council
Report No: 00580_R1_v7.1 Page 1
1 Introduction
Natural hazards, including floods, have the potential to threaten life and property. They impose social and economic costs on governments and the community. Indeed, flooding is recognised as the costliest natural disaster in Australia. Historically, floodplains have always attracted settlement. Posing risks to the township of Blackall, riverine flooding from the Barcoo River tends not to follow a predictable pattern, occurring at any time of year and at irregular intervals. Flood risk management is a compromise that trades off the benefits of human occupation of the floodplain against the risk of flooding. The risk includes the flood hazard, social, economic and environmental costs and adverse consequences of flooding. This Flood Risk Management Study has been prepared by DC Solutions and Yarramine Environmental, and follows on from the Queensland Reconstruction Authority (QldRA) flood investigation for the township of Blackall, as part of the Queensland Flood Mapping Program. The management study draws on the results of this Level 2 flood study and uses this information, together with additional data collected for the management study, to assess feasible flood risk management measures, also known as flood treatments, for the Barcoo River within the Blackall township study area.
1.1 Objectives of the Flood Risk Management Study
To ensure that all levels of government and the local community accept their responsibilities for managing flood risk in Blackall.
To ensure that flood risk and flood behaviour is understood and considered in a strategic manner in the decision-making process.
To ensure land use planning and development controls minimise both the exposure of people to flood hazard and damage costs to property, new developments and infrastructure.
To ensure a broad range of flood risk management measures are considered, and flood mitigation measures appropriate to the location and acceptable to the local community are used to manage flood risk where economically, socially and environmentally acceptable.
To provide flood forecasting and warning systems and emergency response arrangements that cope with the impacts of flooding on the community in light of the available flood intelligence.
To aid the community in recovering from the devastating impacts of flooding.
1.2 Flood Risk Management
The concept of managing flood risk is receiving increased attention by many experts in Australia and throughout the world. Flood risk management, like other management strategies, provide a framework for balancing the multiple complementary and competing factors that affect risk. If properly structured, a strategy would focus all those factors toward an outcome such as reducing net flood losses to a community. It is generally thought that flood risk management may prove to be better than past strategies as a means of minimising the detrimental impacts flooding continues to have on humans. At the same time, a carefully crafted flood risk management strategy must also consider associated risks and opportunities, such as protecting natural floodplain functions from the detrimental impacts of human use.

Blackall Flood Risk Management Study Blackall - Tambo Regional Council
Report No: 00580_R1_v7.1 Page 2
Managing flood risk should provide a more comprehensive approach to coping with unwanted impacts than past efforts. These focused, at various times and places, on managing (controlling) the flood itself, managing the building and other development taking place in flood prone areas, managing the land area considered to be susceptible to flooding, managing flood damage (with relief measures, insurance, and recovery assistance), managing floodplain functions and resources (with regulatory controls or land management), or managing the vulnerability of development (by applying site-specific mitigation measures). These approaches have met with some success, but they often work at cross-purposes as a result of inconsistent or even contradictory policy foundations. They are also far from well-integrated as programs, have resulted in unintended consequences, focus only on the flood prone area itself rather than the entire catchment watershed and, taken together, have not reduced flood losses nationwide. Further, population growth and movement, anticipated changes in climate, and continued resource degradation can be expected to increase the potential for detrimental impacts and costs from flooding in the decades to come. Flood risk is a combination of the chance of a flood occurring and the consequences of the flood for people, property and infrastructure (Figure 1). The consequences of a flood depend upon how exposed the community is to flooding and how vulnerable its people, property and infrastructure are to the flood’s impacts. Managing risks from floods may involve altering the chance of flooding affecting a community, and/or reducing the impacts of flooding by reducing the community’s vulnerability and exposure to flooding. The methods that are effective in reducing flood risk are very location specific. There is no one-size-fits-all solution and varieties of measures are generally necessary to reduce risk.
Figure 1: Components of flood risk
Source: - Queensland Floods Science, Engineering and Technology Panel Understanding Floods – Questions and Answers
1.2.1 Hazard vs. risk
In understanding how flood risk can be addressed it is important to note the distinction between the terms ‘hazard’ and ‘risk’. These terms are often used interchangeably in both common and technical language, when in fact they describe separate but related matters. The difference from a planning perspective is critical, as ‘hazard’ relates principally to the nature of the event itself, while ‘risk’ relates to the possible impacts on people, property, infrastructure and the environment when that event occurs.
Flood Risk
Consequence of a flood
Chance of a flood
Exposure of a property/ communities to
flood waters
Vulnerability of a property/ communities to
flood waters
Blackall Flood Risk Management Study Blackall - Tambo Regional Council
Report No: 00580_R1_v7.1 Page 3
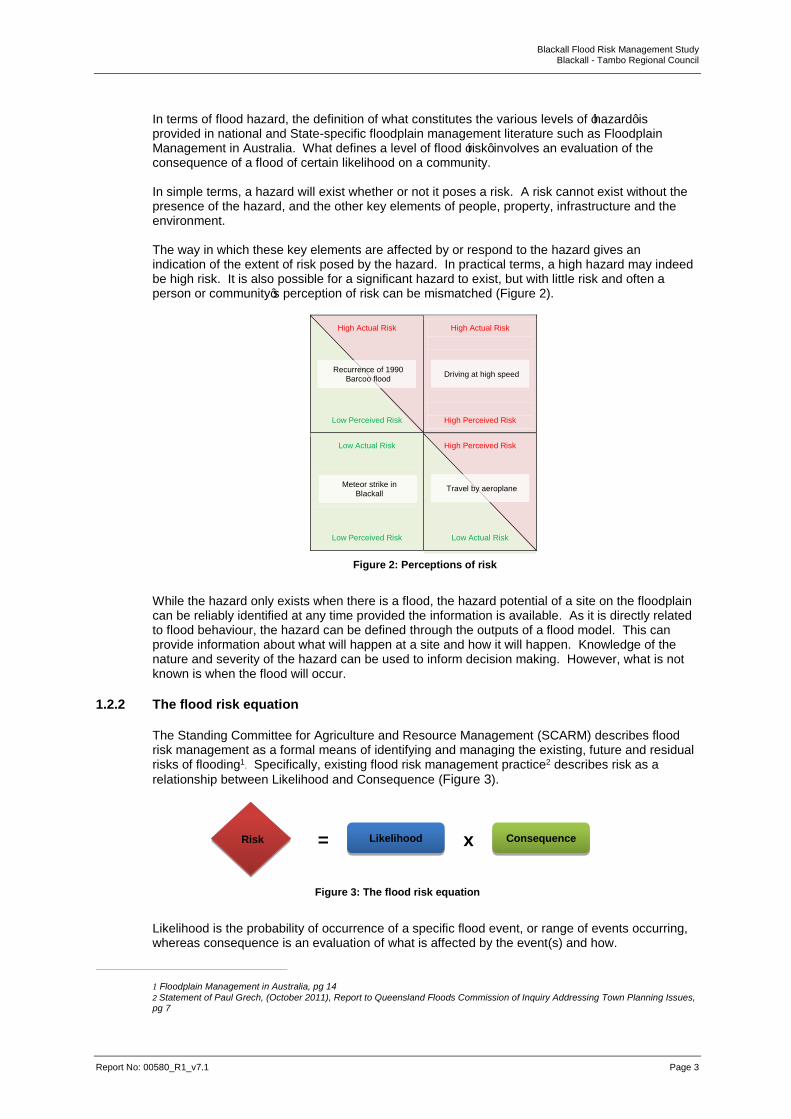
In terms of flood hazard, the definition of what constitutes the various levels of ‘hazard’ is provided in national and State-specific floodplain management literature such as Floodplain Management in Australia. What defines a level of flood ‘risk’ involves an evaluation of the consequence of a flood of certain likelihood on a community. In simple terms, a hazard will exist whether or not it poses a risk. A risk cannot exist without the presence of the hazard, and the other key elements of people, property, infrastructure and the environment. The way in which these key elements are affected by or respond to the hazard gives an indication of the extent of risk posed by the hazard. In practical terms, a high hazard may indeed be high risk. It is also possible for a significant hazard to exist, but with little risk and often a person or community’s perception of risk can be mismatched (Figure 2).
High Actual Risk
Low Perceived Risk
High Actual Risk
High Perceived Risk
Low Actual Risk
Low Perceived Risk
High Perceived Risk
Low Actual Risk
Figure 2: Perceptions of risk
While the hazard only exists when there is a flood, the hazard potential of a site on the floodplain can be reliably identified at any time provided the information is available. As it is directly related to flood behaviour, the hazard can be defined through the outputs of a flood model. This can provide information about what will happen at a site and how it will happen. Knowledge of the nature and severity of the hazard can be used to inform decision making. However, what is not known is when the flood will occur.
1.2.2 The flood risk equation
The Standing Committee for Agriculture and Resource Management (SCARM) describes flood risk management as a formal means of identifying and managing the existing, future and residual risks of flooding1
. Specifically, existing flood risk management practice2 describes risk as a
relationship between Likelihood and Consequence (Figure 3).
=
x
Figure 3: The flood risk equation
Likelihood is the probability of occurrence of a specific flood event, or range of events occurring, whereas consequence is an evaluation of what is affected by the event(s) and how.
1 Floodplain Management in Australia, pg 14
2 Statement of Paul Grech, (October 2011), Report to Queensland Floods Commission of Inquiry Addressing Town Planning Issues, pg 7
Consequence Likelihood Risk
Recurrence of 1990 Barcoo flood
Driving at high speed
Meteor strike in Blackall
Travel by aeroplane

Blackall Flood Risk Management Study Blackall - Tambo Regional Council
Report No: 00580_R1_v7.1 Page 4
An acceptable likelihood for planning and building purposes is usually defined as a Defined Flood Event (DFE), such as the 1% Annual Exceedance Probability (AEP). However, for planners and emergency response managers, an understanding of the consequence of that event, and the range of flood events that also may occur, is paramount. The element of consequence requires an understanding of flood behaviour (hazard) and the exposure, vulnerability and tolerability of people, property and infrastructure to a flood of that likelihood.
1.2.3 Consequence - the key component of flood risk
Quantifying consequence involves an evaluation of the interplay between three other key elements - Exposure, Vulnerability and Tolerability (refer to Section 3.6 on page 28). These three elements are the key considerations in developing balanced response measures in floodplains, whereby the flood hazard is understood and then evaluated in the context of competing interests and community preferences.
1.2.4 Identifying and prioritising the risks
In flood risk management, different types of risks need to be identified and distinguished to enable:
prioritisation for decision making; and
selection and evaluation of different strategies and measures that can be tailored to treating each type and level of risk.
The highest priority in risk management is almost universally agreed to be protecting people by taking steps to prevent loss of life and serious injury. This is the case whether the hazard creating the risk is natural or a result of human activity. The only difference is the way in which risk is treated. Flood risk management has now matured to a stage where it has recognised that there is not one solution, and different mixtures of measures that take different priority in each situation or place are needed. Flood risk management measures which include public awareness, flood warning and evacuation, together with adequate and appropriate evacuation infrastructure and flood monitoring systems, have now become an integral part of flood risk management. It is no longer just structural works such as flood mitigation dams and levees. How the other types of risks (financial, public/ private property damages, business losses and environmental impacts, etc.) are prioritised, will depend on many other factors. The solutions may vary depending whether measures are being sought to reduce danger and contain severe losses in an existing development on flood prone land, or they are part of planning for new floodplain development. Given Blackall experiences minor development change, much of the focus of this management study is devoted towards existing development, however, future development is addressed.
1.2.5 What level of flood risk can be tolerated?
It is widely accepted that risk is a fundamental part of normal life. However, trying to determine what level of flood risk is acceptable or at least tolerable to the community is not straightforward. In a Blackall context, the risk of severe flooding has a low probability but high consequences for its residents and business, but to a lesser extent than outlying rural properties. This is because more people and buildings are affected but not necessarily proportional flood damages. In general, communities trust authorities such as councils to have appropriate controls in place in residential areas prone to natural hazards.
Blackall Flood Risk Management Study Blackall - Tambo Regional Council
Report No: 00580_R1_v7.1 Page 5
From experience, individuals who have endured flooding show a range of symptoms, which include fear, anger, frustration, depression and outrage. The greater the losses, the greater the potential for public outrage. Such outrage is more likely if new developments have not had any measures to protect against flooding which exceeded the adopted risk levels, or if the measures put in place since the last flood have had minimal effect. Whilst flood risk is only one of several relevant interrelated factors, which have to be addressed when reaching decisions to develop land, a damage and loss-causing flood event is likely to provoke emotive reactions. What may initially have been determined to be a ‘tolerable’ or ‘acceptable’ flood risk is likely to be re-evaluated after the experience of a real flood. A basic approach to reduce risk has been to reduce the likelihood of buildings being flooded by adopting minimum FPLs for various types of development. A debate about infrequent flood events is unlikely to engage the community in a meaningful way and may indeed stifle debate about the other elements that make up risk i.e. the consequences of flooding. In most, but not all areas of Queensland, interstate and overseas, the probability of the flood selected for the FPL for residential development has been the 1% or 1 in 100 AEP design flood. Generally, habitable floor levels are required to be at or above this level and permissible land uses below that level are very limited. Good floodplain management practice also adds a freeboard to this design flood level to allow for uncertainties and give a margin for error to ensure that property will not be flooded when the flood event selected for the FPL occurs. Typically, a 0.5m freeboard is advocated. Damages to structure, fittings and contents are reduced because the chance of over-the-floor flooding is reduced. As a floodplain management measure on its own, a 1% FPL has limited regard for flood hazard and has no regard for the consequences of rarer flooding above that level. The consequences of flooding will vary between individuals depending on how they use the floodplain (e.g. agriculture compared to residential) and what remains exposed to the impacts of flooding. The standard is based on the premise that if a person lives in a house built at the 1% flood level for 70 years (a theoretical lifetime) then there is a 50-50 or even chance of experiencing a flood of 1% or greater during that 70 year period. A major problem arises because the section of the community that makes decisions for flood prone land (e.g. council/government), is not necessarily the same community that will eventually own or occupy new development on that land. It is they, the future residents and house owners and not the original decision-makers, who will be exposed to the risk of floods greater than the 1% flood. It is they who will be subject to property losses and personal risk. Decision-makers therefore have a duty of care when making floodplain risk management decisions, especially as the flood risk is foreseeable. Decisions made on behalf of the community (e.g. by an elected council or government) are more likely to be accepted if there has been open communication and consultation with the affected community so that the risk is readily understood. Whilst community involvement in decision-making results in the risk generally being more tolerable (Haddad 1994), in planning for new growth areas, engaging ‘the community’ can be challenging as the future residents are not readily identifiable. Ensuring that people are fully aware of the implications of investing or living in a flood prone property is the responsibility of government, councils and those involved directly in property development and marketing. If one uses common practice in Queensland and elsewhere as a guide, it is not unreasonable to suggest that the 1% or 1 in 100 AEP flood represents a frequency of flooding that can be tolerated by the community as a whole. So whilst accepting that no-one ever wants to have their house flooded, many people are prepared to tolerate some risk and live on land where there is a 1% chance in any year of flooding. What is not always appreciated is that the corollary of that decision, if it is the only floodplain management measure aimed at reducing the risk, is in floods any greater (rarer) than the 1% flood, property that is highly vulnerable to flood impacts will incur significant damage.
Blackall Flood Risk Management Study Blackall - Tambo Regional Council
Report No: 00580_R1_v7.1 Page 6
1.2.6 What flood risk can be tolerated?
People do not want to be impacted by flooding, but they may be prepared to tolerate a level of protection against floods up to and including the 1 in 100 AEP flood (1%). The 1% flood could therefore be said to represent the frequency of flooding that can be tolerated. Nevertheless, having a 1% flood-planning level does not offer any protection against rarer floods, the consequences of which may be very severe. Where floods only slightly rarer than 1% result in over-floor flooding of more than 0.3 metre or deeper, additional measures are needed to reduce the risk to prevent the extent of property damage becoming excessive and possibly catastrophic.
1.2.7 Implementing flood risk management - barriers and enablers
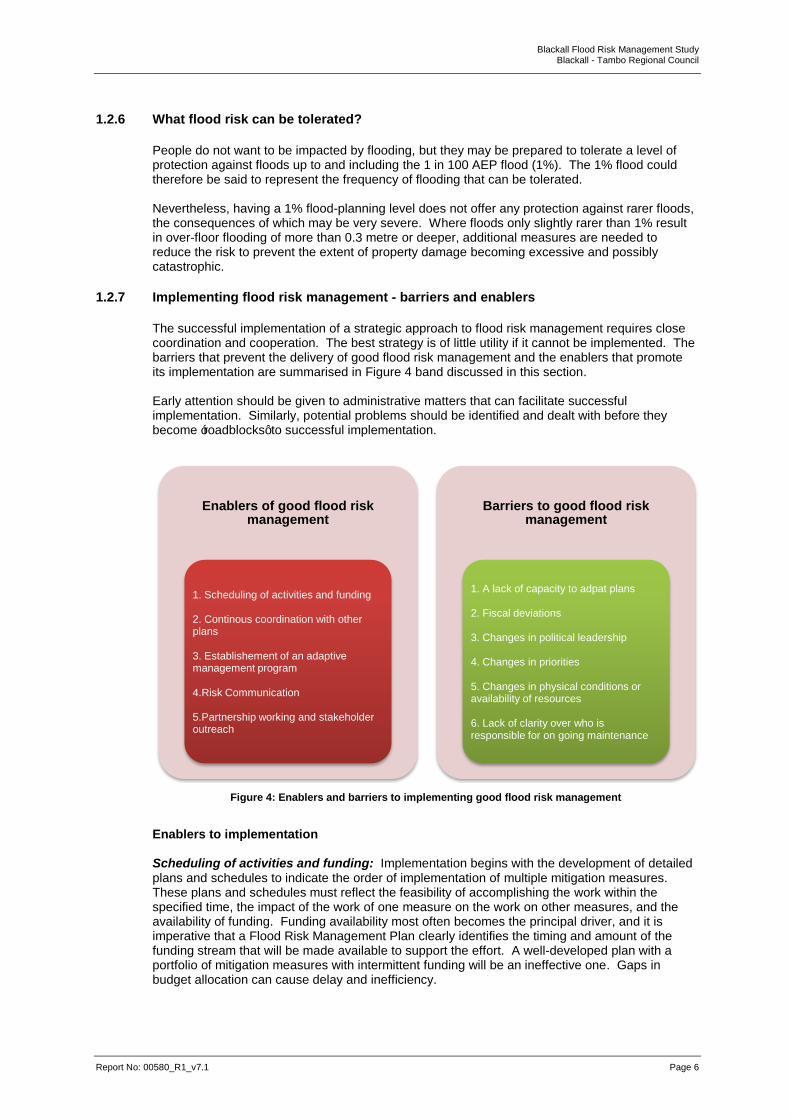
The successful implementation of a strategic approach to flood risk management requires close coordination and cooperation. The best strategy is of little utility if it cannot be implemented. The barriers that prevent the delivery of good flood risk management and the enablers that promote its implementation are summarised in Figure 4 band discussed in this section. Early attention should be given to administrative matters that can facilitate successful implementation. Similarly, potential problems should be identified and dealt with before they become ‘roadblocks’ to successful implementation.
Figure 4: Enablers and barriers to implementing good flood risk management
Enablers to implementation Scheduling of activities and funding: Implementation begins with the development of detailed plans and schedules to indicate the order of implementation of multiple mitigation measures. These plans and schedules must reflect the feasibility of accomplishing the work within the specified time, the impact of the work of one measure on the work on other measures, and the availability of funding. Funding availability most often becomes the principal driver, and it is imperative that a Flood Risk Management Plan clearly identifies the timing and amount of the funding stream that will be made available to support the effort. A well-developed plan with a portfolio of mitigation measures with intermittent funding will be an ineffective one. Gaps in budget allocation can cause delay and inefficiency.
Enablers of good flood risk management
1. Scheduling of activities and funding 2. Continous coordination with other plans 3. Establishement of an adaptive management program 4.Risk Communication 5.Partnership working and stakeholder outreach
Barriers to good flood risk management
1. A lack of capacity to adpat plans 2. Fiscal deviations 3. Changes in political leadership 4. Changes in priorities 5. Changes in physical conditions or availability of resources 6. Lack of clarity over who is responsible for on going maintenance
Blackall Flood Risk Management Study Blackall - Tambo Regional Council
Report No: 00580_R1_v7.1 Page 7
Continuous coordination with other plans: Flood risk management plans are among many that exist within governmental structures, and they must be carefully coordinated with these other plans. National and state policies as well as catchment and local strategies must be integrated carefully with other planning efforts. Because of the time involved in developing and executing flood risk management plans, it is not unusual for parallel exercises to experience change. Unless there is continuous exchange of information, it is possible for efforts that once were in synchronization to suddenly become in conflict. Establishment of an adaptive management programme: No implementation plan will remain static; schedules will change and funding will be modified. In addition, physical and political changes in the implementation area will affect the execution of activity. Better data and information will become available. A successful flood risk management process includes a robust adaptive management programme which, at its heart, needs a monitoring effort that continuously looks for and reports on changes in the hazard, structures and programmes that have been created in support of the flood risk reduction effort. Political support, public interest, funding timing, and construction and implementation delays must also be monitored closely. Risk communication: Government leaders and the public do not support flood risk management if they do not believe there is a risk. Immediately following a major flood event, there is considerable discussion of the need to take some action, but very rapidly, as conditions return to near normal, support for taking action often wanes. Implementation of flood risk strategies requires the cooperation of the public in the execution of many of the measures, especially evacuation and use of individual home protection systems. If those in a flood hazard area do not believe that they are at risk as a major flood approaches, they are less likely to respond to any directions to leave the area, putting them in danger and creating problems for those responsible for responding to the flood. Effective risk communication requires full use of all methods of communication. Ineffective communication can jeopardize the trust that should exist between government officials and the population at large, and destroy support for strategies in the political and public environment.
Partnership working and stakeholder outreach: Implementation success hinges on attainment of cooperation from, and the education of, all parties involved. This involves structured outreach and risk communication. Without such partners, beyond those traditionally involved in flood defence, the more comprehensive approach of flood risk management cannot be implemented. There are many examples of partnership arrangements that provide added value to all those involved, supporting the achievement of multiple goals and objectives. Those who live and work in flood hazard areas are the most affected by flooding, and believe that they should be part of the decision process to determine what measures are used to reduce their risk. The greater the involvement of the public in the initial planning, the less likely it is that such problems will arise during implementation.
Barriers to implementation A lack of capacity to adapt plans: Frequently, those involved in the execution cannot deviate from what was originally planned, being constrained by funding, expectations and so on. As a result, adapting to the realities of the future as it unfolds becomes difficult, and the final outcomes differ considerably from those outcomes originally envisaged (even though the original plan was implemented faithfully). It is important that as the need to make change arises, changes are, in fact, made. Fiscal deviations and budget overruns: Rarely does the size of the plan funding stream increase. It is more likely that the annual funding support for the project will be decreased to accommodate other priorities. Each of these funding changes requires a revaluation of the planning schedule and identification of those project measures that should be delayed or accelerated to best meet priority goals. Simply decreasing all elements of a program equally in the case of fiscal reduction does not provide for optimum flood risk management. Major projects are prone to simple budget overruns; this can lead to incomplete projects or a change in the scope of a strategy, often undermining the outcomes from even the most well considered plan. Changes in political leadership: Frequently those who are supportive of a particular set of measures change positions or leave regions and are replaced by others who either do not understand the flood risk management process or have a different view of what should have

Blackall Flood Risk Management Study Blackall - Tambo Regional Council
Report No: 00580_R1_v7.1 Page 8
priority. It is imperative that as such changes occur in personnel, there is a concerted effort to inform new decision-makers of how the current strategies were developed and the challenges that will be faced in making significant changes to these strategies. Changes in priorities: Inevitably, situations and circumstances change. A major flood event might not only cause changes in the flood hazard, but also result in the need for new activity that will cause modification of existing flood strategies. Efforts should be made to re-evaluate what each of these changes means in terms of activities as a whole and, where appropriate, adjustments should be identified, vetted and implemented. Change in physical conditions or availability of resources: Faster sea level rise, increased storm activity, geomorphologic changes in river configuration and failure of older infrastructure can significantly affect implementation. Initial choices of measures will have been made based on information existing at the time of the decision, and when significant changes occur, there needs to be a revaluation of these choices and a determination of what changes need to be made. As with changes in priorities, efforts should be made to revaluate what each of these changes means in terms of activities as a whole and, where appropriate, adjustments should be identified, vetted and implemented. Lack of clarity over who is responsible for ongoing maintenance: While there is typically widespread support for capital investment in new flood risk management measures (especially flood modification measures), support for ongoing maintenance and operation activities is frequently overlooked and the actual activities are neglected, leading eventually to system failures. Without clarity and fairness within the legal instruments that set out who pays for operations and maintenance activities (based, for example, on the general principle of the beneficiary pays), integrated and effective flood risk management is difficult to achieve.
1.3 Queensland’s disaster management arrangements
The authors of this study have elected to provide background information in this report relating to Queensland’s disaster management arrangements given the strong focus on emergency planning and management in contemporary flood risk management. The inclusion of this information was also prompted by the focus and feedback of the key stakeholder workshop held as part of the study (refer to Section 3.5 on page 27 for further information) in which emergency planning and management was highlighted as a significant area requiring improvement following the 2012 flood event that occurred in Blackall. Queensland’s whole-of-Government disaster management system is based upon partnership arrangements between the Queensland Government and the local governments. These partnership arrangements recognise that each level of the Disaster Management System must not only work collaboratively but in unison to ensure the effective coordination of planning, services, information and resources necessary for comprehensive disaster management. The Queensland Disaster Management System comprises three tiers: Local, District and State. The System enables a progressive escalation of support and assistance through these tiers as required. A fourth level, the Commonwealth is also included in the Disaster Management System, recognising that Queensland may need to seek Commonwealth support in times of disaster. The System comprises several key management and coordination structures through which the functions of disaster management for Queensland are achieved. The principle structures that make up Queensland’s Disaster Management System are:
Disaster Management Groups that operate at State, District and Local levels and which are responsible for the planning, organisation, coordination and implementation of all measures to mitigate/prevent, prepare for, respond to and recover from disaster situations;
Coordination Centres at State, District and Local levels that support Disaster Management Groups in coordinating information, resources and services necessary for disaster operations;
Blackall Flood Risk Management Study Blackall - Tambo Regional Council
Report No: 00580_R1_v7.1 Page 9
State Government Functional Lead Agencies through which the functions and responsibilities of the State Government in relation to disaster management are managed and coordinated;
State Government Threat Specific Lead Agencies responsible for the management and coordination of combating specific threats; and
Committees, either permanent or temporary, established under the authority of the Disaster Management Groups for specific purposes relating to disaster management.
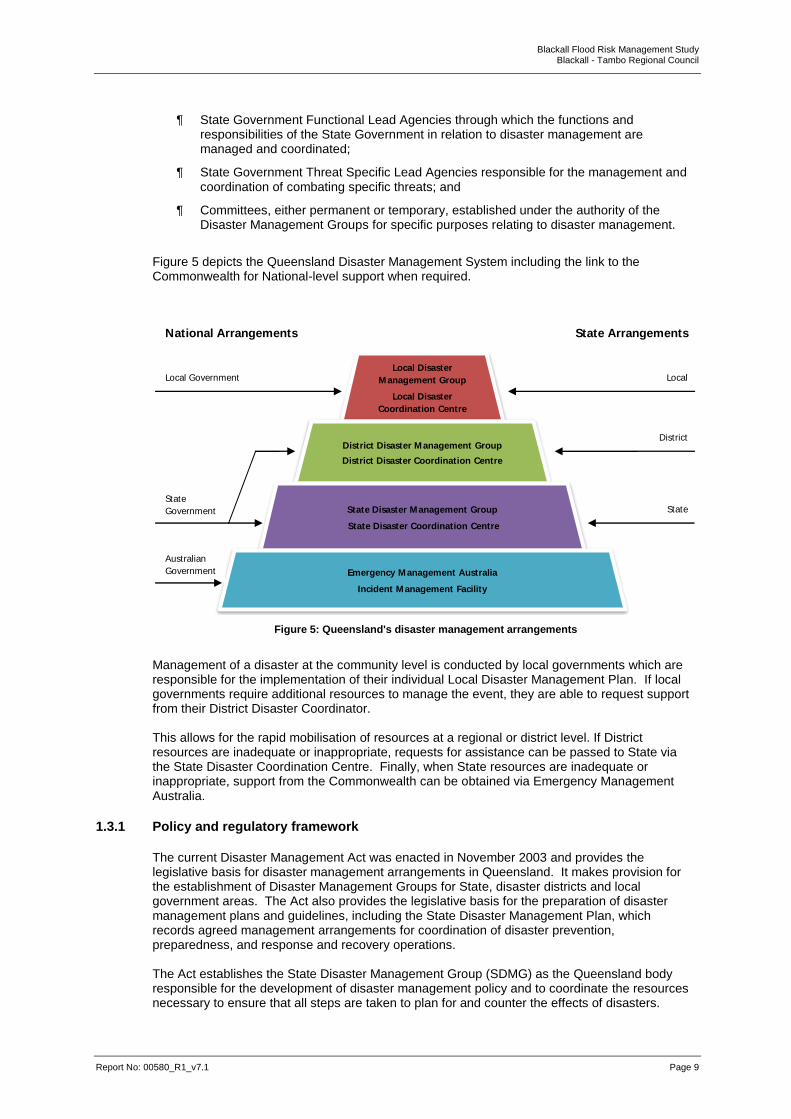
Figure 5 depicts the Queensland Disaster Management System including the link to the Commonwealth for National-level support when required.
Figure 5: Queensland's disaster management arrangements
Management of a disaster at the community level is conducted by local governments which are responsible for the implementation of their individual Local Disaster Management Plan. If local governments require additional resources to manage the event, they are able to request support from their District Disaster Coordinator. This allows for the rapid mobilisation of resources at a regional or district level. If District resources are inadequate or inappropriate, requests for assistance can be passed to State via the State Disaster Coordination Centre. Finally, when State resources are inadequate or inappropriate, support from the Commonwealth can be obtained via Emergency Management Australia.
1.3.1 Policy and regulatory framework
The current Disaster Management Act was enacted in November 2003 and provides the legislative basis for disaster management arrangements in Queensland. It makes provision for the establishment of Disaster Management Groups for State, disaster districts and local government areas. The Act also provides the legislative basis for the preparation of disaster management plans and guidelines, including the State Disaster Management Plan, which records agreed management arrangements for coordination of disaster prevention, preparedness, and response and recovery operations. The Act establishes the State Disaster Management Group (SDMG) as the Queensland body responsible for the development of disaster management policy and to coordinate the resources necessary to ensure that all steps are taken to plan for and counter the effects of disasters.
Local Disaster
Management Group
Local Disaster
Coordination Centre
District Disaster Management Group
District Disaster Coordination Centre
State Disaster Management Group
State Disaster Coordination Centre
Emergency Management Australia
Incident Management Facility
State Arrangements National Arrangements
Local
District
State
Local Government
State
Government
Australian
Government
Blackall Flood Risk Management Study Blackall - Tambo Regional Council
Report No: 00580_R1_v7.1 Page 10
This Act replaced the State Counter Disaster Organisation Act 1975. The declared disaster powers and rescue powers under the Act are in addition to, and do not limit the use of, powers pursuant to the Public Safety Preservation Act 1986. Supporting the Disaster Management Act 2003 are documents prepared by the State Disaster Management Group as required under the Act, including the recently released 2013–2014 Queensland State Disaster Management Plan. The Act requires that Disaster Management ‘groups’ be established to develop a disaster management plan for the disaster risks relevant to the area covered, and to ‘manage’ disasters under the policies and procedures as promulgated by the State Disaster Management Group.
1.3.2 Local Arrangements
It is the function of a local government under s80 of the Act to ensure it:
has a disaster response capability;
approves its Local Disaster Management Plan (LDMP);
collects and promptly disseminates information about an event or a disaster in its area to its District Disaster Coordinator (DDC); and
performs other functions given to local government under the Act.
It is primarily the responsibility of local governments to manage events in their local government areas. This is the front line of disaster management and is based on the premise that it is communities that must be prepared and capable of managing local disasters to the greatest possible extent. Local Disaster Management Groups A local government must establish a Local Disaster Management Group (LDMG) for the local government area. LDMGs are chaired by a councillor of the local government. A Local Disaster Coordinator is appointed by the Chairperson of the LDMG to manage disaster operations for the local government area. LDMGs are comprised of local government, State emergency response agencies, other State agencies, non-government organisations or representatives the Chairperson may, considering the requirements of the LDMG, appoint to the group. Further information on LDMGs is available in the Queensland Local Disaster Management Guidelines and under s 30 – s 37 of the Act. Local Disaster Management Plans In accordance with s 57 of the Act, local government must prepare a LDMP for disaster management in the local government’s area. The development of a LDMP should be based on
the comprehensive approach to disaster management incorporating all aspects of the prevention, preparedness, response and recovery (PPRR) phases and specific provisions
under s 57 and s 58 of the Act. It should outline steps to mitigate the potential risks as well as response and recovery strategies. Local Disaster Coordination Centres Local Disaster Coordination Centres (LDCCs) may be established to operationalise LDMG decisions, as well as plan and implement strategies and activities on behalf of the LDMG during disaster operations. The LDCC should have the capability to coordinate local resources and information and pass information and requests to the District Disaster Coordination Centre (DDCC).
1.3.3 Disaster District Arrangements
District Disaster Management Groups Functions, membership and the roles of the District Disaster Management Group (DDMG) are in accordance with s 23 - s 28 of the Act. Critical to the coordination of disaster operations is the
Blackall Flood Risk Management Study Blackall - Tambo Regional Council
Report No: 00580_R1_v7.1 Page 11
District Disaster Coordinator. Further information on DDMGs is available in the Queensland
District Disaster Management Guidelines. District Disaster Management Plans In accordance with s 53 of the Act, DDMGs must prepare a District Disaster Management Plan (DDMP) for disaster management in the disaster district. DDMPs detail the arrangements within the disaster district to provide whole-of- government planning and coordination capability to support local governments in disaster management. A DDMP should be developed in consideration of the LDMPs in the district to ensure the potential hazards and risks relevant to that area are incorporated. It should outline steps to mitigate the potential risks as well as response and recovery strategies. District Disaster Coordination Centres DDCCs are established to support the DDMG in the provision of district and State level support and resources to local government. This includes the collection and prompt dissemination of relevant information between local government and the State Disaster Coordination Centre (SDCC) about disaster events occurring within their disaster district. The DDCC actions decisions of the DDC and DDMG as well as coordinating State and Australian Government resources in support of local government.
1.3.4 State Arrangements
The Disaster Management Cabinet Committee The Disaster Management Cabinet Committee (DMCC) makes strategic decisions about prevention, preparation, response and recovery for disaster events and to build Queensland’s resilience to natural disasters. The purpose of the DMCC is to ensure there is clear and unambiguous senior strategic leadership during a disaster event and to build Queensland’s resilience to natural disasters. The DMCC:
provides a clear and formal line of communication and decision-making between the Premier, relevant Ministers and the SDMG during and following disasters;
is responsible for oversight of reconstruction and recovery efforts following major disaster events; and
focuses on building Queensland’s disaster resilience through coordination of measures to prepare for, prevent and mitigate the effects of future natural disasters.
The State Disaster Management Group
The SDMG provides strategic direction and State-level decision making for disaster management within the State and ensures PPRR activities are coordinated from a whole-of-government perspective and are based on an all hazards approach. The appointment of additional advisors to the SDMG is regularly reviewed to reflect government priorities and the disaster management arrangements for Queensland. S 18 of the Act articulates the functions of SDMG. The SDMG is responsible for ensuring:
arrangements between the Commonwealth and State are in place for disaster operations;
the coordination of national resources;
that State resources for disaster management are identified and coordinated; and
disaster management is effectively implemented.
The SDMG is accountable to the Minister for Police, Fire and Emergency Services (the Minister). The SDMG is required to prepare an annual report about disaster management in the State at the end of each financial year and is also responsible for developing the Strategic Policy Framework for disaster management and the SDMP. The SDMG is chaired by the Chief Executive of the Department of the Premier and Cabinet (DPC) and is predominantly comprised of the Chief Executives of State Government departments and a small number of Non-
Blackall Flood Risk Management Study Blackall - Tambo Regional Council
Report No: 00580_R1_v7.1 Page 12
Government Organisations (NGOs). The Executive Officer of the SDMG is appointed by the Commissioner of the QPS. State Disaster Coordination Group The State Disaster Coordination Group (SDCG) coordinates the operational delivery of the SDMG’s legislative responsibilities for the purpose of facilitating disaster operations and disaster management for Queensland communities. The SDCG carries out the SDMG’s strategic direction, concentrating the delivery of State, and where applicable, Australian Government support to disaster affected communities during response and recovery phases of disaster events. The SDCG has the following functions:
to examine and recommend measures to enable Queensland’s communities to prepare for, respond to and recover from disaster events;
to coordinate the provision of State and Australian Government support to disaster affected communities;
to support the review of disaster response and recovery operations in Queensland and recommend remedial action on lessons identified; and
to support the review and development of Queensland’s disaster management doctrine and associated guidelines by Queensland Fire and Emergency Services (QFES).
During a disaster event, the SDCG member agencies have a responsibility to ensure a suitably qualified and authorised officer is available to represent the agency in a Liaison Officer role to coordinate response activities. The QPS and QFES jointly chair the SDCG and the full membership of the SDCG is outlined at Annexure A of this Plan. State Disaster Mitigation Committee The State Disaster Mitigation Committee (SDMC) provides strategic advice and recommendations to the SDMG, with a whole-of-government focus on disaster mitigation issues. The Queensland Tropical Cyclone Consultative Committee (QTCCC) is a permanently established State level committee to support the SDMC. The QTCCC provides advice on measures to mitigate the effects of tropical cyclones and monitor progress on measures to mitigate the effects of tsunamis on Queensland communities. A core role of the SDMC is to ensure whole-of-government input to the development of the Queensland Natural Disaster Risk Register. State Recovery Group The State Recovery Group (SRG) coordinates the delivery of the SDMG’s legislative responsibilities under the five functional areas of recovery to support communities following disasters. State Disaster Coordination Centre The SDCC supports the SDMG and SDCG through the coordination of a State level whole-of-government operational response capability during disaster operations. The SDCC also ensures information about an event and associated disaster operations is disseminated to all levels, including to the Australian Government. On a day-to-day basis, the SDCC is managed and staffed by QFES State Duty Officers. When the SDCC is activated during a disaster event, permanent QFES staffing is supplemented by QPS staff and whole-of-government response teams in accordance with Queensland Public Service Commission (PSC) Chief Executive Directive 09/12: Critical incident response and recovery.
1.3.5 Functional arrangements
To provide for the effective coordination of State-level capabilities in disaster management, Queensland has adopted the concept of Functional Lead Agencies. Each Functional Lead Agency is responsible to the SDMG for the provision of specific State Government services,
Blackall Flood Risk Management Study Blackall - Tambo Regional Council
Report No: 00580_R1_v7.1 Page 13
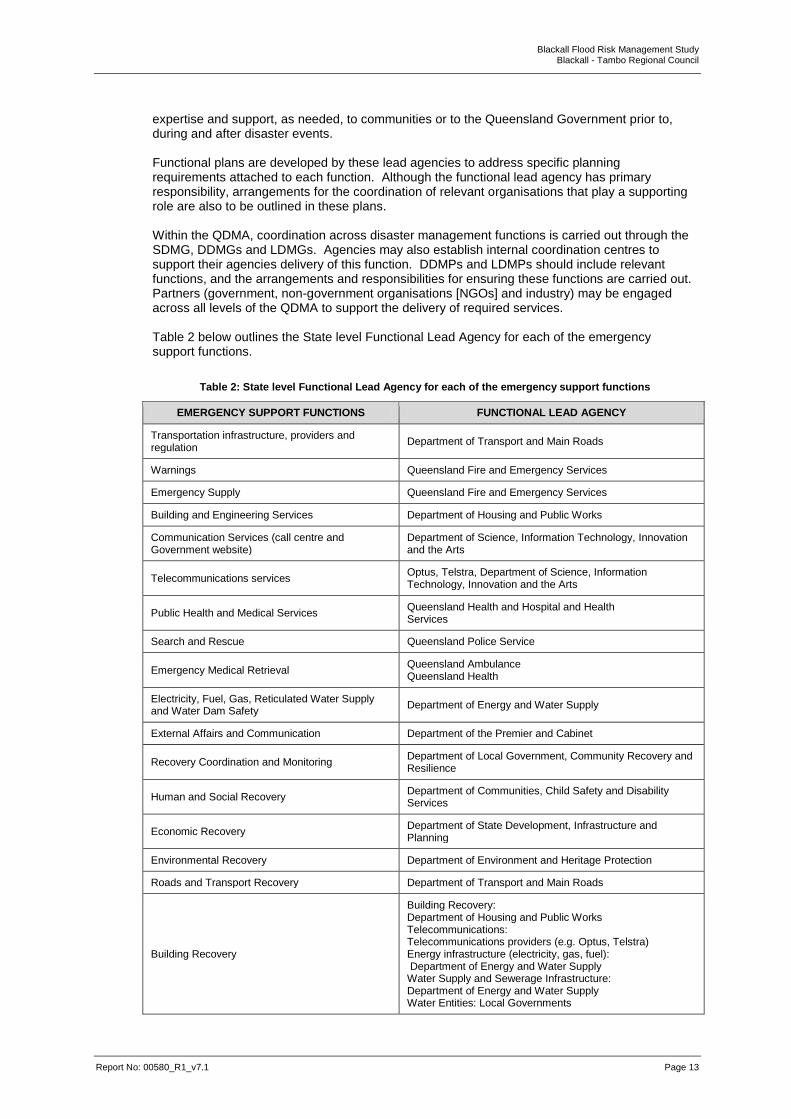
expertise and support, as needed, to communities or to the Queensland Government prior to, during and after disaster events. Functional plans are developed by these lead agencies to address specific planning requirements attached to each function. Although the functional lead agency has primary responsibility, arrangements for the coordination of relevant organisations that play a supporting role are also to be outlined in these plans. Within the QDMA, coordination across disaster management functions is carried out through the SDMG, DDMGs and LDMGs. Agencies may also establish internal coordination centres to support their agencies delivery of this function. DDMPs and LDMPs should include relevant functions, and the arrangements and responsibilities for ensuring these functions are carried out. Partners (government, non-government organisations [NGOs] and industry) may be engaged across all levels of the QDMA to support the delivery of required services. Table 2 below outlines the State level Functional Lead Agency for each of the emergency support functions.
Table 2: State level Functional Lead Agency for each of the emergency support functions
EMERGENCY SUPPORT FUNCTIONS FUNCTIONAL LEAD AGENCY
Transportation infrastructure, providers and regulation
Department of Transport and Main Roads
Warnings Queensland Fire and Emergency Services
Emergency Supply Queensland Fire and Emergency Services
Building and Engineering Services Department of Housing and Public Works
Communication Services (call centre and Government website)
Department of Science, Information Technology, Innovation and the Arts
Telecommunications services Optus, Telstra, Department of Science, Information Technology, Innovation and the Arts
Public Health and Medical Services Queensland Health and Hospital and Health Services
Search and Rescue Queensland Police Service
Emergency Medical Retrieval Queensland Ambulance Queensland Health
Electricity, Fuel, Gas, Reticulated Water Supply and Water Dam Safety
Department of Energy and Water Supply
External Affairs and Communication Department of the Premier and Cabinet
Recovery Coordination and Monitoring Department of Local Government, Community Recovery and Resilience
Human and Social Recovery Department of Communities, Child Safety and Disability Services
Economic Recovery Department of State Development, Infrastructure and Planning
Environmental Recovery Department of Environment and Heritage Protection
Roads and Transport Recovery Department of Transport and Main Roads
Building Recovery
Building Recovery: Department of Housing and Public Works Telecommunications: Telecommunications providers (e.g. Optus, Telstra) Energy infrastructure (electricity, gas, fuel): Department of Energy and Water Supply Water Supply and Sewerage Infrastructure: Department of Energy and Water Supply Water Entities: Local Governments
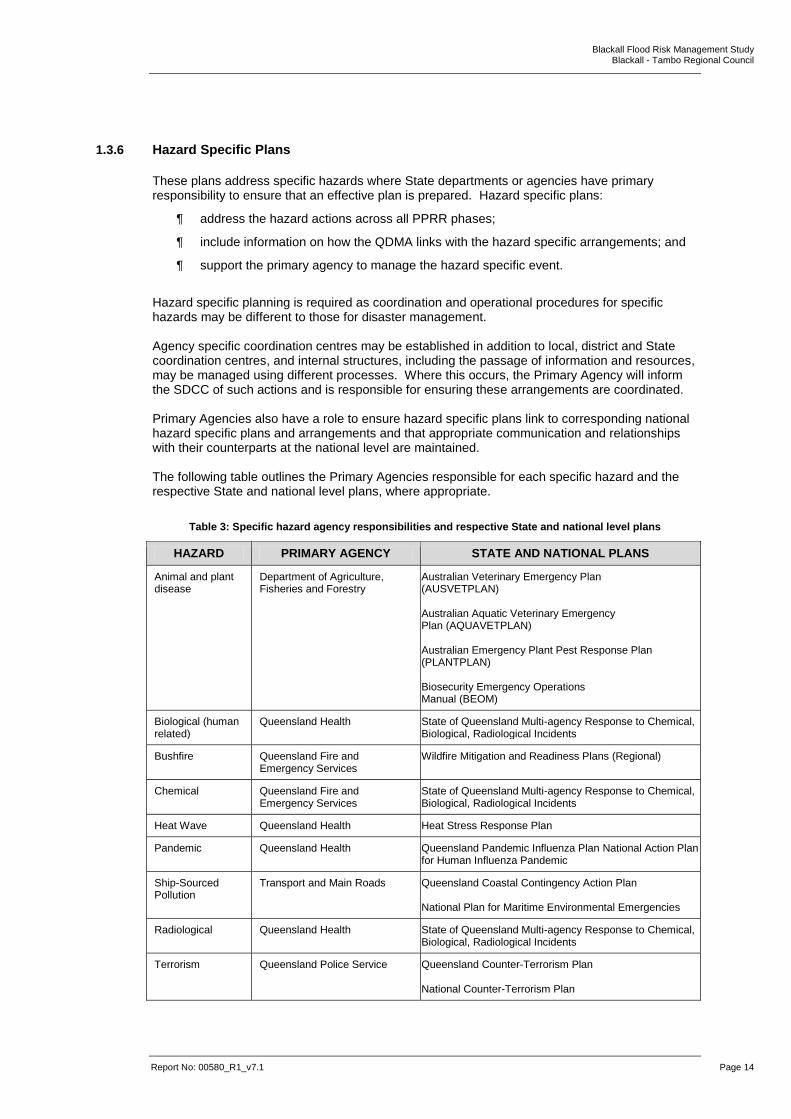
Blackall Flood Risk Management Study Blackall - Tambo Regional Council
Report No: 00580_R1_v7.1 Page 14
1.3.6 Hazard Specific Plans
These plans address specific hazards where State departments or agencies have primary responsibility to ensure that an effective plan is prepared. Hazard specific plans:
address the hazard actions across all PPRR phases;
include information on how the QDMA links with the hazard specific arrangements; and
support the primary agency to manage the hazard specific event.
Hazard specific planning is required as coordination and operational procedures for specific hazards may be different to those for disaster management. Agency specific coordination centres may be established in addition to local, district and State coordination centres, and internal structures, including the passage of information and resources, may be managed using different processes. Where this occurs, the Primary Agency will inform the SDCC of such actions and is responsible for ensuring these arrangements are coordinated. Primary Agencies also have a role to ensure hazard specific plans link to corresponding national hazard specific plans and arrangements and that appropriate communication and relationships with their counterparts at the national level are maintained. The following table outlines the Primary Agencies responsible for each specific hazard and the respective State and national level plans, where appropriate.
Table 3: Specific hazard agency responsibilities and respective State and national level plans
HAZARD PRIMARY AGENCY STATE AND NATIONAL PLANS
Animal and plant disease
Department of Agriculture, Fisheries and Forestry
Australian Veterinary Emergency Plan (AUSVETPLAN) Australian Aquatic Veterinary Emergency Plan (AQUAVETPLAN) Australian Emergency Plant Pest Response Plan (PLANTPLAN) Biosecurity Emergency Operations Manual (BEOM)
Biological (human related)
Queensland Health State of Queensland Multi-agency Response to Chemical, Biological, Radiological Incidents
Bushfire Queensland Fire and Emergency Services
Wildfire Mitigation and Readiness Plans (Regional)
Chemical Queensland Fire and Emergency Services
State of Queensland Multi-agency Response to Chemical, Biological, Radiological Incidents
Heat Wave Queensland Health Heat Stress Response Plan
Pandemic Queensland Health Queensland Pandemic Influenza Plan National Action Plan for Human Influenza Pandemic
Ship-Sourced Pollution
Transport and Main Roads Queensland Coastal Contingency Action Plan National Plan for Maritime Environmental Emergencies
Radiological Queensland Health State of Queensland Multi-agency Response to Chemical, Biological, Radiological Incidents
Terrorism Queensland Police Service Queensland Counter-Terrorism Plan National Counter-Terrorism Plan
Blackall Flood Risk Management Study Blackall - Tambo Regional Council
Report No: 00580_R1_v7.1 Page 15
1.3.7 Activation and declarations
Activation of the Queensland Disaster Management System Activation of the Disaster Management System can occur when there is a need for:
operational coordination to monitor potential threats or response operations;
operational coordination to support response operations being conducted by a designated combat agency;
coordination of resources in support of disaster response and recovery operations at Local Government or District level; or
Statewide disaster response and recovery operations.
Activation of the Disaster Management System at District and Local level can be initiated respectively by the Chair of the DDMG or the Chair of LDMG. Advice of activation is conveyed to the Counter Disaster and Rescue Services of the Department of Emergency Services. Initiation of the activation at State level can be through the Chair, SDMG or the Executive Director, CDRS. Activation at State level will often be in response to activation at District level or activation of a threat specific Lead Agency. Declaration of a Disaster Situation
The Act makes provision for the declaration of a disaster situation by a DDC, with the approval of the Minister, for a district or a part of a district or by the Premier and the Minister for the State or a part of the State. A declaration may be made if the person/s responsible for making it are satisfied a disaster has happened, is happening, or is likely to happen, and it will be necessary, or reasonably likely to be necessary, to exercise declared disaster powers to prevent or minimise the loss of human life, illness or injury to humans, property loss or damage, or damage to the environment. In accordance with the Act, a declaration must be in the approved form, or can be made orally if necessary to exercise declared disaster powers before an approved form can be obtained and completed. QPS prepare the disaster declaration and forward to the Public Safety Business Agency (PSBA) Cabinet Liaison and Legislation Officer for processing. Part 4 of the Act outlines the provisions for declarations and disaster powers. Disaster management forms, including forms for disaster declaration, extension, request to end and for the authorisation of persons to exercise declared disaster powers are available from the Queensland Government Disaster Management website. A DDC (or a declared disaster officer) may exercise an additional power only during the period of a disaster situation and only to do any of the following:
ensure public safety or public order;
prevent or minimise loss of human life, or illness or injury to humans or animals;
prevent or minimise property loss or damage, or damage to the environment.
Full details of the additional powers provided during a disaster situation are contained in the Act. However, in general they include:
the power to control the movements of people, animals and vehicles (including evacuation);
the power to control the supply of equipment and services;
the power to commandeer property or equipment; and
the power to remove or destroy animals, property, and/or equipment.
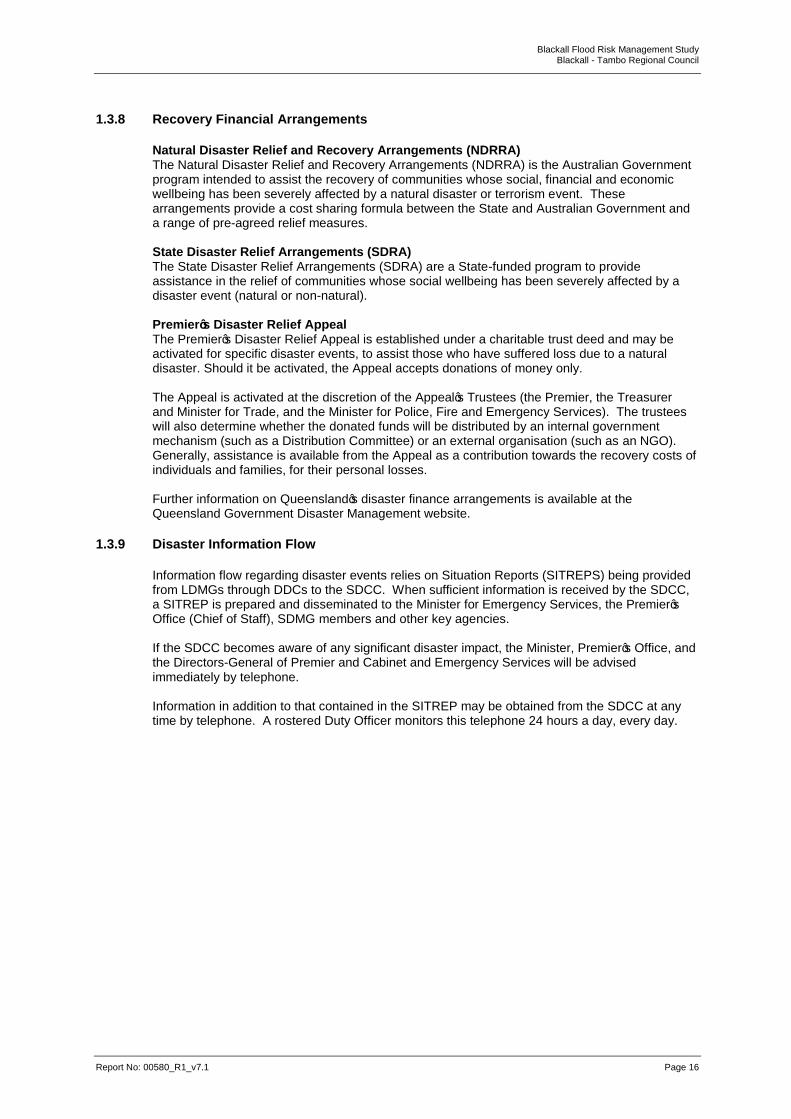
Blackall Flood Risk Management Study Blackall - Tambo Regional Council
Report No: 00580_R1_v7.1 Page 16
1.3.8 Recovery Financial Arrangements
Natural Disaster Relief and Recovery Arrangements (NDRRA) The Natural Disaster Relief and Recovery Arrangements (NDRRA) is the Australian Government program intended to assist the recovery of communities whose social, financial and economic wellbeing has been severely affected by a natural disaster or terrorism event. These arrangements provide a cost sharing formula between the State and Australian Government and a range of pre-agreed relief measures. State Disaster Relief Arrangements (SDRA) The State Disaster Relief Arrangements (SDRA) are a State-funded program to provide assistance in the relief of communities whose social wellbeing has been severely affected by a disaster event (natural or non-natural). Premier’s Disaster Relief Appeal The Premier’s Disaster Relief Appeal is established under a charitable trust deed and may be activated for specific disaster events, to assist those who have suffered loss due to a natural disaster. Should it be activated, the Appeal accepts donations of money only. The Appeal is activated at the discretion of the Appeal’s Trustees (the Premier, the Treasurer and Minister for Trade, and the Minister for Police, Fire and Emergency Services). The trustees will also determine whether the donated funds will be distributed by an internal government mechanism (such as a Distribution Committee) or an external organisation (such as an NGO). Generally, assistance is available from the Appeal as a contribution towards the recovery costs of individuals and families, for their personal losses. Further information on Queensland’s disaster finance arrangements is available at the Queensland Government Disaster Management website.
1.3.9 Disaster Information Flow
Information flow regarding disaster events relies on Situation Reports (SITREPS) being provided from LDMGs through DDCs to the SDCC. When sufficient information is received by the SDCC, a SITREP is prepared and disseminated to the Minister for Emergency Services, the Premier’s Office (Chief of Staff), SDMG members and other key agencies. If the SDCC becomes aware of any significant disaster impact, the Minister, Premier’s Office, and the Directors-General of Premier and Cabinet and Emergency Services will be advised immediately by telephone. Information in addition to that contained in the SITREP may be obtained from the SDCC at any time by telephone. A rostered Duty Officer monitors this telephone 24 hours a day, every day.
Blackall Flood Risk Management Study Blackall - Tambo Regional Council
Report No: 00580_R1_v7.1 Page 17
Figure 6: Disaster information flow
1.3.10 Crisis and Consequence Management Arrangements
In the event of a disaster, or other significant event, there are likely to be significant community consequences. These consequences include impacts on individuals, societies, the economy and/or the environment and may be short term or long term in nature. Consequence management arrangements, as detailed in the State Disaster Management Plan, provide appropriate and timely support to communities, or elements of communities, who suffer hardship as a result of disasters or disaster-like events. Consequence management involves key response and recovery elements of the Disaster Management System. In the event of a terrorist incident, crisis management arrangements are controlled under the National Counter-Terrorism Plan (NCTP). This Plan outlines responsibilities, authorities and the mechanisms to prevent, or if they occur manage, acts of terrorism and their consequences within Australia. The NCTP arrangements have complimentary roles, functions and responsibilities to those relating to consequence management. It is possible that a terrorist incident could see both arrangements activated simultaneously. To avoid confusion and conflict, it is imperative that the two management arrangements are well coordinated. In situations where the Premier deems it necessary for both the State Crisis Centre (crisis management) and the MIG (consequence management) to be operating at the same time, one group of Ministers should oversee both management arrangements. Equally, both the crisis management arrangements and the consequence management arrangements should be so structured to be able to operate independently where there is no requirement for simultaneous activation. A successful relationship between the crisis management arrangements and the consequence management arrangements is predicated on the adequate flow of appropriate information between the two structures.

Blackall Flood Risk Management Study Blackall - Tambo Regional Council
Report No: 00580_R1_v7.1 Page 18
Figure 7: Crisis management and consequence management arrangements
Blackall Flood Risk Management Study Blackall - Tambo Regional Council
Report No: 00580_R1_v7.1 Page 19
2 Study Area
2.1 Catchment Description and Land Use
Together with the Thomson River, the Barcoo River forms the headwaters of the Cooper Creek catchment (Appendix A). The river starts just east of Tambo and flows in a north-westerly direction through Tambo. Major tributaries are the Windeyer and Birkhead creeks, which head on the western slopes of the Great Dividing Range. Ravensbourne Creek heads in the Gowan Ranges and meets the Barcoo west of Blackall. The Alice River flows south from its headwaters near Jericho and joins the Barcoo north-west of Blackall. After this junction, the Barcoo turns south and generally follows a south-westerly course. Powell Creek heads in the Grey Range and flows into the Barcoo east of Jundah. The Barcoo joins the Thomson River between Jundah and Windorah to form Cooper Creek. Its catchment covers an area of 53,242 km² equivalent to 3.1% of Queensland with the major towns consisting of Barcaldine, Blackall and Tambo.
2.2 Township of Blackall
2.2.1 History
Established in 1868, Blackall is a rural town located along the banks of the Barcoo River in central-western Queensland (Appendix B), between Longreach and Charleville and 500 km south-west of Rockhampton. It was named after Samuel Blackall, soldier and Governor of Queensland (1868-71). Blackall is situated on the Barcoo River, in an area explored by Thomas Mitchell in 1846 and Augustus Gregory in 1858 and thus known by the 1860s to be both favourable to grazing and desolate in drought. Pastoral settlement was active in the 1860s, and a rudimentary village settlement evident by 1867. Local government was established in 1879 with the Kargoolnah division, headquartered in Blackall. By 1877, the town had upwards of seven hotels, seven stores, several tradespeople and a school (opened that year). The town's newspaper, the Barcoo Independent, began publication in 1889. During the 1880s, some of the large pastoral runs were subdivided for selection for grazing and dairying. There was a run of fairly good seasons, and the drilling of Queensland's first artesian bore at Blackall in 1885 brought relief to thirsty stock. At the end of the 1890s, the 'federation drought' took hold, followed by flooding of the Barcoo in 1906. Nevertheless, provision against the vagaries of the surface water supply was made by the sinking of further bores and construction of tanks. By 1903, the town's population had passed 750. Within a year of the formation of the Kargoolnah division, Blackall was established as a separate municipal borough. There were periods of uneasy standoff and cooperation between the two authorities, mainly over shire contributions to town amenities in the event of amalgamation, which nevertheless occurred with the formation of Blackall Shire in 1945. Blackall was bypassed by the Longreach railway (1886) until a branch from Jericho was opened in 1908. The branch line came the same year as Blackall opened a large wool scouring works, a sign of confidence in a stable wool-producing region. Running until 1978, the scouring works are now a significant industrial heritage site, listed on the Queensland heritage register. Town amenities were gradually increased: sealed roads, reticulated electricity and plans for a new town hall. Sewerage, a fire brigade, a public park and a swimming pool came after World War II, as did the new town hall.
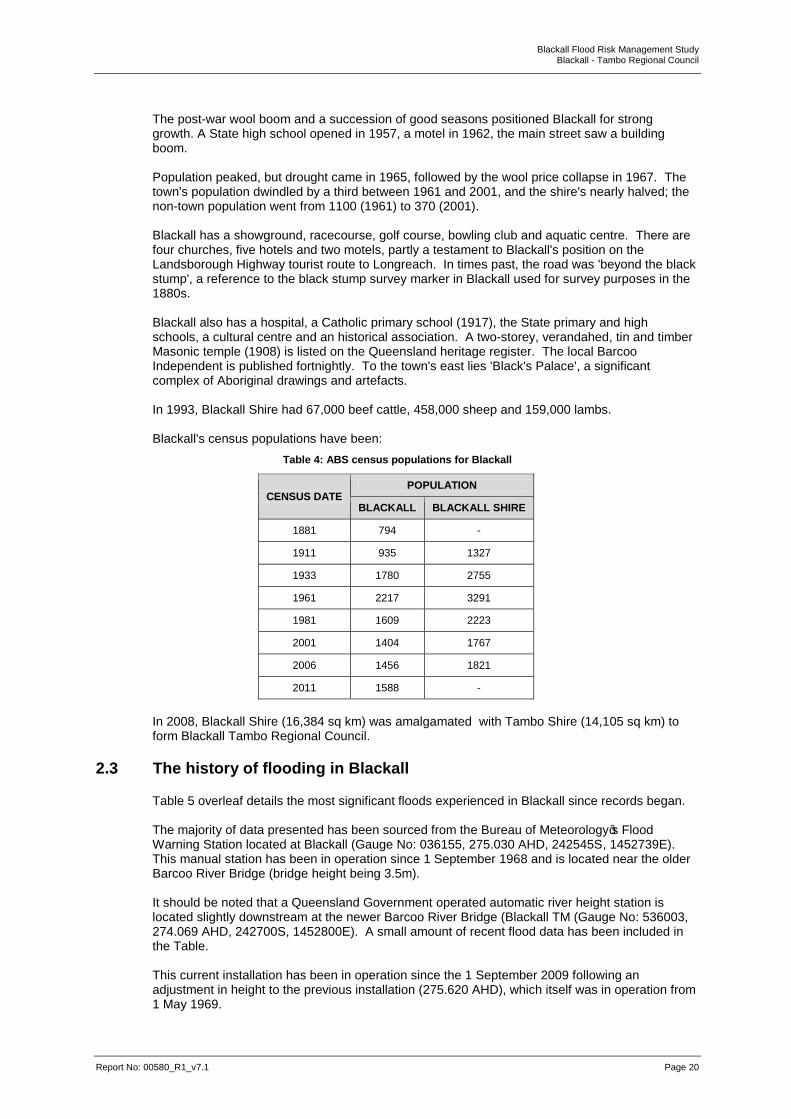
Blackall Flood Risk Management Study Blackall - Tambo Regional Council
Report No: 00580_R1_v7.1 Page 20
The post-war wool boom and a succession of good seasons positioned Blackall for strong growth. A State high school opened in 1957, a motel in 1962, the main street saw a building boom. Population peaked, but drought came in 1965, followed by the wool price collapse in 1967. The town's population dwindled by a third between 1961 and 2001, and the shire's nearly halved; the non-town population went from 1100 (1961) to 370 (2001). Blackall has a showground, racecourse, golf course, bowling club and aquatic centre. There are four churches, five hotels and two motels, partly a testament to Blackall's position on the Landsborough Highway tourist route to Longreach. In times past, the road was 'beyond the black stump', a reference to the black stump survey marker in Blackall used for survey purposes in the 1880s. Blackall also has a hospital, a Catholic primary school (1917), the State primary and high schools, a cultural centre and an historical association. A two-storey, verandahed, tin and timber Masonic temple (1908) is listed on the Queensland heritage register. The local Barcoo Independent is published fortnightly. To the town's east lies 'Black's Palace', a significant complex of Aboriginal drawings and artefacts. In 1993, Blackall Shire had 67,000 beef cattle, 458,000 sheep and 159,000 lambs. Blackall's census populations have been:
Table 4: ABS census populations for Blackall
CENSUS DATE POPULATION
BLACKALL BLACKALL SHIRE
1881 794 -
1911 935 1327
1933 1780 2755
1961 2217 3291
1981 1609 2223
2001 1404 1767
2006 1456 1821
2011 1588 -
In 2008, Blackall Shire (16,384 sq km) was amalgamated with Tambo Shire (14,105 sq km) to form Blackall Tambo Regional Council.
2.3 The history of flooding in Blackall
Table 5 overleaf details the most significant floods experienced in Blackall since records began. The majority of data presented has been sourced from the Bureau of Meteorology’s Flood Warning Station located at Blackall (Gauge No: 036155, 275.030 AHD, 242545S, 1452739E). This manual station has been in operation since 1 September 1968 and is located near the older Barcoo River Bridge (bridge height being 3.5m). It should be noted that a Queensland Government operated automatic river height station is located slightly downstream at the newer Barcoo River Bridge (Blackall TM (Gauge No: 536003, 274.069 AHD, 242700S, 1452800E). A small amount of recent flood data has been included in the Table. This current installation has been in operation since the 1 September 2009 following an adjustment in height to the previous installation (275.620 AHD), which itself was in operation from 1 May 1969.

Blackall Flood Risk Management Study Blackall - Tambo Regional Council
Report No: 00580_R1_v7.1 Page 21
It should also be noted that an additional station operated by BTRC has been recently installed (7/01/2014) at the newer Barco River Bridge (although at a slightly different location to the Queensland Government operated station) (Blackall AL (Gauge No: 536009, 275.620 AHD, 242536S, 1452730E) but at the same height as the original state operated installation. This has been to allow for the direct comparison of historical (at least post 1969) flood peak heights with future flood events for the older Bridge.
Table 5: Summary of significant floods and recent annual peak flood heights for Blackall
STATION NO:
YEAR PEAK
HEIGHT (M)
DATE TIME CLASSIFICATION HIGHEST
SINCE COMMENTS
- 1906 6.91 - - - 3rd highest on
record
- 1950 6 26/11/1950 - -
- 1954 4.74 15/02/1954 9:00 -
- 1955 4.26 27/05/1955 12:00 -
- 1956 5.58 8/02/1956 - -
- 1963 6.33 1/04/1963 - - 1906
(57 years) 4th highest on
record
036155 1970 3.43 10/12/1970 21:00 Minor
036155 1971 3.43 1/02/1971 4:00 Minor
036155 1972 3.2 1/12/1972 21:15 Minor
036155 1977 3.4 14/03/1977 21:00 Minor
036155 1978 3.8 12/07/1978 15:00 Minor
036155 1979 3 2/03/1979 9:00 Minor
036155 1980 2.6 9/02/1980 9:00 Minor
036155 1981 5.38 3/06/1981 2:00 Major
036155 1982 4.15 6/03/1982 0:45 Moderate
036155 1983 6.15 24/05/1983 5:30 Major 1963
(20 years) 5th highest on
record
036155 1984 3.8 31/01/1984 9:00 Minor
036155 1985 2.4 10/12/1985 18:00 Minor
036155 1986 2.6 8/02/1986 9:00 Minor
036155 1987 2.6 24/06/1987 9:00 Minor
036155 1988 2.1 4/05/1988 0:00 Minor
036155 1989 4.1 18/03/1989 1:00 Moderate
036155 1990
7.4 20/4/1990 21.00 Major
1906 (84 years)
1st highest on record 536003 8.24 21/04/1990 02:00
036155 1991 3.1 8/01/1991 15:00 Minor
036155 1992 2.95 18/12/1992 15:00 Minor
036155 1993 2.05 9/12/1993 8:00 Minor
036155 1994 3.5 3/02/1994 6:00 Minor
036155 1995 3.35 9/02/1995 9:00 Minor
036155 1996 5.3 10/01/1996 15:00 Major 1990
(6 years) 8th highest on
record
036155 1997
6.15 2/02/1997
6:00 Major
1990 (7 years)
5th highest on record 536003 7.01 02:34
036155 1998 2.8 12/02/1998 8:55 Minor
036155 1999 3.35 2/03/1999 21:00 Minor
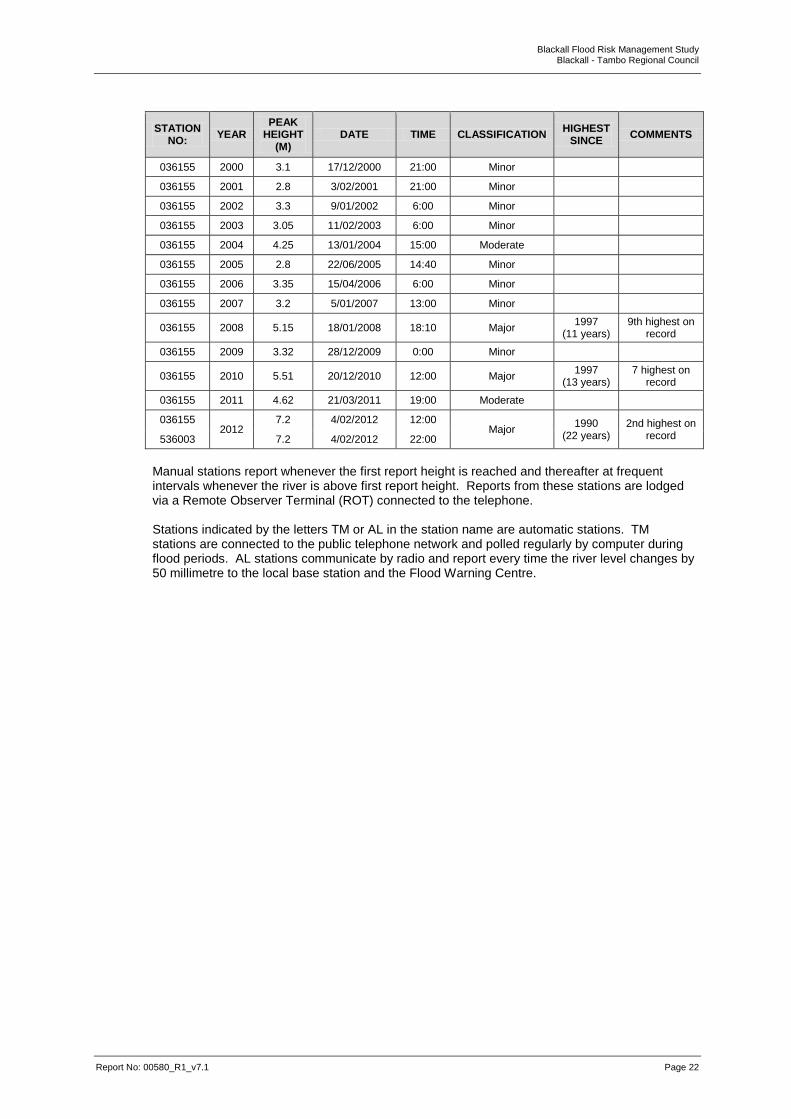
Blackall Flood Risk Management Study Blackall - Tambo Regional Council
Report No: 00580_R1_v7.1 Page 22
STATION NO:
YEAR PEAK
HEIGHT (M)
DATE TIME CLASSIFICATION HIGHEST
SINCE COMMENTS
036155 2000 3.1 17/12/2000 21:00 Minor
036155 2001 2.8 3/02/2001 21:00 Minor
036155 2002 3.3 9/01/2002 6:00 Minor
036155 2003 3.05 11/02/2003 6:00 Minor
036155 2004 4.25 13/01/2004 15:00 Moderate
036155 2005 2.8 22/06/2005 14:40 Minor
036155 2006 3.35 15/04/2006 6:00 Minor
036155 2007 3.2 5/01/2007 13:00 Minor
036155 2008 5.15 18/01/2008 18:10 Major 1997
(11 years) 9th highest on
record
036155 2009 3.32 28/12/2009 0:00 Minor
036155 2010 5.51 20/12/2010 12:00 Major 1997
(13 years) 7 highest on
record
036155 2011 4.62 21/03/2011 19:00 Moderate
036155 2012
7.2 4/02/2012 12:00 Major
1990 (22 years)
2nd highest on record 536003 7.2 4/02/2012 22:00
Manual stations report whenever the first report height is reached and thereafter at frequent intervals whenever the river is above first report height. Reports from these stations are lodged via a Remote Observer Terminal (ROT) connected to the telephone. Stations indicated by the letters TM or AL in the station name are automatic stations. TM stations are connected to the public telephone network and polled regularly by computer during flood periods. AL stations communicate by radio and report every time the river level changes by 50 millimetre to the local base station and the Flood Warning Centre.
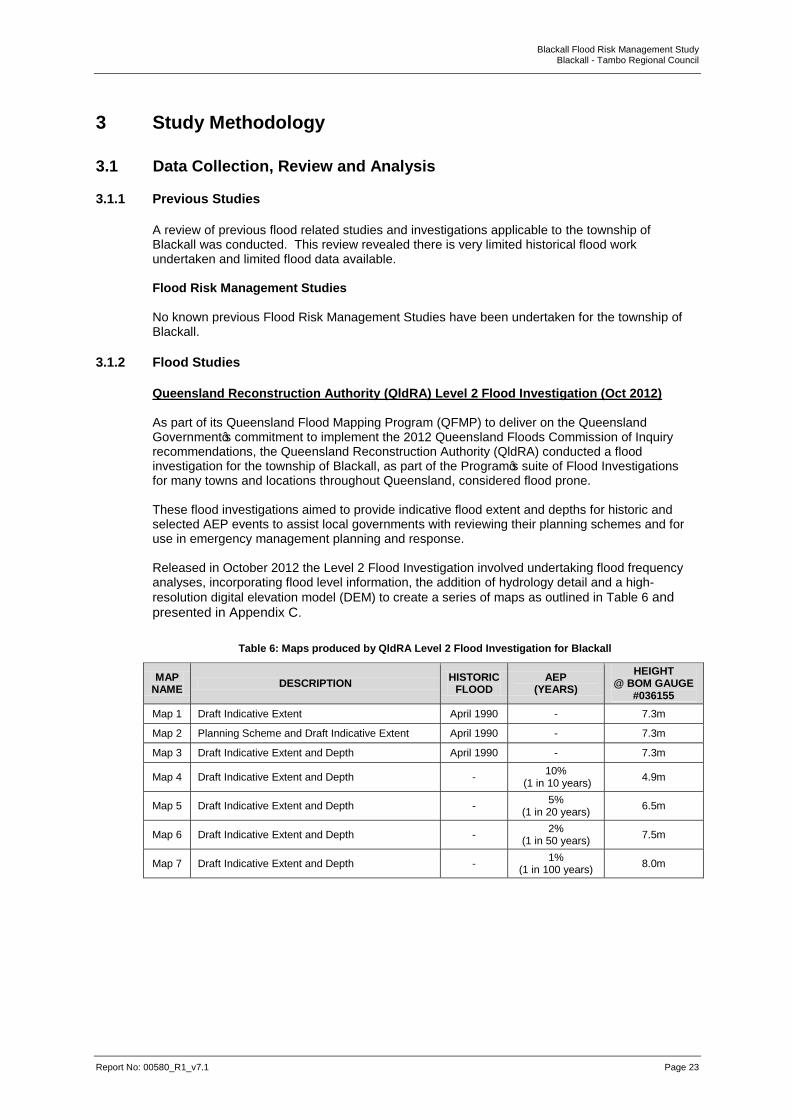
Blackall Flood Risk Management Study Blackall - Tambo Regional Council
Report No: 00580_R1_v7.1 Page 23
3 Study Methodology
3.1 Data Collection, Review and Analysis
3.1.1 Previous Studies
A review of previous flood related studies and investigations applicable to the township of Blackall was conducted. This review revealed there is very limited historical flood work undertaken and limited flood data available. Flood Risk Management Studies No known previous Flood Risk Management Studies have been undertaken for the township of Blackall.
3.1.2 Flood Studies
Queensland Reconstruction Authority (QldRA) Level 2 Flood Investigation (Oct 2012) As part of its Queensland Flood Mapping Program (QFMP) to deliver on the Queensland Government’s commitment to implement the 2012 Queensland Floods Commission of Inquiry recommendations, the Queensland Reconstruction Authority (QldRA) conducted a flood investigation for the township of Blackall, as part of the Program’s suite of Flood Investigations for many towns and locations throughout Queensland, considered flood prone. These flood investigations aimed to provide indicative flood extent and depths for historic and selected AEP events to assist local governments with reviewing their planning schemes and for use in emergency management planning and response. Released in October 2012 the Level 2 Flood Investigation involved undertaking flood frequency analyses, incorporating flood level information, the addition of hydrology detail and a high-
resolution digital elevation model (DEM) to create a series of maps as outlined in Table 6 and presented in Appendix C.
Table 6: Maps produced by QldRA Level 2 Flood Investigation for Blackall
MAP NAME
DESCRIPTION HISTORIC
FLOOD AEP
(YEARS)
HEIGHT @ BOM GAUGE
#036155
Map 1 Draft Indicative Extent April 1990 - 7.3m
Map 2 Planning Scheme and Draft Indicative Extent April 1990 - 7.3m
Map 3 Draft Indicative Extent and Depth April 1990 - 7.3m
Map 4 Draft Indicative Extent and Depth - 10%
(1 in 10 years) 4.9m
Map 5 Draft Indicative Extent and Depth - 5%
(1 in 20 years) 6.5m
Map 6 Draft Indicative Extent and Depth - 2%
(1 in 50 years) 7.5m
Map 7 Draft Indicative Extent and Depth - 1%
(1 in 100 years) 8.0m
Blackall Flood Risk Management Study Blackall - Tambo Regional Council
Report No: 00580_R1_v7.1 Page 22
While it is important to acknowledge this fit for purpose study, which does increase the level of flood knowledge for Blackall, it relied on local knowledge, historic information, a basic analysis of stream flow, utilised an unvalidated GIS mapping approach to identify flood extent and depth, and did not involve hydrologic or hydraulic modelling. Methodology details utilised are further discussed in the following sections. As such, it should not be termed a ‘flood study’ per se, and the extent and depth results considered generalised. One key limitation noted in the flood investigation report was the requirement for Blackall - Tambo Regional Council to check and verify the maps produced using local data and or knowledge to confirm or modify the indicative extents shown. Following a review of the flood investigation, Council did not require further improvements or upgrades to the mapping produced to be made by QRA and confirmed to the consultants its suitability for use as a source of data to inform the development of this Study. Correspondence to this effect is presented in Appendix D. Data produced provided the underlying flood extent and depth data used in this Flood Risk Management Study. Level 2 Flood Investigation To complete the Level 2 Flood Investigations, the GIS mapping approach adopted by QldRA required the development of flood frequency analyses, identification of flood level information and the incorporation of this hydrology detail with a high resolution digital elevation model (DEM). To support this process, the Flood Frequency Analysis (FFA) details were provided by the DSITIA. This analysis provided the AEP for the historic event and was used to set up the GIS model and gauge heights for a range of AEPs. Additional flood level information was also accessed from the BoM website. These gauge heights were used in conjunction with the DEM for QldRA to produce maps showing the extent and depth of floods for the various events. Limitations of the Level 2 Flood Investigation A number of key points to note regarding the limitations and uncertainty of the Level 2 Flood investigation, and hence, the Flood Risk Management Study results include:
From the FFA, the spread of the Monte Carlo 90 % quantile confidence limitsfor the AEP
1% (1 in 100 year) event is from 1516 to 54823 cumecs (cubic metres per second)3;
The rating curve was extended using a cross section derived from the DEM;
The highest gauging at the station was at 700 cumecs. Flows above this level are estimated using an extrapolated rating curve;
The floodslope was set as zero for the frontage along the town area, and assumed to be the same for all floods;
The extent of the April 1990 event was checked against a map prepared in the only other known Flood Study covering Blackall - Blackall Flood Inundation April 1990 from the Western Queensland Towns Flood Study (Jan 1991) (refer to next Sub Section); and
3 Using a statistical measure of spread gives us an idea of how well the mean, for example, represents the data. If the spread of
values in the data set is large, the mean is not as representative of the data as if the spread of data is small. This is because a large spread indicates that there are probably large differences between individual contributing data, i.e. less certainty in the predicted results.
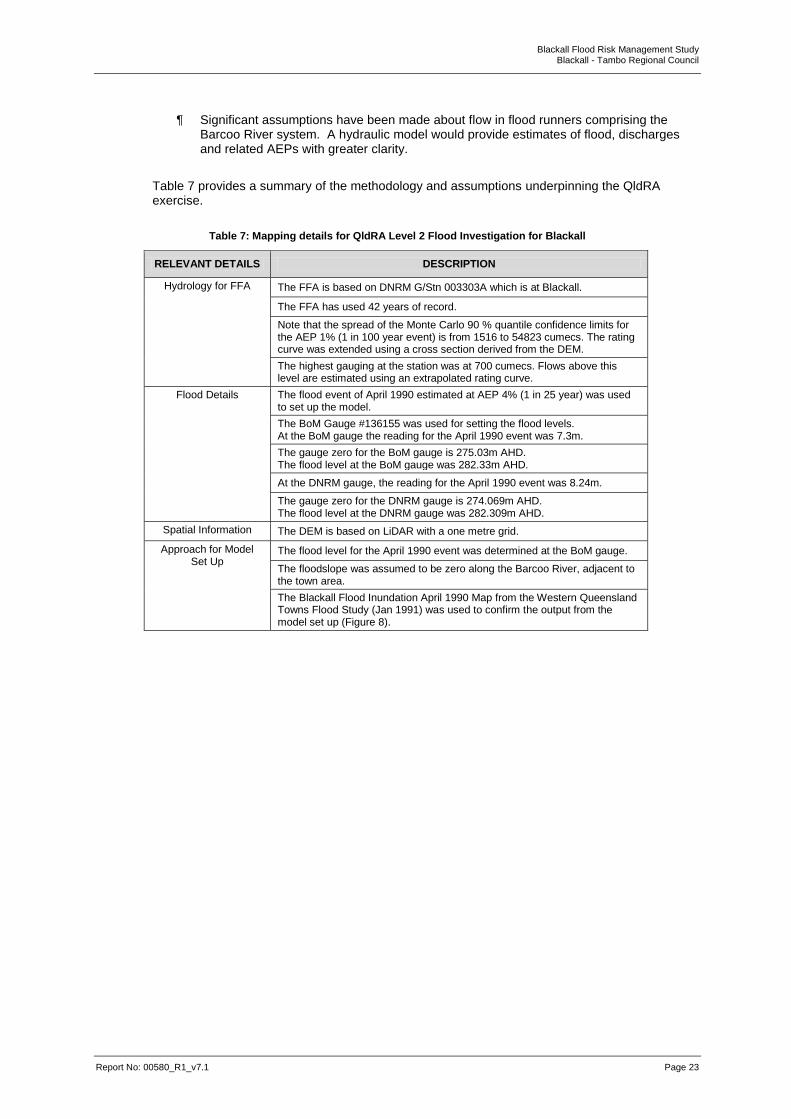
Blackall Flood Risk Management Study Blackall - Tambo Regional Council
Report No: 00580_R1_v7.1 Page 23
Significant assumptions have been made about flow in flood runners comprising the Barcoo River system. A hydraulic model would provide estimates of flood, discharges and related AEPs with greater clarity.
Table 7 provides a summary of the methodology and assumptions underpinning the QldRA exercise.
Table 7: Mapping details for QldRA Level 2 Flood Investigation for Blackall
RELEVANT DETAILS DESCRIPTION
Hydrology for FFA The FFA is based on DNRM G/Stn 003303A which is at Blackall.
The FFA has used 42 years of record.
Note that the spread of the Monte Carlo 90 % quantile confidence limits for the AEP 1% (1 in 100 year event) is from 1516 to 54823 cumecs. The rating curve was extended using a cross section derived from the DEM.
The highest gauging at the station was at 700 cumecs. Flows above this level are estimated using an extrapolated rating curve.
Flood Details The flood event of April 1990 estimated at AEP 4% (1 in 25 year) was used to set up the model.
The BoM Gauge #136155 was used for setting the flood levels. At the BoM gauge the reading for the April 1990 event was 7.3m.
The gauge zero for the BoM gauge is 275.03m AHD. The flood level at the BoM gauge was 282.33m AHD.
At the DNRM gauge, the reading for the April 1990 event was 8.24m.
The gauge zero for the DNRM gauge is 274.069m AHD. The flood level at the DNRM gauge was 282.309m AHD.
Spatial Information The DEM is based on LiDAR with a one metre grid.
Approach for Model Set Up
The flood level for the April 1990 event was determined at the BoM gauge.
The floodslope was assumed to be zero along the Barcoo River, adjacent to the town area.
The Blackall Flood Inundation April 1990 Map from the Western Queensland Towns Flood Study (Jan 1991) was used to confirm the output from the model set up (Figure 8).
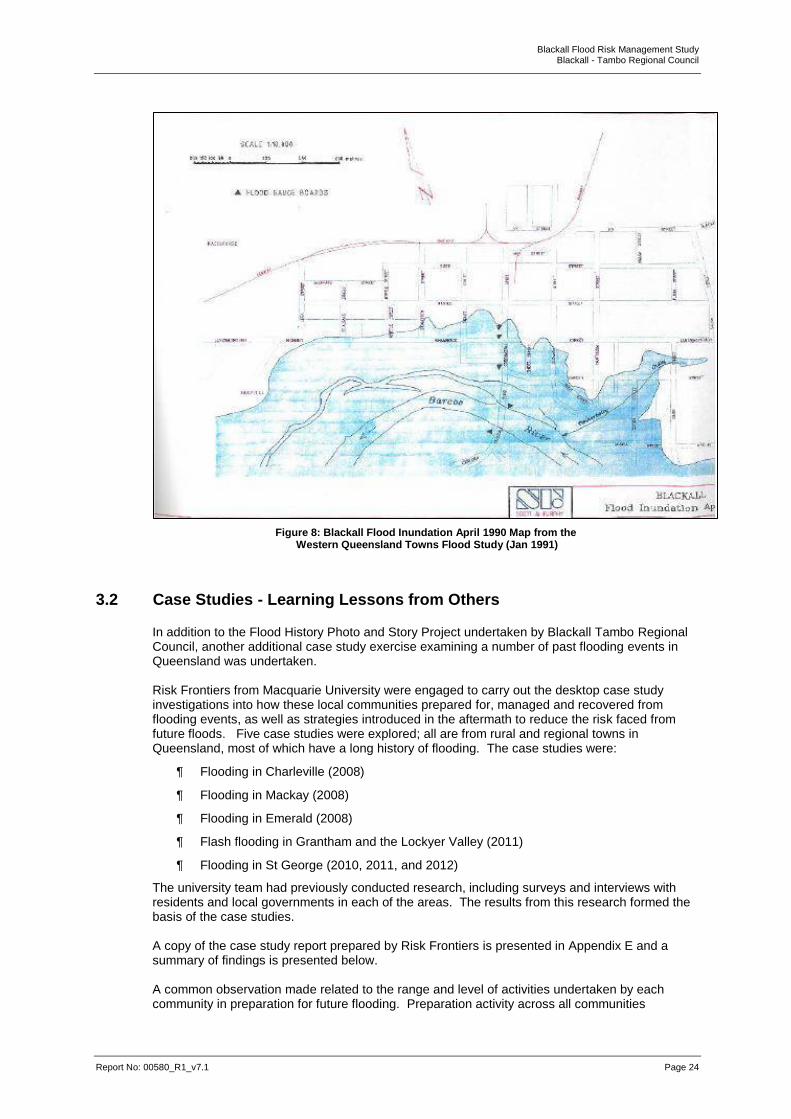
Blackall Flood Risk Management Study Blackall - Tambo Regional Council
Report No: 00580_R1_v7.1 Page 24
Figure 8: Blackall Flood Inundation April 1990 Map from the Western Queensland Towns Flood Study (Jan 1991)
3.2 Case Studies - Learning Lessons from Others
In addition to the Flood History Photo and Story Project undertaken by Blackall Tambo Regional Council, another additional case study exercise examining a number of past flooding events in Queensland was undertaken. Risk Frontiers from Macquarie University were engaged to carry out the desktop case study investigations into how these local communities prepared for, managed and recovered from flooding events, as well as strategies introduced in the aftermath to reduce the risk faced from future floods. Five case studies were explored; all are from rural and regional towns in Queensland, most of which have a long history of flooding. The case studies were:
Flooding in Charleville (2008)
Flooding in Mackay (2008)
Flooding in Emerald (2008)
Flash flooding in Grantham and the Lockyer Valley (2011)
Flooding in St George (2010, 2011, and 2012)
The university team had previously conducted research, including surveys and interviews with residents and local governments in each of the areas. The results from this research formed the basis of the case studies. A copy of the case study report prepared by Risk Frontiers is presented in Appendix E and a summary of findings is presented below. A common observation made related to the range and level of activities undertaken by each community in preparation for future flooding. Preparation activity across all communities

Blackall Flood Risk Management Study Blackall - Tambo Regional Council
Report No: 00580_R1_v7.1 Page 25
occurred and included a number of similar activities such as carrying out regular maintenance to ensure ditches and drains around properties were free of debris and carrying out river monitoring. Following previous floods, there was also a small portion of some of the communities raising their houses, as well as some businesses raising their floor levels. More immediate common activities in the lead up to the flood events studied included placing the SES and Red Cross on stand-by, the issuing of flood warnings from Emergency Services and/or local governments, and activating warning sirens. Moving cars, white goods, irreplaceable items, chemicals and poisons to higher ground was also widely undertaken as well as evacuation and power cuts for safety reasons, communication activities such as radio alerts and notification through SES workers and local government officials undertaking water level readings during the flood period. Common issues identified were difficulty in gaining SES volunteers due to the time-consuming training and induction process (pre-flooding), lack of warning of the flood and no warning of severity, lack of emergency accommodation shelters, and initial lack of other volunteers followed by haphazard, overzealous volunteering and sightseeing. Other issues identified included difficulties in keeping children out of waters, local hospitals not being able to cope with nursing home patients, fatigue all round, and communication breakdowns. Evacuees needing to be fed, insufficient sandbags, decision making occurring outside the local area where it was felt that decision making at the local level would have been more valid were also identified along with emergency plans unable to be enacted due to people dealing with their own disasters or not able to access where they needed to be. Following the event other issues identified were a shortage of tradespeople in the region to assist with rebuilding activities, only a small number of organisations, businesses and households had emergency plans and evacuation plans, no power for a couple of weeks due to lack of available electricians and many varying issues with insurance companies and claims.
The case study investigation also identified a range of possible future actions and mitigation measures by each community, including:
More warning systems and devices
Improving flood modelling
More river height reading stations
Better data needs (e.g. flood mapping and risk assessment) to become available out of either manual or automatic systems
Desilting to be carried out
Delivering community education programs
Delivering more training for SES volunteers
Raising houses and the floor levels in businesses
Being more targeted in evacuations
Localising decision making
Maintaining regular information in the media, particularly on what needs to be done and what different people’s roles are
Providing people with accurate information, better warning system
Implementing mitigation measures
Take out additional flood insurance
Greater commitment from insurance companies
Cooperation between departments is needed
Managing onlookers during flood events
Have available more apprentice plumbers, electricians and other tradespeople
Blackall Flood Risk Management Study Blackall - Tambo Regional Council
Report No: 00580_R1_v7.1 Page 26
Promote rail as a service option
Develop an improved warning system, that can be heard throughout all of town, supplement with door knocking
Sending SMS messages as flood warnings
Businesses have two (2) emergency plans in place, one for those with the expertise, and one for “raw recruits” in case those with expertise were unable to enact the plan.
Following the 2008 flood in Charleville it was found that most residents outlined that they believe responsibility for protecting them from floods was shared 50% themselves and 50% with the Murweh Shire Council. Whereas businesses, believed the three levels of government have a high level of responsibility for protecting them from floods, with the greatest level of responsibility lying with the local council. In Mackay, also following a 2008 flood event, the majority of residents believe that local council has a substantial responsibility for protecting them from flooding and only a small number of people believe that there is a need for the community to prepare for a flood.
A range of mitigation measures that have been or are being put in place across the communities following the investigated flood events was also observed. These included:
The preparation of flood maps
Creating an online mapping service to identify if property is in flood zone
Re-designed new subdivision aimed at lowering road levels to facilitate an improved outlet along the road
Installed an additional 900mm diameter pipe downstream
Cleared vegetation along the edge of the tributary to improve the future flow along the creek
Repaired storm water drainage systems and roads
Provided a wet season checklist to assist residents to mitigate flood damages.
Introduction of a Disaster Response Levy of $10 per annum against all rateable assessments to assist Council to have the capacity to meet the demands associated with natural disasters and funds areas.
Installation of additional gauging stations
Installation of a radar station
Developing a vulnerable persons register
Land swap/relocation (Lockyer Valley & St George)
Levee (St George - 4.1 km) - lack of consultation over levee & physical division in community regarding levee
House raising
The key stakeholder workshop in Blackall identified a levee as a possible mitigation measure. Through these case studies, it was identified that Mackay has a levee system in place, which offers some protection for small to medium flows, but in the case of large flows, extensive flooding would still occur, as was the case in the 2008 flood. Following flooding three years in a row in St George and the evacuation of the entire town in 2012, a decision was made to build a 4.1 km levee. Some residents will not be protected by this levee and they have been offered alternative mitigation measures including voluntary house raising, property relocation or a capped cost to undertake their own mitigation measures. There is

Blackall Flood Risk Management Study Blackall - Tambo Regional Council
Report No: 00580_R1_v7.1 Page 27
a perceived lack of consultation throughout the entire community and a physical division in the community over the Levee. The case studies have identified some strong common threads across all communities in regards to the importance of housing design and the number of houses that cannot be lifted due to their “slab on the ground” structure. Building code changes were called for in Emerald. Another is a perceived lack of warning systems and lack of communication and the need for better warning systems and communication. This was a similar finding at the key stakeholder workshop that was held in Blackall as part of this flood study. Similar to Blackall, Charleville and Mackay have flood-warning systems that are operated by the Australian Government and the Bureau of Meteorology based on rainfall and river height observations. The BOM flood warning system uses a rainfall and river height observations network, consisting of volunteer observers who forward data by phone when the initial flood height is exceeded at their station, and automatic phone telemetry stations run by the BOM, Department of Environment and Resource Management and Councils.
3.3 Flood Damages Assessment
The main objective of the flood damages assessment is to establish the ‘baseline’ economic costs of flooding (i.e. based on current conditions) which can then be used to help quantify the benefits of potential mitigation measures. Flood damages are classified as tangible or intangible, depending on whether costs can be assigned monetary values. Intangible damages arise from adverse social and environmental effects caused by flooding, including factors such as loss of life and limb, stress and anxiety. Tangible damages are monetary losses directly attributable to flooding. The flood damages assessment estimates these tangible damages to provide information on the economic impact of flooding and potential management measures. Results of the flood damages assessment will be presented in the following Preliminary Flood Risk Management Plan that will accompany this Study.
3.4 Cost Benefit Assessment
Cost benefit assessments are carried out on proposed management options to determine the economic merits of pursuing and / or implementing these options. The assessments compare the cost of implementing the option (e.g. construction and maintenance) with the likely reduction in flood damages (i.e. economic benefit). This comparison produces a ratio which can help inform the decision making process. It must be noted that the cost benefit assessment does not include intangible benefits, such as improved safety or environmental benefits. Results of the cost benefit assessment will be presented in the following Preliminary Flood Risk Management Plan that will accompany this Study.
3.5 Community & Specialist Consultation
Consultation provides a forum for relevant stakeholders, including the community, to work together to shape a collective vision for Blackall and future flood risk management. Effective consultation can increase community acceptance of the Blackall Flood Risk Management Plan and provide the opportunity for better decision making.
3.5.1 Stakeholder Consultation
Focus Group Summary of outcomes to be provided in the areas of:
Flood Awareness
Evacuation
Information
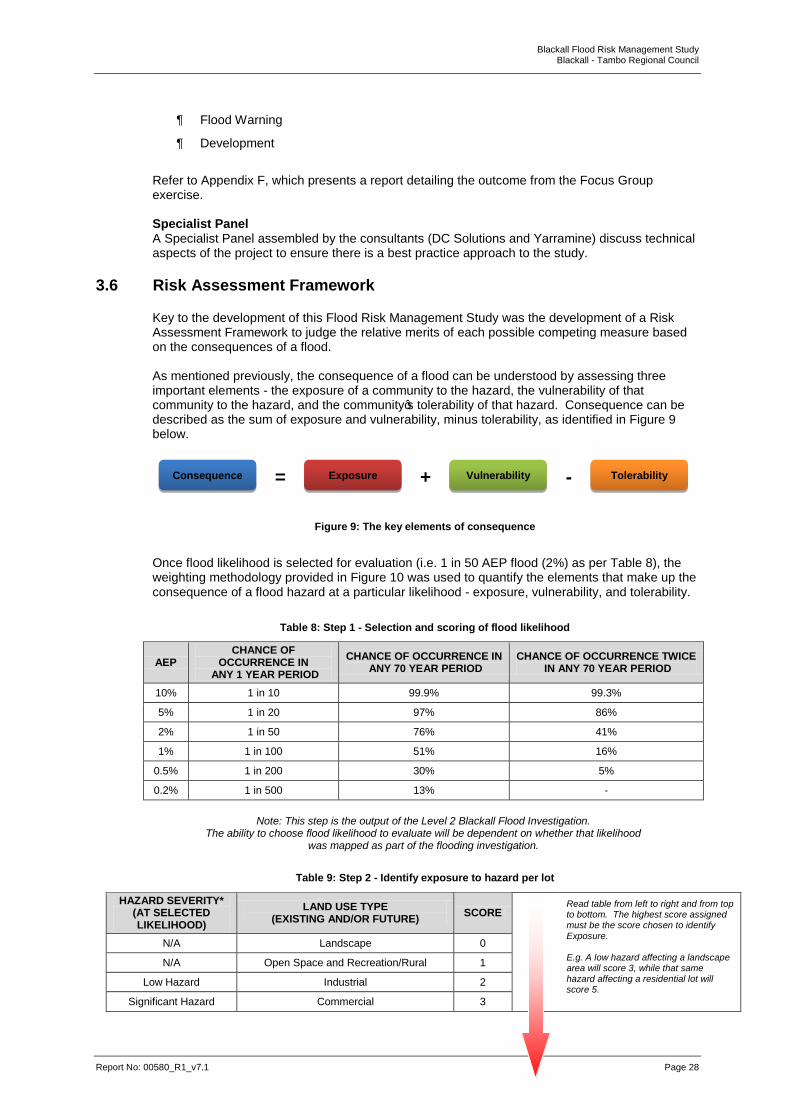
Blackall Flood Risk Management Study Blackall - Tambo Regional Council
Report No: 00580_R1_v7.1 Page 28
Flood Warning
Development
Refer to Appendix F, which presents a report detailing the outcome from the Focus Group exercise. Specialist Panel A Specialist Panel assembled by the consultants (DC Solutions and Yarramine) discuss technical aspects of the project to ensure there is a best practice approach to the study.
3.6 Risk Assessment Framework
Key to the development of this Flood Risk Management Study was the development of a Risk Assessment Framework to judge the relative merits of each possible competing measure based on the consequences of a flood. As mentioned previously, the consequence of a flood can be understood by assessing three important elements - the exposure of a community to the hazard, the vulnerability of that community to the hazard, and the community’s tolerability of that hazard. Consequence can be described as the sum of exposure and vulnerability, minus tolerability, as identified in Figure 9 below.
=
+
-
Figure 9: The key elements of consequence
Once flood likelihood is selected for evaluation (i.e. 1 in 50 AEP flood (2%) as per Table 8), the weighting methodology provided in Figure 10 was used to quantify the elements that make up the consequence of a flood hazard at a particular likelihood - exposure, vulnerability, and tolerability.
Table 8: Step 1 - Selection and scoring of flood likelihood
AEP CHANCE OF
OCCURRENCE IN ANY 1 YEAR PERIOD
CHANCE OF OCCURRENCE IN ANY 70 YEAR PERIOD
CHANCE OF OCCURRENCE TWICE IN ANY 70 YEAR PERIOD
10% 1 in 10 99.9% 99.3%
5% 1 in 20 97% 86%
2% 1 in 50 76% 41%
1% 1 in 100 51% 16%
0.5% 1 in 200 30% 5%
0.2% 1 in 500 13% -
Note: This step is the output of the Level 2 Blackall Flood Investigation.
The ability to choose flood likelihood to evaluate will be dependent on whether that likelihood was mapped as part of the flooding investigation.
Table 9: Step 2 - Identify exposure to hazard per lot
HAZARD SEVERITY* (AT SELECTED LIKELIHOOD)
LAND USE TYPE (EXISTING AND/OR FUTURE)
SCORE
Read table from left to right and from top to bottom. The highest score assigned must be the score chosen to identify
Exposure. E.g. A low hazard affecting a landscape area will score 3, while that same hazard affecting a residential lot will score 5.
N/A Landscape 0
N/A Open Space and Recreation/Rural 1
Low Hazard Industrial 2
Significant Hazard Commercial 3
Tolerability Vulnerability Exposure Consequence

Blackall Flood Risk Management Study Blackall - Tambo Regional Council
Report No: 00580_R1_v7.1 Page 29
High Hazard Infrastructure & Utilities/ Rural Residential 4 Equally, an extreme hazard will always score 5 regardless of the land use it affects. Extreme Hazard Residential/Community & Cultural 5
* Derived from AR&R Project 10 (Australian Rainfall & Runoff, Revision Projects, Project 10 Appropriate Safety Criteria for People and other references)

Blackall Flood Risk Management Study Blackall - Tambo Regional Council
Report No: 00580_R1_v7.1 Page 30
Table 10: Step 3 - Identify exposure to hazard per lot
VULNERABLE LAND USE BUILT FORM AND
ASSOCIATED SAFETY FLOOD WARNING TIMES*
FOR AFFECTED PERSONS
ISOLATION OF AFFECTED PERSONS IN URBAN
AREAS VIA NEARBY ROADS SCORE
Read table from left to right and from top to bottom. The highest score assigned must be the score chosen to identify Vulnerability.
E.g. A residential property would score 1 where no other vulnerability considerations were present (i.e. the building on the lot may be out of the hazard). However, where this property is elevated above the selected flood, the score increases to 2. Where it is not elevated, the score increases to 5. Equally, any land use with less
than 6 hours flood warning will always score 5 regardless of the use.
Existing/proposed built form not affected by hazard (regardless of use), or No existing/proposed vulnerable land use or affected persons (e.g. Landscape, Open Space and
Recreation)
Existing built form not affected by hazard
More than 3 days No isolation 0
Commercial, Industrial, Rural, Rural Residential and Residential without vulnerable persons
At grade – industrial 49 hours – 72 hours 0.2%/0.1%/PMF 1
Hazardous Materials/ Warehousing Elevated (elevated above selected flood), or Where currently vacant or underutilised, ability of zoned use(s) to be compatible with flood hazard
25 hours – 48 hours 0.5% 2
Community & Cultural with Vulnerable Property, or Minor infrastructure
At grade – commercial 13 hours – 24 hours 1% 3
Community & Cultural with Vulnerable Persons, or Residential with Vulnerable Persons
At grade - community 7 hours – 12 hours 2% 4
Evacuation Centres/Airports/ Other Critical Infrastructure or Where currently vacant or underutilised, inability of zoned use(s) to be compatible with flood hazard
Not elevated above selected flood – residential,
Less than 6 hours 10% 5
* Warning times based on BoM Classification of less than 6 hours warning as a ‘flash flood’, with per-day metrics used for warning times greater than 6 hours.

Blackall Flood Risk Management Study Blackall - Tambo Regional Council
Report No: 00580_R1_v7.1 Page 31
Table 11: Step 4 - Identify Tolerability to hazard severity per lot
COMMUNITY AWARENESS/
UNDERSTANDING
COMMUNITY PERCEPTION OF HAZARD
COMMUNITY PREPAREDNESS
EMERGENCY MANAGEMENT*
PROCEDURES/EVACUATION
LEVEL OF PROTECTION
TO LOT FROM EXISTING OR PROPOSED
STRUCTURAL WORKS (E.G. LEVEE)
ABILITY OF USE TO REMAIN
OPERATIONAL DURING/AFTER
SELECTED FLOOD EVENT (CRITICAL
INFRASTRUCTURE ONLY)
SCORE
Read table from left to right and from bottom to top. The lowest score assigned must be the score chosen to identify Tolerability. E.g., A community that is aware and tolerant of the flood hazard will score
more than a community that is unaware or intolerant. Tolerability therefore can include common elements such as community awareness that are not lot-specific. Equally, critical
infrastructure that is rendered inoperable by the selected flood event, regardless of community awareness or perception must score 0. This is a lot specific criterion.
OVERRIDING NEED TESTS^
Unaware Intolerant and not resilient
No individual preparedness, business continuity & social networks
For residential/critical infrastructure - no emergency services access to lot, or For non-residential – no evacuation procedures in place on lot
None Not able to remain operational
0
Partially Aware Fearful and generally not resilient
Limited individual preparedness, business continuity & social networks
For residential/critical infrastructure – limited emergency services access to lot, or For non-residential – limited evacuation procedures in place on lot
Less than 2% N/A 1
Moderately Aware Cautious and moderately resilient
Acceptable individual preparedness, business continuity & social networks
For residential/critical infrastructure – acceptable emergency services access to lot, or For non-residential – acceptable evacuation procedures in place on lot
2% to 1% Reduced but acceptable operations
2
Generally Aware Generally
tolerant and resilient
Strong individual
preparedness, business continuity & social networks
For residential/critical infrastructure
– strong emergency services access to lot, or For non-residential – strong evacuation procedures in place on lot
1% N/A 3
Very Aware Tolerant and resilient
Very strong individual preparedness, business continuity & social networks
For residential/critical infrastructure – very strong emergency services access to lot, or For non-residential – very strong evacuation procedures in place on lot
Above 1% Able to remain fully operational
4
No persons or property affected, or emergency services/evacuation procedures and structural controls unnecessary 5
^ Overriding economic or social need to remain in a flood hazard area must balance these imperatives with community awareness/understanding of the hazard to which they are subject, the community’s perception of the hazard, their preparedness to such a hazard, and the extent of responsibility placed upon emergency management.
* Advice should be sought from local disaster management coordinator in evaluating emergency management procedures/evacuation plans

Blackall Flood Risk Management Study Blackall - Tambo Regional Council
Report No: 00580_R1_v7.1 Page 32
Using this weighting, each lot was assigned a score of between 0 and 5 points based on the calculation process that supports the evaluation. The analysis resulted in final score out of ten (10), with ten (10) representing the highest level of consequence, and zero (0) representing no consequence, i.e. 4 + 4 – 2 = 6
=
+
-
Figure 10: Step 5 - Quantifying consequence using a weighting approach to the key elements of exposure, vulnerability and tolerability
Once a consequence score was derived, the flood risk matrix (Figure 13) was used to assign a level of risk to that score, relative to the flood likelihood against which the evaluation was undertaken. It can be seen from the matrix that the risk level identified is a product of the ‘Risk = Likelihood x Consequence’ formula discussed in Section 1.2.2 on Page 3. As a result, the consequence assigned to a flood hazard is then able to compare relative to the likelihood at which it occurs. Naturally, a flood hazard that is expected to occur once every ten years is less tolerable than a flood hazard of the same consequence that may occur once every thousand years as demonstrated Figure 11 below.
Figure 11: The risk scores possible at each level of AEP using the matrix
Note how risks become more acceptable the lesser the likelihood of their occurrence
The adopted approach for the management study to evaluating risk considers the approach to evaluating risk promoted by the National Emergency Risk Assessment Guidelines (NERAG), principally through the application of the ‘ALARP’ principle. According to NERAG, the ALARP (As Low As Reasonably Practicable) Principle is applied to define boundaries between risks that are generally intolerable, tolerable or broadly acceptable. The ALARP principle helps to prioritise a risk hierarchy and determine which risks require action and which do not. Those that are broadly acceptable naturally require little, if any, action while risks that are at an intolerable level require attention to bring them to a tolerable level.
0 to 5 points where:
0 is No tolerability
5 is high tolerability
Tolerability
0 to 5 points where:
0 is No vulnerability
5 is high vulnerability
Vulnerability
0 to 5 points where:
0 is No exposure
5 is high exposure
Exposure Consequence
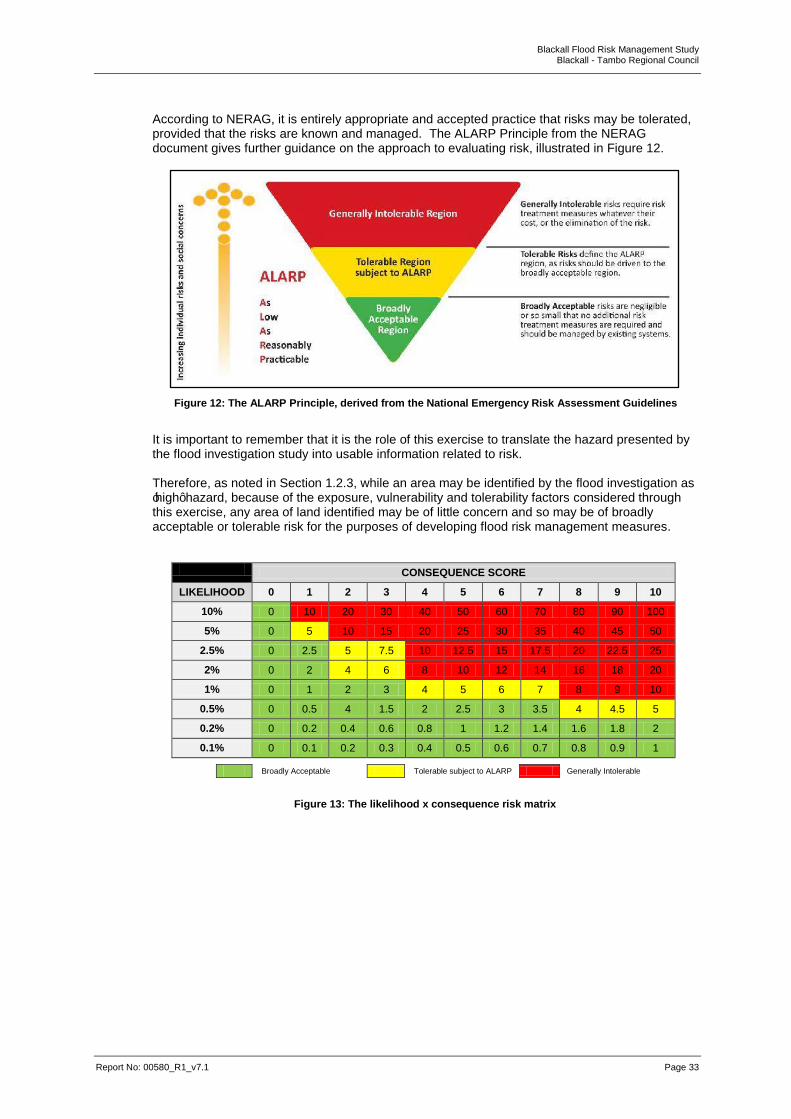
Blackall Flood Risk Management Study Blackall - Tambo Regional Council
Report No: 00580_R1_v7.1 Page 33
According to NERAG, it is entirely appropriate and accepted practice that risks may be tolerated, provided that the risks are known and managed. The ALARP Principle from the NERAG document gives further guidance on the approach to evaluating risk, illustrated in Figure 12.
Figure 12: The ALARP Principle, derived from the National Emergency Risk Assessment Guidelines
It is important to remember that it is the role of this exercise to translate the hazard presented by the flood investigation study into usable information related to risk. Therefore, as noted in Section 1.2.3, while an area may be identified by the flood investigation as ‘high’ hazard, because of the exposure, vulnerability and tolerability factors considered through this exercise, any area of land identified may be of little concern and so may be of broadly acceptable or tolerable risk for the purposes of developing flood risk management measures.
CONSEQUENCE SCORE
LIKELIHOOD 0 1 2 3 4 5 6 7 8 9 10
10% 0 10 20 30 40 50 60 70 80 90 100
5% 0 5 10 15 20 25 30 35 40 45 50
2.5% 0 2.5 5 7.5 10 12.5 15 17.5 20 22.5 25
2% 0 2 4 6 8 10 12 14 16 18 20
1% 0 1 2 3 4 5 6 7 8 9 10
0.5% 0 0.5 4 1.5 2 2.5 3 3.5 4 4.5 5
0.2% 0 0.2 0.4 0.6 0.8 1 1.2 1.4 1.6 1.8 2
0.1% 0 0.1 0.2 0.3 0.4 0.5 0.6 0.7 0.8 0.9 1
Broadly Acceptable Tolerable subject to ALARP Generally Intolerable
Figure 13: The likelihood x consequence risk matrix
Blackall Flood Risk Management Study Blackall - Tambo Regional Council
Report No: 00580_R1_v7.1 Page 34
4 Risk Assessment Results
This section of the Study, presents the results of the flood risk assessment undertaken as the underlying basis of how Blackall can improve its resilience to flood events in the future through a risk-based, fit-for-purpose approach. The assessment undertaken evaluates the risk of a flood event, which was identified as a 2% AEP flood event via the QldRA Level 2 Flood Investigation that was undertaken. The flood extent of this event, its hazard (expressed through depth) is presented in Appendix G and the existing land use planning zones are displayed in Appendix H. The flood event selected was the closest exceeding AEP from the highest known flood (April 1990 for Blackall. Such an event has an approximately 76% chance of occurring at least once in 70 years, and approximately 41% chance of occurring twice in this period, and has only come close once since records began.
4.1 Planning evaluation - determining risk levels
Using the step by step process previously presented, a suite of maps were developed to identify those properties subject to flood exposure and vulnerability, as well as the level of flood tolerability, in order to assign specific levels of flood risk to each property. This analysis was performed via a GIS spatial database so that the exposure, vulnerability and tolerability scores for each lot could be identified and risk per lot calculated.
4.2 Determining exposure
Using the exposure scoring matrix, the map shown in Appendix I was developed. Each lot in the subject area was scored for its level of exposure to the flood hazard of the 2% AEP flood event. Note that the levels of exposure are the same (a maximum exposure of 5 points) in both the rural area adjacent the main river channel and the residential area to the east north. This is even though the flood hazard in the rural area is more significant than that in the residential area. This is due to the scoring matrix giving strong weight to both instances of higher hazard and uses of increasing sensitivity to that hazard. Those residential lots that were identified as vacant also still scored a maximum 5 points for vulnerability. Given the significant depth of the floodwaters (> 2 metres) in the area of the numerous vacant properties, it would have been difficult for a home to be approved on that lot given it would be improbable that a house could be reasonably designed to be compatible with the depth of floodwater on those sites. In practice, this may be an indication as to why these urban residential lots are still vacant.
4.3 Determining vulnerability
Using the vulnerability scoring matrix, the map shown in Appendix J was developed. Each lot in the subject area was scored for its level of vulnerability to the flood hazard of the 2% AEP flood event. Of particular interest for the subject area is the vulnerability to:
the existing residential properties, caused by vulnerable built form such as slab-on-ground or low-set construction; and
critical infrastructure.
Flood warning time was not considered an element that would contribute to the vulnerability of land use in the subject area, as the community has a long forewarning of floodwaters due to its position in the sub-basin and the flood warning system already in place. In addition, several land uses included vulnerable persons (e.g. aged care or childcare) or vulnerable property (such as museums / libraries or electrical sub-stations) in this area.

Blackall Flood Risk Management Study Blackall - Tambo Regional Council
Report No: 00580_R1_v7.1 Page 35
A built form assessment of all urban residential and commercial zoned land was undertaken to determine those buildings that would be inundated above their ground floor level during the 2% event. This was undertaken using publicly available street view information. Note that for existing residential properties, the minority scored a vulnerability score of 2, while a small number scored only 5 points, the opposite for the commercial land uses in the CBD. This is due to the majority of homes either being elevated and the majority of commercial premises being either low-set/slab-on ground construction, or where elevated, the flood depth was so high that these homes and buildings would still be inundated.
4.4 Determining tolerability
Using the tolerability scoring matrix, the map shown in Appendix K was developed. Each lot in the subject area was scored for its level of tolerability to the flood hazard of the 2% AEP flood event.
The Community Awareness/Understanding criterion is a community-wide, rather than lot-specific consideration. For this criterion, it is not the intention to interview each resident on each lot, but to form a community-wide view of these matters that is then applied at the property level. The size or spatial area of a ‘community’ will be subjective, and focussed on a size that is representative of the persons likely to be affected by the flood hazard. Therefore, given the historic experience of flood in Blackall, it was assumed that, the community’ awareness and understanding of flood would be generally good. Notwithstanding, the ‘Community Perception of Hazard’ is an important consideration that is relative to the type of land use on the lot. The extent of flood hazard on some residential lots would be so great that it would be improbable that a community member would reasonably be able to tolerate the effects of that flood, such as the potential for impacts on personal safety and property. Therefore, residential lots where the flood hazard severity and the vulnerability to it were high were assigned a low tolerability score. Some lots where the flood hazard was not so severe that it had only minimal impact on the lot or its built form, and those lots with a non-sensitive land use such as open space and some rural lots were assigned high tolerability scores. In practice, the tolerability criteria in the matrix can be used to ‘weigh up’ a community’s tolerance of the flood hazard and therefore understand how or whether an overriding need to remain in or advance into the floodable area can be demonstrated. For example, as above, a low score for ‘Community Perception of Hazard’ can be used where the severity of the flood is simply so great that the community affected cannot tolerate it or be resilient to it. ‘Community Preparedness’ can be used to rate the ability of a community to prepare for floods of certain types - i.e. if flash floods are being evaluated, the ability of individuals and businesses to be fully prepared for such an event is likely to be limited. The ‘Emergency Management Procedures/Evacuation’ criterion could be assigned a higher score where floods are slow, shallow and there is long warning time of the event. The key in undertaking a tolerability assessment is to assess all criteria, but the lowest score assigned must be the score chosen to identify tolerability. Notably, Blackall does not include any structural works that may protect the floodable part of town during such an event. This criterion in the tolerability matrix therefore was not used in this instance.
4.5 Flood risk mapping & initial analysis
Using the Likelihood x Consequence flood risk matrix the risk levels relative to the selected flood event and its consequences were translated into areas of generally intolerable, tolerable and broadly acceptable risk and mapped.