Embed Size (px)
Citation preview

_____________________________
The Blackstone Group L.P.
345 Park Avenue
New York, New York 10154
T 212 583 5000
Blackstone Reports Fourth Quarter and Full Year 2018 Results
New York, January 31, 2019: Blackstone (NYSE:BX) today reported its fourth quarter and full year 2018 results.
Stephen A. Schwarzman, Chairman and Chief Executive Officer, said, “Blackstone again delivered attractive investment performance for our
limited partners in 2018, with nearly all of our flagship strategies handily beating their relevant indices despite significant market volatility.
Inflows of more than $100 billion last year coupled with positive performance drove assets under management to a record $472 billion. And for
our shareholders, we returned $1 billion through distributions and buybacks for the second consecutive quarter, and $3 billion for the full year.”
Blackstone issued a full detailed presentation of its fourth quarter and full year 2018 results, which can be viewed at www.blackstone.com.
Distribution
Blackstone has declared a quarterly distribution of $0.58 per common unit to record holders of common units at the close of business on
February 11, 2019. This distribution will be paid on February 19, 2019.
Quarterly Investor Call Details
Blackstone will host a conference call on January 31, 2019 at 9:00 a.m. ET to discuss fourth quarter and full year 2018 results. The conference call
can be accessed via the Shareholders section of Blackstone’s website at www.blackstone.com or by dialing +1 (877) 391-6747 (U.S. domestic) or
+1 (617) 597-9291 (international), pass code 149 943 55#. For those unable to listen to the live broadcast, a replay will be available on
www.blackstone.com or by dialing +1 (888) 286-8010 (U.S. domestic) or +1 (617) 801-6888 (international), pass code 420 922 04#.
About Blackstone
Blackstone is one of the world’s leading investment firms. We seek to create positive economic impact and long-term value for our investors, the
companies we invest in, and the communities in which we work. We do this by using extraordinary people and flexible capital to help companies
solve problems. Our asset management businesses, with $472 billion in assets under management, include investment vehicles focused on private
equity, real estate, public debt and equity, non-investment grade credit, real assets and secondary funds, all on a global basis. Further information
is available at www.blackstone.com. Follow Blackstone on Twitter @Blackstone.
2
Forward-Looking Statements
This release may contain forward-looking statements within the meaning of Section 27A of the Securities Act of 1933 and Section 21E of the
Securities Exchange Act of 1934 which reflect Blackstone’s current views with respect to, among other things, Blackstone’s operations, financial
performance and unit repurchase and distribution activities. You can identify these forward-looking statements by the use of words such as
“outlook,” “indicator,” “believes,” “expects,” “potential,” “continues,” “may,” “will,” “should,” “seeks,” “approximately,” “predicts,” “intends,”
“plans,” “estimates,” “anticipates” or the negative version of these words or other comparable words. Such forward-looking statements are subject
to various risks and uncertainties. Accordingly, there are or will be important factors that could cause actual outcomes or results to differ
materially from those indicated in these statements. Blackstone believes these factors include but are not limited to those described under the
section entitled “Risk Factors” in its Annual Report on Form 10-K for the fiscal year ended December 31, 2017, as such factors may be updated
from time to time in its periodic filings with the Securities and Exchange Commission, which are accessible on the SEC’s website at
www.sec.gov. These factors should not be construed as exhaustive and should be read in conjunction with the other cautionary statements that are
included in this release and in the filings. Blackstone undertakes no obligation to publicly update or review any forward-looking statement,
whether as a result of new information, future developments or otherwise.
This release does not constitute an offer of any Blackstone Fund.
Investor and Media Relations Contacts
Joan Solotar
Blackstone
Tel: +1 (212) 583-5068
Weston Tucker
Blackstone
Tel: +1 (212) 583-5231
Christine Anderson
Blackstone
Tel: +1 (212) 583-5182

January 31, 2019
Blackstone’s Fourth Quarter and Full Year 2018 Earnings
Blackstone 1
184 0 92 102 0 70 0 152 195 99 206 202 201 221 3 0 103 120 0 115 99 0 171 146
% Change % Change
(Dollars in Thousands, Except per Unit Data) (Unaudited) 4Q'17 4Q'18 vs. 4Q'17 FY'17 FY'18 vs. FY'17
Revenues
Management and Advisory Fees, Net 729,059$ 797,554$ 9% 2,751,322$ 3,027,796$ 10%
Incentive Fees 120,187 15,797 (87)% 242,514 57,540 (76)%
Investment Income (Loss)
Performance Allocations
Realized 1,422,262 511,388 (64)% 3,571,811 1,876,507 (47)%
Unrealized (483,033) (806,305) 67% (105,473) 561,373 n/m
Principal Investments
Realized 184,562 109,901 (40)% 635,769 415,862 (35)%
Unrealized (20,567) (218,165) n/m 42,605 49,917 17%
Total Investment Income (Loss) 1,103,224 (403,181) n/m 4,144,712 2,903,659 (30)%
Interest and Dividend Revenue 40,524 47,885 18% 139,696 171,947 23%
Other (33,781) 46,923 n/m (133,229) 672,317 n/m
Total Revenues 1,959,213 504,978 (74)% 7,145,015 6,833,259 (4)%
Expenses
Compensation and Benefits
Compensation 364,484 373,790 3% 1,442,485 1,609,957 12%
Incentive Fee Compensation 43,450 10,260 (76)% 105,279 33,916 (68)%
Performance Allocations Compensation
Realized 557,244 212,174 (62)% 1,281,965 711,076 (45)%
Unrealized (166,183) (302,868) 82% 103,794 319,742 208%
Total Compensation and Benefits 798,995 293,356 (63)% 2,933,523 2,674,691 (9)%
General, Administrative and Other 138,608 153,519 11% 488,582 594,873 22%
Interest Expense 74,606 44,644 (40)% 197,486 163,990 (17)%
Fund Expenses 32,692 3,577 (89)% 132,787 78,486 (41)%
Total Expenses 1,044,901 495,096 (53)% 3,752,378 3,512,040 (6)%
Other Income (Loss)
Reduction of Tax Receivable Agreement Liability 403,855 - (100)% 403,855 - (100)%
Net Gains (Losses) from Fund Investment Activities 81,963 (59,234) n/m 321,597 191,722 (40)%
Income (Loss) Before Provision for Taxes 1,400,130$ (49,352)$ n/m 4,118,089$ 3,512,941$ (15)%
Provision for Taxes 596,590 29,366 (95)% 743,147 249,390 (66)%
Net Income (Loss) 803,540$ (78,718)$ n/m 3,374,942$ 3,263,551$ (3)%
Net Income (Loss) Attributable to Redeemable Non-Controlling Interests in Consolidated Entities 7,600 (4,303) n/m 13,806 (2,104) n/m
Net Income (Loss) Attributable to Non-Controlling Interests in Consolidated Entities 132,364 (68,800) n/m 497,439 358,878 (28)%
Net Income Attributable to Non-Controlling Interests in Blackstone Holdings 359,438 5,253 (99)% 1,392,323 1,364,989 (2)%
Net Income (Loss) Attributable to The Blackstone Group L.P. ("BX") 304,138$ (10,868)$ n/m 1,471,374$ 1,541,788$ 5%
Net Income (Loss) per Common Unit, Basic 0.45$ (0.02)$ n/m 2.21$ 2.27$ 3%
Net Income (Loss) per Common Unit, Diluted 0.45$ (0.02)$ n/m 2.21$ 2.26$ 2%
Income (Loss) Before Provision for Taxes Margin 71.5% (9.8)% 57.6% 51.4%
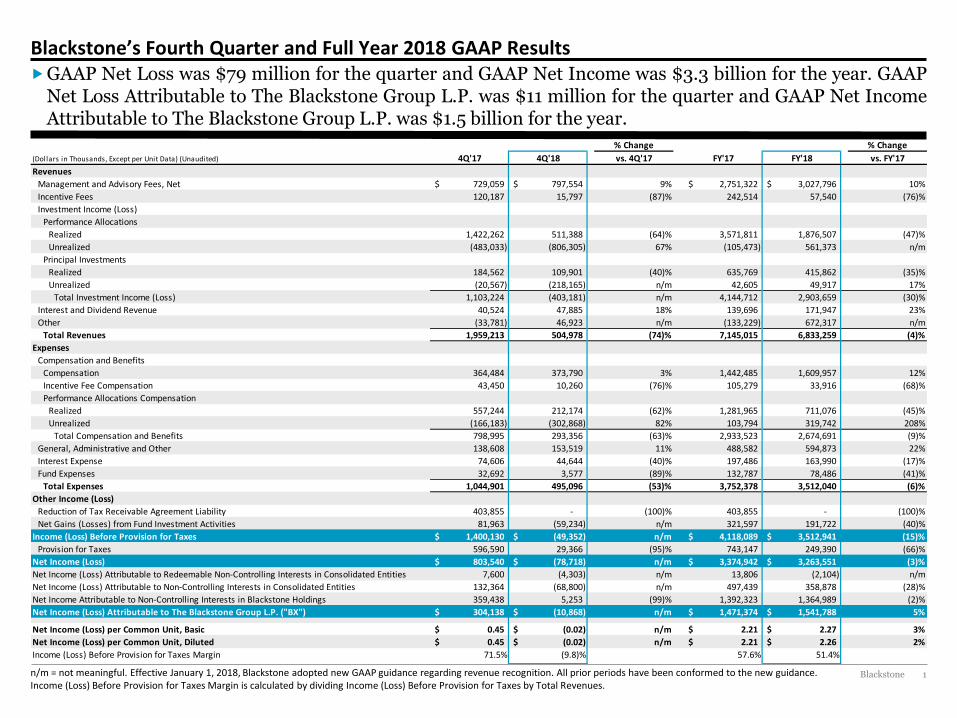
Blackstone’s Fourth Quarter and Full Year 2018 GAAP Results GAAP Net Loss was $79 million for the quarter and GAAP Net Income was $3.3 billion for the year. GAAP
Net Loss Attributable to The Blackstone Group L.P. was $11 million for the quarter and GAAP Net Income Attributable to The Blackstone Group L.P. was $1.5 billion for the year.
n/m = not meaningful. Effective January 1, 2018, Blackstone adopted new GAAP guidance regarding revenue recognition. All prior periods have been conformed to the new guidance. Income (Loss) Before Provision for Taxes Margin is calculated by dividing Income (Loss) Before Provision for Taxes by Total Revenues.
Blackstone 2
184 0 92 102 0 70 0 152 195 99 206 202 201 221 3 0 103 120 0 115 99 0 171 146
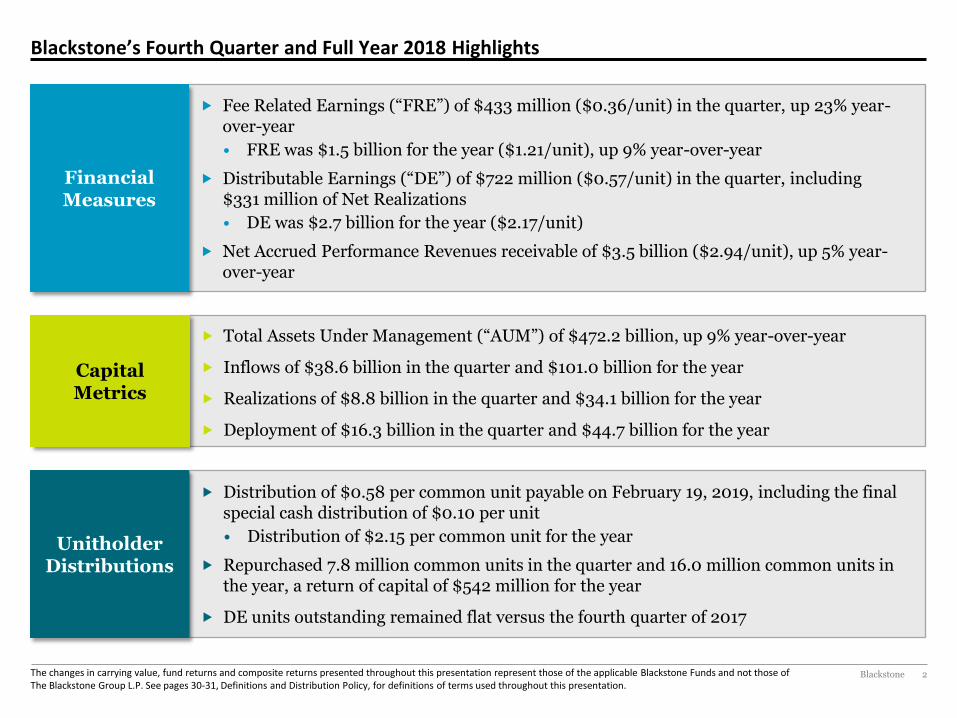
Blackstone’s Fourth Quarter and Full Year 2018 Highlights
The changes in carrying value, fund returns and composite returns presented throughout this presentation represent those of the applicable Blackstone Funds and not those of The Blackstone Group L.P. See pages 30-31, Definitions and Distribution Policy, for definitions of terms used throughout this presentation.
Financial Measures
Fee Related Earnings (“FRE”) of $433 million ($0.36/unit) in the quarter, up 23% year-over-year
• FRE was $1.5 billion for the year ($1.21/unit), up 9% year-over-year
Distributable Earnings (“DE”) of $722 million ($0.57/unit) in the quarter, including $331 million of Net Realizations
• DE was $2.7 billion for the year ($2.17/unit)
Net Accrued Performance Revenues receivable of $3.5 billion ($2.94/unit), up 5% year-over-year
Capital Metrics
Total Assets Under Management (“AUM”) of $472.2 billion, up 9% year-over-year
Inflows of $38.6 billion in the quarter and $101.0 billion for the year
Realizations of $8.8 billion in the quarter and $34.1 billion for the year
Deployment of $16.3 billion in the quarter and $44.7 billion for the year
Unitholder Distributions
Distribution of $0.58 per common unit payable on February 19, 2019, including the final special cash distribution of $0.10 per unit
• Distribution of $2.15 per common unit for the year
Repurchased 7.8 million common units in the quarter and 16.0 million common units in the year, a return of capital of $542 million for the year
DE units outstanding remained flat versus the fourth quarter of 2017
Blackstone 3
184 0 92 102 0 70 0 152 195 99 206 202 201 221 3 0 103 120 0 115 99 0 171 146
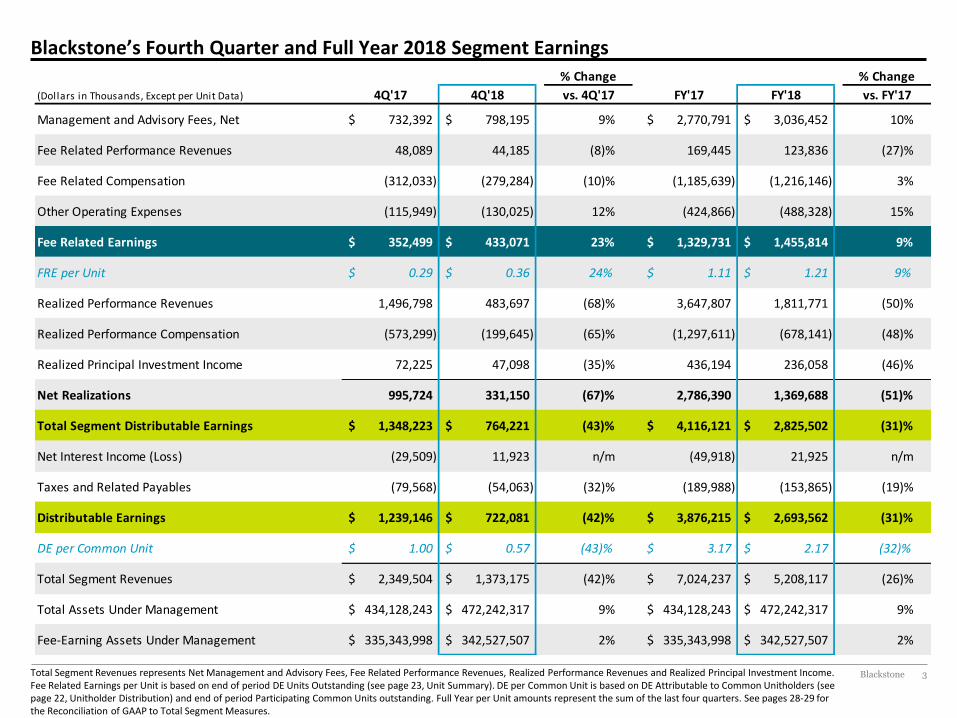
Blackstone’s Fourth Quarter and Full Year 2018 Segment Earnings
Total Segment Revenues represents Net Management and Advisory Fees, Fee Related Performance Revenues, Realized Performance Revenues and Realized Principal Investment Income. Fee Related Earnings per Unit is based on end of period DE Units Outstanding (see page 23, Unit Summary). DE per Common Unit is based on DE Attributable to Common Unitholders (see page 22, Unitholder Distribution) and end of period Participating Common Units outstanding. Full Year per Unit amounts represent the sum of the last four quarters. See pages 28-29 for the Reconciliation of GAAP to Total Segment Measures.
% Change % Change
(Dollars in Thousands, Except per Unit Data) 4Q'17 4Q'18 vs. 4Q'17 FY'17 FY'18 vs. FY'17
Management and Advisory Fees, Net 732,392$ 798,195$ 9% 2,770,791$ 3,036,452$ 10%
Fee Related Performance Revenues 48,089 44,185 (8)% 169,445 123,836 (27)%
Fee Related Compensation (312,033) (279,284) (10)% (1,185,639) (1,216,146) 3%
Other Operating Expenses (115,949) (130,025) 12% (424,866) (488,328) 15%
Fee Related Earnings 352,499$ 433,071$ 23% 1,329,731$ 1,455,814$ 9%
FRE per Unit 0.29$ 0.36$ 24% 1.11$ 1.21$ 9%
Realized Performance Revenues 1,496,798 483,697 (68)% 3,647,807 1,811,771 (50)%
Realized Performance Compensation (573,299) (199,645) (65)% (1,297,611) (678,141) (48)%
Realized Principal Investment Income 72,225 47,098 (35)% 436,194 236,058 (46)%
Net Realizations 995,724 331,150 (67)% 2,786,390 1,369,688 (51)%
Total Segment Distributable Earnings 1,348,223$ 764,221$ (43)% 4,116,121$ 2,825,502$ (31)%
Net Interest Income (Loss) (29,509) 11,923 n/m (49,918) 21,925 n/m
Taxes and Related Payables (79,568) (54,063) (32)% (189,988) (153,865) (19)%
Distributable Earnings 1,239,146$ 722,081$ (42)% 3,876,215$ 2,693,562$ (31)%
DE per Common Unit 1.00$ 0.57$ (43)% 3.17$ 2.17$ (32)%
Total Segment Revenues 2,349,504$ 1,373,175$ (42)% 7,024,237$ 5,208,117$ (26)%
Total Assets Under Management 434,128,243$ 472,242,317$ 9% 434,128,243$ 472,242,317$ 9%
Fee-Earning Assets Under Management 335,343,998$ 342,527,507$ 2% 335,343,998$ 342,527,507$ 2%
Blackstone 4
184 0 92 102 0 70 0 152 195 99 206 202 201 221 3 0 103 120 0 115 99 0 171 146
Fee Related Earnings
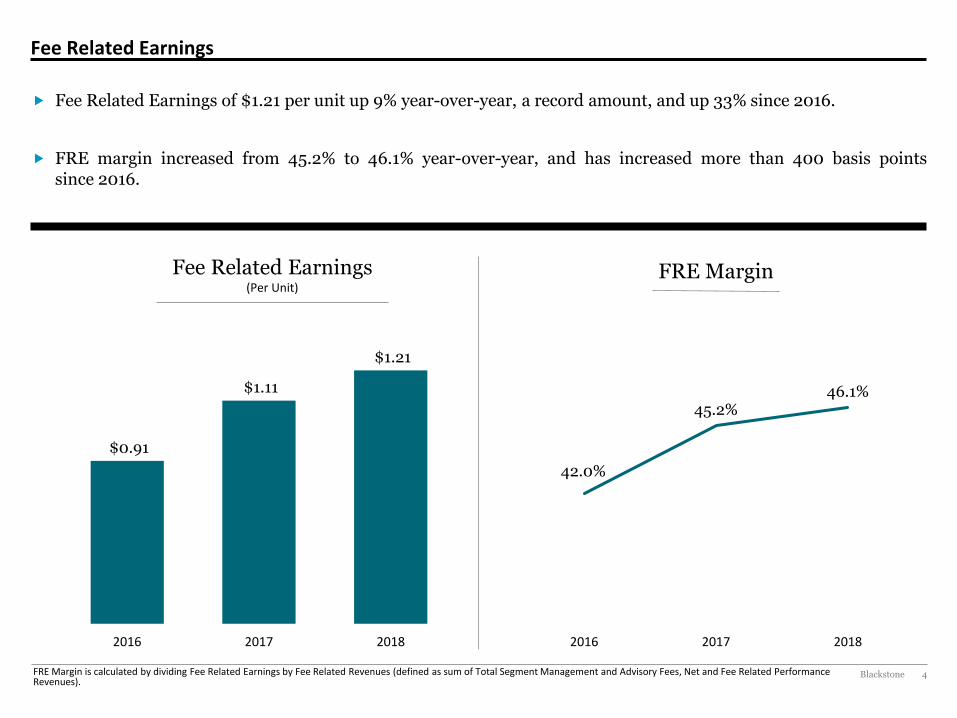
Fee Related Earnings of $1.21 per unit up 9% year-over-year, a record amount, and up 33% since 2016.
FRE margin increased from 45.2% to 46.1% year-over-year, and has increased more than 400 basis points since 2016.
Fee Related Earnings (Per Unit)
42.0%
45.2%46.1%
2016 2017 2018
FRE Margin
$0.91
$1.11
$1.21
2016 2017 2018
FRE Margin is calculated by dividing Fee Related Earnings by Fee Related Revenues (defined as sum of Total Segment Management and Advisory Fees, Net and Fee Related Performance Revenues).
Blackstone 5
184 0 92 102 0 70 0 152 195 99 206 202 201 221 3 0 103 120 0 115 99 0 171 146
4Q'18 FY'18
Real Estate
Opportunistic Funds 0.6% 9.8%
Core+ 2.3% 10.7%
Private Equity
Corporate Private Equity (2.9)% 19.1%
Tactical Opportunities 0.3% 12.2%
Strategic Partners 5.1% 18.6%
Hedge Fund Solutions
BPS Composite (2.3)% 2.0%
Credit
Performing Credit (0.2)% 8.8%
Distressed (7.3)% (3.2)%
Investment Performance and Net Accrued Performance Revenues
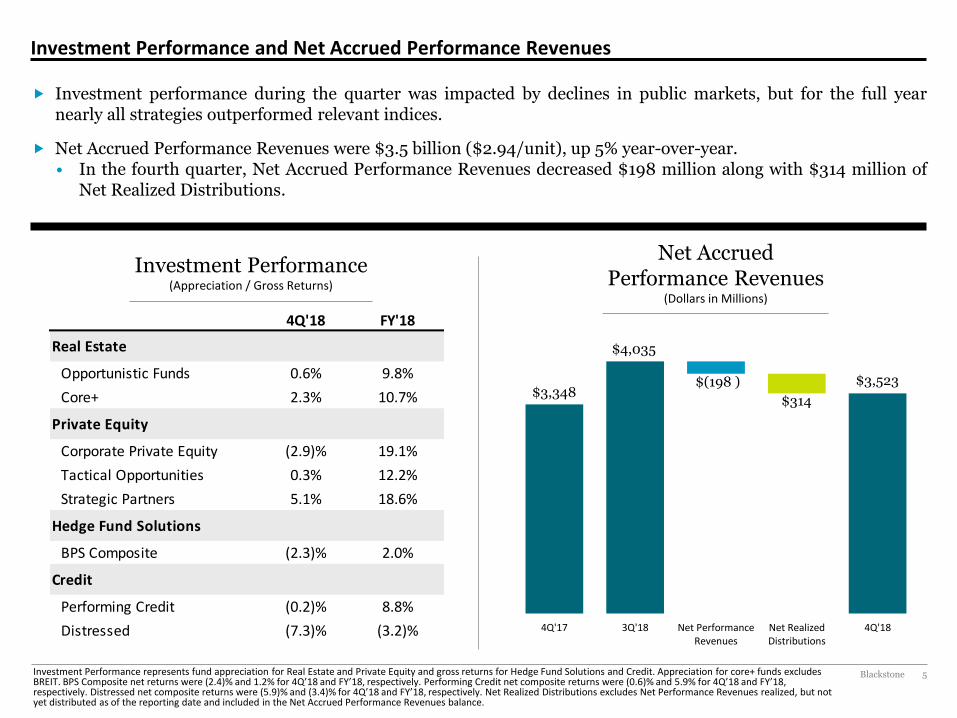
Investment performance during the quarter was impacted by declines in public markets, but for the full year nearly all strategies outperformed relevant indices.
Net Accrued Performance Revenues were $3.5 billion ($2.94/unit), up 5% year-over-year. • In the fourth quarter, Net Accrued Performance Revenues decreased $198 million along with $314 million of
Net Realized Distributions.
Net Accrued Performance Revenues
(Dollars in Millions)
Investment Performance (Appreciation / Gross Returns)
Investment Performance represents fund appreciation for Real Estate and Private Equity and gross returns for Hedge Fund Solutions and Credit. Appreciation for core+ funds excludes BREIT. BPS Composite net returns were (2.4)% and 1.2% for 4Q’18 and FY’18, respectively. Performing Credit net composite returns were (0.6)% and 5.9% for 4Q’18 and FY’18, respectively. Distressed net composite returns were (5.9)% and (3.4)% for 4Q’18 and FY’18, respectively. Net Realized Distributions excludes Net Performance Revenues realized, but not yet distributed as of the reporting date and included in the Net Accrued Performance Revenues balance.
$3,348
$4,035
$3,523 $(198 )
$314
4Q'17 3Q'18 Net PerformanceRevenues
Net RealizedDistributions
4Q'18
Blackstone 6
184 0 92 102 0 70 0 152 195 99 206 202 201 221 3 0 103 120 0 115 99 0 171 146
Capital Metrics Activity
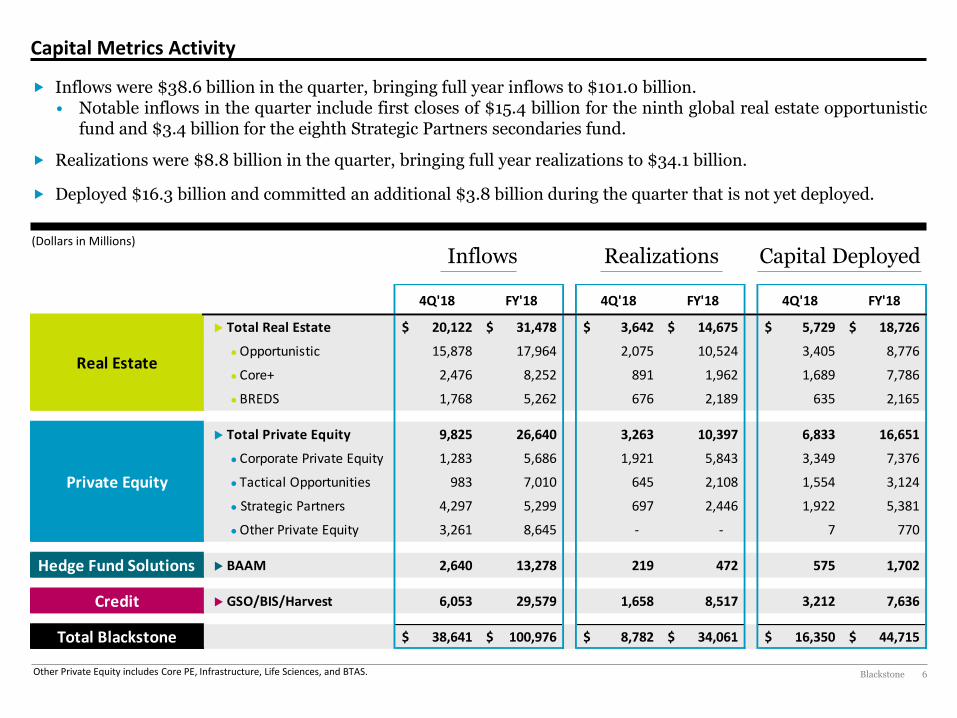
Inflows were $38.6 billion in the quarter, bringing full year inflows to $101.0 billion. • Notable inflows in the quarter include first closes of $15.4 billion for the ninth global real estate opportunistic
fund and $3.4 billion for the eighth Strategic Partners secondaries fund.
Realizations were $8.8 billion in the quarter, bringing full year realizations to $34.1 billion.
Deployed $16.3 billion and committed an additional $3.8 billion during the quarter that is not yet deployed.
(Dollars in Millions)
Other Private Equity includes Core PE, Infrastructure, Life Sciences, and BTAS.
4Q'18 FY'18 4Q'18 FY'18 4Q'18 FY'18
u Total Real Estate 20,122$ 31,478$ 3,642$ 14,675$ 5,729$ 18,726$
● Opportunistic 15,878 17,964 2,075 10,524 3,405 8,776
● Core+ 2,476 8,252 891 1,962 1,689 7,786
● BREDS 1,768 5,262 676 2,189 635 2,165
u Total Private Equity 9,825 26,640 3,263 10,397 6,833 16,651
● Corporate Private Equity 1,283 5,686 1,921 5,843 3,349 7,376
● Tactical Opportunities 983 7,010 645 2,108 1,554 3,124
● Strategic Partners 4,297 5,299 697 2,446 1,922 5,381
● Other Private Equity 3,261 8,645 - - 7 770
Hedge Fund Solutions u BAAM 2,640 13,278 219 472 575 1,702
Credit u GSO/BIS/Harvest 6,053 29,579 1,658 8,517 3,212 7,636
Total Blackstone 38,641$ 100,976$ 8,782$ 34,061$ 16,350$ 44,715$
Real Estate
Private Equity
Inflows Realizations Capital Deployed
Blackstone 7
184 0 92 102 0 70 0 152 195 99 206 202 201 221 3 0 103 120 0 115 99 0 171 146
Summary of Financials by Segment
Fee Related Earnings (Dollars in Millions)
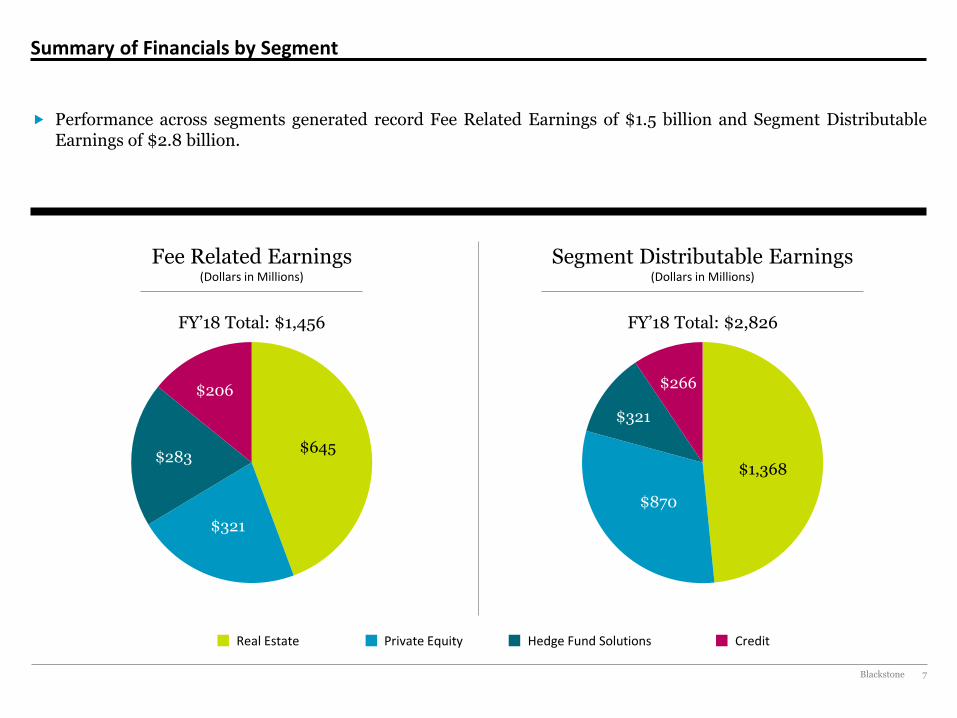
Performance across segments generated record Fee Related Earnings of $1.5 billion and Segment Distributable Earnings of $2.8 billion.
Segment Distributable Earnings (Dollars in Millions)
$645
$321
$283
$206
$1,368
$870
$321
$266
FY’18 Total: $1,456 FY’18 Total: $2,826
Real Estate Private Equity Hedge Fund Solutions Credit
Blackstone 8
184 0 92 102 0 70 0 152 195 99 206 202 201 221 3 0 103 120 0 115 99 0 171 146
$111.3 $97.0
$69.9 $72.3
$70.1 $80.0
$84.0 $93.3
$335.3 $342.5
4Q'17 4Q'18
$138.1 $127.5
$75.1 $77.8
$105.6 $130.7
$115.3 $136.2
$434.1
$472.2
4Q'17 4Q'18
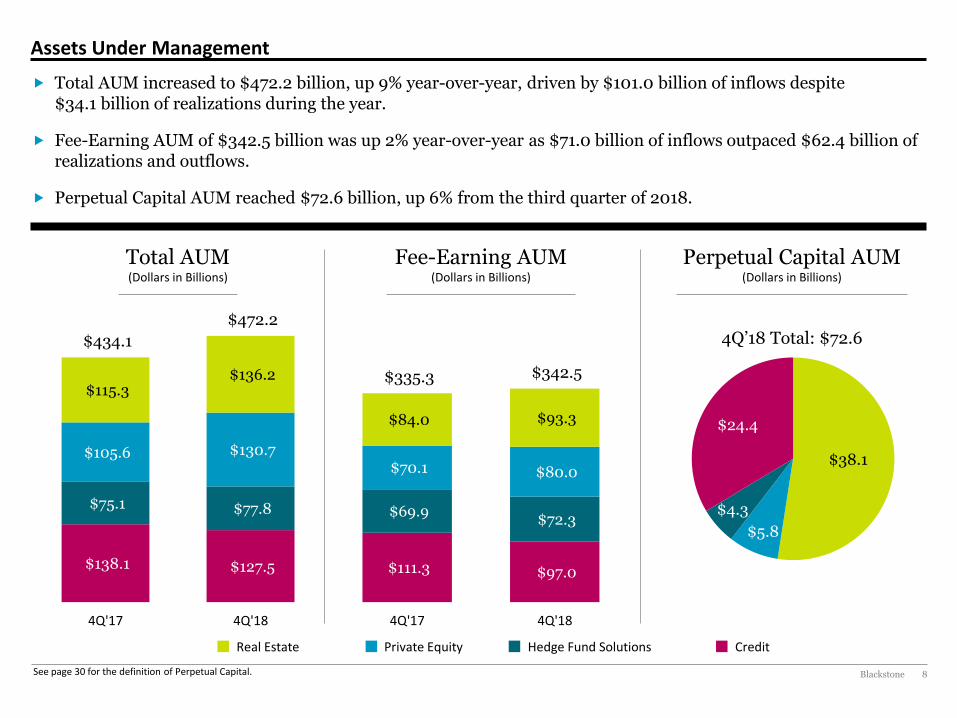
Assets Under Management
Total AUM increased to $472.2 billion, up 9% year-over-year, driven by $101.0 billion of inflows despite $34.1 billion of realizations during the year.
Fee-Earning AUM of $342.5 billion was up 2% year-over-year as $71.0 billion of inflows outpaced $62.4 billion of realizations and outflows.
Perpetual Capital AUM reached $72.6 billion, up 6% from the third quarter of 2018.
Fee-Earning AUM (Dollars in Billions)
Total AUM (Dollars in Billions)
See page 30 for the definition of Perpetual Capital.
Real Estate Hedge Fund Solutions Credit
$38.1
$5.8
$4.3
$24.4
4Q’18 Total: $72.6
Private Equity
Perpetual Capital AUM (Dollars in Billions)
Blackstone 9
184 0 92 102 0 70 0 152 195 99 206 202 201 221 3 0 103 120 0 115 99 0 171 146
$36.9 $42.1 $22.9
$36.7 $41.2
$42.4
$38.3 $46.1
$59.5
$63.3
$73.5 $85.5
$175.1
$202.9 $210.3
2016 2017 2018
$40.6
$44.4
$3.3
$24.5
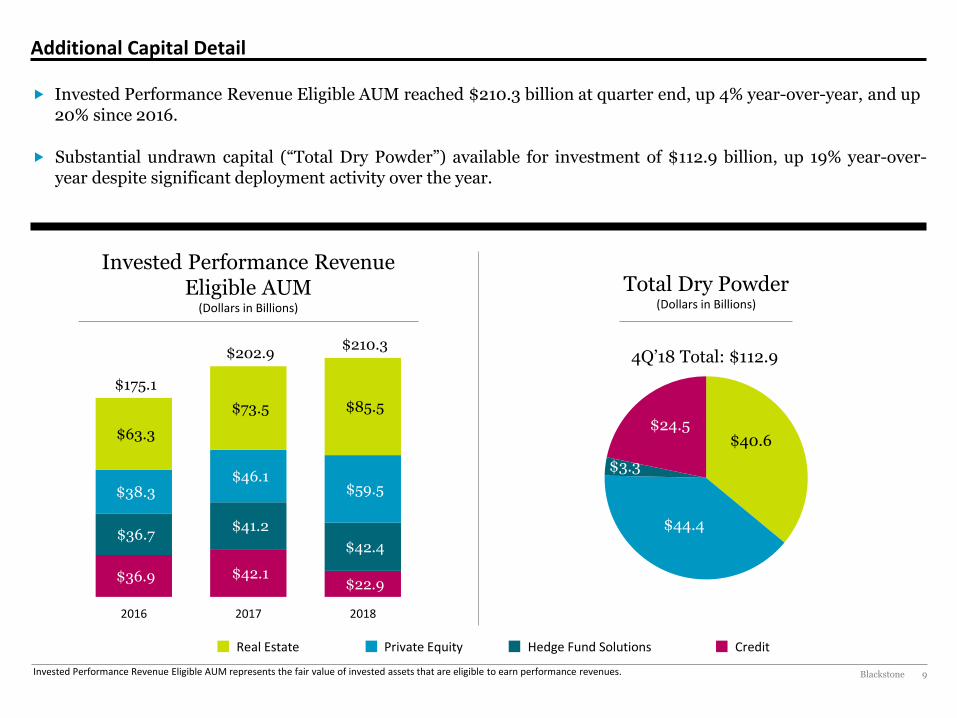
Additional Capital Detail
Invested Performance Revenue Eligible AUM reached $210.3 billion at quarter end, up 4% year-over-year, and up 20% since 2016.
Substantial undrawn capital (“Total Dry Powder”) available for investment of $112.9 billion, up 19% year-over-year despite significant deployment activity over the year.
Total Dry Powder (Dollars in Billions)
4Q’18 Total: $112.9
Invested Performance Revenue Eligible AUM
(Dollars in Billions)
Real Estate Private Equity Hedge Fund Solutions Credit
Invested Performance Revenue Eligible AUM represents the fair value of invested assets that are eligible to earn performance revenues.

Segment Highlights
Blackstone 11
184 0 92 102 0 70 0 152 195 99 206 202 201 221 3 0 103 120 0 115 99 0 171 146
Real Estate
% Change % Change
(Dollars in Thousands) 4Q'17 4Q'18 vs. 4Q'17 FY'17 FY'18 vs. FY'17
Management Fees, Net 244,064$ 317,269$ 30% 939,038$ 1,126,470$ 20%
Fee Related Performance Revenues 20,730 44,185 113% 79,500 124,502 57%
Fee Related Compensation (114,822) (109,695) (4)% (437,311) (459,430) 5%
Other Operating Expenses (38,543) (41,030) 6% (136,042) (146,260) 8%
Fee Related Earnings 111,429$ 210,729$ 89% 445,185$ 645,282$ 45%
Realized Performance Revenues 971,360 172,985 (82)% 2,141,374 914,984 (57)%
Realized Performance Compensation (363,073) (54,179) (85)% (751,526) (284,319) (62)%
Realized Principal Investment Income 34,276 11,439 (67)% 255,903 92,525 (64)%
Net Realizations 642,563 130,245 (80)% 1,645,751 723,190 (56)%
Segment Distributable Earnings 753,992$ 340,974$ (55)% 2,090,936$ 1,368,472$ (35)%
Segment Revenues 1,270,430$ 545,878$ (57)% 3,415,815$ 2,258,481$ (34)%
Total AUM 115,340,363$ 136,247,229$ 18% 115,340,363$ 136,247,229$ 18%
Fee-Earning AUM 83,984,824$ 93,252,724$ 11% 83,984,824$ 93,252,724$ 11%
Appreciation for core+ funds excludes BREIT.
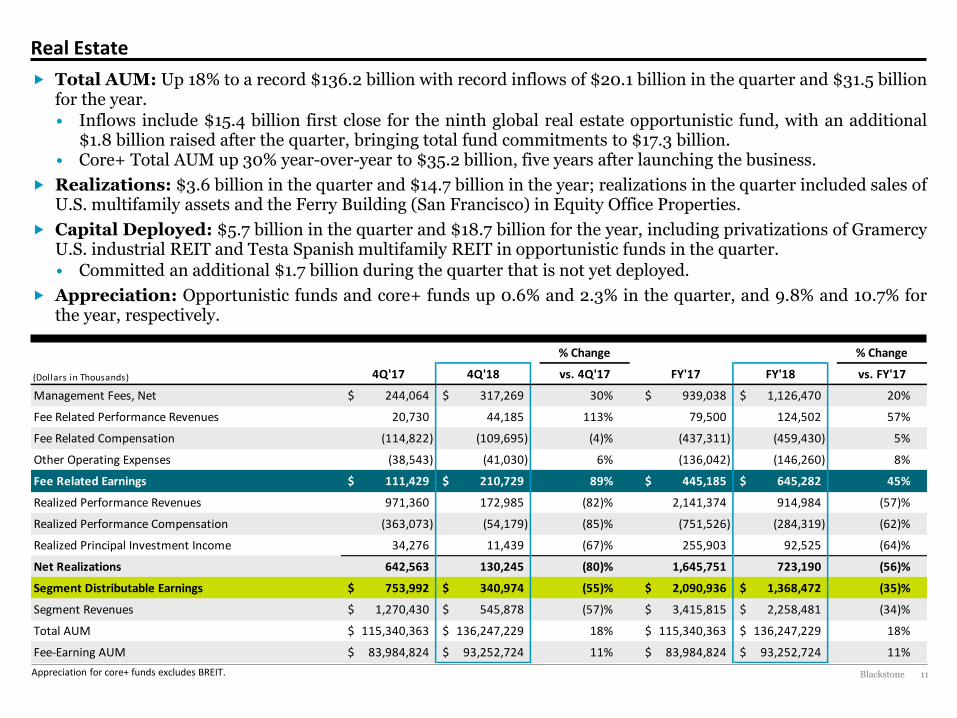
Total AUM: Up 18% to a record $136.2 billion with record inflows of $20.1 billion in the quarter and $31.5 billion for the year.
• Inflows include $15.4 billion first close for the ninth global real estate opportunistic fund, with an additional $1.8 billion raised after the quarter, bringing total fund commitments to $17.3 billion.
• Core+ Total AUM up 30% year-over-year to $35.2 billion, five years after launching the business.
Realizations: $3.6 billion in the quarter and $14.7 billion in the year; realizations in the quarter included sales of U.S. multifamily assets and the Ferry Building (San Francisco) in Equity Office Properties.
Capital Deployed: $5.7 billion in the quarter and $18.7 billion for the year, including privatizations of Gramercy U.S. industrial REIT and Testa Spanish multifamily REIT in opportunistic funds in the quarter.
• Committed an additional $1.7 billion during the quarter that is not yet deployed.
Appreciation: Opportunistic funds and core+ funds up 0.6% and 2.3% in the quarter, and 9.8% and 10.7% for the year, respectively.
Blackstone 12
184 0 92 102 0 70 0 152 195 99 206 202 201 221 3 0 103 120 0 115 99 0 171 146
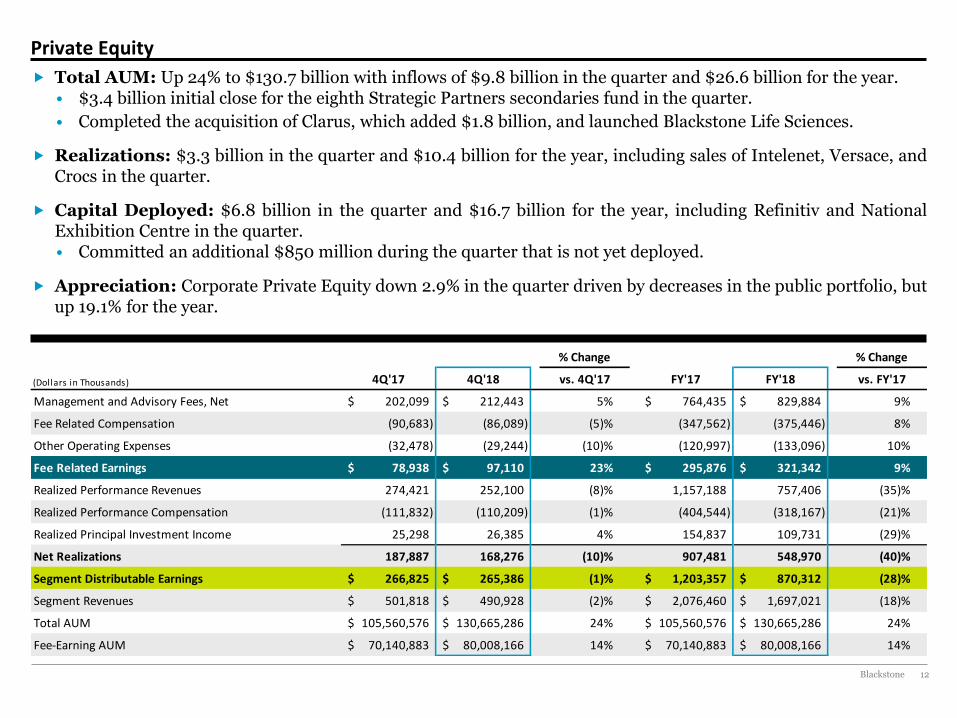
Private Equity
Total AUM: Up 24% to $130.7 billion with inflows of $9.8 billion in the quarter and $26.6 billion for the year. • $3.4 billion initial close for the eighth Strategic Partners secondaries fund in the quarter.
• Completed the acquisition of Clarus, which added $1.8 billion, and launched Blackstone Life Sciences.
Realizations: $3.3 billion in the quarter and $10.4 billion for the year, including sales of Intelenet, Versace, and Crocs in the quarter.
Capital Deployed: $6.8 billion in the quarter and $16.7 billion for the year, including Refinitiv and National Exhibition Centre in the quarter. • Committed an additional $850 million during the quarter that is not yet deployed.
Appreciation: Corporate Private Equity down 2.9% in the quarter driven by decreases in the public portfolio, but up 19.1% for the year.
% Change % Change
(Dollars in Thousands) 4Q'17 4Q'18 vs. 4Q'17 FY'17 FY'18 vs. FY'17
Management and Advisory Fees, Net 202,099$ 212,443$ 5% 764,435$ 829,884$ 9%
Fee Related Compensation (90,683) (86,089) (5)% (347,562) (375,446) 8%
Other Operating Expenses (32,478) (29,244) (10)% (120,997) (133,096) 10%
Fee Related Earnings 78,938$ 97,110$ 23% 295,876$ 321,342$ 9%
Realized Performance Revenues 274,421 252,100 (8)% 1,157,188 757,406 (35)%
Realized Performance Compensation (111,832) (110,209) (1)% (404,544) (318,167) (21)%
Realized Principal Investment Income 25,298 26,385 4% 154,837 109,731 (29)%
Net Realizations 187,887 168,276 (10)% 907,481 548,970 (40)%
Segment Distributable Earnings 266,825$ 265,386$ (1)% 1,203,357$ 870,312$ (28)%
Segment Revenues 501,818$ 490,928$ (2)% 2,076,460$ 1,697,021$ (18)%
Total AUM 105,560,576$ 130,665,286$ 24% 105,560,576$ 130,665,286$ 24%
Fee-Earning AUM 70,140,883$ 80,008,166$ 14% 70,140,883$ 80,008,166$ 14%
Blackstone 13
184 0 92 102 0 70 0 152 195 99 206 202 201 221 3 0 103 120 0 115 99 0 171 146
Hedge Fund Solutions
BPS Composite net returns were (2.4)% and 1.2% for 4Q’18 and FY’18, respectively.
% Change % Change
(Dollars in Thousands) 4Q'17 4Q'18 vs. 4Q'17 FY'17 FY'18 vs. FY'17
Management Fees, Net 130,384$ 132,611$ 2% 518,935$ 522,869$ 1%
Fee Related Compensation (32,331) (38,557) 19% (146,924) (162,172) 10%
Other Operating Expenses (17,610) (19,740) 12% (68,265) (77,772) 14%
Fee Related Earnings 80,443$ 74,314$ (8)% 303,746$ 282,925$ (7)%
Realized Performance Revenues 118,447 20,987 (82)% 154,343 42,419 (73)%
Realized Performance Compensation (30,940) (14,401) (53)% (40,707) (21,792) (46)%
Realized Principal Investment Income 8,165 6,609 (19)% 9,074 17,039 88%
Net Realizations 95,672 13,195 (86)% 122,710 37,666 (69)%
Segment Distributable Earnings 176,115$ 87,509$ (50)% 426,456$ 320,591$ (25)%
Segment Revenues 256,996$ 160,207$ (38)% 682,352$ 582,327$ (15)%
Total AUM 75,090,834$ 77,814,516$ 4% 75,090,834$ 77,814,516$ 4%
Fee-Earning AUM 69,914,061$ 72,280,606$ 3% 69,914,061$ 72,280,606$ 3%
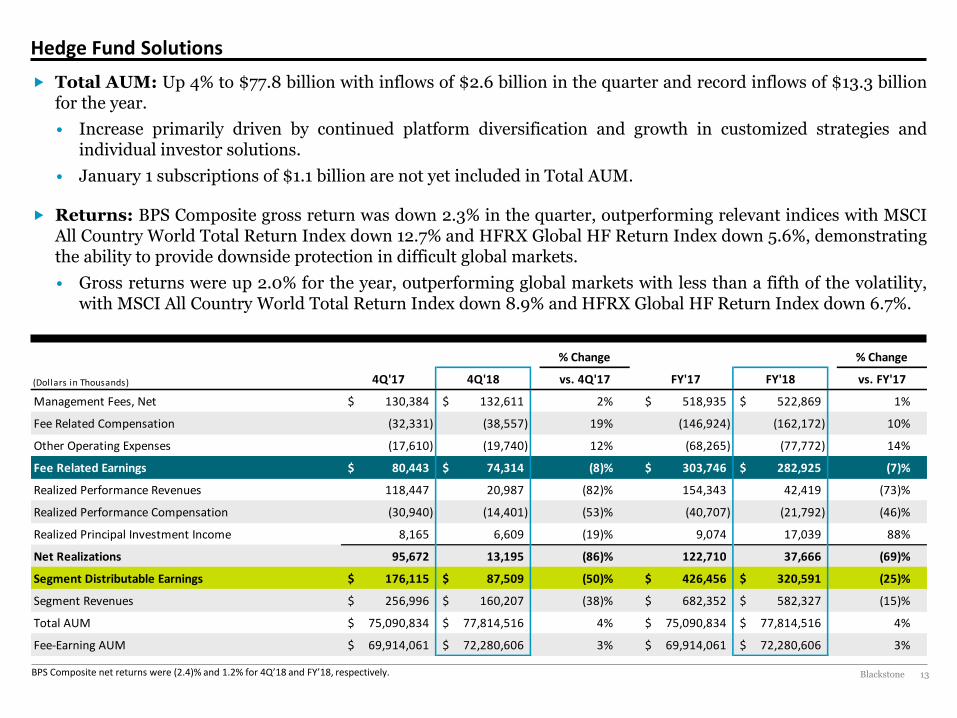
Total AUM: Up 4% to $77.8 billion with inflows of $2.6 billion in the quarter and record inflows of $13.3 billion for the year.
• Increase primarily driven by continued platform diversification and growth in customized strategies and individual investor solutions.
• January 1 subscriptions of $1.1 billion are not yet included in Total AUM.
Returns: BPS Composite gross return was down 2.3% in the quarter, outperforming relevant indices with MSCI All Country World Total Return Index down 12.7% and HFRX Global HF Return Index down 5.6%, demonstrating the ability to provide downside protection in difficult global markets.
• Gross returns were up 2.0% for the year, outperforming global markets with less than a fifth of the volatility, with MSCI All Country World Total Return Index down 8.9% and HFRX Global HF Return Index down 6.7%.
Blackstone 14
184 0 92 102 0 70 0 152 195 99 206 202 201 221 3 0 103 120 0 115 99 0 171 146
Credit
% Change % Change
(Dollars in Thousands) 4Q'17 4Q'18 vs. 4Q'17 FY'17 FY'18 vs. FY'17
Management Fees, Net 155,845$ 135,872$ (13)% 548,383$ 557,229$ 2%
Fee Related Performance Revenues 27,359 - (100)% 89,945 (666) n/m
Fee Related Compensation (74,197) (44,943) (39)% (253,842) (219,098) (14)%
Other Operating Expenses (27,318) (40,011) 46% (99,562) (131,200) 32%
Fee Related Earnings 81,689$ 50,918$ (38)% 284,924$ 206,265$ (28)%
Realized Performance Revenues 132,570 37,625 (72)% 194,902 96,962 (50)%
Realized Performance Compensation (67,454) (20,856) (69)% (100,834) (53,863) (47)%
Realized Principal Investment Income 4,486 2,665 (41)% 16,380 16,763 2%
Net Realizations 69,602 19,434 (72)% 110,448 59,862 (46)%
Segment Distributable Earnings 151,291$ 70,352$ (53)% 395,372$ 266,127$ (33)%
Segment Revenues 320,260$ 176,162$ (45)% 849,610$ 670,288$ (21)%
Total AUM 138,136,470$ 127,515,286$ (8)% 138,136,470$ 127,515,286$ (8)%
Fee-Earning AUM 111,304,230$ 96,986,011$ (13)% 111,304,230$ 96,986,011$ (13)%
Performing Credit includes mezzanine lending funds, middle market direct lending funds and other performing credit strategy funds. Distressed Strategies include credit alpha strategies, stressed / distressed funds and energy strategies. The composite gross returns represent a weighted‐average composite of the fee‐earning funds exceeding $100 million of fair value at each respective quarter end for each strategy. Composite gross returns exclude the Blackstone Funds that were contributed to GSO as part of Blackstone’s acquisition of GSO in March 2008. Performing Credit net composite returns were (0.6)% and 5.9% for 4Q’18 and FY’18. Distressed Strategies’ net composite returns were (5.9)% and (3.4)% for 4Q’18 and FY’18.
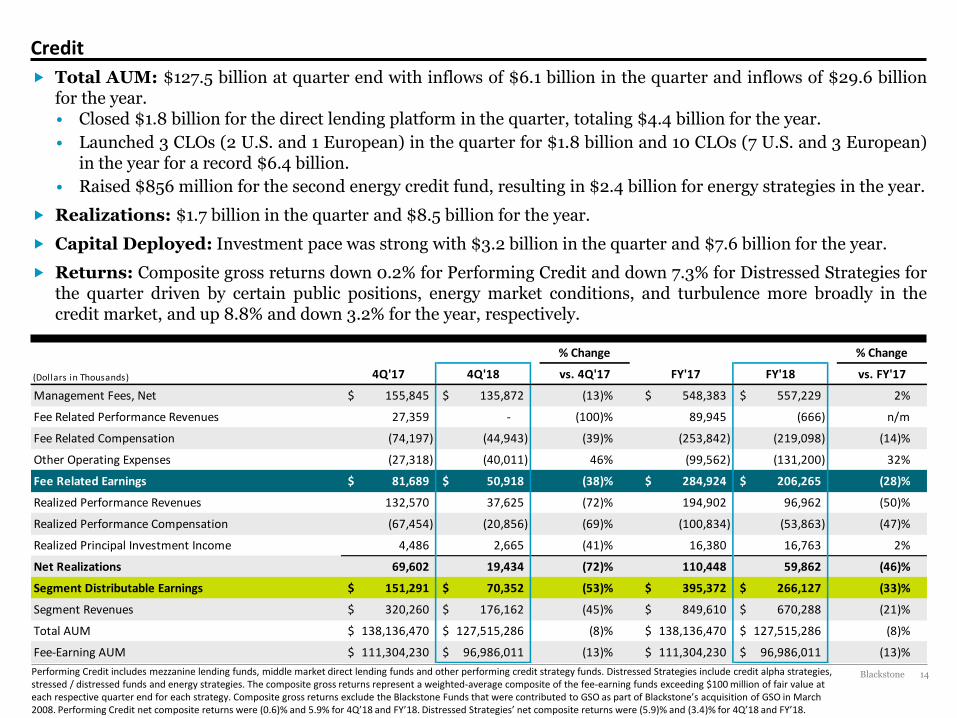
Total AUM: $127.5 billion at quarter end with inflows of $6.1 billion in the quarter and inflows of $29.6 billion for the year. • Closed $1.8 billion for the direct lending platform in the quarter, totaling $4.4 billion for the year.
• Launched 3 CLOs (2 U.S. and 1 European) in the quarter for $1.8 billion and 10 CLOs (7 U.S. and 3 European) in the year for a record $6.4 billion.
• Raised $856 million for the second energy credit fund, resulting in $2.4 billion for energy strategies in the year.
Realizations: $1.7 billion in the quarter and $8.5 billion for the year.
Capital Deployed: Investment pace was strong with $3.2 billion in the quarter and $7.6 billion for the year.
Returns: Composite gross returns down 0.2% for Performing Credit and down 7.3% for Distressed Strategies for the quarter driven by certain public positions, energy market conditions, and turbulence more broadly in the credit market, and up 8.8% and down 3.2% for the year, respectively.

Supplemental Details
Blackstone 16
184 0 92 102 0 70 0 152 195 99 206 202 201 221 3 0 103 120 0 115 99 0 171 146
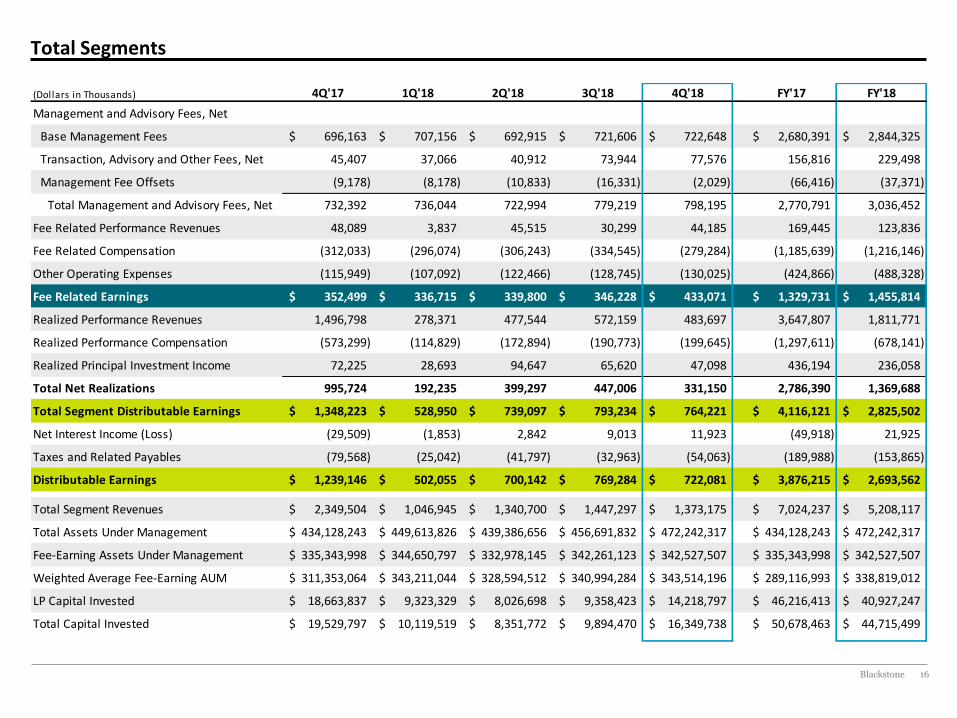
Total Segments
(Dollars in Thousands) 4Q'17 1Q'18 2Q'18 3Q'18 4Q'18 FY'17 FY'18
Management and Advisory Fees, Net
Base Management Fees 696,163$ 707,156$ 692,915$ 721,606$ 722,648$ 2,680,391$ 2,844,325$
Transaction, Advisory and Other Fees, Net 45,407 37,066 40,912 73,944 77,576 156,816 229,498
Management Fee Offsets (9,178) (8,178) (10,833) (16,331) (2,029) (66,416) (37,371)
Total Management and Advisory Fees, Net 732,392 736,044 722,994 779,219 798,195 2,770,791 3,036,452
Fee Related Performance Revenues 48,089 3,837 45,515 30,299 44,185 169,445 123,836
Fee Related Compensation (312,033) (296,074) (306,243) (334,545) (279,284) (1,185,639) (1,216,146)
Other Operating Expenses (115,949) (107,092) (122,466) (128,745) (130,025) (424,866) (488,328)
Fee Related Earnings 352,499$ 336,715$ 339,800$ 346,228$ 433,071$ 1,329,731$ 1,455,814$
Realized Performance Revenues 1,496,798 278,371 477,544 572,159 483,697 3,647,807 1,811,771
Realized Performance Compensation (573,299) (114,829) (172,894) (190,773) (199,645) (1,297,611) (678,141)
Realized Principal Investment Income 72,225 28,693 94,647 65,620 47,098 436,194 236,058
Total Net Realizations 995,724 192,235 399,297 447,006 331,150 2,786,390 1,369,688
Total Segment Distributable Earnings 1,348,223$ 528,950$ 739,097$ 793,234$ 764,221$ 4,116,121$ 2,825,502$
Net Interest Income (Loss) (29,509) (1,853) 2,842 9,013 11,923 (49,918) 21,925
Taxes and Related Payables (79,568) (25,042) (41,797) (32,963) (54,063) (189,988) (153,865)
Distributable Earnings 1,239,146$ 502,055$ 700,142$ 769,284$ 722,081$ 3,876,215$ 2,693,562$
Total Segment Revenues 2,349,504$ 1,046,945$ 1,340,700$ 1,447,297$ 1,373,175$ 7,024,237$ 5,208,117$
Total Assets Under Management 434,128,243$ 449,613,826$ 439,386,656$ 456,691,832$ 472,242,317$ 434,128,243$ 472,242,317$
Fee-Earning Assets Under Management 335,343,998$ 344,650,797$ 332,978,145$ 342,261,123$ 342,527,507$ 335,343,998$ 342,527,507$
Weighted Average Fee-Earning AUM 311,353,064$ 343,211,044$ 328,594,512$ 340,994,284$ 343,514,196$ 289,116,993$ 338,819,012$
LP Capital Invested 18,663,837$ 9,323,329$ 8,026,698$ 9,358,423$ 14,218,797$ 46,216,413$ 40,927,247$
Total Capital Invested 19,529,797$ 10,119,519$ 8,351,772$ 9,894,470$ 16,349,738$ 50,678,463$ 44,715,499$
Blackstone 17
184 0 92 102 0 70 0 152 195 99 206 202 201 221 3 0 103 120 0 115 99 0 171 146
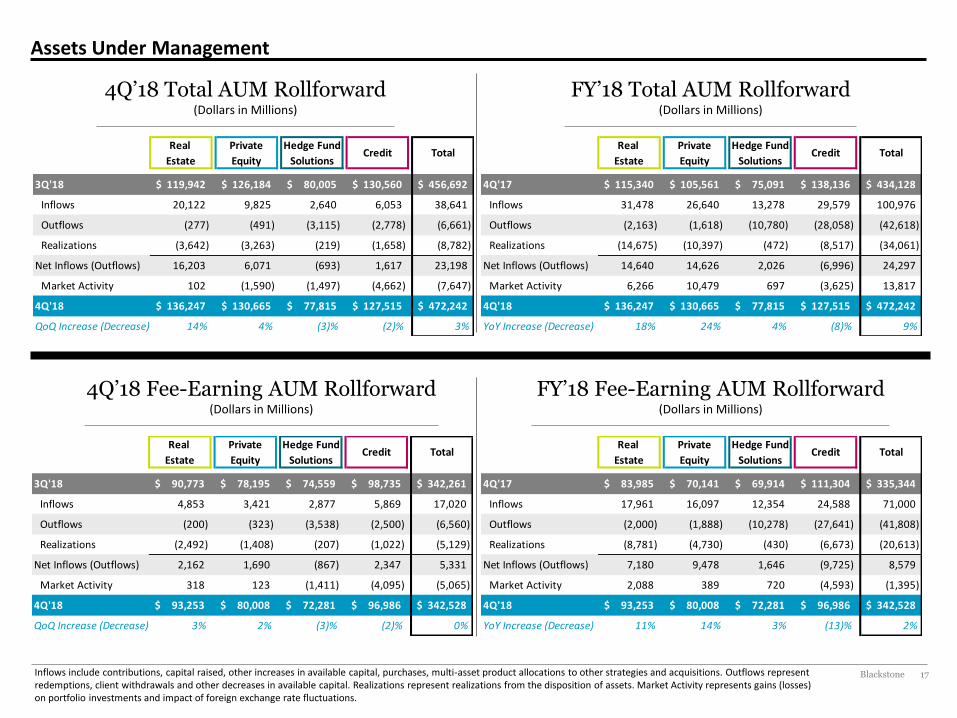
4Q’18 Total AUM Rollforward (Dollars in Millions)
FY’18 Total AUM Rollforward (Dollars in Millions)
Inflows include contributions, capital raised, other increases in available capital, purchases, multi-asset product allocations to other strategies and acquisitions. Outflows represent redemptions, client withdrawals and other decreases in available capital. Realizations represent realizations from the disposition of assets. Market Activity represents gains (losses) on portfolio investments and impact of foreign exchange rate fluctuations.
Assets Under Management
Real Private Hedge Fund
Estate Equity Solutions
3Q'18 119,942$ 126,184$ 80,005$ 130,560$ 456,692$
Inflows 20,122 9,825 2,640 6,053 38,641
Outflows (277) (491) (3,115) (2,778) (6,661)
Realizations (3,642) (3,263) (219) (1,658) (8,782)
Net Inflows (Outflows) 16,203 6,071 (693) 1,617 23,198
Market Activity 102 (1,590) (1,497) (4,662) (7,647)
4Q'18 136,247$ 130,665$ 77,815$ 127,515$ 472,242$
QoQ Increase (Decrease) 14% 4% (3)% (2)% 3%
Credit TotalReal Private Hedge Fund
Estate Equity Solutions
4Q'17 115,340$ 105,561$ 75,091$ 138,136$ 434,128$
Inflows 31,478 26,640 13,278 29,579 100,976
Outflows (2,163) (1,618) (10,780) (28,058) (42,618)
Realizations (14,675) (10,397) (472) (8,517) (34,061)
Net Inflows (Outflows) 14,640 14,626 2,026 (6,996) 24,297
Market Activity 6,266 10,479 697 (3,625) 13,817
4Q'18 136,247$ 130,665$ 77,815$ 127,515$ 472,242$
YoY Increase (Decrease) 18% 24% 4% (8)% 9%
Credit Total
4Q’18 Fee-Earning AUM Rollforward (Dollars in Millions)
FY’18 Fee-Earning AUM Rollforward (Dollars in Millions)
Real Private Hedge Fund
Estate Equity Solutions
3Q'18 90,773$ 78,195$ 74,559$ 98,735$ 342,261$
Inflows 4,853 3,421 2,877 5,869 17,020
Outflows (200) (323) (3,538) (2,500) (6,560)
Realizations (2,492) (1,408) (207) (1,022) (5,129)
Net Inflows (Outflows) 2,162 1,690 (867) 2,347 5,331
Market Activity 318 123 (1,411) (4,095) (5,065)
4Q'18 93,253$ 80,008$ 72,281$ 96,986$ 342,528$
QoQ Increase (Decrease) 3% 2% (3)% (2)% 0%
Credit TotalReal Private Hedge Fund
Estate Equity Solutions
4Q'17 83,985$ 70,141$ 69,914$ 111,304$ 335,344$
Inflows 17,961 16,097 12,354 24,588 71,000
Outflows (2,000) (1,888) (10,278) (27,641) (41,808)
Realizations (8,781) (4,730) (430) (6,673) (20,613)
Net Inflows (Outflows) 7,180 9,478 1,646 (9,725) 8,579
Market Activity 2,088 389 720 (4,593) (1,395)
4Q'18 93,253$ 80,008$ 72,281$ 96,986$ 342,528$
YoY Increase (Decrease) 11% 14% 3% (13)% 2%
Credit Total
Blackstone 18
184 0 92 102 0 70 0 152 195 99 206 202 201 221 3 0 103 120 0 115 99 0 171 146
$8.67 $8.45
4Q'17 4Q'18
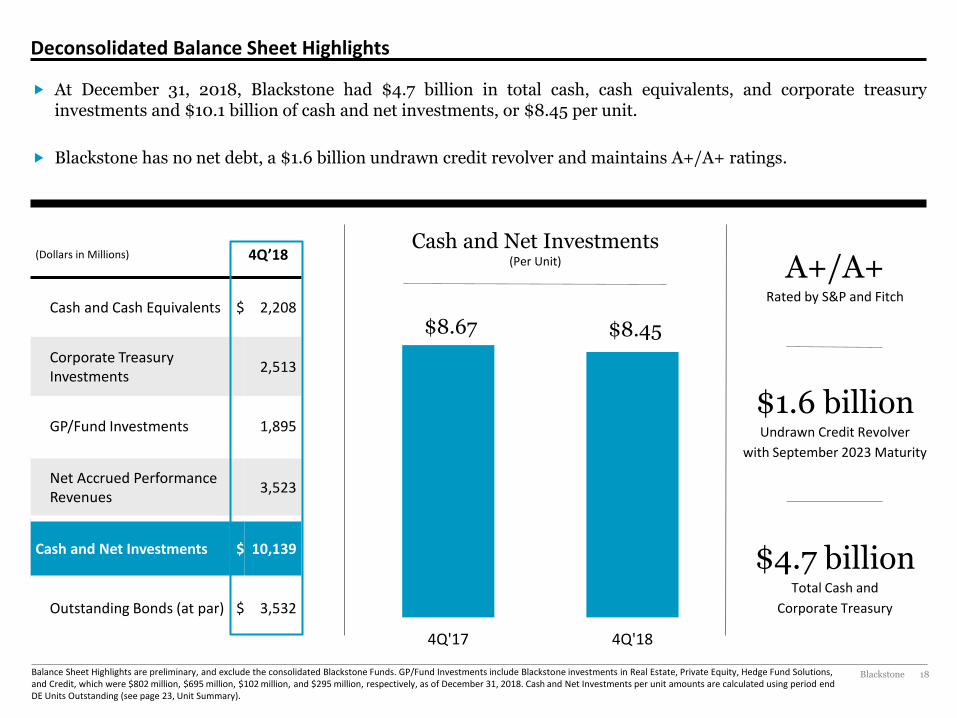
At December 31, 2018, Blackstone had $4.7 billion in total cash, cash equivalents, and corporate treasury investments and $10.1 billion of cash and net investments, or $8.45 per unit.
Blackstone has no net debt, a $1.6 billion undrawn credit revolver and maintains A+/A+ ratings.
Deconsolidated Balance Sheet Highlights
Balance Sheet Highlights are preliminary, and exclude the consolidated Blackstone Funds. GP/Fund Investments include Blackstone investments in Real Estate, Private Equity, Hedge Fund Solutions, and Credit, which were $802 million, $695 million, $102 million, and $295 million, respectively, as of December 31, 2018. Cash and Net Investments per unit amounts are calculated using period end DE Units Outstanding (see page 23, Unit Summary).
A+/A+ Rated by S&P and Fitch
$1.6 billion Undrawn Credit Revolver
with September 2023 Maturity
$4.7 billion Total Cash and
Corporate Treasury
Cash and Net Investments (Per Unit) (Dollars in Millions) 4Q’18
Cash and Cash Equivalents $ 2,208
Corporate Treasury Investments
2,513
GP/Fund Investments 1,895
Net Accrued Performance Revenues
3,523
Cash and Net Investments $ 10,139
Outstanding Bonds (at par) $ 3,532
Blackstone 19
184 0 92 102 0 70 0 152 195 99 206 202 201 221 3 0 103 120 0 115 99 0 171 146
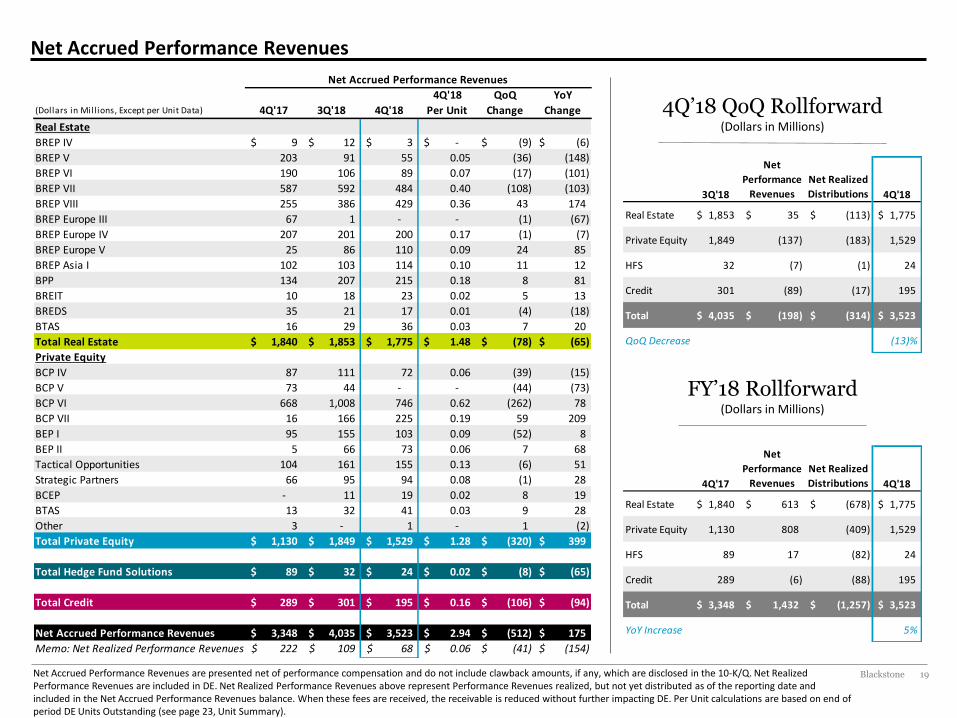
Net Accrued Performance Revenues
Net Accrued Performance Revenues are presented net of performance compensation and do not include clawback amounts, if any, which are disclosed in the 10-K/Q. Net Realized Performance Revenues are included in DE. Net Realized Performance Revenues above represent Performance Revenues realized, but not yet distributed as of the reporting date and included in the Net Accrued Performance Revenues balance. When these fees are received, the receivable is reduced without further impacting DE. Per Unit calculations are based on end of period DE Units Outstanding (see page 23, Unit Summary).
Net Accrued Performance Revenues
(Dollars in Mill ions, Except per Unit Data) 4Q'17 3Q'18 4Q'18
4Q'18
Per Unit
QoQ
Change
YoY
Change
Real Estate
BREP IV 9$ 12$ 3$ -$ (9)$ (6)$
BREP V 203 91 55 0.05 (36) (148)
BREP VI 190 106 89 0.07 (17) (101)
BREP VII 587 592 484 0.40 (108) (103)
BREP VIII 255 386 429 0.36 43 174
BREP Europe III 67 1 - - (1) (67)
BREP Europe IV 207 201 200 0.17 (1) (7)
BREP Europe V 25 86 110 0.09 24 85
BREP Asia I 102 103 114 0.10 11 12
BPP 134 207 215 0.18 8 81
BREIT 10 18 23 0.02 5 13
BREDS 35 21 17 0.01 (4) (18)
BTAS 16 29 36 0.03 7 20
Total Real Estate 1,840$ 1,853$ 1,775$ 1.48$ (78)$ (65)$
Private Equity
BCP IV 87 111 72 0.06 (39) (15)
BCP V 73 44 - - (44) (73)
BCP VI 668 1,008 746 0.62 (262) 78
BCP VII 16 166 225 0.19 59 209
BEP I 95 155 103 0.09 (52) 8
BEP II 5 66 73 0.06 7 68
Tactical Opportunities 104 161 155 0.13 (6) 51
Strategic Partners 66 95 94 0.08 (1) 28
BCEP - 11 19 0.02 8 19
BTAS 13 32 41 0.03 9 28
Other 3 - 1 - 1 (2)
Total Private Equity 1,130$ 1,849$ 1,529$ 1.28$ (320)$ 399$
Total Hedge Fund Solutions 89$ 32$ 24$ 0.02$ (8)$ (65)$
Total Credit 289$ 301$ 195$ 0.16$ (106)$ (94)$
Net Accrued Performance Revenues 3,348$ 4,035$ 3,523$ 2.94$ (512)$ 175$
Memo: Net Realized Performance Revenues 222$ 109$ 68$ 0.06$ (41)$ (154)$
4Q’18 QoQ Rollforward (Dollars in Millions)
FY’18 Rollforward (Dollars in Millions)
3Q'18
Net
Performance
Revenues
Net Realized
Distributions 4Q'18
Real Estate 1,853$ 35$ (113)$ 1,775$
Private Equity 1,849 (137) (183) 1,529
HFS 32 (7) (1) 24
Credit 301 (89) (17) 195
Total 4,035$ (198)$ (314)$ 3,523$
QoQ Decrease (13)%
4Q'17
Net
Performance
Revenues
Net Realized
Distributions 4Q'18
Real Estate 1,840$ 613$ (678)$ 1,775$
Private Equity 1,130 808 (409) 1,529
HFS 89 17 (82) 24
Credit 289 (6) (88) 195
Total 3,348$ 1,432$ (1,257)$ 3,523$
YoY Increase 5%
Blackstone 20
184 0 92 102 0 70 0 152 195 99 206 202 201 221 3 0 103 120 0 115 99 0 171 146
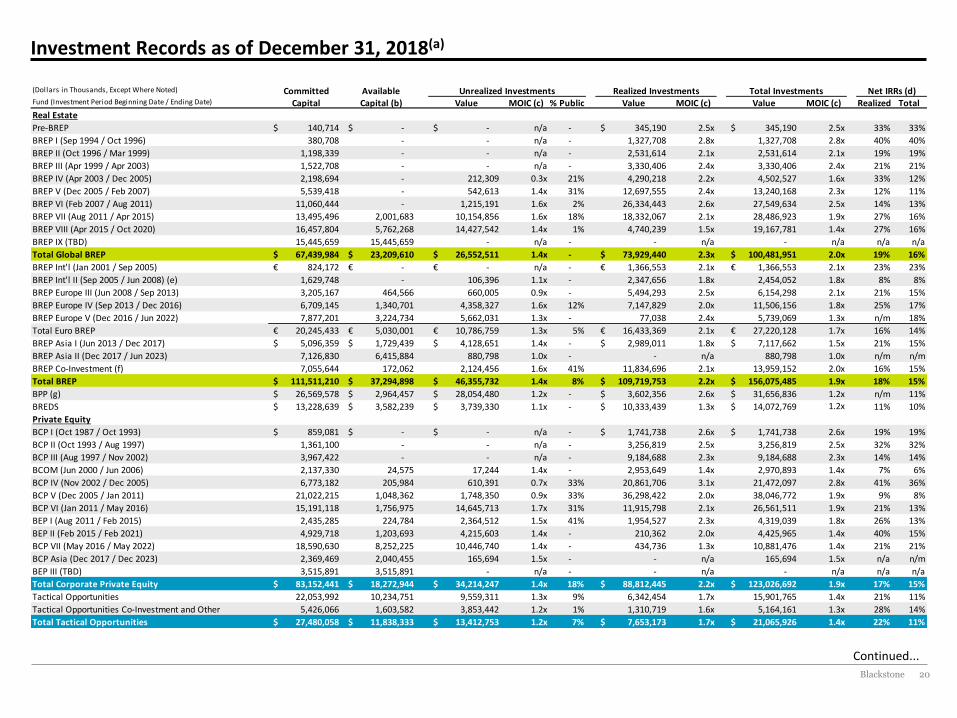
Investment Records as of December 31, 2018(a)
(Dollars in Thousands, Except Where Noted) Committed Available Unrealized Investments Realized Investments Total Investments Net IRRs (d)Fund (Investment Period Beginning Date / Ending Date) Capital Capital (b) Value MOIC (c) % Public Value MOIC (c) Value MOIC (c) Realized TotalReal Estate
Pre-BREP 140,714$ -$ -$ n/a - 345,190$ 2.5x 345,190$ 2.5x 33% 33%
BREP I (Sep 1994 / Oct 1996) 380,708 - - n/a - 1,327,708 2.8x 1,327,708 2.8x 40% 40%
BREP II (Oct 1996 / Mar 1999) 1,198,339 - - n/a - 2,531,614 2.1x 2,531,614 2.1x 19% 19%
BREP III (Apr 1999 / Apr 2003) 1,522,708 - - n/a - 3,330,406 2.4x 3,330,406 2.4x 21% 21%
BREP IV (Apr 2003 / Dec 2005) 2,198,694 - 212,309 0.3x 21% 4,290,218 2.2x 4,502,527 1.6x 33% 12%
BREP V (Dec 2005 / Feb 2007) 5,539,418 - 542,613 1.4x 31% 12,697,555 2.4x 13,240,168 2.3x 12% 11%
BREP VI (Feb 2007 / Aug 2011) 11,060,444 - 1,215,191 1.6x 2% 26,334,443 2.6x 27,549,634 2.5x 14% 13%
BREP VII (Aug 2011 / Apr 2015) 13,495,496 2,001,683 10,154,856 1.6x 18% 18,332,067 2.1x 28,486,923 1.9x 27% 16%
BREP VIII (Apr 2015 / Oct 2020) 16,457,804 5,762,268 14,427,542 1.4x 1% 4,740,239 1.5x 19,167,781 1.4x 27% 16%
BREP IX (TBD) 15,445,659 15,445,659 - n/a - - n/a - n/a n/a n/a
Total Global BREP 67,439,984$ 23,209,610$ 26,552,511$ 1.4x - 73,929,440$ 2.3x 100,481,951$ 2.0x 19% 16%
BREP Int'l (Jan 2001 / Sep 2005) 824,172€ -€ -€ n/a - 1,366,553€ 2.1x 1,366,553€ 2.1x 23% 23%
BREP Int'l II (Sep 2005 / Jun 2008) (e) 1,629,748 - 106,396 1.1x - 2,347,656 1.8x 2,454,052 1.8x 8% 8%
BREP Europe III (Jun 2008 / Sep 2013) 3,205,167 464,566 660,005 0.9x - 5,494,293 2.5x 6,154,298 2.1x 21% 15%
BREP Europe IV (Sep 2013 / Dec 2016) 6,709,145 1,340,701 4,358,327 1.6x 12% 7,147,829 2.0x 11,506,156 1.8x 25% 17%
BREP Europe V (Dec 2016 / Jun 2022) 7,877,201 3,224,734 5,662,031 1.3x - 77,038 2.4x 5,739,069 1.3x n/m 18%
Total Euro BREP 20,245,433€ 5,030,001€ 10,786,759€ 1.3x 5% 16,433,369€ 2.1x 27,220,128€ 1.7x 16% 14%
BREP Asia I (Jun 2013 / Dec 2017) 5,096,359$ 1,729,439$ 4,128,651$ 1.4x - 2,989,011$ 1.8x 7,117,662$ 1.5x 21% 15%
BREP Asia II (Dec 2017 / Jun 2023) 7,126,830 6,415,884 880,798 1.0x - - n/a 880,798 1.0x n/m n/m
BREP Co-Investment (f) 7,055,644 172,062 2,124,456 1.6x 41% 11,834,696 2.1x 13,959,152 2.0x 16% 15%
Total BREP 111,511,210$ 37,294,898$ 46,355,732$ 1.4x 8% 109,719,753$ 2.2x 156,075,485$ 1.9x 18% 15%
BPP (g) 26,569,578$ 2,964,457$ 28,054,480$ 1.2x - 3,602,356$ 2.6x 31,656,836$ 1.2x n/m 11%
BREDS 13,228,639$ 3,582,239$ 3,739,330$ 1.1x - 10,333,439$ 1.3x 14,072,769$ 1.2x 11% 10%
Private Equity
BCP I (Oct 1987 / Oct 1993) 859,081$ -$ -$ n/a - 1,741,738$ 2.6x 1,741,738$ 2.6x 19% 19%
BCP II (Oct 1993 / Aug 1997) 1,361,100 - - n/a - 3,256,819 2.5x 3,256,819 2.5x 32% 32%
BCP III (Aug 1997 / Nov 2002) 3,967,422 - - n/a - 9,184,688 2.3x 9,184,688 2.3x 14% 14%
BCOM (Jun 2000 / Jun 2006) 2,137,330 24,575 17,244 1.4x - 2,953,649 1.4x 2,970,893 1.4x 7% 6%
BCP IV (Nov 2002 / Dec 2005) 6,773,182 205,984 610,391 0.7x 33% 20,861,706 3.1x 21,472,097 2.8x 41% 36%
BCP V (Dec 2005 / Jan 2011) 21,022,215 1,048,362 1,748,350 0.9x 33% 36,298,422 2.0x 38,046,772 1.9x 9% 8%
BCP VI (Jan 2011 / May 2016) 15,191,118 1,756,975 14,645,713 1.7x 31% 11,915,798 2.1x 26,561,511 1.9x 21% 13%
BEP I (Aug 2011 / Feb 2015) 2,435,285 224,784 2,364,512 1.5x 41% 1,954,527 2.3x 4,319,039 1.8x 26% 13%
BEP II (Feb 2015 / Feb 2021) 4,929,718 1,203,693 4,215,603 1.4x - 210,362 2.0x 4,425,965 1.4x 40% 15%
BCP VII (May 2016 / May 2022) 18,590,630 8,252,225 10,446,740 1.4x - 434,736 1.3x 10,881,476 1.4x 21% 21%
BCP Asia (Dec 2017 / Dec 2023) 2,369,469 2,040,455 165,694 1.5x - - n/a 165,694 1.5x n/a n/m
BEP III (TBD) 3,515,891 3,515,891 - n/a - - n/a - n/a n/a n/a
Total Corporate Private Equity 83,152,441$ 18,272,944$ 34,214,247$ 1.4x 18% 88,812,445$ 2.2x 123,026,692$ 1.9x 17% 15%
Tactical Opportunities 22,053,992 10,234,751 9,559,311 1.3x 9% 6,342,454 1.7x 15,901,765 1.4x 21% 11%
Tactical Opportunities Co-Investment and Other 5,426,066 1,603,582 3,853,442 1.2x 1% 1,310,719 1.6x 5,164,161 1.3x 28% 14%
Total Tactical Opportunities 27,480,058$ 11,838,333$ 13,412,753$ 1.2x 7% 7,653,173$ 1.7x 21,065,926$ 1.4x 22% 11%
Continued...
Blackstone 21
184 0 92 102 0 70 0 152 195 99 206 202 201 221 3 0 103 120 0 115 99 0 171 146
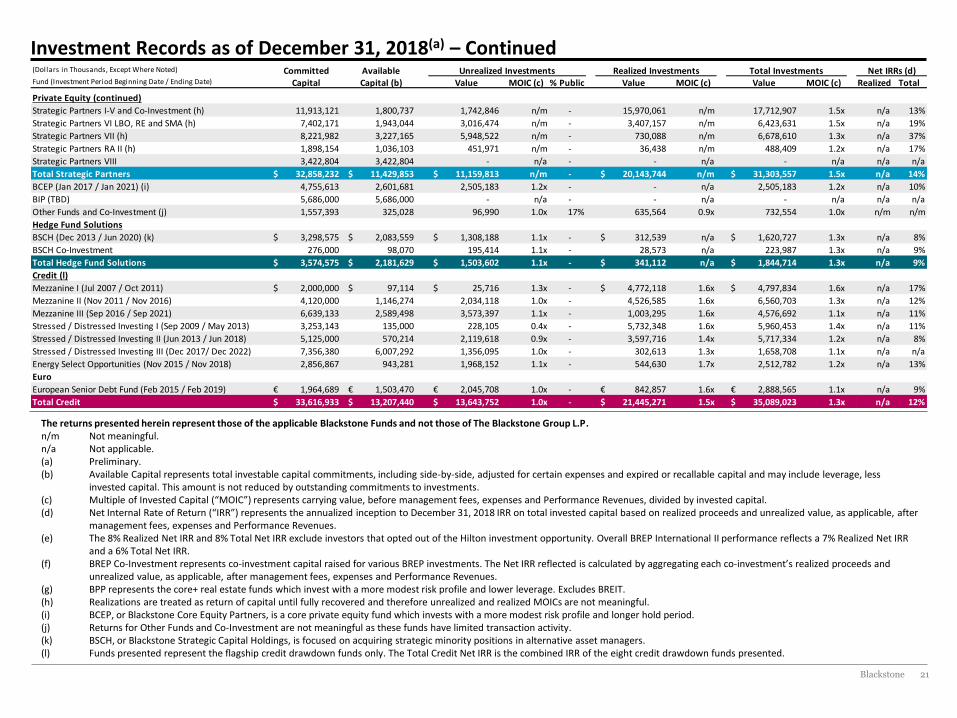
(Dollars in Thousands, Except Where Noted) Committed Available Unrealized Investments Realized Investments Total Investments Net IRRs (d)Fund (Investment Period Beginning Date / Ending Date) Capital Capital (b) Value MOIC (c) % Public Value MOIC (c) Value MOIC (c) Realized Total
Private Equity (continued)
Strategic Partners I-V and Co-Investment (h) 11,913,121 1,800,737 1,742,846 n/m - 15,970,061 n/m 17,712,907 1.5x n/a 13%
Strategic Partners VI LBO, RE and SMA (h) 7,402,171 1,943,044 3,016,474 n/m - 3,407,157 n/m 6,423,631 1.5x n/a 19%
Strategic Partners VII (h) 8,221,982 3,227,165 5,948,522 n/m - 730,088 n/m 6,678,610 1.3x n/a 37%
Strategic Partners RA II (h) 1,898,154 1,036,103 451,971 n/m - 36,438 n/m 488,409 1.2x n/a 17%
Strategic Partners VIII 3,422,804 3,422,804 - n/a - - n/a - n/a n/a n/a
Total Strategic Partners 32,858,232$ 11,429,853$ 11,159,813$ n/m - 20,143,744$ n/m 31,303,557$ 1.5x n/a 14%
BCEP (Jan 2017 / Jan 2021) (i) 4,755,613 2,601,681 2,505,183 1.2x - - n/a 2,505,183 1.2x n/a 10%
BIP (TBD) 5,686,000 5,686,000 - n/a - - n/a - n/a n/a n/a
Other Funds and Co-Investment (j) 1,557,393 325,028 96,990 1.0x 17% 635,564 0.9x 732,554 1.0x n/m n/m
Hedge Fund Solutions
BSCH (Dec 2013 / Jun 2020) (k) 3,298,575$ 2,083,559$ 1,308,188$ 1.1x - 312,539$ n/a 1,620,727$ 1.3x n/a 8%
BSCH Co-Investment 276,000 98,070 195,414 1.1x - 28,573 n/a 223,987 1.3x n/a 9%
Total Hedge Fund Solutions 3,574,575$ 2,181,629$ 1,503,602$ 1.1x - 341,112$ n/a 1,844,714$ 1.3x n/a 9%
Credit (l)
Mezzanine I (Jul 2007 / Oct 2011) 2,000,000$ 97,114$ 25,716$ 1.3x - 4,772,118$ 1.6x 4,797,834$ 1.6x n/a 17%
Mezzanine II (Nov 2011 / Nov 2016) 4,120,000 1,146,274 2,034,118 1.0x - 4,526,585 1.6x 6,560,703 1.3x n/a 12%
Mezzanine III (Sep 2016 / Sep 2021) 6,639,133 2,589,498 3,573,397 1.1x - 1,003,295 1.6x 4,576,692 1.1x n/a 11%
Stressed / Distressed Investing I (Sep 2009 / May 2013) 3,253,143 135,000 228,105 0.4x - 5,732,348 1.6x 5,960,453 1.4x n/a 11%
Stressed / Distressed Investing II (Jun 2013 / Jun 2018) 5,125,000 570,214 2,119,618 0.9x - 3,597,716 1.4x 5,717,334 1.2x n/a 8%
Stressed / Distressed Investing III (Dec 2017/ Dec 2022) 7,356,380 6,007,292 1,356,095 1.0x - 302,613 1.3x 1,658,708 1.1x n/a n/a
Energy Select Opportunities (Nov 2015 / Nov 2018) 2,856,867 943,281 1,968,152 1.1x - 544,630 1.7x 2,512,782 1.2x n/a 13%
Euro
European Senior Debt Fund (Feb 2015 / Feb 2019) 1,964,689€ 1,503,470€ 2,045,708€ 1.0x - 842,857€ 1.6x 2,888,565€ 1.1x n/a 9%
Total Credit 33,616,933$ 13,207,440$ 13,643,752$ 1.0x - 21,445,271$ 1.5x 35,089,023$ 1.3x n/a 12%
Investment Records as of December 31, 2018(a) – Continued
The returns presented herein represent those of the applicable Blackstone Funds and not those of The Blackstone Group L.P. n/m Not meaningful. n/a Not applicable. (a) Preliminary. (b) Available Capital represents total investable capital commitments, including side-by-side, adjusted for certain expenses and expired or recallable capital and may include leverage, less
invested capital. This amount is not reduced by outstanding commitments to investments. (c) Multiple of Invested Capital (“MOIC”) represents carrying value, before management fees, expenses and Performance Revenues, divided by invested capital. (d) Net Internal Rate of Return (“IRR”) represents the annualized inception to December 31, 2018 IRR on total invested capital based on realized proceeds and unrealized value, as applicable, after
management fees, expenses and Performance Revenues. (e) The 8% Realized Net IRR and 8% Total Net IRR exclude investors that opted out of the Hilton investment opportunity. Overall BREP International II performance reflects a 7% Realized Net IRR
and a 6% Total Net IRR. (f) BREP Co-Investment represents co-investment capital raised for various BREP investments. The Net IRR reflected is calculated by aggregating each co-investment’s realized proceeds and
unrealized value, as applicable, after management fees, expenses and Performance Revenues. (g) BPP represents the core+ real estate funds which invest with a more modest risk profile and lower leverage. Excludes BREIT. (h) Realizations are treated as return of capital until fully recovered and therefore unrealized and realized MOICs are not meaningful. (i) BCEP, or Blackstone Core Equity Partners, is a core private equity fund which invests with a more modest risk profile and longer hold period. (j) Returns for Other Funds and Co-Investment are not meaningful as these funds have limited transaction activity. (k) BSCH, or Blackstone Strategic Capital Holdings, is focused on acquiring strategic minority positions in alternative asset managers. (l) Funds presented represent the flagship credit drawdown funds only. The Total Credit Net IRR is the combined IRR of the eight credit drawdown funds presented.
Blackstone 22
184 0 92 102 0 70 0 152 195 99 206 202 201 221 3 0 103 120 0 115 99 0 171 146
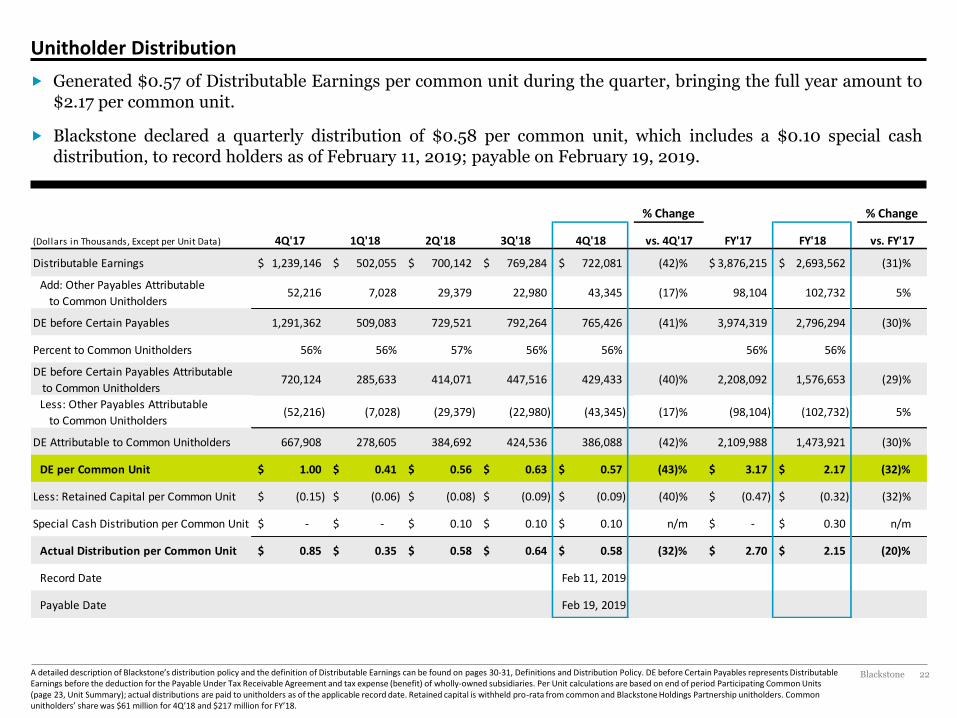
Unitholder Distribution
A detailed description of Blackstone’s distribution policy and the definition of Distributable Earnings can be found on pages 30-31, Definitions and Distribution Policy. DE before Certain Payables represents Distributable Earnings before the deduction for the Payable Under Tax Receivable Agreement and tax expense (benefit) of wholly-owned subsidiaries. Per Unit calculations are based on end of period Participating Common Units (page 23, Unit Summary); actual distributions are paid to unitholders as of the applicable record date. Retained capital is withheld pro-rata from common and Blackstone Holdings Partnership unitholders. Common unitholders’ share was $61 million for 4Q’18 and $217 million for FY’18.
Generated $0.57 of Distributable Earnings per common unit during the quarter, bringing the full year amount to $2.17 per common unit.
Blackstone declared a quarterly distribution of $0.58 per common unit, which includes a $0.10 special cash distribution, to record holders as of February 11, 2019; payable on February 19, 2019.
% Change % Change
(Dollars in Thousands, Except per Unit Data) 4Q'17 1Q'18 2Q'18 3Q'18 4Q'18 vs. 4Q'17 FY'17 FY'18 vs. FY'17
Distributable Earnings 1,239,146$ 502,055$ 700,142$ 769,284$ 722,081$ (42)% 3,876,215$ 2,693,562$ (31)%
Add: Other Payables Attributable
to Common Unitholders52,216 7,028 29,379 22,980 43,345 (17)% 98,104 102,732 5%
DE before Certain Payables 1,291,362 509,083 729,521 792,264 765,426 (41)% 3,974,319 2,796,294 (30)%
Percent to Common Unitholders 56% 56% 57% 56% 56% 56% 56%
DE before Certain Payables Attributable
to Common Unitholders720,124 285,633 414,071 447,516 429,433 (40)% 2,208,092 1,576,653 (29)%
Less: Other Payables Attributable
to Common Unitholders(52,216) (7,028) (29,379) (22,980) (43,345) (17)% (98,104) (102,732) 5%
DE Attributable to Common Unitholders 667,908 278,605 384,692 424,536 386,088 (42)% 2,109,988 1,473,921 (30)%
DE per Common Unit 1.00$ 0.41$ 0.56$ 0.63$ 0.57$ (43)% 3.17$ 2.17$ (32)%
Less: Retained Capital per Common Unit (0.15)$ (0.06)$ (0.08)$ (0.09)$ (0.09)$ (40)% (0.47)$ (0.32)$ (32)%
Special Cash Distribution per Common Unit -$ -$ 0.10$ 0.10$ 0.10$ n/m -$ 0.30$ n/m
Actual Distribution per Common Unit 0.85$ 0.35$ 0.58$ 0.64$ 0.58$ (32)% 2.70$ 2.15$ (20)%
Record Date Feb 11, 2019
Payable Date Feb 19, 2019
Blackstone 23
184 0 92 102 0 70 0 152 195 99 206 202 201 221 3 0 103 120 0 115 99 0 171 146
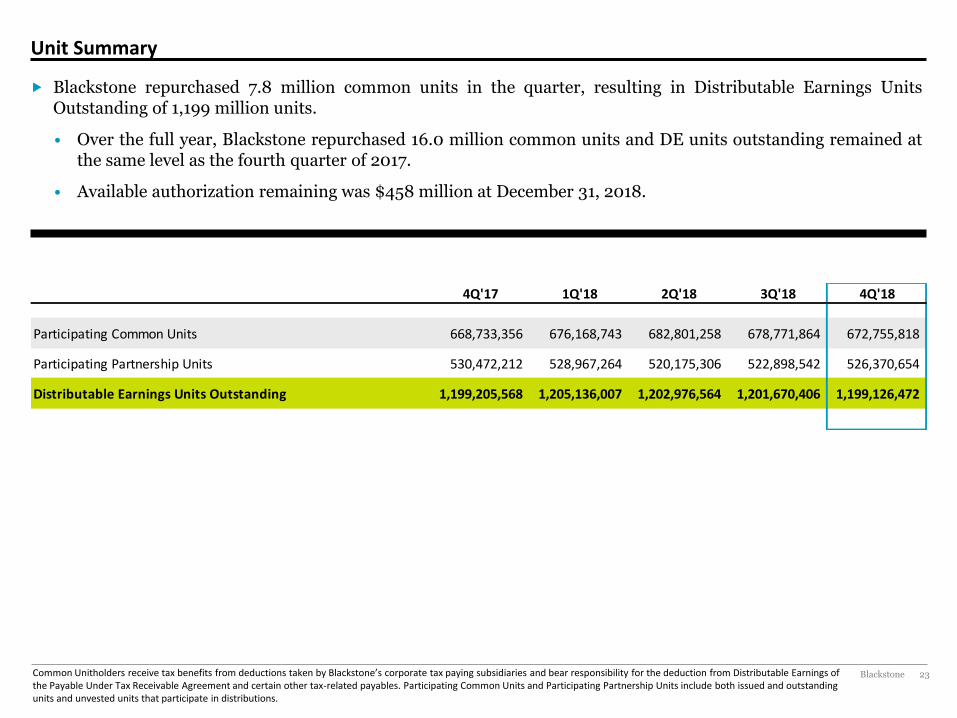
Unit Summary
Common Unitholders receive tax benefits from deductions taken by Blackstone’s corporate tax paying subsidiaries and bear responsibility for the deduction from Distributable Earnings of the Payable Under Tax Receivable Agreement and certain other tax-related payables. Participating Common Units and Participating Partnership Units include both issued and outstanding units and unvested units that participate in distributions.
4Q'17 1Q'18 2Q'18 3Q'18 4Q'18
Participating Common Units 668,733,356 676,168,743 682,801,258 678,771,864 672,755,818
Participating Partnership Units 530,472,212 528,967,264 520,175,306 522,898,542 526,370,654
Distributable Earnings Units Outstanding 1,199,205,568 1,205,136,007 1,202,976,564 1,201,670,406 1,199,126,472
Blackstone repurchased 7.8 million common units in the quarter, resulting in Distributable Earnings Units Outstanding of 1,199 million units.
• Over the full year, Blackstone repurchased 16.0 million common units and DE units outstanding remained at the same level as the fourth quarter of 2017.
• Available authorization remaining was $458 million at December 31, 2018.

Reconciliations and Disclosures
Blackstone 25
184 0 92 102 0 70 0 152 195 99 206 202 201 221 3 0 103 120 0 115 99 0 171 146
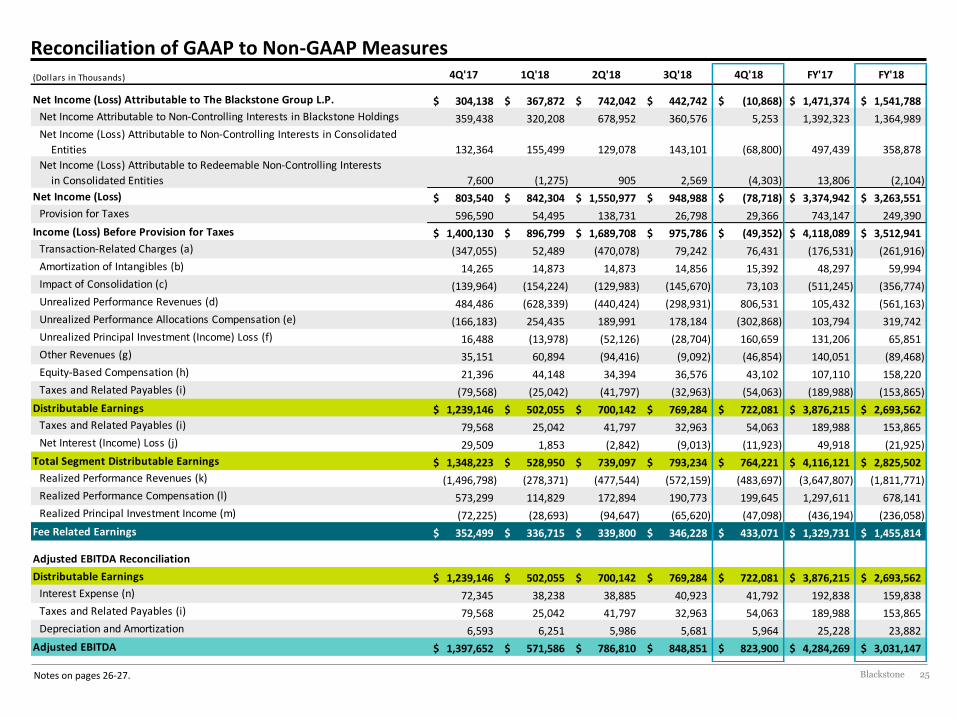
Notes on pages 26-27.
Reconciliation of GAAP to Non-GAAP Measures (Dollars in Thousands) 4Q'17 1Q'18 2Q'18 3Q'18 4Q'18 FY'17 FY'18
Net Income (Loss) Attributable to The Blackstone Group L.P. 304,138$ 367,872$ 742,042$ 442,742$ (10,868)$ 1,471,374$ 1,541,788$
Net Income Attributable to Non-Controlling Interests in Blackstone Holdings 359,438 320,208 678,952 360,576 5,253 1,392,323 1,364,989
Net Income (Loss) Attributable to Non-Controlling Interests in Consolidated
Entities 132,364 155,499 129,078 143,101 (68,800) 497,439 358,878
Net Income (Loss) Attributable to Redeemable Non-Controlling Interests
in Consolidated Entities 7,600 (1,275) 905 2,569 (4,303) 13,806 (2,104)
Net Income (Loss) 803,540$ 842,304$ 1,550,977$ 948,988$ (78,718)$ 3,374,942$ 3,263,551$
Provision for Taxes 596,590 54,495 138,731 26,798 29,366 743,147 249,390
Income (Loss) Before Provision for Taxes 1,400,130$ 896,799$ 1,689,708$ 975,786$ (49,352)$ 4,118,089$ 3,512,941$
Transaction-Related Charges (a) (347,055) 52,489 (470,078) 79,242 76,431 (176,531) (261,916)
Amortization of Intangibles (b) 14,265 14,873 14,873 14,856 15,392 48,297 59,994
Impact of Consolidation (c) (139,964) (154,224) (129,983) (145,670) 73,103 (511,245) (356,774)
Unrealized Performance Revenues (d) 484,486 (628,339) (440,424) (298,931) 806,531 105,432 (561,163)
Unrealized Performance Allocations Compensation (e) (166,183) 254,435 189,991 178,184 (302,868) 103,794 319,742
Unrealized Principal Investment (Income) Loss (f) 16,488 (13,978) (52,126) (28,704) 160,659 131,206 65,851
Other Revenues (g) 35,151 60,894 (94,416) (9,092) (46,854) 140,051 (89,468)
Equity-Based Compensation (h) 21,396 44,148 34,394 36,576 43,102 107,110 158,220
Taxes and Related Payables (i) (79,568) (25,042) (41,797) (32,963) (54,063) (189,988) (153,865)
Distributable Earnings 1,239,146$ 502,055$ 700,142$ 769,284$ 722,081$ 3,876,215$ 2,693,562$
Taxes and Related Payables (i) 79,568 25,042 41,797 32,963 54,063 189,988 153,865
Net Interest (Income) Loss (j) 29,509 1,853 (2,842) (9,013) (11,923) 49,918 (21,925)
Total Segment Distributable Earnings 1,348,223$ 528,950$ 739,097$ 793,234$ 764,221$ 4,116,121$ 2,825,502$
Realized Performance Revenues (k) (1,496,798) (278,371) (477,544) (572,159) (483,697) (3,647,807) (1,811,771)
Realized Performance Compensation (l) 573,299 114,829 172,894 190,773 199,645 1,297,611 678,141
Realized Principal Investment Income (m) (72,225) (28,693) (94,647) (65,620) (47,098) (436,194) (236,058)
Fee Related Earnings 352,499$ 336,715$ 339,800$ 346,228$ 433,071$ 1,329,731$ 1,455,814$
Adjusted EBITDA Reconciliation
Distributable Earnings 1,239,146$ 502,055$ 700,142$ 769,284$ 722,081$ 3,876,215$ 2,693,562$
Interest Expense (n) 72,345 38,238 38,885 40,923 41,792 192,838 159,838
Taxes and Related Payables (i) 79,568 25,042 41,797 32,963 54,063 189,988 153,865
Depreciation and Amortization 6,593 6,251 5,986 5,681 5,964 25,228 23,882
Adjusted EBITDA 1,397,652$ 571,586$ 786,810$ 848,851$ 823,900$ 4,284,269$ 3,031,147$
Blackstone 26
184 0 92 102 0 70 0 152 195 99 206 202 201 221 3 0 103 120 0 115 99 0 171 146
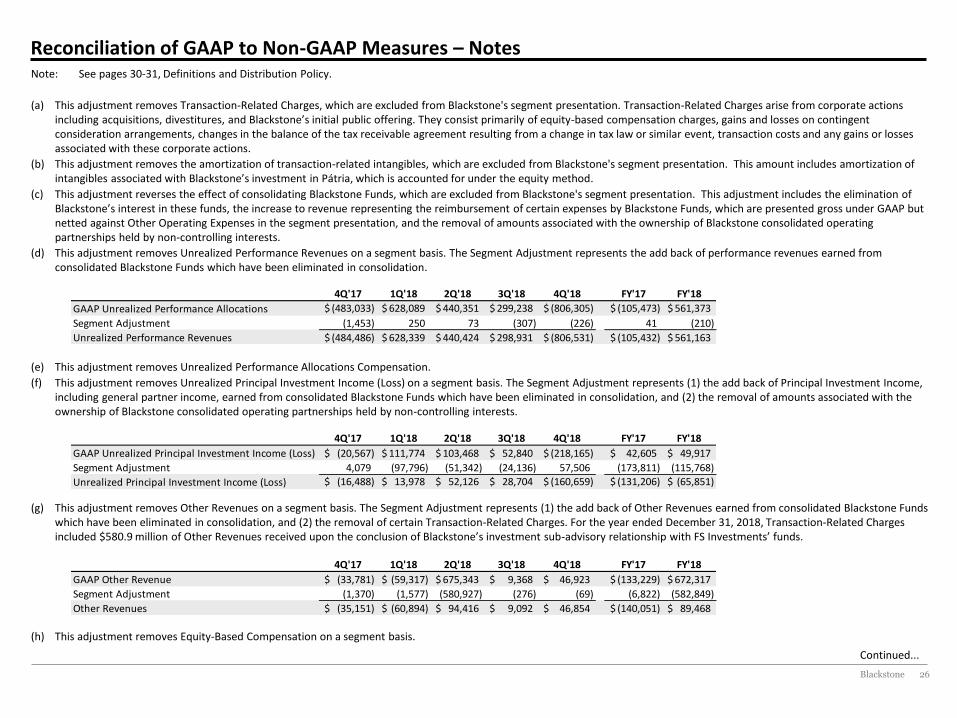
Reconciliation of GAAP to Non-GAAP Measures – Notes Note: See pages 30-31, Definitions and Distribution Policy.
(a) This adjustment removes Transaction-Related Charges, which are excluded from Blackstone's segment presentation. Transaction-Related Charges arise from corporate actions including acquisitions, divestitures, and Blackstone’s initial public offering. They consist primarily of equity-based compensation charges, gains and losses on contingent consideration arrangements, changes in the balance of the tax receivable agreement resulting from a change in tax law or similar event, transaction costs and any gains or losses associated with these corporate actions.
(b) This adjustment removes the amortization of transaction-related intangibles, which are excluded from Blackstone's segment presentation. This amount includes amortization of intangibles associated with Blackstone’s investment in Pátria, which is accounted for under the equity method.
(c) This adjustment reverses the effect of consolidating Blackstone Funds, which are excluded from Blackstone's segment presentation. This adjustment includes the elimination of Blackstone’s interest in these funds, the increase to revenue representing the reimbursement of certain expenses by Blackstone Funds, which are presented gross under GAAP but netted against Other Operating Expenses in the segment presentation, and the removal of amounts associated with the ownership of Blackstone consolidated operating partnerships held by non-controlling interests.
(d) This adjustment removes Unrealized Performance Revenues on a segment basis. The Segment Adjustment represents the add back of performance revenues earned from consolidated Blackstone Funds which have been eliminated in consolidation.
4Q'17 1Q'18 2Q'18 3Q'18 4Q'18 FY'17 FY'18
GAAP Unrealized Performance Allocations (483,033)$ 628,089$ 440,351$ 299,238$ (806,305)$ (105,473)$ 561,373$
Segment Adjustment (1,453) 250 73 (307) (226) 41 (210)
Unrealized Performance Revenues (484,486)$ 628,339$ 440,424$ 298,931$ (806,531)$ (105,432)$ 561,163$
(e) This adjustment removes Unrealized Performance Allocations Compensation.
(f) This adjustment removes Unrealized Principal Investment Income (Loss) on a segment basis. The Segment Adjustment represents (1) the add back of Principal Investment Income, including general partner income, earned from consolidated Blackstone Funds which have been eliminated in consolidation, and (2) the removal of amounts associated with the ownership of Blackstone consolidated operating partnerships held by non-controlling interests.
4Q'17 1Q'18 2Q'18 3Q'18 4Q'18 FY'17 FY'18
GAAP Unrealized Principal Investment Income (Loss) (20,567)$ 111,774$ 103,468$ 52,840$ (218,165)$ 42,605$ 49,917$
Segment Adjustment 4,079 (97,796) (51,342) (24,136) 57,506 (173,811) (115,768)
Unrealized Principal Investment Income (Loss) (16,488)$ 13,978$ 52,126$ 28,704$ (160,659)$ (131,206)$ (65,851)$
(g) This adjustment removes Other Revenues on a segment basis. The Segment Adjustment represents (1) the add back of Other Revenues earned from consolidated Blackstone Funds which have been eliminated in consolidation, and (2) the removal of certain Transaction-Related Charges. For the year ended December 31, 2018, Transaction-Related Charges included $580.9 million of Other Revenues received upon the conclusion of Blackstone’s investment sub-advisory relationship with FS Investments’ funds.
4Q'17 1Q'18 2Q'18 3Q'18 4Q'18 FY'17 FY'18
GAAP Other Revenue (33,781)$ (59,317)$ 675,343$ 9,368$ 46,923$ (133,229)$ 672,317$
Segment Adjustment (1,370) (1,577) (580,927) (276) (69) (6,822) (582,849)
Other Revenues (35,151)$ (60,894)$ 94,416$ 9,092$ 46,854$ (140,051)$ 89,468$
(h) This adjustment removes Equity-Based Compensation on a segment basis.
Continued...
Blackstone 27
184 0 92 102 0 70 0 152 195 99 206 202 201 221 3 0 103 120 0 115 99 0 171 146
Reconciliation of GAAP to Non-GAAP Measures – Notes Continued
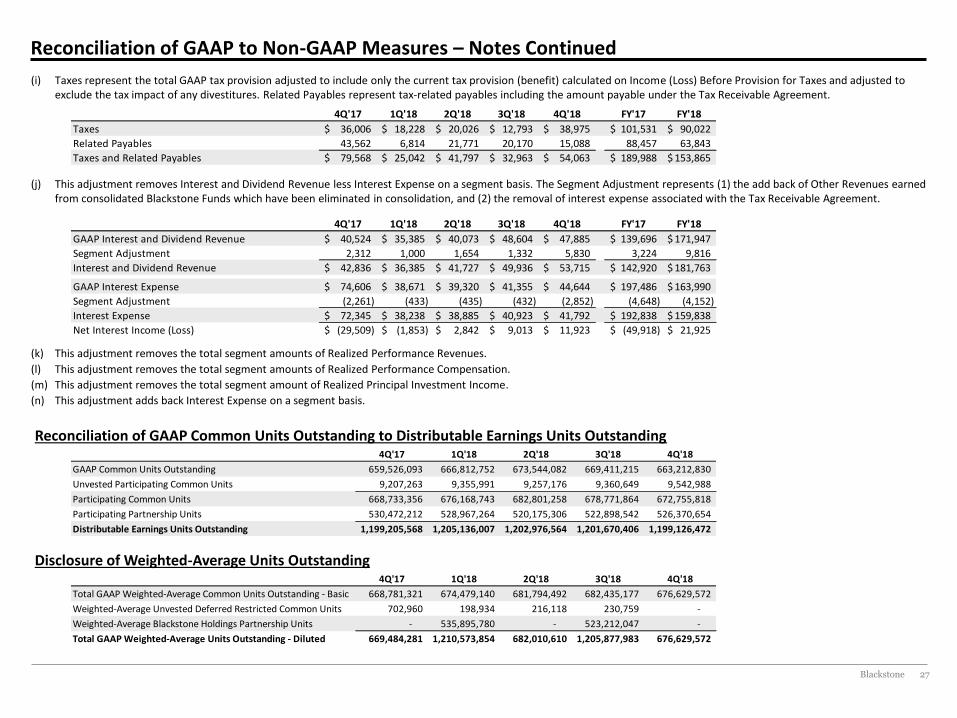
(i) Taxes represent the total GAAP tax provision adjusted to include only the current tax provision (benefit) calculated on Income (Loss) Before Provision for Taxes and adjusted to exclude the tax impact of any divestitures. Related Payables represent tax-related payables including the amount payable under the Tax Receivable Agreement.
4Q'17 1Q'18 2Q'18 3Q'18 4Q'18 FY'17 FY'18
GAAP Interest and Dividend Revenue 40,524$ 35,385$ 40,073$ 48,604$ 47,885$ 139,696$ 171,947$
Segment Adjustment 2,312 1,000 1,654 1,332 5,830 3,224 9,816
Interest and Dividend Revenue 42,836$ 36,385$ 41,727$ 49,936$ 53,715$ 142,920$ 181,763$
GAAP Interest Expense 74,606$ 38,671$ 39,320$ 41,355$ 44,644$ 197,486$ 163,990$
Segment Adjustment (2,261) (433) (435) (432) (2,852) (4,648) (4,152)
Interest Expense 72,345$ 38,238$ 38,885$ 40,923$ 41,792$ 192,838$ 159,838$
Net Interest Income (Loss) (29,509)$ (1,853)$ 2,842$ 9,013$ 11,923$ (49,918)$ 21,925$
(k) This adjustment removes the total segment amounts of Realized Performance Revenues.
(l) This adjustment removes the total segment amounts of Realized Performance Compensation.
(m) This adjustment removes the total segment amount of Realized Principal Investment Income.
(n) This adjustment adds back Interest Expense on a segment basis.
Reconciliation of GAAP Common Units Outstanding to Distributable Earnings Units Outstanding 4Q'17 1Q'18 2Q'18 3Q'18 4Q'18
GAAP Common Units Outstanding 659,526,093 666,812,752 673,544,082 669,411,215 663,212,830
Unvested Participating Common Units 9,207,263 9,355,991 9,257,176 9,360,649 9,542,988
Participating Common Units 668,733,356 676,168,743 682,801,258 678,771,864 672,755,818
Participating Partnership Units 530,472,212 528,967,264 520,175,306 522,898,542 526,370,654
Distributable Earnings Units Outstanding 1,199,205,568 1,205,136,007 1,202,976,564 1,201,670,406 1,199,126,472
Disclosure of Weighted-Average Units Outstanding 4Q'17 1Q'18 2Q'18 3Q'18 4Q'18
Total GAAP Weighted-Average Common Units Outstanding - Basic 668,781,321 674,479,140 681,794,492 682,435,177 676,629,572
Weighted-Average Unvested Deferred Restricted Common Units 702,960 198,934 216,118 230,759 -
Weighted-Average Blackstone Holdings Partnership Units - 535,895,780 - 523,212,047 -
Total GAAP Weighted-Average Units Outstanding - Diluted 669,484,281 1,210,573,854 682,010,610 1,205,877,983 676,629,572
(j) This adjustment removes Interest and Dividend Revenue less Interest Expense on a segment basis. The Segment Adjustment represents (1) the add back of Other Revenues earned from consolidated Blackstone Funds which have been eliminated in consolidation, and (2) the removal of interest expense associated with the Tax Receivable Agreement.
4Q'17 1Q'18 2Q'18 3Q'18 4Q'18 FY'17 FY'18
Taxes 36,006$ 18,228$ 20,026$ 12,793$ 38,975$ 101,531$ 90,022$
Related Payables 43,562 6,814 21,771 20,170 15,088 88,457 63,843
Taxes and Related Payables 79,568$ 25,042$ 41,797$ 32,963$ 54,063$ 189,988$ 153,865$
Blackstone 28
184 0 92 102 0 70 0 152 195 99 206 202 201 221 3 0 103 120 0 115 99 0 171 146
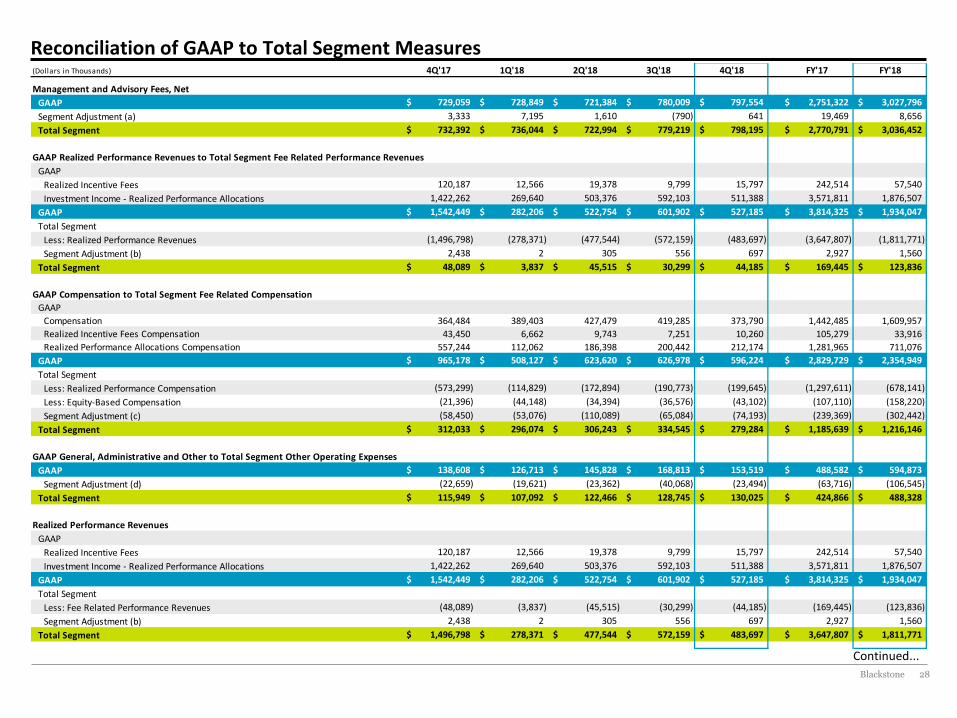
(Dollars in Thousands) 4Q'17 1Q'18 2Q'18 3Q'18 4Q'18 FY'17 FY'18
Management and Advisory Fees, Net
GAAP 729,059$ 728,849$ 721,384$ 780,009$ 797,554$ 2,751,322$ 3,027,796$
Segment Adjustment (a) 3,333 7,195 1,610 (790) 641 19,469 8,656
Total Segment 732,392$ 736,044$ 722,994$ 779,219$ 798,195$ 2,770,791$ 3,036,452$
GAAP Realized Performance Revenues to Total Segment Fee Related Performance Revenues
GAAP
Realized Incentive Fees 120,187 12,566 19,378 9,799 15,797 242,514 57,540
Investment Income - Realized Performance Allocations 1,422,262 269,640 503,376 592,103 511,388 3,571,811 1,876,507
GAAP 1,542,449$ 282,206$ 522,754$ 601,902$ 527,185$ 3,814,325$ 1,934,047$
Total Segment
Less: Realized Performance Revenues (1,496,798) (278,371) (477,544) (572,159) (483,697) (3,647,807) (1,811,771)
Segment Adjustment (b) 2,438 2 305 556 697 2,927 1,560
Total Segment 48,089$ 3,837$ 45,515$ 30,299$ 44,185$ 169,445$ 123,836$
GAAP Compensation to Total Segment Fee Related Compensation
GAAP
Compensation 364,484 389,403 427,479 419,285 373,790 1,442,485 1,609,957
Realized Incentive Fees Compensation 43,450 6,662 9,743 7,251 10,260 105,279 33,916
Realized Performance Allocations Compensation 557,244 112,062 186,398 200,442 212,174 1,281,965 711,076
GAAP 965,178$ 508,127$ 623,620$ 626,978$ 596,224$ 2,829,729$ 2,354,949$
Total Segment
Less: Realized Performance Compensation (573,299) (114,829) (172,894) (190,773) (199,645) (1,297,611) (678,141)
Less: Equity-Based Compensation (21,396) (44,148) (34,394) (36,576) (43,102) (107,110) (158,220)
Segment Adjustment (c) (58,450) (53,076) (110,089) (65,084) (74,193) (239,369) (302,442)
Total Segment 312,033$ 296,074$ 306,243$ 334,545$ 279,284$ 1,185,639$ 1,216,146$
GAAP General, Administrative and Other to Total Segment Other Operating Expenses
GAAP 138,608$ 126,713$ 145,828$ 168,813$ 153,519$ 488,582$ 594,873$
Segment Adjustment (d) (22,659) (19,621) (23,362) (40,068) (23,494) (63,716) (106,545)
Total Segment 115,949$ 107,092$ 122,466$ 128,745$ 130,025$ 424,866$ 488,328$
Realized Performance Revenues
GAAP
Realized Incentive Fees 120,187 12,566 19,378 9,799 15,797 242,514 57,540
Investment Income - Realized Performance Allocations 1,422,262 269,640 503,376 592,103 511,388 3,571,811 1,876,507
GAAP 1,542,449$ 282,206$ 522,754$ 601,902$ 527,185$ 3,814,325$ 1,934,047$
Total Segment
Less: Fee Related Performance Revenues (48,089) (3,837) (45,515) (30,299) (44,185) (169,445) (123,836)
Segment Adjustment (b) 2,438 2 305 556 697 2,927 1,560
Total Segment 1,496,798$ 278,371$ 477,544$ 572,159$ 483,697$ 3,647,807$ 1,811,771$
Reconciliation of GAAP to Total Segment Measures
Continued...
Blackstone 29
184 0 92 102 0 70 0 152 195 99 206 202 201 221 3 0 103 120 0 115 99 0 171 146
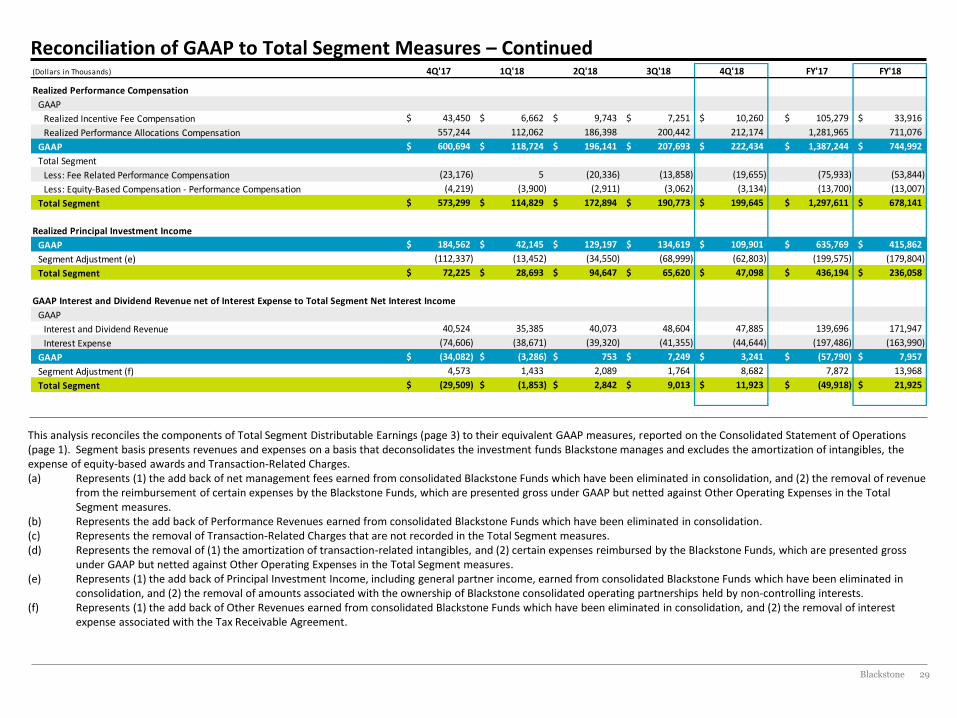
Reconciliation of GAAP to Total Segment Measures – Continued (Dollars in Thousands) 4Q'17 1Q'18 2Q'18 3Q'18 4Q'18 FY'17 FY'18
Realized Performance Compensation
GAAP
Realized Incentive Fee Compensation 43,450$ 6,662$ 9,743$ 7,251$ 10,260$ 105,279$ 33,916$
Realized Performance Allocations Compensation 557,244 112,062 186,398 200,442 212,174 1,281,965 711,076
GAAP 600,694$ 118,724$ 196,141$ 207,693$ 222,434$ 1,387,244$ 744,992$
Total Segment
Less: Fee Related Performance Compensation (23,176) 5 (20,336) (13,858) (19,655) (75,933) (53,844)
Less: Equity-Based Compensation - Performance Compensation (4,219) (3,900) (2,911) (3,062) (3,134) (13,700) (13,007)
Total Segment 573,299$ 114,829$ 172,894$ 190,773$ 199,645$ 1,297,611$ 678,141$
Realized Principal Investment Income
GAAP 184,562$ 42,145$ 129,197$ 134,619$ 109,901$ 635,769$ 415,862$
Segment Adjustment (e) (112,337) (13,452) (34,550) (68,999) (62,803) (199,575) (179,804)
Total Segment 72,225$ 28,693$ 94,647$ 65,620$ 47,098$ 436,194$ 236,058$
GAAP Interest and Dividend Revenue net of Interest Expense to Total Segment Net Interest Income
GAAP
Interest and Dividend Revenue 40,524 35,385 40,073 48,604 47,885 139,696 171,947
Interest Expense (74,606) (38,671) (39,320) (41,355) (44,644) (197,486) (163,990)
GAAP (34,082)$ (3,286)$ 753$ 7,249$ 3,241$ (57,790)$ 7,957$
Segment Adjustment (f) 4,573 1,433 2,089 1,764 8,682 7,872 13,968
Total Segment (29,509)$ (1,853)$ 2,842$ 9,013$ 11,923$ (49,918)$ 21,925$
This analysis reconciles the components of Total Segment Distributable Earnings (page 3) to their equivalent GAAP measures, reported on the Consolidated Statement of Operations (page 1). Segment basis presents revenues and expenses on a basis that deconsolidates the investment funds Blackstone manages and excludes the amortization of intangibles, the expense of equity-based awards and Transaction-Related Charges. (a) Represents (1) the add back of net management fees earned from consolidated Blackstone Funds which have been eliminated in consolidation, and (2) the removal of revenue
from the reimbursement of certain expenses by the Blackstone Funds, which are presented gross under GAAP but netted against Other Operating Expenses in the Total Segment measures.
(b) Represents the add back of Performance Revenues earned from consolidated Blackstone Funds which have been eliminated in consolidation. (c) Represents the removal of Transaction-Related Charges that are not recorded in the Total Segment measures. (d) Represents the removal of (1) the amortization of transaction-related intangibles, and (2) certain expenses reimbursed by the Blackstone Funds, which are presented gross
under GAAP but netted against Other Operating Expenses in the Total Segment measures. (e) Represents (1) the add back of Principal Investment Income, including general partner income, earned from consolidated Blackstone Funds which have been eliminated in
consolidation, and (2) the removal of amounts associated with the ownership of Blackstone consolidated operating partnerships held by non-controlling interests. (f) Represents (1) the add back of Other Revenues earned from consolidated Blackstone Funds which have been eliminated in consolidation, and (2) the removal of interest
expense associated with the Tax Receivable Agreement.
Blackstone 30
184 0 92 102 0 70 0 152 195 99 206 202 201 221 3 0 103 120 0 115 99 0 171 146
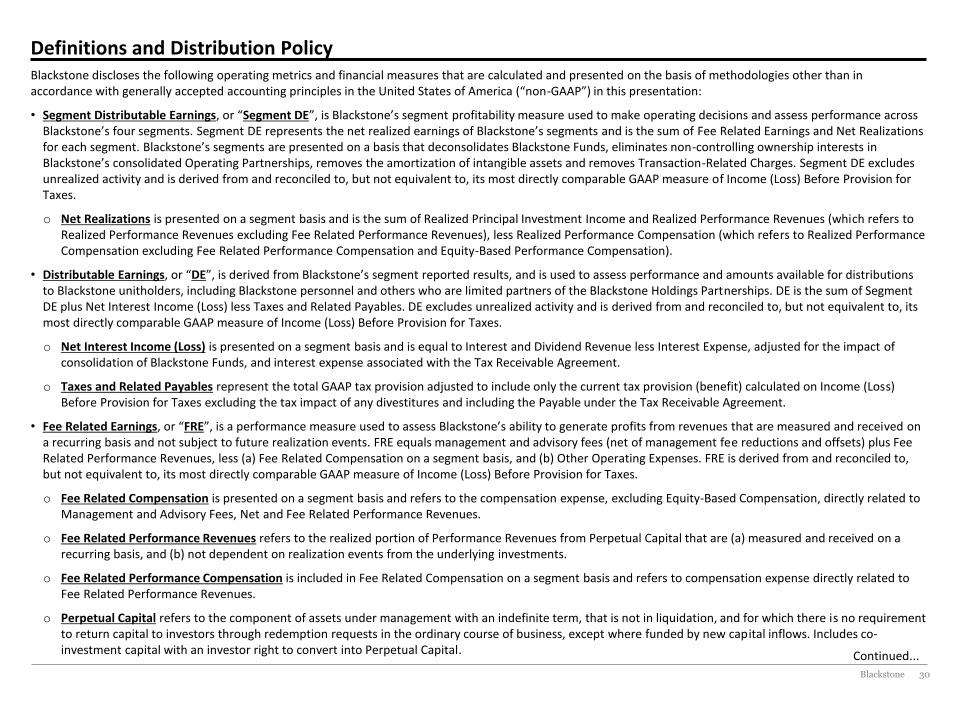
Definitions and Distribution Policy Blackstone discloses the following operating metrics and financial measures that are calculated and presented on the basis of methodologies other than in accordance with generally accepted accounting principles in the United States of America (“non-GAAP”) in this presentation:
• Segment Distributable Earnings, or “Segment DE”, is Blackstone’s segment profitability measure used to make operating decisions and assess performance across Blackstone’s four segments. Segment DE represents the net realized earnings of Blackstone’s segments and is the sum of Fee Related Earnings and Net Realizations for each segment. Blackstone’s segments are presented on a basis that deconsolidates Blackstone Funds, eliminates non-controlling ownership interests in Blackstone’s consolidated Operating Partnerships, removes the amortization of intangible assets and removes Transaction-Related Charges. Segment DE excludes unrealized activity and is derived from and reconciled to, but not equivalent to, its most directly comparable GAAP measure of Income (Loss) Before Provision for Taxes.
o Net Realizations is presented on a segment basis and is the sum of Realized Principal Investment Income and Realized Performance Revenues (which refers to Realized Performance Revenues excluding Fee Related Performance Revenues), less Realized Performance Compensation (which refers to Realized Performance Compensation excluding Fee Related Performance Compensation and Equity-Based Performance Compensation).
• Distributable Earnings, or “DE”, is derived from Blackstone’s segment reported results, and is used to assess performance and amounts available for distributions to Blackstone unitholders, including Blackstone personnel and others who are limited partners of the Blackstone Holdings Partnerships. DE is the sum of Segment DE plus Net Interest Income (Loss) less Taxes and Related Payables. DE excludes unrealized activity and is derived from and reconciled to, but not equivalent to, its most directly comparable GAAP measure of Income (Loss) Before Provision for Taxes.
o Net Interest Income (Loss) is presented on a segment basis and is equal to Interest and Dividend Revenue less Interest Expense, adjusted for the impact of consolidation of Blackstone Funds, and interest expense associated with the Tax Receivable Agreement.
o Taxes and Related Payables represent the total GAAP tax provision adjusted to include only the current tax provision (benefit) calculated on Income (Loss) Before Provision for Taxes excluding the tax impact of any divestitures and including the Payable under the Tax Receivable Agreement.
• Fee Related Earnings, or “FRE”, is a performance measure used to assess Blackstone’s ability to generate profits from revenues that are measured and received on a recurring basis and not subject to future realization events. FRE equals management and advisory fees (net of management fee reductions and offsets) plus Fee Related Performance Revenues, less (a) Fee Related Compensation on a segment basis, and (b) Other Operating Expenses. FRE is derived from and reconciled to, but not equivalent to, its most directly comparable GAAP measure of Income (Loss) Before Provision for Taxes.
o Fee Related Compensation is presented on a segment basis and refers to the compensation expense, excluding Equity-Based Compensation, directly related to Management and Advisory Fees, Net and Fee Related Performance Revenues.
o Fee Related Performance Revenues refers to the realized portion of Performance Revenues from Perpetual Capital that are (a) measured and received on a recurring basis, and (b) not dependent on realization events from the underlying investments.
o Fee Related Performance Compensation is included in Fee Related Compensation on a segment basis and refers to compensation expense directly related to Fee Related Performance Revenues.
o Perpetual Capital refers to the component of assets under management with an indefinite term, that is not in liquidation, and for which there is no requirement to return capital to investors through redemption requests in the ordinary course of business, except where funded by new capital inflows. Includes co-investment capital with an investor right to convert into Perpetual Capital. Continued...
Blackstone 31
184 0 92 102 0 70 0 152 195 99 206 202 201 221 3 0 103 120 0 115 99 0 171 146
Definitions and Distribution Policy – Continued • Adjusted Earnings Before Interest, Taxes and Depreciation and Amortization, or “Adjusted EBITDA”, is a supplemental measure used to assess performance
derived from Blackstone’s segment results and may be used to assess its ability to service its borrowings. Adjusted EBITDA represents Distributable Earnings plus the addition of (a) Interest Expense on a segment basis, (b) Taxes and Related Payables, and (c) Depreciation and Amortization. Adjusted EBITDA is derived from and reconciled to, but not equivalent to, its most directly comparable GAAP measure of Income (Loss) Before Provision for Taxes.
• Performance Revenues collectively refers to: (a) Incentive Fees, and (b) Performance Allocations.
• Performance Compensation collectively refers to: (a) Incentive Fee Compensation, and (b) Performance Allocations Compensation.
• Transaction-Related Charges arise from corporate actions including acquisitions, divestitures, and Blackstone’s initial public offering. They consist primarily of equity-based compensation charges, gains and losses on contingent consideration arrangements, changes in the balance of the tax receivable agreement resulting from a change in tax law or similar event, transaction costs and any gains or losses associated with these corporate actions.
Distribution Policy. Blackstone’s intention is to distribute quarterly to common unitholders approximately 85% of The Blackstone Group L.P.’s share of Distributable Earnings, subject to adjustment by amounts determined by Blackstone’s general partner to be necessary or appropriate to provide for the conduct of its business, to make appropriate investments in its business and funds, to comply with applicable law, any of its debt instruments or other agreements, or to provide for future cash requirements such as tax-related payments, clawback obligations and distributions to unitholders for any ensuing quarter. The amount to be distributed could also be adjusted upward in any one quarter. All of the foregoing is subject to the qualification that the declaration and payment of any distributions are at the sole discretion of Blackstone’s general partner and may change its distribution policy at any time, including, without limitation, to eliminate such distributions entirely.
Blackstone 32
184 0 92 102 0 70 0 152 195 99 206 202 201 221 3 0 103 120 0 115 99 0 171 146
Forward-Looking Statements
This presentation may contain forward-looking statements within the meaning of Section 27A of the Securities Act of 1933 and Section 21E of the Securities Exchange Act of 1934 which reflect Blackstone’s current views with respect to, among other things, Blackstone’s operations, financial performance and unit repurchase and distribution activities. You can identify these forward-looking statements by the use of words such as “outlook,” “indicator,” “believes,” “expects,” “potential,” “continues,” “may,” “will,” “should,” “seeks,” “approximately,” “predicts,” “intends,” “plans,” “estimates,” “anticipates” or the negative version of these words or other comparable words. Such forward-looking statements are subject to various risks and uncertainties. Accordingly, there are or will be important factors that could cause actual outcomes or results to differ materially from those indicated in these statements. Blackstone believes these factors include but are not limited to those described under the section entitled “Risk Factors” in its Annual Report on Form 10-K for the fiscal year ended December 31, 2017, as such factors may be updated from time to time in its periodic filings with the Securities and Exchange Commission, which are accessible on the SEC’s website at www.sec.gov. These factors should not be construed as exhaustive and should be read in conjunction with the other cautionary statements that are included in this presentation and in the filings. Blackstone undertakes no obligation to publicly update or review any forward-looking statement, whether as a result of new information, future developments or otherwise. This presentation does not constitute an offer of any Blackstone Fund.