Embed Size (px)
Citation preview
© 2006 The Authors. Journal compilation © 2006 The Norwegian Academy of Science and Letters • Zoologica Scripta,
35
, 6, November 2006, pp567–580
567
Irestedt, M., Ohlson, J. I., Zuccon, D., Källersjö, M. & Ericson, P. G. P. (2006). Nuclear DNAfrom old collections of avian study skins reveals the evolutionary history of the Old Worldsuboscines (Aves: Passeriformes). —
Zoologica Scripta, 35
, 567–580.Museum study skins represent an invaluable source of DNA for phylogenetics, phylogeographyand population genetics. This becomes evident by comparing the number of study skins ofbirds housed in museums worldwide (
c
. 10 million) with the corresponding number of tissuesamples (probably fewer than 500 000). While the laboratory techniques used hitherto haveprimarily allowed PCR-based studies of mitochondrial genes from museum skins, we presenthere the first avian phylogeny based on a large number of nuclear sequences. The targetedfragment sizes and the properties of the primers used are important contributory factors toobtain good amplification results. In this study we routinely amplified fragments of
c.
350 bpnuclear DNA. This advance in methodology opens up a new avenue for the use of avianmuseum skins, as nuclear DNA is especially useful when studying ancient patterns of diversi-fication. The phylogenetic hypothesis of the Old World suboscines (Eurylaimides) presentedherein strongly supports a monophyletic origin of the pittas (Pittidae). The phylogeny furthersuggests that pittas could be divided into three major groups, in agreement with the externalmorphological variation found in this group. The broadbills (Eurylaimidae) as currentlydefined are, on the other hand, found to be a paraphyletic family, as both
Sapayoa aenigma
andthe asities (Philepittidae) are nested among them. Based on the phylogenetic results we suggesta revised classification of the Old World suboscines (Eurylaimides).
Martin Irestedt & Mari Källersjö, Molecular Systematics Laboratory, Swedish Museum of NaturalHistory, PO Box 50007, SE-104 05 Stockholm, Sweden. E-mails: [email protected],[email protected] Ohlson, Dario Zuccon & Per G. P. Ericson, Department of Vertebrate Zoology, Swedish Museumof Natural History, PO Box 50007, SE
−
104 05 Stockholm, Sweden. E-mails: [email protected],[email protected], [email protected]
Blackwell Publishing Ltd
Nuclear DNA from old collections of avian study skins reveals the evolutionary history of the Old World suboscines (Aves, Passeriformes)
M
ARTIN
I
RESTEDT
, J
AN
I. O
HLSON
, D
ARIO
Z
UCCON
, M
ARI
K
ÄLLERSJÖ
& P
ER
G. P. E
RICSON
Accepted: 10 July 2006 doi:10.1111/j.1463-6409.2006.00249.x
Introduction
Although fresh samples are always preferred in molecularstudies, tissue and blood of critical avian taxa are often notavailable for study. In such cases museum collections of avianstudy skins can provide an invaluable source of DNA, as it hasbeen estimated that museums hold nearly 10 million birdspecimens of the 10 000 known species (Roselaar 2003).However, after an initial enthusiasm for the recovery of DNAfrom museum specimens (Houde & Braun 1988; Ellegren1991), the use of avian study skins in molecular systematicshas been rather limited (but see e.g. Cooper
et al
. 1992, 1996,2001; Leeton
et al
. 1993; Cracraft & Feinstein 2000; Vallianatos
et al
. 2002; Payne & Sorenson 2003; Sefc
et al
. 2003; Ericson
et al
. 2005), chiefly because degenerated DNA from old aviancollections requires considerable extra labour in the laboratory.
In addition, the DNA regions have hitherto been almostexclusively of mitochondrial origin (for exceptions see e.g.Mundy
et al
. 1997; Eggert
et al
. 2004; Dumbacher &Fleischer 2001), and the general opinion has been thatnuclear DNA sequences are extremely difficult to obtainfrom avian study skins. This is especially unfortunate for thestudy of more ancient systematic relationships in birds, as theseoften have proven to be difficult to resolve by fast evolvingmitochondrial gene sequences, and this has certainly ham-pered the general use of study skins in phylogenetic analyses.By careful primer design and by excising PCR-products from
Phylogeny of Old World suboscines
•
M. Irestedt
et al
.
568
Zoologica Scripta,
35
, 6, November 2006, pp567–580 • © 2006 The Authors. Journal compilation © 2006 The Norwegian Academy of Science and Letters
agarose gels we are here able to present the first avian phylo-geny that has extensively used avian study skins, collected inthe early 20th century, as the source for nuclear DNA. Threenuclear gene regions have been sequenced in order to obtaina hypothesis of the evolutionary relationships of the OldWorld suboscines (Eurylaimides). Our approach has enabledus to include in our phylogeny representatives of all genera,and as many as 28 out of the 30 species of pittas currentlyrecognized (Erritzoe 2003).
The Old World suboscines consist of three groups of birdsthat are seldom numerous and often have elusive habits andattractive plumages. Besides pittas, the group also consists ofthe asities (Philepittidae) and the broadbills (Eurylaimidae).In spite of its Neotropical distribution the broad-billedsapayoa (
Sapayoa aenigma
) has recently been added to thisgroup (Fjeldså
et al
. 2003; Chesser 2004).The taxonomic history of the Old World suboscines is
complicated and reflects the lack of morphological syn-apomorphies for the group. It has long been recognized that theasities, broadbills and pittas share the so-called suboscinetype of the syrinx (the vocal apparatus in birds) with a numberof passerines in the New World (Müller 1847; Forbes1880a,b). Nevertheless, monophyly of the suboscines was notdemonstrated convincingly until Feduccia (1974) showedthat all suboscines (i.e. Eurylaimides and Tyrannides
sensu
Ericson
et al
. 2003) share a derived morphology of the stapes(a bone in the ear). In early classifications broadbills wereoften considered as the most ‘primitive’ passerine groupbased on anatomical evidence (e.g. Forbes 1880b), and weretherefore set apart in their own suborder, the Desmodactyli.Olson (1971) showed that these anatomical characters areeither not consistently found in all broadbills or are sharedwith other suboscine families.
The monophyly of the suboscines is now well established.Both DNA
−
DNA hybridization data (Sibley & Ahlquist1990) and analyses of various kinds of DNA sequence data(e.g. Irestedt
et al
. 2001; Chesser 2004) have confirmed theircommon ancestry. The DNA sequence data have furthershown that the suboscines can be divided into an Old Worldand a New World radiation (e.g. Irestedt
et al
. 2001; Chesser2004). Nevertheless, the most complete study to date, that ofFjeldså
et al
. (2003), lacks several broadbill genera andcontains only one pitta species. Consequently, much of ourcurrent understanding of the phylogenetic relationshipsamong Old World suboscines largely rests on interpretationsof morphology. For the pittas this means that taxonomicconsiderations are mainly based on overall similarity (e.g.Whitehead 1893; Erritzoe & Erritzoe 1998). Phylogeneticrelationships among broadbills and asities have, on the otherhand, been studied by cladistic analyses of hindlimb myology(Raikow 1987) and syrinx morphology (Prum 1993),although the results of the latter two studies conflict with
each other. For more detailed reviews of the history of theclassification of the Old World suboscines see e.g. Olson(1971), Sibley & Ahlquist (1990), Lambert & Woodcock(1996), Erritzoe & Erritzoe (1998), and del Hoyo
et al
.(2003).
Materials and methods
Taxon sampling, amplification and sequencing
The ingroup includes representatives of all genera and morethan 80% of the species of Old World suboscines recognizedby del Hoyo
et al
. (2003). We have studied the DNA of28 species of pittas, 11 broadbills and two asities, along withthat of the broad-billed sapayoa (
Sapayoa aenigma
) (cf. Fjeldså
et al
. 2003; Chesser 2004). A selection of New World sub-oscines has also been included, in order to test the monophylythe Old World suboscines and the affinity of
S. aenigma
. Thephylogenies have been rooted with a tree sparrow (
Passermontanus
), a representative of the oscine passerines.Three nuclear gene regions
−
myoglobin intron 2, ornithinedecarboxylase (ODC) introns 6–7, and glyceraldehyde-3-phosphodehydrogenase (G3PDH) intron 11 — have beensequenced and used for the phylogenetic interpretations. Foreach gene and taxon, multiple sequence fragments wereobtained by sequencing with different primers. These sequenceswere assembled to complete sequences with S
EQ
M
AN
II™(DNASTAR Inc.). Positions where the nucleotide could notbe determined with certainty were coded with the appropriateIUPAC code. GenBank accession numbers are given inTable 1. For extractions, amplifications, and sequencingprocedures for fresh tissue/blood samples see Irestedt
et al
.(2001, 2002, 2004a), Fjeldså
et al
. (2003), and Allen &Omland (2003).
DNA was extracted from footpads of museum study skinfrom 18 of the 42 species in the ingroup using the DNeasyTissue Kit (Qiagen) following the manufacturer’s instructions.Some minor modifications were made; the quantity of buffersand enzymes during the lysis stage was doubled, with ratherlarge pieces (
c
. 10–20 mm
2
) of footpads used whenever possible.As the lysis procedure is prolonged (normally 24–48 h) dueto the firm texture of the footpads (compared to fresh tissue),additional proteinase K (5–10
µ
L) was added two to fourtimes. The amount of elution buffer during the final stage ofthe extraction was decreased to give a total volume of 100
µ
Lextract. The extractions from the footpads were alwaysperformed in a room dedicated to working with old DNAmaterial, with appropriate facilities such as a UV-bench usedfor sterilizing equipment. When available, 2–3 individualsfrom each taxon were extracted and the sample that producedthe best PCR products was selected for sequencing. The chosensamples were then used throughout the study.
For amplifying and sequencing the DNA from thefootpads a number of new primers were designed. Several
M. Irestedt
et al
.
•
Phylogeny of Old World suboscines
© 2006 The Authors. Journal compilation © 2006 The Norwegian Academy of Science and Letters • Zoologica Scripta,
35
, 6, November 2006, pp567–580
569
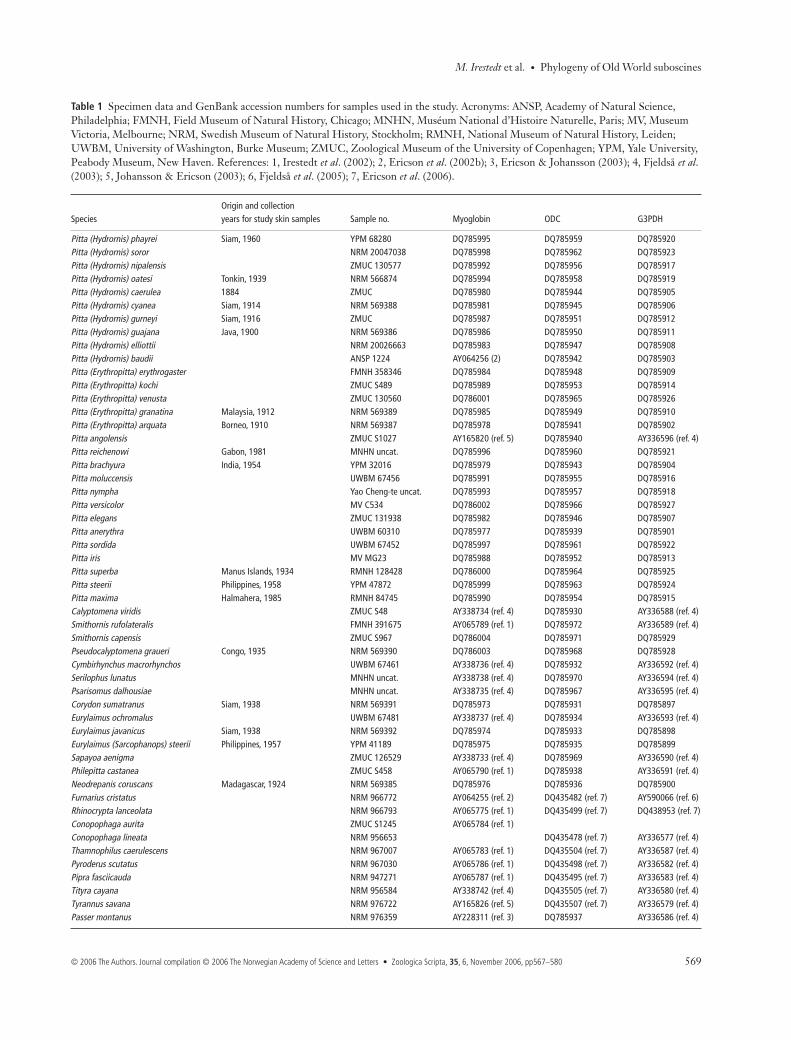
Table 1
Specimen data and GenBank accession numbers for samples used in the study. Acronyms: ANSP, Academy of Natural Science, Philadelphia; FMNH, Field Museum of Natural History, Chicago; MNHN, Muséum National d’Histoire Naturelle, Paris; MV, Museum Victoria, Melbourne; NRM, Swedish Museum of Natural History, Stockholm; RMNH, National Museum of Natural History, Leiden; UWBM, University of Washington, Burke Museum; ZMUC, Zoological Museum of the University of Copenhagen; YPM, Yale University, Peabody Museum, New Haven. References: 1, Irestedt
et al
. (2002); 2, Ericson
et al
. (2002b); 3, Ericson & Johansson (2003); 4, Fjeldså
et al
. (2003); 5, Johansson & Ericson (2003); 6, Fjeldså
et al
. (2005); 7, Ericson
et al
. (2006).
SpeciesOrigin and collection years for study skin samples Sample no. Myoglobin ODC G3PDH
Pitta (Hydrornis) phayrei
Siam, 1960 YPM 68280 DQ785995 DQ785959 DQ785920
Pitta (Hydrornis) soror
NRM 20047038 DQ785998 DQ785962 DQ785923
Pitta (Hydrornis) nipalensis
ZMUC 130577 DQ785992 DQ785956 DQ785917
Pitta (Hydrornis) oatesi
Tonkin, 1939 NRM 566874 DQ785994 DQ785958 DQ785919
Pitta (Hydrornis) caerulea
1884 ZMUC DQ785980 DQ785944 DQ785905
Pitta (Hydrornis) cyanea
Siam, 1914 NRM 569388 DQ785981 DQ785945 DQ785906
Pitta (Hydrornis) gurneyi
Siam, 1916 ZMUC DQ785987 DQ785951 DQ785912
Pitta (Hydrornis) guajana
Java, 1900 NRM 569386 DQ785986 DQ785950 DQ785911
Pitta (Hydrornis) elliottii
NRM 20026663 DQ785983 DQ785947 DQ785908
Pitta (Hydrornis) baudii
ANSP 1224 AY064256 (2) DQ785942 DQ785903
Pitta (Erythropitta)
erythrogaster
FMNH 358346 DQ785984 DQ785948 DQ785909
Pitta (Erythropitta) kochi
ZMUC S489 DQ785989 DQ785953 DQ785914
Pitta (Erythropitta) venusta
ZMUC 130560 DQ786001 DQ785965 DQ785926
Pitta (Erythropitta) granatina
Malaysia, 1912 NRM 569389 DQ785985 DQ785949 DQ785910
Pitta (Erythropitta) arquata
Borneo, 1910 NRM 569387 DQ785978 DQ785941 DQ785902
Pitta angolensis
ZMUC S1027 AY165820 (ref. 5) DQ785940 AY336596 (ref. 4)
Pitta reichenowi
Gabon, 1981 MNHN uncat. DQ785996 DQ785960 DQ785921
Pitta brachyura
India, 1954 YPM 32016 DQ785979 DQ785943 DQ785904
Pitta moluccensis
UWBM 67456 DQ785991 DQ785955 DQ785916
Pitta nympha
Yao Cheng-te uncat. DQ785993 DQ785957 DQ785918
Pitta versicolor
MV C534 DQ786002 DQ785966 DQ785927
Pitta elegans
ZMUC 131938 DQ785982 DQ785946 DQ785907
Pitta anerythra
UWBM 60310 DQ785977 DQ785939 DQ785901
Pitta sordida
UWBM 67452 DQ785997 DQ785961 DQ785922
Pitta iris
MV MG23 DQ785988 DQ785952 DQ785913
Pitta superba
Manus Islands, 1934 RMNH 128428 DQ786000 DQ785964 DQ785925
Pitta steerii
Philippines, 1958 YPM 47872 DQ785999 DQ785963 DQ785924
Pitta maxima
Halmahera, 1985 RMNH 84745 DQ785990 DQ785954 DQ785915
Calyptomena viridis
ZMUC S48 AY338734 (ref. 4) DQ785930 AY336588 (ref. 4)
Smithornis rufolateralis
FMNH 391675 AY065789 (ref. 1) DQ785972 AY336589 (ref. 4)
Smithornis capensis
ZMUC S967 DQ786004 DQ785971 DQ785929
Pseudocalyptomena graueri
Congo, 1935 NRM 569390 DQ786003 DQ785968 DQ785928
Cymbirhynchus
macrorhynchos
UWBM 67461 AY338736 (ref. 4) DQ785932 AY336592 (ref. 4)
Serilophus lunatus
MNHN uncat. AY338738 (ref. 4) DQ785970 AY336594 (ref. 4)
Psarisomus dalhousiae
MNHN uncat. AY338735 (ref. 4) DQ785967 AY336595 (ref. 4)
Corydon sumatranus
Siam, 1938 NRM 569391 DQ785973 DQ785931 DQ785897
Eurylaimus ochromalus
UWBM 67481 AY338737 (ref. 4) DQ785934 AY336593 (ref. 4)
Eurylaimus javanicus
Siam, 1938 NRM 569392 DQ785974 DQ785933 DQ785898
Eurylaimus
(Sarcophanops) steerii
Philippines, 1957 YPM 41189 DQ785975 DQ785935 DQ785899
Sapayoa aenigma
ZMUC 126529 AY338733 (ref. 4) DQ785969 AY336590 (ref. 4)
Philepitta castanea
ZMUC S458 AY065790 (ref. 1) DQ785938 AY336591 (ref. 4)
Neodrepanis coruscans
Madagascar, 1924 NRM 569385 DQ785976 DQ785936 DQ785900
Furnarius cristatus
NRM 966772 AY064255 (ref. 2) DQ435482 (ref. 7) AY590066 (ref. 6)
Rhinocrypta lanceolata
NRM 966793 AY065775 (ref. 1) DQ435499 (ref. 7) DQ438953 (ref. 7)
Conopophaga aurita
ZMUC S1245 AY065784 (ref. 1)
Conopophaga lineata
NRM 956653 DQ435478 (ref. 7) AY336577 (ref. 4)
Thamnophilus
caerulescens
NRM 967007 AY065783 (ref. 1) DQ435504 (ref. 7) AY336587 (ref. 4)
Pyroderus scutatus
NRM 967030 AY065786 (ref. 1) DQ435498 (ref. 7) AY336582 (ref. 4)
Pipra fasciicauda
NRM 947271 AY065787 (ref. 1) DQ435495 (ref. 7) AY336583 (ref. 4)
Tityra cayana
NRM 956584 AY338742 (ref. 4) DQ435505 (ref. 7) AY336580 (ref. 4)
Tyrannus savana
NRM 976722 AY165826 (ref. 5) DQ435507 (ref. 7) AY336579 (ref. 4)
Passer montanus
NRM 976359 AY228311 (ref. 3) DQ785937 AY336586 (ref. 4)
Phylogeny of Old World suboscines
•
M. Irestedt
et al
.
570
Zoologica Scripta,
35
, 6, November 2006, pp567–580 • © 2006 The Authors. Journal compilation © 2006 The Norwegian Academy of Science and Letters
primer-designing programs accessible via the internet, e.g.cybergene (http://www.cybergene.se/primer.html), wereused to check the primer’s melting temperatures, indicationof palindrome or hairpin loop structures, etc. To avoidprimer combinations that form primer dimers, all primercombinations were finally checked with the program Amplify(Engels 1993). We tried to use primers with similar meltingtemperatures (
c.
60–65
°
C) that amplified fragments of 300–350 bp. We used hot-start touchdown PCR, with annealingtemperatures for the first cycles generally just 1–2
°
C belowthe melting temperature of the primer with the lowest meltingtemperature. A representative thermocycling program for agiven primer combination started with initial denaturation at95
°
C for 5 min, followed by four cycles of 95
°
C for 30 s,60
°
C for 30 s, 72
°
C, and another four-cycle phase and one36-cycle phase with identical temperatures and intervals,except that the annealing temperatures were reduced to58
°
C and 56
°
C, respectively. The thermocycling programended with 72
°
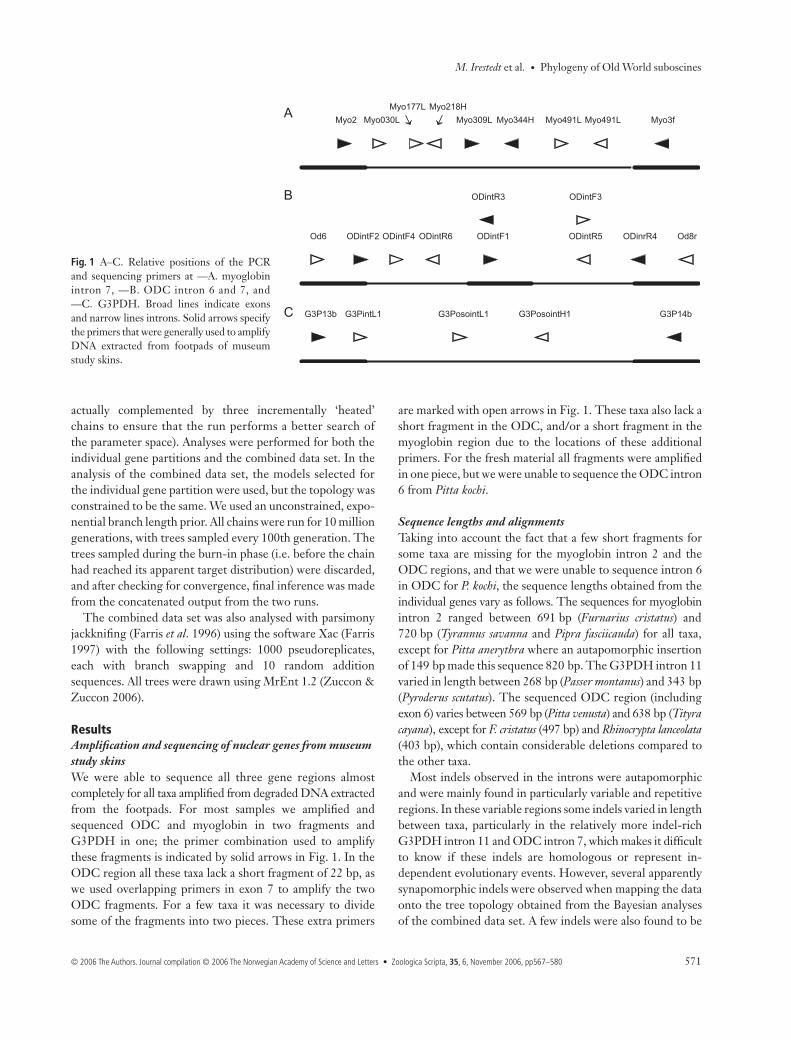
C for 5 min. The primer sequences are listedin Table 2 and their locations in the gene regions are shownin Fig. 1.
Although the primers used for the skin samples werecarefully designed, the PCR products often contained primerdimers or non-specific bands of shorter size than the desiredfragment. To remove these, the PCR products were routinely
loaded on to an agarose gel while the proper band was excisedand cleaned of gel material using QG buffer in conjunction withthe QIAquick PCR Purification Kit (Qiagen). Distinct bandswere sequenced directly, while faint bands were re-amplifiedusing identical primer combinations and PCR-program.
Phylogenetic inference and model selection
As there were relatively few insertions in the introns, thecombined sequences could easily be aligned by eye. All gapshave been treated as missing data in the analyses. Bayesianinference (see e.g. Holder & Lewis 2003; Huelsenbeck
et al
.2001) was used to estimate the phylogenetic relationships.The models for nucleotide substitutions used in the analyseswere selected for each gene individually by applying theAkaike Information Criterion (AIC, Akaike 1973) and theprogram MrModeltest 2.2 (Nylander 2005) in conjunctionwith
PAUP
* (Swofford 1998).Posterior probabilities of trees and parameters in the
substitution models were approximated with MCMC andMetropolis coupling using the program MrBayes 3.1.1(Ronquist & Huelsenbeck 2003). In this version of MrBayes,two chains starting from different randomly chosen trees runsimultaneously in order to calculate the standard deviationof split frequencies; this ensures that the individual runshave converged on the same target distribution (each chain is
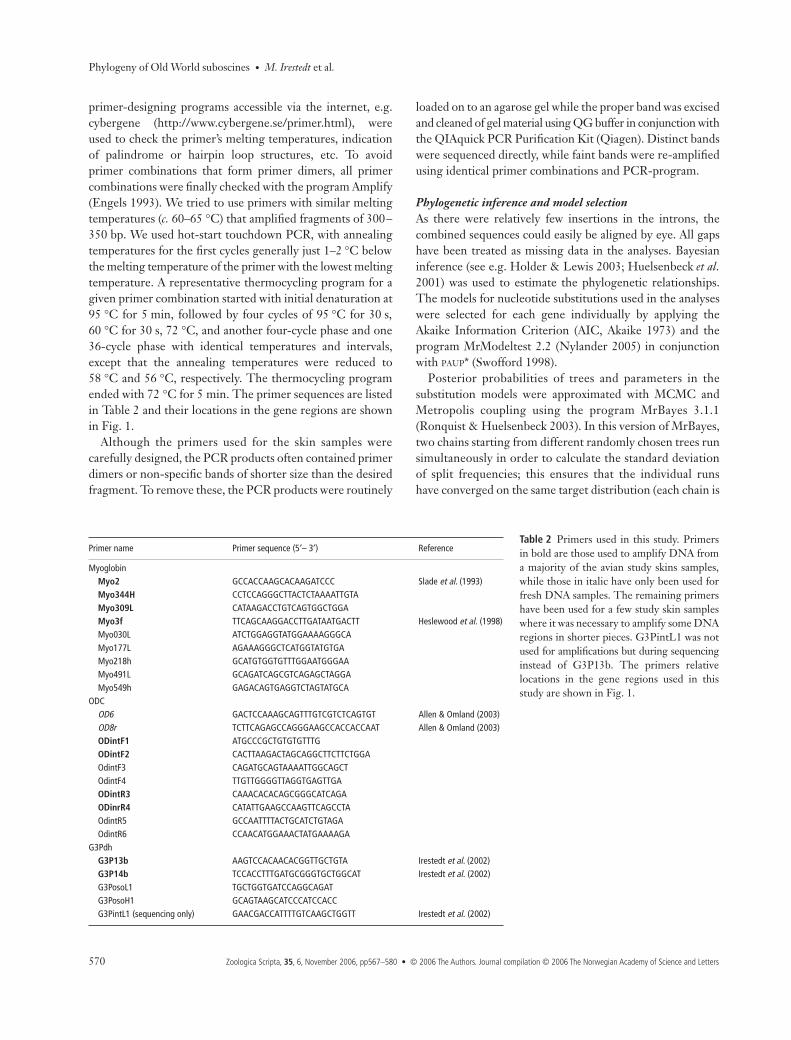
Table 2 Primers used in this study. Primersin bold are those used to amplify DNA froma majority of the avian study skins samples,while those in italic have only been used forfresh DNA samples. The remaining primershave been used for a few study skin sampleswhere it was necessary to amplify some DNAregions in shorter pieces. G3PintL1 was notused for amplifications but during sequencinginstead of G3P13b. The primers relativelocations in the gene regions used in thisstudy are shown in Fig. 1.
Primer name Primer sequence (5′– 3′) Reference
MyoglobinMyo2 GCCACCAAGCACAAGATCCC Slade et al. (1993)Myo344H CCTCCAGGGCTTACTCTAAAATTGTAMyo309L CATAAGACCTGTCAGTGGCTGGAMyo3f TTCAGCAAGGACCTTGATAATGACTT Heslewood et al. (1998)Myo030L ATCTGGAGGTATGGAAAAGGGCAMyo177L AGAAAGGGCTCATGGTATGTGAMyo218h GCATGTGGTGTTTGGAATGGGAAMyo491L GCAGATCAGCGTCAGAGCTAGGAMyo549h GAGACAGTGAGGTCTAGTATGCA
ODCOD6 GACTCCAAAGCAGTTTGTCGTCTCAGTGT Allen & Omland (2003)OD8r TCTTCAGAGCCAGGGAAGCCACCACCAAT Allen & Omland (2003)ODintF1 ATGCCCGCTGTGTGTTTGODintF2 CACTTAAGACTAGCAGGCTTCTTCTGGAOdintF3 CAGATGCAGTAAAATTGGCAGCTOdintF4 TTGTTGGGGTTAGGTGAGTTGAODintR3 CAAACACACAGCGGGCATCAGAODinrR4 CATATTGAAGCCAAGTTCAGCCTAOdintR5 GCCAATTTTACTGCATCTGTAGAOdintR6 CCAACATGGAAACTATGAAAAGA
G3PdhG3P13b AAGTCCACAACACGGTTGCTGTA Irestedt et al. (2002)G3P14b TCCACCTTTGATGCGGGTGCTGGCAT Irestedt et al. (2002)G3PosoL1 TGCTGGTGATCCAGGCAGATG3PosoH1 GCAGTAAGCATCCCATCCACCG3PintL1 (sequencing only) GAACGACCATTTTGTCAAGCTGGTT Irestedt et al. (2002)
M. Irestedt et al. • Phylogeny of Old World suboscines
© 2006 The Authors. Journal compilation © 2006 The Norwegian Academy of Science and Letters • Zoologica Scripta, 35, 6, November 2006, pp567–580 571
actually complemented by three incrementally ‘heated’chains to ensure that the run performs a better search ofthe parameter space). Analyses were performed for both theindividual gene partitions and the combined data set. In theanalysis of the combined data set, the models selected forthe individual gene partition were used, but the topology wasconstrained to be the same. We used an unconstrained, expo-nential branch length prior. All chains were run for 10 milliongenerations, with trees sampled every 100th generation. Thetrees sampled during the burn-in phase (i.e. before the chainhad reached its apparent target distribution) were discarded,and after checking for convergence, final inference was madefrom the concatenated output from the two runs.
The combined data set was also analysed with parsimonyjackknifing (Farris et al. 1996) using the software Xac (Farris1997) with the following settings: 1000 pseudoreplicates,each with branch swapping and 10 random additionsequences. All trees were drawn using MrEnt 1.2 (Zuccon &Zuccon 2006).
ResultsAmplification and sequencing of nuclear genes from museum study skinsWe were able to sequence all three gene regions almostcompletely for all taxa amplified from degraded DNA extractedfrom the footpads. For most samples we amplified andsequenced ODC and myoglobin in two fragments andG3PDH in one; the primer combination used to amplifythese fragments is indicated by solid arrows in Fig. 1. In theODC region all these taxa lack a short fragment of 22 bp, aswe used overlapping primers in exon 7 to amplify the twoODC fragments. For a few taxa it was necessary to dividesome of the fragments into two pieces. These extra primers
are marked with open arrows in Fig. 1. These taxa also lack ashort fragment in the ODC, and/or a short fragment in themyoglobin region due to the locations of these additionalprimers. For the fresh material all fragments were amplifiedin one piece, but we were unable to sequence the ODC intron6 from Pitta kochi.
Sequence lengths and alignmentsTaking into account the fact that a few short fragments forsome taxa are missing for the myoglobin intron 2 and theODC regions, and that we were unable to sequence intron 6in ODC for P. kochi, the sequence lengths obtained from theindividual genes vary as follows. The sequences for myoglobinintron 2 ranged between 691 bp (Furnarius cristatus) and720 bp (Tyrannus savanna and Pipra fasciicauda) for all taxa,except for Pitta anerythra where an autapomorphic insertionof 149 bp made this sequence 820 bp. The G3PDH intron 11varied in length between 268 bp (Passer montanus) and 343 bp(Pyroderus scutatus). The sequenced ODC region (includingexon 6) varies between 569 bp (Pitta venusta) and 638 bp (Tityracayana), except for F. cristatus (497 bp) and Rhinocrypta lanceolata(403 bp), which contain considerable deletions compared tothe other taxa.
Most indels observed in the introns were autapomorphicand were mainly found in particularly variable and repetitiveregions. In these variable regions some indels varied in lengthbetween taxa, particularly in the relatively more indel-richG3PDH intron 11 and ODC intron 7, which makes it difficultto know if these indels are homologous or represent in-dependent evolutionary events. However, several apparentlysynapomorphic indels were observed when mapping the dataonto the tree topology obtained from the Bayesian analysesof the combined data set. A few indels were also found to be
Fig. 1 A–C. Relative positions of the PCRand sequencing primers at —A. myoglobinintron 7, —B. ODC intron 6 and 7, and—C. G3PDH. Broad lines indicate exonsand narrow lines introns. Solid arrows specifythe primers that were generally used to amplifyDNA extracted from footpads of museumstudy skins.
Phylogeny of Old World suboscines • M. Irestedt et al.
572 Zoologica Scripta, 35, 6, November 2006, pp567–580 • © 2006 The Authors. Journal compilation © 2006 The Norwegian Academy of Science and Letters
incongruent with the phylogenetic tree obtained from theanalysis of the combined data set. These were generallyfound in the most variable regions and some of the single basepair insertions actually consist of different bases. For moredetails of indel length and positions see the alignments ofthe individual gene regions deposited at EMBL, accessionnumbers ALIGN_001037 (myoglobin), ALIGN_001038(ODC), ALIGN_001039 (G3PDH).
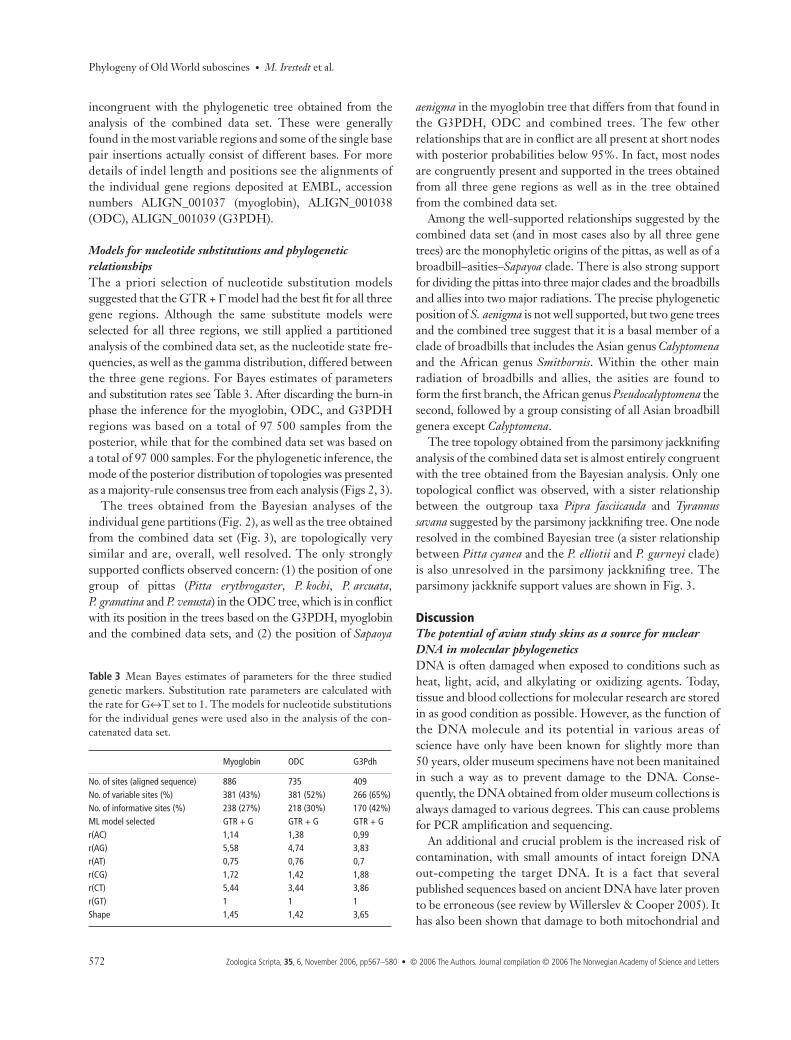
Models for nucleotide substitutions and phylogenetic relationshipsThe a priori selection of nucleotide substitution modelssuggested that the GTR + Γ model had the best fit for all threegene regions. Although the same substitute models wereselected for all three regions, we still applied a partitionedanalysis of the combined data set, as the nucleotide state fre-quencies, as well as the gamma distribution, differed betweenthe three gene regions. For Bayes estimates of parametersand substitution rates see Table 3. After discarding the burn-inphase the inference for the myoglobin, ODC, and G3PDHregions was based on a total of 97 500 samples from theposterior, while that for the combined data set was based ona total of 97 000 samples. For the phylogenetic inference, themode of the posterior distribution of topologies was presentedas a majority-rule consensus tree from each analysis (Figs 2, 3).
The trees obtained from the Bayesian analyses of theindividual gene partitions (Fig. 2), as well as the tree obtainedfrom the combined data set (Fig. 3), are topologically verysimilar and are, overall, well resolved. The only stronglysupported conflicts observed concern: (1) the position of onegroup of pittas (Pitta erythrogaster, P. kochi, P. arcuata,P. granatina and P. venusta) in the ODC tree, which is in conflictwith its position in the trees based on the G3PDH, myoglobinand the combined data sets, and (2) the position of Sapaoya
aenigma in the myoglobin tree that differs from that found inthe G3PDH, ODC and combined trees. The few otherrelationships that are in conflict are all present at short nodeswith posterior probabilities below 95%. In fact, most nodesare congruently present and supported in the trees obtainedfrom all three gene regions as well as in the tree obtainedfrom the combined data set.
Among the well-supported relationships suggested by thecombined data set (and in most cases also by all three genetrees) are the monophyletic origins of the pittas, as well as of abroadbill–asities–Sapayoa clade. There is also strong supportfor dividing the pittas into three major clades and the broadbillsand allies into two major radiations. The precise phylogeneticposition of S. aenigma is not well supported, but two gene treesand the combined tree suggest that it is a basal member of aclade of broadbills that includes the Asian genus Calyptomenaand the African genus Smithornis. Within the other mainradiation of broadbills and allies, the asities are found toform the first branch, the African genus Pseudocalyptomena thesecond, followed by a group consisting of all Asian broadbillgenera except Calyptomena.
The tree topology obtained from the parsimony jackknifinganalysis of the combined data set is almost entirely congruentwith the tree obtained from the Bayesian analysis. Only onetopological conflict was observed, with a sister relationshipbetween the outgroup taxa Pipra fasciicauda and Tyrannussavana suggested by the parsimony jackknifing tree. One noderesolved in the combined Bayesian tree (a sister relationshipbetween Pitta cyanea and the P. elliotii and P. gurneyi clade)is also unresolved in the parsimony jackknifing tree. Theparsimony jackknife support values are shown in Fig. 3.
DiscussionThe potential of avian study skins as a source for nuclear DNA in molecular phylogeneticsDNA is often damaged when exposed to conditions such asheat, light, acid, and alkylating or oxidizing agents. Today,tissue and blood collections for molecular research are storedin as good condition as possible. However, as the function ofthe DNA molecule and its potential in various areas ofscience have only have been known for slightly more than50 years, older museum specimens have not been manitainedin such a way as to prevent damage to the DNA. Conse-quently, the DNA obtained from older museum collections isalways damaged to various degrees. This can cause problemsfor PCR amplification and sequencing.
An additional and crucial problem is the increased risk ofcontamination, with small amounts of intact foreign DNAout-competing the target DNA. It is a fact that severalpublished sequences based on ancient DNA have later provento be erroneous (see review by Willerslev & Cooper 2005). Ithas also been shown that damage to both mitochondrial and
Table 3 Mean Bayes estimates of parameters for the three studiedgenetic markers. Substitution rate parameters are calculated withthe rate for G↔T set to 1. The models for nucleotide substitutionsfor the individual genes were used also in the analysis of the con-catenated data set.
Myoglobin ODC G3Pdh
No. of sites (aligned sequence) 886 735 409No. of variable sites (%) 381 (43%) 381 (52%) 266 (65%)No. of informative sites (%) 238 (27%) 218 (30%) 170 (42%)ML model selected GTR + G GTR + G GTR + Gr(AC) 1,14 1,38 0,99r(AG) 5,58 4,74 3,83r(AT) 0,75 0,76 0,7r(CG) 1,72 1,42 1,88r(CT) 5,44 3,44 3,86r(GT) 1 1 1Shape 1,45 1,42 3,65

M. Irestedt et al. • Phylogeny of Old World suboscines
© 2006 The Authors. Journal compilation © 2006 The Norwegian Academy of Science and Letters • Zoologica Scripta, 35, 6, November 2006, pp567–580 573
nuclear ancient DNA could lead to artifactual sequences(Binladen et al. 2005). However, the specimens used in thesestudies are much older, and it might be assumed that theycontain smaller amounts of DNA that is more damaged (andtherefore likely to be much more sensitive to contamination),than that extracted from museum study skins that are typically25–100 years old.
If some preventive measures are taken, such as keeping theDNA extracted from the footpads of the study skins separ-ately from fresh avian DNA samples, never amplifying DNAfrom fresh and old samples together, and generally handlingold DNA material carefully (e.g. using sterilized filter tips),our results suggest that the risk of contamination should berather low for avian study skins. However, the fragment sizethat is targeted by a given primer combination is probablyalso an important factor when attempting to minimizecontamination. Most samples extracted from footpads producedistinct bands for fragments of around 200 bp, while thestrength of the bands is generally weaker or sometimes non-existent for fragments of around 350 bp. This indicates that
most samples contain a fairly good amount of DNA (whenmeasuring the concentration of a few samples found to containbetween 2 and 8 µg/µl DNA) but that longer fragments onlyexist in small numbers.
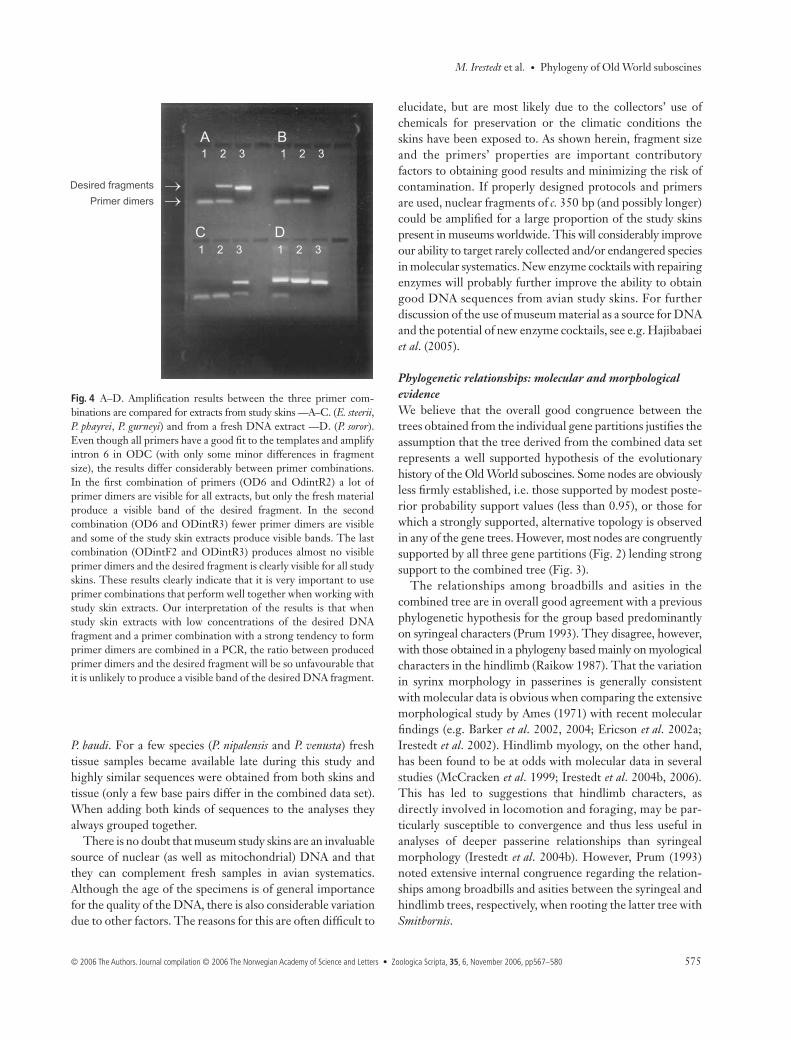
Thus, primer combinations for fragments that are too longmost likely increase the risk of a poor ratio between thedesired fragment and contaminants (if present). Not only isthe length of the target fragment as defined by the primersvital, but how well a given primer pair act together is alsocritical to obtaining good results, possibly reducing the risk ofcontamination. In Fig. 4 the amplification results producedby the three primer combinations are compared. Even thoughthe primers have a good fit to the templates and amplifyvirtually the same region (with only minor differences infragment size), the results differ considerably. One of thecombinations also forms a lot of primer dimers and thedesired fragment is clearly visible only for the fresh DNAextract. In the second combination fewer primer dimers arevisible and some of the study skin extracts produce visiblebands. In the last combination, which produces almost no
Fig. 2 A–C. The majority rule consensus trees obtained from the Bayesian analyses of the individual genes. —A. Tree obtained from theanalyses of the myoglobin intron 2 data set. —B. Tree obtained from the Bayesian analyses of the ODC (ornithine decarboxylase) intron 6 and7 data set. —C. Tree obtained from the analyses of G3PDH (glyceraldehydes-3-phosphodehydrogenase) intron 11 data set. Posteriorprobability values 95% and above are indicated with an asterisk at the branch.
Phylogeny of Old World suboscines • M. Irestedt et al.
574 Zoologica Scripta, 35, 6, November 2006, pp567–580 • © 2006 The Authors. Journal compilation © 2006 The Norwegian Academy of Science and Letters
visible primer dimers, the desired fragment is clearly visiblefor all study skins. This result clearly indicates the importanceof using primer combinations with good properties when thedesired template fragment exists in low concentration, asmost of the primers otherwise might form primer dimersinstead of building up the required fragment.
We have found no reason to suspect that any of thesequences obtained from the museum study skins examinedin this study are erroneous. It should be noted, however, that afew extractions that produced noisy sequence chromatogramswere discarded and replaced by others. Unique sequences
were obtained from all three gene regions from all taxa rep-resented by museum study skin. Furthermore, their phylogeneticpositions in the individual gene trees were congruent, whichmakes sense both with respect to what is known from non-molecular characters such as plumage patterns and fromcomparisons with the DNA from fresh material of relatedspecies. For example, the skin sequences from Eurylaimusochromalus grouped with the sequences from fresh material ofE. javanicus; Pitta arcuata and P. granatina grouped withP. venusta; P. reichenowi grouped with P. angolensis; and P. gurneyi,P. cyanea and P. guajana formed a clade with P. elliotii and
Fig. 3 The 50% majority rule consensus treeobtained from the analyses of the combineddata set (myoglobin intron 2, ODC intron 6and 7, and G3PDH intron 11). Posteriorprobability values and jackknife supportvalues above 50% are indicated are indicatedat the nodes.
M. Irestedt et al. • Phylogeny of Old World suboscines
© 2006 The Authors. Journal compilation © 2006 The Norwegian Academy of Science and Letters • Zoologica Scripta, 35, 6, November 2006, pp567–580 575
P. baudi. For a few species (P. nipalensis and P. venusta) freshtissue samples became available late during this study andhighly similar sequences were obtained from both skins andtissue (only a few base pairs differ in the combined data set).When adding both kinds of sequences to the analyses theyalways grouped together.
There is no doubt that museum study skins are an invaluablesource of nuclear (as well as mitochondrial) DNA and thatthey can complement fresh samples in avian systematics.Although the age of the specimens is of general importancefor the quality of the DNA, there is also considerable variationdue to other factors. The reasons for this are often difficult to
elucidate, but are most likely due to the collectors’ use ofchemicals for preservation or the climatic conditions theskins have been exposed to. As shown herein, fragment sizeand the primers’ properties are important contributoryfactors to obtaining good results and minimizing the risk ofcontamination. If properly designed protocols and primersare used, nuclear fragments of c. 350 bp (and possibly longer)could be amplified for a large proportion of the study skinspresent in museums worldwide. This will considerably improveour ability to target rarely collected and/or endangered speciesin molecular systematics. New enzyme cocktails with repairingenzymes will probably further improve the ability to obtaingood DNA sequences from avian study skins. For furtherdiscussion of the use of museum material as a source for DNAand the potential of new enzyme cocktails, see e.g. Hajibabaeiet al. (2005).
Phylogenetic relationships: molecular and morphological evidenceWe believe that the overall good congruence between thetrees obtained from the individual gene partitions justifies theassumption that the tree derived from the combined data setrepresents a well supported hypothesis of the evolutionaryhistory of the Old World suboscines. Some nodes are obviouslyless firmly established, i.e. those supported by modest poste-rior probability support values (less than 0.95), or those forwhich a strongly supported, alternative topology is observedin any of the gene trees. However, most nodes are congruentlysupported by all three gene partitions (Fig. 2) lending strongsupport to the combined tree (Fig. 3).
The relationships among broadbills and asities in thecombined tree are in overall good agreement with a previousphylogenetic hypothesis for the group based predominantlyon syringeal characters (Prum 1993). They disagree, however,with those obtained in a phylogeny based mainly on myologicalcharacters in the hindlimb (Raikow 1987). That the variationin syrinx morphology in passerines is generally consistentwith molecular data is obvious when comparing the extensivemorphological study by Ames (1971) with recent molecularfindings (e.g. Barker et al. 2002, 2004; Ericson et al. 2002a;Irestedt et al. 2002). Hindlimb myology, on the other hand,has been found to be at odds with molecular data in severalstudies (McCracken et al. 1999; Irestedt et al. 2004b, 2006).This has led to suggestions that hindlimb characters, asdirectly involved in locomotion and foraging, may be par-ticularly susceptible to convergence and thus less useful inanalyses of deeper passerine relationships than syringealmorphology (Irestedt et al. 2004b). However, Prum (1993)noted extensive internal congruence regarding the relation-ships among broadbills and asities between the syringeal andhindlimb trees, respectively, when rooting the latter tree withSmithornis.
Fig. 4 A–D. Amplification results between the three primer com-binations are compared for extracts from study skins —A–C. (E. steerii,P. phayrei, P. gurneyi) and from a fresh DNA extract —D. (P. soror).Even though all primers have a good fit to the templates and amplifyintron 6 in ODC (with only some minor differences in fragmentsize), the results differ considerably between primer combinations.In the first combination of primers (OD6 and OdintR2) a lot ofprimer dimers are visible for all extracts, but only the fresh materialproduce a visible band of the desired fragment. In the secondcombination (OD6 and ODintR3) fewer primer dimers are visibleand some of the study skin extracts produce visible bands. The lastcombination (ODintF2 and ODintR3) produces almost no visibleprimer dimers and the desired fragment is clearly visible for all studyskins. These results clearly indicate that it is very important to useprimer combinations that perform well together when working withstudy skin extracts. Our interpretation of the results is that whenstudy skin extracts with low concentrations of the desired DNAfragment and a primer combination with a strong tendency to formprimer dimers are combined in a PCR, the ratio between producedprimer dimers and the desired fragment will be so unfavourable thatit is unlikely to produce a visible band of the desired DNA fragment.
Phylogeny of Old World suboscines • M. Irestedt et al.
576 Zoologica Scripta, 35, 6, November 2006, pp567–580 • © 2006 The Authors. Journal compilation © 2006 The Norwegian Academy of Science and Letters
The topological conflicts that do exist between the com-bined tree and the interpretations by Prum (1993) concernthe relative position of some basal broadbills. While Prum(1993) found Smithornis to be the sister taxon (with Calyptomenaas the next branch up) to all other broadbills and the asities,our phylogeny suggests that Calyptomena and Smithornis (andpossibly Sapayoa aenigma) form their own clade that is sisterto the other broadbills and the asities. It is noticeable that thisdiscrepancy is supported not by syrinx morphology but bytwo skeletal characters. This disagreement could thus possiblybe explained by these skeletal characters being less consistentthan previously assumed. The conflict between the combinedtree and the syrinx data regarding the position of Pseudocaly-ptomena graueri is more difficult to explain, but could possiblybe due to a local rooting problem. Of the morphologicalcharacters re-evaluated by Olson (1971), a vinculum betweenthe deep plantar tendons (a character used to set broadbillsapart from other passerine birds in the early classifications)was the only distinctive morphological character of the familynot shared with one or more other group of suboscines.Later, Raikow (1987) found a vinculum also in asities, inagreement with the nested position of the asities within thebroadbills suggested herein. The observation of a weak andsometimes absent vinculum in Calyptomena and Smithornisagrees with the major division of broadbills and asities sug-gested by our data. Our phylogeny is also consistent with thesuggestion by Dekker & Dickinson (2000) that the broadbillsin the Philippines (Mindanao wattled broadbill and Visayanwattled broadbill) are better placed in a genus of their own,Sarcophanops, than in the genus Eurylaimus in which they areplaced in most classifications.
Pittas have been poorly represented in analyses of passerinesystematics employing modern techniques and phylogeneticmethods. The morphological analysis by Raikow (1987) andthe DNA−DNA hybridization study of Sibley & Ahlquist(1990) both included only four species of pittas each. Presentknowledge of the evolutionary relationships among pittasthus virtually rests on interpretations based on externalsimilarities (e.g. Whitehead 1893; Erritzoe & Erritzoe 1998).Nevertheless, the phylogenetic relationships suggestedherein based on molecular data in many respects agree wellwith these phenetic studies.
The tree obtained from the combined data set supports theradiations of three major groups of pittas. The first is formedby Pitta arcuata, P. granatina, P. venusta, P. erythrogaster andP. kochi. These pittas have previously been suggested as beingclosely related based on external morphology (e.g. Whitehead1893; Wolters 1982; Lambert & Woodcock 1996), with theextensive crimson/red coloration of the underparts the mostdistinctive character. All these species also have greenish orbluish backs, short tails, and most are small-sized. In linewith previous opinion our phylogeny also suggests that this
group can be further subdivided into two evolutionarygroups, the first formed by P. kochi and P. erythrogaster, thesecond by P. arcuata, P. granatina and P. venusta. Althoughour phylogeny includes all the pitta species that belong tothis major radiation according to Erritzoe (2003), the groupneeds further investigation, as both P. erythrogaster andP. granatina comprise several subspecies/populations withdisjunct distributions. It is worth noting that P. kochi, P. arcuata,and P. venusta have sympatric distribution with P. erythrogasterand P. granatina, respectively, although their altitude prefer-ences differ somewhat (Lambert & Woodcock 1996; Erritzoe& Erritzoe 1998). It may be that P. kochi, P. arcuata, andP. venusta are autapomorphic, mountain radiations derivedfrom ancestral stocks of P. erythrogaster and P. granatina, thusrendering the latter two taxa nonmonophyletic.
The second, major radiation of pittas consists of a ratherheterogeneous assemblage of species (Pitta elliotii, P. gurneyi,P. cyanea, P. baudi, P. guajana, P. caerulea, P. nipalensis, P. soror,P. oatesi, and P. phayrei) that could be subdivided into threeclades. Of these, P. phayrei forms the most basal clade,P. nipalensis, P. soror and P. oatesi a second clade. The lastclade consists of the remaining species. Such a divisionagrees rather well with morphology and with earlier studies(Whitehead 1893; Wolters 1982), although P. caerulea (probablytogether with P. schneideri, not included here) and P. baudi areoften kept separate from the other species in the third clade.However, P. cyanea has, based on its plumage with a blue back anda banded belly, sometimes been suggested as an ‘evolutionarylink’ that unites P. caerulea and P. schneideri with P. elliotii,P. gurneyi, and P. guajana (Erritzoe 2003). Plumage similari-ties have also been used as an indication that P. caerulea andP. schneideri should be grouped together with P. nipalensis,P. soror and P. oatesi (Lambert & Woodcock 1996). P. phayrei,the taxon suggested to form the most basal branch within thisradiation, has always been considered a very aberrant speciesof pitta, based on its autapomorphic cryptic coloration, slenderdecurved bill, and rather short legs. In some classifications itis placed in its own genus, Anthocincla, and it has also beenproposed as being the most ‘primitive’ pitta — the sister to allother pittas (Erritzoe 2003). However, the systematic positionof P. phayrei within the second major radiation of pittas issupported by its possession of sexual dimorphism. Sexualdimorphism occurs in all other species within this radiation,but is absent in all other pitta species. Another synapomorphyfor the clade is possibly the possession of cryptic juvenileplumage. This condition is present in all species for which ithas been studied (Erritzoe 2003).
While the first two clades have their distributions con-centrated to South-east Asia and the Sunda Islands (Pittaerythrogaster is an exception being distributed from thePhilippines to Australia, with many distinct subspecies inhabitingthe different islands), the third major radiation of pittas has a
M. Irestedt et al. • Phylogeny of Old World suboscines
© 2006 The Authors. Journal compilation © 2006 The Norwegian Academy of Science and Letters • Zoologica Scripta, 35, 6, November 2006, pp567–580 577
much wider distribution, with members being found all theway from Africa to Australia. Most species within this radiationhave rather uniform plumages, i.e. P. angolensis, P. brachyura,P. moluccensis, P. nympha, P. versicolor, P. elegans, P. anerythraand P. megarhyncha (not studied herein), with green upperpartswith a blue wing-patch, and cinnamon-buff underparts with(in most species) a red vent. All species also have dark heads,often with paler supercilium, and many species also show awhite wing-patch in flight. However, P. reichenowi, P. sordida,P. steerii, P. iris, P. superba and P. maxima more or less differfrom the general plumage pattern described above. Theplumages of P. reichenowi, P. sordida, P. steerii and P. iris differfrom the above in the colouration of the underparts. P. superbaand P. maxima, on the other hand, have also a different colouron their backs. These differences are probably the reasonwhy the affinities of the latter two species have been difficultto untangle (Erritzoe 2003). Nevertheless, both species haveretained several plumage features that are typical for thisgroup, such as a blue wing-patch and a red vent.
Noticeably, several species within this third clade of pittasare migratory, and the distributions of migratory and sedentaryspecies, respectively, in the combined tree suggest that amigratory habit is plesiomorphic within this radiation. Ourresults thus support the idea of a migratory ancestor givingrise to the species found in remote areas like Halmahera,Manus, the Solomon Islands, and Australia (Lambert &Woodcock 1996). It is also worth noting that species such asPitta angolensis, P. brachyura, P. moluccensis, P. nympha, P. versicolorand P. sordida (and possibly also some of the subspecies ofP. elegans) that do perform migratory movements (Lambert &Woodcock 1996), generally have retained the typical plesio-morphic plumage pattern of the group (P. sordida differs inhaving green underparts). In contrast, sedentary species onislands or remote landmasses have much more derivedplumages. This suggests that the shift in habit, from beingmigratory to becoming sedentary on small islands or on remotelandmasses would have promoted plumage diversificationwithin this radiation of pittas. It remains to be clarified whetherplumage diversification is constrained by the migratory habit(migrating birds may need the camouflage provided by aduller plumage, or that the energy-cost for migration mayhave reduced the ability for plumage diversification). A differentexplanation could be that genetic drift in small, sedentarypopulations has promoted plumage diversification.
The phylogeny of the Old World suboscines, and espe-cially the inclusion of the neotropical Sapayoa aenigma in theclade, raises some biogeographical questions. There are datathat suggest that the earliest evolution of the passerines tookplace in Gondwana during the late Cretaceous (Barker et al.2002, 2004; Ericson et al. 2002a). After the break-up ofGondwana the Old World suboscines appear to have evolvedon the Indian tectonic plate (Ericson et al. 2003). It has been
hypothesized that the ancestor of S. aenigma colonized SouthAmerica from Antarctica in a ‘second wave’, after the phylo-genetic lineages leading to the New World and Old Worldsuboscines, respectively, had split (Fjeldså et al. 2003). Alter-natively the S. aenigma ancestor could have spread from theOld World to the New World either eastwards via Beringiaor westwards via Greenland. Both routes at times alloweddispersal of tropical organisms in the Tertiary. The presentdistribution of the members of the basal lineages of Old Worldsuboscines gives little information about the geographicalorigin of the group as such — all major tropical areas are equallylikely. An exception is the larger clade of broadbills wherethe asities and Pseudocalyptomena form the basal branchesimplying a Madagascan or African origin. Members of thisgroup subsequently dispersed to Asia.
ClassificationOur phylogenetic hypothesis firmly places Sapayoa amongthe asities and broadbills. There is also weak support forplacing Sapayoa as sister to Calyptomena and Smithornis, andthese as the sister group to Philepittidae and the remainingEurylaimidae. This is not compatible with the retention ofthe families Eurylaimidae and Philepittidae in the traditionalsense (e.g. del Hoyo et al. 2003; Dickinson 2003), as this wouldmake Eurylaimidae paraphyletic. One way of reconciling thiswould be to treat all these as one family (Eurylaimidae). Webelieve that this is a less attractive solution, as Sapayoaundoubtedly is a very isolated taxon both morphologicallyand biogeographically, and we advocate its treatment in afamily of its own. The molecular data leave no doubt as to theinclusion of Sapayoa among the Old World suboscines,although this taxon differs from all other members of thisgroup in having intrinsic syringeal musculature (Prum 1990).Although the family name Sapayoaidae has already appearedin print (Dickinson et al. 2003), it is not available because,when originally proposed, it did not meet the requirementsof the Code (ICZN 1999), viz. Articles 13.1 (statement ofdifferences from other similar taxa), 16.1 (statement of being anew name) and 16.2 (designation of the type genus). We thuspropose the new family name Sapayoidae (type genus SapayoaHartert, 1903) for the monotypic Sapayoa aenigma. Weregard the spelling proposed here as more euphonious thanSapayoaidae.
The genera Smithornis and Calyptomena must be removedfrom Eurylaimidae and placed in a separate family. We thuspropose resurrecting the family name CalyptomenidaeBonaparte, 1850, which takes precedence over SmithornithidaeBonaparte, 1853, for these two genera. Our results also showthat the genus Eurylaimus, as currently defined (e.g. del Hoyoet al. 2003), is not monophyletic. Consequently we proposerestricting the name Eurylaimus Horsfield, 1821 to the speciesE. javanicus and E. ochromalus, and to resurrect the genus
Phylogeny of Old World suboscines • M. Irestedt et al.
578 Zoologica Scripta, 35, 6, November 2006, pp567–580 • © 2006 The Authors. Journal compilation © 2006 The Norwegian Academy of Science and Letters
name Sarcophanops Sharpe, 1877 for the species steeri andsamarensis (the latter taxon has not been included in our study,but it shares a similar morphology and biogeographicaldistribution with steerii). Our results show strong support for asister clade relationship between the asities and the remainingbroadbills. Although the inclusion of Philepittidae in a restrictedEurylaimidae, as proposed by Prum (1993), is consistent withour data, we prefer to keep them as separate families to high-light their morphological and behavioural distinctiveness.Therefore we restrict the family Eurylaimidae to include thegenera Pseudocalyptomena, Psarisomus, Corydon, Sarcophanops,Serilophus, Cymbirhynchus and Eurylaimus, and propose tomaintain the family Philepittidae for the genera Philepitta andNeodrepanis.
Pittidae is a very well defined and superficially homogeneousfamily. In most modern classifications all species have beenincluded in a single genus, Pitta, although a resurrection ofseveral genera used in the older literature was preferred byWolters (1982). We feel that the division of Pittidae intothree reciprocally well-supported and morphologicallycoherent clades should be reflected in the classification.Therefore, we propose that the name Pitta Vieillot, 1816should be restricted to the third clade (reichenowi throughiris), that the first clade (granatina through erythrogaster)should be separated as Erythropitta Bonaparte, 1854 and thatthe second clade (phayrei through elliotii) should be separatedas Hydrornis Blyth, 1843. The latter clade is the most hetero-geneous in morphology, although all members are united intheir exhibition of sexual plumage dimorphism and possiblyalso by the presence of a distinctive spotted juvenile plumage.
AcknowledgementsTissue and/or footpad samples were obtained from thefollowing: Museum Victoria, Melbourne (Les Christidis),Zoological Museum, University of Copenhagen (Jon Fjeldsåand Jan Bolding Kristensen), Muséum National d’HistoireNaturelle, Paris (Eric Pasquet), Senckenberg Fors-chungsinstitut and Naturmuseum (Gerald Mayr), Academyof Natural Science, Philadelphia (Leo Joseph), Field Museum ofNatural History (David E. Willard), National Museum ofNatural History, Leiden (Réne Dekker), National Museumof Natural History, Smithsonian Institution (James Dean,Storrs L. Olson), University of Washington, Burke Museum(Sharon Birks), Yale University, Peabody Museum (RichardO. Prum). Jon Fjeldså and two anonymous reviewers arethanked for comments on the manuscript, and Pia Eldenäsand Keyvan Mirbakhsh are thanked for practical support inthe laboratory. Fieldwork in Vietnam was supported by agrant within the Swedish Research Links programme toNguyen Cu and Per Ericson. The Swedish Research Council(grant no. 621-2004-2913 to P.E.) funded the laboratorywork.
ReferencesAkaike, H. (1973). Information theory as an extension of the
maximum likelihood principle. In B. N. Petrov & F. Csaki (Eds)Second International Symposium on Information Theory (pp. 267–281). Budapest: Akademiai Kiado.
Allen, E. S. & Omland, K. E. (2003). Novel intron phylogeny (ODC)supports plumage convergence in orioles (Icterus). The Auk, 120,961–969.
Ames, P. L. (1971). The morphology of the syrinx in passerine birds.Bulletin of the Peabody Museum of Natural History, 37, 1–194.
Barker, K. F., Barrowclough, G. F. & Groth, J. G. (2002). A phylogeneticanalysis for passerine birds: taxonomic and biogeographicimplications of an analysis of nuclear DNA sequence data. Proceedingsof the Royal Society of London B, 269, 295–305.
Barker, F. K., Cibois, A., Schikler, P. A., Feinstein, J. & Cracraft, J.(2004). Phylogeny and diversification of the largest avian radiation.Proceedings of the National Academy of Sciences of the USA, 101,11040–11045.
Binladen, J., Wiuf, C., Gilbert, M. T. P., Bunce, M., Barnett, R.,Larson, G., Greenwood, A. D., Haile, J., Ho, S. Y. W., Hansen,A. J. & Willerslev, E. (2005). Assessing the fidelity of ancient DNAsequences amplified from nuclear genes. Genetics, 172, 733–741.
Chesser, R. T. (2004). Molecular systematics of New World suboscinebirds. Molecular Phylogenetics and Evolution, 32, 11–24.
Cooper, A., Mourer-Chauvire, C., Chambers, G. K., von Haeseler,A., Wilson, A. C. & Pääbo, S. (1992). Independent origins of theNew Zealand moas and kiwis. Proceedings of the National Academyof Sciences of the USA, 89, 8741–8744.
Cooper, A., Rhymer, J. M., James, H. F., Olson, S. L., Mcintosh, C. E.,Sorenson, M. D. & Fleischer, R. C. (1996). Conservation man-agement of island endemics using ancient DNA. Nature, 381, 484.
Cooper, A., Lazuela-Fox, C., Anderson, S., Rambaut, A., Autin, J. &Ward, R. (2001). Complete mitochondrial genome sequences oftwo extinct moas clarify ratite evolution. Nature, 409, 704–707.
Cracraft, J. & Feinstein, J. (2000). What is not a bird of paradise?Molecular and morphological evidence places Macgregoria in theMeliphagidae and the Cnemophilinae near the base of the corvoidtree. Proceedings of the Royal Society of London B, 267, 233–241.
Dekker, R. W. R. J. & Dickinson, E. C. (2000). Systematic notes onthe Asian birds 2. A preliminary review of the Eurylaimidae.Zoologische Verhandelingen Leiden, 331, 65–76.
Dickinson, E. C. (2003). The Howard and Moore Complete Checklist ofthe Birds of the World. London: Christopher Helm.
Dumbacher, J. P. & Fleischer, R. C. (2001). Phylogenetic evidencefor colour pattern convergence in toxic pitohuis: Müllerianmimicry in birds? Proceedings of the Royal Society of London B, 268,1971–1976.
Eggert, L. S., Mundy, N. I. & Woodruff, D. S. (2004). Populationstructure of loggerhead shrikes in the California Channel Islands.Molecular Ecology, 13, 2121–2133.
Ellegren, H. (1991). DNA typing of museum birds. Nature, 354, 113.Engels, W. R. (1993). Contributing software to the internet: the
Amplify program. Trends in Biochemical Sciences, 18, 448–450.Ericson, P. G. P. & Johansson, U.S. (2003). Phylogeny of Passerida
(Aves: Passeriformes) based on nuclear and mitochondrialsequence data. Molecular Phylogenetics and Evolution, 29, 126–138.
Ericson, P. G. P., Christidis, L., Cooper, A., Irestedt, M., Jackson,J., Johansson, U.S. & Norman, J. A. (2002a). A Gondwanan originof passerine birds supported by DNA sequences of the endemic
M. Irestedt et al. • Phylogeny of Old World suboscines
© 2006 The Authors. Journal compilation © 2006 The Norwegian Academy of Science and Letters • Zoologica Scripta, 35, 6, November 2006, pp567–580 579
New Zealand wrens. Proceedings of the Royal Society of London B,269, 235–241.
Ericson, P. G. P., Christidis, L., Irestedt, M. & Norman, J. A.(2002b). Systematic affinities of the lyrebirds (Passeriformes: Men-ura), with a novel classification of the major groups of passerinebirds. Molecular Phylogenetics and Evolution, 25, 53–62.
Ericson, P. G. P., Irestedt, M. & Johansson, U.S. (2003). Evolution,biogeography, and patterns of diversification in passerine birds.Journal of Avian Biology, 34, 3–15.
Ericson, P. G. P., Jansén, A.-L., Johansson, U.S. & Ekman, J. (2005).Inter-generic relationships of the crows, jays, magpies and alliedgroups (Aves: Corvidae) based on nucleotide sequence data.Journal of Avian Biology, 36, 222–234.
Ericson, P. G. P., Zuccon, D., Ohlson, J. I., Johansson, U.S., Alvarenga,H. & Prum, R. O. (2006). Higher level phylogeny and morpho-logical evolution of tyrant flycatchers, cotingas, manakins andtheir allies (Aves: Tyrannida). Molecular Phylogenetics and Evolution,40, 471–483.
Erritzoe, J. (2003). Family Pittidae (Pittas). In J. del Hoyo, A. Elliott& D. A. Christie (Eds) Handbook of the Birds of the World, Vol. 8.Broadbills to Tapaculos (pp. 106–160). Barcelona: Lynx Edicions.
Erritzoe, J. & Erritzoe, H. B. (1998). Pittas of the World; A Monographon the Pitta Family. Cambridge: Lutterworth Press.
Farris, J. S. (1997). Xac [Computer software and manual]. Stockholm:Swedish Museum of Natural History.
Farris, J. S., Albert, V. A., Källersjö, M., Lipscomb, D. & Kluge, A.G. (1996). Parsimony jackknifing outperforms neighbor-joining.Cladistics, 12, 99–124.
Feduccia, A. (1974). Morphology of the bony stapes in New and OldWorld suboscines: new evidence for common ancestry. Auk, 91,427–429.
Fjeldså, J., Zuccon, D., Irestedt, M., Johansson, U.S. & Ericson, P. G. P.(2003). Sapayoa aenigma: a New World representative of ‘OldWorld suboscines’. Proceedings of the Royal Society of London B, 270,238–241.
Fjeldså, J., Irestedt, M. & Ericson, P. G. P. (2005). Molecular datareveal some major adaptational shifts in the early evolution of themost diverse avian family, the Furnariidae. Journal of Ornithology,146, 1–13.
Forbes, W. A. (1880a). Contribution to the anatomy of passerinebirds. Part II. On the syrinx and other points of anatomy of theEurylaemidae. Proceedings of the Zoological Society of London, 1880,380–386.
Forbes, W. A. (1880b). Contribution to the anatomy of passerinebirds. Part III. On some points in the structure of Philepitta, andits position amongst the passeres. Proceedings of the Zoological Societyof London, 1880, 387–391.
Hajibabaei, M., de Waard, J. R., Ivanova, N. V., Ratnasingham, S.,Dooph, R. T., Kirk, S. L., Mackie, P. M. & Hebert, P. D. N. (2005).Critical factors for assembling a high volume of DNA barcodes.Philosophical Transactions of the Royal Society of London B, 360, 1959–1967.
Heslewood, M. M., Elphinstne, M. S., Tidemann, S. C. & Baverstock,P. R. (1998). Myoglobin intron variation in the Gouldian FinchErythura gouldiae assessed by temperature gradient gel electro-phoresis. Electrophoresis, 19, 142–151.
Holder, M. & Lewis, P. O. (2003). Phylogeny estimation: Traditionaland Bayesian approaches. Nature Genetics, 4, 275–284.
Houde, P. & Braun, M. J. (1988). Museum collections as a source ofDNA for studies of avian phylogeny. Auk, 105, 773–776.
del Hoyo, J., Elliott, A. & Christie, D. A. (2003). Handbook of theBirds of the World. Vol. 8. Broadbills to Tapaculos. Barcelona: LynxEdicions.
Huelsenbeck, J. P., Ronquist, F., Nielsen, R. & Bollback, J. P. (2001).Reverend Bayes meets Darwin: Bayesian inference of phylogenyand its impact on evolutionary biology. Science, 288, 2349–2350.
ICZN (1999). International Code of Zoological Nomenclature, 4th edn.The International Trust of Zoological Nomenclature. London:The Natural History Museum.
Irestedt, M., Johansson, U.S., Parsons, T. J. & Ericson, P. G. P.(2001). Phylogeny of major lineages of suboscines (Passeriformes)analysed by nuclear DNA sequence data. Journal of Avian Biology,32, 15–25.
Irestedt, M., Fjeldså, J., Johansson, U.S. & Ericson, P. G. P. (2002).Systematic relationships and biogeography of the tracheophonesuboscines (Aves: Passeriformes). Molecular Phylogenetics andEvolution, 23, 499–512.
Irestedt, M., Fjeldså, J., Nylander, J. A. A. & Ericson, P. G. P.(2004a). Phylogenetic relationships of typical antbirds (Tham-nophilidae) and test of incongruence based on Bayes factors. BMCEvolutionary Biology, 4, 23.
Irestedt, M., Fjeldså, J. & Ericson, P. G. P. (2004b). Phylogeneticrelationships of woodcreepers (Aves: Dendrocolaptinae) —incongruence between molecular and morphological data. Journalof Avian Biology, 350, 280–288.
Irestedt, M., Fjeldså, J. & Ericson, P. G. P. (2006). Evolution of theovenbird-woodcreeper assemblage (Aves: Furnariidae) — majorshifts in nest architecture and adaptive radiation. Journal of AvianBiology, 37, 261–272.
Johansson, U.S. & Ericson, P. G. P. (2003). Molecular support for asister group relationship between Pici and Galbulae (Piciformessensu Wetmore 1960). Journal of Avian Biology, 34, 185–197.
Lambert, F. & Woodcock, M. (1996). Pittas, Broadbills and Asities.Robertsbridge, Sussex: Pica Press.
Leeton, P., Christidis, L. & Westerman, M. (1993). Feathers frommuseum bird skins — a good source of DNA for phylogeneticstudies. Condor, 95, 465–467.
McCracken, K. G., Harshman, J., McClellan, D. A. & Afton, A. D.(1999). Data set incongruence and correlated character evolution:An example of functional convergence in the hind-limbs of stifftaildiving ducks. Systematic Biology, 48, 683–714.
Müller, J. P. (1847). Über die Bisher Unbekannten Typischen Verschieden-heiten der Stimmorgane der Passerinen. Berlin: Abhandlungen derKoniglichen der Akademie der Wissenschaften.
Mundy, N. L., Unitt, P. & Woodruff, D. S. (1997). Skin from feet ofmuseum specimens as a non-destructive source of DNA for aviangenotyping. Auk, 114, 126–129.
Nylander, J. A. A. (2005). Mrmodeltest v.2.2. [Program distributed bythe author]. Uppsala University, Department of Systematic Zoology.
Olson, S. L. (1971). Taxonomic comments on the Eurylaimidae. Ibis,113, 507–516.
Payne, R. B. & Sorenson, M. D. (2003). Museum collections assources of genetic data. In G. Rheinwald (Ed.) Bird Collections inEurope: the Challenge of Mutual Cooperation (pp. 97–104). Bonn:Bonner Zoologische Beiträge.
Prum, R. O. (1990). A test of the monophyly of the manahins(Pipridae) and of the cotingas (Cotingidae) based on morphology.Occasional Papers of The Museum of Zoology, The University ofMichigan, 723, 1–44.

Phylogeny of Old World suboscines • M. Irestedt et al.
580 Zoologica Scripta, 35, 6, November 2006, pp567–580 • © 2006 The Authors. Journal compilation © 2006 The Norwegian Academy of Science and Letters
Prum, R. O. (1993). Phylogeny, biogeography, and evolution of thebroadbills (Eurylaimidae) and asities (Philepittidae) based onmorphology. Auk, 110, 304–324.
Raikow, R. J. (1987). Hindlimb myology and evolution of the OldWorld suboscine passerine birds (Acanthisittidae, Pittidae,Philepittidae, Eurylaimidae). Ornithological Monographs, 41, 1–81.
Ronquist, F. & Huelsenbeck, J. P. (2003). MRBAYES 3: Bayesianphylogenetic inference under mixed models. Bioinformatics, 19,1572–1574.
Roselaar, K. (2003). An inventory of major European bird collections.Bulletine of the British Ornithologists’ Club, 123A, 253–337.
Sefc, K. M., Payne, R. B. & Sorenson, M. D. (2003). Phylogeneticrelationships of African sunbird-like warblers: Moho Hypergerusatriceps, Green Hylia Hylia prasina and Tit-hylia Pholidornisrushiae. Ostrich, 74, 8–17.
Sibley, C. G. & Ahlquist, J. E. (1990). Phylogeny and Classification ofthe Birds of the World. New Jersey: Yale University Press.
Slade, R. W., Moritz, C., Heideman, A. & Hale, P. T. (1993). Rapid
assessment of single-copy nuclear DNA variation in diversespecies. Molecular Ecology, 2, 359–373.
Swofford, D. L. (1998). PAUP*: Phylogenetic Analysis Using Parsimony(* and Other Methods), ver.4. [Computer program and manual].Sunderland, Massachusetts: Sinauer Associates.
Vallianatos, M., Lougheed, S. C. & Boag, P. T. (2002). Conservationgenetics of the loggerhead shrike (Lanius ludovicianus) in centraland eastern North America. Conservation Genetics, 3, 1–13.
Whitehead, J. (1893). A review of the species of the Family Pittidae.Ibis, 5, 488–509.
Willerslev, E. & Cooper, A. (2005). Ancient DNA. Proceedings of theRoyal Society of London B, 272, 3–16.
Wolters, H. E. (1982). Die Vogelarten der Erde. Hamburg und Berlin:Paul Perey.
Zuccon, A. & Zuccon, D. (2006). MrEnt v. 1.2. Program distributedby the authors. Department of Vertebrate Zoology and MolecularSystematics Laboratory, Swedish Museum of Natural History,Stockholm.