Embed Size (px)
Citation preview
Molecular Ecology (2008) 17, 2258–2275 doi: 10.1111/j.1365-294X.2008.03750.x
© 2008 The AuthorsJournal compilation © 2008 Blackwell Publishing Ltd
Blackwell Publishing LtdRecent divergence with gene flow in Tennessee cave salamanders (Plethodontidae: Gyrinophilus) inferred from gene genealogies
MATTHEW L. NIEMILLER,* BENJAMIN M. FITZPATRICK† and BRIAN T. MILLER**Department of Biology, Middle Tennessee State University, Murfreesboro, TN 37132, USA, †Department of Ecology and Evolutionary Biology, University of Tennessee, 569 Dabney Hall, Knoxville, TN 37996, USA
Abstract
Cave organisms occupy a special place in evolutionary biology because convergentmorphologies of many species demonstrate repeatability in evolution even as they obscurephylogenetic relationships. The origin of specialized cave-dwelling species also raises theissue of the relative importance of isolation vs. natural selection in speciation. Two alternativehypotheses describe the origin of subterranean species. The ‘climate-relict’ model proposesallopatric speciation after populations of cold-adapted species become stranded in cavesdue to climate change. The ‘adaptive-shift’ model proposes parapatric speciation driven bydivergent selection between subterranean and surface habitats. Our study of the Tennesseecave salamander complex shows that the three nominal forms (Gyrinophilus palleucuspalleucus, G. p. necturoides, and G. gulolineatus) arose recently and are genealogicallynested within the epigean (surface-dwelling) species, G. porphyriticus. Short branch lengthsand discordant gene trees were consistent with a complex history involving gene flowbetween diverging forms. Results of coalescent-based analysis of the distribution of hap-lotypes among groups reject the allopatric speciation model and support continuous orrecurrent genetic exchange during divergence. These results strongly favour the hypothesisthat Tennessee cave salamanders originated from spring salamanders via divergencewith gene flow.
Keywords: cave invasion, divergence with gene flow, Gyrinophilus, speciation, subterranean
Received 6 October 2007; revision accepted 11 January 2008
Introduction
The origin of cave species has received considerable attentionfrom biologists attempting to understand ecology andevolution (Barr 1968; Culver 1982; Barr & Holsinger 1985;Holsinger 2000). As with speciation in epigean (surface-dwelling) organisms, the roles of selection, gene flow, andgeographical isolation during subterranean speciation arecontroversial and difficult to resolve (Coyne & Orr 2004;Bolnick & Fitzpatrick 2007), but the common ecogeographicalcontext of subterranean speciation generates a commonframework from which to ask general questions (Holsinger2000). The origin of a cave-dwelling lineage always involvesan ecological shift and a generally consistent set of character
changes including reduction of eyes and pigmentation,enhancement of extra-optic sensory systems, reduction infecundity and metabolism, and increased longevity (Barr1968; Culver 1982; Poulson 1985; Borowsky & Wilkens2002). An important question is whether such forms haveoriginated in complete geographical isolation (allopatricspeciation) or in the face of ongoing dispersal across theepigean–subterranean interface (divergence with gene flow,Rice & Hostert 1993).
A traditional view is that cave organisms are isolatedand relictual; populations become trapped undergroundand slowly evolve troglomorphic characters via ‘regressiveevolution’, where structures such as eyes degenerate becauseselection no longer eliminates mutations that would havebeen deleterious on the surface (Darwin 1859; Eigenmann1909; Culver 1982; Romero & Green 2005). However, someauthors favour the view that degenerative characters are
Correspondence: Matthew L. Niemiller, Fax: 865-974-3067; E-mail:[email protected]

D I V E R G E N C E W I T H G E N E F L O W I N C AV E S A L A M A N D E R S 2259
© 2008 The AuthorsJournal compilation © 2008 Blackwell Publishing Ltd
adaptive underground and evolution of cave specialists isno different from evolution of other habitat specialists(Poulson 1963; Culver 1982; Jeffery 2005; Protas et al. 2007).In the latter view, subterranean forms can arise via ecologicalspeciation, a mode of divergence that can be rapid and maynot require geographical isolation (Schluter 2000; Coyne &Orr 2004; Hendry et al. 2007). Ecological divergence withgene flow has become increasingly credible in recent years(Barluenga et al. 2006; Panova et al. 2006; Savolainen et al.2006; Hendry et al. 2007; Quesada et al. 2007), but its pre-valence is the subject of continuing debate (Coyne & Orr2004; Bolnick & Fitzpatrick 2007; Coyne 2007).
In the biospeleological literature, specific allopatricspeciation and divergence-with-gene-flow scenarios havebeen described, respectively, as the ‘climate-relict’ and‘adaptive-shift’ hypotheses (Howarth 1973; Holsinger 2000;Rivera et al. 2002). Under the climate-relict model, epigeanancestors adapted to cool, moist environments in temperateareas retreated into subterranean habitats in response toclimatic fluctuations. As surface conditions became in-hospitable, extirpation of epigean populations facilitatedallopatric speciation of subterranean populations (Holsinger1988, 2000; Ashmole 1993). Under the adaptive-shift model,pre-adapted epigean ancestors invaded subterraneanhabitats to exploit new niches with reduced competitionand quickly evolved in sympatry or parapatry with relatedsurface populations (Howarth 1973, 1981; Holsinger 2000).This is a typical two-habitat ecological speciation scenario(Schluter 2000; Coyne & Orr 2004).
While a parapatric ‘adaptive-shift’ requires divergentnatural selection to overcome the homogenizing process ofgene flow, allopatric ‘climate-relict’ divergence may involvestrictly neutral changes, adaptive changes that may or maynot contribute to the evolution of reproductive isolation, or‘regressive’ changes where cave-associated morphologiescome about due to loss-of-function mutations that are mala-daptive on the surface but selectively neutral underground.Thus, the allopatric climate-relict scenario may or maynot also involve adaptive shifts. The key distinction is notadaptation; it is absence or presence of gene flow duringdivergence.
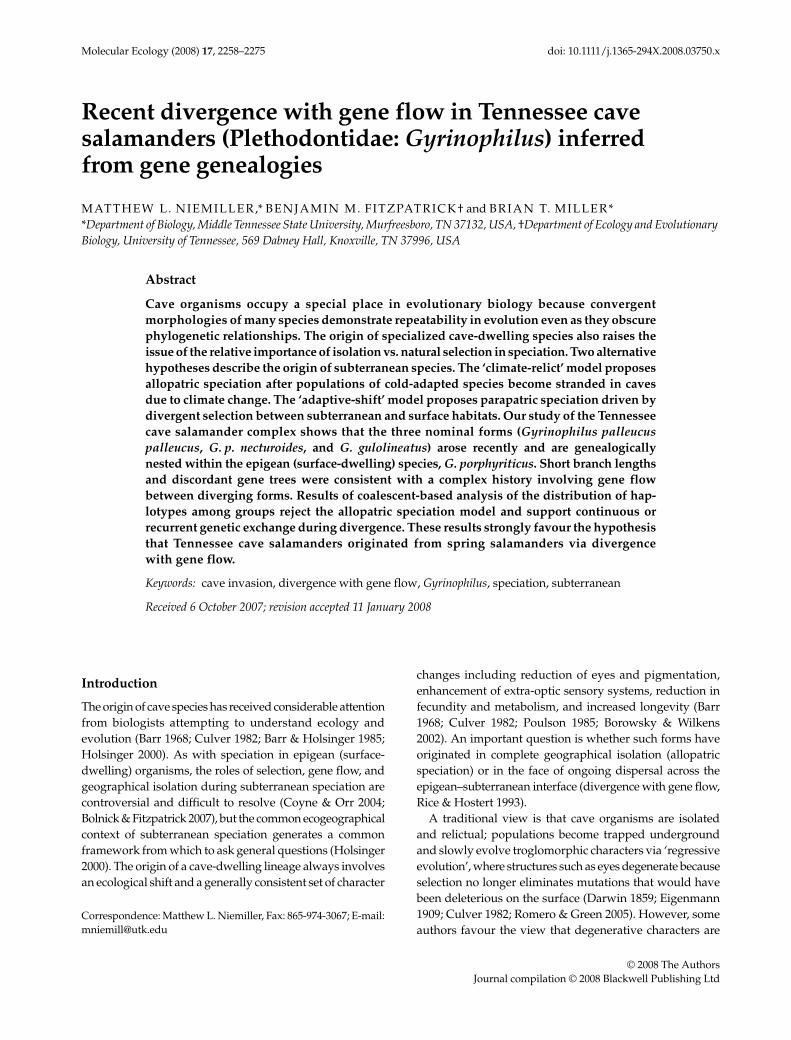
Here, we investigate the divergence of the Tennesseecave salamander (Gyrinophilus palleucus) species complexand its presumed sister species (see Brandon 1966), thespring salamander, G. porphyriticus. Spring salamandersare typical plethodontids with a biphasic life cycle wherefully aquatic larvae transform into terrestrial adults (Fig. 1).They are found not only in association with surface springs,seepages, and coldwater streams (Bruce 1972; Petranka1998), but also in caves (Cooper & Cooper 1968; Petranka1998). Larval G. porphyriticus have relatively broad, flatsnouts and small eyes, suggesting adaptation to subsurfacehabitats in the interstitial zone of streambeds (Brandon1966; Birchfield & Bruce 2000; Bruce 2003). Tennessee cave
salamanders express only a paedomorphic life cycle, wherethe aquatic larvae become large and sexually mature withoutever metamorphosing into a terrestrial form (Brandon1966). In addition to this shift to an entirely aquatic lifecycle, Tennessee cave salamanders exhibit morphologicaltraits typical of cave salamanders in other groups, such asEurycea and Proteus. These traits include markedly reducedeyes and pigmentation, a broad head with a spatulate snout,and well-developed lateral line sensory systems (Fig. 1).
Current taxonomy recognizes two subterranean species(Miller & Niemiller 2008): the Tennessee cave salamander(G. palleucus) from the Central Basin, Eastern Highland Rim,and escarpments of the southern Cumberland Plateau;and the Berry Cave salamander (G. gulolineatus) from theValley and Ridge (Fig. 1). Two subspecies of G. palleucus arerecognized: the pale salamander (Fig. 1A), G. p. palleucus,and the Big Mouth Cave salamander (Fig. 1B), G. p. necturoides.For the purposes of understanding the origin of cave-dwelling lineages with troglomorphic traits, the taxonomicstatus of a group or its resemblance to a particular speciesdefinition is not important. The existence of distinct clustersof diversity is important and we treat the above groups aspotentially independent subterranean lineages.
The ranges of Tennessee cave salamanders and springsalamanders (G. porphyriticus; Fig. 1C), are largely parapatric(Fig. 1; Miller & Niemiller 2008). Brandon (1971) proposedthat the subterranean complex evolved from an epigean,metamorphosing ancestor like G. porphyriticus during thePleistocene as climatic conditions isolated peripheralpopulations of spring salamanders and facilitated allo-patric speciation under the climate-relict model. Cave systemsinhabited by the G. palleucus complex are estimated tobe of Pliocene to Pleistocene age (Barr 1961). However, thephylogeny of the complex and its timing of divergencefrom G. porphyriticus have never been investigated.
To address the question of whether cave salamandersarose in allopatry vs. by divergence with gene flow fromG. porphyriticus, we used population genetic analysesto estimate historic levels of gene flow among taxa andevaluate the influence of geographical structure on gene flowwithin and between taxa. Distinguishing allopatric speci-ation from divergence with gene flow is a major challengefor speciation biology (Coyne & Orr 2004; Fitzpatrick &Turelli 2006). Heuristic interpretation of gene trees hasproven unsatisfactory because genealogical patterns inrecently isolated populations may be qualitatively similarto those produced in the presence of gene flow (Irwin 2002;Hey & Machado 2003). Recent developments in coalescenttheory offer promise for making strong inferences from aBayesian perspective (Nielsen & Wakeley 2001; Hey &Nielsen 2004; Hey 2005). We used the isolation with migration(IM) model to estimate the posterior probability distributionsof gene flow parameters given patterns in mitochondrialDNA (mtDNA) and nuclear DNA sequences (Hey & Nielsen
2260 M . L . N I E M I L L E R , B . M . F I T Z PAT R I C K and B . T. M I L L E R
© 2008 The AuthorsJournal compilation © 2008 Blackwell Publishing Ltd
Fig. 1 Sampling localities and distribution (top) of the described taxa within the Tennessee cave salamander complex and the springsalamander (bottom): (A) pale salamander (G. p. palleucus), (B) Big Mouth Cave salamander (G. p. necturoides), (C) larval spring salamander(G. porphyriticus), and (D) Berry Cave salamander (G. gulolineatus). Information on numbered localities can be found in Table 1. Note thephenotypic differences between the larval epigean form (C) and the paedomorphic subterranean forms (A, B, and D). Larval subterraneansalamanders have reduced eyes and broader, more spatulate snouts than larvae of the epigean form.

D I V E R G E N C E W I T H G E N E F L O W I N C AV E S A L A M A N D E R S 2261
© 2008 The AuthorsJournal compilation © 2008 Blackwell Publishing Ltd
2004). Taking the posterior density at or near zero migrationas an indication of support for allopatric speciation, ouranalyses favour the alternative of divergence with geneflow between Tennessee cave salamanders and their epigeansister species, the spring salamander.
Materials and methods
Sampling and molecular methods
As part of a general study of Tennessee cave salamanders,we obtained tail tissue samples from 109 salamandersfrom 27 localities throughout the range of the Tennesseecave salamander complex and 15 localities of Gyrinophilusporphyriticus (Table 1 and Fig. 1; Animal Care and UseProtocol 04-006, Middle Tennessee State University). Wewere limited to no more than three samples for mostlocalities because of permit restrictions or low abundance.Sampling of G. porphyriticus focused on localities in closeproximity to Tennessee cave salamander localities be-cause if G. porphyriticus is sister to the G. palleucus complex,then G. palleucus likely diverged from populations ofG. porphyriticus inhabiting the Cumberland Plateau andValley and Ridge. Voucher specimens were deposited intothe herpetological collection at Middle Tennessee StateUniversity.
DNA was extracted from tail tissue and polymerasechain reaction (PCR) was used to amplify portions of twomitochondrial genes, ~850 bp of the 12S ribosomal DNA(rDNA) and 783 bp of cytochrome b (cyt b), and one nucleargene, 521 bp of recombination activating gene 1 (RAG-1).This nuclear gene has been utilized with considerableresolving power at many phylogenetic scales in plethodontidsalamanders including within genera (Chippindale et al.2004; Min et al. 2005; Wiens et al. 2006). The 12S rDNAfragment was amplified using primers 12SZ-L and 12SK-H(Goebel et al. 1999; Whiting et al. 2003) and the cyt b fragmentwas amplified using primers MVZ15 and MVZ16 (Moritzet al. 1992) under standard cycling conditions. The RAG-1fragment was amplified using primers RAGSAL4F (5′-CGTTTCTCYTTCACAYTCATGAC-3′) and RAGSAL3R(5′-GCTGAAAKATCTTYTAYAACTCTG-3′) (P. T. Chippin-dale, personal communication) using a touchdown protocol.Sequencing reactions were performed using original PCRprimers and run on an ABI PRISM 3100 (Applied Biosys-tems) at GenHunter Corporation.
Forward and reverse sequences for each sample werealigned and edited using seqman (DNASTAR) withambiguous base calls verified manually by examining theelectropherogram for each sequence. These sequences werealigned to each other and to two outgroup sequences foreach locus (Pseudotriton ruber and Stereochilus marginatus,after Chippindale et al. 2004; Mueller et al. 2004; Macey2005). Resulting contigs were aligned using clustal_x
(Thompson et al. 1997). Direct sequencing of PCR productsfor RAG-1 revealed a few nucleotide sites at which indi-viduals were heterozygous. Heterozygosity was rare andmost haplotypes could be determined unambiguously.Haplotypes for five heterozygous individuals were inferredfollowing Clark (1990).
Phylogenetic analyses
Estimating gene trees. We used collapse 1.2 (D. Posada) toparse redundant haplotypes for each data set. Gene trees wereconstructed using maximum parsimony (MP), maximumlikelihood (ML), and Bayesian analyses with mtDNA andRAG-1 data sets analysed separately. In addition, unrootedstatistical parsimony networks for the mtDNA and RAG-1data were constructed in tcs 1.18 (Clement et al. 2000). Wedid not concatenate the mtDNA and RAG-1 sequencesbecause this practice can be misleading for three reasons.First, different alleles or loci sampled from the same indi-vidual do not have identical histories and it is misleadingto assume that they do (Rosenberg & Nordborg 2002; Hey& Machado 2003). Second, there are over three times asmany base pairs in our mtDNA data set; therefore, most ofthe information in a concatenated sequence would reflectmitochondrial history rather than being a fair average ofthe two histories. Finally, even in situations where thefirst two concerns do not apply, concatenated sequencescan indicate erroneous support for incorrect species trees(Degnan & Rosenberg 2006; Salter Kubatko & Degnan 2007).
MP and ML analyses were conducted in paup* 4.0b10(Swofford 2002) using a heuristic search with tree-bisection–reconnection, ACCTRAN, and 1000 random-taxon-additionreplicates. For MP analysis, all sites were treated as un-ordered, equally weighted characters with gaps treated asmissing data. Confidence at each node was assessed usingnonparametric bootstrapping (Felsenstein 1985) based on1000 pseudoreplicates with 100 random-taxon-additionreplicates per pseudoreplicate. The optimal model of sequenceevolution for each data set (12S, cyt b, 12S+cyt b, and RAG-1)was determined using Akaike’s information criterion (AIC)implemented in modeltest 3.7 (Posada & Crandall 1998).ML analyses were performed under the model of evolutionselected for each data set. The hypothesis of monophylyof G. palleucus and G. gulolineatus was evaluated with theShimodaira–Hasegawa test in paup*.
Bayesian posterior probabilities were estimated in mrbayes3.1 (Ronquist & Huelsenbeck 2003). Two independent runsusing four Markov chains and temperature profiles at thedefault setting of 0.2 were conducted for 8 million genera-tions, sampling every 100th generation. modeltest selecteddifferent models of sequence evolution for 12S and first,second, and third position codons of cyt b. Therefore, thecombined mtDNA data set was partitioned accordinglyand unlinked allowing values for transition/transversion

2262M
. L. N
IEM
ILL
ER
, B. M
. FIT
ZP
AT
RIC
K and
B. T
. MIL
LE
R
© 2008 T
he Authors
Journal compilation ©
2008 Blackw
ell Publishing Ltd
Table 1 Populations of Gyrinophilus sampled with locality information, number of individuals (n) sampled from each population, watershed, major drainage, mtDNA haplotype withnumber of individuals sequenced in parentheses, and RAG-1 haplotype with number of individuals sequenced in parentheses used in this study. Discordance between morphologicalassignment and haplotype are indicated in bold
Population Species Locality (cave no.)* County State n Watershed Major drainage mtDNA haplotype RAG-1 haplotype
1 G. p. palleucus Sinking Cove Cave (TFR25) Franklin TN 4 Lower Tennessee Tennessee palleucus-01 (1), palleucus-02 (3)
palleucus-06 (8)
2 G. p. palleucus Cave Cove Cave (TFR33) Franklin TN 3 Lower Tennessee Tennessee palleucus-01 (3) palleucus-06 (6)3 G. p. palleucus Custard Hollow Cave (TFR7) Franklin TN 4 Lower Tennessee Tennessee palleucus-02 (4) palleucus-01 (2),
palleucus-06 (6)4 G. p. palleucus Shakerag Cave (TMN371) Marion TN 1 Lower Tennessee Tennessee palleucus-16 (1) palleucus-06 (2)5 G. p. palleucus Sauta Cave (AJK50) Jackson AL 2 Lower Tennessee Tennessee palleucus-12 (2) palleucus-06 (4)6 G. p. palleucus McFarland Cave (AJK65) Jackson AL 1 Lower Tennessee Tennessee palleucus-15 (1) palleucus-04 (2)7 G. p. palleucus Gross Skeleton Cave (AJK224) Jackson AL 1 Lower Tennessee Tennessee palleucus-13 (1) palleucus-07 (2)8 G. p. palleucus Guffey Cave (AMD317) Madison AL 2 Lower Tennessee Tennessee palleucus-11 (2) palleucus-02 (4)9 G. p. necturoides Big Mouth Cave (TGD2) Grundy TN 11 Elk Tennessee palleucus-08 (1),
palleucus-17 (8), palleucus-18 (2)
palleucus-02 (21), palleucus-03 (1)
10 G. p. necturoides Crystal Cave (TGD10) Grundy TN 1 Elk Tennessee palleucus-08 (1) palleucus-02 (2)11 G. p. necturoides Smith Hollow Cave no. 2 (TGD64) Grundy TN 3 Elk Tennessee palleucus-10 (3) palleucus-02 (6)12 G. p. necturoides Blowing Springs Cave (TCF18) Coffee TN 3 Elk Tennessee palleucus-03,
palleucus-08palleucus-02 (6)
13 G. p. necturoides Lusk Cave (TCF8) Coffee TN 3 Elk Tennessee palleucus-09 (3) palleucus-02 (6)14 G. p. necturoides Jaco Spring Cave (TWR317) Warren TN 1 Collins Cumberland palleucus-03 (1) palleucus-02 (2)15 G. p. necturoides King Cave (TWR295) Warren TN 2 Collins Cumberland palleucus-03 (2) palleucus-02 (4)16 G. p. necturoides Sugarcookie Cave (TWR301) Warren TN 1 Collins Cumberland palleucus-04 (1) palleucus-02 (2)17 G. palleucus Herring Cave (TRU8) Rutherford TN 3 Stones Cumberland palleucus-14 (3) palleucus-02 (6)18 G. palleucus Snail Shell Cave (TRU16) Rutherford TN 2 Stones Cumberland palleucus-14 (2) palleucus-02 (4)19 G. palleucus Gallagher Cave (TMS23) Marshall TN 2 Duck Tennessee palleucus-05 (1),
palleucus-07 (1)palleucus-01 (2), palleucus-02 (2)
20 G. palleucus Pompie Cave (TMU19) Maury TN 3 Duck Tennessee palleucus-05 (1), palleucus-06 (2)
palleucus-02 (6)
21 G. palleucus Stone Cave (TSQ7) Sequatchie TN 1 Sequatchie Tennessee palleucus-18 (1) palleucus-05 (2)22 G. palleucus Fricks Cave (GWK14) Walker GA 1 Lower Tennessee Tennessee palleucus-19 (1) palleucus-02 (2)23 G. gulolineatus Berry Cave (TRN3) Roane TN 3 Upper Tennessee Tennessee gulolineatus-01 (3) gulolineatus-02 (4),
gulolineatus-03 (2)24 G. gulolineatus Aycock Spring Cave (TKN172) Knox TN 1 Clinch Tennessee gulolineatus-02 (1) gulolineatus-02 (2)25 G. gulolineatus Christian Cave (TKN49) Knox TN 1 Clinch Tennessee gulolineatus-03 (1) gulolineatus-02 (2)26 G. gulolineatus Meade Quarry Cave (TKN28) Knox TN 3 Upper Tennessee Tennessee gulolineatus-04 (3) gulolineatus-01 (1),
gulolineatus-02 (5)27 G. gulolineatus Mudflats Cave (TKN9) Knox TN 3 Upper Tennessee Tennessee gulolineatus-05 (3) gulolineatus-02 (6)28 G. porphyriticus Davidson Branch Coffee TN 1 Duck Tennessee porphyriticus-05 (1) porphyriticus-05 (2)29 G. porphyriticus Pauley Cave (TDK95) DeKalb TN 2 Caney Fork Cumberland porphyriticus-08 (1),
porphyriticus-09 (1)porphyriticus-10 (4)

DIV
ER
GE
NC
E W
ITH
GE
NE
FL
OW
IN C
AV
E S
AL
AM
AN
DE
RS
2263
© 2008 T
he Authors
Journal compilation ©
2008 Blackw
ell Publishing Ltd
30 G. porphyriticus Gar Island Cave (TDK90) DeKalb TN 3 Caney Fork Cumberland porphyriticus-10 (2), porphyriticus-11 (1)
porphyriticus-05 (2), porphyriticus-10 (4)
31 G. porphyriticus West Cemetery Cave (TPU418) Putnam TN 3 Caney Fork Cumberland porphyriticus-13 (2), porphyriticus-14 (1)
porphyriticus-08 (1), porphyriticus-10 (5)
32 G. porphyriticus Marcus Cave (TPI76) Pickett TN 3 Obey Cumberland porphyriticus-01 (2), porphyriticus-17 (1)
porphyriticus-06 (1), porphyriticus-08 (4), porphyriticus-09 (1)
33 G. porphyriticus Mark Us Cave (TPI77) Pickett TN 3 Obey Cumberland porphyriticus-01 (3) porphyriticus-01 (1), porphyriticus-07 (1), porphyriticus-08 (4)
34 G. porphyriticus Ringing Rock River Cave (TPI84) Pickett TN 1 Obey Cumberland porphyriticus-12 (1) porphyriticus-08 (2)35 G. porphyriticus Short Mountain† Cannon TN 2 Collins/Stones Cumberland porphyriticus-15 (2) porphyriticus-05 (2),
porphyriticus-09 (2)36 G. porphyriticus Spencer Rock Cave (TCD11) Cumberland TN 2 Obed Tennessee porphyriticus-16 (2) porphyriticus-01 (1),
porphyriticus-04 (1), porphyriticus-11 (2)
37 G. porphyriticus Cruze Cave (TKN24) Knox TN 8 Upper Tennessee Tennessee porphyriticus-02 (7), porphyriticus-03 (1)
porphyriticus-01 (16)
38 G. porphyriticus Anderson Spring Cave (GWK46) Walker GA 5 Lower Tennessee Tennessee porphyriticus-06 (5) porphyriticus-01 (10)39 G. porphyriticus Hurricane Cave (GDD62) Dade GA 2 Lower Tennessee Tennessee porphyriticus-07 (2) porphyriticus-01 (2),
porphyriticus-02 (2)40 G. porphyriticus Pigeon Cave (GWK57) Walker GA 4 Lower Tennessee Tennessee porphyriticus-06 (4) porphyriticus-01 (7),
porphyriticus-05 (1)41 G. porphyriticus Pocket Branch Walker GA 3 Lower Tennessee Tennessee porphyriticus-06 (3) porphyriticus-01 (5),
porphyriticus-05 (1)42 G. porphyriticus Cosby Creek, GSMNP Cocke TN 1 Pigeon Tennessee porphyriticus-18 (1) porphyriticus-01 (2)43 G. porphyriticus South Mountains Burke NC 1 Catawba Catawba porphyriticus-04 (1) porphyriticus-03 (2)
Locality information and mtDNA haplotype for population 43 correspond to GenBank Accession no. NC_006341 used in Mueller et al. (2004). The RAG-1 haplotype from North Carolina is GenBank Accession no. AY691710 used in Chippindale et al. (2004).*Cave number designated by the Tennessee Cave Survey, Alabama Cave Survey, or Georgia Speleological Survey.†Two individuals were collected < 1 km apart on Short Mountain on each side of the Collins/Stones River drainage divide.
Population Species Locality (cave no.)* County State n Watershed Major drainage mtDNA haplotype RAG-1 haplotype
Table 1 Continued

2264 M . L . N I E M I L L E R , B . M . F I T Z PAT R I C K and B . T. M I L L E R
© 2008 The AuthorsJournal compilation © 2008 Blackwell Publishing Ltd
ratio, proportion of invariable sites, and among-site rateheterogeneity to vary across the data sets during analysis.Random trees were used to begin each Markov chain anda molecular clock was not enforced. The first 1.5 milliongenerations were discarded as ‘burn-in’ to ensure station-arity after examination of the posterior probability. Bayesiananalysis on the RAG-1 data set was performed using thesame configuration but with nst = 6 and rates = propinv.The first 1.5 million generations were discarded as ‘burn-in’. Samples from the stationary distribution of trees wereused to generate 50% majority-rule consensus trees foreach locus.
Divergence times. To estimate the timescale of diversifica-tion, we used two different divergence rates on the mtDNAdata set. The general vertebrate molecular clock of 2%uncorrected sequence divergence per million years wasemployed as the highest rate estimate and a generalpoikilotherm molecular clock of 0.5% uncorrected sequencedivergence per million years was employed as the lowestrate estimate (Avise et al. 1998). Lack of Gyrinophilus fossilsprecludes internally calibrated estimates of divergencetimes. In addition, more advanced approaches to divergencetime estimation are not warranted given our result ofwidespread genealogical discordance. Divergence timeestimates are intended only to give a general idea of thetimescale of diversification in Tennessee cave salamanders;as with all such molecular clock estimates, they should beinterpreted cautiously.
Estimating species trees. To evaluate monophyly of theTennessee cave salamander complex, we used three methodsof estimating species trees from gene trees (Maddison &Knowles 2006; Knowles & Carsten 2007). The methods ofminimizing deep coalescents (Maddison 1997) and groupingbased on shallowest divergence (Takahata 1989) assumezero gene flow such that the most recent common ancestorsof alleles found in different taxa must predate the diver-gence of those taxa. The method of clustering based onaverage patristic distances (Knowles & Carstens 2007) onlyassumes that gene flow has not degraded the expectedcorrelation between average relatedness of individualsbetween populations and the population divergence time.These methods are implemented and thoroughly explainedin the program mesquite (Maddison & Maddison 2006).
Allopatric speciation vs. divergence with gene flow
To address the alternative predictions of the allopatricclimate-relict model of speciation vs. the adaptive-shiftmodel, which allows divergence with gene flow (Rice &Hostert 1993), we used recently developed methods forestimating levels of gene flow in a general model ofpopulation divergence, the isolation with migration (IM)
model (Wakeley & Hey 1998; Nielsen & Wakeley 2001; Hey& Nielsen 2004). After separation from an ancestral popu-lation, the IM model includes gene flow with rates m1 andm2 for gene flow into populations 1 and 2, respectively.The IM model includes complete isolation (allopatry) asa special case where m1 = m2 = 0. Complete isolation vs.divergence with gene flow can be compared by fitting theIM model to data and estimating the posterior probabilitythat gene flow has been zero since the time of populationsplitting (Hey & Nielsen 2004; Won & Hey 2005). We usedthe program im (Hey & Nielsen 2004) to estimate scaledeffective population sizes, migration rates, and divergencetimes for pairwise comparisons of the four taxa (total of sixcomparisons) using the full data set including mtDNA andRAG-1. im is specifically designed to address nonequil-ibrium scenarios where haplotype sharing and genealogicaldiscordance may result from retention of ancestral poly-morphism in recently diverged lineages in addition topotential ongoing gene flow. In cases of very recentdivergence, isolation and gene flow may be difficult todistinguish. In such cases, very flat posterior distributionsare expected and the proper interpretation would be thatthe results are inconclusive.
After preliminary runs to determine appropriate priorsfor subsequent runs and verify convergence of independentruns, a final run was conducted for each pairwise com-parison for a minimum of 9 million generations postburn-in (1 million generations) or until minimum effectivesample sizes were over 50 (Hey 2005). Each run includedfour Metropolis-coupled Markov chains, a linear-heatingscheme with the first heating parameter set to 0.05, and amaximum of 10 multiple chain-swapping attempts.
To view the history of gene flow in more detail, werecorded the number and time of migration events for eachlocus over the course of each simulation (Won & Hey 2005).Inspecting the posterior distribution of migration timesallows a qualitative evaluation of two alternative geneflow scenarios: secondary contact and hybridization vs.continuous divergence with gene flow. A high concentrationof migration events near the present is consistent withsecondary contact and renewed gene flow after a period ofallopatric divergence, while a broad distribution of migrationtimes when the Markov chain is sampling from its stationarydistribution is consistent with continuous or recurrentgene flow since the time of population splitting. As anadditional comparison between continuous gene flow vs.secondary contact, we compared the distribution of dis-cordant nodes in each gene tree to null distributions asfollows. First, nodes where ranked according to theircladistic distances from the tips following Barraclough &Vogler (2000). The interspecific gene exchange ‘events’ weremapped onto the gene trees following Slatkin & Maddison(1989) and Maddison & Maddison (2006), and a node wasdeclared discordant if an exchange was mapped to a

D I V E R G E N C E W I T H G E N E F L O W I N C AV E S A L A M A N D E R S 2265
© 2008 The AuthorsJournal compilation © 2008 Blackwell Publishing Ltd
branch arising from it. The ranks of discordant and con-cordant nodes were compared with the Mann–WhitneyU-test and P values checked by randomization. Under asecondary contact scenario, we expect discordant nodesto be more concentrated toward the tips of the gene treesrelative to the randomized distributions.
Although the IM model formally assumes that each popu-lation is panmictic, some forms of population structure causelittle more than a rescaling of the coalescent process for themetapopulation as a whole (Wakeley 2000, 2004; Nordborg2001; Wakeley & Aliacar 2001; Lessard & Wakeley 2004).Thus, the IM model probably remains a good approximation(with rescaled parameters) for samples from metapopulationstructures resembling the island model or stepping-stonemodel (particularly when sample sizes for each deme aresmall), but may suffer substantial distortion under stronglyhierarchical population structures where coalescence ismore likely within certain clusters of demes (Nordborg 2001;Wakeley & Aliacar 2001). While the IM model is probablyrobust to population structure with regard to distinguishinggene flow and isolation, estimates of effective populationsizes and divergence time will be distorted in unpredictableways (Whitlock & Barton 1997; Wakeley 2000); therefore,we make no attempt to convert the scaled estimates ofpopulation size and time to units of real individuals andyears, respectively.
Tests of assumptions. The IM model assumes that there hasbeen no recombination or gene conversion during thegenealogical history of a single locus and that the variationin the sample is neutral. We tested for recombination inboth the mtDNA and RAG-1 data sets using the DSS methodimplemented in topali (Milne et al. 2004) using a windowsize of 100 and step size of 2. We used the Hudson–Kreitman–Aguade (HKA) test (Hudson et al. 1987) to testfor deviation from neutrality. This test evaluates the nullhypothesis that patterns of polymorphism and divergencein two genes have been shaped by mutation and driftalone. HKA tests were conducted with 10 000 simulationsusing the computer program hka (Jody Hey, RutgersUniversity). Deviations between observed and expectedlevels of divergence between each pairwise comparisonof taxa in IM were summed across the two loci and theprobability from the chi-square distribution was calculated.
To test whether genetic population structure is bestdescribed as isolation by distance or as hierarchical sub-division, we used distance-based redundancy analysis(dbRDA, Legendre & Anderson 1999; McArdle & Anderson2001; Geffen et al. 2004) to investigate the joint effects ofdistance and watershed boundaries on genetic structure inthe epigean G. pophyriticus and subterranean G. p. necturoides.This analysis was not relevant to the other two cave taxabecause they were confined to single drainages (Table 1).dbRDA has been used as an alternative to partial Mantel
tests, which are inadequate because the P values are notalways indicative of the true type I error rates (Raufaste &Rousset 2001; see also Castellano & Balletto 2002; Rousset2002). We used the program distlm (Anderson 2004) toperform dbRDA using a second-order polynomial functionof latitude and longitude as our distance variable set(Borcard et al. 1992). First, the relationship between theDNA distance matrices and the distance variable set wasanalysed alone using dbRDA with P values estimatedfrom 9999 permutations of the distance matrix. Then a setof dummy variables indicating the watershed containingeach site was analysed as a predictor variable set withthe distance variable set fitted as covariates. We used9999 permutations of the residual distance matrix toestimate P values. Two alternative watershed variablesets were analysed (Table 1), one was a ‘major drainage’ set(Tennessee and Cumberland; the single Catawba samplewas not included in the analyses), and the other was a‘watershed’ set including finer scale drainage subdivisions(Table 1).
Results
Gene trees
mtDNA. The 12S rDNA and cyt b data sets resulted innearly identical topologies and the combined mtDNA dataset of 1641 bp was used to estimate a final gene tree.GenBank Accession numbers for unique haplotypes can befound online (Table S1, Supplementary material). Absenceof premature stop codons in cyt b, strong bias againstguanine on the light strand, and high transition to tran-sversion substitution ratios indicate that amplified sequenceswere of mitochondrial origin, not nuclear pseudogenes(Zhang & Hewitt 1996). Maximum-likelihood analysisresulted in a single tree of –ln L 5486.55. Details of the MLmodel of evolution are available online (Table S2, Suppl-ementary material). Bayesian analysis produced a posteriordistribution with a mean –ln L of 5639.69 (SD = 0.19). MP, ML,and Bayesian analyses resulted in nearly identical topologies.All mtDNA haplotypes from the Tennessee cave salamandercomplex were nested within the gene tree of G. porphyriticushaplotypes (Fig. 2). No mtDNA haplotypes were sharedbetween named taxa, but genealogical discordance wascommon and divergence among haplotypes was shallow(Fig. 2). The ML tree, given the backbone constraint ofmonophyly of alleles within Gyrinophilus palleucus andG. gulolineatus, was rejected by the Shimodaira–Hasegawatest (log-likelihood ratio = 238.3, P < 0.001).
RAG-1. ML analysis of the 521 bp data set resulted in a singletree of –ln L 973.75. Bayesian analysis produced a posteriordistribution with a mean –ln L of 1011.20 (SD = 0.17). MP,ML, and Bayesian analyses resulted in nearly identical

2266 M . L . N I E M I L L E R , B . M . F I T Z PAT R I C K and B . T. M I L L E R
© 2008 The AuthorsJournal compilation © 2008 Blackwell Publishing Ltd
Fig. 2 Maximum-likelihood phylogram of the 1641 bp mtDNA data set (12S rDNA + cyt b). Numbers above branches indicate the posteriorprobability of a clade. Numbers below branches represent bootstrap support for clades resolved in maximum parsimony analysis. Shadingrepresents a priori taxonomic designations: light grey, G. palleucus (G. p. palleucus + G. p. necturoides); medium grey, G. porphyriticus; and darkgrey, G. gulolineatus. Numbers in parentheses at the tips indicate population localities as in Table 1 in which the haplotype occurred.

D I V E R G E N C E W I T H G E N E F L O W I N C AV E S A L A M A N D E R S 2267
© 2008 The AuthorsJournal compilation © 2008 Blackwell Publishing Ltd
topologies. Details of the ML model of evolution areavailable online (Table S2). The monophyly of Gyrinophiluswith respect to outgroup haplotypes (Pseudotriton ruber andStereochilus marginatus) is supported (PP = 0.95, BP = 100%);
however, the order of branching relationships withinGyrinophilus could not be elucidated with statistical supportbecause of the limited variation within RAG-1 (Figs 3and 4). For the most part, populations possessed haplotypes
Fig. 3 Maximum-likelihood phylogram of the 521 bp RAG-1 data set. Numbers above branches indicate the posterior probability of a clade.Numbers below branches represent bootstrap support for clades resolved in maximum parsimony analysis. Shading represents discordanthaplotypes: light grey, G. palleucus (G. p. palleucus + G. p. necturoides); medium grey, G. porphyriticus; and dark grey, G. gulolineatus. Numbersin parentheses at the tips indicate population localities as in Table 1 in which the haplotype occurred.
Fig. 4 Unrooted RAG-1 statistical parsimonynetwork. Area of circles is proportional tothe number of individuals with thathaplotype. Text inside circles correspondsto haplotype number in Table 1 and Fig. 3.Black squares represent unsampled or extincthaplotypes.

2268 M . L . N I E M I L L E R , B . M . F I T Z PAT R I C K and B . T. M I L L E R
© 2008 The AuthorsJournal compilation © 2008 Blackwell Publishing Ltd
corresponding to a priori taxonomic designations. Popu-lations of G. p. palleucus (populations 1–6) all possessedthe same haplotype (palleucus-06) and populations ofG. gulolineatus (populations 23–27) possessed haplotypegulolineatus-02. Moreover, the majority of G. p. necturoidesand necturoides-like samples including individuals with diver-gent mtDNA haplotypes possessed haplotype palleucus-02(populations 9–20). One haplotype was shared amongall three species and three other haplotypes were sharedbetween at least two species (Figs 3 and 4). Monophyly ofalleles within G. palleucus and G. gulolineatus was rejectedby the Shimodaira–Hasegawa test (log likelihood ratio =47.3, P = 0.022). In addition, the RAG-1 and mtDNA genetrees were significantly different according to the partition-homogeneity test (1000 replicates, P < 0.001).
What is the species tree? With the extremely shallow diver-gence and widespread haplotype sharing evident in ourdata, a bifurcating species tree could not be resolvedunequivocally. Maddison’s (1997) approach of choosingthe species tree that minimizes the number of deep coale-scents in the gene trees supported a sister relationshipbetween G. palleucus and the epigean G. porphyriticus,implying an earlier, independent origin of the Berry Cavesalamander (G. gulolineatus). Takahata’s (1989) shallowestdivergence consistency criterion also favours a slightlymore recent split between G. palleucus and G. porphyriticus.These methods allow for the expectation that recentlyderived species are genealogically nested within ancestralor sister species gene trees (Takahata 1989; Maddison1997; Hudson & Coyne 2002). However, they are limitedby assuming that genealogical discordance is due solely toincomplete lineage sorting and not gene flow. In contrast,grouping by average sequence divergence, patristic distance,or ΦST between taxa (Knowles & Carstens 2007) favoursmonophyly of the Tennessee cave salamander complex:on average, G. p. palleucus is most similar to G. p. necturoidesand G. gulolineatus is more similar to G. palleucus thanto the average G. porphyriticus. The latter method fails toappreciate the possibility that the cave-dwelling formsarose independently from the same regional stock, andtherefore drew their ancestral haplotypes from a similarnonrandom subset of G. porphyriticus gene lineages.
Divergence times. Using sequence divergence betweenG. palleucus mtDNA haplotypes and their nearest G. porp-hyriticus mtDNA haplotypes (after Takahata & Nei 1985),divergence time estimates range from 61 000 to 2.6 millionyears ago (Pleistocene to mid-Pliocene). This approachgives a range of 244 000 to 2.3 million years ago for theorigin of the Berry Cave salamander (G. gulolineatus).These ranges are broad, reflecting uncertainty in both themolecular clock and the relationship between gene treeand species tree.
Allopatric speciation vs. divergence with gene flow
The apparent recent origin of the Tennessee cave salamandercomplex and lack of phylogenetic resolution indicate thata population genetic analysis is the appropriate approachto study the origin of subterranean Gyrinophilus. Thus, theremainder of this study focuses on results of fitting the IMmodel to the data.
Tests of assumptions. Significant recombination was notdetected in either mtDNA or RAG-1 data sets using theDSS method as implemented in the program topali. Allhka tests for neutrality for each pairwise comparisonwere not significant. The test with the largest chi-squarevalue (1.6448) and lowest P value (P = 0.4394) was betweenG. porphyriticus and G. gulolineatus. Thus, the assumptionsof no recombination and no selection were not rejected.
With regard to population structure, all nominal taxawere genetically differentiated (Table 2), supporting treat-ment of G. p. necturoides and G. p. palleucus as separateunits. Genetic structure was evident within G. porphyriticusand G. p. necturoides (Table 2). To explicitly test for aneffect of watershed or drainage structure over and abovethe effect of distance, we performed dbRDA on G. p. nec-turoides and G. porphyriticus. When spatial variation wastaken into account by treating the second-order poly-nomial function of latitude and longitude as covariables,no association between mtDNA variation and major drain-age was detected (Table 3). A weak relationship betweengenetic variation and finer scale watershed subdivisionswas detected for G. porphyriticus. Little genetic variationexists for RAG-1 within the named taxa and no associationbetween RAG-1 variation and geographical distance andRAG-1 variation and finer scale watershed subdivisionswas detected. However, a significant relationship betweenRAG-1 variation and major drainage was detected forG. porphyriticus.
IM analyses. Given the above results, we consideredpairwise comparisons among each of the four describedtaxa (G. porphyriticus, G. gulolineatus, G. p. palleucus, andG. p. necturoides). In so doing, we follow previous authors(e.g. Machado et al. 2002; Hey & Nielsen 2004; Hey 2005;Won & Hey 2005) in accepting slight departures from thestrict IM model, and our results must be interpreted withthese departures in mind. First, the IM model only considerspairs of populations. Analysing multiple pairs is tantamountto assuming that genealogical relationships in each com-parison are unaffected by the existence of other populations;high rates of gene flow and dramatic changes in populationsize would be inconsistent with this assumption. Second,the IM model assumes that each population is panmictic.Significant structure within a population distorts thedistribution of coalescent times. As a consequence, estimates

D I V E R G E N C E W I T H G E N E F L O W I N C AV E S A L A M A N D E R S 2269
© 2008 The AuthorsJournal compilation © 2008 Blackwell Publishing Ltd
of effective population size and divergence time will alsobe distorted (Wakeley 2000), and we refrain from presentingor making inferences based on such estimates here.Nevertheless, we assume that the posterior probabilityof zero gene flow remains a valid test of isolation vs.divergence with gene flow (Machado et al. 2002; Hey &Nielsen 2004; Hey 2005; Won & Hey 2005).
Our results clearly reject the simple isolation model(m1 = m2 = 0). The posterior probability of zero migrationbetween spring salamanders and Tennessee cave salaman-ders was vanishingly small (Fig. 5A–C). Rather, nonzerogene flow between diverging populations was stronglysupported in all comparisons. Estimates of migration ratesbetween taxa indicate asymmetric gene flow. Nonzerogene flow was detected from the epigean G. porphyriticusinto the subterranean G. p. palleucus and G. gulolineatus(Fig. 5A, C). However, nonzero gene flow in the oppositedirection (from the subterranean to the surface form) wasindicated between G. p. necturoides and G. porphyriticus(Fig. 5B). Posterior distributions indicating gene flow forcomparisons among taxa within the Tennessee cave sala-mander complex have lower resolution as the curvesare broad and have higher probabilities at the low limitof resolution (Fig. 5D–F). These results suggest that geneflow between cave-dwelling and surface populations maybe greater than gene flow among the three cave-dwellingforms.
Given an inference of nonzero gene flow, an importantquestion is whether that signature results from secondarycontact and admixture after a long period of isolation orwhether gene flow has been more continuous between thediverging forms. Following Won & Hey (2005), we took aninformal approach to this question by recording the timingof simulated migration events in each genealogy sampledby the MCMC algorithm. Reconstructed migration eventsfor comparisons involving G. porphyriticus (Fig. 6) foreach locus were broadly distributed across time, consistentwith continuous or recurrent contact and gene flow betweenG. porphyriticus and the subterranean forms. If nonzerogene flow was due to recent secondary contact, we wouldexpect a greater concentration of migration near the presentin Fig. 6. Our analysis of the distribution of discordantnodes also supports continuous gene flow over secondarycontact. Mann–Whitney U-tests failed to reject randomdistributions of discordant nodes (for mtDNA W = 81.5,P = 0.38; for RAG-1 W = 44.5, P = 0.99). In fact, the trendwas for gene exchange events (discordant nodes) to be lessconcentrated toward the tips than expected by chance(observed distributions of discordant nodes were lessconcentrated toward the tips than 82% of randomizeddistributions for the mtDNA gene tree and 54% for theRAG-1 gene tree). Secondary contact after allopatric diver-gence would tend to result in discordant nodes concentratedtoward the tips of gene trees.Ta
ble
2Pa
irw
ise
F ST v
alue
s be
twee
n no
min
ate
taxa
am
ong
maj
or d
rain
ages
. FST
val
ues
for
mtD
NA
bel
ow d
iago
nal a
nd R
AG
-1 a
bove
Taxa
G. p
orph
yrit
icus
(T
enne
ssee
Rr.)
G. p
orph
yrit
icus
(C
umbe
rlan
d R
r.)G
. gul
olin
eatu
s (T
enne
ssee
Rr.)
G. p
. pal
leuc
us
(Ten
ness
ee R
r.)G
. p. n
ectu
roid
es
(Cum
berl
and
Rr.)
G. p
. nec
turo
ides
(T
enne
ssee
Rr.)
G. p
orph
yrit
icus
(Ten
ness
ee R
r.)0.
466*
**0.
786*
**0.
723*
**0.
825*
**0.
824*
**G
. por
phyr
itic
us (C
umbe
rlan
d R
r.)0.
108*
0.68
7***
0.65
7***
0.68
3***
0.74
4***
G. g
ulol
inea
tus
(Ten
ness
ee R
r.)0.
398*
**0.
392*
**0.
472*
**0.
767*
**0.
799*
**G
. p. p
alle
ucus
(Ten
ness
ee R
r.)0.
421*
**0.
416*
**0.
499*
**0.
588*
**0.
651*
**G
. p. n
ectu
roid
es (C
umbe
rlan
d R
r.)0.
405*
**0.
400*
**0.
557*
**0.
209*
**−0
.014
G. p
. nec
turo
ides
(Ten
ness
ee R
r.)0.
331*
**0.
312*
**0.
389*
*0.
267*
*0.
274*
Sign
ific
ance
leve
ls: *
P<
0.05
, **P
<0.
01, a
nd *
**P
<0.
001.

2270 M . L . N I E M I L L E R , B . M . F I T Z PAT R I C K and B . T. M I L L E R
© 2008 The AuthorsJournal compilation © 2008 Blackwell Publishing Ltd
Discussion
The transition from epigean to subterranean habitat presentsan opportunity for ecological speciation, where divergentselection in alternative habitats leads to evolution ofreproductively isolated populations with distinct ecologicaltraits (Schluter 2000). If selection is strong, ecological spe-ciation can proceed without geographical isolation (Rice &Hostert 1993; Schluter 2000; Gavrilets 2003). However,most biospeleologists have followed epigean biologistsin favouring allopatric speciation as the primary processin the origin of cave specialists (e.g. Barr & Holsinger1985). Because subterranean and epigean habitats are
often inherently parapatric, allopatric speciation scenariospropose local extinction of epigean populations and isolationof subterranean populations because of climate changecreating inhospitable surface conditions. The alternativescenario posits an adaptive shift of subterranean populationsin the face of ongoing gene flow with epigean populations(Howarth 1973, 1981). Whether nonallopatric speciation issympatric or parapatric depends on the initial magnitudeof gene flow between habitats (e.g. Gavrilets 2003; Coyne &Orr 2004); either case falls under the more general conceptof divergence with gene flow (Rice & Hostert 1993).
Divergence with gene flow has been inferred to explainthe origin of some terrestrial troglobites in the tropics (Rivera
Table 3 Tests for relationships between genetic variation of Gyrinophilus populations and the predictor variables distance, majorhydrological drainage, and hydrological watershed, using the dbRDA multivariate F-statistic in the distlm program. On the left are theresults of marginal tests for the distance variable set where a second-order polynomial function of latitude and longitude was fitted. Theother two columns show the results of conditional tests evaluating watershed connections as predictors of genetic variation withthe distance variable set included as covariables in each analysis. The column ‘%var’ indicates the percentage of the multivariatemtDNA variation explained by the predictor variable. P values less than 0.05 are indicated in bold
Taxon
Distance Major drainage Watershed
F P %var F P %var F P %var
mtDNAG. p. necturoides 11.835 0.0001 89.42 1.738 0.2264 2.38 1.267 0.4058 5.15G. porphyriticus 5.438 0.0004 77.27 0.546 0.6481 1.64 4.174 0.0340 19.88
RAG-1G. p. necturoides 1.138 0.4511 44.81 0.515 0.5069 4.37 1.386 0.3959 28.13G. porphyriticus 1.680 0.1723 51.22 9.354 0.0022 27.90 2.865 0.0867 40.34
Fig. 5 Posterior distributions of scaledmigration rate (m1 and m2) estimates foreach pairwise comparison among the nomin-ate taxa from the im program. The x-axesare rates of migration per gene copy permutation event; y-axes are marginal posteriorprobabilities. Posterior distributions shownin red are for migration from the taxondisplayed in red font and distributionsshown in blue are for migration from thetaxon displayed in blue font. The top rowshows gene flow between the surfacedwelling G. porphyriticus and the subter-ranean G. p. palleucus (A), G. p. necturoides(B), and G. gulolineatus (C). (D), (E), and (F)show gene flow between pairs of subter-ranean taxa.

D I V E R G E N C E W I T H G E N E F L O W I N C AV E S A L A M A N D E R S 2271
© 2008 The AuthorsJournal compilation © 2008 Blackwell Publishing Ltd
et al. 2002; Schilthuizen et al. 2005). Cases from temperateregions involving aquatic organisms are unknown, althoughthe Mexican cavefish, Astyanax (Strecker et al. 2003), andthe temperate amphipod, Gammarus (Culver et al. 1995),may be cases of divergence with gene flow speciationin progress. Other aquatic subterranean groups in theAppalachian Valley and Interior Plateaus of North America,such as Orconectes crayfish (Buhay & Crandall 2005), appearto be more ancient and only distantly related to their nearestepigean ancestors. The ecogeographical context of theorigins of such taxa is probably beyond the resolving powerof neontological data.
Present-day distributions of Gyrinophilus porphyriticusand the Tennessee cave salamander complex are parapatric(Fig. 1). The published distributions of the Berry Cavesalamander and G. porphyriticus overlap; however, the twospecies rarely occur in close proximity (Miller & Niemiller2008). Based on these distributions, Brandon (1971) pos-tulated that the subterranean species evolved from anepigean, metamorphosing ancestor similar to present-dayG. porphyriticus during the Pleistocene as climatic conditionsforced surface populations at the periphery of the species’range underground, thus isolating and facilitating speci-ation and evolution of troglomorphic characters as predicted
by the allopatric, climate-relict model. mtDNA and RAG-1genealogies support the hypothesis that all three subterraneanforms are recently derived from G. porphyriticus (Figs 2–4).However, the distribution of polymorphism and divergencein these groups favours divergence with gene flow overallopatric speciation. Posterior distributions of migrationrates reject a pure isolation model because the estimatedposterior probability of isolation (m = 0) between cave andsurface lineages is near zero (Fig. 5).
In general, divergence with gene flow can be facilitatedby a number of factors including assortative mating, selec-tion against hybrids, or habitat isolation as subterraneanpopulations became more specialized and spread deeperunderground (Rivera et al. 2002; Coyne & Orr 2004). InGyrinophilus, availability of breeding habitat may be aprimary ecological advantage of subterranean colonization.However, permanent residence underground also presentsa distinct set of ecological challenges. Survival in cavesrequires special sensory, metabolic, and life-history adap-tations for efficient foraging and resource use (Romero &Green 2005). These adaptations may be particularly likely toentail trade-offs; and trade-offs are necessary for ecologicalspeciation in the face of gene flow (Schluter 2000; Coyne &Orr 2004).
Fig. 6 Distributions of migration events(Won & Hey 2005) for each pairwisecomparison among the nominate taxa(G. p. palleucus, G. p. necturoides, G. gulolineatus,and G. porphyriticus) from the im program,summed across loci. The x-axes are time (innumber of generations ago) multiplied bythe effective neutral mutation rate. They-axes are the weighted averages of theindividual locus outputs where the weightis by the total number of migration eventsfrom the MCMC at stationarity for a locus.

2272 M . L . N I E M I L L E R , B . M . F I T Z PAT R I C K and B . T. M I L L E R
© 2008 The AuthorsJournal compilation © 2008 Blackwell Publishing Ltd
Tennessee cave salamanders show several cave-associatedtraits not shared by spring salamanders. These includereduced eyes, expanded lateral line systems, and elimina-tion of the terrestrial life-history stage. Reduced eyesmay be a correlated response to selection favouring hyper-trophy of other sensory systems (Culver et al. 1995; Borowsky& Wilkens 2002; Jeffery 2005; Protas et al. 2007). Paedomor-phosis and a permanently aquatic life cycle in subterraneansalamanders is probably adaptive in taking advantageof aquatic resources, while metamorphosis is favouredin the small surface streams inhabited by epigean Gyri-nophilus (Wilbur & Collins 1973; Whiteman 1994). In othersalamanders, paedomorphosis is prevalent in areaswhere terrestrial habitats are particularly inhospitable(Shaffer & Voss 1996; Chippindale et al. 2000; Bonett &Chippindale 2006).
Paedomorphosis may contribute to premating isolation;paedomorphs must court and mate underwater whilemetamorphosed Gyrinophilus may court and mate under-water or on land, although only the latter has been observed(Beachy 1997). Courtship and breeding have never beenobserved for paedomorphic Gyrinophilus. However, instancesof successful breeding between paedomorphs and meta-morphs exist for other salamander species (Semlitsch &Wilbur 1989; Krenz & Sever 1995; Whiteman et al. 1999;Denöel et al. 2001). Bonett & Chippindale (2006) suggestthat paedomorphosis in plethodontid salamanders mayaffect mate recognition. The majority of metamorphosingplethodontids exhibit terrestrial courtship where phe-romones play an intricate role. Reproductive isolationbetween paedomorphs and metamorphs may occur readilyin plethodontids if paedomorphs do not develop the samepheromones as metamorphs (Bonett & Chippindale2006).
Temperate cave faunas have often been viewed asisolated and relictual, with troglomorphic traits evolvingslowly via ‘regressive’ evolution (Romero & Green 2005).However, several examples illustrate rapid, adaptivedivergence of cave populations from epigean ancestors(Chakraborty & Nei 1974; Wilkens & Hüppop 1986;Culver et al. 1995). Here, we present evidence from mito-chondrial and nuclear gene genealogies consistent withrecent divergence with gene flow of Tennessee cavesalamanders from surface-dwelling G. porphyriticus. Theorigin of subterranean species takes place in a simpleecological context where strong natural selection maypromote local adaptation and ecological speciation,even in the face of extensive gene flow. With growingacceptance of divergence with gene flow speciation amongzoologists (Coyne & Orr 2004), increasing volumes ofDNA data, and development of statistical tools likethe IM model (Hey & Nielsen 2004), we expect discoveryof more examples of divergence with gene flow incave-adapted animals.
Acknowledgements
We are grateful to N. Mann, G. Moni, A. Moni, C. Kerr, H. Garland,J. Jensen, J. Buhay, A. Wynn, J. Douglas, B. Biddix, B. Walter, B.Glorioso, J. Todd, A. Farone, M. Farone, T. Niemiller, R. Wyckoff,C. Davis, J.A. Miller, J.H. Miller, E. Gray, E. Young, L. Faust, A.Moore, G. Wallace, G. Reynolds, and P. Shah for assistance duringfield sampling or laboratory work. We thank the Tennessee CaveSurvey and the Tennessee Department of Environment and Con-servation for providing locality data and the state agencies ofAlabama, Georgia, and Tennessee for permits. We thank theSoutheastern Cave Conservancy, Inc. and private landownersfor allowing access to their property. An earlier draft of thismanuscript was reviewed by J. Fordyce, J. Holsinger, T. Poulson,K. Kozak, J. Buhay, and G. Reynolds. This work was funded by theTennessee Wildlife Resources Agency (contract nos ED-04-01467-00 and ED-06-02149-00), the Department of Biology at MiddleTennessee State University, and the Department of Ecology andEvolutionary Biology at the University of Tennessee.
References
Anderson MJ (2004) DISTLM Version 5: A FORTRAN Computer Pro-gram to Calculate a Distance-Based Multivariate Analysis for a LinearModel. Department of Statistics, University of Auckland, NewZealand.
Ashmole NP (1993) Colonization of the underground environmentin volcanic islands. Mémoires de Biospéologie, 20, 1–11.
Avise JC, Walker D, Johns GC (1998) Speciation durations andPleistocene effects on vertebrate phylogeography. Proceedings ofthe Royal Society B: Biological Sciences, 265, 1707–1712.
Barluenga M, Stolting KN, Salzburger W, Muschick M, Meyer A(2006) Sympatric speciation in Nicaraguan crater lake cichlidfish. Nature, 439, 719–723.
Barr TC Jr (1961) Caves of Tennessee. Bulletin 64. Tennessee Divisionof Geology, Nashville, Tennessee.
Barr TC Jr (1968) Cave ecology and evolution of troglobites.Evolutionary Biology, 2, 35–102.
Barr TC Jr, Holsinger JR (1985) Speciation in cave faunas. AnnualReview of Ecological Systematics, 16, 313–337.
Barraclough TG, Vogler AP (2000) Detecting the geographicalpattern of speciation from species-level phylogenies. AmericanNaturalist, 155, 419–434.
Beachy CK (1997) Courtship behavior in the plethodontid sala-mander Gyrinophilus porphyriticus. Herpetologica, 54, 288–296.
Birchfield GL, Bruce RC (2000) Morphometric variation amonglarvae of four species of lungless salamanders (Caudata:Plethodontidae). Herpetologica, 56, 332–342.
Bolnick DI, Fitzpatrick BM (2007) Sympatric speciation: modelsand empirical evidence. Annual Review of Ecology, Evolution andSystematics, 38, 459–487.
Bonett RM, Chippindale PT (2006) Streambed microstructurepredicts evolution of development and life history mode inthe plethodontid salamander Eurycea tynerensis. BioMed CentralBiology, 4, 6.
Borcard D, Legendre P, Drapeau P (1992) Partialling out thespatial component of ecological variation. Ecology, 73, 1045–1055.
Borowsky R, Wilkens H (2002) Mapping a cave fish genome: poly-genic systems and regressive evolution. Journal of Heredity, 93,19–21.
D I V E R G E N C E W I T H G E N E F L O W I N C AV E S A L A M A N D E R S 2273
© 2008 The AuthorsJournal compilation © 2008 Blackwell Publishing Ltd
Brandon RA (1966) Systematics of the salamander genus Gyrinophilus.Illinois Biology Monographs, 35, 1–85.
Brandon RA (1971) North American troglobitic salamanders:some aspects of modification in cave habitats, with specialreference to Gyrinophilus palleucus. Bulletin of the National Speleolo-gical Society, 33, 1–21.
Bruce RC (1972) Variation in the life cycle of the salamanderGyrinophilus porphyriticus. Herpetologica, 28, 230–245.
Bruce RC (2003) Ecological distribution of the salamanders Gyri-nophilus and Pseudotriton in a southern Appalachian watershed.Herpetologica, 59, 301–310.
Buhay JE, Crandall KA (2005) Subterranean phylogeographyof freshwater crayfishes shows extensive gene flow and sur-prisingly large population sizes. Molecular Ecology, 14, 4259–4273.
Castellano S, Balletto E (2002) Is the partial Mantel test inadequate?Evolution, 56, 1871–1873.
Chakraborty R, Nei M (1974) Dynamics of gene differentiationbetween incompletely isolated populations of unequal size.Theoretical Population Biology, 5, 460–469.
Chippindale PT, Price AH, Wiens JJ, Hillis DM (2000) Phylogeneticrelationships and systematic revision of central Texas hemidac-tyliine plethodontid salamanders. Herpetological Monographs, 14,1–80.
Chippindale PT, Bonett RM, Baldwin AS, Wiens JJ (2004)Phylogenetic evidence for a major reversal in life historyevolution in plethodontid salamanders. Evolution, 58, 2809–2822.
Clark AG (1990) Inference of haplotypes from PCR-amplifiedsamples of diploid populations. Molecular Biology and Evolution,7, 111–122.
Clement MD, Posada D, Crandall KA (2000) tcs: a computerprogram to estimate gene genealogies. Molecular Ecology, 9,1657–1659.
Cooper JE, Cooper MR (1968) Cave-associated herpetozoa II:salamanders of the genus Gyrinophilus. Alabama caves. Bulletinof the National Speleological Society, 30, 19–24.
Coyne JA (2007) Sympatric speciation. Current Biology, 17, R787–R788.
Coyne JA, Orr HA (2004) Speciation. Sinauer Associates, Sunderland,Massachusetts.
Culver DC (1982) Cave Life: Evolution and Ecology. Harvard UniversityPress, Cambridge, Massachusetts.
Culver DC, Kane TC, Fong DW (1995) Adaptation and Natural Selectionin Caves: the Evolution of Gammarus minus. Harvard UniversityPress, Cambridge, Massachusetts.
Darwin C (1859) On the Origin of Species. John Murray, London.Degnan JH, Rosenberg NA (2006) Discordance of species trees with
their most likely gene trees. Public Library of Science: Genetics, 2,762–768.
Denöel M, Poncin P, Ruwet J (2001) Sexual compatibility betweentwo heterochronic morphs in the alpine newt, Triturus alpestris.Animal Behavior, 62, 559–566.
Eigenmann CH (1909) Cave Vertebrates of America. A Study inDegenerative Evolution. Carnegie Institution of Washington,Washington.
Felsenstein J (1985) Confidence limits on phylogenies: an approachusing the bootstrap. Evolution, 39, 783–791.
Fitzpatrick BM, Turelli M (2006) The geography of mammalianspeciation: mixed signals from phylogenies and range maps.Evolution, 60, 601–615.
Gavrilets S (2003) Models of speciation: what have we learned in40 years? Evolution, 57, 2197–2215.
Geffen E, Anderson MJ, Wayne RK (2004) Climate and habitatbarriers to dispersal in the highly mobile grey wolf. MolecularEcology, 13, 2481–2490.
Goebel AM, Donelly JM, Atz ME (1999) PCR primers and ampli-fication methods for 12S ribosomal DNA, the control region,cytochrome oxidase I, and cytochrome b in bufonids and otherfrogs and an overview of PCR primers which have amplifiedDNA in amphibians successfully. Molecular Phylogenetics andEvolution, 11, 163–199.
Hendry AP, Nosil P, Rieseberg LH (2007) The speed of ecologicalspeciation. Functional Ecology, 21, 455–464.
Hey J (2005) On the number of New World founders: a populationgenetic portrait of the peopling of the Americas. Public Library ofScience: Biology, 3, e193.
Hey J, Machado CA (2003) The study of structured populations —a difficult and divided science has new hope. Reviews Genetics,4, 535–543.
Hey J, Nielsen R (2004) Multilocus methods for estimating popu-lation sizes, migration rates and divergence time, with applicationsto the divergence of Drosophila pseudoobscura and D. persimilis.Genetics, 167, 747–760.
Holsinger JR (1988) Troglobites: the evolution of cave-dwellingorganisms. American Scientist, 76, 85–105.
Holsinger JR (2000) Ecological derivation, colonization, andspeciation. In: Ecosystems of the World, Vol. 30 (eds Wilkens H,Culver DC, Humphreys WF), pp. 399–415. Elsevier, Oxford.
Howarth FG (1973) The cavernicolous fauna of Hawaiian lavatubes. I. Introduction. Pacific Insects, 15, 139–151.
Howarth FG (1981) Non-relictual terrestrial troglobites in thetropic Hawaiian caves. Proceedings of the 8th International Congressof Speleology (Bowling Green, Kentucky), 2, 539–541.
Hudson RD, Coyne JA (2002) Mathematical consequences of thegenealogical species concept. Evolution, 56, 1557–1565.
Hudson RR, Kreitman M, Aguade M (1987) A test of neutralmolecular evolution based on nucleotide data. Genetics, 116,153–159.
Irwin DE (2002) Phylogeographic breaks without geographicbarriers to gene flow. Evolution, 56, 2383–2394.
Jeffery WR (2005) Adaptive evolution of eye degeneration in theMexican blind cavefish. Journal of Heredity, 96, 185–196.
Knowles LL, Carstens BC (2007) Estimating a geographicallyexplicit model of population divergence for statistical phylogeo-graphy. Evolution, 61, 477–493.
Krenz JD, Sever DM (1995) Mating and oviposition in paedo-morphic Ambystoma talpoideum precedes the arrival of terrestrialmales. Herpetologica, 51, 387–393.
Legendre P, Anderson MJ (1999) Distance-based redundancyanalysis: testing multispecies responses in multifactorial ecolo-gical experiments. Ecological Monographs, 69, 1–24.
Lessard S, Wakeley J (2004) The two-locus ancestral graph in a sub-divided population: convergence as the number of demes grows inthe island model. Journal of Mathematical Biology, 48, 275–292.
Macey JR (2005) Plethodontid salamander mitochondrial genomics:a parsimony evaluation of character conflict and implicationsfor historical biogeography. Cladistics, 21, 194–202.
Machado C, Kliman RM, Markert JM, Hey J (2002) Inferring thehistory of speciation from multilocus DNA sequence data: thecase of Drosophila pseudoobscura and its close relatives. MolecularBiology and Evolution, 19, 472–488.

2274 M . L . N I E M I L L E R , B . M . F I T Z PAT R I C K and B . T. M I L L E R
© 2008 The AuthorsJournal compilation © 2008 Blackwell Publishing Ltd
Maddison WP (1997) Gene trees in species trees. Systematic Biology,46, 523–536.
Maddison WP, Knowles LL (2006) Inferring phylogeny despiteincomplete lineage sorting. Systematic Biology, 55, 21–30.
Maddison WP, Maddison DR (2006) MESQUITE: A Modular System forEvolutionary Analysis, Version 1.12, http://mesquiteproject.org.
McArdle BH, Anderson MJ (2001) Fitting multivariate models tosemi-metric distances: a comment on distance-based redundancyanalysis. Ecology, 82, 290–297.
Miller BT, Niemiller ML (2008) Distribution and relative abun-dance of Tennessee cave salamanders (Gyrinophilus pallecusand Gyrinophilus gulolineatus) with an emphasis on Tennesseepopulations. Herpetological Conservation and Biology, 3, 1–20.
Milne I, Wright F, Rowe G et al. (2004) topali: software for automaticidentification of recombinant sequences within DNA multiplealignments. Bioinformatics, 20, 1806–1807.
Min MS, Yang SY, Bonett RM et al. (2005) Discovery of the firstAsian plethodontid salamander. Nature, 435, 87–90.
Moritz C, Schneider CJ, Wake DB (1992) Evolutionary relation-ships within the Ensatina eschscholtzi complex confirm the ringspecies interpretation. Systematic Zoology, 41, 273–291.
Mueller RL, Macey JR, Jaekel M, Wake DB, Boore JL (2004)Morphological homoplasy, life history evolution, and historicalbiogeography of plethodontid salamanders: novel insights fromcomplete mitochondrial genome sequences. Proceedings of theNational Academy of Sciences, USA, 101, 13820–13825.
Nielsen R, Wakeley J (2001) Distinguishing migration from iso-lation: a Markov chain Monte Carlo approach. Genetics, 158,885–896.
Nordborg M (2001) Coalescent theory. In: Handbook of StatisticalGenetics (eds Balding DJ, Cannings C, Bishop M), pp. 179–212.Wiley, Chichester, UK.
Panova M, Hollander J, Johannesson K (2006) Site-specific geneticdivergence in parallel hybrid zones suggests nonallopatricorigin of reproductive barriers. Molecular Ecology, 15, 4021–4031.
Petranka JW (1998) Salamanders of the United States and Canada.Smithsonian Institution Press, Washington.
Posada D, Crandall KA (1998) modeltest: testing the model ofDNA substitution. Bioinformatics, 14, 817–818.
Poulson TL (1963) Cave adaptation in amblyopsid fishes. AmericanMidland Naturalist, 70, 257–290.
Poulson TL (1985) Evolutionary reduction by neutral mutations:plausibility arguments and data from amblyopsid fishes andlinyphiid spiders. Bulletin of the National Speleological Society, 47,109–117.
Protas M, Conrad M, Gross JB, Tabin C, Borowsky R (2007) Regres-sive evolution in the Mexican cave tetra, Astyanax mexicanus.Current Biology, 17, 452–454.
Quesada H, Posada D, Caballero A, Moran P, Rolan-Alvarez E(2007) Phylogenetic evidence for multiple sympatric ecologicaldiversification in a marine snail. Evolution, 61, 1600–1612.
Raufaste N, Rousset F (2001) Are partial Mantel tests adequate?Evolution, 55, 1703–1705.
Rice WR, Hostert EE (1993) Laboratory experiments on speci-ation: what have we learned in 40 years? Evolution, 47, 1637–1653.
Rivera MAJ, Howarth FG, Taiti S, Roderick GK (2002) Evolution inHawaiian cave-adapted isopods (Oniscidea: Philosciidae):vicariant speciation or adaptive shifts? Molecular Phylogeneticsand Evolution, 25, 1–9.
Rodriguez F, Oliver JL, Marin A, Medina JR (1990) The generalstochastic model of nucleotide substitution. Journal of TheoreticalBiology, 142, 485–501.
Romero A, Green SM (2005) The end of regressive evolution:examining and interpreting the evidence from cave fishes.Journal of Fish Biology, 67, 3–32.
Ronquist F, Huelsenbeck JP (2003) mrbayes 3: Bayesian phylo-genetic inference under mixed models. Bioinformatics, 19,1572–1574.
Rosenberg NA, Nordborg M (2002) Genealogical trees, coalescenttheory, and the analysis of genetic polymorphisms. NatureReviews Genetics, 3, 380–390.
Rousset F (2002) Partial Mantel tests: reply to Castellano and Balletto.Evolution, 56, 1874–1875.
Salter Kubatko L, Degnan JH (2007) Inconsistency of phylogeneticestimates from concatenated data under coalescence. SystematicBiology, 56, 17–24.
Savolainen V, Anstett MC, Lexer C et al. (2006) Sympatric specia-tion in palms on an oceanic island. Nature, 441, 210–213.
Schilthuizen M, Cabanban AS, Haase M (2005) Possible speciationwith gene flow in tropical cave snails. Journal of ZoologicalSystematics and Evolutionary Research, 43, 133–138.
Schluter D (2000) The Ecology of Adaptive Radiation. Oxford UniversityPress, Oxford, UK.
Semlitsch RD, Wilbur HM (1989) Artificial selection for paedo-morphosis in the salamander Ambystoma talpoideum. Evolution,43, 105–112.
Shaffer HB, Voss SR (1996) Phylogenetic and mechanistic analysisof a developmentally integrated character complex: alternatelife history modes in ambystomatid salamanders. AmericanZoologist, 36, 24–35.
Slatkin M, Maddison WP (1989) A cladistic measure of gene flowinferred from the phylogeny of alleles. Genetics, 123, 603–613.
Strecker U, Bernatchez L, Wilkens H (2003) Genetic divergencebetween cave and surface populations of Astyanax in Mexico(Characidae, Teleostei). Molecular Ecology, 12, 669–710.
Swofford DL (2002) PAUP*: Phylogenetic Analysis Using Parsimony(* and Other Methods), Version 4.0. Sinauer Associates, Sunderland,Massachusetts.
Takahata N (1989) Gene genealogy in three related populations —consistency probability between gene and population trees.Genetics, 122, 957–966.
Takahata N, Nei M (1985) Gene genealogy and variance of inter-population nucleotide differences. Genetics, 110, 325–344.
Tamura K, Nei M (1993) Estimation of the number of nucleotidesubstitutions in the control region of mitochondrial DNA inhumans and chimpanzees. Molecular Biology and Evolution, 10,512–526.
Thompson JD, Gibson TJ, Plewniak F, Jeanmougin F, Higgins DG(1997) The clustal_x windows interface: flexible strategiesfor multiple sequence alignment aided by quality analysis tools.Nucleic Acids Research, 25, 4876–4882.
Wakeley J (2000) The effects of subdivision on the genetic diver-gence of populations and species. Evolution, 54, 1092–1101.
Wakeley J (2004) Metapopulations and coalescent theory. In:Ecology, Genetics, and Evolution of Metapopulations (eds HanskiI, Gaggiotti O), pp. 175–198. Elsevier, Oxford, UK.
Wakeley J, Aliacar N (2001) Gene genealogies in a metapopulation.Genetics, 159, 893–905.
Wakeley J, Hey J (1998) Testing speciation models with DNAsequence data. In: Molecular Approaches to Ecology and Evolution

D I V E R G E N C E W I T H G E N E F L O W I N C AV E S A L A M A N D E R S 2275
© 2008 The AuthorsJournal compilation © 2008 Blackwell Publishing Ltd
(eds Schierwater B, DeSalle R), pp. 157–175. Birkhauser-Verlag,Basel, Switzerland.
Whiteman HH (1994) Evolution of facultative paedomorphosis insalamanders. Quarterly Review of Biology, 69, 205–221.
Whiteman HH, Gutrich JJ, Moorman RS (1999) Courtship behaviorin a polymorphic population of the tiger salamander, Ambystomatigrinum nebulosum. Journal of Herpetology, 33, 348–351.
Whiting AS, Bauer AM, Sites JW Jr (2003) Phylogenetic relation-ships and limb loss in sub-Saharan African scincine lizards(Squamata: Scincidae). Molecular Phylogenetics and Evolution, 29,582–598.
Whitlock MC, Barton NH (1997) The effective size of a subdividedpopulation. Genetics, 146, 723–733.
Wiens JJ, Engstrom TN, Chippindale PT (2006) Rapid diversifica-tion, incomplete isolation, and the ‘speciation clock’ in NorthAmerican salamanders (genus Plethodon): testing the hybridswarm hypothesis of rapid radiation. Evolution, 60, 2585–2603.
Wilbur HM, Collins JP (1973) Ecological aspects of amphibianmetamorphosis. Science, 182, 1305–1314.
Wilkens H, Hüppop K (1986) Sympatric speciation in cave fishes?Studies on mixed population of epi and hypogean Astyanax(Characidae, Pisces). Zeitschrift für Zoologische Systematik undEvolutionsforschung, 24, 223–230.
Won YJ, Hey J (2005) Divergence population genetics of chim-panzees. Molecular Biology and Evolution, 22, 297–307.
Zhang D-X, Hewitt GM (1996) Nuclear integrations: challengesfor mitochondrial DNA markers. Trends in Ecology & Evolution,11, 247–251.
This study represents Matthew Niemiller’s master’s thesis on theevolutionary history of cave salamanders with Brian Miller.Niemiller’s research interests focus on the ecology, populationgenetics and phylogeography of subterranean fauna with anemphasis on fish and salamanders. Niemiller is currently adoctoral student in the Department of Ecology and EvolutionaryBiology at the University of Tennessee. Ben Fitzpatrick is anAssistant Professor in the Department of Ecology and EvolutionaryBiology at the University of Tennessee. Fitzpatrick’s researchinterests include the genetics and biogeography of speciation, theimportance of local adaptation for both evolution and conservationmanagement, and invasion biology. Brian Miller is a Professor ofBiology at Middle Tennessee State University. Miller studies theevolution, ecology and conservation biology of amphibians andreptiles, particularly salamanders.
Supplementary material
The following supplementary material is available for this article:
Table S1 GenBank Accession numbers for unique mtDNA (12Sand cyt b) and nuclear (RAG-1) haplotypes observed.
Table S2 The optimal model of sequence evolution for each dataset (mtDNA and RAG-1) determined in modeltest 3.7 and usedfor ML analyses.
This material is available as part of the online article from:http://www.blackwell-synergy.com/doi/abs/10.1111/j.1365-294X.2008.03750.x(This link will take you to the article abstract).
Please note: Blackwell Publishing are not responsible for the con-tent or functionality of any supplementary materials supplied bythe authors. Any queries (other than missing material) should bedirected to the corresponding author for the article.
![Functional Redundancy and Divergence within the · Functional Redundancy and Divergence within the Arabidopsis RETICULATA-RELATED Gene Family1[W][OA] José Manuel Pérez-Pérez, David](https://img.pdfslide.net/doc/110x75/5b5319e87f8b9add3a8b6d55/functional-redundancy-and-divergence-within-functional-redundancy-and-divergence.jpg)