Embed Size (px)
Citation preview

300
Australian Geographical Studies
•
November 2002
•
40(3):300–322
Blackwell Science Asia
Locational Disadvantage and Household Locational Decisions: Changing Contexts and Responses in the Cessnock District of New South Wales, Australia, 1964–1999
JOHN HOLMES,
1
KATE HARTIG
2
AND MARTIN BELL
1
1
University of Queensland and
2
University of Newcastle, New South Wales
Abstract
Following the rapid demise of local coalmining in the 1950s and early 1960s, theformer coal towns of the Cessnock area have survived in their newfound dormitoryrole, with cheap serviced housing acting as a major constraint on out-migration andan incentive for in-migration for low-income householders, mainly engaged inexternal commuting or outside the workforce. Behavioural responses to wideninglocal job deficits in the early 1960s were reported in this journal (Holmes, 1965).From household surveys and other sources, Holmes examined the interplay betweenindividual, household and locality variables and presented a spectrum of projectedfuture outcomes for localities, according to accessibility, size and service provision,either attached to the Newcastle-Maitland labour market as low-income outer sub-urbs or experiencing varying rates of decline while providing low-cost welfarehousing. While these broad trends have continued over the last 35 years, significantvariants, not predictable in 1965 have emerged, notably: the increased residentialattractiveness of some small localities; the strengthening of welfare migration,notably from Sydney; the increase in non-workforce households; and, some evid-ence of emerging socio-economic polarisation in larger towns. In these respects,Cessnock localities can be viewed as a microcosm of wider trends in Australiansociety, trends which are most fully revealed in disadvantaged metropolitanperipheral localities.
KEY WORDS:
locational disadvantage; household mobility; welfare migration;housing markets; Hunter Valley; New South Wales
Introduction: locational disadvantage and mobility
In Australia, as in many other western nations,researchers have discerned a significant spatial
dimension in the trend towards increased socialand economic polarisation, with disadvantagedhouseholds becoming concentrated in disadvant-aged localities (see Maher
et al
., 1992; Maher,
AGES_039.fm Page 300 Tuesday, September 10, 2002 11:04 AM

Locational Disadvantage and Household Locational Decisions 301
© Institute of Australian Geographers 2002
1993; Murphy and Watson, 1994). Concern hasbeen expressed about the way that geographic-ally concentrated unemployment and povertycreates an environment that isolates residentsfrom the world of work and promotes a cultureof dependency (Vinson, 1999, 10).
It has also been shown that internal migrationis a major contributor to emerging locationalinequalities, with disadvantaged groups playingan increasingly significant role in the redistribu-tion of Australia’s population (Birrell, 2000).Contrary to classical equilibrium theory, whichpostulates migration from low-income and/orjob deficit areas towards high income and/orjob surplus locations, there has been a pro-gressive disarticulation between economic anddemographic trends (O’Connor and Stimson,1996).
Through a detailed analysis of 1991 census dataon interregional mobility, Wulff and Bell (1998,6) recognised that ‘. . . mobility is exerting anindependent or intervening influence on socialstructures [with] poor areas becoming poorer, notjust by rising unemployment among local resid-ents, but also by the movement into the area ofpoor unemployed households or the movementout of the area by those who are better off.’Furthermore they argue that ‘. . . moves by lowincome households, despite the cost and upheavalinvolved, may in fact represent economicallyrational decisions’ (1998, x) primarily throughaccess to cheaper housing, and occasional jobprospects at the lower end of the occupationspectrum. Additionally, it is noted that a ‘. . .focus on mobility can detract attention fromimmobility . . . in many cases, it is the immobilityof households that creates disadvantage . . .’. withpoverty traps reinforced by plummeting realestate values (Wulff and Newton, 1996, 438).
To date, Australian research into mobility andlocational disadvantage has relied almost entirelyon analyses of census and other areally-aggregateddata. Increasingly, it is being recognised thatfurther insights require intensive case studies atthe level of localities and households. This widelystated view is summarised by Wulff and Newton(1996, 439):
So much of the relationship between mobilityand social justice depends on the experience ofindividual households and the area in whichthey live. Consequently, only innovative researchdesigns that place the household in the contextof location as well as carefully framed analysesdrawing on multiple data sources can possiblyadvance an adequate understanding of thisrelationship.
This paper endeavours to take up Wulff andNewton’s appeal by examining the changingface of disadvantage in the Cessnock coalfieldsof New South Wales. Comparisons of householdmobility, migration decisions and activity pat-terns in the late 1990s with those observed threedecades earlier provide a unique opportunityto trace the processes underpinning the originsand perpetuation of locational disadvantage. Bycoupling analyses of aggregate data with inten-sive localised research we aim to tease out thecomplex interplay between large-scale structuralforces, household decisions, and the nature oflocalities. In focusing on the near-metropolitanhinterland, it also seeks to broaden the scope ofinquiry into locational disadvantage beyond thecontemporary narrow preoccupation on metro-politan areas. From a wider perspective, the signific-ance of this longitudinal research is that it identifiespriority issues requiring further investigation bygovernmental and non-governmental agenciesconcerned with enhancing the life chances ofresidents in localities that have been defined asbeing socially and economically disadvantaged.
Previous research in the Cessnock District
Some 32 years before Wulff and Newton’s (1996)plea for household-focussed research, Holmes(1965, 1971) undertook a comparable, if limited,inquiry into the household decision process in acontext of locational disadvantage. This researchaddressed the issues currently of concern toresearchers and policy makers (see Gregory andHunter, 1995; Raskall, 1995; Newton and Bell,1996). The multiple data sources advocated byWulff and Newton (1996) were used includinghousehold interview and questionnaire surveys,supplemented by school records on arrivals and
AGES_039.fm Page 301 Tuesday, September 10, 2002 11:04 AM
302 Australian Geographical Studies
© Institute of Australian Geographers 2002
departures, housing prices, census data and avariety of other local information sources.
This inquiry was focussed on the former coaltowns of the Cessnock district, near Newcastle,New South Wales, where the demise of the gas-making coal industry had prompted a reductionin the local mining workforce from 6700 in1954 to under 1400 in 1964. In the absence of
alternative local employment, but with ample jobopportunities in manufacturing, construction andmining at Newcastle, Maitland, Lake Macquarie(see Figure 1) and elsewhere, displaced minersand their households were faced with a clearchoice between out-commuting, out-migrationor early retirement. This provided an unparalleledcontext for research into the household decision
Figure 1 Cessnock coalfield towns: locality map.
AGES_039.fm Page 302 Tuesday, September 10, 2002 11:04 AM

Locational Disadvantage and Household Locational Decisions 303
© Institute of Australian Geographers 2002
process with particular attention to the interplaybetween household attributes and locality char-acteristics. The survey covered 555 households,located in six coal towns, differentiated on criticalvariables including accessibility, size, amenitiesand services, transport and housing markets.Locality differences were sufficiently significantto enable Holmes (1965) to propose three dis-tinctly different sets of projected long-term out-comes for former coal towns in their new-founddormitory role.
Current policy concern with the entrenchmentof disadvantage in job-poor localities provides acompelling case to revisit the same localities studiedover 35 years ago when locational disadvantagewas less entrenched and of less policy concernthan it is now. Valuable insights may be gainedby comparing projected with current outcomesfor these settlements and their resident house-holds. Any apparent divergences could well beindicative of changing directions within Aus-tralian society.
The 1964 Cessnock survey: summary of findings
In 1964, alternative employment was readilyavailable for displaced miners, and local unem-ployment only briefly exceeded four per cent.However, over half of the resident male work-forces were employed outside the Cessnock district.As indicated in Figure 2, many retrenched mineworkers, notably those resident in the northerncoaltowns found employment in the manufactur-ing sector, also involving commuting to the heavyindustries in Newcastle and the textile industriesin Maitland (Hartig and Holmes, 2000). However,as Holmes (1965, 109) noted ‘Cessnock workers,geographically peripheral to Newcastle’s labour-shed, have also been economically a marginalworkforce, only newly arrived and including veryfew whose skills are suitable for non-miningemployment . . . and, according to 62.4 per centof those interviewed, at wage levels below thosereceived in mining.’
Job dissatisfaction and daily travel burdenscompelled many households to consider out-migration as an alternative to out-commuting.
The decision to stay or move was influenced bya complex interplay between personal, householdand locality variables. Most influential was thestage in life-course of the primary income-earner(the former local coalminer). Middle-aged to olderminers revealed a high propensity to acceptthe heaviest commuting burdens, encouragedby strong inducements to maintain ties to bothcoalmining and their home localities. However,a high proportion unable to continue in miningaccepted unskilled work, mainly in Newcastle’sheavy industries or in job-creating constructionprojects. Younger workers showed a high pro-pensity to migrate, particularly if living in small,remote mining townships.
Already by 1964, locality-related variables werestrongly influencing the prospective outcomesfor former coal towns in their newfound job-deficit, dormitory role, with the most significantinfluences being proximity to Newcastle (and
Figure 2 Cessnock coalfield towns: percentage of maleworkforce engaged in manufacturing in each censuscollection district in 1961.
AGES_039.fm Page 303 Tuesday, September 10, 2002 11:04 AM

304 Australian Geographical Studies
© Institute of Australian Geographers 2002
Maitland) and settlement size and infrastructure.These locality-related variables influenced the per-ceptions and actions of both stayers and movers(in-migrants and as well as out-migrants). Itwas in the small outlying townships that stayersexpressed the strongest desire to out-migrate andmost frequently mentioned house-price differ-entials as a major constraint (Holmes, 1965, 121).The behaviour of out-migrants was not known,but in-migrants were also revealing markedlydifferentiated locational choices, tied to workforcestatus. The Kurri Kurri-Weston area, closest toNewcastle and Maitland, was already experiencinga small influx of young working householdersattracted by cheap housing and willing to reverse-commute to their existing workplaces. Smallremote localities, such as Paxton, Millfield andEllalong, could only attract welfare migrants, out-side the workforce, seeking the cheapest possiblehousing (Holmes, 1965, 121).
Using the data from the household surveys,school records on arrivals and departures, cen-sus data and real estate sales, Holmes (1965)predicted three distinct outcomes for the formercoal towns, namely:
1. Stable external commuting with entry of somesuburbanites for the more accessible towns ofCessnock, Kurri, Weston, Abermain, PelawMain and Stanford Merthyr.
2. Slowly declining external commuting withlimited replacement for Bellbird, Kearsley,Neath, Paxton and Millfield.
3. Rapidly declining external commuting withpersistent population decline for the moreremote communities of Ellalong, Kitchenerand Abernethy.
How have these former coaltowns fared overthe last 35 years, in the context of deindustrial-isation, the transition to a service and informa-tion economy, entrenched higher unemploymentlevels and the widening impacts of metropolitanpopulation growth and housing needs? How suc-cessful have these localities been, not only inretaining or attracting people, but also in meet-ing their needs for housing, jobs, services andamenities? Specifically, to what extent have the
scenarios, predicted according to trends in 1964been realised?
Changing fortunes for Cessnock’s former coal towns
During 1998 and 1999 research was conductedthroughout the Cessnock area to address thequestions raised above. Equally important werequestions regarding the residents’ levels of sat-isfaction with living in an area with persistent localjob deficits. As in the 1964 research, we havesought to ‘place the household in the context oflocation . . . drawing on multiple data sources’(Wulff and Newton 1996 as cited above) so thatwe could move beyond a reliance on aggregateddata and reflect the personal experiences andaspirations of the people living in these formercoal towns. In 1998, focus group discussions wereheld with various community groups, includingretired miners’ associations, pre-school and schoolparents’ groups, a high school student council,Chambers of Commerce, an Aboriginal associa-tion and a multicultural group. Our evaluation ofthe issues raised confirmed our focus on locationaldisadvantage, and the surveyed locations wereselected on the criteria of high mobility, lowincome and high unemployment rates. Accord-ingly, specific census collection districts withinKurri, Weston, East Cessnock and West Cessnocktogether with the outlying villages of Paxton andMillfield were surveyed. The following analysisis based on the information gained from localresidents (both stayers and movers), supplementedwith our own personal observations, as well asfrom census data and other sources.
By some indicators, most noticeably thoserelating to population numbers, age compositionand housing, as well as in their urban landscapes,the former coal towns of Cessnock appear tohave done reasonably well — remarkably sofor the small, outer localities which appear tohave escaped the outcomes forecast in 1964. Incontrast to the total dereliction or demolitionof collieries, railways and related mining infra-structure, urban landscapes are well preserved andmodestly enhanced. Gravel roads and unkemptditches have been replaced by bitumen, kerbing
AGES_039.fm Page 304 Tuesday, September 10, 2002 11:04 AM
Locational Disadvantage and Household Locational Decisions 305
© Institute of Australian Geographers 2002
and guttering; dunnies (outhouses), henhouses andcoal heaps replaced by carports, garages and gardensheds; verandahs enclosed; and untended grassnow mown. Even the small, outer townships havea more cared-for appearance and levels of mainten-ance than recorded in the 1964 field notes, andwith little evidence of neglected or dilapidatedhousing which was common in the early sixties.
Housing and population
Quite strikingly, and contrary to all 1964 indicatorsthere has been a continuing steady investment innew housing. According to census data from 1966to 1996 the housing stock increased by 46.5 percent in Cessnock-Bellbird, 44.4 per cent in Kurri-Weston-Abermain and by 62 per cent in the vil-lages. A visit to the former coal towns revealsmodest construction activity over recent decades,although not to the extent suggested by the censusdata. As in Australia as a whole, however, resid-ential construction has been partly offset by a
sharp decline in average household size, from3.39 down to 2.52 persons per dwelling over thesame period. Population growth has neverthelesstaken place, although it has been spatially quiteconcentrated.
While the population of the Cessnock localgovernment area increased by 31 per cent overthe 30-year period 1966–1996, most of this growthhas been in accessible areas near Maitland andalong the northern transport corridor, as well asin the amenity-oriented vineyard and resort areaaround Pokolbin (Figure 1). The former coal townshave experienced modest growth, with Cessnock-Bellbird increasing by 11.5 per cent to 17 540persons, Kurri-Weston-Abermain by 7.1 per centto 12 555 and the six former colliery townshipsby 7.5 per cent to 2250. Of the townships, Neath,Kitchener, Abernethy and Paxton all declined,Millfield increased and Ellalong expanded by117 per cent, growing from 232 to 504 residents(see Box 1).
Box 1: The Emerging Transformation of Ellalong
Apart from the more accessible northern townships of Heddon Greta and East Greta, as well as Kurri and Weston whichhad already begun the suburbanisation transformation in 1964, Ellalong appears to be the only former coal townexperiencing a significant identity change. Perhaps the most convincing evidence is the transfer of Ellalong real estate intothe rural amenity housing market in the real estate agent’s window, but there are other indicators. Between 1986 and 1996Ellalong’s population increased by over 90 percent, growing from 264 to 504 persons in the census counts.
Table III shows that, in contrast to other outer townships, Ellalong is also experiencing an improvement in employmentand labour force status, to levels above those for the LGA overall. The township is attracting a high rate of buildingapprovals and its school is experiencing a rapid rise in enrolments, in contrast to the situation at neighbouring Paxton andMillfield. For example between 1959 and 1964 primary school enrolments at Ellalong averaged around 35. In 1985 thenumber of students at Ellalong Primary school remained at 34, yet by 1996 student enrolments had climbed to 124. Incontrast primary school enrolments for Paxton and Millfield in 1996 stood at 65 and 28 respectively.
Yet, in 1963, Ellalong appeared to be in terminal decline, showing every sign of becoming a deserted village, even moreso than Kitchener and Abernethy, the two other former colliery villages awarded the most pessimistic future scenario, withprospects even lower than Paxton and Millfield: see map in Holmes (1971, 785). In 1964 Ellalong presented a near-derelictappearance, with the hotel and shop showing signs of incipient abandonment, and with very scattered, dilapidated housing inan exceptionally remote setting along a bush road, which continued on to impoverished farmsteads in the Quorrobolong Valley.
Some of these perceived deficiencies in 1964 can now be regarded as attractions. The open dispersal of housing in awooded landscape, rarely found in other former coal towns, has helped Ellalong to discard its coal town image and assistedits residential transformation, with new houses readily built on available, partly serviced urban and rural residential lots.The township provides attractive views across the extensive Ellalong lagoon to the high, cliffed Myall range. Nearby ruralQuorrobolong has also undergone transformation. Both were formerly regarded as far too remote for habitation, other thanwhen tied to local employment, but this has been overturned, particularly by easy, direct road access through The Gap tothe Sydney-Newcastle freeway. Such changes could not readily be foreseen in 1964.
AGES_039.fm Page 305 Tuesday, September 10, 2002 11:04 AM

306 Australian Geographical Studies
© Institute of Australian Geographers 2002
Employment and welfare
Census data show a steady increase in employ-ment, growing by 33.2 per cent for the localgovernment area, but at lower rates in the formercoal towns, namely 17.8 per cent for the Cessnockand 9.4 per cent for the Kurri urban areas. In allcases employment growth exceeded populationgrowth. However, although detailed evidence onworkplace is not available, it would appear thatthe residents of the former coal towns must con-tinue to rely mainly on external commuting. Anindicative figure was obtained in our 1999 Cess-nock household survey where 42.6 per cent ofthe 129 workers recorded were engaged in externalcommuting. There is little evidence to suggest thatlocal jobs have increased since 1964. Indeed, thecomment from one respondent that he ‘moved hereknowing that it would be necessary to travel forwork’ (Kurri, 1999) reveals widespread acknow-ledgment of the severe local job deficit.
The strong dependence of Cessnock residentson external employment opportunities is not soreadily ascertained from census data (Table I).However, our household survey and focus groupdiscussions confirm that the economic restruc-turing of the mining industry in the Upper Hunterhas contributed to the decline of mining employ-ment for Cessnock’s workforce. Similarly, it isthe expansion of retail activity in Newcastle,Maitland and the Central Coast that has been animportant factor in increased retail employment.
In terms of local employment, new jobs pro-vided by the Cessnock gaol and Allandale AgedCare Facility and by the Capral (formerly Alcan)aluminium plant at Kurri fall well short of joblosses in local mining, and with the closure of localclothing factories. Local retailing remains poorlydeveloped, as are professional services, and in anycase, many professional and semi-professionalworkers prefer to live elsewhere, commuting dailyto Cessnock. Also, the expanding work oppor-tunities in the Pokolbin wine-growing and resortarea, though less than ten kilometres from Cess-nock, provide only limited, mainly casual, jobsfor small numbers of local residents. It appearsthat the former Cessnock coal towns have becomepermanently integrated into an expanded New-castle-Lower Hunter-Central Coast labour market,though still largely providing a relatively low-skill,marginalised workforce (Table II), further bur-dened by long journeys to work.
Concerning longer-term prospects for thedistrict, Holmes (1971, 790) commented:
Although very little external commuting is inlong-term equilibrium, it does not follow thatexternal commuting is a transient phenomenonof only passing interest. It will continue to bean important means of adjustment to spatialanomalies in job opportunities, and its import-ance may well increase as economic changesaccelerate and daily travel range increases. It
Table I Cessnock Local Government Area — employment of resident workforce in major industry categories 1966–1996.
Industry Number of workers % of Employed persons % change
1966 1986 1996 1966 1986 1996 1966–1986 1986–1996
Mining 2 326 2 876 1 876 19.7 20.0 11.9 +23.6 −34.7
Manufacturing 3 662 2 664 2 439 31.0 18.5 15.9 −27.3 −13.0
Retail 1 351 1 457 2 176 11.5 10.1 13.8 +27.5 +26.3
All other 4 456 7 393 9 617 37.8 51.4 58.3 +65.9 +24.0
TOTAL 11 795 14 390 15 712 100.0 100.0 100.0 +22.0 +9.8
Source: Census, 1966, 1986 and 1996.
AGES_039.fm Page 306 Tuesday, September 10, 2002 11:04 AM
Locational Disadvantage and Household Locational Decisions 307
© Institute of Australian Geographers 2002
will remain useful in delaying the write-off ofinvestment in established communities. It willease the problems of employment dislocationby transferring the redeployment burden to thecommuter, whose daily journey will link thedeclining source area and the more prosperousworkplace, and transfer enough of this prosperityback to the source area to sustain its residentialrole in the short term.
In retrospect, while near the mark, this commentfailed to recognise the durability of externalcommuting from Cessnock coal towns, foundedon increasing travel tolerance levels of the com-muters, aided by faster, uncongested roads andbetter vehicles. Indeed, the coping strategies ofexternal commuting by retrenched miners in the1960s are still considered essential:
I am very fortunate that my eldest son (17 years)has found an apprenticeship in the miningindustry at Singleton. I don’t know if my othertwo children will be as lucky, Cessnock is asmall place to be looking for work. But I’m atrue believer in the fact that if you really wantto work, then you will find a job. Even if itmeans travelling to that job. These values I
have tried to instil in my children (Cessnock,1999).
Long-distance commuting is further encouragedby cheap but satisfactory housing in the Cessnockarea, reinforced by the prohibitively high housingcosts in near-city or coastal locations, and sustainedby an enhanced perception of local stability andcontinuity, compared with the dislocations ofthe early 1960s. These positive perceptions wereconfirmed in focus group discussions and house-hold surveys:
Cessnock is supposed to have the highest rateof unemployment in New South Wales. Butthere is a job if you are willing to travel. Peopledon’t want to leave because it is the cheapestplace to get housing (Ellalong, 1998).
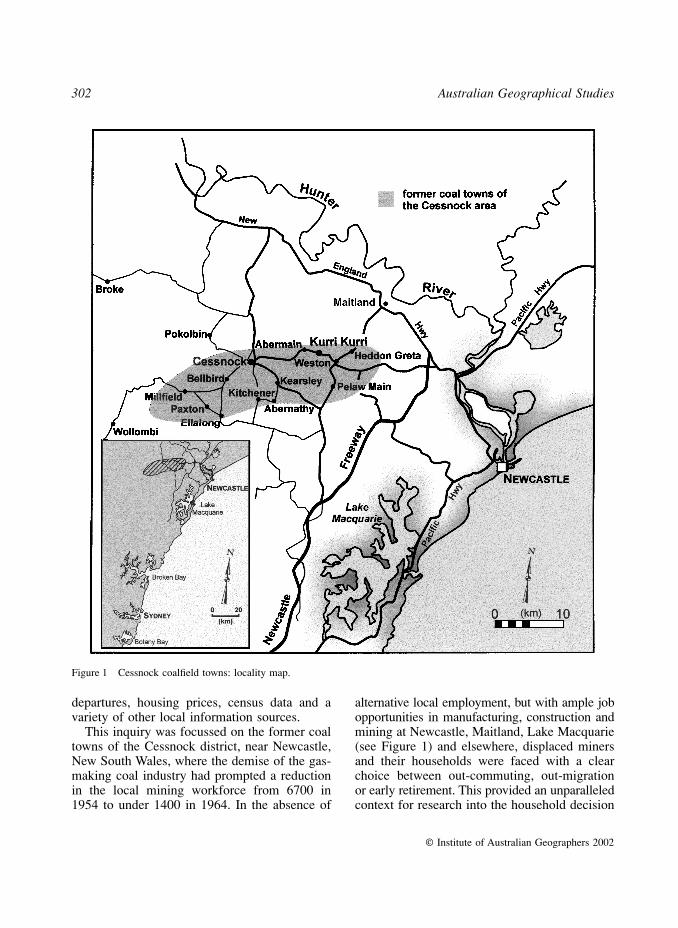
The continuing marginalised role of the Cess-nock workforce was demonstrated by all relevantindicators, including low occupational status, lowincome, low labour force participation and highunemployment. Table II reveals not only the lowoccupational status of the workforce, but also aconcentration in occupations in decreasing demand,with the continuing decline in manufacturing,mining and related activities in the Hunter Valley.
Table II Employment by occupation — Cessnock and New South Wales 1996.
Occupation NSW % Cessnock LGA % Cessnock as % NSW
Managers and administrators 9.2 4.7 51
Professionals 17.9 10.0 56
Associate professionals 11.1 9.2 83
Tradespersons & related workers 12.7 18.4 145
Adv. Clerical, sales and service 4.8 3.1 65
Inter. Clerical, sales and service 16.2 13.6 84
Inter. Production and transport 8.5 18.0 212
Elem. Clerical, sales and service 8.8 9.1 103
Labourers and related workers 8.2 11.6 141
Inadequately described/not stated 2.6 2.4 —
Source: Census 1996.
AGES_039.fm Page 307 Tuesday, September 10, 2002 11:04 AM
308 Australian Geographical Studies
© Institute of Australian Geographers 2002
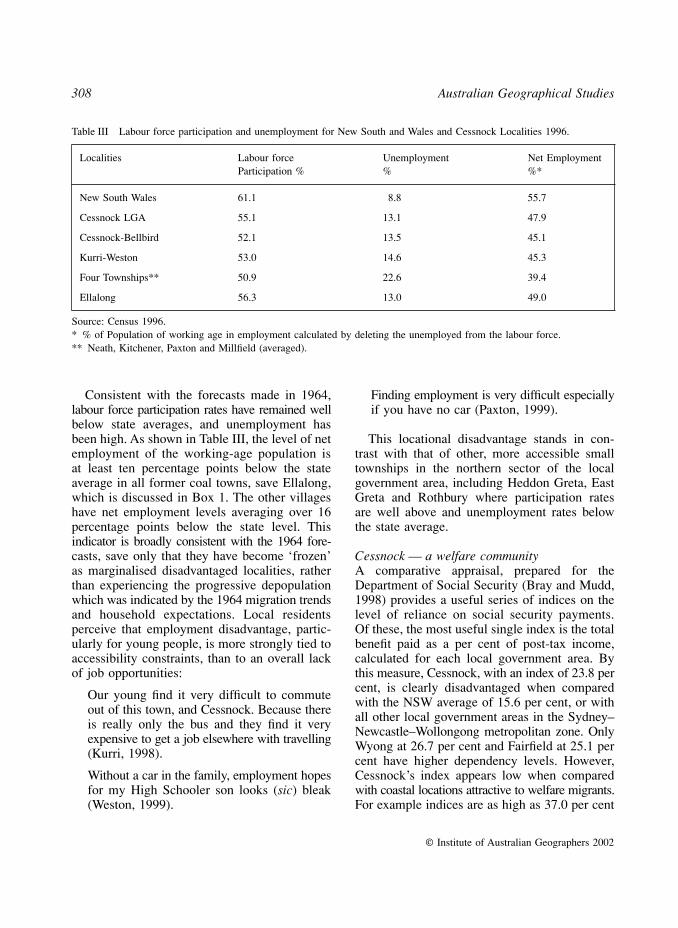
Consistent with the forecasts made in 1964,labour force participation rates have remained wellbelow state averages, and unemployment hasbeen high. As shown in Table III, the level of netemployment of the working-age population isat least ten percentage points below the stateaverage in all former coal towns, save Ellalong,which is discussed in Box 1. The other villageshave net employment levels averaging over 16percentage points below the state level. Thisindicator is broadly consistent with the 1964 fore-casts, save only that they have become ‘frozen’as marginalised disadvantaged localities, ratherthan experiencing the progressive depopulationwhich was indicated by the 1964 migration trendsand household expectations. Local residentsperceive that employment disadvantage, partic-ularly for young people, is more strongly tied toaccessibility constraints, than to an overall lackof job opportunities:
Our young find it very difficult to commuteout of this town, and Cessnock. Because thereis really only the bus and they find it veryexpensive to get a job elsewhere with travelling(Kurri, 1998).
Without a car in the family, employment hopesfor my High Schooler son looks (
sic
) bleak(Weston, 1999).
Finding employment is very difficult especiallyif you have no car (Paxton, 1999).
This locational disadvantage stands in con-trast with that of other, more accessible smalltownships in the northern sector of the localgovernment area, including Heddon Greta, EastGreta and Rothbury where participation ratesare well above and unemployment rates belowthe state average.
Cessnock — a welfare community
A comparative appraisal, prepared for theDepartment of Social Security (Bray and Mudd,1998) provides a useful series of indices on thelevel of reliance on social security payments.Of these, the most useful single index is the totalbenefit paid as a per cent of post-tax income,calculated for each local government area. Bythis measure, Cessnock, with an index of 23.8 percent, is clearly disadvantaged when comparedwith the NSW average of 15.6 per cent, or withall other local government areas in the Sydney–Newcastle–Wollongong metropolitan zone. OnlyWyong at 26.7 per cent and Fairfield at 25.1 percent have higher dependency levels. However,Cessnock’s index appears low when comparedwith coastal locations attractive to welfare migrants.For example indices are as high as 37.0 per cent
Table III Labour force participation and unemployment for New South and Wales and Cessnock Localities 1996.
Localities Labour force Participation %
Unemployment%
Net Employment%*
New South Wales 61.1 8.8 55.7
Cessnock LGA 55.1 13.1 47.9
Cessnock-Bellbird 52.1 13.5 45.1
Kurri-Weston 53.0 14.6 45.3
Four Townships** 50.9 22.6 39.4
Ellalong 56.3 13.0 49.0
Source: Census 1996.* % of Population of working age in employment calculated by deleting the unemployed from the labour force.** Neath, Kitchener, Paxton and Millfield (averaged).
AGES_039.fm Page 308 Tuesday, September 10, 2002 11:04 AM

Locational Disadvantage and Household Locational Decisions 309
© Institute of Australian Geographers 2002
for Nambucca, and nine other LGAs are over 30per cent (Bellingen, Byron, Eurobodalla, Taree,Kempsey, Kyogle, Richmond River and part ofTweed).
Also of note is Cessnock’s relatively low child-to-adult ratio for eligibility to receive additionalsocial security benefits. For NSW the averagepercentage eligibilities are 37.2 for children and29.4 for adults, whereas for Cessnock the ratio isreversed, at 39.9 and 41.4 per cent. This reversaloccurs in very few other LGAs with the excep-tion of towns with a settlement history similar toCessnock’s, including other former mining towns(Broken Hill and Lithgow), and long-establishedindustrial and working class areas includingNewcastle, Maitland, Lake Macquarie andWollongong.
It appears that, although Cessnock is attractingsome low-income households with eligible chil-dren, this modest influx is not sufficiently largeto outweigh the numbers of low-income earnerswho are ageing in place or returning on retirement.Also, Cessnock’s apparent locational disadvantagefor households with children is partly amelioratedby commuting to work outside the LGA, thus itis benefiting from an option which is less readilyavailable in the other coastal and inland shires,well removed from the central metropolitanzone.
Housing and social change
The essential complement to this continuedreliance on external commuting is the ongoingavailability of adequate affordable housing, identi-fied as a critical asset in 1964 and still the case somethirty years later, perhaps more so than ever withthe remarkable escalation in housing costs inSydney and adjacent coastal areas. In the Decem-ber quarter, 1998, the median sale price for theCessnock LGA was $87 000, compared withmedians of between $123 000 and $165 000 forother Newcastle, and lower Hunter LGAs. Thelowest median in the Sydney area was $112 000for Campbelltown. Yet, even this lowly Cessnockprice included a rise of 9.1 per cent over the twelvemonth period, while median N.S.W. prices declinedslightly. Given these low prices, Cessnock hasbeen able to maintain its longstanding traditionof home ownership, with 75.7 per cent of dwell-ings either owned or being purchased, comparedwith 65.0 per cent for New South Wales overall.Even in the outlying townships, with very highpopulation turnover, home ownership remainsvery high. Home ownership, combined with lowrentals, ensures that weekly housing costs, at$71.84, are well below the state average at $104.57(ABS, 1998). Table IV shows that house rentalsare well below the state average, most notably fordwellings with few bedrooms, for which there is
Table IV Median weekly rents for all dwellings: December quarter 1998.
MEDIAN RENTS A$
LGA One Bedroom Two Bedroom Three Bedroom Four Bedroom
Cessnock 85 115 140 180
4 Lower Hunter (a) 90–100 126–150 155–170 185–200
4 West Sydney (b) 115–120 140–155 175–210 210–240
NSW 165 185 190 240
Cessnock Index (c) 51.5 62.2 73.7 75.0
Source: NSW Department of Urban Affairs and Planning.(a) Newcastle, Maitland, Lake Macquarie and Port Stephens.(b) Blacktown, Campbelltown, Fairfield and Liverpool.(c) Cessnock rents as per cent of NSW average.
AGES_039.fm Page 309 Tuesday, September 10, 2002 11:04 AM

310 Australian Geographical Studies
© Institute of Australian Geographers 2002
relatively less demand among prospective renters,particularly when compared with the Sydneyrental market.
A lot of people are buying houses, doing themup and then renting them out (Ellalong, 1998).
With the policy change away from public housingtowards subsidised private rental housing, therehas been a steady boost to the Cessnock housingmarket. Attractive returns accrue to local investors,purchasing houses in the price range $40 000 to$80 000 for weekly subsidised rental returns of$120 to $180. The steady rise in house prices hasbeen influenced by the subsidy policy. Neverthe-less, according to real estate agents, the ceilingon coal town house prices remains at $80 000.Our focus group discussions confirmed that coaltown houses are extremely hard to sell above thisprice. In marked contrast, prices of $200 000 to$400 000 and more were being realised in theadjacent amenity-oriented rural settings, notablythe Pokolbin–Mount View winery area, as wellas rural lifestyle villages of Mulbring andQuorrobolong.
Even in the former coal towns, there are nowsome indications of emerging socio-economic dif-ferentials in residential status. Such differentiationhardly existed in the highly egalitarian coalminingera when households had near equal status, saveonly for a moderately better housing standard inWest Cessnock and small pockets of very poorhousing surviving as reminders of the bag humpiesof the Depression years. Even the public housingestate in East Cessnock was not markedly differ-entiated from other residential areas.
In recent years, this public housing estate hasincreasingly gained an unfortunate reputation.This reflects a nationwide trend, as such housingbecomes increasingly associated with providingfor the needs of the most severely disadvantagedhouseholds (Gregory and Hunter, 1995). Theconcentration of public housing, particularlyin East Cessnock situated away from shops andtransport routes reinforces the feeling of depri-vation by many of its residents. So strong wasthe negative image of this locality that manyrespondents felt a need to qualify that their
residence in this area was due to unfortunatecircumstances rather than by choice:
I needed to get a commission home after Iseparated because of my ill health and mydaughter’s disability (East Cessnock, 1999).
I had to leave a $1000 week job and move fromNarrabri to Cessnock to care for wife who hademphysema. We needed a Housing Commissionhome with disability facility (East Cessnock,1999).
I had to move to a house with laid-on waterand septic toilet as I have a son with bad lungs.He had chicken pox that went in and scarredhis lungs after his bone marrow transplant forleukemia in 1986 (East Cessnock, 1999).
I had to move here because of family andfinancial reasons (East Cessnock, 1999).
Although this public housing estate is located ina scenic bushland location, with larger gardensand homes of an appreciably higher standard thanother public housing in the Cessnock area, levelsof satisfaction with the neighbourhood were low.Many householders in East Cessnock deliber-ately isolated themselves from their neighboursand some prevented their children from socialisingwith other children on the estate. Our study alsoindicated that residents were particularly frustratedwith the petty vandalism that included teenageviolence, setting fires to garbage bins and thedestruction of public telephones. Yet, many alsoexpressed concerns over the feeling of hopeless-ness experienced by young people within theirlocality:
The job situation for the young is scary (EastCessnock, 1999).
Young kids; there is nothing here for them.No employment opportunities for them (EastCessnock, 1999).
The neighbourhood is full of drugs, violenceand idle young ones (East Cessnock, 1999).
At the other end of the spectrum is the mod-est development of better quality housing on
AGES_039.fm Page 310 Tuesday, September 10, 2002 11:04 AM

Locational Disadvantage and Household Locational Decisions 311
© Institute of Australian Geographers 2002
wooded, slightly elevated locations on the fringesof Abermain, Bellbird Heights, West Cessnockand Nulkaba.
Mobility and migration flows
In the late 1990s, no less than in 1964, the futureprospects of the Cessnock towns, in their pre-dominantly residential role, remain tied to theresidential decisions of households, both thosein residence and those considering in-migration.As was done in the 1964 survey, we have inquiredinto current trends in residential mobility includingthe motivations, expectations and perceptions ofresident householders. While the latter informa-tion has been derived from household surveys,further insights into mobility have been obtainedfrom the comprehensive data available from the1996 census.
The census shows that the population residentin 1996 had experienced very low mobility overthe previous five year period, with only 15.5 percent living outside the LGA five years previously,compared with 26.7 per cent for New SouthWales as a whole. However, this low index failsto take account of out-migration. Also there is ahigh level of residential relocation within theLGA, at 18.0 per cent, compared with 15.6 percent for New South Wales. This local movementis facilitated by the multiplicity of urban centreswithin the LGA. Certainly, our household surveyindicated that movement between the variouscoalfield towns was common, particularly whenpurchasing homes:
We moved here from Abermain to buy ourown home. We had been renting before (WestCessnock, 1999).
We were renting a house that belonged to hisparents at Paxton . . . then we got our ownhome for an absolute steal. It was just a bar-gain (Cessnock, 1998).
The limited evidence available suggests that thereis a continuation of the 1964 pattern of movementfrom the outer townships into Cessnock. Paxtonand Millfield in particular, with low rental costs,appear to act as staging points for welfare migrants,
some of whom are seeking to make a further moveinto Cessnock. Partly associated with limitedaccessibility to employment opportunities thesetwo townships also have high levels of unem-ployment (see Table III). Their levels of residen-tial relocation are above the State average, incontrast to Kurri-Weston at 10 percentage pointsand Cessnock at 8 percentage points below theState average. As explained by a spokespersonin the NSW Department of Housing, approxim-ately ninety per cent of the names on the longwaiting list for Cessnock public housing areliving locally, mainly in smaller townships inthe district (pers com., Maitland, 5.3.1999).
Local residential relocation is a minor elementwithin the main streams of internal migration. Themain migration components for the Cessnockdistrict are seen in Table V and Figures 3–6.Table V shows that most in-migration is short-distance. Of the 5802 arrivals, 4490 or 77.4 percent were from the adjacent Sydney-Newcastle-Hunter area. Of the 6849 departures, 4550 or 66.4per cent were to the same group of destinations,indicating an overall balance in local populationexchanges, but with a notable net loss to moredistant destinations. These movements suggestthat Cessnock’s residential future is closely tied
Table V Internal migration by origin and destination —Cessnock 1991–1996.
Arrivals Departures Net Migration
Lake Macquarie 906 741 165
Maitland 824 965 −141
Newcastle 560 682 −122
Other Hunter 712 1009 −297
Sydney 1488 1153 335
Other NSW 784 1240 −456
Elsewhere in Australia
528 1059 −531
TOTAL 5802 6849 −1047
Source: 1996 Census.
AGES_039.fm Page 311 Tuesday, September 10, 2002 11:04 AM
312 Australian Geographical Studies
© Institute of Australian Geographers 2002
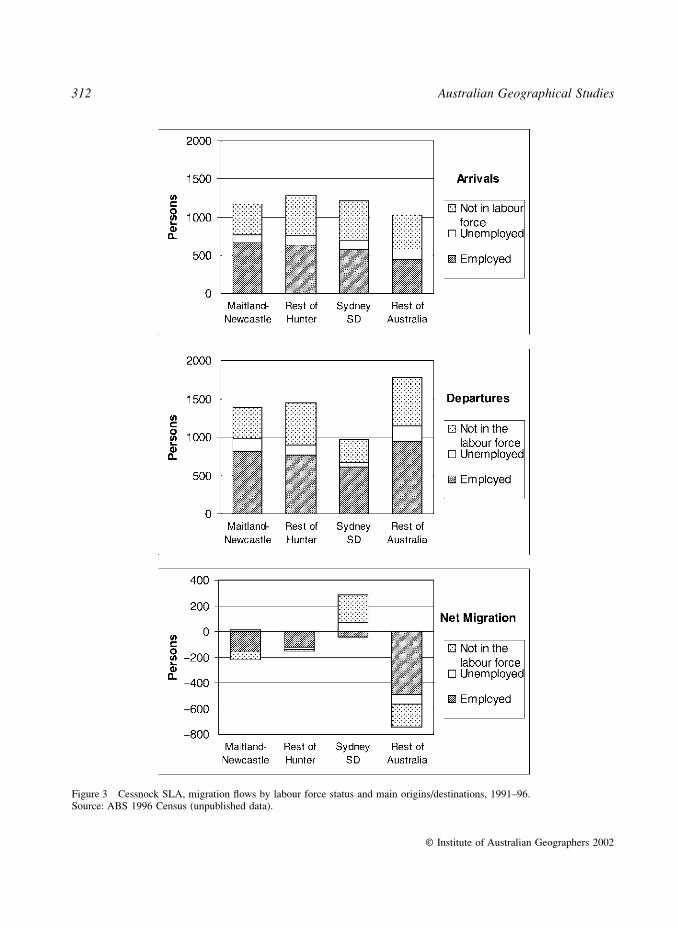
Figure 3 Cessnock SLA, migration flows by labour force status and main origins/destinations, 1991–96. Source: ABS 1996 Census (unpublished data).
AGES_039.fm Page 312 Tuesday, September 10, 2002 11:04 AM

Locational Disadvantage and Household Locational Decisions 313
© Institute of Australian Geographers 2002
Figure 4 Cessnock SLA, migration flows by weekly personal income and main origins/destinations, 1991–96. Source: ABS 1996 Census (unpublished data).
AGES_039.fm Page 313 Tuesday, September 10, 2002 11:04 AM

314 Australian Geographical Studies
© Institute of Australian Geographers 2002
Figure 5 Cessnock SLA, migration flows, households by housing tenure and main origins/destinations, 1991–96. Source: ABS 1996 Census (unpublished data).
AGES_039.fm Page 314 Tuesday, September 10, 2002 11:04 AM

Locational Disadvantage and Household Locational Decisions 315
© Institute of Australian Geographers 2002
Figure 6 Cessnock SLA, migration flows, households by family/household type and main origins/destinations, 1991–96. Source: ABS 1996 Census (unpublished data).
AGES_039.fm Page 315 Tuesday, September 10, 2002 11:04 AM

316 Australian Geographical Studies
© Institute of Australian Geographers 2002
to trends in the labour and housing markets inthe Sydney-Newcastle-Hunter areas, and also togovernment welfare policies:
I was offered a Housing Commission house withlower rent and the house was in better condi-tion than the one I was living in at Argenton[Newcastle] (Weston, 1999).
I wanted to get away from the Sydney envir-onment and I had relatives in the area. Camefrom a four bedroom Housing Commission toa smaller Housing Commission, but I like theenvironment here (West Cessnock, 1999).
In this locally-oriented ‘system’ of residentialrelocation, the most striking change is the emer-gence of a strong link to Sydney, most notably in-migration from Sydney to the Cessnock district.Apart from Lake Macquarie, Sydney is the onlysource of net in-migration. This is in markedcontrast to 1964. Comparable data were notcollected at the Census prior to 1976 but the 1964schools survey provided an estimate of 9.9 percent of in-migrants from Sydney, compared with26.9 per cent of immigrant households withchildren in the 1996 census records.
To a greater extent than for arrivals from othersources, those from Sydney can be characterisedas ‘welfare migrants’, as suggested by the fol-lowing indicators, with those from other sourcesshown in brackets. Sydney migrants have lowerlabour force participation at 42.9 (39.9) per centnot in the workforce and with 59.5 (55.7) per centhaving incomes below $300 per week. However,along with other local arrivals from Newcastle-Maitland and Other Hunter, 59.7 (56.6) per centare engaged in owning or purchasing a house.
Further research reveals a very distinctive agestructure and household composition for arrivalsfrom Sydney. Almost half of the households arriv-ing from Sydney, namely 49.3 per cent, comprisecouples without children or lone persons, comparedwith 40.3 per cent from elsewhere. Only 32.2 (40.0)per cent comprise couples with children, yieldinga household size of only 2.43 (2.71) persons. Cess-nock appears to be avoided not only by younghouseholds with children but also by the 15–24
year age group with ‘welfare refugees’ from Sydneyin these categories presumably migrating to moreattractive northern coastal destinations.
An outcome is that Sydney supplied relativelyhigh proportions of both the 35–54 and 55–64year age groups. Cheap housing in reasonablywell-serviced locations, not too far from Sydney,appears to be the prime attraction.
There were very marked imbalances in thecomposition of movements from and to Sydney,with these being clearly revealed in the netexchanges shown in Figures 3–6. The net outcomewas that Cessnock experiences heavy losses toSydney of persons aged 15–24, but substantialgains in all other age groups. It lost a small numberof employed persons and gained many not in theworkforce. Among low-income earners (under$300 per week) it lost 311 persons to other des-tinations, but gained 265 from Sydney. Perhapssurprisingly, it also made a small net gain of personsearning over $1000, but presumably this net in-migration was directed to high amenity locationsoutside of the former coal towns. These movementsclearly indicate that the former coal towns aredistinctive ‘niche’ destinations for one segmentof the predominantly low income householdsmigrating from Sydney to NSW coastal regions,documented in more detail by Wulff and Bell(1998) and identified earlier by Burnley (1988).
The volume and composition of exchangeswith Newcastle and Maitland have continued aspredicted in 1964. Most notable is the high rateof entry of the 25–34 age group from these twosources. For these two origins, 25–34 years isthe modal age for arrivals, compared with 35–54 years for all other origins. Also, together withthe 65+ years age group, 25–34 is the only agegroup for which Cessnock makes net gains fromNewcastle-Maitland.
Analysis of the data used in compilingFigures 3–6 reveals the following differentialsin arrivals from Newcastle-Maitland as comparedwith all other arrivals, with others shown in brackets,per cent employed: 57.0 (46.5); per cent withweekly income over $300: 50.6 (41.0); per centowning or purchasing house: 65.2 (55.0); and percent of couples with children: 41.4 (36.7).
AGES_039.fm Page 316 Tuesday, September 10, 2002 11:04 AM

Locational Disadvantage and Household Locational Decisions 317
© Institute of Australian Geographers 2002
These figures indicate a continuation of the‘suburbanisation’ trend, described by Holmes(1965), comprising mainly young families seekingcheap housing and with primary income earnersprepared to commute to their existing workplace.Figure 6 shows that Newcastle-Maitland, alongwith Sydney, is the only net source of coupleswith children to the Cessnock district. Communitymeetings held in the Cessnock district providedconfirmation of this modest entry of young fam-ilies, tied to Newcastle-Maitland workplaces. Asin 1964, Kurri-Weston is the preferred locationfor these incoming commuters:
I moved here because my partner was preg-nant and we wanted to purchase a home. Kurrihas cheap housing, nice place to raise a familyand it’s an easy ride to work at Boolaroo[Newcastle] (Kurri, 1999).
We wanted to buy a home. My sister had movedhere and its much cheaper here than Wyong[Central Coast] (Kurri, 1999).
We left Newcastle because land prices were somuch cheaper up here. We could never have builtthe kind of house we have now anywhere elseand I can still get to work easily in Newcastle(Weston, 1999).
Although there is a proportionately large popu-lation exchange with Newcastle-Maitland, thenet outcomes are only modest, most notably asubstantial net loss of the 15–24 years age group,partially balanced by a modest gain in 25–34 yearolds. This also involves net gains in low-incomeearners (but with less impact than from othersources), in home ownership, and in couples withchildren, with these being the only household typeexperiencing net in-movement.
Population exchanges to the rest of Australiaare very one-sided, with 175 departures for every100 arrivals, and with a net loss of 987 out of thetotal net loss of 1047. Queensland looms large,attracting 755 departures, but only 290 arrivals,giving Cessnock a net loss of 465 to that State.The most significant outcomes are the loss ofcouples with children and of persons in employ-ment, but a near balanced movement of lone
parents. There is also a notably higher propor-tionate movement of persons with low incomes,both in-migrants and out-migrants, with arelatively low level of home ownership amongin-migrants.
Household motivations and levels of satisfaction
Consistent with Wulff and Newton’s (1996) sug-gested research priority, stated earlier, we havesupplemented the migration analysis with a focussedquestionnaire survey of 164 households, including24 in Kurri, 26 in Weston, 67 in Cessnock and37 in Paxton and Millfield. The sampled house-holds were selected using a systematic locationsampling method selecting every 5th dwellingalong a predetermined route, within selectedcensus collection districts with low incomes, highunemployment and high mobility. Our concernwas to examine the decisions, motivations andperceptions of low income movers, rather thanto seek a representative sample of the district’shouseholds. However, all households selected wereinterviewed to enable comparisons to be madebetween long term residents and newcomers.The final sample comprised 116 long-termersand 48 newcomers, with 100 living in the samedwelling five years previously and 64 livingelsewhere. Interestingly, on all attributes, describedbelow, chi square tests consistently showed nosignificant differences in the responses of any ofthese groups.
Persons interviewed were invited to respondto a series of Likert-scaled questions on: the relativeimportance of issues influencing their decisionto move from their last address (Table VI); acomparison of their present with their previouslocation (Table VII); and their present level ofsatisfaction with their dwelling, neighbourhood,access to services and to job opportunities(Table VIII).
Responses consistently showed the pivotalimportance of housing as the prime attraction forboth movers and stayers. This is most clearlyrevealed in the diagnostic question on the relat-ive importance of selected issues in influencingthe decision to move (Table VI). Of the five issues
AGES_039.fm Page 317 Tuesday, September 10, 2002 11:04 AM

318 Australian Geographical Studies
© Institute of Australian Geographers 2002
which were clearly most influential, four were tiedto housing. In order of importance, these were:the desire for home ownership, for a larger house,for lower housing costs and for a better qualityhouse (Table VI).
In Tables VII and VIII, only two housingattributes were listed for appraisal, with thesetwo clearly outranking all others in any favourablecomparisons with previous place of residence(Table VII), and being outranked only by contactswith friends and relatives in score on level ofsatisfaction with present location (Table VIII).
As was the case in 1964, the availability of cheaphousing, of reasonable standard, in adequatelyserviced communities continues to be the primeasset in retaining stayers and attracting movers.
‘Wanted better place to raise a family’ was theonly other top ranking influence on the decisionto move, listed in Table VI. Unfortunately thisissue was not listed in the other two sets of ques-tions but its importance can readily be impliedfrom the overall response patterns. Of comparableimportance was the level of satisfaction concerningcontacts with friends and family (Table VII),
Table VI Cessnock 1999 household survey — ranking of importance scores on issues affecting the decision to move.
Issue
Response Frequencies Index of Importance*Not important Important Very Important
Wanted to purchase house 53 6 57 2.02
Wanted better place to raise family 53 25 40 1.89
Wanted larger house 52 27 39 1.89
Wanted lower housing costs 59 27 46 1.89
Wanted better quality house 55 25 38 1.86
To be closer to family or friends 72 17 29 1.64
Had to move (eg. lease ended) 78 10 30 1.59
Wanted to live closer to town services 76 27 15 1.50
To be closer to work 83 16 19 1.46
Dissatisfied with previous house 84 19 15 1.42
Married, divorced, separated or widowed 81 7 20 1.40
Dissatisfied with previous neighbourhood 88 16 14 1.37
Independence (eg. leaving family home) 97 2 19 1.33
To take up employment in Cessnock area 99 6 13 1.27
Other family or personal reasons 99 6 13 1.27
To find employment 103 5 10 1.21
Retirement 108 4 6 1.14
Wanted smaller house 110 6 2 1.08
Source: 1999 Household survey.* Obtained by awarding a score of 3 for ‘very important’, 2 for ‘important’ and 1 for ‘not important’ or no response, and then calculating the mean score.
AGES_039.fm Page 318 Tuesday, September 10, 2002 11:04 AM

Locational Disadvantage and Household Locational Decisions 319
© Institute of Australian Geographers 2002
although this ranked only sixth in its influenceon decision to move, well below the top five issues.
Tracking through Table VI reveals the custom-ary diverse array of reasons which can affecthousehold location decisions. Reasons includedissatisfaction with previous house and neigh-bourhood, a desire for better services or a morerural setting, a change in family or householdstatus, as well as the inevitable small number ofmoves tied to job relocation. Surprisingly, therewere only ten cases where the move was tied toretirement.
When invited to compare their present with theirprevious place of residence, a majority responded
‘about the same’ on all items, save only on housingsuitability and quality, housing costs and qualityof neighbourhood. On housing suitability andquality, a clear majority indicated better outcomes,while a near majority did so on housing costs.However, on ‘quality of the neighbourhood’,markedly divergent responses were provided, with‘better’ responses marginally exceeding ‘worse’.On all other attributes, a majority was unpreparedto differentiate, this being most noticeably so withaccess to health, education and training services.Where some differentiation did occur, there wasa generally favourable outcome for contacts withlongstanding friends and relatives, but an adverse
Table VII Cessnock 1999 household survey — ranking of scores of satisfaction with present residential location comparedwith previous location.
Issue
Response FrequenciesIndex of Satisfaction*Better
About the same Worse
Suitability and quality of house 79 45 13 2.48
Housing costs 60 50 19 2.32
Contact with friends and relatives 33 88 14 2.14
Access to basic daily needs 37 74 23 2.10
Quality of neighbourhood 43 54 38 2.04
Quality of basic daily needs 30 81 24 2.04
Quality of education and training facilities 15 74 11 2.04
Access to social security and employment advisory services
12 78 9 2.03
Ease of making friends in neighbourhood 31 77 28 2.02
Access to health, medical and related services 21 93 18 2.02
Quality of health, medical and related services 15 104 14 2.01
Involvement in community activities and sport 21 88 19 2.01
Access to education and training facilities 14 72 15 1.99
Local job prospects 4 72 26 1.78
Source: 1999 Household survey.* Obtained by awarding a score of 3 for ‘better’, 2 for ‘about the same’ and 1 for ‘worse’ and then calculating the mean score.Note: Total response frequencies to each question vary from 137 to 99. Non responses to questions are considered not relevant.
AGES_039.fm Page 319 Tuesday, September 10, 2002 11:04 AM

320 Australian Geographical Studies
© Institute of Australian Geographers 2002
outcome for local job prospects. Nevertheless,concerning job prospects, 71 per cent of respond-ents considered that these were no different thanat their previous place of residence.
The statements presented in Table VIII enabledrespondents to indicate levels of satisfaction withtheir present residential situation. Surprisingly highlevels of satisfaction are indicated, not only forhousing and for contacts with relatives and friendsbut also, if to a lesser extent, with the quality andaccessibility of all basic daily needs, services
and community activities. Friends and kinshipties were particularly important along with theperception that the Cessnock region provided a‘friendly place’ to live. Despite complaints overthe downgrading of the Cessnock hospital andthe shortage of doctors who ‘bulk-bill’, even thelowest ranking measure on services, namely accessto health, medical and related services, still man-ages to score a slightly positive rating. Only oneissue scored a negative rating, and this was verymarkedly so. As expected, dissatisfaction with local
Table VIII Cessnock 1999 household survey — ranking of scores on level of satisfaction with present location.
Issue
Response FrequenciesIndex of satisfaction*
Not satisfied
Moderatelysatisfied
Very satisfied
Contact with friends and relatives 9 49 101 2.58
Cost of housing 5 68 84 2.50
Quality of housing 7 73 80 2.46
Quality of basic daily needs 19 64 69 2.39
Access to basic daily needs 21 70 71 2.31
Quality of health, medical and related services
22 76 64 2.26
Involvement in community activities and sport
17 62 51 2.26
Friendliness of the neighbourhood 23 76 63 2.25
Education and training facilities 18 53 45 2.23
Access to education and training 16 59 42 2.22
Access to social security and employment advisory services
24 56 28 2.22
Neighbourhood generally 28 71 61 2.21
Access to health, medical and related services
40 58 62 2.14
Local job prospects 78 19 11 1.38
Source: 1999 Household survey.* Obtained by awarding a score of 3 for ‘very satisfied’, 2 for ‘moderately satisfied’ and 1 for’ not satisfied’ and then calculating the mean score.Note: Total response frequencies to each question vary from 162 to 108. Non responses to questions are considered not relevant.
AGES_039.fm Page 320 Tuesday, September 10, 2002 11:04 AM

Locational Disadvantage and Household Locational Decisions 321
© Institute of Australian Geographers 2002
job prospects was experienced by 72 per cent ofrespondents.
Questionnaire responses identified a mix ofbenefits and costs for both stayers and movers, withthe benefits outweighing the costs for householdsnot involved in the workforce and, presumably forhouseholds whose workers are securely employed,particularly in local jobs. The costs are borne mostheavily and directly by those seeking employ-ment, and most disturbingly, by young peopleseeking to enter the workforce. In turn these havenegative outcomes for their households andfor neighbourhoods affected by a cycle of anti-social behaviour. So far, Cessnock’s former coaltowns have not been severely impacted by socialdislocation, save only in isolated locales, associ-ated with public housing.
Conclusion
Compared with expectations in 1964, the formercoal towns have acquired a more substantial andsecure residential role, even embracing the outertownships which previously appeared destinedto further decline and dereliction. This stabilityhas been secured by these localities occupying adistinctive niche within the larger population–housing–work–welfare metropolitan agglom-eration focussed on Sydney and Newcastle.Functional ties to Newcastle and Maitlandcontinue to be based primarily on commuting,strengthened by easier, cheaper car travel and byescalating housing costs in more favoured coastallocations. As predicted in 1964, house price dif-ferentials continue to inhibit out-migration ofresident commuters, while also attracting a smallinflux of young families from Newcastle andMaitland, with the primary income earner engagedin return commuting.
Increasingly important are newfound functionalties to Sydney. Contrary to any realistic predic-tions in 1964, Sydney had become the only majornet supplier of people to the former coal towns.While this connection with Sydney is importantin maintaining population numbers and the localmarket for housing and other services, it may alsoincrease overall levels of welfare dependency,further accentuating existing levels of locational
disadvantage and contributing to the trend towardssocial and economic polarisation described in theintroduction, and documented in recent analysesof welfare-led migration, notably Hugo and Bell(1998) and Wulff and Bell (1998).
Locational disadvantage has commonly beenexamined through analysis of statistical data. Suchanalysis tends to frame the resident as a passivevictim caught within a poverty trap. Statistical datafor the former Cessnock coal towns conform wellto those indicating locational disadvantage: highunemployment, high welfare dependency andlow house values. However, the picture is morecomplex than is suggested by the statistics. Formany long-term residents and for some newcomersthere are very substantial locational advantages.These residents are making economically andsocially rational decisions, with favourable out-comes on both housing and community/neigh-bourhood attributes, offering high levels ofsatisfaction for many residents on relatively lowincomes. However, for others, particularly foryounger people seeking training and employment,locational disadvantage remains an entrenchedbarrier to the realisation of life chances.
The aggregate picture that emerges for Cess-nock, then, is one of sustained locational disad-vantage over the three decades covered in thisstudy. But this conceals a marked shift in theprocesses underlying local economic fortunes,with gains of welfare-dependent migrants, drivenby global economic restructuring, sustaining popu-lation numbers in many formerly marginal towns.This outcome almost certainly reflects Cessnock’sposition within the expanded embrace of Sydney’smetropolitan region and may not be mirrored inother centres, more distant from urban influence.For Cessnock and similar towns, however, theoutcome is a paradox, whereby the inwards migra-tion of urban refugees sustains population growthwithout economic revival, thereby trapping exist-ing residents, especially the young, in a climateof continued marginalisation. A choice that iseconomically rational for one group contributes toan economic trap for another. In the contemporaryclimate of economic rationalism, coupled withpolicies that seek to drive welfare beneficiaries to
AGES_039.fm Page 321 Tuesday, September 10, 2002 11:04 AM
322 Australian Geographical Studies
© Institute of Australian Geographers 2002
areas of job-growth rather than decline, the para-dox of towns like Cessnock presents a disarmingchallenge.
Correspondence
: Emeritus Professor John Holmes, Depart-ment of Geographical Sciences and Planning, University ofQueensland, St Lucia, Queensland 4072, Australia. Email:[email protected]
ACKNOWLEDGMENTSOur thanks are extended to the many residents, council andbusiness people across the Cessnock City Council regionwho participated in group discussions. Thanks are also due toStephen Dick for his cartographic assistance and to ChristineTandy, Patricia Blair, Judy Thomas and Louise Ormerod fortheir assistance in conducting the household surveys.
REFERENCESABS, 1998:
Regional Profile: Cessnock Local GovernmentArea
. Australian Bureau of Statistics, Canberra.Birrell, B., 2000: Residential relocation in Sydney and the
NSW coast over the period 1991–1996.
People and Place
,7, 33–43.
Bray, J.R. and Mudd, W., 1998:
The Contribution of D.S.S.Payments to Regional Income
, Department of SocialSecurity, Technical Series No.2, Canberra.
Burnley, I., 1988: Population turnaround and the peopling ofthe countryside? Migration from Sydney to country districtsof New South Wales.
Australian Geographer
19, 268–282.Gregory, R.G. and Hunter, B., 1995: Further remarks on
increased neighbourhood inequality.
Social SecurityJournal
, 20–28.Hartig, K. and Holmes, J.H., 2000: Whatever happened to
coaltown? In McManus, P., O’Neil, P. and Loughran, R.(eds.)
Journeys — The making of the Hunter Region
,Allen and Unwin, Sydney, 186–206.
Holmes, J.H., 1965: The suburbanization of Cessnock coal-field towns: 1954–1964.
Australian Geographical Studies
3, 105–128.Holmes, J.H., 1971: External commuting as a prelude to
suburbanization.
Annals. Assoc. American Geographers
,61, 774–790.
Hunter, B., 1995: Is there an Australian underclass? Explaining
changes in the social structure of employment.
UrbanFutures
18, 14–21.Hugo, G. and Bell, M., 1998: The hypothesis of welfare-led
migration to rural areas: The Australian case. In Boyle, P.and Halfacree, K. (eds),
Migration into Rural Areas: The-ories and Issues
, Wiley, Chichester, 107–133.Maher, C., Whitelaw, J., McAllister, A., Frances, R., Palmer, J.,
Chee, E. and Taylor, P., 1992:
Mobility and LocationalDisadvantage within Australian Cities: Social JusticeImplications of Household Relocation
, Report 2. SocialJustice Research Program into Locational Disadvantage,Department of Prime Minister and Cabinet and Bureau ofImmigration Research, Australian Government PublishingService, Canberra.
Maher, C., 1993: Household mobility and locational dis-advantage, key findings of research into the implication ofresidential mobility within Australian cities.
Urban Futures
,3, 10–16.
Murphy, P. and Watson, S., 1994: Social polarization andAustralian cities.
International Journal of Urban andRegional Research
, 18, 573–590.Newton, P.W. and Bell, M. (eds), 1996:
Population Shift —Mobility and Change in Australia
. Australian GovernmentPublishing Service, Canberra.
O’Connor, K. and Stimson, R., 1996: Convergence and diver-gence of demographic and economic trends. In Newton,P.W. and Bell M. (eds),
Population Shift: Mobility andChange in Australia
. Australian Government PublishingService, Canberra, 108–125.
Raskall, P., 1995: Who gets what where? Spatial inequalitybetween and within Australian cities. Paper prepared forCommonwealth Department of Housing and RegionalDevelopment, Seminar Spatial Inequality, Canberra.
Vinson, T., 1999:
Unequal in life, the distribution of socialdisadvantage in Victoria and New South Wales
. JesuitSocial Services, Melbourne.
Wulff, M. and Bell, M., 1998:
Internal Migration, SocialWelfare and Settlement Patterns: Impacts on Householdsand Communities
. Department of Immigration and Multi-cultural Affairs, Canberra.
Wulff, M. and Newton, P., 1996: Mobility and social justice.In Newton, P.W. and Bell M. (eds),
Population Shift —Mobility and Change in Australia
. Australian GovernmentPublishing Service, Canberra, 426–443.
AGES_039.fm Page 322 Tuesday, September 10, 2002 11:04 AM