Embed Size (px)
Citation preview
E l i X ~ ~ l y s i S , 4 (1992) 33-40
Blank Response at Glassy Carbon Electrodes in a Flow Injection System
Yan Xu, H Brian Halsall, and William R Heinman2 Dqbament of C b & t r y , Univmig of Cincinnati, Cincinnati, Ohio 45221-01 72, U S A Received August 2, 1991.
ABSTRACT The blank response at glassy carbon electrodes in a flow injection system consists of a transient compo- nent and a steady state (residual current) component. The transient response is attributed to nonfaradaic current and faradaic current from the oxidation-reduction of electroactive surface func- tional groups on glassy carbon. The magnitude of the transient response was dependent on the poten- tial applied to the electrode, temperature, ionic strength and pH of the injected sample solution, and independent of the flow rate. A linear relationship exists between the transient response and the differ- ence in concentration of ionic species or pH between injected sample and the carrier. A difference of 0.01 M ionic concentration or 0.04 pH unit between carrier and injected sample could change the transient charge by ca. 0.038 1LC/cm2. The shape of the transient response due to pH difference at high positive potential indicates that some changes occur on glassy carbon surface in this potential region.
KEY WORDS Flow injection analysis, amperometric detection, glassy carbon electrode.
IATRODUCTION
A phenomenon, here called the blank response, is often encountered in liquid chromatography and flow injection analysis with electrochemical detectors (LCEC and FIAEC). When the injected sample matrix does not match the carrier matrix, the detector response may be affected and a blank response peak may be recorded. The blank re- sponse has been described [l-31 as a static charging or discharging process at the electrode surface caused by the unmatched matrices of sample and carrier fluid. In chro- matography, the blank response is usually not a problem since the electroacrive species of interest elute at a differ- ent retention time. However, in flow injection analysis, the presence of a blank response may mask the presence of the analyte peak. Because the detection limit of FIAEC is com- monly defined as the mean of the blank response plus two times the standard deviation of the blank response, knowl- edge of the magnitude of the blank response is, therefore, essential in defining the limit of detection of an analytical method that is based on FIAEC. Nevertheless, no system- atic investigation of this phenomenon has been reported. In this article, the major component of the blank response, the transient response, at glassy carbon is investigated as a
In memory of Professor G. Patriarche. 'Present address: Department of Chemistry, Cleveland State University, Euclid Avenue at East 24th Street, Cleveland, Ohio 44115. 'To whom correspondence should be addressed.
function of the ionic strength and pH of the injected sample, applied potential of the working electrode, flow rate of the carrier, temperature, and size of sample loop. Glassy carbon was chosen as the working electrode be- cause of its extensive use in LCEC and FIAEC.
EXPERIMENTAL Cbem icals NaCI, KCI, Na,HP04 (Certified ACS), CH,COONa (HPLC grade) and alumina (dry powder, type B, particle size <0.1 pm) were obtained from Fisher Scientific. &Fe(CN), (Cer- tified ACS) was obtained from MUB. All solutions were prepared with water (resistivity > 17 megohrdcm) from a Barnstead NANOpure'" and ORGANICpure" system (Boston, MA) and pH adjusted with 1 M NaOH or 1 M HCI.
Cleaning of Glassware All glassware was cleaned by soaking first in laboratory detergent, Alconox (Fisher Scientific), later in HNOfiCI mixed acids, and then thoroughly rinsing with the purified water. Glassware was dried in an oven at 200°C.
Flow Injection System
A BAS 400 LCEC system without a separation column (Bioanalytical Systems, West Lafayette, IN) was used. It consisted of an HPLC pump (BAS, PM-48), an amperomet- ric detector (BAS, LC-4B), an amperometric thin-layer cell
1040-03971 9243.50 + .25 33 6 1992 VCH Publishers,lnc.

34 Xu et a1
I
(BAS, GC-4), and a temperature controller (BAS, LC-22A). The sample loops were 5,10,20,100,200, and 2000 p1. The noise filter of the amperometric detector was set at 1.0 Hz, which corresponds to a signal rise time of 0.35 s. Data were collected by a Fisher ReCOrddll@ series 5000 chart re- corder with a response time of less than 0.33 s to within +- 1% of full scale.
,
Thin-layer Cell and Electrodes The amperometric thin-layer cell had aAg/AgC1(3 M NaCI) reference electrode (BAS, MF-2021), a stainless steel auxil- iary electrode, dual glassy carbon working electrodes (BAS, MF-1000) in the parallel mode, and a Teflon gasket (BAS, MF-1046) that gave a volume of ca. 2pl. The stainless steel inlet tubing was 30 cm in length with an inside diameter of 0.25 mm. The working electrodes had surface areas of 0.1460 cm2, as measured by chronocoulometry on the system of 1 mM &Fe(CN)6 in 0.1 M KCI. Thevalues used in calculation were the following: the analyte slope = 1.495 pC/ms”’, the background slope = 0.2139 pC/ms”*, the diffusion coefficient (D,) = 0.650 X cm2/s, and the n-value = 1 eq/mol. The working electrodes were pretreated by first rinsing with water and methanol then hand polishing with 0.1 pm alumina slurry on Mi- crocloth@ (BAS polishing cloth) using smooth, even pres- sure and a circular motion until a mirror-like finish was obtained. The polished electrodes were sonicated in water for 10 min, rinsed well with the purified water, and air dried.
*
Other Instrumentation The cyclic voltammetry and chronocoulometry were per- formed with a BAS 100 Electrochemical Analyzer.
RESULTS AND DlSCUSSION
Blank Response in F M C Representative examples of the blank response in FIAEC for the injection of samples that are either identical to the carrier or are different from the carrier in ionic strength or pH are shown in Figures 1 and 2. Each trace shows the response to repetitive injections of a 5-pl sample; the small perturbation in the middle of each trace is caused by switching the injection valve to reload. Injection of a sample of the carrier solution into the carrier shows only a small current response (Figure la), which is attributed to a pressure change that accompanies switching of the injec- tion valve. Figures l b and l c show the typical response obtained for injection of samples of the carrier to which NaCl was added to increase the ionic strength. When the leading edge of the sample encounters the electrode, a cathodic current response occurs; the current then rapidly switches to anodic as the sample leaves the detector. Comparison of Figures lb and l c shows that the magnitude of this current response increases as the difference in ionic strength between sample and carrier increases. A repre- sentative response accompanving a mismatch in pH of sample and carrier is shown in Figure 2 for two different sample pHs. In this case the response is more compli-
a
11. “A
- FIGURE 1. Amperometric blank responses in FIAEC caused by injection of samples of different ionic strength. Samples: (a) 0.1 M sodium acetate at pH 5.0, (b) 0.02 M NaCl in 0.1 M sodium acetate at pH 5.0, (c) 0.06 M NaCl in 0.1 M sodium acetate at pH 5.0. Carrier, 0.1 M sodium acetate at pH 5.0; flow rate, 1 mlimin; applied potential, +0.3 V; sample loop, 5 pl; temperature, 25°C. In all fig- ures, the peak that is above the baseline is cathodic cur- rent and the peak below the baseline is anodic current.
l a s
cated-sharply anodic, then sharply cathodic and then a slower anodic decay.
The current response accompanying the leading edge of the sample as it crosses the electrode can be separated from the trailing edge response by using an unusually large sample loop as shown in Figure 3. In this case a sample of carrier in which the ionic strength was increased by addition of NaCl was injected from a 2000 p1 sample loop. After 30 s, the loop was switched back to carrier, which defines the trailing edge of the sample. This figure clearly shows the sharp cathodic current accompanying the leading edge and the sharp anodic current for the trailing edge. It also shows that the current decays into a steady state current of the carrier. This steady state current is the residual currenr of the sample, i.e., electrolysis of trace electroactive contaminants, solvent, and supporting electrolyte.

Blank Response at GCE 35
U
ii 7 2 0 nA
f------3 9 s
- 18 s
FIGURE 2. Amperometric blank response in FIAEC caused by injection of samples of different pH. Samples: (a) 0.1 M sodium phosphate at pH 7.2, (b) 0.1 M sodium phosphate at pH 7.0. Carrier, 0.1 M sodium phosphate at pH 7.4; flow rate, 1 ml/min; applied potential, +0.3 V; sample loop, 5 pi; temperature, 25°C.
In this study, we have examined, primarily, the time- dependent (transient) current response by measuring its charge as shown in Figure 3. This transient component of the blank signal consists of the well-known nonfaradaic charging current that would be expected to accompany compositional changes in the electrical double layer that occur when a sample of different ionic strength or pH crosses the electrode surface 14-61. Although the cell potential is being held constant in an amperometric exper- iment, the potential of the working electrode could shift slightly due to a difference in solution resistance between sample and carrier that would affect the cell iR (ohmic potential) drop. The transient current should also contain a faradaic current from the oxidation-reduction of surface electroactive species [7-151. This would be caused by a shift in the formal reduction potential, E"', of a surface redox couple, caused by a change in ionic strength or p€I at the surface. In the ca5e of pH, the magnitude of change in E" of a specific redox couple would depend on pK, and proton stoichiometry. Surface reactions are especially im- portant for glassy carbon because the surface is covered with organic functional groups that are electroactive. Thus, the transient component of the blank response is a compli- cated mix of nonfaradaic and faradaic currents.
b FIGURE 3. Charging and discharging accompanying lead- ing and trailing edges of sample in FIAEC. Peak a resulted from turning sample valve from load to inject position; peak b resulted from turning sample valve from inject back to load position before sample completely ran out of the sam- ple loop. Qd., time-dependent (transient) charge; Qi., time- independent (steady-state) charge. Sample, 0.05 M NaCl in 0.1 M sodium phosphate at pH 7.0. Carrier, 0.1 M so- dium phosphate at pH 7.0; flow rate, l mlimin; applied po- tential, + 0.3 V; sample loop, 2000 pl; temperature, 35°C.
Since the transient current is the major interference in the measurement of peak height of electroactive analyte at concentrations near the detection limit, the remainder of the study dealt with factors that affect its magnitude. Either transient peak height or transient charge, (Itd (see Figure 3) , was measured.
The Effect of Size of Sample Loop on Transient Response The effect of the size of the sample loop on the transient current is shown in Figure 4 . The peak current reaches a plateau at 20 pl. Smaller sample loops have insufficient volume to essentially replace the carrier with sample and hence the maximum response is not achieved. In order to maintain a steady-state amperometric response long enough to permit separation of the transient response from the steady-state faradaic response, a 2000-4 sample loop was used for experiments described below.
The Effect of Temperature on Transient Response Figure 5 indicates that the transient charge increases ap- proximately 10% between 25°C and 65°C. According to the Nernst equation, the half-cell potential of the Ag/AgCI reference electrode would shift -3.8 mV from 25°C to 65"C, which represents only 0.3% of the total 10% of tran- sient charge increment (see section below on variation of transient response as a function of applied potential).

36 Xu et al.
FIGURE 4. The effect of size of sample loop on transient re- sponse. Sample, 0.1 M NaCi in 0.1 M sodium phosphate at pH 7.0; carrier, 0.1 M sodium phos- phate at pH 7.0; flow rate, 1 ml/ min; applied potential, +0.3 V; temperature, 25°C. The re- sponse was based on three measurements.
n c(
E
9 CL
*-
1
Therefore, this 10% increment is likely due to the tempera- ture dependence of one or more of the following: (a) the adsorption-desorption process of ionic species on the glassy carbon surface, (b) mass transport to the electrode surface, (c) the dielectric constant of the solution, and (d) the thickness of the double layer. In this work, the temper- ature of the carrier preheater was always kept at 35°C.
The Effect of Flow Rate on Transient Response It is reported that the steady-state faradaic current for sample electrolysis in a channel or duct cell depends on
10 100 1000
Size of Sample Loop (pL)
the solution velocity to the one-third power [ 16-18]. The major factor that may alter this value is the design of the entrance to the cell, which influences the mass transport profile. Figure 64, which was obtained by plotting the transient current response to the one-third power of flow rate, indicates that the transient current did not follow the faradaic current response pattern. However, the character- istics of the transient response in a flow injection system are revealed in Figure 6I3, in which the transient charge is independent of flow rate.
FIGURE 5. The effect of temper- 0.64 ature on transient response. Sample, 0.1 M NaCl in 0.1 M so- dium phosphate at pH 7.0; car- rier, 0.1 M sodium phosphate at pH 7.0; flow rate, 1 ml/min; ap- plied potential, +0.3 V; sample loop, 2000 wl. The response was
0.60 O a a l N based on three measurements.
\
T 1 20 25 30 35 40 45 50 55 60
I
65 I
Mobile Phase Preheater Temperature ("C)

Blank Response at GCE 37
0.84 -
n N
E s p. .-
A
0.76 -
0.68 - 0.60 -
0.52 -
1.6
1.4-
1.2-
1.0- n
E 0 3 0.8-
0.6-
0.4 - 0.2 - 0.0
0
B
a a w w - w v
+ I 8 I i I
FIGURE 6. (A) The effect of flow rate on transient current re- sponse. Sample, 0.15 M NaCl in 0.1 M sodium phosphate at pH 7.0; carrier, 0.1 M sodium phosphate at pH 7.0; applied potential, + 0.3 V; temperature, 35°C. The response was based on three measurements. (B) The effect of flow rate on tran- sient charge response. Condi- tions were the same as in Fig- ure 7A. The response was based on three measurements.
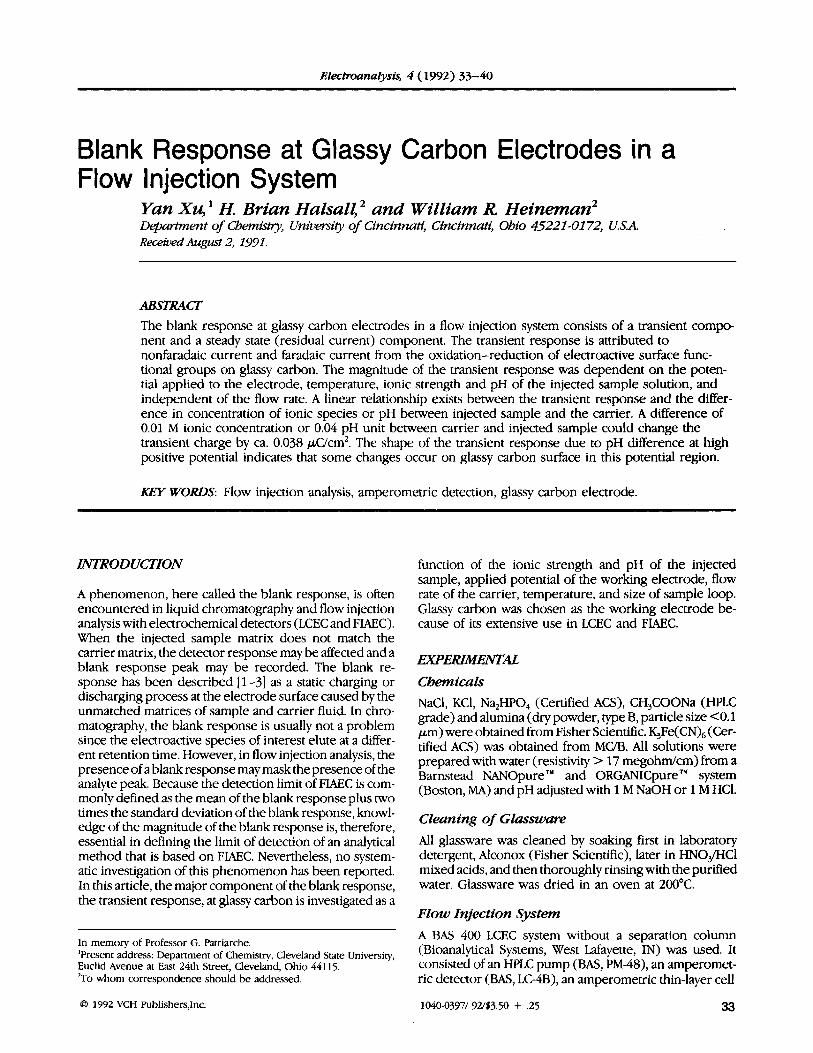
Transient Response as a Function of Ionic Strength and pH Figures 7A and 7B show the dependencies of the transient response on both sodium chloride concentration and solution pH. In both cases, an essentially linear relation- ship was obtained based on either the charge or current response. It is interesting to note that when the ionic strength of sample is greater than the ionic strength of carrier, the transient response is cathodic and, when the ionic strength of sample is less than the ionic strength of carrier, the transient response is anodic. However, this situation is reversed in the case of sample pH.
A projection that could be made out of the facts is that an amperometric detector for chromatography based on the transient response to the ionic strength and the solu- tion pH can be developed. Because the transient response in an amperometric detector is caused by the A ionic strength or A pH between the carrier and sample solution
as shown in Figures 7A and 7B, it seems that it is less sensitive to temperature than a dielectric constant detector in which the dielectric constant of the eluates are mea- sured and the temperature must be stable to within ca. 0.001"C [19]. The result shown in Figure 5 also supports this statement.
The results shown in Figure 7 are most important for the FJAEC user since they reveal that to keep the transient response to less than 0.038 pc/cm2, the difference be- tween the injected sample and carrier in concentration and solution pH should be controlled to within or smaller than 0.01 M (Figure 7A) and 0.04 pH unit (Figure TB).
V a h t i o n of Transient Response as a Function of Applied Potential The elemode material, glassy carbon, is a gas imperme- able material made by heating phenol-formaldehyde res- ins in an inert atmosphere [20]. The electrode made from
38 XU eta1
FIGURE 7. (A) The effect of ionic strength on transient charge re- sponse. Sample, NaCl in 0.1 M so- dium phosphate at pH 7.0; carrier, 0.1 M sodium phosphate at pH 7.0; flow rate, 1 mlimin; applied potential, +0.3 V; sample loop, 2000 PI; tem- perature, 35°C. The response was based on three measurements. (6) The effect of solution pH on tran- sient charge response. Sample, 0.2 M NaCl in 0.002 M sodium phos- phate adjusted pH to 6.0, 6.2, 6.4, 6.6, 6.8, 7.0, 7.2, 7.4, 7.6, 7.8, and 8.0, respectively; carrier, 0.2 M NaCl in 0.002 M sodium phosphate at pH 7.0; flow rate, 1 mlimin; applied po- tential, +0.3 V; sample loop, 2000 PI; temperature, 35°C. The response was based on three measurements.
I
n Cll
E s 3 0
5.8 6.2 6.6 7.0 7.4 7.8 8.2
pH of Sample Solution
glassy carbon can be used at both positive and negative potentials with a range in aqueous solution of cd. 2 V, and the electrode response is relatively constant with time (211. However, the electrode has a high residual current [8]. Numerous observations [ 7-15 and the references therein] have been made that there are a number of oxygen containing functionalities on the surface of glassy carbon. The redox reactions of these functional groups could be the main sources of the residual current [8]. h s a result of these redox reactions, the charge on the glassy carbon electrode surface could change, and, hence, affect the structure of the electrode double layer [ll].
Figure 8 presents the transient response as a function of applied potential at the glassy carbon electrode. The maximum response occurs at an applied potential of ca. -0.2 V vs. A@AgCl. Possible causes for the shape of the potential curve include the population and diversity of surface functionalities (e.g., quinone-like functionalities)
on the electrode, adsorbed electroactive material, the structure of the electrical double layer, and defects in the electrode lattice.
Figure 9 shows that a complicated blank response (peak b) occurs at a high positive applied potential, and that this is different from the response at low applied potential (peak a). The difference in response suggests that changes have occurred within the electrode double layer or on the surface of the electrode and that these changes were sensitive to the pH of the sample solution.
coNcLusIoNs The amperometric blank response at glassy carbon in a flow injection system has been described phenomenologi- cally. The steady-state flow injection approach allows us to separate the transient response from the steady-state re- sponse. The magnitude of the transient response was

Blank Response at GCE 39
dependent on the applied potential at the electrode, temperature, ionic strength and pH of solution, and inde- pendent of the flow rate. A linear relationship between the transient response and A concentration of ionic species or A pH of solution has been observed. The complicated transient response at high positive potential caused by
FIGURE 9. The amperometric blank response in FIAEC on glassy carbon electrode at different applied potentials; (a) + 0.3 V; (b) + 0.8 V. Sample, 0.2 M NaCl in 0.002 M sodium phosphate at pH 6.0; carrier, 0.2 M NaCl in 0.002 M sodium phosphate at pH 7.0; flow rate, 1 ml/min; sam- ple loop, 2000 PI; temperature, 35°C.
a
b
- 9 s
FIGURE 8. The effect of applied potential on transient charge re- sponse based upon ionic strength of solution. Samples, a series of NaCl concentrations in 0.1 M so- dium phosphate at pH 7.0; car- rier, 0.1 M sodium phosphate at pH 7.0; flow rate, 1 ml/min; sam- ple loop, 2000 PI; temperature, 35°C. The response was based on three measurements.
+--
solution pH reflects changes on the glassy carbon surface. Preparatioddilution of the sample in the carrier matrix is highly recommended for suppression of the transient re- sponse and obtaining lower limits of detection with FIAEC.
1.
2.
3
4
5
6 7
8
9 10.
11. 12.
13.
14.
K. R. Wehmeyer, M. J. Doyle, D. S. Wright, H. M. Eggers, H. B. Halsall, and W. R. Heineman, J. Liq. Chromatogr. (1983)
C . E. Lunte, P. T. Kissinger, and R. E. Shoup, Anal. Chem. 57
Y . Xu, H. B. Halsall, and W. R. Heineman, J. P b u m . Biomed
J. O’M. Bockris a n d k K. N. Reddy,ModemElectrocbemisty, (Vol. 2 ) Plenum Press: New York,.Chap. 7 (1970). A. J, Bard and L. Faulkner, Electrochemical Metbod, Wiley: New York, Chaps. 1 and 12 (1980). H. B. Mark, Jr., Analyst I 1 5 (1990) 667-678. D. Laser and M. Ariel, J. Electrmnal. Chem. 52 (1974)
J. W. Dieker, W. E. Van der Linden, and H. Poppe, TaZanta25
J. F. Evans and T. Kuwana, Anal. Chem. 5 1 (1979) 356-365. D. J. Chesney, J. L. Anderson, D. E. Weisshaar, and D. E. Tallman, Anal. Cbzm. Acta 124 (1981) 321-331. J. F. Rusling, Anal. Chem. 56 (1984) 575-578. B. Kazee, D. E. Weisshaar, and T. Kuwana, Anal. Cbm. 57
1. F. Hu, D. H. Karweik, and T. KuwanaJ, Electroanal. C h . 188 (1985) 59-72. D. T. Fagan, I. F. Hu, and T. Kuwana, Anal. C h . 57 (1985)
2141-2145.
(1985) 1541-1546.
Anal. 7 (1989) 1301-1311.
291-303.
(1978) 151-155.
(1985) 2736-2739.
2759-2763.

40 Xu et al.
15. L. A. b u r y , Jr. and W. R Heineman J. Electroanal. Chem. 256 (1988) 327-341.
16. S. G. Weber, J. Electroanal Chem. 145 (1983) 1-7. 17. D. G. Swartzfager, Anal. Chem. 48 (1976) 2189-2192.
19. P. C. White, Analyst Z@l (19&1) 677-697. 20. D. C. Johnson, S. G. Weber, A. M. Bond, R. M. Wightman, R E.
Shoup, and I. S. Krul1,Anal. Chim. Acta 180(1986) 187-250. 21. C. Bollet, P. Oliva, andM. Caude,]. Chromutogy. 249 (1977)
18. P. L. Meschi and D. C.Johnson, Anal. Chim. Acfa 124 (1981) 625-644. 303-314.