Embed Size (px)
Citation preview

Report of Investigations 9455
Blast Vibrations and Other Potential Causes of Damage in Homes Near a Large Surface Coal Mine in Indiana
By David E. Siskind, Steven V. Crum, and Matthew N. Plis
UNITED STATES DEPARTMENT OF THE INTERIOR Bruce Babbitt, Secretary
BUREAU OF MINES
' ,.

CONTENTS Page
Ab::,,ract . . . . . . . . . . . . . . . . . . . . . . . . . . . . . . . . . . . . . . . . . . . . . . . . . . . . . . . . . . . . . . . . . . . . . . . . . . . 1 Introduction . . . . . . . . . . . . . . . . . . . . . . . . . . . . . . . . . . . . . . . . . . . . . . . . . . . . . . . . . . . . . . . . . . . . . . . . 2 Acknowledgments . . . . . . . . . . . . . . . . . . . . . . . . . . . . . . . . . . . . . . . . . . . . . . . . . . . . . . . . . . . . . . . . . . . . 3 Background . . . . . . . . . . . . . . . . . . . . . . . . . . . . . . . . . . . . . . . . . . . . . . . . . . . . . . . . . . . . . . . . . . . . . . . . 3
Ground vibrations . . . . . . . . . . . . . . . . . . . . . . . . . . . . . . . . . . . . . . . . . . . . . . . . . . . . . . . . . . . . . . . . . 3 Generation and propagation . . . . . . . . . . . . . . . . . . . . . . . . . . . . . . . . . . . . . . . . . . . . . . . . . . . . . . . . 3 Vibration effects on structures . . . . . . . . . . . . . . . . . . . . . . . . . . . . . . . . . . . . . . . . . . . . . . . . . . . . . . 4
Cosmetic cracking in homes . . . . . . . . . . . . . . . . . . . . . . . . . . . . . . . . . . . . . . . . . . . . . . . . . . . . . . 4 Structural response . . . . . . . . . . . . . . . . . . . . . . . . . . . . . . . . . . . . . . . . . . . . . . . . . . . . . . . . . . . . 4 Cracking of concrete ............................. : ........................... , . 4 Ambient vibrations . . . . . . . . . . . . . . . . . . . . . . . . . . . . . . . . . . . . . . . . . . . . . . . . . . . . . . . . . . . . . 5
Human response to vibrations . . . . . . . . . . . . . . . . . . . . . . . . . . . . . . . . . . . . . . . . . . . . . . . . . . . . . . . 5 Whole body vibrations . . . . . . . . . . . . . . . . . . . . . . . . . . . . . . . . . . . . . . . . . . . . . . . . . . . . . . . . . . 5 Persons in buildings . . . . . . . . . . . . . . . . . . . . . . . . . . . . . . . . . . . . . . . . . . . . . . . . . . . . . . . . . . . . 6
Airblasts . . . . . . . . . . . . . . . . . . . . . . . . . . . . . . . . . . . . . . . . . . . . . . . . . . . . . . . . . . . . . . . . . . . . . . . . 6 Generation and propagation . . . . . . . . . . . . . . . . . . . . . . . . . . . . . . . . . . . . . . . . . . . . . . . . . . . . . . . . 6
Degree of confmement . . . . . . . . . . . . . . . . . . . . . . . . . . . . . . . . . . . . . . . . . . . . . . . . . . . . . . . . . . 6 Weather influences . . . . . . . . . . . . . . . . . . . . . . . . . . . . . . . . . . . . . . . . . . . . . . . . . . . . . . . . . . . . . 7
Airblast effects on structures . . . . . . . . . . . . . . . . . . . . . . . . . . . . . . . . . . . . . . . . . . . . . . . . . . . . . . . 8 Structural response . . . . . . . . . . . . . • . . . . . • . . . . . • . . . . . . . . . . . . . . . . . . . . . . . . . . . . . . . • . . 8 Cosmetic cracking and glass breakage . . . . . . . . . . . . . . . . . . . . . . . . . . . . . . . . . . . . . . . . . . . . . . . 9 Structural cracking . . . . . . . . . . . . . . . . . . . . . . . . . . . . . . . . . . . . . . . . . . . . . . . . . . . . . . . . . . . . . 10 Human response . . . . . . . . . . . . . . . . . . . . . . . . . . . . . . . . . . . . . . . . . . . . . . . . . . . . . . . . . . . . . . 10
Site descriptions . . . . . . . . . . . . . . . . . . . . . . . . . . • . . . . . . . . . . . . . . . . . . . . . . . . . . . . . . . . . . . . . . . . . . 11 Ayrshire mine . . . . . . . . . . . . . . . . . . . . . . . . . . . . . . . . . . . . . . . . . . . . . . . . . . . . . . . . . . . . . . . . . . . . 11 Town areas . . . . . . . . . . . . . . . . . . . . . . . . . . . . . . . . . . . . . . . . . . . . . . . . . . . . . . . . . . . . . . . . . . . . . . 11
General description . . . . . . . . . . . . . . . . . . . . . . . . . . . . . . . . . . . . . . . . • . . . . . . . . . . . . . . . . . . . . . 11 Geology of study area . . . . . . . . . . . . . . . . . . . . . . . . . . . . . . . . . . . . . . . . . . . . . . . . . . . . . . . . . . . . . 12
Selection of houses for study . . . . . . • . . . . . . . . . . . . . . . . . . . . . . . . . . . . . . . . . . . . . • . . . . . . . . . . . . . 14 Citizens' concerns and complaints . . . . . . . . . . . . . . . . . . . . . . . . . . . . . . • . . . . . . . . . . . . . . . . . . . . . . . 15
Analysis and findings . . . . . . . . . . . . . . . . . . . . . . . . . . . . . . . . . . . . . . . . . . . . . . . . . . . . . . . . . . . . . . . . . 17 Vibration and airblast . . . . . . . . . . . . . . . . . . . . . . . . . . . . . . . . . . . . . . . . . . . . . . . . . . . . . . . . . . . . . . . 17
Monitoring . . . . . . . . . . . • . . . . . . . . . . . . . . . . . . . . . . . . . . . . . . . . . . . . . . . . . . . . . . . . . . . . . . . . . 17 Historical blasting data ............. , . . . . . . • . . . . . . . . . . . . . . . . . . . . . . . . . . . . . . . . . . . . . . . . 18 Ground vibrations . . . . . . . . . . . . . . . . . . . . . . . . . . . . . . . . . . . . . . . . . . . . . . . . . . . . . . . . . . . . . . • 19
Wave form analysis . . . . . . . . . . . • . . . . . . . . . . . . . . . . . . . . . . . . . . . . . . . . . . . . . . . . . . . . . . . . . 19 Vibration amplitudes . . . . . . . . . . . . . . . . . . . . . . . . . . . . . . . . . . . . . . . . . . . . . . . . . . . . . . . . . . . 22 Historical data-propagation plots of vibration amplitudes . . . . • . . • . . . . . . . . . . . . . . . . . . . . . . . • 22 Bureau of Mines data-propagation plots of vibration amplitudes . . . . . . . . . . . . . . . . . . . . . . . . . . . 24 Vibration frequencies . . . . . . . . . . . . . . . . • . . . . . . . . . . . . . . . . . . . . . . . . . . . . . . . . . . . . . . . . . . 24 Natural seismicity in study area . . . . . . • . . • . . . . . . . . . . . . . . . . . . . • . . . . . . . . . . . . . . . . . . . . . 25
Airblasts . . . . . . . . . . • . . . . . . . . . . . . . . • . . . . . . . . . . . . . . . . . . . . . . . . . . . . . . . . . . . . . • . . . . . . 25 Climatological data . . . . . . . . . . . . . . . . . . . . . . . . . . . . . . . . . . . . . . . . . . . . . . . . . . . . . . . . . . . . . . • 26
Structural vibrations . . . . . . . . . . . . . . • . . . . . . . . . . . . . . . . . . . . . . . . . . . . . . . . . . . . . . . . . . . . . . . . . 27 Ground-vibration-induced responses . . . . . . • . . . . . . . • . • . . . . . . . . . . . . . . . . . . . . . . . . . . . . • . . . . 27 Airblast responses . . . . . . . . . . . . . . . . . . . . . . . . . . . . . . . . • . . . . . . . . • . . . . . . . • . . . . . . . . . . . . . 27 Responses from human activity ...................................•........ , . . . . . . . . . . 28

ll
CONTENTS-Continued Page
Cracking and damage in homes . . . . . . . . . . . . . . . . . . . . . . . . . . . . . . . . . . . . . . . . . . . . . . . . . . . . . . . 28 Monitoring period inspections . . . . . . . . . . . . . . . . . . . . . . . . . . . . . . . . . . . . . . . . . . . . . . . . . . . . . . . 28 Damage changes observed during monitoring period . . . . . . . . . . . . . . . . . . . . . . . . . . . . . . . . . . . . . . 28 Inspections of existing damage . . . . . . . . . . . . . . . . . . . . . . . . . . . . . . . . . . . . . . . . . . . . . . . . . . • . . . 29 Assessment of damage . . . . . . . . . . . . . . . . . . . . . . . . . . . . . . . . . . . . . . . . . . . . . . . . . . . . . . . . . . . . 31
Level-loop surveys . . . . . . . . . . . . . . . . . . . . . . . . . . . . . . . . . . . . . . . . . . . . . . . . . . . . . . . . . . . . . . . . . 31 Soil characteristics and foundation failure . . . . . . . . . . . . . . . . . . . . . . . . . . . . . . . . . . . . . . . . . . . . . . . . 34 Blast designs . . . . . . . . . . . . . . . . . . . . . . . . . . . . . . . . . . . . . . . . . . . . . . . . . . . . . . . . . . . . . . . . . . . . . 34
Conclusions . . . . . . . . . . . . . . . . . . . . . . . . . . . . . . . . . . . . . . . . . . . . . . . . . . . . . . . . . . . . . . . . . . . . . . . . 35 References . . . . . . . . . . . . . . . . . . . . . . . . . . . . . . . . . . . . . . . . . . . . . . . . . . . . . . . . . . . . . . . . . . . . . . . . . 36 Appendix A.-Production blasts monitored by Bureau of Mines . . . . . . . . . . . . . . . . . . . . . . . . . . . . . . . . . . 38 Appendix B.-Vibration data from monitoring of surface coal mine production blasts at the AMAX Ayrshire
mme . . . . . . . . . . . . . . . . . . . . . . . . . . . . . . . . . . . . . . . . . . . . . . . . . . . . . . . . . . . . . . . . . . . . . . . . . . . 40 Appendix C.-Summary of vibration and airblast data from Ayrshire mine blasting . . . . . . . . . . . . . . . . . . . . 52 Appendix D.-Selected high-level airblast incidents . . . . . . . . . . . . . . . . . . . . . . . . . . . . . . . . . . . . . . . . . . . . 57 Appendix E.-Soil-foundation interactions . . . . . . . . . . . . . . . . . . . . . . . . . . . . . . . . . . . . . . . . . . . . . . . . . . 58 Appendix F.-Press release on drought effects on basement walls . . . . . . . . . . . . . . . . . . . . . . . . . . . . . . . . . 62
ILLUSTRATIONS
1. Mine and monitoring locations west of Ayrshire mine near Evansville, IN . . . . . . . . . . . . . . . . . . . . . . . 2 2. Propagation plot regressions for production blasts for six Indiana coal mines monitored by the Bureau,
from Bureau RI 9226..... . . . . . . . . . . . . . . . . . . . . . . . . . . . . . . . . . . . . . . . . . . . . . . . . . . . . . . . . 4 3. Vibration damage summary from Bureau RI 8507 . . . . . . . . . . . . . . . . . . . . . . . . . . . . . . . . . . . . . . . . 5 4. Airblast propagation from surface mining, from Bureau RI 8485 . . . . . . . . . . . . . . . . . . . . . . . . . . . . . . 7 5. Combined mining airblast measurements for all sites, from Bureau RI 8485 . . . . . . . . . . . . . . . . . . . . . . 8 6. Structural and midwall responses of low-rise structures from airblast overpressures, from Bureau
RI 8485....................................................................... 9 7. Ground vibrations, structure vibrations, and airblast from a coal mine highwall blast . . . . . . . . . . . . . . . 10 8. Ayrshire mine highwall showing blasts during Bureau mo,..itoring program, November 1989 to January
1990 . . . . . . . . . . . . . . . . . . . . . . . . . . . . . . . . . . . . . . . . . . . . . . . . . . . . . . . . . . . . . . . . . . . . . . . . . 11 9. Monitored homes and additional seismic stations west of the Ayrshire mine highwall . . . . . . . . . . . . . . . 12
10. Generalized map of surface geology in Evansville, IN, area and descriptions of unconsolidated deposits . . 13 11. Generalized geologic cross section of McCutchanville area . . . . . . . . . . . . . . . . . . . . . . . . . . . . . . . . . . 14 12. Survey crew performing level-loop analysis . . . . . . . . . . . . . . . . . . . . . . . . . . . . . . . . . . . . . . . . . . . . . . 15 13. Vibration monitoring system in house 209, including digital oscilloscope for data retrieval and seven-
channel FM recorder ............................................................. · 18 14. Vibration transducers in basement corner of house 209, at ground level . . . . . . . . . . . . . . . . . . . . . . . . . 18 15. Rear view of house 209 showing height and microphone placement . . . . . . . . . . . . . . . . . . . . . . . . . . . . 18 16. Ground vibrations, structure response, and airblast overpressure at house 105 for shot 25 . . . . . . . . . . . . 20 17. Ground vibrations, structure response, and airblast overpressure at house 209 for shot 25 . . . . . . . . . . . . 21 18. Historical and recent Bureau data on peak particle velocity in three directions of measurement . . . . . . . 23 19. Bureau data on peak particle velocity for homes monitored in McCutcbanville and Daylight . . . . . . . . . . 24 20. Peak particle velocity and associated frequency for Bureau monitoring in McCutcbanville and Daylight . . 25 21. Historical and recent Bureau airblast overpressures for McCutchanville and Daylight directions . . . . . . . 26 22. Amplification factors for blast-produced corner responses for houses 105 and 209 and midwall responses
for house 209 . . . . . . . . . . . . . . . . . . . . . . . . . . . . . . . . . . . . . . . . . . . . . . . . . . . . . . . . . . . . . . . . . . 27

iii
ILLUSTRATIONS-continued Page
23. Displacement gauge placed across outside crack in house 108 prior to Bureau's study . . . . . . . . . . . . . . 29 24. Basement block wall crack on east wall of house 201 . . . . . . . . . . . . . . . . . . . . . . . . . . . . . . . . . . . . . . 30 25. Uncovered patio at house 201 with tilt toward house's north wall . . . . . . . . . . . . . . . . . . . . . . . . . . . . . 31 26. Junction of north wall and patio of house 201 showing evidence of settlement . . . . . . . . . . . . . . . . . . . . 31 27. Level-loop surveys . . . . . . . . . . . . . . . . . . . . . . . . . . . . . . . . . . . . . . . . . . . . . . . . . . . . . . . . . . . . . . . . 32
TABLES
1. Whole-body vibration tolerated by humans for 1-min durations . . . . . . . . . . . . . . . . . . . . . . . . . . . . . . . 5 2. Peak vibration levels tolerated by humans in buildings . . . . . . . . . . . . . . . . . . . . . . . . . . . . . . . . . . . . . . 6 3. Propagation equations for airblasts from mining-type blasts in figure 4 . . . . . . . . . . . . . . . . . . . . . . . . . 7 4. Soil types encountered at Bureau test houses . . . . . . . . . . . . . . . . . . . . . . . . . . . . . . . . . . . . . . . . . . . . 14 5. Descriptions of homes studied by Bureau, October 1989 through January 1990 . . . . . . . . . . . . . . . . . . . . 16 6. Complaints flied with regulatory agency, Indiana DNR, during Bureau monitoring . . . . . . . . . . . . . . . . . 16 7. Monitoring and inspection of Evansville area homes by Bureau, October 1989 through January 1990 . . . 17 8. Blast monitoring equipment for Bureau study . . . . . . . . . . . . . . . . . . . . . . . . . . . . . . . . . . . . . . . . . . . . 17 9. Structure vibration responses from airblasts . . . . . . . . . . . . . . . . . . . . . . . . . . . . . . . . . . . . . . . . . . . . . 28
10. Structure vibration responses in house 209 from aircraft operations and human activity . . . . . . . . . . . . . 28 11. Crack changes in homes during Bureau monitoring period, November 1, 1989 through January 3, 1990 . . 29 12. Summary of two level-loop surveys of seven Daylight and McCutchanville houses, October 1989 and
January 1990 . . . . . . . . . . . . . . . . . . . . . . . . . . . . . . . . . . . . . . . . . . . . . . . . . . . . . . . . . . . . . . . . . . . 34

UNIT OF MEASURE ABBREVIATIONS USED IN THIS REPORT
dB decibel lb pound
ft foot lbjin2 pound per square inch
ft/lb112 foot per square root pound mb millibar (square root sealed distance)
mi/h mile per hour ftjlb113 foot per cubic root pound
(cubic root scaled distance) min minute
ft/s foot per second mm millimeter
g -acceleration of gravity ms millisecond
Hz hertz pet percent
in l..U'-.U. s second
injs inch per second

BLAST VIBRATIONS AND OTHER POTENTIAL CAUSES OF DAMAGE IN HOMES NEAR A LARGE SURFACE COAL MINE IN INDIANA
By David E. Siskind,1 Steven V. Crum,2 and Matthew N. Plis3
ABSTRACT
The U.S. Bureau of Mines studied seven homes near Evansville, I:t-;, that had various degrees of damage that the owners attributed to vibrations from surface coal mine blasting. Researchers monitored vibration and air blast impacts, crack behavior before and after blasts, and dynamic structural responses to blasting and other sources. Level-loop surveys were performed to quantify possible settlement and subsidence. These results were combined with State and coal company measurements to determine if recent vibration characteristics, airblast propagations, or structural responses were typical of results found in historical studies that produced criteria for safe blasting and regulatory limits.
Researchers found that the blasting vibrations were occasionally of low frequency, down to 3 Hz, making them unusually noticeable. The low vibration amplitudes and lack of additional cracking and extensions during this study indicated that phenomena other than blasting were responsible for the structural damage observed in the study area. The nature of the damage, a soil evaluation, and information on soils from nearby southern Illinois suggest that expansive clays and/ or highly erodible soils are primarily responsible for the foundation~related structural damage, with possible contributions from drainage and slope failure. Airblasts are likely responsible for the occasional and irregular high perceptibility of blasting by homeowners.
1SupeiVisory geophysicist, Twin Cities Research Center, U.S. Bureau of Mines, Minneapolis, MN. 2Geophysicist, Twin Cities Research Center. 3Mining engineer, lntennountain Field Operations Office, U.S. Bureau of Mines, Denver, CO.

2
INTRODUCTION
J:'he U.S. Bureau of Mines was asked by the Federal Office of Surface Mining Reclamation and Enforcement (OSM) to conduct a damage evaluation study in two communities west of the active Ayrshire surface coal mine operated by the AMAX Coal Co. north of Evansville, IN (fig. 1). Residents of 45 to 50 homes in the communities of Daylight and McCutchanville had been complaining of blast vibration impacts and/ or damage. They attributed damage ranging from cosmetic superstructure cracks to collapsing basement walls to the mine blasting 2 to 5 miles away. Additionally, some complaints had been received at widely varying locations up to 10 miles away, suggesting abnormal propagations for vibration, airblast, or both.
The Bureau study was to determine if the damage was being caused by the blasting, through a program of blast monitoring and crack inspections. Included in the study '"~-n assessments of vibration characteristics, such as frequency and duration, in addition to particle velocity amplitudes. Airblast impacts, possible settlement and subsidence, effects of the propagating media on the vibrations, structural response, and effects of vibration sources other than blasting were also examined. If the blasting was found not to be the cause of damage, the Bureau was to propose alternative explanations.
In Indiana, the Department of Natural Resources (DNR) controls blasting effects by enforcing regulations approved by the OSM for surface coal mining. In response to these 1988 and 1989 complaints, the DNR reviewed the recent history of Ayrshire mine blasting and complaints (1).4 This undated evaluation, completed about August 1989, stated that blasting was not a likely cause of damage to homes in these communities, based on low vibration amplitudes. The study also noted that a significant number of the ~events" complained about were not blasts at all, at Ayrshire or at other farther away mines. The DNR continues its program of monitoring Ayrshire mine blasting. A permanent seismograph station is in place at one McCutchanville home, and blasting practices at the mine are in continual review.
One recent effort by the DNR verified that production blasts during the period of the Bureau's monitoring, November 1, 1989, through January 3, 1990, were typical and as large as previous blasts (within 80 pet of total explosive charge weight), including blasts during periods of high complaint levels. The DNR also noted that the mine had been varying minor factors in the blast design, such as initiation delay intervals and pattern designs. The effects of such changes on vibration characteristics at the large distances of concern for this study (2 to 4 miles) are
4Italic numbers in parentheses refer to items in the list of references preceding the appendixes at the end of this report.
expected to be minor, but have not been systematically studied. Because of typical vibration propagation equations (given later in the "Background" section), even a major change, such as a doubling of the charge weight per 8-ms delay, is expected to have, at worst, a corresponding doubling of vibration amplitude.
OSM also became directly involved because of the number of complaints and the implications for both its regulations and the coal mining industry should the blasting be responsible for damage to homes. OSM officials conducted a comprehensive damage inspection program that included about 115 area homes. Following that survey, they initiated a multifaceted research program involving Bureau of Mines monitoring (the subject of this report), an Indiana Geologic Survey (IGS) core drilling and logging
Haubstadt D
N Base Line Road site 0
Daylight D
McCutchanville D
.£/ Regional ff" atrport
)
Ayrshire mine highwall (12-89)
Evansville, IN
~Downtown
0 4
Figure 1.-Mine and monitoring locations west of Ayrshire mine near Evansville, IN.

program to characterize local geology, and engineering tests on local soils by both the IGS and the U.S. Army Corps of Engineers. It is anticipated that OSM will assimilate all these efforts and publish an overall program report.
3
This research was done at the request of OSM Eastern Field Operations and was partly funded by OSM through Interagency Agreement EC68-IA9-13259. The OSM technical project officer was Louis L. McGee.
ACKNOWLEDGMENTS
Willard Pierce, blasting specialist, Indiana Department of Natural Resources, Jasonville, provided suggestions and information on specific monitoring sites, measurements, and blast design. AMAX Coal Co. coordinated blasting schedules with Bureau researchers when specific on-site
equipment had to be operated manually and also supplied historical and current data from its own monitoring stations. Homeowners provided regular access for both monitoring equipment and crack inspections and, on occasion, assessments of their perceptions of the blasts.
BACKGROUND
Ground vibrations from blasting have been the subject of mar..J u,J.dies, by the Bureau and others, back to at least 1942. Two Bureau reports contain detailed summaries of vibration generation: Bulletin 656, on quarry blasting (2), and the more recent and comprehensive Report oflnvestigations (RI) 8507, mainly on coal mine blasting (3). There is long-term interest in the environmental effects of blasting because the mining, quarrying, and construction industries consume 4 billion lb ( 4 x 10⁹) of commercial explosives per year and expose large numbers of neighbors to the resulting vibrations. Although these relatively wellconfined blasts are intended to fragment and move rock, they do produce some ground vibrations and airblast as wasted energy.
GROUND VIBRATIONS
Generation and Propagation
Vibration amplitudes (expressed as particle velocities, inches per second) have been found to depend mainly on two simple factors, explosive charge weights per delay and distances. Most equations describing vibration amplitudes include only these factors, as exemplified by the coal mine summary propagation prediction from RI 8507 (3): ·
where V is the particle velocity at a monitoring site in inches per second at a distance (D) in feet from a charge (W) in pounds of explosive per delay.
A third factor, of less importance than charge weight and distance, is the degree of blast confinement, expressed
in various ways such as Hdepth of burial" in loose material a:1d "burden" in rock. In standard coal mining echelon blasting, the rock is well confmed and is primarily fractured in place. Cast blasting has recently been adopted by surface mining on a large scale. This method uses smaller burdens and longer between-row delays to throw a significant portion of the overburden across the pit. There is no question that casting improves productivity by reducing materials-handling costs. Offsetting the effects of the large charge weights in casting is the smaller burden, which some believe reduces vibrations. A previous study of Indiana surface coal mine blasting appears to support this supposition, with lower vibration amplitudes on the basis of charge weight per delay (4).
A potentially serious side effect from casting is a less predict:'ble airblast and an enhanced air pressure pulse (APP), defmed as an airblast component produced by the piston effect of the moving rock, as described in RI 8485 (5). Both the air-pressure pulse and increased chance of a blowout suggest that casting increases the risk of occasional high airblast. However, this has not been studied. Airblasts are described in more detail in the next section.
Vibration propagation examples are shown in figure 2 for six Indiana surface coal mines, scaled traditionally by the square root of charge weights per 8-ms delay (4). Line 6 in this figure represents a westward-oriented seismic array at the Ayrshire mine, the general direction of concern for this study. The propagation equation for line 6is
Note the low value of the exponent compared with that in the earlier coal mine summary from RI 8507, showing a

4
10,00
"' i:
~ (.)
0 ..J w > w 1.00 d ~ < "-
"' < w "-
,10
SQUARE ROOT SCALED DISTANCE, IV!b II>
Figure 2.-Propagatlon plot regressions for production blasts for six Indiana coal mines monitored by the Bureau, from Bureau Rl 9226 (4).
slightly lower attenuation with distance. The Ayrshire mine parameters for the line 6 data are as follows:
1. Distances of seismographs .. 100 to 6,000 ft. 2. Charge weight per delay . . . . 1,350 lb. 3. Hole diameter ............ 12-1/4 in. 4. Initiation design • . . • . . . . . . . 17- by 100-ms echelon. s. Time of monitoring . . . . • . . . April 1987.
The date is given because the mine is continually moving, westward in this case. An earlier study of vibration and airblast from Ayrshire mine blasting was done by the Bureau when the mine was considerably to the cast and the geology was different ( 6). These earlier measurements examined blast design effects on vibrations; however, casting was not in practice at that time, between 1980 and 1983.
Vibration Effects on Structures
Cosmetic Cracking in Homes
The most comprehensive study of blasting vibration impacts on homes is Bureau Rl 85~7 on ~ound vibration (3), published in 1980. Supplementmg thts was a followup
study of repeated long-term vibration effects on a single structure's construction components and materials, RI 8896 (7). These two studies summarize all available and appropriate observations of low-level blast-produced cracking. Their scopes of study were low-rise residential structures, small to moderate-size blasts (up to about 4,000 lb per delay), and moderate distances of a few miles.
A major finding reported in Rl 8507 was the importance of vibration frequency to both structural response and damage potential. Figure 3 shows the Bureaudeveloped "safe-envelope," including reduced levels at low frequencies, superimposed on actual damage observations. The exact damage risk at low frequencies, especially below 4Hz, should be considered as approximated by the Bureau's envelope, because of the scarcity of data. RI 8507 discusses the special problems of low-frequency sources, such as earthquakes, and usc of the old 0.030-in displacement criterion (3).
Structural Response
Structures shake from blasting according to the characteristics of both the vibration and the structure (see RI 8507 for detailed discussion). For low-rise residential structures, typical vibration amplifications in the structures' natural frequency range of 4 to 12 Hz are 1.5 to 2 times. Midwall amplifications can be higher and correspond to high secondary noises, such as window sash rattling. ThPse noises definitely contribute to vibration and airblast perceptibility.
Cracking of Concrete
Massive concrete is understandably very resistant to vibration-induced cracking. Oriard (8) recommends restrictions for new (green) concrete that has not yet fulJy cured, estimating a safe level of 2 to 4 in/s after 7 to 10 days. In actual tests, he found that over 100 in/s vibration was required to crack 8-day-old concrete and that old concrete could withstand 375 injs. Oriard also lists Tennessee Valley Authority (TVA) criteria for mass concrete, which specify a level of 12 in/s for concrete over 10 days old at distances beyond 250 ft. Closer distance allows higher vibrations, (e.g., up to 20 in/s within 50ft). The American Concrete Institute recommends similar values for peak vibrations (up to 2 to 7 in/s). Obviously, these vibration levels are orders of magnitude above what the superstructures could withstand and are not of concern outside the immediate vicinity of a blast (a few feet).
The Bureau collected a small amount of data on cracks in basement wall concrete block in its previous studies of vibration impacts on homes (3, 7). Three observations of cracks in these walls occurred at vibrations of 6 to 11 injs,

5
0
1::.
>-1-
10 :JR 1::. 8 t:.e
et:.t:.~t:. t:. o o t:. o iJMajor
--=~~===o~=~,~~~jr.:~~~~n~-:o~~~t:.~~[~~ ; L,M;no' G 9 w > w ....I (.)
a~ 0 Threshold 0
f= a:
a a • 1::.
rt a o t:. • • 5'-----------------80 C4t • • • 11' KEY ::t:
<( w 0..
0 •~::.. • ,•. 0 • • Jl{ . , . . '· .. .,.. : r----·---------•J . ·' . / . 1
r:.'--~- ._ ___ • ___ ..,,,/ /
10
• t:. Minor damage
o Major damage
• Threshold damage
100 1,000
FREQUENCY. Hz
Figure 3.-Vibration damage summary from Bureau Rl 8507 (3). Dashed line defines safe level limits using a combination of velocity and displacement, from appendix B of Rl 8507.
and frequencies were about 12 Hz (figure 3, "major damage").
Ambient Vibrations
Although only suspected at the time of publication of RI 8507 (3), a vibration level criterion of 0.5 in/s was found to have special significance in that it approximates typical ambient conditions in houses. Human activity such as walking and door closing and weather influences such as wind gusts, temperature, and humidity cycles produce internal strains equivalent to about 0.5 in/s (7). Since houses are regularly immersed in such an environment, it is not surprising that no blast-produced cracking was observed in tests with vibrations below 0.5 injs. As a result, Bureau researchers concluded that vibration levels below 0.5 in/s were insignificant, except for two possible cases: those involving particularly sensitive devices, such as scientific instruments, that are vibration-isolated (shockmounted) and those involving vibrations with frequencies below those studied for blasting (less than 4 Hz). Examples of the latter are earthquakes or other teleseismic events such as nuclear tests.
Human Response to Vibrations
Whole Body Vibrations
Vibration effects on persons are also covered in the comprehensive RI 8507 (3). Three possible effects are of potential concern, in order of increasing amplitudes of motion: (1) perceptibility and startle (comfort), (2) proficiency boundary or activity interference, and (3) health and safety effects.
The American National Standard Institute {ANSI) addresses whole-body vibration concerns for the general population in ANSI S3.18-1979 {9). The ANSI guidelines are basically for steady-state rather than transient vibrations and address issues of health, task proficiency, and comfort (table 1).
4 8
Table 1.-Whole-body vibration (inches per second) tolerated by humans for 1-mln durations (after ANSI 83.18-1979 (9))
Frequency, Hz Comfort Proficiency Health limits
4 •••••••••• 1.40 4.40 8.80 ........... .70 2.20 4.40
20 .. ~ ....... .70 2.20 4.40

6
Persons in Buildings
ANSI recognized that people perceiving vibrations impacting buildings have different concerns than do persons performing a task or concerned with comfort and health within a vibration environment other than buildin~ (e.g., operating a vehicle). ANSI developed a separate standard for this case, which implicitly includes the factors of attitudes, fears of damage, and feelings of intrusiveness into a private situation (such as one's home). This standard is ANSI S3.29-1983 (!0). Here, people are not responding directly to the vibration, but to the structure's response to the vibration, including all the secondary effects such as window rattling, superstructure groans and creaks, and movement of loose items on shelves and pictures on walls.
Table 2 lists values of peak particle velocity for transient vibrations of less than 1-s duration for worst case combined vertical and horizontal motion.
Table 2.-Peak vibration levels1 (inches per second) tolerated by humans In buildings
[after ANSI 53.29-1983 (10))
Number of events per day ..... .
Critical structure (e.g., hospital) .. Residence, night •...•........ Residence, day .•............ Office or workshop ........... .
0.0050 .008 .50 .71
1Combined curve for frequencies of 8 to 80 Hz.
12 26
0.0027 0.0019 .0038 .0026 .25 .17 .35 .24
RI 8507 researchers noted that the chief concern of homeowners is fear that their homes are being damaged by the vibrations. Any vibration-produced structure rattling, including the already mentioned secondary effects, can fuel that fear. Where people are assured that damage is not going to occur, they will tolerate up to 0.5 in/s (table 2), at least during the day when ambient vibrations are also high. However, when their fears are not allayed, any perceptible rattling is a potential problem. Complaints would then be expected whenever the impacting vibration (outside-measured vibration) exceeds about 0.1 in/s and possibly when vibration is lower, under some conditions such as low frequencies. As will be discussed, airblasts can also produce structural vibrations and rattling and similar fears of possible damage.
The lowest values in table 2 are below the experimentally determined threshold of perceptibility, roughly 0.01 in/s. For these sensitive cases, any amount of noticed vibration could be judged unacceptable.
AIR BLASTS
Generation and Propagation
Blasting produces both groundborne e'1ergy (the ground vibrations discussed above) and airborne energy, called airblast overpressure or impulsive sound. As with ground vibrations, explosive charge size per delay and distances are important prediction parameters for airblasts. The degree of confinement of the blast is far more important for airblast than it is for vibration. The airblast wave front is also influenced by weather conditions, particularly wind and temperature inversions. For these reasons, airblast overpressures for a given charge and distance can vary by two orders of magnitude (a factor of 100). In a parallel effort to its mine blasting ground vibration studies, the Bureau also monitored airblasts and airblast-produced structur:il responses, summarizing its effort in RI 8485 (5).
Degree of Confinement
Although RI 8485 contains propagation curves for a variety of bbst designs, these are only approximately applicable to the Ayrshire mine casting blasts because of the importance of confinement on airblast generation. "Standard" surface mine blasts reported in RI 8485 and RI 8507 are echelon blasts or variations thereof. The Bureau has not studied the effects of casting on vibration and airblast.
As mentioned, confinement is important for controlling airblast. Generally, mining blasts have sufficient conimement to ensure that most of the explosive energy goes into breaking rock. Airblast is then primarily the result of rock motion through the piston effect of the forward or upward moving rock face. This is the air-pressure pulse discussed previously. When confrnement is insufficient or deliberately designed to be low, explosive products cart vent directly into the atmosphere, producing excessive airblast (overpressure amplitudes) and also a sharper, higher frequency sound. Mining examples of the latter situation are some parting blasts (in thin and hard rock layers), conventional bench blasts with seams of weakness or other easy paths for an explosive breakthrough, and secondary blasting such as mudcapping a boulder. Casting blasts are designed for good rock throw and, hence, have low confinement. Therefore, cast blasting can produce high airblast in two ways, through its strong rock throw, producing a high air-pressure pulse that is directional (strongest in front), and through the increased risk of direct venting or blowout conditions.

Figure 4 summarizes mining airblasts for three cases: (1) total confmement (deep burial), (2) mining highwall bench blasts, and (3) slightly confmed coal mine parting bL:;ts. Traditional cube root scaled distance is used to account for variations in charge sizes. Propagation equations for these curves are in table 3. Casting values would be somewhere between coal highwall and parting values.
Figure 5 summarizes all the mining airblasts and includes a minimum line representing total confinement and a maximum line for unconfmed surface blasts derived from a Ballistic Research Laboratories study (11). (This figure is adapted from RI 8485 figure B-5, which had an incorrectly plotted unconfmed line.) Most significant is the 'Wide range of measured values resulting from variation in confinement and undocumented weather influences. For instance, a 1,000-lb blast at 3,000 ft could produce from 0.00026 to 0.060 lb/in2 overpressure (99 to 146 dB). This is an enormous range of uncertainty for predicting airblast levels for a mining blast with only the knowledge of charge size and distance. When blast designs are known or fiXed, however, predictions are considerably improved, as shown by the reasonable standard deviation bars in figure 4.
c
~ ui a: :::l (/) (f) w a: a. a: w > 0 1-(f)
:5 Ill g; <
10'""'
Total confinement
CUBE ROOT SCALED DISTANCE. ft/lb113
151
141
131
121 Ill 't>
J w >
111 w ...J Cl z :::l
101 g
91
81
71 10,000
Figure 4.-Airblast propagation from surface mining, from Bureau Rl8485 (5).
7
Table 3.-Propagation equations for airblasts from mining-type blasts In figure 4 [from Rl 8485 {5)]
Type of blasting
Equation1
Parting . . . . . . . . AB 169 (DJW113)-1.623
Coal highwall . . . AB = 0.162 (OJW113) -
0•794
Total confinement AB = 0.061 (OJW113) -
0·956
NAp Not applicable. 1Where AB airblast, lbfin2
,
0 distance from blast, ft. and W weight of charge per delay, lb.
Weather Influences
Correia- Stand-tion ard
coeffi- error, cient pet
0.587 120 .739 88 NAp 130
Both RI 8485 (5) and ANSI S2.20-1983 (12) on explosions in air discuss the effects of weather conditions on the propagation of airblasts. Two atmospheric conditions are significant, temperature inversions and wind (direction and ~trenr-•t.. 1. Bot!:- ~r these conditions can· increase airblast leve11. aoove what would be normal at a given scaled distance. They do not produce additional airblast energy, but only affect its distribution.
In temperature inversions, warm air overlies cooler air. This is the reverse of the normal situation of steadily falling temperature with altitude up to about 35,000 ft (12). Under normal conditions, airblast ray paths are bent away from the earth's surface by the process of acoustic refraction (analogous to optical refraction of light). When an inversion exists, by contrast, these rays are bent downward in the inversion layer and can produce one or more focus points at large distances from the blast. A focus location 'Will be an area of abnormally high airblast, with a relatively silent zone between it and the source.
A review of cases in RI 8485 describes predicted inversion-produced sound intensifications of up to 3 times and averaging 1.8 times (5.1 dB) (5). An ANSI standard also reports some tests of atmospheric focusing and compares measured values with a linear probability distribution in its figure 20 (12). Tests showed a 1-pct chance of a two-times amplification above the standard curves.
Temperature inversions are common in the mornings and evenings as the ground surface and air heat and cool at different rates. This is one reason surface mines tend to blast near the middle of the day. The Du Pont Blaster's Handbook (13) has examples of inversion effects on airblast waves.
Wind is the second significant weather influence on airblast propagation. Both RI 8485 and ANSI S2.20-1983

8
"' 1 o-1 c
--.0
w a: :::> Cl) Cl)
w a:
.
. . . .
. . ... ..
· . .... . . . . . . . ··• .. . . . . .. . .. . . . .. .. .. .. . . · . . .. , .. . . .. .. ,., ..
· · · ._, • rr:-. •• . \t~-. .• • . ... ::-. ...... -.:: . : 0.. a:
...J w > w ...J
a z :::> 0 Cl)
w >
\ ••••• •t•:,· • :. ·: .. 9 't .$.. .... . ... : •• ..,.. : •• .J. ·-•• .,: ... ~ ·: ... 0
1-Cl) .,.,#. "'-). • • . " . •'.':.~·.:-.·. ···:
\ .. . .: ... . . .. <( ...J .. . . . . . . . .. co a: . . .. <( : . .
\Unconfined ...
. .
Total confinement 10-4L-~~~~~~~~~~~~~--~~~~~~~~~~~~~~~ 91
1 10 100 1,000 10,000 100.000
CUBE ROOT SCALED DISTANCE. ft/lb113
Figure 5.-Comblned mining airblast measurements for all sites, from Bureau Rl 8485 (5).
discuss wind effects. Examples of wind effects are 10- to 15-dB increases of sound level downwind compared with levels in cross- or no-wind conditions for close-in quarry blasts, and a change of the propagation decay exponent proportional to wind velocity (5).
Airblast Effects on Structures
Structural Response
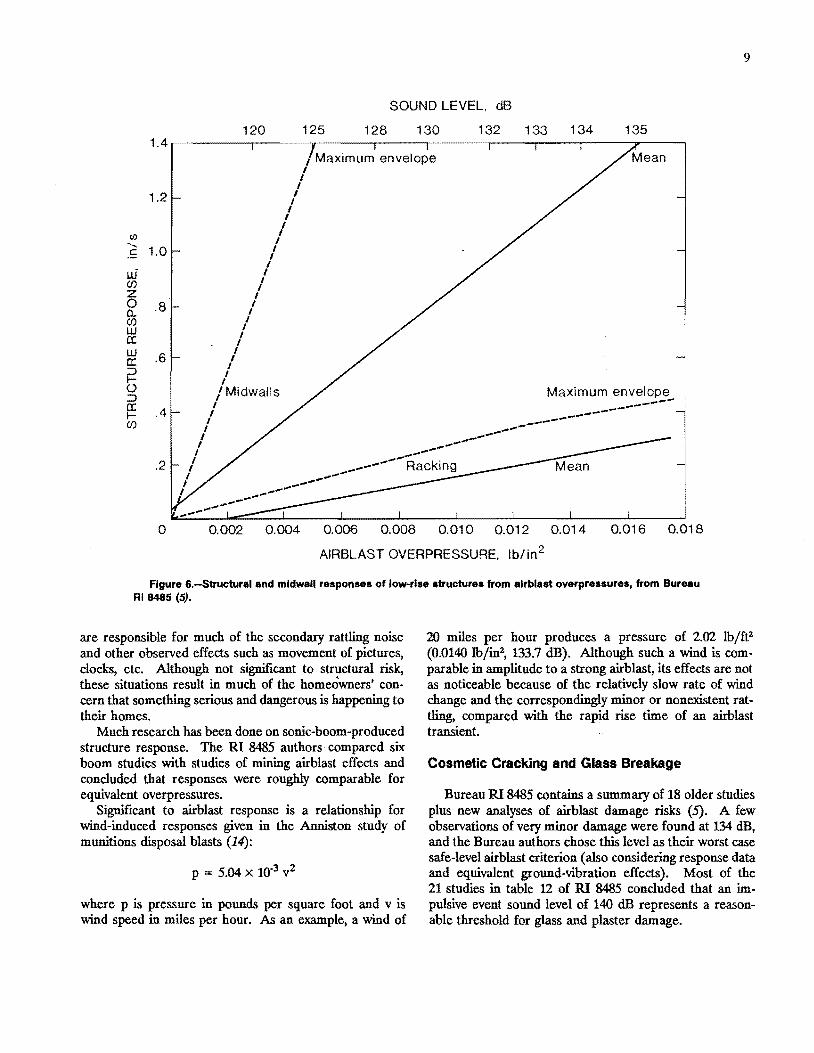
As with ground vibrations, airblasts can produce structure rattling and, in extreme cases, cracking and other damage. The Bureau summary airblast report, RI 8485, includes plots of residential structure response to airblasts for a variety of measurement methods (5). Figure 6 shows measured mean and maximum responses of structures to a variety of mining blasts for wide-band monitored airblast. "Wide-band" here means that these peak overpressures were detected by a system with a flat response from
0.1 to at least 500 Hz and unfiltered. This ensured that the resoonses were being compared with complete and undistorted airblast recordings.
Racking or whole-structure response is measured by corner-mounted transducers. Because cracking of structure walls results from strains in the plane of the wall, this type of response is directly related to significant damage potential. For mining blasts, worst case equivalencies between airblast overpressures and crack-producing groundvibration responses are that 0.0145 lb/in2 (134 dB, 0.1-Hz system) equals about 0.50 in/s (3, 5).
Midwall responses to airblasts are considerably greater than racking responses for a given overpressure. As discussed in detail in RI 8485, midwall response does not produce in-plane strains and is not significant in the cracking potential of structure walls, with the exception of windows. Indeed, cracking of window glass has been found to be the first indication of airblast damage, as discussed later in this report in the section "Airblasts." Midwall responses
9
SOUND LEVEL. dB
120 125 128 130 132 133 134 135 1.4
1 Maximum envelope I
I I
1.2 I I
I I
I (/) I
I ...... 1.0 I c I
I ui I (f) I
I z I 0 .8 I 0. I (f) I w I
I a: I w .6
I a: I
I ::> I 1- I () fMidwalls ::> a: .4
I 1- I (f) I
I I I
I
.2 I I
I I
I
0 0.002 0.004 0.006 0.008 0.010 0.012 0.014 0.016 0.018
AIRBLAST OVERPRESSURE. lb/in2
Figure &.-Structural and mldwall responses of low-rise structures from alrblast overpressures, from Bureau Rl 8485 (5).
are responsible for much of the secondary rattling noise and other observed effects such as movement of pictures, clocks, etc. Although not significant to structural risk, these situations result in much of the homeowners' concern that something serious and dangerous is happening to their homes.
Much research has been done on sonic-boom-produced structure response. The RI 8485 authors compared six boom studies with studies of mining airblast effects and concluded that responses were roughly comparable for equivalent overpressures.
Significant to airblast response is a relationship for wind-induced responses given in the Anniston study of munitions disposal blasts (14):
p = 5.04 x 10⁻³ v2
where p is pressure in pounds per square foot and v is wind speed in miles per hour. As an example, a wind of
20 miles per hour produces a pressure of 2.02 lb/ft2
(0.0140 lb/in2, 133.7 dB). Although such a wind is comparable in amplitude to a strong airblast, its effects are not as noticeable because of the relatively slow rate of wind change and the correspondingly minor or nonexistent rattling, compared with the rapid rise time of an airblast transient.
Cosmetic Cracking and Glass Breakage
Bureau RI 8485 contains a summary of 18 older studies plus new analyses of airblast damage risks (5). A few observations of very minor damage were found at 134 dB, and the Bureau authors chose this level as their worst case safe-level airblast criterion (also considering response data and equivalent ground-vibration effects). Most of the 21 studies in table 12 of RI 8485 concluded that an impulsive event sound level of 140 dB represents a reasonable threshold for glass and plaster damage.

10
Structural Cracking
Damage risk to structures, other than cosmetic plaster cracks and glass breakage, has not been of interest to airblast and sonic-boom researchers because ofthe extremely high overpressures required to produce such damage. Napadenski gives structural failure probabilities of 10 pet for the following cases (15):
Framed construction 1 to 3 stories .. 1.5-21b/in2 {174-177 dB) Low rise masonry .............. 1.71b/in2 {175 dB) Multistory steel construction ....... 3.5 lb/in2 {182 dB)
ANSI S2.20-1983 gives a structural damage criterion of about 0.25 lb/in2 (159 dB) based on zero replacement cost {12). The standard also. states that "claims for damages such as cracked concrete foundations or broken pipes (from airblasts] are invalid."
Human Response
The responses of people to airblast are very much like their responses to ground vibration. Again, the primary concern is the apprehension that damage could be occurring, which is fueled by structural response as noticed by the people in their homes. Complaints from citizens about blasting almost always involve persons experiencing the "vibrationM while in their homes rather than outside. Consequently, they are actually responding to the structure's rattling and groaning. In reality, people do not usually feel the direct ground vibration and sometimes do not even hear the direct airblast, which actually arrives about 1 s after the initial ground vibration for every 1,000 ft of source-to-receiver distance. For this reason blast researchers measure all three quantities (vibration: airblast, and structure response) on time-correlated multichannel systems. In this way, they can tell if and how much the structure responds to both the ground vibration and airblast. Figure 7 shows such a set of records from RI 8507 (3), with structure responses from both vibrations and airblast.
As an example, a long-range blast may produce noticeable airblast response. This airblast will be of very low frequency, with little energy above 5 Hz, because the atmosphere selectively attenuates the higher frequencies. Persons inside a house may not hear or notice the direct sound. However, the house has a natural vibration frequency near 5 Hz and will respond to the airblast and
0
Ground vibrolion,E-W
Ground vibration, N-S
2d-f1aor corner, low, E·W
2d-floor corner, low, N-S
1 sl-floor corner, mid-height, E -W
TIME, s
structure vibration amplitude,2.0 in/s I lAirblost amplitude,
0.01 lb/in2
Airblost outside
1.0
Figure 7 .-Ground vibrations, structure vibrations, and airblast from a coal mine highwall blast
produce a considerable amount of higher frequency secondary noise (rattling). The occupants, not hearing the direct sound, attribute the rattling (and even possible floor vibration) to ground vibrations. They do not realize that the low-level vibration arrived unnoticed 10 or more seconds earlier.

11
SITE DESCRIPTIONS
AYRSHIRE MINE
The AMAX Coal Co. Ayrshire mine is a surface mining operation about 10 miles northeast of downtown Evansville, IN (fig. 1). Like all such mines in the United States, Ayrshire uses blasting to break up the overburden rock to allow easy digging and removal. About March 1988, AMAX adopted cast blasting for the northern areas of its nearly 3-mile-long highwall. Shown in figure 8 are production blasts detonated during the Bureau's monitoring period from November 1, 1989, to January 3, 1990. A listing of blasts is given in appendix A.
Citizens objecting to the blasting vibrations are generally in communities behind the highwall in the westward direction. The open pit, spoils, and reclaimed land are all on the east side. Previous studies at the mine did identify it as a location having low-frequency vibrations toward the we~•.
Several previous Bureau studies were done at the Ayrshire mine. Some of the monitoring for RI 8507 (3) and 8485 (5) was in homes near this mine. The fieldwork phases for the blasting fatigue study, RI 8896 (7), and the blast design study, RI 9026 (6), were done there. It was also one of the sites studied in the 1987 survey of Indiana mines done for OSM and published in RI 9226 (4).
TOWN AREAS
General Description
The town of Daylight is the closest community to the west of the Ayrshire mine (fig. 1). This is a flat-lying area developed on old glacial lakebeds. Homes and commercial structures in Daylight range from newly built to 100 years old and are mostly one story tall. Typical hometo-blast distances are 2 miles.
McCutchanville is a suburb of Evansville, IN. It consists of a mixture of old and new homes, some quite large. The homes are up to three stories tall, and many are located on slopes. Virtually all of McCutchanville is heavily wooded and hilly, with a relief of about 75 ft. The McCutchanville homes range from 3 to 5 miles from the mine. A few of the homes are as close as 0.30 mile from the end of the most active runway of the Evansville Regional Airport, which has regular commercial jet service.
Scattered homes and farmsteads are also located along county and township roads. Northwest of the mine is an area labeled MBase Line Road site" in figure 1. The homes
in this area are closest to the pit's northern end, which is usually cast blasted and can have tight box cuts (with low relief and potentially higher vibrations). Also northwest of the mine is the Haubstadt School at about 10 miles (fig. 1). The school was monitored by AMAX for a short period as a result of complaints from the school staff that the blasting was noticeable and alarming. Figure 9 shows
Scale. ft
N
t
48
Figure 8.-Ayrahlre mine hlghwall showing blasts during Bureau monitoring program, November 1989 to January 1990. Blasts are listed In appendix A.

12
locations of homes monitored by the Bureau and additional seismic stations operated by AMAX.
Geology of Study Area
The near-surface geology of the OSM study area consists of Pennsylvanian shales and sandstones, with thin beds of limestone, clay, and coal of the McLeansboro and Carbondale Groups. These units are, in general, overlaid
LEGEND
~ Highwall position as ol 1-1-90
o Homes monitored. 11-89 through 1 -90
t> Other seismic stations
0 108
N
I 0 4.000
Scale. ft
[:,.
M.McCutchan
303 0
10700209
by loess in the bedrock-cored uplands surrounding McCutchanville. Lacustrine clays and silts occupy the flats near the Warrick County line and the Ayrshire mine to the northeast (figs. 10-11). Modern soils derived from these materials are fmc-grained, are composed mainly of siltand clay~sized particles, and are classified as a "silt loam" throughout much of the area (16-17). A generali7.ed cross section through McCutchanville and the Ayrshire mine is illustrated in figure 11.
0
215
0 105
[:,.
Cissell
[:,.
21
t; C. Bohrer
0 t; 334 15
[:,.
16
£::. 19
Figure 9.-Monltored homes (three-digit numbers) and additional seismic stations west of the Ayrshire mine hlghwall. C. Bohrer, M. McCutchan, Clssel, and two-digit numbered stations are AMAX monitoring locations.

0 4
LEGEND
Figure 10.-Generallzed map of aurface geology In Evanavllle, IN, area and deacrlptlona of unconsolidated deposita. The location labeled "McCutchan• Ia modern-dey McCutchanvllle (17).
13

14
F"EET ABOVE SEA LEVEL
600
0 2
Scale, miles
f'E(T A80'1( SEA LfVEL
000
Rgure 11.-Generallzed geologic cross section of McCutchanville area (1).
Reference 16 describes-three levels of local landscape called the upper, middle, and lower surfaces. The upper surface generally corresponds to the presence of the West Franklin Limestone Member of the Shelburn Formation, which forms narrow ridgetops with steeply sloping sides. The middle surface is related to the underlying shale of the Shelburn Formation, which forms the gently sloping flanks adjacent to the upper surface. The relatively flat lower surface is formed of lacustrine deposits of a deeper basin cut into the shale. This basin is referred to as the "lake plain."
The unconsolidated soil materials in the study area range in thickness from less than 10 ft at some upper and middle surface locations to greater than 80 ft in the lower surface. The soil profile in the upper surface generally consists of modem soils containing a fragipan overlying loess. The loess may be composed of upper and lower units, which in turn grade downward into a sandy loam or shale. The transition to bedrock is commonly abrupt. The weathered material just above the contact reflects the variable composition of the underlying West Franklin bedrock unit. The soil materials in the middle surface exhibit a transition with less loess and a thicker shale. This is interpreted to be the result of a thickening wedge of sheetwash sediment forming the slope below the upper surface because of weathering and erosion. Fmally, the soil profile in the lower surface consists of deep, gleyed modem soils overlying large-scale sedimentation units composed in general of clay and silty clay, silt, sand, and silty clay in turn (16).
As part of the OSM study, the Indiana Geological Survey drilled and sam pled the unconsolidated soil materials at a number of locations throughout the study area (16). The soils were described and classified using U.S. Department of Agriculture (USDA) terminology and grouped for engineering purposes according to the Unified Classification System. Five holes were drilled near structures
monitored by the Bureau. Table 4 contains a summary list of sample intervals and associated engineering group names for each location. The USDA system was used to describe the soil at house 334 because the engineering data were unavailable.
Table 4.--Soll types encountered at Bureau test houses
Depth, ff Soil group Depth, ff Soil group
House 105: House 209-Con.: 0.8 to 1.3 lean clay. 6.0 to 6.9 ... Silt. 1.7 to 2.2 Fat clay. 6.9 to 8.7 ... Lean clay. 2.5 to 3.0 Lean clay. 8.7 to 10.7 .. Fat clay. 4.5 to 5.0 Silt. House 215: 7.0 to 12.0 .. Lean clay. 0.2 to 0.6 Lean clay.
House 108: 1.3 to 1.8 Fat clay. 0.8 to 3.0 Lean clay. 2.8 to 6.4 Lean clay. 3.5 to 4.0 Lean clay 5.0 to 10.0 .. Loess?1
with sand. House 334: 4.5 <.; 5.0 Sandy lean 0.0 to 7.7 Silt loam.
clay. 7.7 to 8.5 Silty clay 5.3 to 8.2 Fat clay. loam. 9.5 to 11.5 .. Lean clay. 8.5 to 9.2 Clay.
House 209: 9.2 to 9.5 Loamy sand. 1.0 to 6.0 ... Lean clay.
1Most of sample lost.
SELECllON OF HOUSES FOR STUDY
A review was made of the 115 homes inspected and catalogued by OSM. Of these, 16 were selected as candidates for instrumenting and preliminary level-loop surveying (fig. 12). Selection criteria were based on representative samples for both damage condition and location. Regular accessibility was important for both damage inspections and access to instrumentation. Ic McCutchanville, two homes were selected that were located on east-facing slopes (toward the mine), for maxi.ID.Um. airblast-induced structure responses. The full 2-month inspection and

Figure 12.-survey crew performing level-loop analysis.
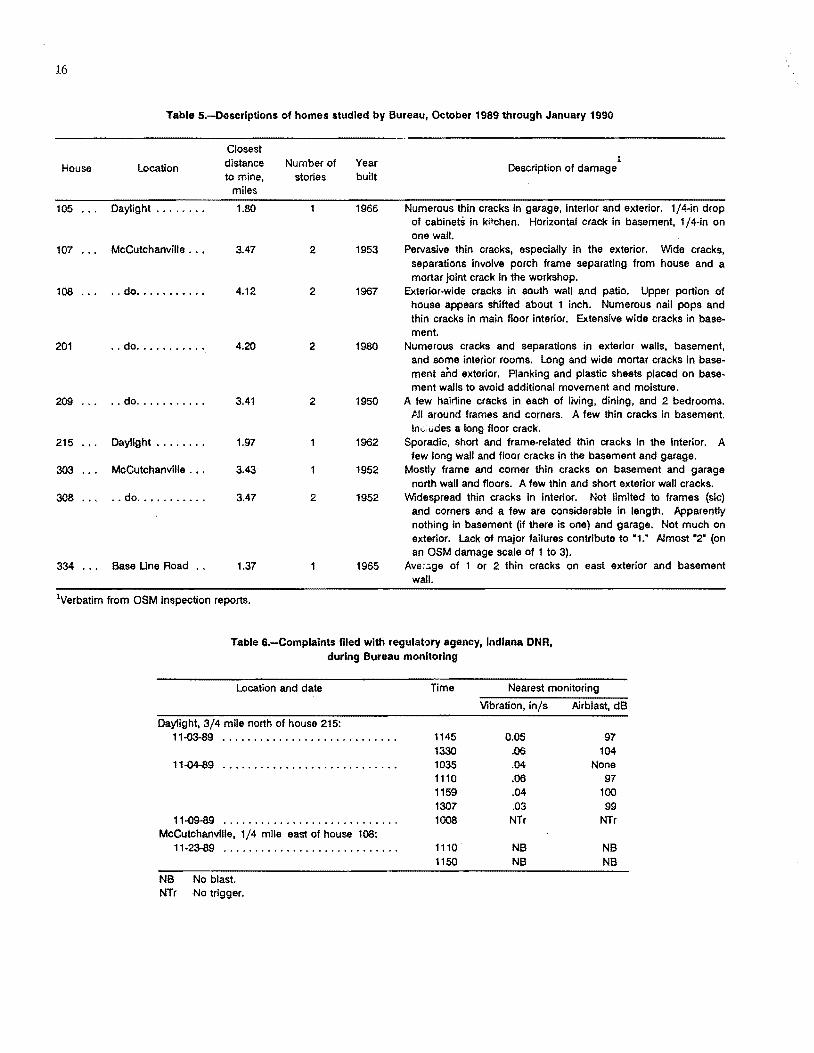
monitoring program was done for six homes, three of which were in McCutchanville. One additional home (108) had been under constant monitoring by the Indiana Department of Natural Resources (DNR), and during the study, two additional McCutchanville homes with serious cracking were given walk-through inspectiom;. Table 5 describes the nine homes studied. Locations of the homes relative to the highwall are shown in figure 9. All homes except 107 had concrete block basements, although some homes had parts of their upper stories on footings. Home 107 is particularly complex, with part over a basement and part on footings. It was built in stages with different foundations and also an added second story.
CITIZENS' CONCERNS AND COMPLAINTS
Some homeowners near the mine have been concerned about the Ayrshire mine blasting, and there is no question
15
that many homes, particularly in McCutchanville, have extensive cracks. Because blasting produces occasional house rattling, some citizens have attributed the cracking to the blasting and are complaining accordingly. The Indiana DNR report listed all complaints between September 1, 1988, and May 30, 1989, a period of 296 Ayrshire mine blasts, and noted that 36 pet of complaint times did not match blasting times (1).
Generally, there was no indication from the complaints about the severity of the "event" and also no monitoring near enough to provide a vibration or airblast to compare with the noticed "event." There was a lack of existing airblast recordings. This made it impossible to obtain a complete analysis because of airblast variability with regard to focusing, topography, and different shot-to-shot practices. Without monitoring, there is generally no way to tell if ground vibration or later arriving airblast is shaking the homes, and no citizens reported two distinct arrivals with enough separation to correspond to the two different events. There are a few cases in which noticed or recorded blasts are not from the Ayrshire mine, but rather from the much farther Peabody Coal Co. Lynnville mine at about 9 miles. This very long range propagation is airblast, as shown by two events of 121 dB recorded by the DNR, once each at two different McCutchanville sites, on September 19, 1989, at 0915 (09:15am) and October 17, 1989, at 0803.
Some homeowners claim that all damage occurred since cast blasting was begun (March 1988), while at least one stated that some cracks were older than 3 years (pre-1988). A neighbor near house 334 stated that the blast of November 6, 1989, at 1110 was the "worst ever." That blast generated a peak vibration of 0.092 in/s and 102 dB at the nearby monitored structure, far below any historical levels of concern for damage.
Bureau personnel examined complaint data from the period preceding its own monitoring because of claims that blasting had previously been more severe. There is a lack of a recognizable pattern to the complaints. Some complaints received were from large distances: downtown Evansville, Eastland Shopping Mall, and the town of Haubstadt. For at least one of these complaints, there was no blast at any of the local mines.
In addition to comments made to Bureau researchers, the DNR received a few complaints while the Bureau was monitoring. Table 6 lists those events and the vibrations recorded at the nearest monitored structure.
16
Table 5.-Descrlptlons of homes studied by Bureau, October 1989 through January 1990
Closest
House Location distance to mine,
miles
105 . . . Daylight ..•.•... 1.80
107 . . . McCutchanville ... 3.47
108 . . . . . do .••..•••... 4.12
201 .. do .•....•••.• 4.20
209 ... . . do ........... 3.41
215 Daylight .......• 1.97
303 McCutchanville .•• 3.43
308 .. do .•......... 3.47
334 . . . Base Une Road .. 1.37
1Verbatim from OSM inspection reports.
Number of Year stories built
1966
2 1953
2 1967
2 1980
2 1950
1962
1952
2 1952
1965
l Description of damage
Numerous thin cracks in garage, interior and exterior. 1/4-in drop of cabinets in kitchen. Horizontal crack in basement, 1/4-in on one wall.
Pervasive thin cracks, especially in the exterior. Wide cracks, separations involve porch frame separating from house and a mortar joint crack in the workshop.
Exterior-wide cracks in south wall and patio. Upper portion of house appears shifted about 1 inch. Numerous nail pops and thin cracks in main floor interior. Extensive wide cracks in basement.
Numerous cracks and separations in exterior walls, basement, and some interior rooms. Long and wide mortar cracks in basement and exterior. Planking and plastic sheets placed on basement walls to avoid additional movement and moisture.
A few hair!ine cracks in each of living, dining, and 2 bedrooms . JIJI around frames and corners. A few thin cracks in basement. lno:;;udes a long floor crack.
Sporadic, short and frame-related thin cracks in the interior. A few long wall and floor cracks in the basement and garage.
Mostly frame and corner thin cracks on basement and garage north wall and floors. A few thin and short exterior wall cracks.
Widespread thin cracks in interior. Not limited to frames (sic) and corners and a few are considerable in length. Apparently nothing in basement (if there is one) and garage. Not much on exterior. Lack of major failures contribute to "1." Almost "2" (on an OSM damage scale of 1 to 3).
Ave~::;.ge of 1 or 2 thin cracks on east exterior and basement wall.
Table &.-Complaints filed with regulatory agency, Indiana ONR, during Bureau monitoring
Location and date Time Nearest monitoring
Vibration, in/s Airblast, dB
Daylight, 3/4 mile north of house 215: 11-03-89 .....................•.•.... 1145 0.05 97
1330 .06 104 11-<)4-89 1035 .04 None
1110 .06 97 1159 .04 100 1307 .03 99
11-09-89 ...................••....... 1008 NTr NTr McCutchanville, 1/4 mile east of house 108:
11-23-89 .........•.........•.....•.. 1110 NB NB 1150 NB NB
NB No blast. NTr No trigger.

17
ANAL VSIS AND FINDINGS
VIBRATION AND AIRBLAST
Monitoring
The Bureau's monitoring and inspection program is summarized in table 7, and instrument characteristics are given in table 8. Six homes had Bureau-owned selftriggered seismographs with airblast channels. A seventh home (108) had been monitored by the Indiana DNR since February 1989, and those data were also supplied to the Bureau. An OSM-loaned seismograph was used at house 209, as a backup. Additionally, one home each in Daylight (105) and McCutchanville (209) was monitored with seven-channel tape systems, which allowed measurement of structure response while also serving as wide-band backups for the seismographs. The self-triggering seismographs were in continuous operation for the monitoring period; however, the two tape systems required operators a ....... were run for a sampling of blasts.
Figures 13 and 14 show the vibration sensors, high-gain integrating signal conditioning amplifiers, and sevenchannel FM tape recorder in place, plus seismographs and a digital oscilloscope for data retrieval at one of the monitored houses. Ground-vibration transducers were either mounted on the inside of the foundation at ground level or buried next to the foundation, depending on
outside accessibility. Bureau studies of vibration monitorlog procdures found that exact locations were not critical for low vibration levels (18). Airblast microphones were mounted high up on the house walls facing the mine and under the eaves (fig. 15).
Structure responses were measured at two of the homes by pairs of horizontal transducers mounted high up in the structural corners facing the mine. At one house, 209 in McCutchanville, midwall responses were also measured. Time correlation of recordings allowed determination of the relative impacts of vibration and airblast.
Most of the project emphasis was on measuring blastproduced vibrations and airblasts and analyzing their impacts. However, the scope of the project also called for comparisons between blasting and other sources. It was immediately evident, upon working in some of the homes, that aircraft operations at the nearby Evansville airport r.ause structural rattling that can be both felt and heard. In addition, the houses are often rattled by normal human activities such as walking, jumping, and door closing. Recordings were made of such activities primarily affecting superstructure vibrations. In general, seismographs with buried or foundation-mounted transducers are not triggered by such activity. All blast vibration data collected by the Bureau are in appendix B.
Table 7.-Monltorlng and Inspection of Evansville area homes by Bureau, October 1989 through January 1990
House Location Settlement1 Vibration Regular Structure Visible and airblast cracks response damage
105 ~ ... Daylight .•....•. X X X X 107 McCutchanville ... X X X xz 1083
•••• . . do .•.....•... X X
201 .. do ..........• 209 .. do ...••....•• X X X xz 215 Daylight •.••••.. X X X
303 McCutchanville ... X X X 308 .• do ...•...••.. 334 Base Une Road .. X X X 12 level-loop surveys. zA few measurements were made with a backup seismograph. 3Monitoring by Indiana DNR
Instrument
Recorder ......... .
Seismograph (ST -4) ..
Table 8.-Biast monitoring equipment for Bureau study
Item measured
Vibration and structure response Airblast .................... . Vibration .....•.............. Airblast •....................
System dynamic range
0.0020 to 0.40 in/s ......•.•........ 0.000052 to 0.02 lbfin1 (85 to 137 dB) .• 0.01 to 1.0 injs •................... 0.02 to 1.4mb (100 to 137 dB) ....... .
X X X
X X X
X X X
Frequency response, Hz
- 1,000 .1 -16,000
1 200 5 • 200

18
Figure 13.-Vibratlon monitoring system in house 209, IncludIng digital oscilloscope for data retrieval (right) and sevenchannel FM recorder (left).
Figure 14.-VIbratlon transducers In basement corner of house 209, at ground level. The larger cylindrical and square seismograph transducers contain three geophones each.
Historical Blasting Data
In addition to collecting new vibration data, Bureau researchers obtained many peak values and a few records for historical blasts, defined here as any prior to November 1, 1989. Some residents claimed that they experienced excessive vibrations on certain dates or during certain periods of time, and researchers sought as much information on these events as was available. The Indiana DNR report contained a great amount of information up to the spring of 1989 (1). The DNR also provided additional records from its continual monitoring at house 108.
Figure 15.--Rear view of house 209 showing height and micro· phone placement.
AMAX was asked for much information; however, most of its monitoring was at compliance seismographs closer to the blasts than were the homes of the complainers. AMAX complied with requests for information from its monitoring program, although few airblast data were available.
The historical data were divided into three sets, corresponding to the three distinct directions from the mine: southwest toward McCutchanville, west toward Daylight, and northwest toward Base Line Road and Haubstadt. Depending on the blast location, a particular monitoring station would belong to one case or another at different times. For example, the station at Cissell's (fig. 9) is in a western direction for blasts along the southern half of the highwall, but southwest for far-north blasts, or approximately in line with McCutchanville. The general idea was to prepare three propagation plots corresponding to the

three distinct directions, with measurement locations approximating linear arrays. Tables in appendix C list all the historical data values.
Ground Vibrations
Waveform Analysis
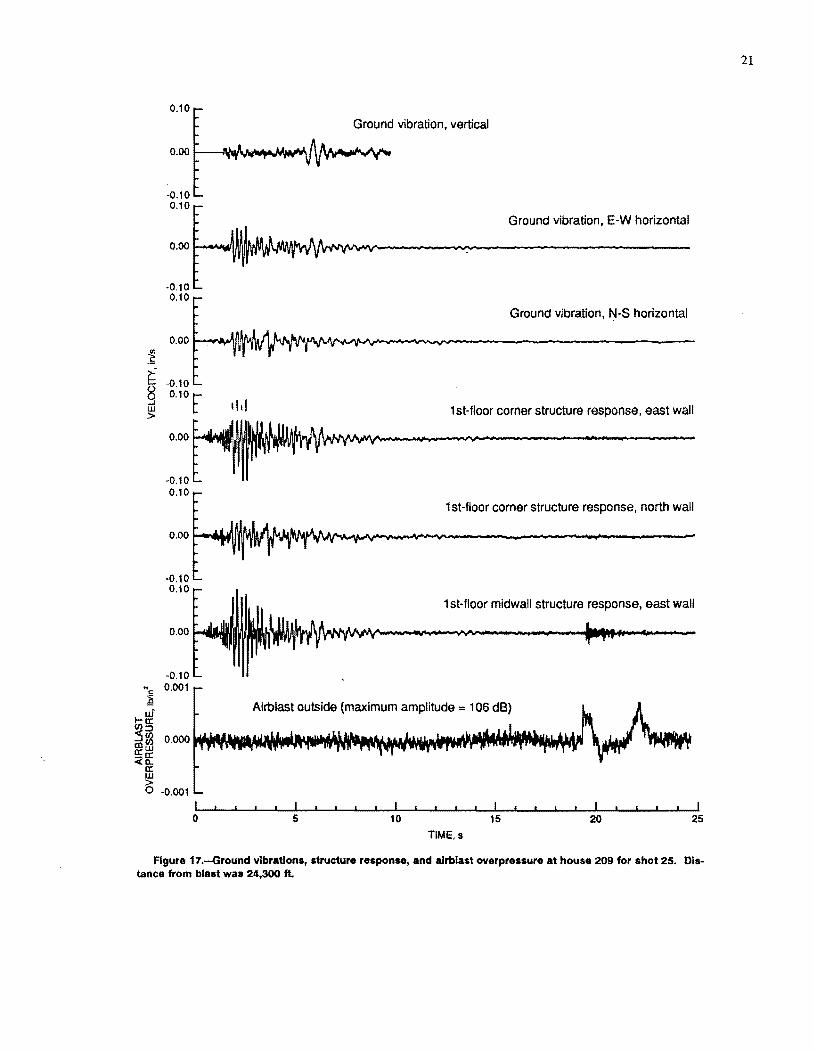
A time-correlated set of the vibrations recorded at house 105 is given in figure 16, and a set for house 209 is presented in figure 17. Both sets of time histories are from blast 25, a cast-blast design detonated on November 22, 1989, at 1116. House 105 was 10,250 ft (1.9 miles) from the blast, and house 209 was at a distance of 24,300 ft ( 4.6 miles). This blast produced one of the largest ground vibrations recorded during the Bureau's monitoring period and is representative of a "worst case" vibration for this study. The vibration waveforms were recorded on the seven-channel FM recording systems described earlier, except for the vertical ground motion in figure 17, which is an ST-4 seismograph record. The first-floor vibrations are discussed in the "Structural Vibrations" section later in this report.
Seismic waves from blasting contain several different types of waves; the most common are P-, S-, Rayleigh, and Love waves. P- and S-waves are commonly called body waves because they penetrate deepest into the earth. Rayleigh and Love waves propagate mostly in the near surface rock strata and are hence often called surface waves. The wave types have theoretically distinct directional characteristics and can sometimes be identified by comparing and contrasting the time histories recorded on the three individual components of ground motion.
Shot 25 was located about 1'7" to north from the eastorientated longitudinal or radial ground-motion transducer at house 105. Considering the large distance involved between the shot and house, the record presented in figure 16 should give a good representation of the true directional characteristics of the ground vibration.
The frrst arrival on the vertical and radial components signals the P-wave arrival. The peak amplitude phase (i.e., wave part that contains the peak amplitude) from shot 25, arriving about 2.1 s after the frrst P-wave arrival, is dominant on the vertical component and can also be identified on the radial component of motion. These directional characteristics, low-frequency content, and relative arrival time suggest that the peak amplitude wavelet is part of a Rayleigh wave. Rayleigh waves are created by the sharp acoustic impedance found at the interface between the surface of the earth and the atmosphere. They travel at speeds of about nine-tenths of the shear wave velocity of the substratum for longer wavelengths, and at speeds of the uppermost geologic layers for shorter wavelengths ( 19).
19
The actual wavelengths of the shot 25 vibrations were not measured as part of this project and are difficult to estimate because of the complex seismic velocity structure of the area, which has not been sufficiently characterized.
The small-amplitude S-wave arrival on the transverse component is indicated on figure 16. The subsequent lower frequency, higher amplitude wave packet may be identified as the Love wave. Love waves are usually dominant in the transverse direction and arise from seismic energy that is. trapped in a layer bounded by two interfaces of high acoustic impedance, such as a low-velocity surface layer situated over much higher velocity strata. This type of geologic condition exists in the McCutchanville-Daylight area· and is generally typical of the southwestern Indiana ~.:oal region. Love waves travel at the shear wave speed of the lower medium for large wavelengths. Based on the differences in arrival time, it appears that Love waves travel faster than Rayleigh waves between the mine and Daylight.
For house 209, shot 25 was positioned about 39° to the north of the east-orientated radial ground-motion sensor. This rotation may be too great to allow for proper waveform identification since ground motion will not be distinct in the radial or transverse directions relative to the blast. For example, the distinct separation of P- and S-wave arrivals inferred from the differences in the radial and transverse records, respectively, at house 105 is not evident in the recording from house 209.
As the distance from the blast becomes greater, the differences in wave speeds and seismic travel paths cause the duration of the ground vibration to increase. Wave amplitudes (particle velocities) decrease with increasing d; ,tance through geometric spreading and absorption. The frequeTJcy content is generally shifted to the lower end of the spectrum, as high frequencies are more readily attenuated than low frequencies, although particular site characteristics will also influence the waveforms.
The ground vibrations at house 209 (fig. 17), located in McCutchanville at a distance of 4.6 miles from the blast, last perhaps twice as long as (or more) those observed at house 105 in Daylight, about 2 miles from the blast. Peak amplitudes are about half at house 209 as at house 105, but dominant ground motion is now located on the horizontal components and not associated with the Rayleighwave phase as before. The peak vertical ground motion at house 209, which is mimicked in the radial component, is probably Rayleigh-wave vibration. Also, the character of the early portion of the radial component at house 209 is very similar to the Love-wave phase identified on the transverse component at house 105. Perhaps the Love wave travels more efficiently than the Rayleigh wave and its motion is being recorded more on the radial than the transverse component because of the large orientation

20
0.10
0.00
-0.10
0.10
0.00
-0.10 0.10
~ r;
0.00 (.)
9 w >
-0.10 0.10
0.00
-0.10 0.10
0.00
"'c: 0.003 ~
l-ui wcr:
Airblast outside (maximum amplitude= 117.5 dB)
:s=> Ill ~ 0.000 ~-----V"'-----------"" cr:w <g:
cr: w e> -0.003
0 5 10
TIME,s
Ground vibration, vertical
Ground vibration, E-W horizontal
Ground vibration, N-S horizontal
1st-floor corner response, east wall
1st-floor corner response, north wall
15 20
Figure 16.-Ground vibrations, structure response, and airblast overpressure at house 105 for. shot 25. For ground motions, •p• Is P-wave arrival, •s• Is shear wave, 'R" Is Rayleigh wave, and "L" Is Love wave. Distance from blast was 1 0,250 ft.
0.10
Ground vibration, vertical
0.00
-0.10 0.10
Ground vibration, E-W horizontal
0.00
-0.10 0.10
Ground vibration, N-S horizontal
0.00
~ ~ -0.10 § 0.10r
•ld L.U > 1st-floor corner structure response, east wall
0.00
-0.10 0.10
1st-floor corner structure response, north wall
0.00
-0.10 0.10
1st-floor midwall structure response, east wall
0.00
Airblast outside (maximum amplitude = 1 06 dB)
-0.001 I 0 5 10 15 20 25
TIME,s
Figure 17.-Ground vibrations, structure response, and alrblast overpressure at house 209 for shot 25. Distance from blast was 24,300 fl
21

22
angle of 39° between the radial direction and the shot. Additional studies, designed to specifically look at surface wave generation and propagation, are needed to better understand these observations from a seismological standpoint.
Because of their low-frequency energy and efficient propagation, surface waves offer a greater potential for structural damage than do close-in body waves. An extreme example is seen in the 1985 Mexico City earthquake, which had a measured acceleration of 0.2 g at 0.5 Hz. This converts to a 25-in/s velocity and nearly 8-in peak displacement in the low-velocity near-surface strata. Because surface waves also result from blasting, further research regarding their characteristics would help to control blast vibrations.
Vibration Amplitudes
Peak ground-vibration and airblast overpressure amplitdes were obtained by the Indiana DNR and Ayrshire mine during the 9-month period from October 1988 to June 1989. These were used in conjunction with recently collected Bureau data (November 1989 to January 1990) to construct propagation plots in three directions for the McCutchanville-Daylight area: the McCutchanville direction, trending southwest from the mine; the Daylight direction, trending west from the mine; and the Base Line Road direction, trending northwest from the mine. This gives a "historical" perspective of the vibrations during this period and a comparison to "current" measurements, as well as some inferences to the seismic propagation characteristics of the area.
Historical Data-Propagation Plots of Vibration Amplitudes
Figure 18 shows the relation between square root scaled distance and peak ground-vibration particle velocity. This scaled distance is used so that the data presented can be easily compared with previously published Bureau research data. The positions of the recording stations are fixed, so changes in the scaled distance arise from different shot locations along the highwall and from changes of the charge weight per delay used in the blast design. A peak value represents the highest amplitude particle velocity for all three components so that only one peak value is used from a station for a particular blast. Peak amplitudes were usually, but not always, horizontal components. Peak vibration levels measured from houses monitored by the Bureau during the study period are included with the historical data. The ground-vibration sensors were aligned
so that the radial direction was eastward, in the direction of the mine; they were not realigned to adjust for shot relocation along the north-south-trending highwall. Because of the large distances between the shot and recording stations, imprecise directional alignment of ~he transducers did not greatiy affect peak-level measurements. Data for house 108 was collected by the DNR during the time of the Bureau's monitoring. The values of the plotted vibration amplitudes are given in appendixes B and C.
The propagation lines from RI 9226 in figure 18 are the least squares regression fit to peak-production-blast amplitudes recorded from an earlier study at the Ayrshire mine (4). The data were obtained from an east-west array of seismic stations that extended from close in to the blast to about 6,000 ft west of the highwall in the Daylight direction. These lines are included as reference, and extrapolation to larger scaled distances may not be appropriate.
Figures 18A and B, representing the McCutchanville and Daylight directions, respectively, show very good correlation between the RI 9226 line and the- h!stodnl d~ta. Peak particle velocities in the McCutchanville direction are between 0.25 injs at a scaled distance of 90 ft/lb112 and 0.02 in/s at 900 ft/lb112• In the Daylight direction, historical peak levels range from 0.8 in/s at a scaled distance of near 4D ft/lb112 to 0.06 in/s at about 250 ft/lb112
• Because of the narrow range of scaled distances involved, the clata are quite clustered, but where scaled distances overlap, the peak levels are similar. The Bureau monitoring data show consistently lower particle velocities than do the historical data at similar scaled distances in both directions. Part of this difference is that ihe "scaling" of distance assumes that no significant changes in wave type occur. There is no question that surface waves attenuate more slowly than body waves, and comparisons over extreme absolute distances results in a departure from linearities in amplitude versus propagation.
The propagation plot for the Base Line Road direction, figure 18C, indicates particle velocities that are somewhat higher than expected for the historical data, compared with plots for the other two directions. Peak levels were observed from about 1 in/sat a scaled distance of approximately 65 ft/lb112 to 0.03 in/sat a scaled distance of about 1,000 ft/lb112
• The series of crosses to the far right of the graph represent the Haubstadt School, about 10 miles away from the blasts. Peak particle velocities of 0.02 to 0.05 in/s recorded at this site are above what would be expected at such a large distance. Ground resonance near the characteristic frequency of the earth in this area may explain this unusual occurrence, or there may simply be a problem with using scaled distance analysis because of the large distances.

.~ ~ g -' w > UJ 0.1 -' (.)
~ <( 0.. :.:: <( UJ 0..
+
A
KEY
+ Historical data
o Bureau monitoring
- AI 9226 site 6
+ it
+ * + .. ++ + ++ ++ * .. +o
+o+*+ + .g ~ +
6> Jl ~ of &
00 0 0 0
23
0.1
8
0.01 '-----~~~~--'------~--.............. 0.01 '-----~~~~~-'----~-~ ........ ~-........ 10 100 1,000 10 100 1,000
~ ~ (.)
0 -' UJ > UJ -' (.)
~ 0:: <( a.. :.:: <( w a..
0.1
SQUARE ROOT SCALED DISTANCE. ftllb "2
c
SQUARE ROOT SCALED DISTANCE, ft/lb 112
+ +
SQUARE ROOT SCALED DISTANCE. ftllb 112
Figure 18..-Historical and recent Bureau data l)n peak particle velocity in three directions of measurement: A, McCutchanville or southwest; B, Daylight or west; C, Base Une Road or northwest
The plot of the historical data in the Base Line Road direction suggests a different type of seismic propagation, relative to the Daylight and McCutchanville area, because of the higher peak levels observed at common scaled
distances and because of the vibrations recorded at the Haubstadt School. The Base Line Road and McCutchanville plots represent many of the same blasts or ones that have a basically similar design, so differences in blast

24
design do not appear responsible for the amplitude differences. In-depth blast design analysis was not part of the project, so this conclusion is speculative. Again, the Bureau's recent measurements in the Base Line Road direction (house 334 only) are comparatively lower than the historical peaks but, contrary to the historical observations, are very similar to the peak values obtained in the McCutchanville area.
For all three directions, the peak particle velocities from the recent Bureau monitoring project appear to be consistently lower than the historical data, based on scaled distance. Because of the extrapolation involved in these comparisons, it is possible that the scaled distance relationship is breaking down (shift of peak frequency at extreme distances causing constructive interference or selectiveness of surface. waves through extreme distance attenuation). For such comparisons, absolute-distancebased values are needed; however, historical data do not exist that correspond to the distances studied here.
Bureau ot Mines Data-Propagation Plots of Vibration Amplitudes
Figure 19 shows the specific results from all of the shots recorded by the Bureau from November 1989 to January 1990, with each house identified by a separate symbol. House 334, previously included in the Base Line Road direction (figure 18C) is grouped with the Daylight data in figure 19. Data recorded by the tape systems were used where available; otherwise, peak levels were obtained from the less accurate ST 4 seismograph recordings. The regression line from RI 9226 site 6 (Ayrshire mine) is again included for reference.
The maximum peak ground-vibration level recorded was about 0.1 in/s in the Daylight area and 0.06 in/s in the McCutchanville area. The McCutchanville data (fig. 19) are clustered from a scaled distance of about 300 to 650 ft/lb112 and the Daylight data from near 90 to 300 ft/lb112• The peak values overlap at the common scaled distance of 300 ft/lb112 and are near or lower than the reference given by the RI 9226 study. Relative position of the blast in conjunction with the particular differences in site characteristics (surface geology, physical characteristics of the house, etc.) can most likely account for the slight differences in peak particle velocity within an area. In general, the peak ground-vibration amplitudes were a bit higher than would be expected at the relatively long distances to Daylight, McCutchanville, and Haubstadt, but are still very low compared with historical damage thresholds of 0.5 to 2.0 in/s.
"' 1; ~· 0 0 _)
w > w _)
£.1 I-a: ..: a_ ~ ..: u. a_
0.1
McCutchanville . om
10 100
0.1
Daylight
Kt='Y
0 House 107
+ House 108 D House 209
b. House 303
- Rl 9226 site 6
0 D
0+ 0+
~-~ 0 0 o oo
0 b.D b. b. Do
D
KEY
0 House 105
o House 215
b. House 334
- Rl 9226 site 6
1,000
0.01 '---~-~~-~....,_ _____ _,_......_ ......... 10 100 1,000
SQUARE ROOT SCALED DISTANCE. ftllb 112
Figure 19.-Bureau data on peak particle velocity for homes monitored In McCutchanvllle and Daylight.
Vibration Frequencies
Figure 20 depicts frequency versus peak groundvibration particle velocity levels in McCutchanville and Daylight. The frequencies were obtained from the groundvibration time histories and calculated as the inverse of the period (in seconds) of the corresponding peak velocity wavelet. The curve in the upper left-hand corner of each

<J)
:s ~-()
g UJ > UJ _J ()
i= rr. <1: Q_
~ Q_
01
0.1
Drywall
... ............ !:I .. '!~!?! ... J··''
0 D
0
Drywall
' ' Plaster ,' ________ ..,.., __ ,
D
KEY
0 House 107
D House 209 A House 303
McCutchanville
KEY o House 105 D House215 A House 334
Daylight
0.01 L------~....._ ....... .....__........._ _______ ~-............J
1 10 100
FREQUENCY, Hz
Figure 20.-Peak particle velocity and associated frequency for Bureau monitoring In McCutchanvllle and Dayllghl Dashed lines In upper left are from appendix B of Rl 8507 and represent safe limits recommended by the Bureau (3).
plot is the recommended Bureau limit from appendix B in RI 8507, which relates threshold damage levels to frequency and peak ground-vibration particle velocity (3). No frequency data were available for house 108.
The ground vibrations in McCutchanville (fig. 20) had a narrow frequency range. Most frequencies were between 4 and 8 Hz, with highest velocity observations (0.03 to 0.06 in/s) occurring at about 5Hz for houses 209 and 107.
25
A few vibrations had frequencies below 4 Hz, accounting for their unusual perceptibility. House 303 is not in the immediate vicinity of houses 209 and 107, which may account for the different peak velocities (i.e., the site characteristics are different). All vibration amplitudes are well below Bureau-suggested limits. Because of the nature of the distribution of peak level frequencies, the characteristic frequency of the ground in this area may be around 5 Hz.
The Daylight data in figure 20 show a frequency range from about 3.5 to 20 Hz, which is broader than the range for McCutchanville. Peak velocity levels of 0.1 in/s occur at about 5 Hz for house 105 and about 11 Hz for houses 215 and 334.
Considering the frequency characteristics observed in the study area, the homes in McCutchanville should experience a greater amount of narrow-band, lower fre-
. quency vibrations than homes in Daylight. This condition probably occurs because of the large distances from the blast and also because of the influence of local geology (and possibly topography). The peak vibration frequencies are concentrated near 5 Hz, which is close to the natural frequencies of larger homes, making these ground vibrations more noticeable.
Natural Seismicity in Study Area
On June 10, 1987, a 5.0 magnitude earthquake occurred in southeastern Illinois that was recorded by portable seismogro.phs located in Daylight. Earthquakes usually produce lower frequency and longer duration events than does blasting and therefore pose a greater potential threat to structures. Street (20) reported peak particle velocity levels from the June 10, 1987, earthquake, which were recorded at four blast-monitoring stations located in Daylight. The frequencies associated with the peak velocities were close to the low-frequency rolloffs of the seismographs, and therefore, amplitudes may actually be higher than reported. The peak amplitudes for the individual stations range from 0.2 to 0.44 in/s at 2 to 6 Hz. These amplitudes are two times to over four times the highest velocity levels recorded by Bureau researchers in this area from blasting. ··
Airblasts
Historical data and Bureau monitoring of airblast overpressure recorded in the McCutchanville and Daylight directions are given in figure 21. Airblast data correspond to the same group of blasts used in the previous groundvibration analysis (see figures 18 and 19 and discussion thereof).

26
Cll u uj a:: ::J
!3 ff a:: w > 0
§ Cll a: <
130r---~--~--~~~--~,--~~~~~~~
120
110
'
KEY ', ' + Hislorical data \
A Houses 107 and 303. 5Hz '\+ 0 House 209. linear '
+ ++
+
a
+ + +
' +, ' ' \
\ Unconfinod
' ' ' ' \ \
' ' \ \
\
"' ',,_______________ .. ~~. ' ' '
Total confinement'',,''''' ~
90~--~--~--~~~----~~~~~~
100
120
110
100
1,000
KEY + Historical data a House 215.5 Hz o House 1 os. linear
0 0
a
+
1,000
\ \
\ \
' \ ' ' ', Unconfined
\
' ' ' ', ' ' \ ',
' ' ' \
CUBE ROOT SCALED DISTANCE, ft!lb 113
10,000
\
' \ \
',
10.000
Figure 21.-Historlcal and recent Bureau alrblast overpressure• for McCutchanville (top) and Daylight (bottom) directions.
The dashed lines of figures 21 represent upper and lower historical reference bounds for airblast levels for a totally confmed blast (lower line) and unconfined blast (upper line), which could amount to a "blowout." The solid black line is the regression line calculated from other historical data for typical surface coal mine blasts. These three reference lines are from RI 8485 (5) and have also been presented in this text in figure 4. Peak levels obtained from the ST 4 recorders are identified in the plot
key as "5 Hz" because this is the frequency rolloff of the airblast channel on these instruments. "Linear" refers to the sonic-boom detectors with the tape record~r systems, which have flat responses from 0.1 to 8,000 Hz. Alrblast levels obtained from the 5-Hz system are about 8 dB lower than the levels measured with the linear system for the low-frequency airblasts observed from the relatively distant Ayrshire mine. All of the subsequent plots do not correct for this difference, although the type of system used is stated. Peak airblast values used in this report are also given in appendixes B and C. Alrblasts with values stated as less than 100 dB were plotted at 99 dB.
The airblasts recorded in each direction are highly variable even within a relatively narrow scaled distance range. The vast majority of peak airblast levels for all of the McCutchan ville and Daylight measurements are within 90 and 120 dB, falling between the confmed and unconfined bound, with most being near or below the expected coal-highwall-type blasts and also less than 110 dB. The highest airblast overpressure recorded by Bureau researchers was 121 dB at house 334, using a 5-Hz system. This is well below the Bureau's recommended maximum of 129 dB for such a measuring system (5).
In the McCutchanville direction (figure 21, top), the recent Bureau monitoring shows peak airblast levels comparable to, and often lower than, historical measurements. Two comparatively large events between 120 and 125 dB, recorded by the Indiana DNR in the McCutchanville area, are near the unconfmed bound and could therefore be indicative of a blowout. But the time and date of these events coincides only approximately with actual mine blasts. Bureau researchers examined one of the time histories, but it is unclear if these events are truly blasts or if they are coincident "non-blast-events." They resembled other recorded "events" that were clearly not blasts.
Climatological Data
Weather data for the Evansville airport were requested from the National Climatic Data Center in Asheville, NC. Rainfall ·data were sought as an aid in understanding water-soil interactions and their role in the observed foundation cracking. Wind direction and velocity were requested for specific dates in an attempt to explain longrange airblast propagation. Appendix D contains selected airblasts and shows that long-range airblasts from the distant Lynnville mine corresponded to wind conditions from that direction, north and northeast. The two Ayrshire blasts of April6, 1989, at 1254, and July 21, 1989, at 1443 di(f not have tailwind conditions, and the reason for their relatively high amplitudes is not known.

STRUCTURAL VIBRATIONS
Ground-Vibration-Induced Responses
As discussed previously, houses 105 and 209 were instrumented to monitor aboveground structure motion induced by the blast vibrations. Structure response sensors for corner motion were placed in the main living areas of the homes directly over the corresponding sensors used to monitor ground motion.
Figure 16 shows the first floor, upper wall corner response to shot 25 in the same direction as the horizontal ground-motion sensors, as recorded at house 105, a onestory dwelling. Structure response from ground motion is identified within the approximate timeframe as the ground vibrations. The respective ground-motion and structure response time histories are very similar except for a slight particle velocity amplification in the structure response.
House 209 has a walkout basement on the side of the st:-,.-:::ture, facing the mine. Sensors were located essentially two stories above ground level, directly over and in the same directions as the horizontal ground-motion transducers (fig. 15). The second-story (first-floor) corner response of house 209 from shot 25, as seen in figure 17, is again very similar to the ground motion except for structure amplification of the particle velocity. In addition, some high- frequency "bumps" are observed on the time history, which could have been induced by specific characteristics of the structure such as the materials and methods used in construction.
Monitoring of the house 209 response was supplemented by a third transducer placed on an inside window frame located on the east-facing wall (radial direction), which gave an indication of the midwall response of the upperlevel house motion. The midwall response to the ground motion in the radial (east-west) direction is almost identical in shape and duration to the east wall corner motion except for an amplification of the ground motion by a factor of 2. The upper level structure amplification of the ground vibration observed for houses 105 and 209 with respect to shot 25 is normal for one- and two-story residential structures (see RI 8507, figures 33 through 41).
Response amplifications for the two homes monitored for structure response are shown in figure 22. House 209 in McCutchanville had ground-to-structure corner amplifications averaging nearly 2.0. House 105 was shorter, at one story, and had a typical amplification factor of 1.3 and a maximum of 1.6. This house was also subjected to a much wider range of vibration frequencies, as already mentioned for all the Daylight homes. Midwall amplifications were also measured in house 209 and ranged up to
. 27
4 KEY
Corner response
0 House 105 [J
3 House 209
[J [J
[J
2 oa
rcct:l
oc"i::J o
0 %~eo lbo 0 0 0 0 0
X'> 0
a: 12 0
~ u. 0 z
Q 1 10 100
~ 41 (.)
!!; KEY ,.;
~ Midwail :e ;pvn.;a 0 House 209
3 [J
oa oo
0
2 CfJra rtflo
0
PEAK GROUND VIBRATION FREQUENCY, Hz
Figure 22.-Ampllflcatlon factors for blast-produced corner responses for houses 1 OS and 209 and mldwall responses for house 209.
a factor of 3. All response values are within the bounds of previously studied homes, as shown in figures 38 through 40 in RI 8507 (3), and cannot be considered abnormal in terms of blasting vibrations.
Airblast Responses
The airblast overpressures for shot . 25 at houses 105 and 209, shown in figures 16 and 17, respectively, were

28
recorded using the wide-band sonic-boom system described earlier. Because sound usually travels much more slowly through the air than through the ground, the airblast arrival will follow the ground vibration by a time proportional to the distance from tl:te blast. The airblasts shown here are characteristic of overpressures recorded at large distances, with most of the signal energy near or below 1Hz. The respective peak amplitudes of 117.5 and 106.0 dB can be noticed by persons inside a home, but are well below any thresholds of damage.
Airblast-induced structure responses were obtained for a few blasts in the two instrumented homes. Because of their relatively low dominant frequencies (less than 1 Hz and consistent with long distance and behind-face direction), they produced responses on the low side of the historical data. Table 9 lists the measured responses for house 105, corner only, and for 209, corner and midwall. The low height of 105 probably contributed to its small response.
, acle 9.-5tructure v.bration responses from airblasts
Structure House Alrblast response, injs
lbjin2 dB Corner Midwall
105 .......... 0.00216 117.5 0.004 NO 209 .......... .00058 106 .005 .031
.00145 114 1.008 1.037
NO Not determined. 1These convert to 5.5 and 25.5 injs per lb/in2, respectively,
compared with average r'lsponses in AI 8485 (5) of 16 and 84.
Responses From Human Activity
While the instruments were in place in McCutchanville home 209, researchers measured a variety of respor • .,.::-s to aircraft operations and human actions (table 10). Aircraftinduced rattling was noticeable and produced midwall vibrations comparable to, but somewhat lower in amplitude than, the worst blasts of the monitoring period. More significant is the human activity, comparable to the strongest blasts for corners and far worse than the blasting for midwalls. These fmdings are entirely consistent with previous studies (3, 7).
CRACKING AND DAMAGE IN HOMES
Monitoring Period Inspections
A total of 45 areas were selected in the 6 monitored homes for regular inspections before and after every blast
when Bureau researchers were present. These areas included crack tips, crack widths, and areas with no visible cracks. Effects of blasting and possible long-term changes, such as seasonal climatic influences, were being sought. Each area in each home was examined 38 times between November 1, 1989, and January 3, 1990. Inspections were carefully done with a seven-power optical comparator and strong side-lighting for contrast. Resolution was about 0.002 in (0.05 mm).
Table 10.-5tructure vibration responses In house 209 from aircraft operations and human
activity, Inch per second
Activity
Aircraft takeoffs, 3 cases ....... . Children's activity ............ . Moderate' door close ......•.•. Jumping or· floor ............ . Wall pounding (e.g., nailing) .... .
ND Not determined.
Corner
0.004-0.009 NO
.007- .015
.026- .039
.023- .055
Midwall
0.012-0.034 .026- .032
.006
.38
.36
Selection of inspection areas concentrated on those with the highest estimated risk, such as areas above doorways, and those with high promise of visible change. All were inside the homes and most involved cracks in wallboard. A few masonry cracks were monitored; however, the rough surface textures made assessments of crack tip locations difficult. This was less of a problem for crack widths. In all, over 1,700 inspections were done and documented, in addition to the operation of the recording systems and coordination with the mine blasting.
Damage Changes Observed During Monitoring Period
Of the six homes under monitoring for cracks, four had some minor changes in crack widths and one had an extension of a crack that was not one of those preselected for monjtoring. Table 11 summarizes the observations. Generally, the cracks cycled open and closed with no regard to the blasts, whlch, as already mentioned, were of low amplitude. For example, house 105 had a crack that appeared wider after a blast (by a very minor 0.004 in or 0.1 mm) and then was back to its original width upon inspection the next morning. For three successive inspections, this crack appeared to be widening steadily until it was observed to reverse and return to its original width.
House 107 had a ceiling crack extension that was not under inspection but cut through a mark placed to identify a nearby crack tip. The highest vibration level during the period in which this occurred was 0.031 in/s.
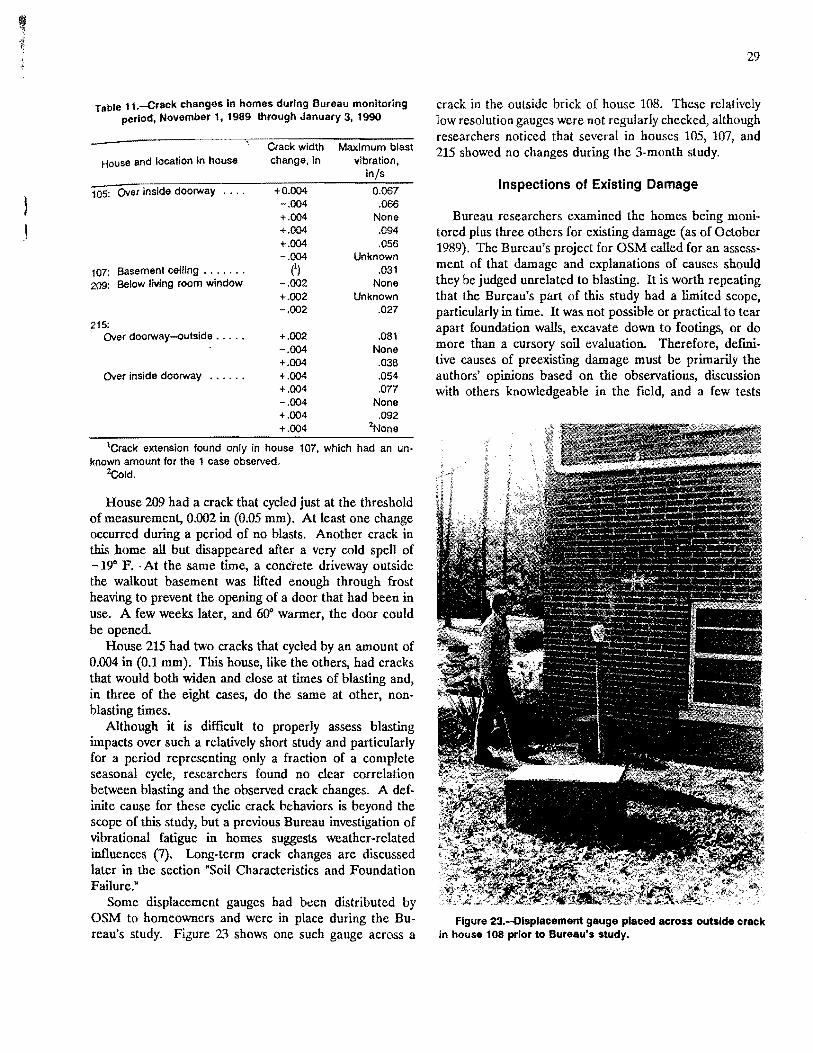
, !
Table 11.-Crack changes In homes during Bureau monitoring period, November 1, 1989 through January 3, 1990
Crack width Maximum blast House and location in house change, in vibration,
injs
105: Over inside doorway .... +0.004 0.067 -.004 .066 +.004 None +.004 .094 +.004 .056 -.004 Unknown
107: Basement ceillng ....••. (1) .031
209: Below living room window -.002 None +.002 Unknown -.002 .027
215: Over doorway-outside ...•. +.002 .081
-.004 None +.004 .038
Over inside doorway ...... +.004 .054 +.004 .077 -.004 None +.004 .092 +.004 2None
1Crack extension found only in house 107, which had an unknown amount for the 1 case observed.
2Cold.
House 209 had a crack that cycled just at the threshold of measurement, 0.002 in (0.05 mm). At least one change occurred during a period of no blasts. Another crack in this home all but disappeared after a very cold spell of -19° F. ·At the same time, a conc'rete driveway outside the walkout basement was lifted enough through frost heaving to prevent the opening of a door that had been in use. A few weeks later, and 60° warmer, the door could be opened.
House 215 had two cracks that cycled by an amount of 0.004 in (0.1 mm). This house, like the others, had cracks that would both widen and close at times of blasting and, in three of the eight cases, do the same at other, nonblasting times.
Although it is difficult to properly assess blasting impacts over such a relatively short study and particularly for a period representing only a fraction of a complete seasonal cycle, researchers found no clear correlation between blasting and the observed crack changes. A definite cause for these cyclic crack behaviors is beyond the scope of this study, but a previous Bureau investigation of vibrational fatigue in homes suggests weather-related influences (7). Long-term crack changes are discussed later in the section "Soil Characteristics and Foundation Failure."
Some displacement gauges had b~en distributed by OSM to homeowners and were in place during the Bureau's study. Figure 23 shows one such gauge across a
29
crack in the outside brick of house 108. These relatively low resolution gauges were not regularly checked, although researchers noticed that several in houses 105, 107, and 215 showed no changes during the 3-month study.
Inspections of Existing Damage
Bureau researchers examined the homes being monitored plus three others for existing damage (as of October 1989). The Bureau's project for OSM called for an assessment of that damage and explanations of causes should they be judged unrelated to blasting. It is worth repeating that the Bureau's part of this study had a limited scope, particularly in time. It was not possible or practical to tear apart foundation walls, excavate down to footings, or do more than a cursory soil evaluation. Therefore, definitive causes of preexisting damage must be primarily the authors' opinions based on the observations, discussion with others knowledgeable in the field, and a few tests
Figure 23.-Displacement gauge placed across outside crack in house 108 prior to Bureau's study.

30
performed in the limited time available. Further studies are planned by OSM.
House 105 has two types of damage, minor horizontal cracks in the concrete block basement wall just below ground level and a few superstructure cracks including one over the center wall doorway and parallel to the house's long axis. The horizontal block cracks appear to occur on both sides of the house (only one wall was well exposed). Because the brick facade also begins at ground level, the block thickness appears to be reduced here in order to provide both room and support for the bricks. This is a likely point of weakness.
House 107 has cracks throughout both the basement and superstructure, including separation cracks behind the massive brick fireplace. A few cracks in the living room appear to be from compression. For example, it appears that wallpaper was used to cover an existing crack, which later closed somewhat, buckling the paper. This home was built in stages, part on footings (with a crawl space) and part over a basement. It is likely that different parts of the hou.:... are expeiiencing different forces, particularly from any soil changes and also possibly complicated by the shallow slope.
House 108 is on a steeper slope and, as with house 303, has evidence of downslope foundation failure. There are large cracks (some about 1/2 in wide) in both the outside brick walls and in the concrete basement floor. On the east end, where the worst outside cracks occur, the bricks near the ground are muddy. This indicates that rainwater has been splashing directly on the walls (or that the gutters are not working properly). In addition, the homeowner reported that water sometimes appeared in the basement floor cracks. Any assessment of damage in this house would have to consider the influence of water.
House 201 is the only one examined that has severe structural failure, with major basement wall cracks and wood bracing to prevent the wall from falling inward. This house is on a hilltop. The most seriously leaning wall faces north and is a plain concrete block wall about 60 ft long with a full 8-ft height and completely below ground level (fig. 24). This wall has no intersecting walls except at the two ends and also no visible reinforcing pilasters (double-thick ribs). Outside and above this wall is an uncovered patio. This patio has a perceptible tilt toward the wall and appears to have settled about 2 in on the end against the house (figs. 25-26). Again, rain and water must be considered in any damage assessment of this home.
House 209 is on a hillside and has numerous superstructure cracks, mostly hairline. House 215 is in a flat area in Daylight and has both a few superstructure cracks and a few basement block wall cracks similar to those in house 105.
f"igure 24.-Basement block wall crack on east wall of house 201.
House 303 is on a hillside in McCutchanville and has many cracks throughout. Previous basement damage had been repaired prior to these studies and the adoption of casting by the mine. This required new brick and block work on the downslope side of the home, which was again showing signs of cracking. Some large ceiling cracks had been plastered over at one time and then buckled when the cracks closed. New cracks continue to appear in this house, including a large one visible both inside and outside, which the owner thought occurred recently (during the Bureau's study period).
House 308 has extensive superstructure cracks throughout most rooms but little visible cracking outside. This house is on a hillside an~ like 107, has parts with a crawl space and other parts over a basement-like walkout. The owner stated that some cracks are over 3 years old.

Figure 25.-Uncovered patio at house 201 with tilt toward house's north wall.
Figure 26.-Junction of north wall and patio of house 201 showing evidence of settlemenl
House 334 in Daylight has the fewest cracks and most superficial cracking of all homes studied, despite being the closest to the blasting. It also has horizontal cracks near ground level, as noticed in the other two Daylight homes. However, these are very fme by comparison. The cracks in this house, as well as many of the cracks in the other homes studied, are typical of cracks observed in all homes regardless of location.
Assessment of Damage
Determining the cause of the damage to these homes 1s difficult because of the similarity of damage from
31
blasting and from various short- and long-term causes of strains and cracking in homes. The elimination of factors that are not causes is far easier than fmding definitive causes. This is underscored by a publication of the American Insurance Association, which describes the many ways that cracks form in homes (21), and a section of Wiggins' sonic-boom text, which similarly discusses cracks in houses (22).
The worst damage is in McCutchanville homes, and most of those are on slopes. Major cracks are consistent with some kind of downslope failure, possibly as a contributing factor. Construction practices are also a likely factor in some cases. For example, houses that have more than one kind of foundation will be subject to varieties of differential strains, houses 107 and 308 being good examples. By contrast, similar homes on level ground (e.g., in Daylight) have little or no damage although they are closer to the blasting. Houses with the worst damage (108 and 201) have evidence of water intrusion along the foundation. The apparent lack of pilasters in house 201 plus water intrusion was also noted earlier.
It is not possible to assess the damages with precise regard to causes; however, it is most likely and plausible that foundation responses from soil and water interactions are the largest forces on the homes. This is consistent with observations that much of the cracking exhibits cyclic rather than progressive behavior (table 11). A complete discussion of soil and geological influences follows in appendix E.
LEVEL-LOOP SURVEYS
Bureau researchers performed pairs of level-loop surveys for the seven homes being monitored for blast vibrations (fig. 11). Such surveys can reveal gross differential settlement, subsidence, and slope failure, to a resolution of about 0.01 ft. Comparisons between the pairs of measurements made 3 months apart can show noncyclic changes associated with ongoing processes.
The seven homes surveyed for settlement are shown in figure 27, and the results are summarized in table 12. These results are relative elevations and do not directly indicate that the structure is under strain. Measured deviations could be due to differential settlement, or the structures could have been built slightly out of level and free of strain, not having moved at all. If they were originally level, most of these distortions are high enough for a substantial risk of cracking. Boscardin (23) cites the following ratio criteria in terms of angular distortions:
Structural damage •....................... Cracking of panel and load-bearing walls ...... . No cracking ......•..........•........•..
1:150 1:300 1:500

32
-0.07<;>-----------------------~ -0.08
-0.09 -009 0 0
N
House 105 9'
-0.03
-o.04 -0.03 -o.05
0 -0.04 I -0.05
oJO l -004 -0.18
0 -0.04 -0.04 -0.19
-0.24
-0.25
-0.03 -0.036----------Q
-0.04
-0.21 -0.16
:.~:o-
1 __ -_0_;2"-1.0
-0.40 -0.36 -0.41o--------0_0.37
-o.16 0 ~~~--------~0
House 107
-o.39 1 -0.34
-0.38 -Q34 o-------o,
1 -0.24
-o.406---------;;;----o~.2...;;5_.::;0
-oAo e -o.1oL ___ _1.._ ___ --o-o.18 NO -o.oo -o.18
-o.15 -0.09
-o.12 -o.16 -o.07
0 -0.11 -o.16 -0.14 -o.14
0 -0.09 -o.13 -o.14 -o.15
0 10
-o.14
House 108 6
-005 -o.oso---------------------0
LEGEND
0 Survey point
o Vibration transducer
E9 Airblast transducer
-o.15
-0.16
-0.06
-o.07 -o.15 ee -o. 15o:o=o=--------==-:.o
0
-0.18
N e 0
-0.14
-o.14
-o.10
-o.oo
House 209
0
-0.17 ,------------------~0
<)N
Figure 27.-t.evel-loop surveys. In each pair of elevations, top Is survey of October 1S89 and bottom Is survey of January 1990. Elevations are In feet

-0.11
-0.08
-o.o2
0
({l
0
-0.08
-0.05
-0.12
-o.10
-o.01 -o.01 0~-----------------------------------------q 0
-o.04
-o.o4 am
0
House 215
-Q02
-o.03 -0.02
-o.03
16-------0-0.03 -0.03 -0.03
-o.03
-o.07
0
-o.10
-----------------~ -D.Q9 -o.05
-0.07
0 10
House 303 Scale, ft
-0.19
-o.14 -0.17
l I I I I
-o.13
-Q.27 1 I I \.------· -0.27
-0.15 -0.13
-o. 16 -o. 1 6 -o. 13 o -o. 15 -0.13L_ _______________ ~_0.15
-0.19
0 oo-------------~
-0.' >
House 334
-o.10 -0.15
-0.09 -0.13 -0.06
I -o.15
-0.06 -0.11 -0.14
-0.09 -0.14 l 1 -o. 17 ...... __ -0.14 -0.18 ({l -o.16
6 -o.18
N
Figure 27.-Level-loop surveys-Continued. In each pair of elevations, top is survey of October 1989 and bottom is survey of January 1990. Elevations are in feet.
33

34
Table 12.-Summary of two level-loop surveys of seven Daylight and McCutchanville houses, October 1989 and January 1990
Maximum elevation Maximum Total angular House change between angular distortion Slope and survey results
two surveys, ft distortion1 for house
105 107 108 209 215 303 334
-0.02 1:430 .03 1:80
-.03 1:220 +.01 1:171 +.01 1:338 +.03 1:107 -.03 1:253
Not applicable. distortion of 1 part in 430, etc.
These are relatively high values. For example, the 1:226 for house 303 corresponds to the cracked north wall and means that the downhill (northeast) corner is 0.10 ft (1.2 in) lower than the uphill (northwest) corner 23 ft away. All four houses on hills had low downhill ends, as i: ·' _re had been some downslope slippage. The survey for house 107 had to be done using the roof eave as a survey horizon, making the data less reliable than data from homes with a traceable foundation or brick course. Additionally, house 215 has an elevation value of 0.10 ft in the northeast corner, which is so different from the other readings for this house that it looks like a transcription or reading error. There was no cracking damage corresponding to this very large "change," so the value is considered erroneous.
SOIL CHARACTERISTICS AND FOUNDATION FAILURE
The relatively low levels of vibration measured by the Bureau during the course of this investigation prompted a search for phenomena other than blasting that could be responsible for the structural damage observed in the study area. One clue to a possible cause is found in the report describing the proceedings of the informal public conference held as part of the review of AMAX's mining permit, in McCutchanville on May 4-5, 1989 (1). Pierce (J) stated that "a point of general agreement was the relatively recent time frame for the escalation of these problems. A number of speakers noted that they had either been lifelong residents or had been in the neighborhood for more than ten to fifteen years and that serious problems have only been noted since 1987-88." One speaker stated that she had lived in the area 34 years and had never had any cracked windows until the period between the spring and fall of 1988, when 10 occwred. The introduction of cast blasting at Ayrshire mine in March 1988 has been offered by 0thers as an explanation for the recent
1:680 1:174 1:432 1:258 1:1730 1:226 1:549
NAp. Roof line survey. Downslope end is low. Downslope end is low.
Do. NAp. Downslope end is low (on north side). NAp.
increase in damage complaints. However, given the Bureau's vibration measurements and available historical data, Bureau researchers believe a more probable cause is the extremely dry conditions and the accompanying soil volumetric changes as a result of the drought of 1988 and/ or erm;"T'l result;,.,,. upon rehydration.
N~a. lhe end of the Bureau's monitoring program, researchers realized that soil and foundation conditions may be important for understanding the observed damage in McCutchanville and Daylight. Researchers· were aware that OSM was testing local soils. However, the details of those tests and analyses were not available for this report. In addition, the agreement between OSM and the Bureau stated "if the blasting is not found to be responsible for the observed damage, researchers will try to determine the likely causes." Consequently, the Bureau examined the question of soil-structure interaction as it applies to the north Evansville area and collected a sample for testing. Results are described in detail in appendixes E and F.
BLAST DESIGNS
A detailed analysis of blast design influences was beyond the scope of this study, although it has been proposed for future research. Specifically of interest are the vibration and airblast from cast blasting, a potentially stronger source for these effects than conventional blasting, as described in the "Background" section. During the Bureau's study, the Indiana DNR reviewed blasting done at the Ayrshire mine and found that blasts detonated during the first week of monitoring ranged up to 7,500 lb per delay and 280,000 lb per blast total. These weights are comparable to those in previous periods, including those corresponding to times of high numbers of complaints. Later reviews of the entire study period found similar results. \.
The site 6 propagation equation, given previously in the "Background" section, suggests that a doubling of charge

weight will increase vibration amplitudes by a factor of about 1.50. Because amplitudes are low at the larger monitoring distances, typical.,ly O.Q3 in/s, they would still be tow even from such a large change in charge weight.
A variety of initiation delays were in use at different times, as the mine continually experimented for acceptable
35
and productive blasting. Generally, little influence on vibration character is expected from initiation design changes at the large distances of concern here, based on previous research (4). However, this is an area identified as needing additional research (24).
CONCLUSIONS
About 50 homes in the communities of Daylight and McCutchanville, north of Evansville, IN, have cracks in both superstructures and foundations, as found upon inspection. In some cases, the damage is more than cosmetic, including extensive exterior and interior wall cracks, leaning basement walls, and concrete floor collapse.
The Bureau studied the damage conditions in these two communities, assessing the vibration environment (current and past, blasting and other sources) and evaluating damag: c:r a sampling of seven homes. Findings are as follows:
1. Vibration Amplitudes: Some were found to be high relative to the large blast-to-structure scaled distances. McCutchanville amplitudes ranged up to 0.06 in/s, somewhat high for the over 4-mile distance. Some previous measurements at 10 miles (in Haubstadt) were well beyond expectations at about 0.04 in/s.
2~ Vibration Frequencies: As expected from previous work at this site, frequencies were low, primarily because of the nature of the near-surface geology, and were aggravated by the long blast-to-receiver distances (note that these long distances also reduce vibration amplitudes). Measurements in Daylight ranged from 4 to 20 Hz, while those in McCutchanville clustered closely around 4 to 5 Hz. These low frequencies are abnormally noticeable both directly by persons and by the structure rattling produced.
3. Structural Responses: An examination of blasting and other vibration sources found that these structures responded similarly to other previously studied structures. Other transient vibration sources, such as human activity and local aircraft operation, also produced noticeable structural responses, another result consistent with previous studies (3, 7).
4. Airblast Effects: No significant airblasts occurred during the monitoring period. A proper assessment of past airblast impacts cannot be done. This is because airblast measurements either do not exist for most of the dates labeled "severe" by the homeowners, or were obtained too far away to be of any use. Airblasts must remain a possible contributing factor in perceptibility and
even possibly in some cosmetic effects. However, the lack of widespread glass breakage makes it unlikely that a sound level of 140 dB has ever been exceeded, a value that ~lso represents a threshold chance of plaster cracking (5). There are no known cases of foundation cracks from airblasts at values anywhere near the glass breakage threshold of 140 dB.
The use of cast blasting does produce a potential airblast problem through low blasthole confinement, possible blowouts, and severe rock-throw-producing air-pressure pulse airblasts. The relationships between blast design (particularly casting) and airblast need investigating. The variability of casting-produced airblast combined with weather conditions favoring long-range sound propagation appear to account for occasional anomalous "events" such as the distant Peabody Lynnville mine blasts that were measured in McCutchanville. Climatological data support the idea of occasional long-range airblast propagation in the Evansville area.
There is no way to tell if the airblasts measured by the Bureau are representative of past airblasts because of their var<ability and the lack of available records in the areas and time periods of concern.
5. Cracks in Homes: Inspections and surveys conducted during the 64-day blast monitoring period found very minor changes in crack widths and relative elevations that had no correlation to the blasting. All level-loop survey results were consistent with downslope slippage for those homes on slopes. Cyclic changes and their causes are ambiguous because they were not monitored long enough to encompass a complete 1-year weather cycle. Researchers noticed that some of the biggest crack width changes and related effects occurred during a period of two very large temperature swings.
Blast vibrations measured by the Bureau were at least two orders of magnitude below the 5 to 10 in/s required to crack concrete walks, driveways, and foundations and to cause major superstructure cracks. Because there are no conceivable blast design changes that could begin to account for this vast difference, researchers conclude that blasting vibration is not responsible for the damage that is

36
present. Airblast is admittedly more variable; however, researchers saw no evidence that levels have ever been higb. enough to account for the magnitude of damage. Although few data exist outside of military studies, a reasonable beginning value for airblast damage to masonry and concrete is 5 lb/in2 (note that a 131-dB airblast is 0.01lbjin2). This 5 lb/in2 would be the expected ov~rpressure from a surface blast of 400 lb at a distance of about 66 ft (the reason that bombing destruction of concrete fortifications requires a direct hit).
A preliminary soil engineering analysis and tests on a single soil sample suggest that the expansion of claycontaining soils activated by weather extremes may be the primary cause of major cracking in area homes. This mechanism is possibly assisted by other soil properties and construction designs, such as partial basements, that place differential soil-foundation forces on homes with nonuniform foundations located on slopes. Failures from soils
eroded by waterflow under and around foundations have occurred at some homes. All seriously damaged homes are in McCutchanville rather than Daylight or the Base Line Road direction. This suggests a geographical correlation with damage rather than a simple distance-fromthe-mine rule. Two of the most seriously damaged homes show evidence of water intrusion. Wet and dry cycles are going to continually affect homes on the clay-containing soils in the study area, and topographic effects favor erosion. The simpler Daylight homes appear less susceptible to these forces because of complete basements, uniform home designs, level ground, and possibly different near-surface soils.
At this time, there are no more plausible explanations for the observed damages than soil forces and displacements, particularly for cracks in concrete and foundations, caving basement walls, collapsing pipes, detaching steps, and other downslope failures.
REFERENCES
1. Pierce, W. E. Investigation Into the Complaints Concerning the Blasting at the AMAX Coal Company, Ayrshire Mine. IN Div. Reclam., IN Dep. Nat. Resour., 1989, 92 pp.
2. Nicholls, H. R., C. F. Johnson, and W. I. Duvall. Blasting Vibrations and Their Effects on Structures. BuMines B 656, 1971, 105 pp.
3. Siskind, D. E., M. S. Stagg, J. W. Kopp, and C. H. Dowding. Structure Response and Damage Produced by Ground Vibration From Surface Mine Blasting. BuMines RI 8507, 1980, 74 pp.
4. Siskind, D. E., S. V. Crum, R. E. Otterness, and J. W. Kopp. Comparative Study of Blasting Vibrations From Indiana Surface Coal Mines. BuMines RI 9226, 1989,41 pp.
5. Siskind, D. E., V. J. Stachura, M. S. Stagg, and J. W. Kopp. Structure Response and Damage Produced by Airblast From Surface Mining. BuMines RI 8485, 1980, 111 pp.
6. Kopp, J. W., and D. E. Siskind. Effects of Millisecond-Delay Intervals on Vibration and Airblast From Surface Coal Mine Blasting. BuMines RI 9026, 1986,44 pp.
7. Stagg, M. S., D. E. Siskind, M. G. Stevens, and C. H. Dowding. Effects of Repeated Blasting on a Wood-Frame House. BuMines RI 8896, 1984, 82 pp.
8. Oriard, L. L., and J. H. Coulson. 'IV A Blast Vibration Criteria for Mass Concrete. Pres. at ASCE Conf., Portland, OR, Apr. 1980. ASCE preprint 80-175, 1980, pp. 101-123.
9. American National Standards Institute. Guide to the Evaluation of Human Exposure to Whole-Body Vibration. ANSI S3.18-1979 (Acoust. Soc. America, ASA 38-1979), 1979, 18 pp.
10. __ . Guide to the Evaluation of Human Exposure to Vibration in Building. ANSI S3.29-1983 (Acoust. Soc. America, ASA 48-1983), 1983, 10 pp.
11. Perkins, B., Jr., and W. F. Jackson. Handbook for Prediction of Airblast Focusing. Ballistic Res. Labs., Aberdeen, MD, Rep. 1240, Feb. 1964, 100 pp.
12. American National Standards Institute. Estimation of Air Blast Characteristics for Single Point Explosions in Air, With a Guide to Evaluation of Atmospheric Propagation and Effects. ANSI S2.20-1983 (Acoust. Soc. America, ASA 20-1983), 1983, 26 pp.
13. E.l. Du Pont de Nemours & Co. Blaster's Handbook. Tech. Serv. Sec., Explos. Prod. Div., Wilmington, DE, 175th anniversary.ed., 1977, 493 pp.
14. Ursenback, W. 0. Measurements of Air and Ground Shock Disturbances Arising From Demolition Activities at Anniston Ordnance Depot (U.S. Army contract DA-04-495-0RD 907). Explos. Res. Group, Inst. Study of Rate Processes, Univ. UI', Salt Lake City, UI', Rep. 4, Aug. 1, H57, 60 pp.
15. Napadenski, H., and A. Longinow. Explosion Damage to Urban Structures at Low Ovetpressure. Paper in Proceedings of the 2nd Symposium on the Interaction of Non-Nuclear Munitions With Structures (Panama City Beach, FL, Apr. 15-18, 1985). Univ. FL Grad. Eng. Cent., Elgin AFB, 1985, pp. 12-16.
16. Indiana Geological Survey. Geologic Framework and Physical Properties of Bedrock and Lacustrine Deposits In and Around McCutchanville, IN (OSM contract GR 993184). 1989-90 midyear rep., pt. 1, approx. 100 pp.
17. Gray, H. H., W. J. Wayne, and C. E. Wier. Geologic Map of the 1 x 2 Vincennes Quadrangle and Parts of Adjoining Quadrangles, Indiana and Illinois, Showing Bedrock and Unconsolidated Deposits. IN Dep. Nat. Resour., 1970, 1 sheet.
18. Siskind, D. E., and M. S. Stagg. Blast Vibration Measurements Near and On Structure Foundations. BuMines RI 8969, 1985, 20 pp.
19. Dobrin, M. B. Introduction to Geophysical Prospecting. McGraw Hill, 1976, 630 pp.
20. Street, R., A. Zekulin, D. Jones, and G. Min. A Preliminary Report on the Variability in Particle Velocity Recordings of the June 10, 1987 Southeastern Illinois Earthquake. Seismol. Res. Lett., v. 59, No. 3, July-Sept 1988, pp. 91-97.
21. American Insurance Association. Blasting Damage, A Guide for Adjusters and Engineers. Am. Ins. SeiV. Group, New York, 1972, 70 pp.
22. Wiggins, J. H., Jr. Effects of Sonic Boom. J. H. Wiggins Co., PalOs Verdes Estates, CA, 1969,174 pp.
23. Boscardin, M. D. Building Response to Excitation-Induced Ground Movements. Ph.D. Thesis, Univ. IL at Urbana-Champaign, Urbana, IL, 1980, 279 pp.

24. Siskind, D. E., V. J. Stachura, and M. J. Nutting. Low-Frequency Vibrations Produced by Surface Mine Blasting Over Abandoned Underground Mines. BuMines RI 9078, 1987, 58 pp.
25. Murphy, E. W., R Yarbrmlgh, and S. C. Bradford. A Review of Qaims Data-Illinois Mine Subsidence Insurance Fund, October 1979 to October 1985. Paper in Proceedings of the 2nd Workshop on Surface Subsidence Due to Underground Mining (Morgantown, WV, June 9-11, 1986). WV Univ., Morgantown, WV, 1986, pp. 13-18.
26. Illinois State Geological Swvey. Geonews, v. 3, No. 3, summer 1988,6 pp.
27. Bauer, R A. Damage That Might Be Mistaken for Coal-Mine Subsidence. IL Dep. Energy and Nat. Resour., State Geol. Swv. Div., reprint 1983E, pp. 66-72.
28. Rose, W. Failed Footings & Buckled Walls. N. Engl. Builder, v. 6, No. 6, Mar. 1988, pp. 37-39.
29. Small Homes Council-Building Research Council, University of Illinois, Illinois State Geological Survey. Protect Your Concrete Block Basement Walls From the Pressures Induced by Drought. Press release, June 21, 1988, 1 p. (in ap_P.endix F).
30. Baird, W. D. Drought May Wreak Foundation Damage. Champaign-Urbana (IL) News-Gazette, Sept. 21, 1988.
31. Shirk, M. Drouth Causing Houses Here To Settle and Walls To Crack. St. Louis (MO) Post-Dispatch, Sept. 22, 1976.
3"7
32. Chen, F. H., and D. l!uang. Lateral Expansion Pressure on Basement Walls. Paper in Proceedings of 6th International Conference on Expansive Soils (New Delhi, India, Dec. 1-4, 1987). A. A. Balkema, 1991, v. 1, pp. 55-59
33. Nater, E. A. (Univ. MN). Soil Test by University of Minnesota on a McCutchanville Sample. Private communication, Feb. 9, 1990; available from D. E. Siskind, Twin Cities Res. Cent., BuMines, Minneapolis, MN.
34. Osipov, V. I., N. N. Bik, and N. A Rumjantseva. Cyclic Swelling of Qays. Appl. Qay Sci., v. 2, No. 4, Sept. 1987, pp. 363-374.
35. Straw, W. T., H. H. Gray, and R L Powell. Environmental Geology of the Evansville Area Southwestern Indiana. IN Dep. Nat. Resour., Geol. Surv. Spec. Rep. 12, 19n, p. 5.
36. Seed, H. B. Soil Liquefaction and Cyclic Mobility Evaluation for Level Ground During Earthquakes. J. Geotech. Eng. Div. Am. Soc. Civ. Eng., v. 105, Feb. 1979, pp. 201-255.
37. Paolillo, P. E. Suitability of Existing Vibration Criteria for Rail Rapid Transit Systems. J. Acoust. Soc. America, suppl. 1, v. 67, spring 1980, pp. 561-562.
38. Hough, B. K Basic Soils Engineering. Wiley & Sons, 2d ed., 1969, 634 pp.

38
APPENDIX A.-PRODUCTION BLASTS MONITORED BY BUREAU OF MINES
Shot1 Date Time Type of blast Location Charge weight, lb
Northing Easting Total Per delay
11-01-89 1255 Casting ...... 219,177 393,316 279,500 7,482 2 11-01-89 1340 . . do .•..•.•.. 219,376 393,279 38,377 3,596 3 11-01-89 1538 .. do ......... 219,740 393,309 210,923 4,234 4 11-02-89 1145 Conventional .. 210,104 391,893 4,817 325 5 11-02-89 1220 .. do ......... 209,683 391,674 18,031 325 6 11-03-89 1145 Casting 220,154 393,322 225,602 4,292 7 11-03-89 1331 .. do ...•..•.. 220,562 393,328 241,311 4,408 8 ...... 11-04-89 1028 .. do ........ 220,854 393,339 61,742 3,596 9 ...... 11-04-89 1110 . . do ......... 220,960 393,347 75,265 2,275 10 11-04-89 1155 . . do ......... 221,120 393,354 66,550 2,015
11 11-04-89 1300 Box ......... 221,295 393,395 126,724 2,070 12 11-06-89 1110 .. do ......... 221,473 292,408 136,169 1,972 13 11-08-89 1403 Conventional .. 209,389 391,474 21,833 462 14 11-08-89 1416 . . do ......... 209,078 391,359 15,330 294 15 11-09-89 1008 Box ..•...... 221,644 393,797 137,399 2.030 16 11-09-89 1126 .. do .....•... 221,822 393,401 153,49C. ..., ,...,r:r:..
17 11-10-89 1049 .. do ......... ~,u16 393,399 167,233 2,204 18 11-10-89 1326 Conventional .. 208,902 391,271 15,078 420 19 11-10-89 1344 . . do .•.•.•... 208,738 391,186 17,178 210 20 11-13-89 1111 .. do ......... 208,618 391,114 5,460 210
21 11-14-89 1452 .. do ......... 216,307 393,022 106,969 2,016 22 11-20-89 1410 Casting ...... 216,118 393,098 87,393 1,919 23 11-21-89 1230 •. do ......... 218,126 393,188 193,725 3,285 24 11-21-89 1452 •. do ......... 217,757 393,171 230,423 3,285 25 11-22-89 1116 .• do ......... 217,257 393,162 325,588 6,225 26 11-22-89 1437 .• do ..•.•.... 216,692 393,122 196,103 3,470 27 11-29-89 1107 .. do ...•..... 215,762 393,061 186,927 2,842 28 11-29-89 1117 Conventional .. 215,447 393,033 28,923 1,740 29 11-30-89 1106 •. do ..•...... 215,119 393,044 66,642 1,798 30 11-30-89 1140 •. do .•..•.... 214,708 392,972 50,421 1,625
31 12-04-89 1019 .. do .••.•..•. 210,759 392,700 14,735 350 32 12-04-89 1220 .. do •........ 210,990 392,226 14,649 350 33 12-04-89 1233 .• do ...•..... 211,234 392,351 13,245 365 34 12-05-89 1212 .• do .•.•..... 213,937 392,805 75,075 2,210 35 12-07-89 1113 .. do .•.•..... 213,187 392,639 57,944 1,625 36 12-07-89 1319 Casting ...... 212,866 392,533 83,790 3,915 37 12-08-89 1200 Conventional .. 209,757 391,598 2,485 280 38 12-08-89 1210 •. do ..•...... 209,903 391,648 8,980 245 39 12-08-89 1345 Conventional .. 210,244 391,833 9,520 280 40 12-09-89 1357 Casting ...... 212,543 392,470 179,297 4,140
41 12-09-89 1425 .. do ..•..•.•. 212,307 392,412 34,881 2,436 42 12-09-89 1452 •• do .••.•.... 212,107 392,344 125,870 2,552 43 12-11-89 1133 .. do •.•...•.. 211,771 392,222 146,685 4,830 44 12-11-89 1154 Conventional .. 211,526 392,132 18,495 1,665 45 12-12-89 0951 •. do ....•...• 209,575 391,425 12,670 280 46 12-13-89 1450 Casting ...... 218,580 393,174 173,723 4,319 47 12-14-89 1240 Conventional .. 210,541 391,979 4,810 130 46 12-14-89 1244 •. do .•.....•• 209,698 391,537 4,815 225 49 12·23-89 1208 Casting ...... 219,104 393,181 \ 277,125 7,004 50 12-23-89 1404 •. do ......... 219,659 393,183 296,572 7,352 1Shot numbers are keyed to map, figure 8.

39
Shot1 Date Time Type of blast Location Charge weight, lb
Northing Easting Total Per delay
51 12-26-89 1200 Casting ...... 220,198 393,198 294,507 6,668 52 12-27-89 1029 . . do •........ 220,614 393,201 227,560 4,234 53 12-27-89 1408 .. do ......... 220,848 393,212 35,721 4,756 54 12-27-89 1418 .. do ....•.. " •• 221,017 393,230 160,717 4,292 55 12-27-89 1600 .. do ......... 221,310 393,250 184,943 4,060 56 12-28-89 1126 .. do •........ 221,669 393,243 182,883 4,002 57 12-28-89 1454 .. do ......•.. 221,981 393,231 157,333 4,524 58 01-{)3-90 1125 .• do •....... 217,083 393,023 153,129 2,900 59 01.()3-90 1448 .. do .••..•..• 216,673 393,014 179,497 3,190
1Shot numbers are keyed to map, figure 8.

40
APPENDIX B.-VIBRATION DATA FROM MONITORING OF SURFACE COAL MINE PRODUCTION BLASTS AT THE AMAX AYRSHIRE MINE
Ground vibration Structure re- Charge Square
Compo- Veloc- Frequency, Dura- sponse, infs Air- Distance. weight root
Date Time nent of lty, Hz tion, s Cor- Mid- blast, from per de- scaled motion1 in/s ner wall dB blast, ft lay,lb distance,
ft/lb112
HOUSE 105, DAYLIGHT, SEISMOGRAPH (ST-4)
11-01-89 1540 v 0.037 5.5 5 } A .054 12, 5 3.5 103 11,260 4,234 173 T .060 10, 6 2.3
11-03-89 1144 v .017 3.8 5.5 } A .059 10, 8.8 5 100 11,462 4,292 175 T .043 8 5
11-03-89 1329 v .030 4.3 } A .062 14, 5 102 11,665 4,408 176 T .062 4
11-04-92 1110 v .025 5.7, 3.4 4
} <100 A .071 5.5 3 11,885 2,275 249 T .060 5.4 3.8
11-04-89 1153 v .019 5.6 } <100 A .040 5.7 11,976 2,015 267
T .056 5.4
11-06-89 1108 v .05
} <100 A .05 12,212 1,972 275 T .05
11-14-89 1452 v .012 33 } A .022 11.1 99 9,924 2,016 221 T .008 12.0
11·20-89 1410 v .048 4.8 } A .056 4.6 98 9,971 1,919 228 T .032 4.8
11-21-89 1.229 v .036 25 } A .067 13.3 104 10,526 3,285 184 T .040 10.0
11-21-89 1453 v .058 14.3 } A .066 13.3 109 10,397 3,285 181 T .034 16.7 j
11-22-89 1116 v .092 4.1 } t A .094 8.7 10,253 6,225 130 , T .075 4.9
11·30-89 1140 v .045 6.4, 11 } R .041 5.5 9,748 1,625 242 T .014 6.5
12-07-89 1113 v .026 10.5 } < 100 \ R .059 10.5 9,541 1,625 237
T .034 9.5
1See notes at end of table.

41
Ground vibration Structure re- Charge Square
Compo- Veloc- Frequency, Dura- sponse, in/s Air- Distance weight root
Date Time nent of . ity, Hz tion, s Cor- Mid- blast, from per de- scaled motion1 -. in/s ner wall dB blast, ft lay,lb distance,
ft/lb112
HOUSE 105, DAYLIGHT, SEISMOGRAPH (ST-4)-Continued
12..07-89 1319 v 0.027 6.1 } R .036 11.8 102 9,514 3,915 152 T .021 10.0
12..09-89 1357 v .029 9.1
} <100 R .051 11.1 9,505 4,140 148 T .026 8.0
12-23-89 1209 v .024 5.4 1 R .036 11.8 99 10,874 7,004 130 T .056 11.1 J
12-23-89 1404 v .047 5.3 } R .048 5.3 97 11,111 7,352 130 T .055 7.4
01 :::-90 1450 v .040 15.4 } R .047 10.0 111 9,981 3,190 177 T .020 11.7
HOUSE 107, McCUTCHANVILLE, SEISMOGRAPH (ST-4)
11..01-89 1252 v 0.038 2 8 } R .043 5 10 25,973 7,482 300 T .040 6.6 8
11..01-89 1342 v } R .027 5 6 26,080 3,596 435 T .012 6 6
11..01-89 1540 v .008 2.2 8 1 R .444 5 10
J 26,349 4,234 405
T .020 3 9.5
11-03-89 1329 v .007 2.2 } R .012 3, 5.5 26,930 4,408 406 T .020 2.8, 5.9
11-04-89 1110 v .006 2.4, 5 6.5 } R .025 4.8 7 27,222 2,275 571 T .017 2.9 7
11-04-89 1153 v .006 } R .023 5 27,339 2,015 609 T .014 5
11-14-89 1452 v .004 5.6 0.010 1 R .029 5.6 .028 J 23,911 2,016 533 T .013 6.45 .108
11-20-89 1410 v .010 2.1
} R .028 4.8 23,858 1,919 545 T .019 4.4
1See notes at end of table.


43
l •'
Ground vibration Structure re- Charge Square
Compo- Veloc- Frequency, Dura- sponse, in/s Air- Distance weight root
Date Time nent of -, lty, Hz tion,s Cor- Mid- blast, from per de- scaled motion1 In/a ner wall dB blast, ft lay, lb distance,
ft/lb112
HOUSE 108, McCUTCHANVILLE, SEISMOGRAPH (ST-4)-Continued
11-01-89 1537 v 0.01 } R .03 28,324 4,234 435 T .02
11-14-89 1450 v .02 } R .03 103 26,465 2,016 589 T .02
11-22-89 1113 v .04 } R .04 103 27,003 6,225 342 T .03
12-27-89 1024 v .02 } R .04 102 28,691 4,234 441 T .02
HOUSE 209, McCUTCHANVILL:, SEIS:. ~ ::lAPH (ST-4)
11--01-89 1252 v 0.017 2 } R .037 4.8 4 104 25,677 7,482 297 T .032 5, 3.3 4
11-Q1-89 1342 v } R .020 5.1 3.6 25,785 3,596 430 T .018 6 3.6
11-Q1-89 1540 v .007 4 } R .036 4.6 104 26,055 4,234 400 T .022 4.7
11-o3-89 1329 v .008 3 } R .024 6.25, 2.3 7.5 26,638 4,408 401 T .020 5, 12.6 8
11-o4-89 1110 v .005 2.0 5.6 } R .024 5.3 5.3 26,932 2,275 565 T .024 6.1 7.4
11-21-89 1229 v -010 2.1 } R .022 4.5 24,885 3,285 434 T .018
11-21-89 1453 v .008 2.9 } R .023 4.9 104 24,633 3,285 430 T .024 5.7
11-22-89 1116 v .030 2.2 } R .049 4.6 102 24,305 6,225 308 T .037 4.9
12-Q7-89 1113 v .019 2.0
} <100 R .036 1.75 21,514 1,676 534 T .Q10 3.13
1See notes at end of table.

44 ,J
i, :
Ground vibration re- Charge Square
Compo- Veloc- Frequency, Dura- sponse, injs Air- Distance weight root l.
Date Time nent of ity, Hz tion, s Cor- Mid- blast, from per de- scaled ji motion1 in/s dB blast, ft lay, lb distance,
li ner wall fi
ft/lb1/ 2 t;
I! HOUSE 209, McCUTCHANVILLE, SEISMOGRAPH (ST-4)-Continued ii 12-26-89 1200 v } <100
1! R 0.021 26,291 6,668 322 !I T .031 6.3
,j ll !I ·11
12-27-89 1029 v .009 } <100
;t " ~
R .027 6.3 26,585 4,234 409 !l T .020 6.3
HOUSE 215, DAYLIGHT. SEISMOGRAPH, (ST-4)
11-01·89 1540 v 0.050 4.6 l R .081 5.5. 15
J 103 10,708 4,234 165
T .050 15.8
11-03-89 1144 v .028 3.9 5.5 } R .048 9.5 5.5 97 10,785 4,292 165 T .035 11 4
! HJ3·89 1329 v .057 4.5 } R .058 9 104 10,869 4,408 164 T .038 10, 4.3
11-04-89 1028 v .030 6.9 3 } R .038 9.5 3 10,944 3,592 183 T .030 7.7 3
11-04-89 1110 v .028 3.6 4.5
} R .058 6.9 4.5 97 10,977 2,275 230 T .043 4.9 5
11-04-89 1153 v .030 5.9 } R .038 5.7 100 11,020 2,015 245 T .043 4.2
11-04-89 1300 v .023 25 4 } R .029 15.4 4 99 11,110 2,070 244 T .028 ''1 3.5
11-06-89 1108 v .033 15.4 } R .044 14.3 3 11,172 1,972 252 T .040 14.3
11-14-89 1452 v .021 6.25 } R .042 8.25 108 10,510 2,016 234 T .021 13.3
11-20-89 1410 v .054 4.4 } R .040 4.3 115 10,622 1,919 243 T .031 4.3
11-21-89 1229 v .031 15.4 } R .077 13.3 104 10,489 3,285 183 T .047 14.3
1See notes at end of table.
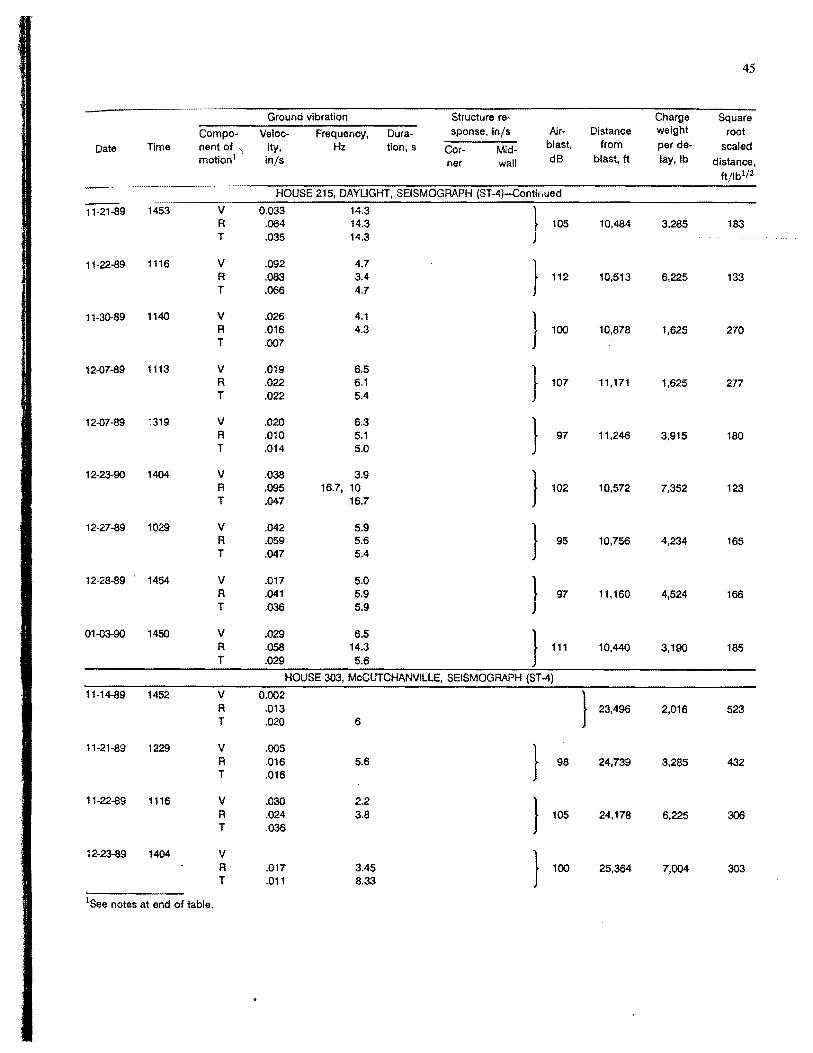
45
Ground vibration Structure re- Charge Square
Compo- Veloc- Frequency, Dura- sponse, in/s Nr- Distance weight root
Date Time nent of -. ity, Hz tion, s Cor- Mid- blast, from per de- scaled motion1 in/s ner wall dB blast, ft lay,lb distance,
ft/lb112
HOUSE 215, DAYLIGHT, SEISMOGRAPH (ST-4)-Contil•ued -··· v 0.033 } 11-21-89 1453 14.3 R .064 14.3 105 10,484 3,285 183 T .035 14.3
11-22-89 1116 v .092 4.7 } R .083 3.4 112 10,513 6,225 133 T .066 4.7
11-30-89 1140 v .026 4.1
} R .016 4.3 100 10,878 1,625 270 T .007
12-07-89 1113 v .019 6.5 } R .022 6.1 107 11,171 1,625 277 T .022 5.4
12-07-89 :319 v .020 6.3 } R .010 5.1 97 11,246 3,915 180 T .014 5.0
12-23-90 1404 v .038 3.9 } R .095 16.7, 10 102 10,572 7,352 123 T .047 16.7
12-27-89 1029 v .042 5.9 } R .059 5.6 95 10,756 4,234 165 T .047 5.4
12-28-89 1454 v .017 5.0 } R .041 5.9 97 11,160 4,524 166 T .036 5.9
01-03-90 1450 v .029 6.5 } R .058 14.3 111 10,440 3,190 185 T .029 5.6
HOUSE 303, McCUTCHANVILLE, SEISMOGRAPH (ST -4)
11-14-89 1452 v 0.002 } R .013 23,496 2,016 523 T .020 6
11-21-89 1229 v .005 } R .016 5.6 98 24,739 3,285 432 T .016
11-22-89 1116 v .030 2.2
} R .024 3.8 105 24,178 6,225 306 T .036
12-23-89 1404 v } R .017 3.45 100 25,364 7,004 303 T .011 8.33
1See notes at end of table.

46
Ground vibration Structure re- Charge Square
Compo- Veloc- Frequency, Dura- sponse, injs P\Jr- Distance weight root
Date Time nent of ity, Hz tion, s Cor- Mid- blast, from per de- scaled motion1 injs ner wall dB blast, ft lay,lb distance,
ftjlbl/Z
HOUSE 303, McCUTCHANVILLE, SEISM,OGRAPH (ST -4)-Continued
12-27-89 1029 v } R 0.016 3.7(\ 95 26,393 4,234 406 T .021 7.14
01-(}3-90 1125 v } R .018 6.7 <95 23,962 2,900 445 T .019
01-(}3-90 1450 v } R .017 5.9 <95 23,706 3,190 420 T .021 5.6
HOUSE 334, DAYLIGHT, SEISMOGRAPH (ST-4)
11-(}3-89 1144 v 0.056 22.2 3.5 } R .073 13.3 5.3 105 8,666 4,292 132 T .070 14.3 5.5
11-(}3-89 1329 v .058 13 } R .091 13 107 8,362 4,408 126 T .10 12.5
11-()4..89 1028 v .038 16 } R .067 13 98 8,155 3,596 136 T .075 8.7
11-04-89 1110 v .032 7 3.2 } R .068 15.4, 6 4 110 8,084 2,275 169 T .080 14.3, 5 5
11-(}4-89 1153 v .034 5.3,12 } R .041 6.5, 9 99 7,974 2,015 178 T .044 8.7
11-()4..89 1300 v .021 16.7, 7 3.5 } A .094 13.3 3.5 106 7,880 2,070 173 T .064 13.3 3.4
11-06-89 1110 v .064 28.6 } A .087 14.3 102 7,767 1,972 175 T .092 14.3
11-09-89 1008 v .073 20 } <100 R .088 20 7,945 2,030 176
T .065 13.3
11-09-89 1126 v .077 16.7 } R .106 16.7 3.5 102 7,528 2,668 146 T .097 14.3
11-10-89 1049 v .099 25
} <100 A .084 16.7 7,400 2,204 158 T .090 14.3
1See notes at end of table. ...

! t 47 \ ,.
~ ,.
I Ground vibration Structure re- Charge Square
Compo- Veloc- Frequency, Dura- sponse, injs Air- Distance weight root Date Time nent of ·'- ity, Hz tion, s Cor- Mid- blast, from per de- scaled
motion1 in/s ner wall dB blast, ft lay,lb distance, ft/lb112
HOUSE 334, DAYLIGHT, SEISMOGRAPH (ST-4)-Continued
l 11-2Q-89 1410 v 0.029 4.1 } R .023 4.2 94 11,933 1,919 272 T .014 4.4
11-21-89 1229 v .020 18.2 } 1 R .028 16,7 98 10,227 3,285 178 I T .025 13.3
l 11·21-89 1453 v .030 15.4 } R .055 15.4 98 10,532 3,285 184 T .043 15.4
! 11-22·89 1116 v .037 3.8 } R .047 4.0 109 10,959 6,225 140 T .036 4.2
12-13-89 1450 17 } R .033 13 108 9,839 4,319 150 T .029 13
12-23-89 1209 v .023 } R .044 15 110 9,410 7,004 112 T .036 14
12-23-89 1404 v .041 11 } R .064 17 108 8,965 7,352 105 T .048 17
12-26-89 1200 v .057 17 } R .068 14 110 8,552 6,668 105 T .068 14
12-27-89 1029 v .036 l R .063 15 106 8,238 4,234 127 T .059 12 J
12-27-89 1408 v .022 11
} <100 R .026 14 8,072 4,756 117 T .037 11
12-27-89 1418 v .041 17 } R .049 13 106 7,961 4,292 121 T .052 11.8
12-27-89 1600 v .055 22 } R .052 12 103 7,766 4,060 122 T .051 10
12-28-89 1126 v .055 25 } R .081 13 105 7,513 4,002 119 T .086 13
1See notes at end of table.

. ,, 48 1
'l Ground vibration Structure re- Charge Square l Compo- Veloc- Frequency, Dura- sponse, injs Ajr- Distance weight root
Date Time nent of ity, Hz tion, s Cor- Mid- blast, from per de- scaled !
motion1 in/s ner wall dB blast, ft lay, lb distance,
ft/lb112
HOUSE 334, DAYLIGHT, SEISMOGRAPH (ST-4)-Continued
12-28-89 1454 v 0.036 15 } R .097 17 104 7,294 4,524 109 T .080 15
01-03-89 1450 v .017 14 } R .023 17 121 10,440 3,190 202 T .022 15
HOUSE 105, DAYLIGHT, RECORDER (STORE 7)
11-Q1-89 1252 v 0.099 5.3 } R .059 4.2 0.041 113.6 11,027 7,482 127 T .080 6 .042
11-Q1-89 1342 v .029 5.2 } R .034 5.5 .046 101.3 11,075 3,596 185 T .027 5 .040
. I-Q1-89 1540 v .029 4.4 } R .047 4.4 .052 109.4 11,260 4,234 173 T .057 9.5 .034
11-Q3-89 1144 v .026 20 } R .041 10.5 .058 109 11,462 4,292 175 T .035 9.1 .048
11-Q3-89 1329 v .034 4.3 } R .044 11.6, 5.1 .057 116.5 11,665 4,408 176 T .046 4 .067
11-Q4-89 1028 v .026 22, 9 } R .044 8 .025 92.6 11,823 3,596 197 T .049 8 .on
11-Q4-89 1110 v .030 5.9 } R .on 5.6 .090 104.8 11,885 2,275 249 T .071 5.5 .110
11-Q4-89 1153 v .020 5.5 } R .039 5.4 .043 104.6 11,976 2,015 267 T .055 5.0 .073
11-Q4-89 1300 v .025 22 } R .043 12 .054 99.0 12,104 2,070 266 T .037 9.5 .054
11-o6-89 1108 v .044 20 } R .049 11 .062 12,212 1,972 275 T .042 10 .067
11-20-89 1410 v .057 4.4 } A .060 5.9 .072 101.7 9,971 1,919 228 T .032 5.4 .045
1See notes at end of table. \

49
Ground vibration Structure re- Charge Square Compo- Veloc- Frequency, Dura- sponse, in/s Air- Distance weight root
Date Time nent of \ ity, Hz tion, s Cor- Mid- blast, from per de- scaled motion1 in/s ner wall dB blast, ft lay, lb distance,
ft/lb112
HOUSE 105, DAYLIGHT, RECORDER (STORE 7)---Continuec!
11-21-89 1229 v 0.032 5 } R .046 13 0.055 112.6 10,526 3,285 184 T .042 6 .062
11-21-89 1453 v .037 20 } R .052 18 .064 113.7 10,397 3,285 181 T .026 5.4 .048
11-22-89 1116 v .103 4.1 } R .083 4.9 .100 117.5 10,253 6,225 130 T .on 4.4 .095
11-30-89 1104 v .027 4.7 } R .024 3 .032 104.2 9,787 1,798 231 T .017 4.8 .030
.• -30-89 1140 v .050 4.3 } R .037 5.1 . .A7 105.0 9,748 1,625 242 T .021 5 .027
12.07-89 1113 v .029 9 } R .061 12 .070 109.8 9,541 1,625 237 T .035 7.7 .055
12.07-89 1319 v .029 } R .034 .040 110.1 9,514 3,915 152 T .022 .027
12-23-89 1404 v .042 2.6 } R .051 12 .080 112 11,111 7,352 130 T .060 8 .080
01.03-89 1125 v .025 6.7.29 } R .039 7 .050 104.4 1o,on 2,900 187 T .032 6 .052
01.03-89 1450 v .025 5 } R .039 7 .050 110.3 9,981 3,190 1n T .027 7 .047
HOUSE 209, McCUTCHANVILLE, RECORDER (STORE 7)
11.01-89 1252 v } R 25,6n 7,482 297 T
11.01-89 1342 v <0.01 } A .021 5 0.035 0.039 25,785 3,596 430 T .012 6 .017
11.01-89 1540 v .012 } R .032 4.5 .on .085 26,055 4,234 400 T .021 5 .031
1See notes at end of table.

50
Ground vibration Structure re- Charge Square
Compo- Veloc- Frequency, Dura- sponse, infs PJr- Distance weight root
Date Time nent of ity, Hz tion, s Cor- Mid- blast, from per de- scaled
motion1 in/s ner wall dB blast, ft lay, lb distance,
ft/ib112
HOUSE 209, McCUTCHANV!LLE, RECORDER (STORE 7)-Continued
11..()2-89 1222 v <0.01 } R .0063 0.0078 0.017 19,013 325 1,054 T .0055 .0075
11..()3-89 1144 v <.01 10.5 } R .022 5.6 11 .052 .058 106.6 26,349 4,292 402 T .018 8.0 2.3 .040
11..()3-89 1329 v } R .024 4.3 7.7 .045 .053 26,638 4,408 401 T .021 6.0 10.5 .050
11..()4-89 1028 v .006 } R .021 .058 .062 26,851 3,596 448 T .016 .024
11..()4-89 1110 v .005 7.0 } R .028 6.0 .037 .040 26,932 2,275 565 T .020 6.0 .035
11..()4-89 1153 v <.01 } R .020 6.0 .038 .046 27,051 2,015 603 T .013 5.6 .017
11..()4-89 1300 v .006 11 } R .016 6 .030 .039 27,204 2,070 598 T .009 6.5 .024
11-()6-89 1108 v .004 5.0 } R .014 5.4 .031 .042 27,341 1,972 616 T .014 6.0 .027
11-20-89 1410 v } R .022 4.4 .040 .040 101 23,552 1,919 538 T .020 5.0 .027
11-21-89 1229 v } R .030 6.0 .049 .055 103 24,885 3,285 434 T .018 4.4 .026
11-21-89 1453 v .008 } R .025 4.7 .035 .045 103.9 24,633 3,285 430 T .019 5.6 .025
11-22-89 1116 v .005 } R .053 4.5 .096 .112 106.0 24,305 6,225 308 T .037 5.0 .055
11-30-89 1104 v } R .009 5.4 .014 .023 97.1 22,885 1,789 540 T .007 12.5 .012
1See notes at end of table. ·,_

51
Ground vibration Structure re- Charge Square Compo- Veloc- Frequency, Dura- sponse, in/s Air- Distance weight root
Date Time nent of , ity, Hz tion, s Cor- Mid- blast, from per de- scaled motion1 in/s ner wall dB blast, ft lay, lb distance,
ft/lb112
HOUSE 209, McCUTCHANVILLE, RECORDER (STORE 7)-Continued
11-30-89 1140 v 0.002 3 1 R .009 5.5 0.017 O.D18 22,624 1,625 561 T .008 6.0 .011 J
12-07-89 1113 v .019 } R .015 5.1 .029 .031 21,514 1,625 541 T .017 5.6 .021
12-07-89 1319 v } R 3,915 T
12-23-89 1209 v R T
1:: ::::-89 1404 v } R .019 4.3 .045 .046 114.0 25,908 7,352 302 T .022 5.0 .039
12-26-89 1200 v R T
12-27-89 1029 v R T
01-03-89 1125 v } R .019 .036 .037 24,089 2,900 447 T .019 .028
01-03-89 1450 v .004 4.5 } R .019 5.3 .029 .040 97.1 23,825 3,190 422 T .017 5.6 .025
1V = vertical; R = radial; T = transverse. Radial and transverse directions are-
House R T House R T House R T 105 E s 209 E N 303 E N 107 NE NW 215 E s 334 s E 108 E s
NOTE.-Biank cells indicate no data.

52
APPENDIX C.-SUMMARY OF VIBRATION AND AIRBLAST DATA FROM AYRSHIRE MINE BLASTING
Monitor location1 Time Charge weight, lb Distance to Square root scaled Vibration, Airblast, ;:'
and date Total Per delay blast, ft distance, ft/lb112 in/s dB
SOUTHWEST OF MINE, McCUTCHANVILLE DIRECTION
Cissell: 01..{)5-89 1055 3.400 178,100 12,379 212 0.07
1207 3,700 236,100 12,560 207 .09 01-10-89 1341 3,700 230,500 12,744 210 .11 01-12-89 1112 3,300 198,800 12,915 225 .08 01-17-89 1113 3,700 153,900 13,293 219 .06 <100 01-18-89 1448 450 3,400 13,980 659 .07 02-14-89 1201 2,900 145,200 12,175 226 .06
1424 3,700 204,000 12,342 203 .08 02-17-89 1350 3,700 177,700 12,706 209 .07 02-20-89 1031 3,100 71,300 12,853 231 .07 02-24-89 1345 3,300 137,900 12,965 226 .06 02-27-89 1313 3,200 70,600 13,075 231 .06 04-13-89 1108 2,200 44,500 13,405 286 .04 <100 06-16-89 1035 3,510 238,578 13,329 225 .10 100
M. McCutchan: 12-13-88 1421 3,900 87,700 18,111 290 .07 110 12-15-88 1131 2,600 146,700 16,622 326 .08 107 12-19-88 1440 1,900 98,600 16,541 379 .05 •106 01-10-89 1341 3,700 230,500 17,170 282 .09 109 01-12-89 1112 3,300 198,800 17,269 301 .06 <100 01-16-89 1058 3,600 123,800 17,408 290 .09 112
1114 3,800 108,500 17,346 281 .06 107 01-17-89 1113 3,700 153,900 17,491 288 .07 107
1433 2,000 86,200 17,594 393 .04 <100 01-18-89 0952 2,000 36,700 17,675 395 .05 107
1344 2,000 39,900 17,707 396 .05 <100 01-20-89 1337 2,000 57,600 17,893 400 .05 109 02-14-89 1201 2,900 145,200 16,803 312 .07
1424 3,700 204,000 16,886 278 .05 02-17-89 1350 3,700 177,700 17,091 281 .05 02-24-89 1345 3,300 137,900 17,239 300 .13 02-27-89 1313 3,200 70,600 17,304 306 .11
R. McCutchan (108): 02..{)4-89 ......• 1134 3,300 178,100 24,981 435 .05 103 02-14-89 1424 3,700 204,000 27,593 454 .03 107 04-06-89 1254 1,700 45,800 28,413 689 .07 124 04-13-89 1108 2,200 264,000 28,609 610 .05 103 05-15-89 1049 5,580 334,038 27,563 369 .05 103 05-23-89 1319 5,040 296,514 24,501 345 .05 103 06-16-89 1033 3,510 238,578 28,565 482 .04 103 07-21-89 1433 600 19,616 22,807 931 .02 121
16: 11-16-88 1400 2,000 115,800 6,135 137 .16 108 11-17-88 1329 2,400 166,400 6,243 127 .20 111 11-18-88 0917 2,400 82,800 6,319 129 .16 113 12..{)8-88 0939 4,000 236,800 5,751 91 .24 114 01-12-89 1112 3,300 198,800 5,600 98 .20 01-16-89 1058 3,600 123,800 5,657 94 .13
1114 3,800 108,500 5,597 91 .11 01-17-89 1113 3,700 153,900 5,682 93 .17 108
1Some are shown on map, figure 9.


54
Monitor location1 Time Charge weight, lb Distance to Square root scaled Vibration, Airblast, and date Total· Per delay blast, ft distance, ft/lb1/ 2 injs dB
NORTHWEST OF MINE, BASE LINE ROAD DIRECTION
C. Bohrer: 12-06-88 ....... 1014 3,000 217,400 13,176 220 0.~ <100 12-<>8-88 0939 4,000 236,800 12,821 203 .09 12-09-88 ....... 1034 4,000 241,500 12,469 197 .10 12-1(}88 ..•..•• 0931 3,800 240,700 12,096 196 .08 12-13-88 .....•. 1012 3,800 208,900 11,759 191 .10
1339 700 308,700 11,410 136 .15 1421 3,900 87,700 11,18$ 179 .08
12-23-88 ....... 1148 3,600 15,100 18,211 304 .04 12-29-88 ....... 1446 3,800 212,300 18,495 300 .05 01-05-89 ....... 1055 3,400 178,100 14,007 240 .07
1207 3,700 236,100 13,617 224 .10 01-12-89 1112 3,300 198,800 12,934 225 .06 01-17-89 1433 2,000 86,200 12,on 270 .05
1459 2,000 35,700 12,039 269 .03 01-18-89 0952 2,000 36,700 11,881 266 .04 02-17-89 1350 3,700 1n,1oo 13,051 215 .04
Haubstadt: 12-<>8-88 0939 4,000 236,800 53,100 840 .05 12-09-88 .•..... 1034 4,000 241,500 52,900 836 .03 12-1(}88 ....... 0931 3,800 240,700 52,500 852 .05 01-05-89 ..•.... 1207 3,700 236,100 53,700 883 .04 01-10-89 •.....• 1341 3,700 230,500 53,400 878 .04 01-12-89 .....•. 1112 3,300 198,800 53,200 926 .03 01-16-89 .•..... 1058 3,600 123,800 52,900 882 .04 01-17-89 ...•.•. 1113 3,700 153,900 52,600 865 .03 02-14-89 1424 3,700 204,000 53,800 884 .03
12: 09-27-88 1038 2,200 105,500 4,682 99 .32 09-29-88 1101 2,200 113,400 4,408 93 .42 10.01-88 1425 2,400 141,800 4,158 84 .65
1450 1,800 126,000 3,925 92 .43 10-04-88 1330 1,800 124,700 3,617 85 .31 1Q.05-88 1011 1,800 108,400 3,353 79 .49 1Q.06-88 1018 2,200 109,000 3,084 65 .79 10.07-88 1147 2,400 121,800 2,838 57 .68
1205 2,400 29,300 2,818 57 .57 1Q.08-88 1320 2,400 n,400 2,615 53 .31
1336 2,400 48,000 2,592 52 .35 1351 2,400 31,500 2,581 52 .27
11-07-88 ......• 1400 1,800 28,000 4,711 111 .39 1517 2,000 44,800 4,744 106 .14 1534 2,000 67,900 4,753 106 .26 1606 2,700 118,850 4,480 86 .47
11-09-88 ....... 1404 2,700 208,100 4,189 80 .63 11-12-88 ....... 1350 2,600 196,400 3,781 74 .54 11-14-88 ......• 1151 2,600 137,500 3,503 68 .60 11-15-88 ..•.... 1143 2,000 130,200 3,254 72 .58 11-16-88 ....... 1344 1,800 28,500 2,978 70 .48
1400 2,000 115,800 2,994 66 .97
1Some are shown on map, figure 9.
'\.

55
Monitor 1ocation1 Time Charge weight, lb Distance to Square root scaled Vibration, Airblast, and date Total Per delay blast, ft distance, ft/lb1
/2 in/s dB
NORTHWEST OF MINE, BASE LINE ROAD DIRECTION-Continued
12: 11-17-88 1329 2,400 166,400 2,734 55 11-18-88 0917 2,400 82,800 2,519 51 12-06-88 1014 3,600 217,400 4,683 78 0.72 12..()8..88 0939 4,000 236,800 4,283 67 .74 12-09-88 1034 4,000 241,500 3,896 61 .67 12-10-88 0931 3,800 240,700 3,470 56 .67 12-13-88 1021 3,800 208,900 3,088 50 .70
1339 7,000 308,700 2,691 32 1.22 1421 3,900 87,700 2,438 39 .80
15: 12-06-88 1014 3,000 217,400 10,124 169 .27 12..()8..88 0939 4,000 236,800 9,n3 155 .27 12-09-88 1034 4,000 241,500 9,425 149 .24 12-1(}.88 0931 3,800 240,700 9,058 147 .20 12-13-88 1012 3,800 208,900 8,729 142 .16
1339 7,000 308,700 8,391 100 .24 1421 3,900 87,700 8,174 131 .24
01-Q5-89 1055 3,400 178,100 10,952 188 .17 1207 3,700 236,100 ~0,562 173 .21
01-12-89 1112 3,300 198,800 9,882 172 .19 02-17-89 1350 3,700 1n,1oo 9,996 164 .16
18: 01-12-89 1112 3,300 198,800 4,825 83 .71 01-16-89 1058 3,600 123,800 4,431 73 .57
1114 3,800 108,500 4,436 71 .54 01-17-89 1113 3,700 153,900 4,086 67 .69
1433 2,000 86,200 3,845 85 .34 1459 2,000 35,700 3,827 85 .15
.01-18-89 ......• 0952 2,000 36,700 3,620 80 .31 1000 2,000 5,400 3,501 78 .19 1010 2,000 42,600 3,587 80 .35 1022 2,000 13,500 3,635 81 .16 1033 2,000 8,100 3,511 78 .12 1159 2,000 51,300 3,360 75 .30 1335 2,000 17,200 3,336 74 .37 1344 2,000 39,900 3,347 74 .33 1353 2,000 13,100 3,225 72 .16 1448 450 3,400 2,807 132 .24
01-20-89 .••.... 1337 2,000 57,600 3,064 68 .42 1434 2,000 91,600 3,083 68 .54 1532 1,700 55,000 2,812 68 .48 1629 1,700 52,300 2,795 67 .45
02-17-89 .•...•• 1350 3,700 1n,1oo 5,005 82 .42 02-20-89 ...•••. 1031 3,100 71,300 4,696 84 .33 02-24-89 ....... 1014 3,300 137,900 4,484 78 .43 02-27-89 1313 3,200 70,600 4,267 75 .37 03-Q1-89 1057 1,700 80,000 4,098 99 .52 03-Q3-89 1014 1,700 59,100 3,838 93 .19
1408 1,700 68,700 3,813 92 .31
1Some are .shown on map, figure 9.

56
Monitor location1 Time Charge weight, lb Distance to Square root scaled Vibration, Airblast, and date Total Per delay blast, ft distance, ft/lb1
/2 injs dB
NORTHWEST OF MINE, BASE LINE ROAD DIRECTION-Continued
18: 03-06-89 1109 1,700 50,000 3,514 85 0.34
1246 1,700 48,400 3,499 84 .37 03-07-89 1118 1,700 41,200 3,260 79 .33
1154 1,700 34,600 3,223 78 .39 1416 1,700 84,500 3,070 74 .sa
03-09-89 ....... 0917 1,700 6.800 2,977 72 .32 1030 1,700 47,600 2,89? 70 .61 1117 1,700 29,600 2,875 69 .92 1325 1,700 6,000 2,785 67 .21 1353 1,700 26,500 2,738 66 .52 1414 1,700 11,700 2,723 66 .21 1436 1,700 21,900 2,722 66 .23
04-()3-89 1417 3,600 102,400 4,277 71 .41 04-05-89 0945 1,700 46,400 4,037 97 .29
1403 1,700 42,400 3,751 90 .28 ()4..()6-89 1038 1,700 55,400 4,046 98 .27
1254 1,700 45,800 3,766 91 .32 04-07-89 1449 3,700 247,600 4,995 82 .36 04-1()-89 1044 3,300 187,700 4,566 79 .29 04-13-89 1108 2,200 44,500 3,484 74 .33
1205 1,700 55,000 3,473 84 .26 1419 2,200 62,000 3,195 68 .40 1448 1,700 67,300 3,193 77 .35
04-17-89 ••.•... 1020 2,200 33,100 2,962 63 .47 1042 1,700 37,400 2,937 71 .47 1205 3,400 63,700 2,762 47 .42 1322 1,700 56,400 2,752 66 .37
1Some are shown on map, figure 9.

57
APPENDIX D.-SELECTED HIGH-LEVEL AIRBLAST INCIDENTS
Date Time. Airblast, Blast at Distance Wind dB time of "event• from blast, miles1
Direction Speed, ml/h
04-06-89 1254 124 Yes 5 w 12 07·12-89 1724 123 No NAp SW 6 07·21-89 1443 121 Yes 5 w 5 09-19-89 0915 121 Yes 9 NE 6 10.17-89 0803 121 Yes 9 N 12 10.25-89 1811 128 No NAp N 3 10.30-89 1539 128 No NAp sw 11 12-02-89 0809 131 No NAp NW 11 12-06-89 0832 130 No NAp N 4 12-09-89 1238 127 No NAp NAp 0
NAp Not applicable. 1Distance of about 9 miles corresponds to Lynnville mine of Peabody Coal Co. Distance of about 5 miles corresponds to Ayrshire mine of AMAX Coal Co.
NOTE.-Ail data are from monitoring near house 10A except for 09-19-89 data, which are from near house 107.

58
APPENDIX E.-SOil-FOUNDATION INTERACTIONS
ILLINOIS STUDIES
Murphy (25)1 tabulated 17 factors associated with foundation failures, as part of a 6-year review of claims for the Illinois Mine Subsidence Insurance Fund. Six of the factors are especially relevant to the situation observed in the Daylight-McCutchanville area and are discussed here. Some of the remaining 11 items may be pertinent, but they are not considered here because of the lack of supporting information. The six relevant factors are soil desiccation, soil shrink-swell, soil freeze-thaw, soil densification by vibration (liquefaction), piping of soils beneath foundations, and upward buoyancy of structures caused by a seasonal high-water table. Also worthy of consideration are variations in the load-bearing capacity of soils found in this area.
The Illinois State Geological Survey (ISGS) reported in the summer 19«~::: ~ •· (2ol that its water survey scientists had examined rainfall amounts during the periods between January and June for the last 100 years. They averaged the 10 years with the lowest rainfall and found that 1988 rainfall was lower than average. Although similar climatological data for Indiana are unavailable to the authors at the present time, given the close proximity of the two States it is reasonable to conclude that soil moisture conditions were generally the same in both. This information is significant in that ISGS scientists reported in the aforementioned article that they had observed a link between soil behavior during the drought and damage in the form of cracked basement walls and, in extreme cases, collapsed foundations.
According to Bauer (27), the mechanism explaining the drought-related foundation damage is as follows:
Compression forces against foundation walls are most commonly developed by an increase of soil moisture after an extended dry period. During long, extremely dry weather, the soil shrinks and pulls away from the foundation, and soil particles fall into the resulting gap. Wind, animals, and rain may also push materials into the resulting gap. The return of moisture to the soil causes clay particles in the gap and in the adjacent soil to expand, exerting horizontal pressure on the foundation walls. Horizontal pressures push the foundation walls inward, forming a bow shape with the midspan of the wall pushed farthest inward. The foundation walls ~ually have horizontal cracks within 2 feet of the ground surface. We conclude that horizontal pressures are generally
1Italic numbers in parentheses refer to items in the list of references preceding appendix A.
built up by :l combination of wetting/drying and swelling/shrinking cycles. It may take many such cycles to exert enough pressure to damage the foundation, although the process can be accelerated by drought.
Rose (28) found that the horizontal cracks mentioned in the previous paragraph often occur at the level of the bottoms of the basement windows; such cracks were observed to be prominent in house 105, and evident to a lesser degree in houses 215 and 334, in the Daylight area when Bureau researchers visited these homes. Homes in the McCutchanville area (with the exception of house 201 in the vicinity of the Evansville airport, with a block foundation extensively cracked and bowed inward) in generaJ had basement walls covered with some type of plaster, or were in some other way finished, so that damage of this type could not readily be assessed. In any case, soil conditions in these two areas are different, as explained in the "Geology of Study Area" section of this report, and the active mechanism may not be the same for ~e two study areas.
Indicative of the relative severity of the drought-related foundation damage in Illinois is a press release published in June 1988, by the Building Research Council at the University of Illinois (29).2 This release instructs homeowners to keep the soil moist around their foundations during the drought by shading, mulching, covering, or watering if possible. Also, an article (30) entitled "Drought May Wreak Foundation Damage," published in the September 21, 1988, issue of the Champaign-Urbana News-Gazette quotes a representative of the Small Homes Council as saying that homeowners who do not take such preventative measures could have problems. When foundation problems have occurred, the usual solution is to excavate the soil around the foundation to relieve the earth pressure. Sinlilar problems occurring in Missouri were described in an article in the St. Louis Post-Dispatch (31).
SOIL SHRINK-SWELL
Southern Illinois is not known for having highly expansible soils, unlike areas of the western United States. One would not generally expect to see such problems as described above in Illinois during times of average precipitation. A well-known example of an area having highly expansible soils is Denver, CO. In some parts of Denver soils containing the clay'mineral ben~onite have been found to cause extensive foundation cracking and buckling.
2Press release is included as appendix F.

Damage in these areas typically takes place within 2 years after the homes are completed, which is indicative of the highly active nature of the soils present (32). Most of the damage to the homes in the OSM study area in Indiana, however, apparently occurred many years after they were built. This implies that the soils in DaylightMcCutchanville are not highly expansible in the usual sense, but may respond to more severe than usual drought cycles.
Although the Bureau, as part of the OSM effort, was not responsible for determining soil properties, at the conclusion of the vibration monitoring, the authors collected one soil sample from the ground surface near the foundation of house 108. This sample was submitted to the University of Minnesota's Soil Science Department for analysis. It was not. otherwise specially prepared or handled. In general, the soil was classified as a silt loam, following the USDA system. It was found to have a moderate shrink-swell hazard due to the presence of expansible smectite and interlayered smectite-illite clays (33). The 1c:.ults from one sample are obviously not definitive, but they do indicate the possibility that soil expansibility could have been at least partially responsible for the damage to the foundation of house 108, and possibly to other homes in the upland area near McCutchanville. Further work is required to establish the credibility of this hypothesis for the entire study area.
There is one point regarding the shrinking and swelling of clay~containing soils needing emphasis. This is a cyclic process, as· was previously mentioned in the quotation from Bauer (27). Once the soil surrounding a foundation has been disturbed by excavation and backfilling, it may take many cycles of prolonged wetting and drying for horizontal soil pressures to increase enough to damage that foundation. Research by Osipov (34) shows that the number of wet-dry cycles required to produce the maximum amount of expansion in disturbed soils ranges from 3 to 4 in modern silts to 6 to 20 in lithified clays. Therefore, since most homes examined in the OSM study area are less than 40 years old, and serious foundation damage has occurred only recently, it is possible that the drought of 1988 was the last in a series of prolonged wet-dry cycles required to produce that effect. Construction techniques, soil characteristics, and landscape vary enough that some homes will be affected to a greater or lesser degree than others. Without additional studies, this causation must remain only a hypothesis.
SOIL FREEZE-THAW
Another soil characteristic is its response to ambient temperature fluctuations above and below the freezing point of water. Silts are the deposits most susceptible to
59
frost heaving (28). In fact, the relatively silty soils found in the upper and middle surface of the study area drain slowly (35), probably for a number of reasons given by Hester (16), thereby contributing to the frost-heaving hazard for structures situated in this soil. The climate in the area is generally moderate, however, and this should be a relatively minor problem in the Daylight-McCutchanville area, with a shallow depth of freezing in winter (35). Structures with the highest risk of heaving and cracking, however, are poured floors in unheated garages, concrete· driveways, patios, etc., and (hypothetically during abnormally cold periods) foundations whose loose footings lie relatively near the ground surface. This last condition is more likely to oecur to footings located in the sloping portions of the study area, particularly footings on the downslope side of the house. Freeze-thaw action could also theoretically cause a gradual downhill creep of the soil and house. The most extensive cracking in house 108 occurred on the downslope side. Frost heaving could have played a role in causing that damage, although a more thorough examination by qualified professionals would be required to establish that as fact. One definite example of frost heaving was noticed by researchers at house 209, mentioned previously.
SOIL LIQUEFACTION
Soil liquefaction by vibration has been hypothesized by some homeowners as a possible cause for the damage to the homes in the study area. Soil liquefaction is the vibration-induced loss of cohesion and bearing capacity of soil. It is caused by an increase of pore pressure from the shaking-induced rearrangement of particle grains into a ~ore compact form. Saturated cohesionless soils are susceptible to this effect, particularly fine dense sands with low permeability. Liquefaction is also a time-dependant phenomenon, starting at depth and. moving upward. Seed (36) cited a cas~ in which liquefaction was observed after 10 vibration cycles at 20-ft depth and after 80 cycles at the surface from a 0.165-g horizontal vibration; the water table was within 2 to 3 ft of the surface. This is equivalent to 1.0 in/sat 10Hz and 2.6 in/sat 4Hz {4Hz was the dominant frequency measured by the Bureau in McCutchanville). Paolillo (37) stated that settlement due to liquefaction can occur in loose, saturated, cohesionless soils at 0.05 to 0.20 g, although the low end of this range would be a conservative criterion as it is unlikely that soil under existing buildings would be in loose condition.
Because of the time dependence of liquefaction and the short durations of blasting vibrations, seconds rather than minutes, liquefaction is unlikely. This is particularly so at vibration levels usually encountered in blasting, less than

60
1 in/s, and particularly at 0.02 to 0.1 in/s as measured by the Bureau in the study area.
PIPING OF SOILS
The ptpmg (draining away) of soils from beneath foundations is of particular interest because the loess, with its high silt content, found in the upper and middle surfaces of the study area, is prone to exhibit this behavior. Rose (28) cites a case in which a homeowner with a high water table installed a sump pump without filter fabric to dewater his basement and consequently excavated four tons of the relatively free-flowing saturated silt from beneath his footings. Bauer (27) states that loess can easily be piped from along poorly sealed subsurface drainage systems, which can lead to a differential lowering of the foundation and development of tensile cracks. This mechanism could be partially responsible for the damage observed in house 108 and, from the homeowner's description, possibly house 303, although the major damage in LIDS house had already been repaired when the authors frrst inspected it. A followup walkthrough inspection was made by a Bureau researcher after the completion of the vibration project. One house in McCutchanville (301), not part of the original study, was found to have a collapsed concrete garage floor. All the soil beneath the collapsed portion was gone, apparently carried away by the drainage system. Additional study of piping behavior in this community is highly appropriate.
UPWARD BUOYANCY
The .upward buoyancy of structures caused by a seasonal high water table (or the settlement of structures due to fluctuations in ground water level) is a matter of concern in the study area, especially in homes having significant differences in their footing elevations. If a home is built partly over a full basement and partly over a crawl space, for example, and the ground water level is near the footings, variations in the water level could cause portions of the house to settle differentially (38). This settlement could cause cracks to appear in the walls and ceilings above ground level and potentially in the foundation should it not settle evenly. A dense fragipan typically located at about 25 to 3 ft of depth in the upper surface of the study area has the potential for creating a seasonally perched water table that might activate this mechanism (16). House 107 is situated in this surface, and at least some of the cracking observed in this house might thus be explained.
SOIL LOAD-BEARING CAPACITY
The load-bearing capacity of the study area soils varies; the various capacities were loosely grouped into two cate-gories by Straw (35). ·
The lacustrine materials found m the lower surface were reported to provide poor foundation conditions for all but relatively light loads. The soils are stated to be saturated with field moisture contents well above the optimum moisture for proper compaction and maximum strength. House 105 was located in the lower surface near the lower-middle surface boundary. Damage to homes in the lower surface, however, was generally less severe than that found in homes in or near the upper surface; the level-loop surveys indicated little movement away from level in the lower and near-lower surface homes. This implies that the bearing capacity of the lacustrine soils is sufficient to properly support the inspected homes situated therein.
The bearing capacity of the silty soils of the upper to .mrfaces was reported to be adequate for light to
moderate foundation loads, and bedrock of good bearing capacity can be reached at shallow depth if necessary. The bearing capacity of the soil is commonly significan,tly less, however, when the material is saturated than· when it is dry. This could be a problem if downspouts discharge along the comers of foundations during wet weather, saturating and reducing the bearing capacity of the silty soil. The foundation could consequently be cracked near the comers in stair-step fashion and lowered, with the comers rotating outward and downward (27). The damage observed in house 108 and that reported to have occurred on house 303 might at least be partially attributed to this mechanism. Also, prolonged wet weather could saturate the material under the footings around the entire circumference of the house. Lack of rain gutters or leaky gutters would accelerate this process. If the house was located on a slope in the upper or middle surface, the upslope footings might be at or near bedrock and the downslope footings could be resting on several feet of silty soil. Upon becoming saturated, the silty soil would decrease in bearing capacity, possibly past the point required to induce foundation settlement. The downslope side of the house would thus settle more than the upslope side, possibly causing foundation and superstructure cracks. The levelloop surveys show that the downslope side of house 209 is in fact lower than the upslope side; this trend is evident but not as definite in houses 108 and 303. Assuming these homes were originally built relatively leve~ the process described above could· explain the apparent downslope

movement measured by the surveys. One must keep in mind that it is difficult and uneconomical to build a house perfectly level and plumb. :Oifferences of as much as 1 in (0.08 ft) in level from corner to corner in a newlyconstructed home are not unusual and are principally due to variations in the quality control of the materials used.
In summary, there are obviously many soil-related factors potentially responsible for the variety of damage
61
observed in homes in the Daylight-McCutchanville area. In any one location several mechanisms could operate simultaneously, making a proper assessment difficult. Additionally, construction techniques and quality vary from home to home. Each damage situation is therefore unique and deserves more than the cursory treatment received here to truly determine the causative element at work..

62
APPENDIX F.-PRESS RELEASE ON DROUGHT EFFECTS ON BASEMENT WALLS
PRESS RELEASE
June 21, 1988
Small Homes Council-Building Research Council Un:versity of Illinois
Illinois State Geological Survey
PROTECT YOUR CONCRETE BLOCK BASEMENT WALLS FROM THE PRESSURES INDUCED BY DROUGHT
Staff of the Small Homes Council of the University of Illinois and the Illinois State Geological Survey have observed that multiple episodes of drought may cause some concrete block basement walls to crack and deform. Here's how:
Soil containing clay minerals will swell or shrink depending on whether it is wet or dry. Right now during the drought, the soil is very dry. So the soil around many house foundations, where it is exposed and unprotected, has shrunk away from the walls creating a vertical separation which may be 1/2-inch wide at the top and 2-feet deep. This separation of the soil from the wall is not detrimental as long as it stays open and free of any debris which may be deposited by the wind, water (initial rainfalls or watering) or animals traveling next to the foundation. If dirt is allowed to accumulate repeatedly in the open crack, then concrete block basement walls may be headed for trouble. When the rains come again, the soil will try to swell back to its original dimension but is hindered by the debris that has accumulated _in the crack. This increases the pressure on the walls after each dry period. Years of accumulation and pressure buildup can cause the walls to bulge inward and in extreme cases, can cause the basement walls to collapse.
To protect your basement walls against damage from drought:
--keep the soil moist around the foundation by shading, mulching, covering and watering if possible. Respect water use limitation during droughts.
When the rains come and the soil swells back, do not become alarmed if hairline cracks form in concrete block basement walls. If the inward deflection is greater than 2" for an 8-inch thick wall, the wall may need to be repaired.
For more information contact Mr. William Rose at the Small Homes Council (217) 333-1801.
INf.BU.OF MINES,PGH.,PA 29724
*U.S.G.P.O.: 1993-509-008/80051


![Blast vibration modeling using linear superposition methodjme.shahroodut.ac.ir/article_450_9fde67ade5c059e... · ground vibrations caused by mine blasting operations [1-23]. Perhaps,](https://img.pdfslide.net/doc/110x75/5f9d29c0d219cd501468b4ec/blast-vibration-modeling-using-linear-superposition-ground-vibrations-caused-by.jpg)