Embed Size (px)
Citation preview

Munich Personal RePEc Archive
Blessing or curse? Government funding
of deposit insurance and corporate
lending
Delis, Manthos and Iosifidi, Maria and Papadopoulos,
Panagiotis
18 March 2020
Online at https://mpra.ub.uni-muenchen.de/99153/
MPRA Paper No. 99153, posted 18 Mar 2020 07:48 UTC
brought to you by COREView metadata, citation and similar papers at core.ac.uk
provided by Munich RePEc Personal Archive

Blessing or curse?
Government funding of deposit insurance and corporate lending
Manthos D. Delis Montpellier Business School
Maria Iosifidi Montpellier Business School
Panagiotis Papadopoulos University of Surrey
Blessing or curse? Government funding of deposit insurance and corporate
lending
Abstract
A key policy to limit the possibility of bank runs is an explicit deposit insurance scheme, which can be either privately or government funded. Using syndicated loans from 63 countries during the period 1985–2016, we study the effect of government involvement in deposit insurance funding on price and non-price characteristics of loans. We show that changes from purely private-funded to either government-funded or jointly funded deposit insurance increase all-in-spread-drawn by approximately 4.6%, further increase loan fees, decrease loan maturity, and increase the use of performance pricing provisions. Our findings are consistent with the moral hazard problem behind government-funded deposit insurance schemes.
JEL classification: G21; G28; G38 Keywords: Deposit insurance; Government or private funding; Lending terms; Syndicated loans
1
1. Introduction
Deposit insurance is a fundamental pillar of the financial safety net policies in many countries,
constituting an integral part of their banking systems’ modus operandi. The last three decades
witnessed a large increase in the number of explicit deposit insurance schemes (henceforth,
simply called deposit insurance) operating worldwide, and the literature has pointed out several
effects of the introduction of such laws in shaping the banking landscape (e.g., Demirgüç-Kunt
and Detragiache, 2002; Demirgüç-Kunt and Huizinga, 2004; Demirgüç-Kunt et al., 2015; and
others). Although the effects of adopting deposit insurance are well researched, little analysis
exists on the effect of funding sources. To construct their funding mechanism, deposit
insurance schemes generally rely on two sources: private funds (i.e., insurance premiums paid
by the banking institutions participating in the scheme) or public (government) funds (i.e.,
funding is either solely public or jointly provided by member banks and the government).
In the late 1990s, in approximately 65% of the countries that had adopted some form
of deposit insurance, governments participated in the funding (Demirgüç-Kunt et al., 2005).
Since the mid-2000s, a gradual change from government or jointly funded deposit schemes to
exclusively privately funded schemes has taken place in several countries. As of 2015, in more
than 75% of countries where deposit insurance is used, the legal requirement is that deposit
insurance funding must come exclusively from contributions by the insured banks (Demirgüç-
Kunt et al., 2015). This development naturally generates a research question about whether
government involvement in deposit insurance funding affects bank lending. This is the question
we answer in this paper.
From a theoretical viewpoint, the effect of government involvement in deposit
insurance funding is ambiguous. On one hand, purely private funding of deposit insurance is
costly to banks, who might aim to pass this cost (at least partially) along to their borrowers (the
passing-cost view). This implies a straightforward mechanism through which we should
2
observe higher lending rates in countries with privately funded deposit insurance. In contrast,
the public sector’s supplementary funding reduces the relevant cost for the member banks,
potentially allowing these banks to provide more-competitive lending terms or laxer lending
terms altogether (e.g., lower collateral and covenant requirements).
On the other hand, there is a standard moral hazard–adverse selection argument against
government involvement. Specifically, government-funded deposit insurance potentially
encourages inferior screening and monitoring of borrowers, which in turn leads to more-
stringent price and non-price lending terms. Further, the pool of borrowers within a
government-funded scheme might on average be more risky. The outcome is less efficient
banking with higher loan defaults (e.g., Beck, 2002; Kaminsky and Schmukler, 2003; Brissimis
et al., 2008; Andries and Capraru, 2013). If this mechanism prevails, we expect more
competitive lending terms in banking systems with solely privately funded deposit insurance,
in spite of the extra cost imposed on participating banks.
To examine the effect of deposit insurance funding source on intermediation efficiency
and bank lending decisions, we match information on deposit insurance schemes with
syndicated loan deals (data from DealScan). The syndicated loans are provided by one or more
lead lenders and participant banks to a single firm. These data are ideal because they provide
information on lending terms (both price and non-price) of large corporate loans originated
across several countries with different and changing deposit insurance schemes. DealScan
covers the post-1985 period, but for most countries coverage starts around 1993–94. Since then,
we document 38 regulatory changes in 32 countries in the deposit insurance funding source
(from purely private to government or jointly funded, or vice versa). Also, approximately 47%
of the corporate loans are provided by banks operating in countries with privately funded
deposit insurance and 53% by banks in countries where the government participates in the
3
schemes. Thus, our sample has considerable variation in the funding source of deposit
insurance schemes both across countries and years.
We carry out our empirical analysis at the loan level (loan facilities), as this is
particularly helpful with empirical identification. Specifically, most banks (firms) in our
sample extend (receive) several loans. This allows us to use bank and firm fixed effects to
control for several bank-, firm-, and country-specific (time-invariant) characteristics that
potentially affect lending terms. Identification in these models comes from within-country
changes in the funding sources of deposit insurance schemes. Given that the changes in the
schemes take place in different years, our model represents a differences in differences (DID)
model with variation in treatment timing (Goodman-Bacon, 2018). We further control for
several bank-year characteristics (reflecting capital, risk, size, and performance), firm-year
characteristics (leverage, value, performance, and size), and quite importantly, more than 100
country-year variables, reflecting countries’ economic, financial, regulatory, and general
institutional environment.
In an important robustness test, we also use an instrumental variable (IV) based on the
practice of countries in the region on deposit insurance schemes. Specifically, we use regional
waves in changes of the deposit insurance funding source, excluding the own country,
controlling in the first stage for numerous country-specific institutional and macroeconomic
variables (including bilateral trade flows). This instrumentation follows Acemoglu et al. (2019)
in their study of the effect of democracy on economic growth; Delis et al. (2019) in their study
of the effect of democracy on bank lending; and, importantly, Demirgüç-Kunt and Detragiache
(2002) in their study of the effects of adopting an explicit deposit insurance scheme on bank
risk and financial stability.
Our baseline specifications show that government involvement in deposit insurance
funding leads to an increase in the all-in-spread-drawn (defined as the spread over LIBOR plus
4
any facility fee) by approximately 11 basis points (equal to a 4.6% increase compared to the
mean all-in-spread-drawn in our sample). This price increase is economically significant,
translating to a $1.5 million higher cost of credit (for the mean loan), and denotes more
competitively priced corporate loans from banks operating in countries with exclusively
privately funded deposit insurance. Further, loan fees (in particular, commitment and facility
fees) increase by more than 7% compared to our sample’s average.
Our findings survive a large battery of sensitivity tests. First, our results become slightly
more potent when using our IV approach: we find that government-funded deposit insurance
increases the all-in-spread-drawn by 14 basis points, while the increase in loan fees is
approximately 8%. We next show that our results are robust to the inclusion of more than 100
country-specific controls, including controls for other bank regulations and/or institutions or
the occurrence of systemic banking crises. Further, our results are robust to the use of (i)
different fixed effects and standard error clustering, (ii) different subsamples, and (iii) different
loan-level controls and a SUR model to avoid a “bad controls” problem.
Overall, our findings are consistent with the moral hazard viewpoint of deposit
insurance funding, indicating less incentive on the part of depositors to monitor bank lending
decisions and on the part of banks to monitor borrowers and lead arrangers’ lending strategies
in the syndicated loan industry. These effects dominate over the “passing cost” view and
intensify the moral hazard problems already caused by the presence of deposit insurance. This
in turn leads to higher lending rates and overall cost of credit.
This study is the first that directly ties the deposit insurance funding source to banks’
lending decisions and mainly contributes to two strands of literature. First, we extend the results
of studies by Demirgüç-Kunt and Detragiache (2002), Demirgüç-Kunt and Huizinga (2004),
and Gropp and Vesala (2004), which focus on the effects of establishing an explicit deposit
insurance scheme on bank risk and performance. Second, we contribute to the literature on
5
institutional determinants on lending terms (e.g., Qian and Strahan, 2007; Delis et al., 2019).
These institutional determinants come in the form of creditor rights or general political
institutions, and the effect of bank regulations on lending terms is relatively understudied.
Section 2 reviews the existing literature so as to motivate our study, explores the potential effect
of deposit insurance funding sources on lending terms, and specifies our paper’s research
question. Section 3 describes the dataset and its suitability to answer our main research
question, and discusses our approach to identify a causal effect running from deposit insurance
funding to bank lending terms. Section 4 presents the empirical results, and Section 5
concludes, discussing the policy implications based on our findings.
2. Theoretical considerations
2.1. General economic effects of deposit insurance and its funding sources
An explicit deposit insurance scheme is considered a significant regulatory pillar for the
promotion of financial stability, first established in the U.S. as a policy reaction to the Great
Depression and associated bank runs. Although no other country adopted an explicit deposit
insurance scheme until the 1960s, almost every country currently has one in place. During the
1990s, the use of explicit deposit insurance schemes spread rapidly. In the years leading up to
and during the 2007 global financial crisis, a large number of countries either enacted deposit
insurance for the first time (e.g., Australia, New Zealand) or made numerous changes in their
schemes (to become more extensive in coverage and/or change funding sources). Currently,
more than 113 countries have adopted some form of deposit insurance and several others are
considering doing so (Demirgüç-Kunt et al., 2015; Bergbrant et al., 2016). This group
represents more than 85% of high-income countries (according to the World Bank definition)
and 96% of European countries.
6
A considerable literature focuses on the benefits and drawbacks of deposit insurance.
Although deposit insurance schemes were adopted primarily to enhance public confidence in
the banking system, prevent inefficient bank runs, and protect small depositors (Diamond and
Dybvig, 1983; Demirgüç-Kunt and Huizinga, 2004), the literature also highlights adverse
effects (Demirgüç-Kunt and Kane, 2002; Calomiris and Jaremski, 2016). Specifically, the
existence of deposit insurance is linked to lower growth of the financial system (Bergbrant et
al., 2016) and an increase in the likelihood of banking crises (Kane, 1989; Wheelock and
Wilson, 1995; Demirgüç-Kunt and Detragiache, 2002; Barth et al., 2004), and financial
fragility (Demirgüç-Kunt and Detragiache, 2002; Beck, 2002; Demirgüç-Kunt and Huizinga,
2004; Anginer et al., 2014; Calomiris and Jaremski, 2016). The source of the adverse effects is
mainly moral hazard via excessive risk-taking by banks (Merton, 1977; Keeley, 1990; Kane,
1989; Beck, 2003; Demirgüç-Kunt and Huizinga, 2004; Ioannidou and Penas, 2010; DeLong
and Saunders, 2011; Barth et al., 2013; Beck et al., 2013; Anginer et al., 2014; Lambert et al.,
2017; Brandao-Marques et al., 2020).
A deposit insurance scheme is financed either exclusively by covered institutions (i.e.,
the member banks fund the scheme and contribute premiums to build the funding pool) or with
government participation in the funding. In the latter case, the scheme is either solely
government funded (i.e., with no involvement from the private sector) or jointly funded (i.e.,
partially funded by premiums levied on member banks and eligible for additional government
resources when the system is established or if a crisis occurs). Government-funded deposit
insurance refers to both startup and ongoing funding. Such schemes of course depend on a
government’s ability to generate income (through taxes and other common sources), but
governments might also face considerable public and internal pressure to provide the funds in
light of a large failure.
7
In contrast to the large literature on the effects of initiating a deposit insurance scheme,
we know much less about the potential effects of a scheme’s funding sources. These effects
deserve special attention because they are crucial to the overall design of a deposit insurance
scheme (IADI, 2009) and banks’ performance (Beck, 2002). Further, despite the almost
universal adoption of deposit insurance, funding sources differ significantly between countries
and over time (Beck, 2002; IADI, 2009; Demirgüç-Kunt et al., 2015).
2.2. Funding source and corporate lending
Theoretically, government participation in deposit insurance funding can have both positive
and negative effects on the cost of credit. On the positive side, the argument is fairly
straightforward: if a scheme collects premiums from the member banks, these banks might opt
to pass along the cost (at least partially) to the borrowing firms. This scenario would in turn
generate more stringent lending terms, leading to inefficient economic outcomes in terms of
higher investment costs, use of stricter loan covenants, and/or lower credit volume. If instead
governments finance the scheme, the lower costs incurred by banks can be viewed as a transfer
to borrowers and yield more competitively priced lending and more efficient corporate
financing. Accordingly, other non-price terms of lending might be better for firms, including
fewer covenants, performance provisions, and collateral requirements.
On the other hand, and consistent with the “moral hazard” view of deposit insurance,
government participation in deposit insurance funding might lead banks to adopt riskier lending
strategies and originate loans with higher interest rates than they would if the deposit insurance
were entirely bank funded. Demirgüç-Kunt and Detragiache (2002) provide evidence that
overall financial stability (at the macro level) is weaker when deposit insurance schemes
operate with some form of government support. Along the same line, Demirgüç-Kunt and
Huizinga (2004) argue that government-funded schemes lead to inferior screening and

8
monitoring of lending institutions, introducing additional adverse selection and moral hazard,
and eventually encouraging unnecessary risk-taking by banks.
In our context, the theoretical arguments on inferior lending terms resulting from
government-funded deposit insurance imply that banks finance riskier borrowers and higher-
risk projects than they normally would. These decisions in turn imply an increase in lending
rates and loan guarantees to cover the higher risks. In contrast, privately funded schemes are
more flexible in monitoring and controlling (England, 1985; Ely, 1986), as well as enhancing
regulatory incentives to monitor and discipline excessive bank risk-taking (Kane, 2000). In
addition, in privately funded systems, member banks further encourage monitoring among each
other, in this way replacing monitoring by depositors and creditors with peer monitoring (Beck,
2002; Demirgüç-Kunt et al., 2015). Thus, within privately funded deposit insurance, we expect
less risky lending at lower rates and fewer guarantees.
Given the two opposing arguments, the effect of the deposit insurance’s funding source
on the corporate lending terms becomes an empirical question, which we take up in the
following empirical analysis.
3. Data, variables, and summary statistics
3.1. Data and variables
We use data from two main sources. First, we use syndicated loan-level data from DealScan.
We exclude facilities without conventional pricing and other missing information on important
variables. DealScan has information for the banks and firms involved in the loan, loan pricing
(loan spreads and some information on fees), amount, maturity, number of lenders, and loan
guarantees (collateral, covenants, and performance pricing provisions). We conduct our
analysis based on lead banks, which make all the important loan decisions, including loan
pricing decisions. For loans with more than one lead banks, therefore, the number of
9
observations for that loan equals the number of lead banks. The reason is that deposit insurance
is attached to each lead bank and in some cases, lead banks for the same loan are from different
countries and thus are subject to different deposit insurance schemes.
Second, we match the loans with information on the deposit insurance funding source
and other deposit insurance characteristics (the extent of coverage, how the specific insurance
scheme is managed, etc.) in the lead banks’ countries. Information is from Demirgüç-Kunt et
al. (2015), who obtain their original information from (i) several surveys carried out by the
International Association of Deposit Insurers (IADI), (ii) the European Commission, (iii) a
combination of country sources, and (iv) International Monetary Fund (IMF) staff reports. To
obtain information for historical changes in deposit insurance schemes, we also use Talley and
Mas (1990), Kyei (1995), Garcia (1999), Demirgüç‐Kunt and Sobaci (2001), Demirgüç-Kunt
et al. (2005), EFDI (2006), Demirgüç-Kunt et al. (2008), World Bank (2011), and Laeven
(2013).
Still, there are several countries for which the aforementioned studies provide no
information for the year in which a deposit insurance scheme changed. For these countries, we
obtain information directly from online sources or asked the country authorities.
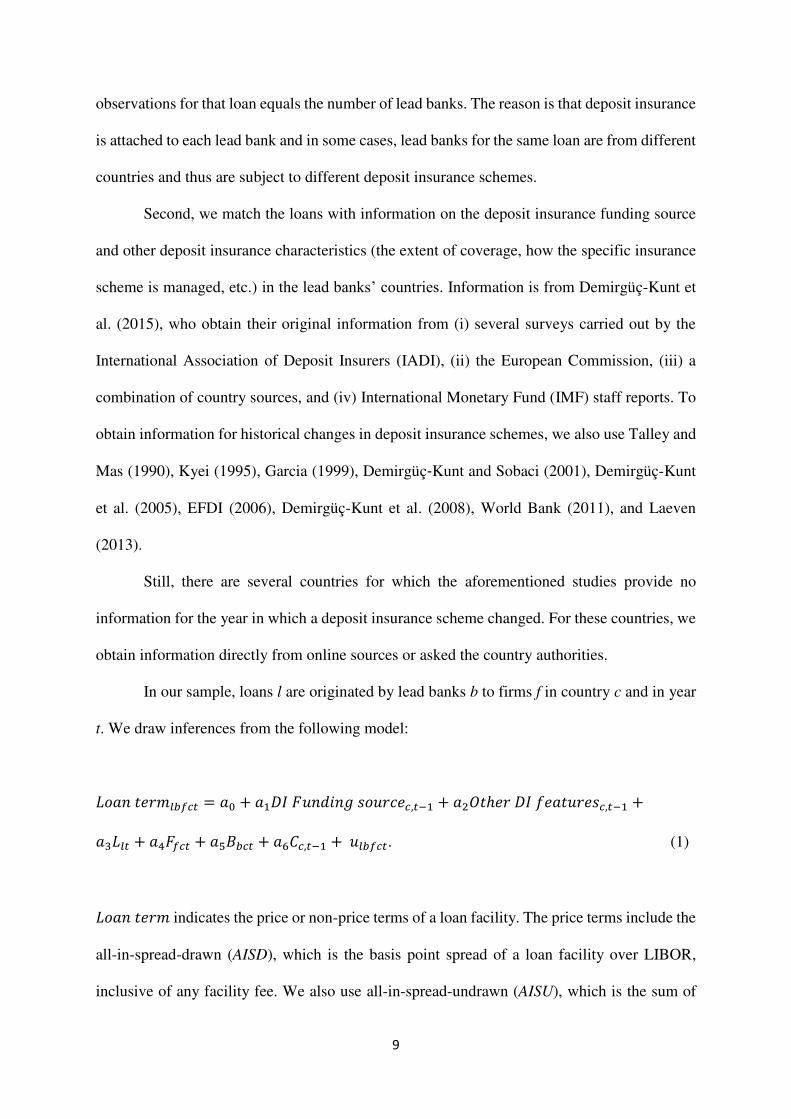
In our sample, loans l are originated by lead banks b to firms f in country c and in year
t. We draw inferences from the following model:
𝐿𝑜𝑎𝑛 𝑡𝑒𝑟𝑚𝑙𝑏𝑓𝑐𝑡 = 𝑎0 + 𝑎1𝐷𝐼 𝐹𝑢𝑛𝑑𝑖𝑛𝑔 𝑠𝑜𝑢𝑟𝑐𝑒𝑐,𝑡−1 + 𝑎2𝑂𝑡ℎ𝑒𝑟 𝐷𝐼 𝑓𝑒𝑎𝑡𝑢𝑟𝑒𝑠𝑐,𝑡−1 +𝑎3𝐿𝑙𝑡 + 𝑎4𝐹𝑓𝑐𝑡 + 𝑎5𝐵𝑏𝑐𝑡 + 𝑎6𝐶𝑐,𝑡−1 + 𝑢𝑙𝑏𝑓𝑐𝑡. (1)
𝐿𝑜𝑎𝑛 𝑡𝑒𝑟𝑚 indicates the price or non-price terms of a loan facility. The price terms include the
all-in-spread-drawn (AISD), which is the basis point spread of a loan facility over LIBOR,
inclusive of any facility fee. We also use all-in-spread-undrawn (AISU), which is the sum of
10
the facility and commitment fees.1 The non-price lending terms include Loan amount, Loan
maturity, Collateral, Performance provisions, and Total covenants, and these represent the
most important design features of loan contracts (Sufi, 2007; Ivashina, 2009). We thoroughly
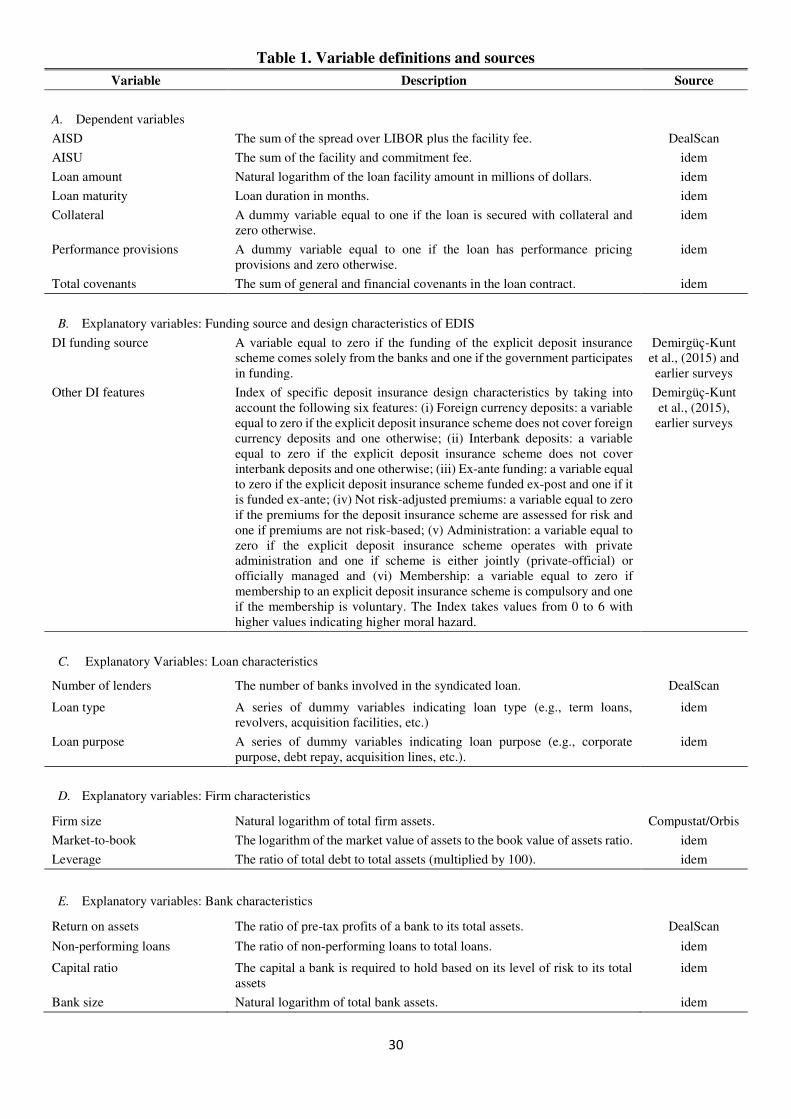
define these variables, along with all other variables in our empirical analysis, in Table 1.
[Please insert Table 1 about here]
Our main explanatory variable, DI Funding source, is a binary variable equal to zero if
the deposit insurance (DI) scheme is funded exclusively by the participating lending
institutions and one if the scheme is either jointly funded by governments and banks or solely
government funded. We assume that previous year’s funding source affects the current lending
terms. Besides being theoretically plausible, this practice reduces simultaneity concerns (also
given the use of several controls and fixed effects). We prefer to use a dummy variable instead
of the actual amounts of funding or a variable distinguishing among the three states (private,
partial government, full government) for two main reasons. First, even a small amount of
explicit government participation in the funding pool is enough to introduce moral hazard; in
the event of adverse developments, the expectation would be for the government to step in with
all the necessary funds to bail out banks (e.g., Demirgüç-Kunt and Huizinga, 2004). Second,
using the actual fund amounts requires assumptions about the magnitude of the regulated
banking system, which is hard to identify in several developing countries.
In turn, Other DI features is an index of other deposit insurance characteristics that
might separately affect Loan terms. For the construction of this index, we rely on Demirgüç-
Kunt et al. (2015) and earlier studies (e.g., Demirgüç-Kunt and Detragiache, 2002; Demirgüç-
Kunt and Huizinga, 2004; Demirgüç-Kunt et al., 2008); Table 1 provides the details. Other DI
features takes values from zero to six, with higher values indicating more-stringent deposit
1 Berg et al. (2016) analyze the pricing structure that U.S. lenders use to construct the total price of a loan. Unfortunately, either the global syndicated loans data lack information on some fees or loans in other countries do not have specific types of fees. Thus, we use the drawn and undrawn variables separately—that is, we do not construct a total cost of loans variable (for similar implementation, see Qian and Strahan, 2007; Delis et al., 2019).

11
insurance schemes. We expect that larger values, representing extensive coverage, ex ante
funded schemes, voluntary membership, etc., reflect higher moral hazard and potentially less
competitive lending terms.
Further, L, F, B, and C in Equation (1) are vectors of loan, firm, bank, and country
characteristics, respectively. In specifications using price lending terms as the outcome
variable, we use non-price lending terms as controls and vice versa (with a caution to avoid a
“bad controls” problem). We also control for the number of lenders in the syndicate (Number
of lenders) and a series of dummy variables denoting loan type (e.g., term loans, revolvers,
acquisition facilities, etc.) and loan purpose (e.g., corporate purpose, debt repay acquisition
lines, etc.).2
At the firm-year level (information from Compustat and Orbis), we control for the log
of total firm’s assets (Firm size), the market-to-book value ratio (Market-to-book), and firm’s
leverage (Leverage). We also experiment with other firm controls (e.g., cash flow, profitability
indicators, tangibility, etc.) but find that these additions do not affect our results either
qualitatively or quantitatively.
At the bank-year level (information from Bankscope), we control for the ratio of pre-
tax profits to total assets (Return on assets), the ratio of non-performing loans to total loans
(Non-performing loans), the ratio of total bank capital to total assets (Capital ratio), and the
log of total bank assets (Bank size). Again, using additional bank controls does not significantly
affect our estimates.
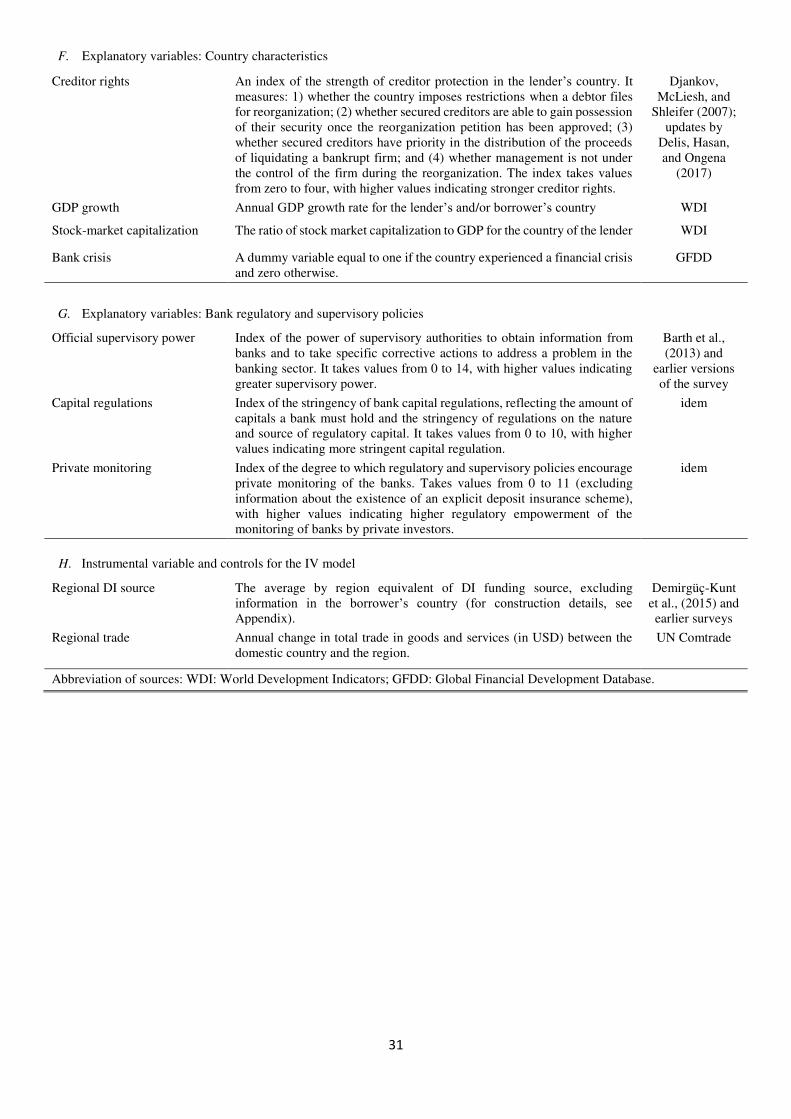
The country-year control variables (again, Table 1 provides thorough definitions) are
important to avoid attributing the effect of other country characteristics to the deposit insurance
funding source. We first use economic growth (GDP growth) in the borrower’s country to
2 Controlling for loan type is especially important because 76% of the term loans have no fee (see also Berg et al., 2016).
12
control for the general economic incidence. In further specifications, we additionally control
for the GDP growth in the bank’s country, without noting significant changes in our results.
We also use Stock-market capitalization as a measure of financial development in the lender’s
country. Further, we use the Creditor rights index by Djankov et al. (2007), which the literature
shows to play a crucial role in shaping loan spreads (Qian and Strahan, 2007; Bae and Goyal,
2009). To examine whether financial crises affect our results, we additionally introduce Bank
crisis in sensitivity tests. In line with Delis et al. (2019), we experiment with more than 100
other country-year control variables, obtained from several sources (see Appendix Table A1).
We find no significant changes in the results when using these additional controls.
We also control for variables capturing other general bank regulatory and supervisory
environments. We use the power of supervisory authorities (Official supervisory power), the
general capital stringency (Capital regulations), and the degree to which regulatory and
supervisory policies encourage private monitoring of banks (Private monitoring). We provide
thorough definitions and data sources for these variables in Table 1. Given that information for
bank regulation and supervision is available only beginning in the late 1990s, we include these
controls only in sensitivity tests to avoid losing observations.3
Finally, the term 𝑎0 in Equation (1) indicates the inclusion of bank, firm, and year fixed
effects. These fixed effects are important for identification purposes, as further discussed in the
following sections.
3.2. Summary statistics and correlations
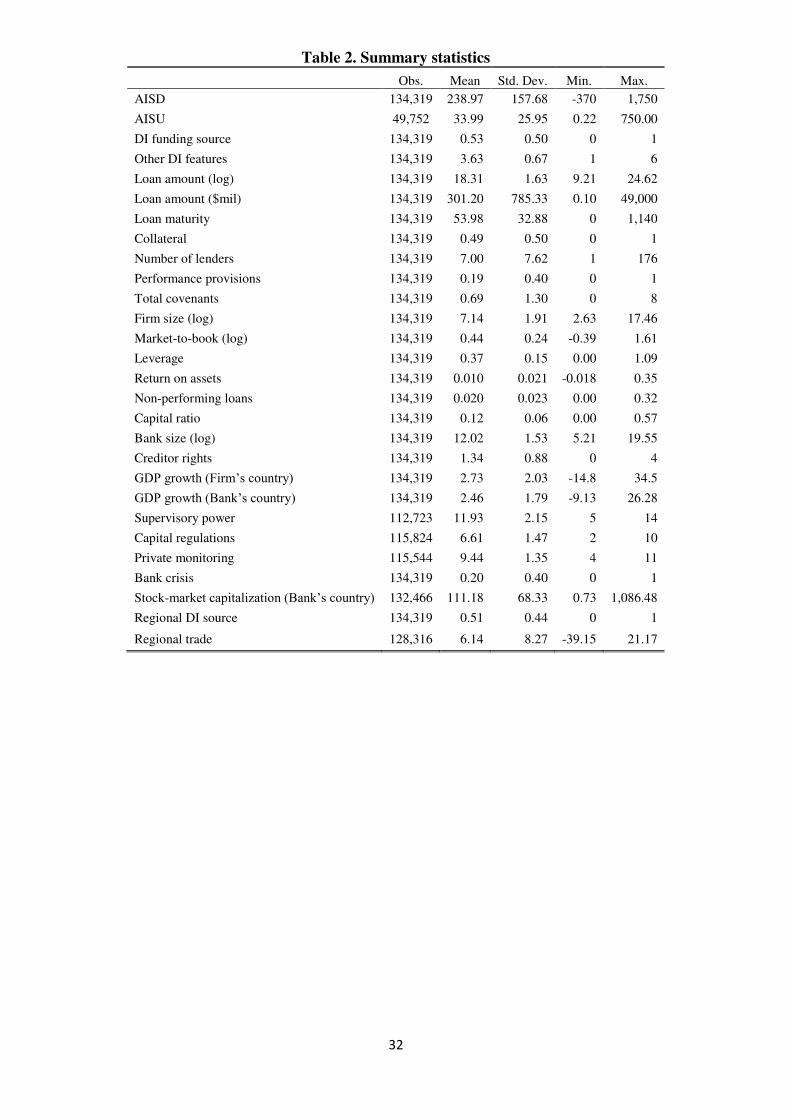
The number of observations in our benchmark specification is 134,319, consisting of loans
originated by lead banks operating in 63 countries in the period 1985–2016. Approximately
3 The surveys by Barth et al. come in four waves in 1999, 2002, 2005, and 2011. We use the regulatory and supervisory variables from the 1999 survey for the observations since 1996, assuming that applying the values for earlier years might introduce severe measurement error.
13
90% of the loans are granted from 1995 onward. We provide basic summary statistics for our
sample in Table 2. The mean loan has an AISD equal to 238.97 basis points. There are a few
(24) loan facilities with negative AISD, which means that the reported spread is below LIBOR.
We keep these loans in our sample because they do not play a significant role in our estimates.
[Please insert Table 2 about here]
In Table A2 of the Appendix, we report the number of loans by lender country along
with the mean and standard deviation of DI Funding source. Among the 63 countries in our
sample, 20 had privately funded deposit insurance and 11 had government-funded or jointly
funded deposit insurance during the full sample period. In the remaining 32 countries, there are
38 changes in deposit insurance funding source. These 32 countries are those from which we
mostly obtain identification of causal effects of DI Funding source by studying within-country
changes in lending terms pre- and post-change (given the inclusion of bank fixed effects and
that banks are headquartered in the same country). Interestingly, 47% of the observations
(63,394 observations) concern loans given by banks in countries where deposit insurance
funding comes solely from private sources and 53% (70,925 loans) where the government
participates.
To address the potential concern that Other DI features is highly correlated with DI
Funding source, we compute their pairwise correlation and find it approximately equal to 36%
(Appendix Table A3). We also report pairwise correlations between DI Funding source and all
the individual components of Other DI features in Table A4. These correlations never exceed
38%.
4. Empirical identification and results
4.1. Identification method
14
Our identification approach maps those of Qian and Strahan (2007), Bae and Goyal (2009),
and Delis et al. (2019), who analyze the effect of country-specific creditor rights and
democracy on loan pricing using syndicated loan data. Our loan-level data, with most banks
(firms) lending (borrowing) multiple times, significantly reduce the possibility of endogeneity
bias because they allow using several types of fixed effects.
Specifically, we introduce bank fixed effects to control for time-invariant bank
characteristics. Banks in our sample are involved in several loan facilities and, because DI
Funding source is attached to the lead banks’ countries, these fixed effects imply identification
from the 38 changes in the schemes’ funding sources. We also use firm fixed effects to control
for time-invariant firm characteristics and year fixed effects to control for shocks common to
all banks, firms, and loans.
Importantly, the use of bank fixed effects in our context carries more than the usual
interpretation of the fixed effects model. It also implies that Equation (1) represents a two-way
fixed effects DID model when treatment timing varies. In our context, the treatment is the
changes in DI funding source, the timing of which varies by country. Goodman-Bacon (2018)
shows theoretically and empirically that when the treatment timing in panel data varies, the
inclusion of cross-sectional fixed effects (here, bank fixed effects, because they also control
for country fixed effects) collapses the usual 2×2 DID model (the model including the
interaction term as the DID identifier) to a model in which the DID identifier is the coefficient
on the treatment variable (here, DI funding source). The fact that there are multiple treatments
that occur in different time periods carries the additional advantage of controlling for
potentially concurrent changes in other bank regulations alongside time-varying firm and bank
characteristics shaping lending terms. Goodman-Bacon (2018) provides a nice description of
existing literature on this class of models.
15
As a robustness test, we use recent literature in economics and finance that explores
regional waves of changes in institutions or regulations as an IV in a two-stage least squares
(2SLS) model (Acemoglu et al., 2019; Delis et al., 2019). The exclusion restriction is that
regional waves of changes in regulations (excluding the own country), while controlling in the
first stage for the macro dynamics in the own country, affects loan spreads only through the
effect on the change in regulations in that own country. Demirgüç-Kunt and Detragiache (2002)
precisely show that the proportion of countries already using deposit insurance is a good
instrument for measuring the adoption of deposit insurance, given that policymakers are
heavily influenced by standard practice in these technical matters. In other words, and
following the literature on changes in institutions (e.g., Acemoglu et al., 2019), the factors
creating regional waves of changes in bank regulations are not only explained by economic
changes but, equally important, by a demand for changing bank regulations (and thus deposit
insurance) in line with the propositions of international organizations and standard practice of
close countries.
We tighten the approach of Demirgüç-Kunt and Detragiache (2002) by using regional
waves of changes in the funding of deposit insurance as our IV and controlling in the first stage
for the macroeconomic, institutional, and bank regulatory dynamics of own countries
(following the paradigm of Acemoglu et al., 2019; Delis et al., 2019). We include the full
details used to estimate our Regional DI funding in the Appendix; here we provide the intuition
for our refinements.
Specifically, the regulation–bank lending nexus might imply a three-way correlation
among general bank regulations (i.e., not specific to deposit insurance), the economic
environment (mainly economic growth), and the cost of credit. This is because loan spreads
are cyclical, decreasing in good economic periods and increasing in periods of uncertainty.
General bank regulations might react to this cyclicality in order to smooth problems related to
16
financial instability. An obvious buffer against this potential three-way correlation is to control
for both regional and domestic GDP growth as well as bank regulations in both stages of our
IV model. Then, in the two-stage IV model, the standard exclusion restriction suggests that
Regional DI funding affects AISD only via DI funding source, conditional on controls for
economic growth and the regulatory environment in both the region and the domestic country.
To this end, we include all types of regulations (previously used as controls in our DID
approach) and GDP growth in both stages of the IV model.
Second, we acknowledge that an alternative channel through which regional changes
in deposit insurance can affect domestic loan pricing is trade. In episodes of abrupt changes in
financial regulations and institutions, disruptions in trade can arise between a country and its
wider region. In turn, trade disruptions can substantially affect domestic economic conditions
and the cost of credit. To this end, we control for annual trade growth (or recession) between
the region and the own country (variable named Regional trade and defined in Table 1) in our
IV model. We run several other sensitivity tests using different sets of control variables in our
IV approach, as highlighted in the following section; our results remain robust.
4.2. Results for loan pricing
Table 3 reports coefficient estimates and standard errors clustered by the lender’s country (the
cross-sectional unit of DI funding source) from our DID model. The first column reports results
from the specification including only loan-level controls and Other DI features. In columns (2)
and (3), we add firm- and bank-level controls, while in the third specification we further control
for Creditor rights and GDP growth.
We observe that government involvement in deposit insurance funding affects the cost
of lending significantly, both statistically and economically. Specifically, government funding
of deposit insurance increases spreads by approximately 11 basis points (according to the most
17
restrictive specification 3), equal to a 4.6% increase for the average AISD in our sample (238.97
basis points). This result is economically significant. Given that the mean sample loan size is
$301 million and the average loan’s time to maturity is approximately four and a half years (54
months), a bank operating in a country with government-funded or jointly funded deposit
insurance will receive higher interest income from each loan of around $1.5 million (= 301.20
× 0.0011 × 4.5). Thus, firms borrowing from banks in countries with exclusively privately
funded deposit insurance have a competitive advantage in loan pricing.
[Please insert Table 3 about here]
In contrast, Other DI features is statistically insignificant. This result is somewhat
expected because there is no considerable variation across the other design characteristics of
deposit insurance, and firm and bank fixed effects absorb any potential effect. Specifically,
almost 90% of the observations in our sample are from countries where a deposit insurance
provides coverage for foreign currency deposits; for 83% of the observations, deposit insurance
is ex ante funded; for 92%, the government participates in the administration of the scheme;
and for 99%, participation in a deposit insurance is obligatory. Thus, the key element of deposit
insurance affecting loan pricing is DI funding source.
The effects of firm characteristics are consistent with the literature (e.g., Qian and
Strahan, 2007; Ivashina, 2009; Bae and Goyal, 2009; Delis et al., 2019). Essentially, risk,
performance, and size are the most important firm characteristics shaping lending terms. Larger
firms are perceived as having a lower probability of default and are usually financially less
opaque; they thus pay lower spreads. Similarly, firms with higher market-to-book ratios pay
lower spreads whereas leveraged ones pay higher spreads. Including the firm-year controls in
the empirical model reduces the effect of DI funding source from 15.2 basis points in column
(1) to 11.3 basis points in column (2), highlighting the importance of these variables in
explaining banks’ loan pricing decisions.
18
Concerning bank characteristics, size does not play a significant role in banks’ loan
pricing decisions, but Return on assets and Capital ratio have significant effects. These
findings are intuitive given that highly profitable and well-capitalized banks can provide credit
at more competitive terms. Further, the ratio of non-performing loans to total loans has a
significant and positive effect on the cost of credit. This implies that banks holding a large
share of very risky loans increase the spread charged to borrowers.
In line with the finding on Other DI features, the effect of Creditor rights is statistically
insignificant. This result is probably because of the inclusion of bank and firm fixed effects
and the fact that creditor rights do not substantially change over time. In the Appendix Table
A5, we replicate the baseline specification excluding bank and firm fixed effects. In line with
Bae and Goyal (2009), who do not use fixed effects, Creditor rights turns significant; however,
the adjusted R-squared decreases from 80% to approximately 65%. Also in line with
expectations, GDP growth enters with a negative and statistically significant coefficient,
reflecting the adverse effect of a negative economic environment on loan spreads.
Overall, our findings indicate that banks provide more-expensive syndicated loans
when deposit insurance is financed partly or exclusively by public sources. On the other hand,
banks in countries with privately funded deposit insurance price syndicated loans more
competitively. This dynamic is a strong indication that privately funded deposit insurance is
beneficial both for borrowing firms and for real economic activity.
We conduct a first wave of robustness tests on our benchmark specification and report
the results in Table 4. To examine whether a “bad controls” problem drives our results because
we include potentially simultaneously determined loan-level variables, we experiment with
different specifications that exclude specific groups of these controls (Delis et al., 2019). In
column (1), we omit all the loan-level controls; in column (2), we exclude the loan guarantees
(Collateral, Performance provisions, and Total covenants); and in column (3), we exclude
19
Loan amount, Loan maturity, and Number of lenders. Evidently, our results are almost
unchanged compared with those of column (3) of Table 3.4
[Please insert Table 4 about here]
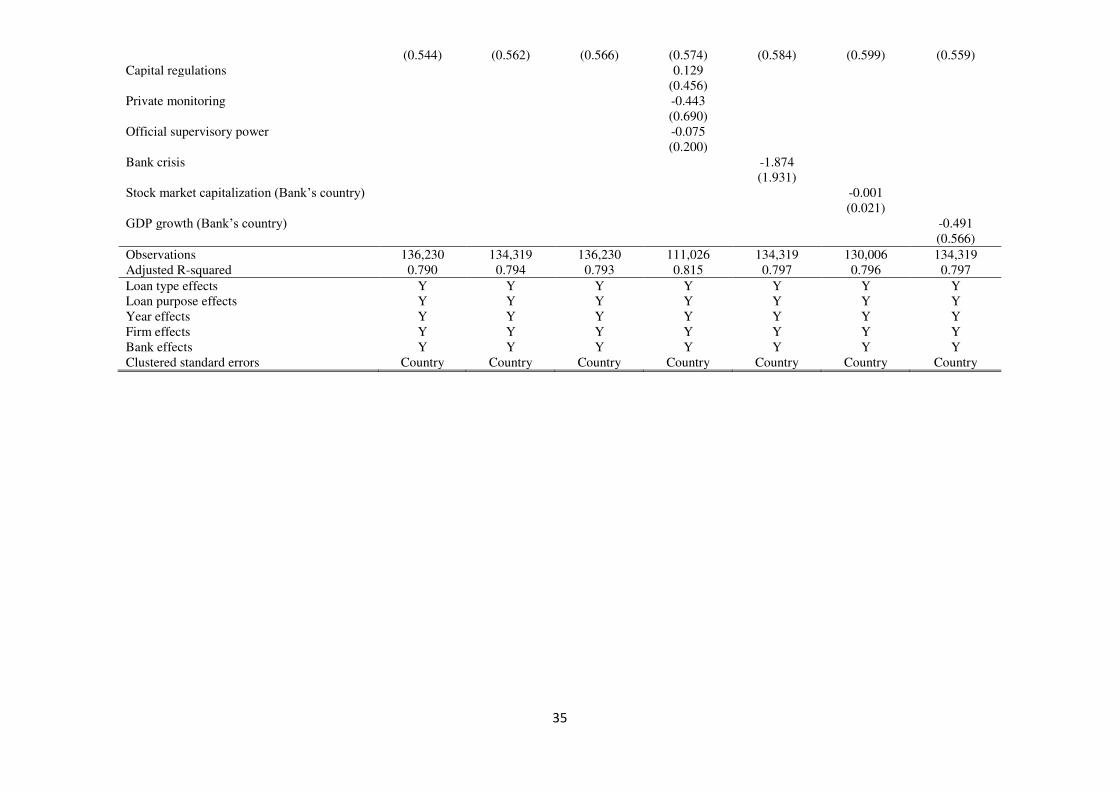
In specification (4) of Table 4, we add a set of control variables for banking regulation
and supervision. The introduction of the Official supervisory power, Capital regulations, and
Private monitoring variables reduces the number of the observations, because we have no
information for these variables before 1996. Again we obtain very similar results, with the
regulatory and supervisory variables being statistically insignificant at any level.
In column (5), we further control for the potential impact of Bank crisis on the baseline
results. We expect an increase in the cost of lending resulting from increased uncertainty during
crisis periods. The baseline results remain unaffected, whereas the effect of Bank crisis is
statistically insignificant. Essentially, this is a placebo test because any crisis effect should be
captured by our control variables and the year fixed effects (indeed removing the year fixed
effects yields a positive and significant coefficient on Bank crisis).
In specifications (6) and (7), we introduce stock market capitalization and GDP growth
in the lead bank’s country as controls for financial development and economic incidence
affecting the supply-side decisions of banks. Again, we find no significant changes compared
with our baseline results. We confirm the robustness of our baseline findings to the use of
several other macro control variables for the lender’s and the borrower’s country; we list these
variables in Appendix Table A1.
We report results from additional robustness tests in the Appendix. In Table A6, we
cluster standard errors by (i) loan facility and year or (ii) lender’s country and year to account
4 Following Gropp et al., (2014), we also estimate a Seemingly Unrelated Regression (SUR), with AISD, Loan
amount, and Loan maturity as dependent variables. We find that the effect of deposit insurance is even stronger in this model. Adding more equations for Collateral and Covenants, leaves our main inferences unchanged. Thus, the SUR model also rules against the “bad controls” problem driving our inferences. These results are available on request.
20
for possible dependence of loans or countries within years. In Table A7, we (i) include only
the most conventional corporate loans (term and revolver loan deals) or (ii) exclude loans for
leveraged buyouts (LBOs) and mergers and acquisitions (M&As). The reasoning is that, for
such loans, banks usually have additional information for the borrowing firms, resulting in
lower spreads (Ivashina and Kovner, 2011).
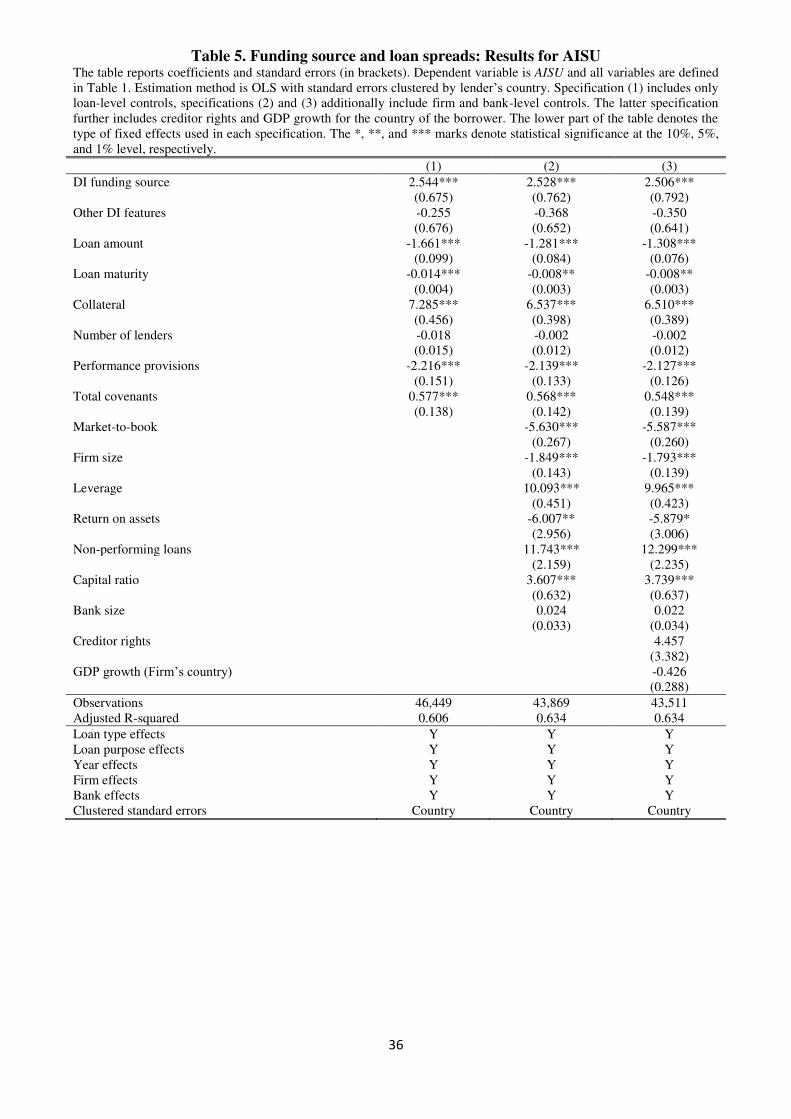
We next examine whether the funding source of deposit insurance affects the AISU,
which includes commitment and facility fees. We find a positive and significant effect.
Specifically, the results reported in Table 5 show that government funding of deposit insurance
increases AISU by approximately 7.4% for the average AISU in our sample (equal to 33.99
basis points). Sensitivity tests on these results (shown in Table A8 in the Appendix) further
support this finding. We conclude that besides affecting loan spreads, government funding of
deposit insurance increases commitment and loan facility fees, thereby further enhancing the
positive effect of deposit insurance on the cost of credit.
[Please insert Table 5 about here]
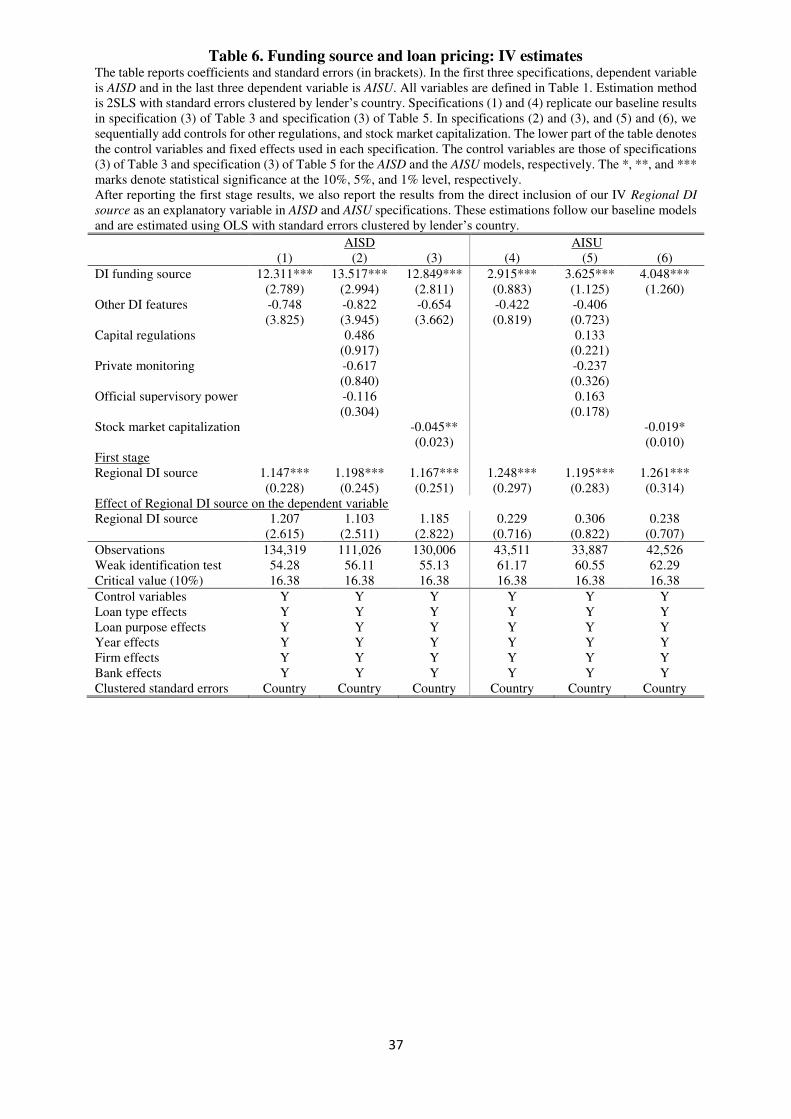
The last and perhaps most important robustness test of our analysis on the effect of DI
funding source on loan spreads and fees is the IV (2SLS) model discussed in Section 4.1. In
Table 6, we report the IV results for important specifications of AISD and AISU; we note,
however, that all the results reported in the previous tables hold. The first-stage estimate on our
IV, Regional DI source, is exceptionally statistically significant and easily passes across all
specifications the threshold of the weak identification test reported in the lower part of the
table. In the lower part of Table 6, we also report the results from OLS regressions, where
Regional DI source directly enters as an explanatory variable in the AISD and AISU models.
For the exclusion restriction to be satisfied, the effect of Regional DI source in these models
should be statistically insignificant—and our results confirm this.
21
Turning to the estimates on DI funding source,5 we find slightly stronger effects
compared with those reported in the previous tables. In column (1), the effect of DI funding
source on AISD equals 12.3 basis points, whereas the standard error is also slightly larger. The
effects are also somewhat more potent (along with slightly larger standard errors) when
controlling for other bank regulations in column (2) and stock market capitalization in column
(3). The larger standard errors is a classic problem with the IV models; in our setting, however,
this increase is not particularly strong, also highlighting the strength of our IV in the first-stage
estimates. We document similar findings in the corresponding AISU regressions (columns 4 to
6). Again, the effects are, if anything, a bit larger than those in Table 5. Overall, our IV results
are completely aligned with those from the DID OLS specifications.
4.3. Results for non-price lending terms
This section considers the effect of the deposit insurance funding source on loan amount, loan
maturity, and loan guarantees. Given our finding of a positive effect of DI funding source on
loan pricing, we expect that, if anything, the loan amount will be smaller. The results in the
first part of Table 7, however, do not show a robust negative effect of DI funding source on
Loan amount. This finding is further corroborated by robustness tests in Appendix Table A9,
which show that the statistical significance of DI funding source is lost when we control for
AISD.
In contrast, as evident from the second part of Table 7, EDIS funding source has a
statistically significant effect on Loan maturity. We find that when the funding scheme is
publicly or jointly funded, loan maturity is limited by approximately two months or 3.9% for
the duration of the average loan in our sample. This effect is robust to the “bad controls”
5 For expositional brevity, we do not report the results on all our control variables. The corresponding estimates are largely similar to those reported in the OLS specifications.
22
problem and other sensitivity tests reported in Table A10, and it is generally consistent with
the premise that in light of taking more risk under the moral hazard mechanism of government-
funded deposit insurance, banks aim for loans with shorter maturity.
In Table 8, we examine the effect of Funding source on Collateral, Performance
provisions, and Total covenants. Collateral and Performance provisions are binary variables,
and using probit or logit models implies econometric efficiency gains. We prefer a linear
probability model, however, because of the presence of multiple fixed effects that cause
convergence problems in our estimations.6
The effect of DI funding source on Collateral in the first three columns of Table 8 is
statistically insignificant. This is also the case in most of the specifications of Table A11,
especially those using the full set of control variables. We find similar results for Total
covenants in specifications 7 to 9 of Table 8 and in Appendix Table A13. In contrast, we
document a positive and significant effect of DI funding source on the probability of using
performance-pricing provisions. Specifically, government involvement in deposit insurance
increases the probability of a loan contract having performance-pricing provisions by 1.8%.
The results are similar to the robustness specifications in Appendix Table A12. This is an
economically small increase, however, highlighting that the main effect of government funding
of deposit insurance is channeled via loan spreads and fees, and not so much via other
qualitative characteristics of loans.7
[Please insert Tables 7 and 8 about here]
5. Policy implications and concluding remarks
6 Probit models have well-known problems in the presence of fixed effects. Logit models accommodate fixed effects but, in the case of multiple fixed effects, the maximum likelihood function faces convergence difficulty in several specifications. 7 We note that all our inferences in Section 4.3 hold when using the 2SLS model. These results are not reported and are available on request.

23
Theoretical considerations from the industrial organization literature predict that any increased
regulatory cost imposed on banks, here in the form of privately funded deposit insurance, will
be passed at least partially to borrowers. In contrast, a standard moral hazard argument with
limited liability predicts that government-funded deposit insurance increases the risk-taking
appetite of banks. This paper empirically examines which of the two theoretical viewpoints
dominates. Using the global syndicated loan market as our laboratory, we identify changes in
lending terms following changes in deposit insurance schemes from purely privately funded to
government (or jointly) funded, and vice versa.
We find that government involvement in deposit insurance funding has an
economically important effect on the all-in-spread-drawn (a 4.6% increase compared with our
sample’s average). The facility and commitment fees increase at an even higher rate. We also
document a moderate decrease in loan maturity (in months) and a small increase in the
probability of using performance pricing provisions.
Our results have two main implications. First, firms that borrow from banks operating
in countries with exclusively privately funded deposit insurance have a competitive advantage
because they can obtain credit at a lower cost (approximately $1.5 million for the mean loan).
Thus, privately funded deposit insurance can be viewed as a mechanism that allows banks to
provide credit on favorable terms, enhance investments, and promote the real economic
activity. Second, consistent with Pareto improvement considerations, privately funded deposit
insurance lowers moral hazard in the corporate lending market without increasing public cost.
Thus, our findings have clear implications in favor of laws and regulations on deposit insurance
funding from the insured banks.
Our findings set the pathway for additional research on the effects of other deposit
insurance characteristics. Specifically, the effects of the extent of coverage, the existence of ex
ante funding or risk-assessed premiums, and the means of deposit insurance administration

24
have not received special attention in the literature, despite their importance in key theoretical
issues in banking and corporate finance regarding regulation, asymmetric information, and
limited liability. We leave these ideas for future research.
21
References
Acemoglu, D., Naidu, S., Restrepo, P., Robinson, J.A., 2019. Democracy does cause growth.
Journal of Political Economy, 127, 47-100.
Andries, A. M., Capraru, B., 2013. Impact of financial liberalization on banking sectors
performance from central and eastern European countries. PloS one, 8(3), e59686.
Anginer, D., Demirgüç-Kunt, A., Zhu, M., 2014. How does deposit insurance affect bank risk?
Evidence from the recent crisis. Journal of Banking & Finance, 48, 312-321.
Bae, K-H, Goyal, V.K., 2009. Creditor rights, enforcement, and bank loans. Journal of Finance,
64(2), 823-860.
Barth, J. R., Caprio Jr, G., Levine, R., 2004. Bank regulation and supervision: What works
best? Journal of Financial intermediation, 13(2), 205-248.
Barth, J. R., Caprio Jr. G., Levine, R., 2013. Bank regulation and supervision in 180 countries
from 1999 to 2011. Journal of Financial Economic Policy, 5(2), 111-219.
Barth, J. R., Lin, C., Ma, Y., Seade, J., Song, F.M., 2013. Do bank regulation, supervision and
monitoring enhance or impede bank efficiency? Journal of Banking & Finance, 37(8),
2879-2892.
Beck, T., 2002. Deposit insurance as private club: Is Germany a model? The Quarterly Review
of Economics and Finance, 42(4), 701-719.
Beck, T., 2003. The Incentive-Compatible Design of Deposit Insurance and Bank Failure
Resolution: Concepts and Country Studies. World Bank Policy Research Working Paper
No. 3043. Available at SSRN: https://ssrn.com/abstract=636405.
Beck, T., De Jonghe, O., Schepens, G., 2013. Bank competition and stability: Cross-country
heterogeneity. Journal of financial Intermediation, 22(2), 218-244.
Berg, T., Saunders, A., Steffen, S., 2016. The total cost of corporate borrowing in the loan
market: Don't ignore the fees. Journal of Finance, 71(3), 1357–1392.
26
Bergbrant, M. C., Campbell, K. T., Hunter, D. M., Owers, J. E., 2016. Does deposit insurance
retard the development of non-bank financial markets? Journal of Banking & Finance, 66,
102-125.
Brandao-Marques, L., Correa, R., Sapriza, H., 2020. Government support, regulation, and risk
taking in the banking sector. Journal of Banking & Finance, 112, 105177.
Brissimis, S. N., Delis, M. D., Papanikolaou, N. I., 2008. Exploring the nexus between banking
sector reform and performance: Evidence from newly acceded EU countries. Journal of
Banking & Finance, 32(12), 2674-2683.
Calomiris, C. W., Jaremski, M., 2016. Deposit insurance: Theories and facts. Annual Review
of Financial Economics, 8, 97-120.
Delis, M. D., Hasan, I., Ongena, S., 2019. Democracy and credit. Journal of Financial
Economics, forthcoming.
DeLong, G., Saunders, A., 2011. Did the introduction of fixed-rate federal deposit insurance
increase long-term bank risk-taking? Journal of Financial Stability, 7(1), 19-25.
Demirgüç-Kunt, A., Detragiache, E., 2002. Does deposit insurance increase banking system
stability? An empirical investigation. Journal of Monetary Economics, 49(7), 1373-1406.
Demirgüç-Kunt, A., Huizinga, H., 2004. Market discipline and deposit insurance. Journal of
Monetary Economics, 51(2), 375-399.
Demirgüç-Kunt, A., Kane, E. J., 2002. Deposit insurance around the globe: Where does it
work? Journal of Economic Perspectives, 16(2), 175-195.
Demirgüç-Kunt, A., Kane, E. J., Laeven, L., 2008. Determinants of deposit insurance adoption
and design. Journal of Financial Intermediation, 17(3), 407-438.
Demirgüç-Kunt, A., Kane, E. J., Laeven, L., 2015. Deposit insurance around the world: A
comprehensive analysis and database. Journal of Financial Stability, 20, 155-183.
27
Demirgüç-Kunt, A., Karacaovali, B., Laeven, L., 2005. Deposit insurance around the world: A
comprehensive database. In: Policy Research Working Paper No. 3628.World Bank,
Washington, DC.
Demirgüç‐Kunt, A., Sobaci, T., 2001. A new development database: Deposit insurance around
the world. The World Bank Economic Review, 15(3), 481-490.
Diamond, D. W., Dybvig, P. H., 1983. Bank runs, deposit insurance, and liquidity. Journal of
Political Economy, 91(3), 401-419.
Djankov, S., McLiesh, C., Shleifer, A., 2007. Private credit in 129 countries. Journal of
Financial Economics, 84(2), 299-329.
Ely, B., 1986. Private sector depositor protection is still a viable alternative to federal deposit
insurance. Issues in Bank Regulation, 9, 40–47.
England, C., 1985. A proposal for introducing private deposit insurance. In Proceedings of a
conference on bank structure and competition. Federal Reserve Bank of Chicago, 73, 316–
337.
European Federation of Deposit Insurance (EFDI), 2006. Deposit guarantee systems: EFDI’s
first report.
Garcia, G., 1999. Deposit insurance: Actual and good practices. IMF Occasional Paper No.
197. International Monetary Fund, Washington, DC.
Goodman-Bacon, A., 2018. Differences-in-differences with variation in treatment timing.
National Bureau of Economic Research, Working Paper 25018.
Gropp, R., Gruendl, C., Guettler, A., 2014. The impact of public guarantees on bank risk-
taking: Evidence from a natural experiment. Review of Finance, 18(2), 457–488.
Gropp, R., Vesala, J., 2004. Deposit insurance, moral hazard and market monitoring. Review
of Finance, 8(4), 571-602.
28
International Association of Deposit Insurers (IADI), 2009. Funding of deposit insurance
systems, Guidance Paper.
Ioannidou, V. P., Penas, M. F., 2010. Deposit insurance and bank risk-taking: Evidence from
internal loan ratings. Journal of Financial Intermediation, 19(1), 95-115.
Ivashina, V., 2009. Asymmetric information effects on loan spreads. Journal of Financial
Economics, 92(2), 300-319.
Ivashina, V., Kovner, A., 2011. The private equity advantage: Leveraged buyout firms and
relationship banking. The Review of Financial Studies, 24(7), 2462-2498.
Kaminsky, G., Schmukler, S., 2003. Short-run pain, long-run gain: The effects of financial
liberalization (No. w9787). National Bureau of Economic Research.
Kane, E. J., 1989. How incentive-incompatible deposit insurance fails. NBER working paper
no. 2836.
Kane, E. J., 2000. Designing financial safety nets to fit country circumstances. Mimeo World
Bank.
Keeley, M. C., 1990. Deposit insurance, risk, and market power in banking. The American
Economic Review, 1183-1200.
Kyei, A., 1995. Deposit protection arrangements: A survey. IMF Working Paper No. 95/134.
International Monetary Fund, Washington, DC.
Laeven, L., 2013. European Union: Publication of Financial Sector Assessment Program
Documentation-Technical Note on Deposit Insurance, IMF Country Report No. 13/66.
International Monetary Fund, Washington, DC.
Lambert, C., Noth, F., Schüwer, U., 2017. How do insured deposits affect bank risk? Evidence
from the 2008 Emergency Economic Stabilization Act. Journal of Financial
Intermediation, 29, 81-102.

29
Merton, R. C., 1977. An analytic derivation of the cost of deposit insurance and loan guarantees
an application of modern option pricing theory. Journal of Banking & Finance, 1(1), 3-11.
Qian, J., Strahan, P.E., 2007. How laws and institutions shape financial contracts: The case of
bank loans. Journal of Finance, 62(6), 2803-2834.
Shy, O., Stenbacka, R., & Yankov, V. 2016. Limited deposit insurance coverage and bank
competition. Journal of Banking & Finance, 71, 95-108.
Sufi, A., 2007. Information asymmetry and financing arrangements: Evidence from syndicated
loans. The Journal of Finance, 62(2), 629-668.
Talley, S., Mas, I., 1990. Deposit insurance in developing countries. Policy, Research, and
External Affairs Working Paper No. 548. World Bank, Washington, DC.
Wheelock, D. C., Wilson, P. W., 1995. Explaining bank failures: Deposit insurance, regulation,
and efficiency. The Review of Economics and Statistics, 689-700.
World Bank, 2011. Survey of banking supervision and regulation.
30
Table 1. Variable definitions and sources
Variable Description Source
A. Dependent variables
AISD The sum of the spread over LIBOR plus the facility fee. DealScan
AISU The sum of the facility and commitment fee. idem
Loan amount Natural logarithm of the loan facility amount in millions of dollars. idem
Loan maturity Loan duration in months. idem
Collateral A dummy variable equal to one if the loan is secured with collateral and zero otherwise.
idem
Performance provisions A dummy variable equal to one if the loan has performance pricing provisions and zero otherwise.
idem
Total covenants The sum of general and financial covenants in the loan contract. idem
B. Explanatory variables: Funding source and design characteristics of EDIS
DI funding source A variable equal to zero if the funding of the explicit deposit insurance scheme comes solely from the banks and one if the government participates in funding.
Demirgüç-Kunt et al., (2015) and earlier surveys
Other DI features Index of specific deposit insurance design characteristics by taking into account the following six features: (i) Foreign currency deposits: a variable equal to zero if the explicit deposit insurance scheme does not cover foreign currency deposits and one otherwise; (ii) Interbank deposits: a variable equal to zero if the explicit deposit insurance scheme does not cover interbank deposits and one otherwise; (iii) Ex-ante funding: a variable equal to zero if the explicit deposit insurance scheme funded ex-post and one if it is funded ex-ante; (iv) Not risk-adjusted premiums: a variable equal to zero if the premiums for the deposit insurance scheme are assessed for risk and one if premiums are not risk-based; (v) Administration: a variable equal to zero if the explicit deposit insurance scheme operates with private administration and one if scheme is either jointly (private-official) or officially managed and (vi) Membership: a variable equal to zero if membership to an explicit deposit insurance scheme is compulsory and one if the membership is voluntary. The Index takes values from 0 to 6 with higher values indicating higher moral hazard.
Demirgüç-Kunt et al., (2015), earlier surveys
C. Explanatory Variables: Loan characteristics
Number of lenders The number of banks involved in the syndicated loan. DealScan
Loan type A series of dummy variables indicating loan type (e.g., term loans, revolvers, acquisition facilities, etc.)
idem
Loan purpose A series of dummy variables indicating loan purpose (e.g., corporate purpose, debt repay, acquisition lines, etc.).
idem
D. Explanatory variables: Firm characteristics
Firm size Natural logarithm of total firm assets. Compustat/Orbis
Market-to-book The logarithm of the market value of assets to the book value of assets ratio. idem
Leverage The ratio of total debt to total assets (multiplied by 100). idem
E. Explanatory variables: Bank characteristics
Return on assets The ratio of pre-tax profits of a bank to its total assets. DealScan
Non-performing loans The ratio of non-performing loans to total loans. idem
Capital ratio The capital a bank is required to hold based on its level of risk to its total assets
idem
Bank size Natural logarithm of total bank assets. idem
31
F. Explanatory variables: Country characteristics
Creditor rights An index of the strength of creditor protection in the lender’s country. It measures: 1) whether the country imposes restrictions when a debtor files for reorganization; (2) whether secured creditors are able to gain possession of their security once the reorganization petition has been approved; (3) whether secured creditors have priority in the distribution of the proceeds of liquidating a bankrupt firm; and (4) whether management is not under the control of the firm during the reorganization. The index takes values from zero to four, with higher values indicating stronger creditor rights.
Djankov, McLiesh, and
Shleifer (2007); updates by
Delis, Hasan, and Ongena
(2017)
GDP growth Annual GDP growth rate for the lender’s and/or borrower’s country WDI
Stock-market capitalization The ratio of stock market capitalization to GDP for the country of the lender WDI
Bank crisis A dummy variable equal to one if the country experienced a financial crisis and zero otherwise.
GFDD
G. Explanatory variables: Bank regulatory and supervisory policies
Official supervisory power Index of the power of supervisory authorities to obtain information from banks and to take specific corrective actions to address a problem in the banking sector. It takes values from 0 to 14, with higher values indicating greater supervisory power.
Barth et al., (2013) and
earlier versions of the survey
Capital regulations Index of the stringency of bank capital regulations, reflecting the amount of capitals a bank must hold and the stringency of regulations on the nature and source of regulatory capital. It takes values from 0 to 10, with higher values indicating more stringent capital regulation.
idem
Private monitoring Index of the degree to which regulatory and supervisory policies encourage private monitoring of the banks. Takes values from 0 to 11 (excluding information about the existence of an explicit deposit insurance scheme), with higher values indicating higher regulatory empowerment of the monitoring of banks by private investors.
idem
H. Instrumental variable and controls for the IV model
Regional DI source The average by region equivalent of DI funding source, excluding information in the borrower’s country (for construction details, see Appendix).
Demirgüç-Kunt et al., (2015) and earlier surveys
Regional trade Annual change in total trade in goods and services (in USD) between the domestic country and the region.
UN Comtrade
Abbreviation of sources: WDI: World Development Indicators; GFDD: Global Financial Development Database.
32
Table 2. Summary statistics
Obs. Mean Std. Dev. Min. Max.
AISD 134,319 238.97 157.68 -370 1,750
AISU 49,752 33.99 25.95 0.22 750.00
DI funding source 134,319 0.53 0.50 0 1
Other DI features 134,319 3.63 0.67 1 6
Loan amount (log) 134,319 18.31 1.63 9.21 24.62
Loan amount ($mil) 134,319 301.20 785.33 0.10 49,000
Loan maturity 134,319 53.98 32.88 0 1,140
Collateral 134,319 0.49 0.50 0 1
Number of lenders 134,319 7.00 7.62 1 176
Performance provisions 134,319 0.19 0.40 0 1
Total covenants 134,319 0.69 1.30 0 8
Firm size (log) 134,319 7.14 1.91 2.63 17.46
Market-to-book (log) 134,319 0.44 0.24 -0.39 1.61
Leverage 134,319 0.37 0.15 0.00 1.09
Return on assets 134,319 0.010 0.021 -0.018 0.35
Non-performing loans 134,319 0.020 0.023 0.00 0.32
Capital ratio 134,319 0.12 0.06 0.00 0.57
Bank size (log) 134,319 12.02 1.53 5.21 19.55
Creditor rights 134,319 1.34 0.88 0 4
GDP growth (Firm’s country) 134,319 2.73 2.03 -14.8 34.5
GDP growth (Bank’s country) 134,319 2.46 1.79 -9.13 26.28
Supervisory power 112,723 11.93 2.15 5 14
Capital regulations 115,824 6.61 1.47 2 10
Private monitoring 115,544 9.44 1.35 4 11
Bank crisis 134,319 0.20 0.40 0 1
Stock-market capitalization (Bank’s country) 132,466 111.18 68.33 0.73 1,086.48
Regional DI source 134,319 0.51 0.44 0 1
Regional trade 128,316 6.14 8.27 -39.15 21.17

33
Table 3. Funding source and loan spreads: Baseline results The table reports coefficients and standard errors (in brackets). Dependent variable is AISD and all variables are defined in Table 1. Estimation method is OLS with standard errors clustered by lender’s country. Specification (1) includes only loan-level controls, specifications (2) and (3) additionally include firm and bank-level controls. The latter specification further includes creditor rights and GDP growth for the country of the borrower. The lower part of the table denotes the type of fixed effects used in each specification. The *, **, and *** marks denote statistical significance at the 10%, 5%, and 1% level, respectively.
(1) (2) (3)
DI funding source 15.182*** 11.348*** 10.997***
(1.885) (1.765) (1.820) Other DI features -0.609 0.353 0.891
(3.374) (2.674) (2.500) Loan amount -10.255*** -5.887*** -5.861***
(1.395) (0.424) (0.430) Loan maturity 0.297** 0.143*** 0.142***
(0.114) (0.051) (0.050) Collateral 34.473*** 20.826*** 20.850***
(1.641) (1.358) (1.357) Number of lenders -0.591*** -0.019 -0.011
(0.102) (0.068) (0.067) Performance provisions -25.965*** -22.373*** -22.456***
(0.970) (1.673) (1.624) Total covenants 1.095 0.519 0.528
(0.721) (0.423) (0.435) Market-to-book -80.516*** -80.421***
(7.682) (7.627) Firm size -54.740*** -54.552***
(2.639) (2.642) Leverage 144.094*** 143.831***
(6.113) (6.037) Return on assets -111.773*** -112.489*** (7.563) (7.400) Non-performing loans 106.005*** 106.267*** (9.406) (9.452) Capital ratio 18.088*** 18.375*** (2.206) (2.277) Bank size -0.009 -0.015 (0.150) (0.154) Creditor rights -5.880 (12.395) GDP growth (Firm’s country) -2.454*** (0.584)
Observations 141,354 135,952 134,319 Adjusted R-squared 0.694 0.798 0.797
Loan type effects Y Y Y Loan purpose effects Y Y Y Year effects Y Y Y Firm effects Y Y Y Bank effects Y Y Y Clustered standard errors Country Country Country
34
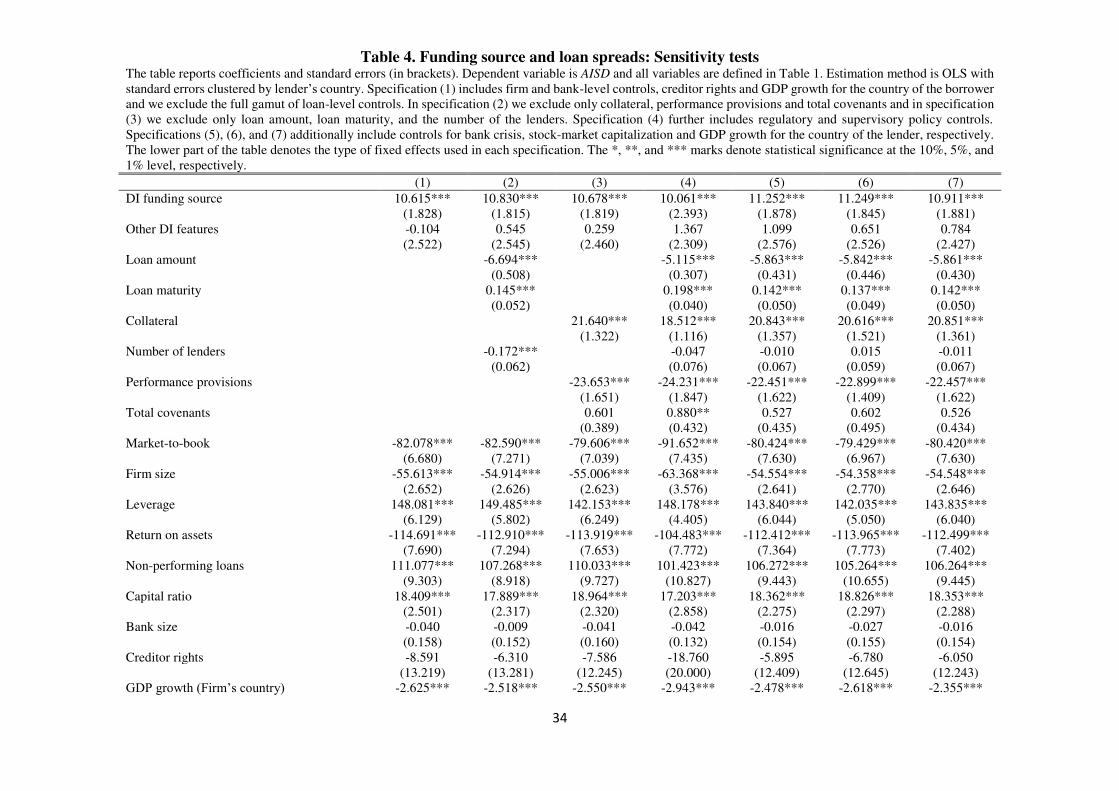
Table 4. Funding source and loan spreads: Sensitivity tests The table reports coefficients and standard errors (in brackets). Dependent variable is AISD and all variables are defined in Table 1. Estimation method is OLS with standard errors clustered by lender’s country. Specification (1) includes firm and bank-level controls, creditor rights and GDP growth for the country of the borrower and we exclude the full gamut of loan-level controls. In specification (2) we exclude only collateral, performance provisions and total covenants and in specification (3) we exclude only loan amount, loan maturity, and the number of the lenders. Specification (4) further includes regulatory and supervisory policy controls. Specifications (5), (6), and (7) additionally include controls for bank crisis, stock-market capitalization and GDP growth for the country of the lender, respectively. The lower part of the table denotes the type of fixed effects used in each specification. The *, **, and *** marks denote statistical significance at the 10%, 5%, and 1% level, respectively. (1) (2) (3) (4) (5) (6) (7)
DI funding source 10.615*** 10.830*** 10.678*** 10.061*** 11.252*** 11.249*** 10.911***
(1.828) (1.815) (1.819) (2.393) (1.878) (1.845) (1.881) Other DI features -0.104 0.545 0.259 1.367 1.099 0.651 0.784 (2.522) (2.545) (2.460) (2.309) (2.576) (2.526) (2.427) Loan amount -6.694*** -5.115*** -5.863*** -5.842*** -5.861***
(0.508) (0.307) (0.431) (0.446) (0.430) Loan maturity 0.145*** 0.198*** 0.142*** 0.137*** 0.142***
(0.052) (0.040) (0.050) (0.049) (0.050) Collateral 21.640*** 18.512*** 20.843*** 20.616*** 20.851***
(1.322) (1.116) (1.357) (1.521) (1.361) Number of lenders -0.172*** -0.047 -0.010 0.015 -0.011 (0.062) (0.076) (0.067) (0.059) (0.067) Performance provisions -23.653*** -24.231*** -22.451*** -22.899*** -22.457***
(1.651) (1.847) (1.622) (1.409) (1.622) Total covenants 0.601 0.880** 0.527 0.602 0.526
(0.389) (0.432) (0.435) (0.495) (0.434) Market-to-book -82.078*** -82.590*** -79.606*** -91.652*** -80.424*** -79.429*** -80.420***
(6.680) (7.271) (7.039) (7.435) (7.630) (6.967) (7.630) Firm size -55.613*** -54.914*** -55.006*** -63.368*** -54.554*** -54.358*** -54.548***
(2.652) (2.626) (2.623) (3.576) (2.641) (2.770) (2.646) Leverage 148.081*** 149.485*** 142.153*** 148.178*** 143.840*** 142.035*** 143.835***
(6.129) (5.802) (6.249) (4.405) (6.044) (5.050) (6.040) Return on assets -114.691*** -112.910*** -113.919*** -104.483*** -112.412*** -113.965*** -112.499***
(7.690) (7.294) (7.653) (7.772) (7.364) (7.773) (7.402) Non-performing loans 111.077*** 107.268*** 110.033*** 101.423*** 106.272*** 105.264*** 106.264***
(9.303) (8.918) (9.727) (10.827) (9.443) (10.655) (9.445) Capital ratio 18.409*** 17.889*** 18.964*** 17.203*** 18.362*** 18.826*** 18.353*** (2.501) (2.317) (2.320) (2.858) (2.275) (2.297) (2.288) Bank size -0.040 -0.009 -0.041 -0.042 -0.016 -0.027 -0.016 (0.158) (0.152) (0.160) (0.132) (0.154) (0.155) (0.154) Creditor rights -8.591 -6.310 -7.586 -18.760 -5.895 -6.780 -6.050 (13.219) (13.281) (12.245) (20.000) (12.409) (12.645) (12.243) GDP growth (Firm’s country) -2.625*** -2.518*** -2.550*** -2.943*** -2.478*** -2.618*** -2.355***
35
(0.544) (0.562) (0.566) (0.574) (0.584) (0.599) (0.559) Capital regulations 0.129 (0.456) Private monitoring -0.443 (0.690) Official supervisory power -0.075 (0.200) Bank crisis -1.874 (1.931) Stock market capitalization (Bank’s country) -0.001 (0.021) GDP growth (Bank’s country) -0.491 (0.566)
Observations 136,230 134,319 136,230 111,026 134,319 130,006 134,319 Adjusted R-squared 0.790 0.794 0.793 0.815 0.797 0.796 0.797
Loan type effects Y Y Y Y Y Y Y Loan purpose effects Y Y Y Y Y Y Y Year effects Y Y Y Y Y Y Y Firm effects Y Y Y Y Y Y Y Bank effects Y Y Y Y Y Y Y Clustered standard errors Country Country Country Country Country Country Country
36
Table 5. Funding source and loan spreads: Results for AISU The table reports coefficients and standard errors (in brackets). Dependent variable is AISU and all variables are defined in Table 1. Estimation method is OLS with standard errors clustered by lender’s country. Specification (1) includes only loan-level controls, specifications (2) and (3) additionally include firm and bank-level controls. The latter specification further includes creditor rights and GDP growth for the country of the borrower. The lower part of the table denotes the type of fixed effects used in each specification. The *, **, and *** marks denote statistical significance at the 10%, 5%, and 1% level, respectively. (1) (2) (3)
DI funding source 2.544*** 2.528*** 2.506***
(0.675) (0.762) (0.792) Other DI features -0.255 -0.368 -0.350
(0.676) (0.652) (0.641) Loan amount -1.661*** -1.281*** -1.308***
(0.099) (0.084) (0.076) Loan maturity -0.014*** -0.008** -0.008**
(0.004) (0.003) (0.003) Collateral 7.285*** 6.537*** 6.510***
(0.456) (0.398) (0.389) Number of lenders -0.018 -0.002 -0.002
(0.015) (0.012) (0.012) Performance provisions -2.216*** -2.139*** -2.127***
(0.151) (0.133) (0.126) Total covenants 0.577*** 0.568*** 0.548***
(0.138) (0.142) (0.139) Market-to-book -5.630*** -5.587***
(0.267) (0.260) Firm size -1.849*** -1.793***
(0.143) (0.139) Leverage 10.093*** 9.965***
(0.451) (0.423) Return on assets -6.007** -5.879* (2.956) (3.006) Non-performing loans 11.743*** 12.299*** (2.159) (2.235) Capital ratio 3.607*** 3.739*** (0.632) (0.637) Bank size 0.024 0.022 (0.033) (0.034) Creditor rights 4.457 (3.382) GDP growth (Firm’s country) -0.426 (0.288)
Observations 46,449 43,869 43,511 Adjusted R-squared 0.606 0.634 0.634
Loan type effects Y Y Y Loan purpose effects Y Y Y Year effects Y Y Y Firm effects Y Y Y Bank effects Y Y Y Clustered standard errors Country Country Country
37
Table 6. Funding source and loan pricing: IV estimates The table reports coefficients and standard errors (in brackets). In the first three specifications, dependent variable is AISD and in the last three dependent variable is AISU. All variables are defined in Table 1. Estimation method is 2SLS with standard errors clustered by lender’s country. Specifications (1) and (4) replicate our baseline results in specification (3) of Table 3 and specification (3) of Table 5. In specifications (2) and (3), and (5) and (6), we sequentially add controls for other regulations, and stock market capitalization. The lower part of the table denotes the control variables and fixed effects used in each specification. The control variables are those of specifications (3) of Table 3 and specification (3) of Table 5 for the AISD and the AISU models, respectively. The *, **, and *** marks denote statistical significance at the 10%, 5%, and 1% level, respectively. After reporting the first stage results, we also report the results from the direct inclusion of our IV Regional DI
source as an explanatory variable in AISD and AISU specifications. These estimations follow our baseline models and are estimated using OLS with standard errors clustered by lender’s country. AISD AISU (1) (2) (3) (4) (5) (6)
DI funding source 12.311*** 13.517*** 12.849*** 2.915*** 3.625*** 4.048***
(2.789) (2.994) (2.811) (0.883) (1.125) (1.260) Other DI features -0.748 -0.822 -0.654 -0.422 -0.406
(3.825) (3.945) (3.662) (0.819) (0.723) Capital regulations 0.486 0.133 (0.917) (0.221) Private monitoring -0.617 -0.237 (0.840) (0.326) Official supervisory power -0.116 0.163 (0.304) (0.178) Stock market capitalization -0.045** -0.019* (0.023) (0.010) First stage Regional DI source 1.147*** 1.198*** 1.167*** 1.248*** 1.195*** 1.261*** (0.228) (0.245) (0.251) (0.297) (0.283) (0.314) Effect of Regional DI source on the dependent variable Regional DI source 1.207 1.103 1.185 0.229 0.306 0.238 (2.615) (2.511) (2.822) (0.716) (0.822) (0.707)
Observations 134,319 111,026 130,006 43,511 33,887 42,526 Weak identification test Critical value (10%)
54.28 16.38
56.11 16.38
55.13 16.38
61.17 16.38
60.55 16.38
62.29 16.38
Control variables Y Y Y Y Y Y Loan type effects Y Y Y Y Y Y Loan purpose effects Y Y Y Y Y Y Year effects Y Y Y Y Y Y Firm effects Y Y Y Y Y Y Bank effects Y Y Y Y Y Y Clustered standard errors Country Country Country Country Country Country
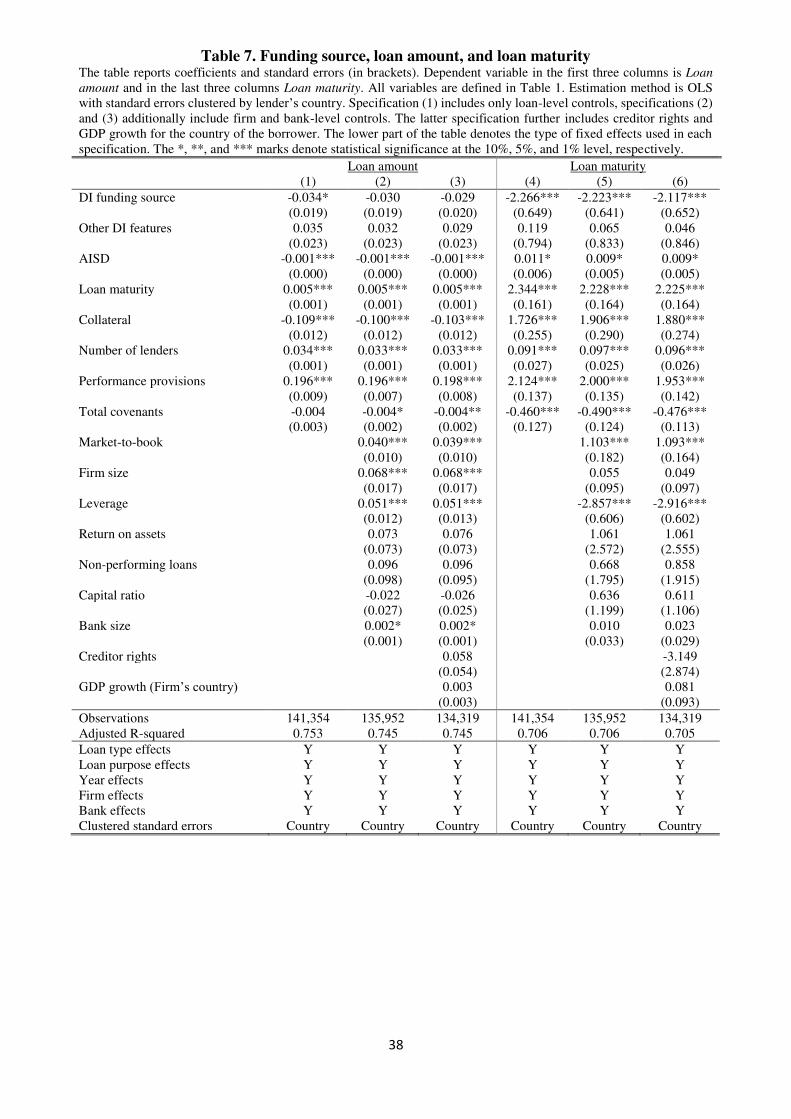
38
Table 7. Funding source, loan amount, and loan maturity The table reports coefficients and standard errors (in brackets). Dependent variable in the first three columns is Loan
amount and in the last three columns Loan maturity. All variables are defined in Table 1. Estimation method is OLS with standard errors clustered by lender’s country. Specification (1) includes only loan-level controls, specifications (2) and (3) additionally include firm and bank-level controls. The latter specification further includes creditor rights and GDP growth for the country of the borrower. The lower part of the table denotes the type of fixed effects used in each specification. The *, **, and *** marks denote statistical significance at the 10%, 5%, and 1% level, respectively.
Loan amount Loan maturity (1) (2) (3) (4) (5) (6)
DI funding source -0.034* -0.030 -0.029 -2.266*** -2.223*** -2.117***
(0.019) (0.019) (0.020) (0.649) (0.641) (0.652) Other DI features 0.035 0.032 0.029 0.119 0.065 0.046
(0.023) (0.023) (0.023) (0.794) (0.833) (0.846) AISD -0.001*** -0.001*** -0.001*** 0.011* 0.009* 0.009*
(0.000) (0.000) (0.000) (0.006) (0.005) (0.005) Loan maturity 0.005*** 0.005*** 0.005*** 2.344*** 2.228*** 2.225***
(0.001) (0.001) (0.001) (0.161) (0.164) (0.164) Collateral -0.109*** -0.100*** -0.103*** 1.726*** 1.906*** 1.880***
(0.012) (0.012) (0.012) (0.255) (0.290) (0.274) Number of lenders 0.034*** 0.033*** 0.033*** 0.091*** 0.097*** 0.096***
(0.001) (0.001) (0.001) (0.027) (0.025) (0.026) Performance provisions 0.196*** 0.196*** 0.198*** 2.124*** 2.000*** 1.953***
(0.009) (0.007) (0.008) (0.137) (0.135) (0.142) Total covenants -0.004 -0.004* -0.004** -0.460*** -0.490*** -0.476***
(0.003) (0.002) (0.002) (0.127) (0.124) (0.113) Market-to-book 0.040*** 0.039*** 1.103*** 1.093***
(0.010) (0.010) (0.182) (0.164) Firm size 0.068*** 0.068*** 0.055 0.049
(0.017) (0.017) (0.095) (0.097) Leverage 0.051*** 0.051*** -2.857*** -2.916***
(0.012) (0.013) (0.606) (0.602) Return on assets 0.073 0.076 1.061 1.061 (0.073) (0.073) (2.572) (2.555) Non-performing loans 0.096 0.096 0.668 0.858 (0.098) (0.095) (1.795) (1.915) Capital ratio -0.022 -0.026 0.636 0.611 (0.027) (0.025) (1.199) (1.106) Bank size 0.002* 0.002* 0.010 0.023 (0.001) (0.001) (0.033) (0.029) Creditor rights 0.058 -3.149 (0.054) (2.874) GDP growth (Firm’s country) 0.003 0.081 (0.003) (0.093)
Observations 141,354 135,952 134,319 141,354 135,952 134,319 Adjusted R-squared 0.753 0.745 0.745 0.706 0.706 0.705
Loan type effects Y Y Y Y Y Y Loan purpose effects Y Y Y Y Y Y Year effects Y Y Y Y Y Y Firm effects Y Y Y Y Y Y Bank effects Y Y Y Y Y Y Clustered standard errors Country Country Country Country Country Country
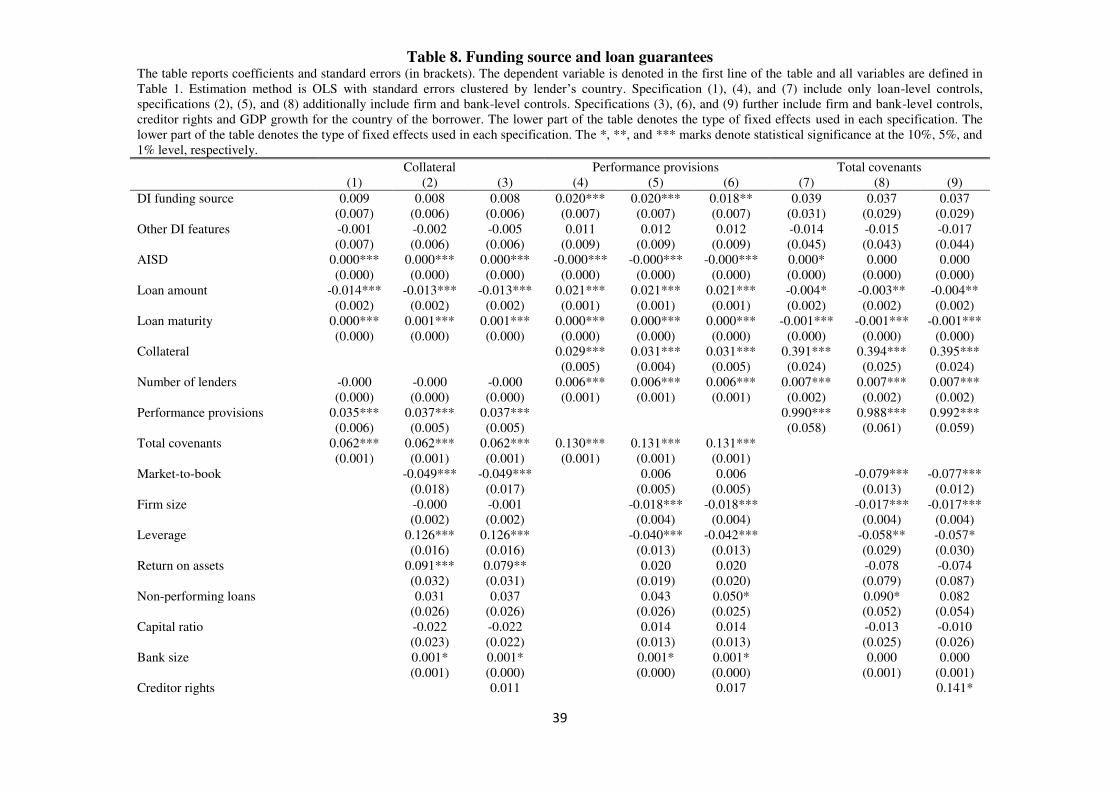
39
Table 8. Funding source and loan guarantees The table reports coefficients and standard errors (in brackets). The dependent variable is denoted in the first line of the table and all variables are defined in Table 1. Estimation method is OLS with standard errors clustered by lender’s country. Specification (1), (4), and (7) include only loan-level controls, specifications (2), (5), and (8) additionally include firm and bank-level controls. Specifications (3), (6), and (9) further include firm and bank-level controls, creditor rights and GDP growth for the country of the borrower. The lower part of the table denotes the type of fixed effects used in each specification. The lower part of the table denotes the type of fixed effects used in each specification. The *, **, and *** marks denote statistical significance at the 10%, 5%, and 1% level, respectively. Collateral Performance provisions Total covenants (1) (2) (3) (4) (5) (6) (7) (8) (9)
DI funding source 0.009 0.008 0.008 0.020*** 0.020*** 0.018** 0.039 0.037 0.037
(0.007) (0.006) (0.006) (0.007) (0.007) (0.007) (0.031) (0.029) (0.029) Other DI features -0.001 -0.002 -0.005 0.011 0.012 0.012 -0.014 -0.015 -0.017 (0.007) (0.006) (0.006) (0.009) (0.009) (0.009) (0.045) (0.043) (0.044) AISD 0.000*** 0.000*** 0.000*** -0.000*** -0.000*** -0.000*** 0.000* 0.000 0.000 (0.000) (0.000) (0.000) (0.000) (0.000) (0.000) (0.000) (0.000) (0.000) Loan amount -0.014*** -0.013*** -0.013*** 0.021*** 0.021*** 0.021*** -0.004* -0.003** -0.004**
(0.002) (0.002) (0.002) (0.001) (0.001) (0.001) (0.002) (0.002) (0.002) Loan maturity 0.000*** 0.001*** 0.001*** 0.000*** 0.000*** 0.000*** -0.001*** -0.001*** -0.001***
(0.000) (0.000) (0.000) (0.000) (0.000) (0.000) (0.000) (0.000) (0.000) Collateral 0.029*** 0.031*** 0.031*** 0.391*** 0.394*** 0.395***
(0.005) (0.004) (0.005) (0.024) (0.025) (0.024) Number of lenders -0.000 -0.000 -0.000 0.006*** 0.006*** 0.006*** 0.007*** 0.007*** 0.007*** (0.000) (0.000) (0.000) (0.001) (0.001) (0.001) (0.002) (0.002) (0.002) Performance provisions 0.035*** 0.037*** 0.037*** 0.990*** 0.988*** 0.992***
(0.006) (0.005) (0.005) (0.058) (0.061) (0.059) Total covenants 0.062*** 0.062*** 0.062*** 0.130*** 0.131*** 0.131***
(0.001) (0.001) (0.001) (0.001) (0.001) (0.001) Market-to-book -0.049*** -0.049*** 0.006 0.006 -0.079*** -0.077***
(0.018) (0.017) (0.005) (0.005) (0.013) (0.012) Firm size -0.000 -0.001 -0.018*** -0.018*** -0.017*** -0.017***
(0.002) (0.002) (0.004) (0.004) (0.004) (0.004) Leverage 0.126*** 0.126*** -0.040*** -0.042*** -0.058** -0.057*
(0.016) (0.016) (0.013) (0.013) (0.029) (0.030) Return on assets 0.091*** 0.079** 0.020 0.020 -0.078 -0.074
(0.032) (0.031) (0.019) (0.020) (0.079) (0.087) Non-performing loans 0.031 0.037 0.043 0.050* 0.090* 0.082
(0.026) (0.026) (0.026) (0.025) (0.052) (0.054) Capital ratio -0.022 -0.022 0.014 0.014 -0.013 -0.010 (0.023) (0.022) (0.013) (0.013) (0.025) (0.026) Bank size 0.001* 0.001* 0.001* 0.001* 0.000 0.000 (0.001) (0.000) (0.000) (0.000) (0.001) (0.001) Creditor rights 0.011 0.017 0.141*
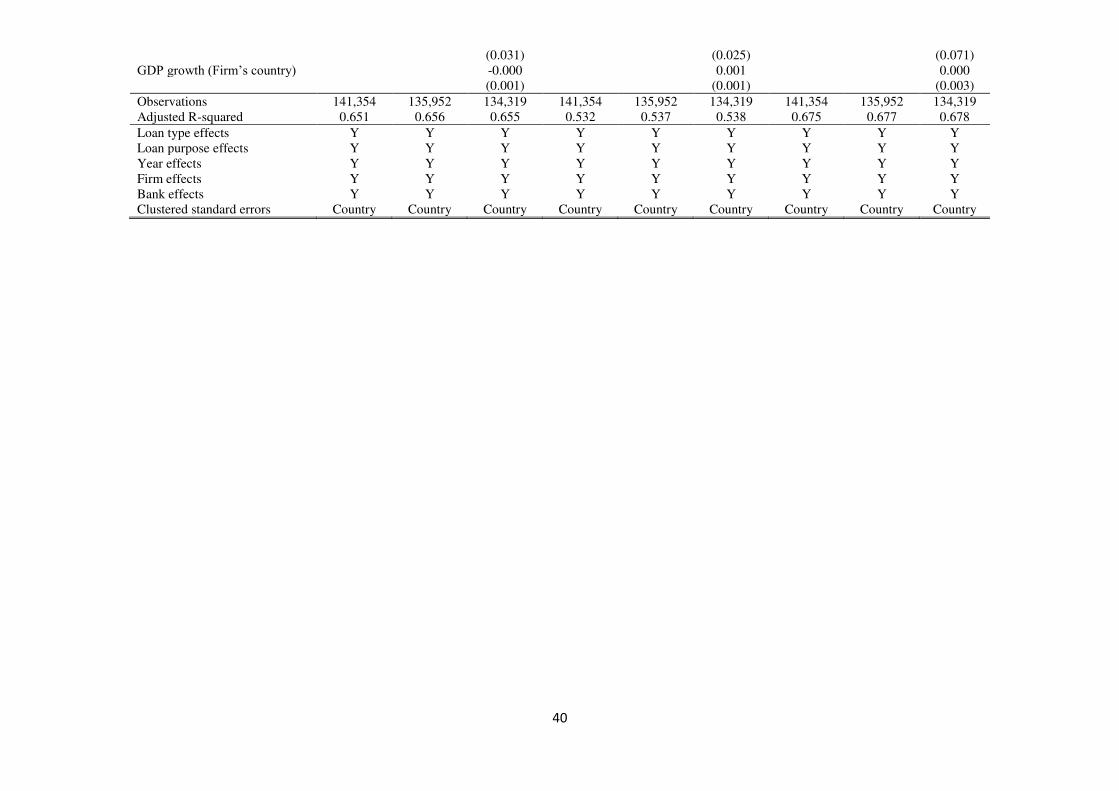
40
(0.031) (0.025) (0.071) GDP growth (Firm’s country) -0.000 0.001 0.000 (0.001) (0.001) (0.003)
Observations 141,354 135,952 134,319 141,354 135,952 134,319 141,354 135,952 134,319 Adjusted R-squared 0.651 0.656 0.655 0.532 0.537 0.538 0.675 0.677 0.678
Loan type effects Y Y Y Y Y Y Y Y Y Loan purpose effects Y Y Y Y Y Y Y Y Y Year effects Y Y Y Y Y Y Y Y Y Firm effects Y Y Y Y Y Y Y Y Y Bank effects Y Y Y Y Y Y Y Y Y Clustered standard errors Country Country Country Country Country Country Country Country Country
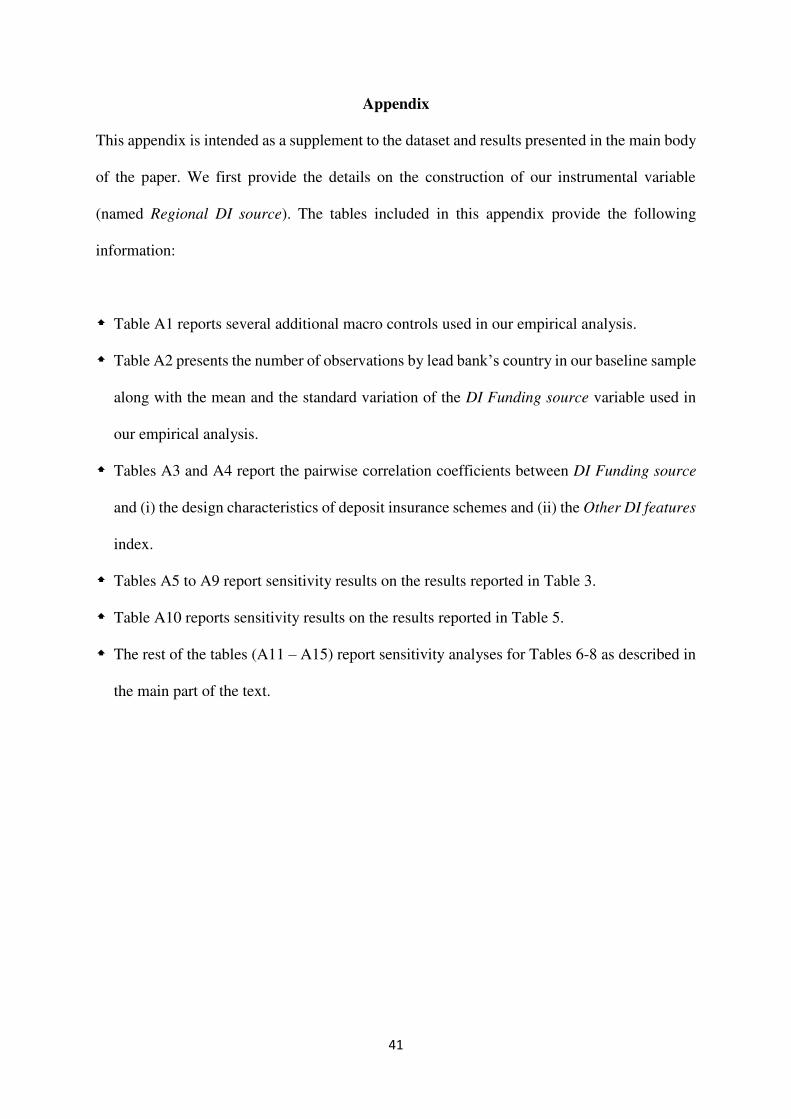
41
Appendix
This appendix is intended as a supplement to the dataset and results presented in the main body
of the paper. We first provide the details on the construction of our instrumental variable
(named Regional DI source). The tables included in this appendix provide the following
information:
Table A1 reports several additional macro controls used in our empirical analysis.
Table A2 presents the number of observations by lead bank’s country in our baseline sample
along with the mean and the standard variation of the DI Funding source variable used in
our empirical analysis.
Tables A3 and A4 report the pairwise correlation coefficients between DI Funding source
and (i) the design characteristics of deposit insurance schemes and (ii) the Other DI features
index.
Tables A5 to A9 report sensitivity results on the results reported in Table 3.
Table A10 reports sensitivity results on the results reported in Table 5.
The rest of the tables (A11 – A15) report sensitivity analyses for Tables 6-8 as described in
the main part of the text.
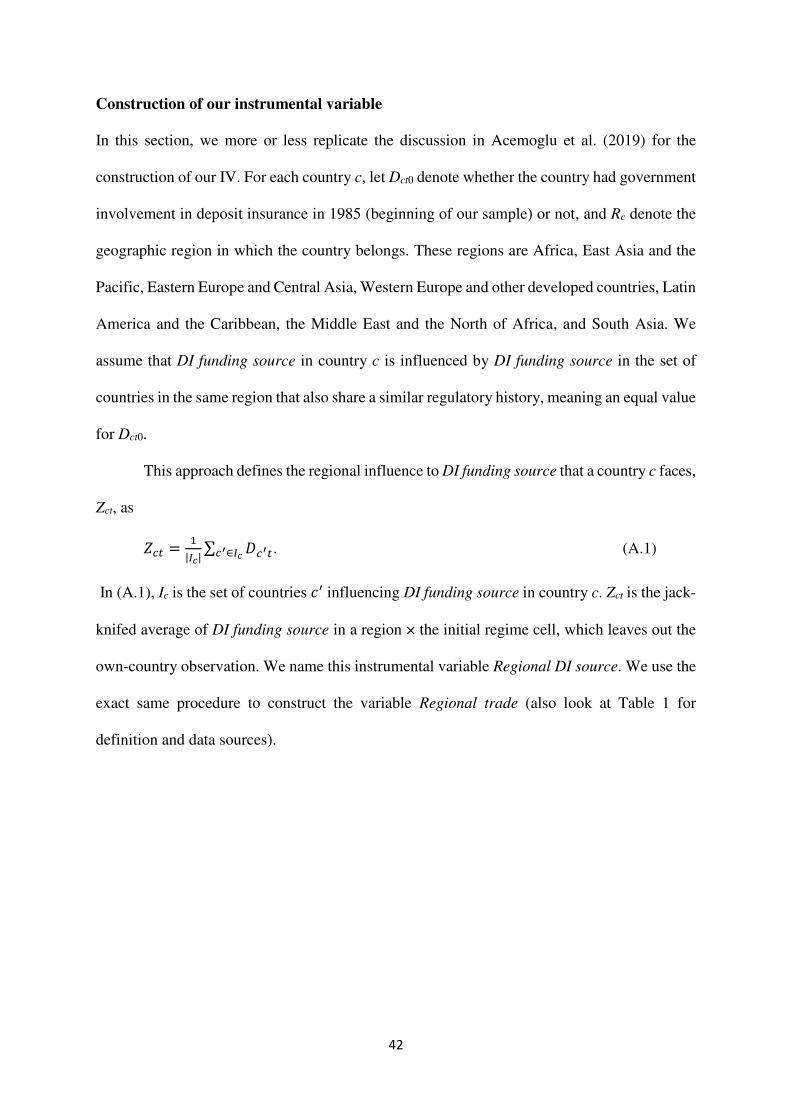
42
Construction of our instrumental variable
In this section, we more or less replicate the discussion in Acemoglu et al. (2019) for the
construction of our IV. For each country c, let Dct0 denote whether the country had government
involvement in deposit insurance in 1985 (beginning of our sample) or not, and Rc denote the
geographic region in which the country belongs. These regions are Africa, East Asia and the
Pacific, Eastern Europe and Central Asia, Western Europe and other developed countries, Latin
America and the Caribbean, the Middle East and the North of Africa, and South Asia. We
assume that DI funding source in country c is influenced by DI funding source in the set of
countries in the same region that also share a similar regulatory history, meaning an equal value
for Dct0.
This approach defines the regional influence to DI funding source that a country c faces,
Zct, as
𝑍𝑐𝑡 = 1|𝐼𝑐| ∑ 𝐷𝑐′𝑡𝑐′∈𝐼𝑐 . (A.1)
In (A.1), Ic is the set of countries 𝑐′ influencing DI funding source in country c. Zct is the jack-
knifed average of DI funding source in a region × the initial regime cell, which leaves out the
own-country observation. We name this instrumental variable Regional DI source. We use the
exact same procedure to construct the variable Regional trade (also look at Table 1 for
definition and data sources).
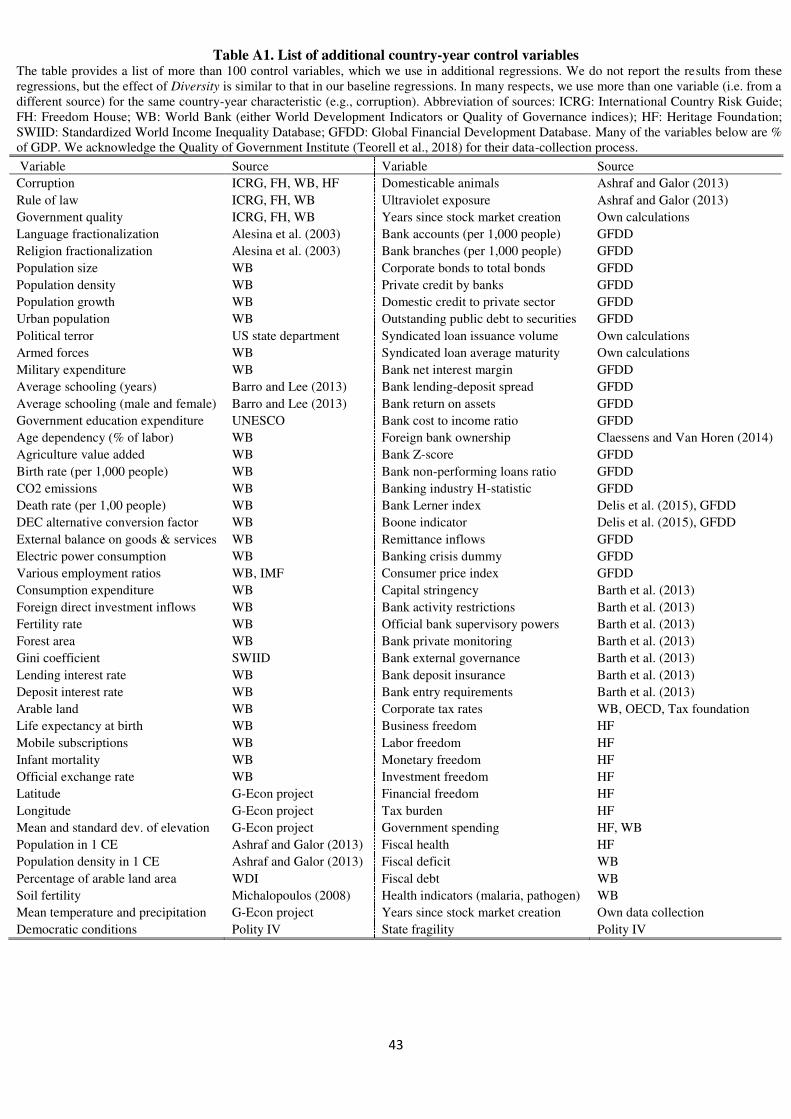
43
Table A1. List of additional country-year control variables The table provides a list of more than 100 control variables, which we use in additional regressions. We do not report the results from these regressions, but the effect of Diversity is similar to that in our baseline regressions. In many respects, we use more than one variable (i.e. from a different source) for the same country-year characteristic (e.g., corruption). Abbreviation of sources: ICRG: International Country Risk Guide; FH: Freedom House; WB: World Bank (either World Development Indicators or Quality of Governance indices); HF: Heritage Foundation; SWIID: Standardized World Income Inequality Database; GFDD: Global Financial Development Database. Many of the variables below are % of GDP. We acknowledge the Quality of Government Institute (Teorell et al., 2018) for their data-collection process.
Variable Source Variable Source
Corruption ICRG, FH, WB, HF Domesticable animals Ashraf and Galor (2013)
Rule of law ICRG, FH, WB Ultraviolet exposure Ashraf and Galor (2013)
Government quality ICRG, FH, WB Years since stock market creation Own calculations
Language fractionalization Alesina et al. (2003) Bank accounts (per 1,000 people) GFDD
Religion fractionalization Alesina et al. (2003) Bank branches (per 1,000 people) GFDD
Population size WB Corporate bonds to total bonds GFDD
Population density WB Private credit by banks GFDD
Population growth WB Domestic credit to private sector GFDD
Urban population WB Outstanding public debt to securities GFDD
Political terror US state department Syndicated loan issuance volume Own calculations
Armed forces WB Syndicated loan average maturity Own calculations
Military expenditure WB Bank net interest margin GFDD
Average schooling (years) Barro and Lee (2013) Bank lending-deposit spread GFDD
Average schooling (male and female) Barro and Lee (2013) Bank return on assets GFDD
Government education expenditure UNESCO Bank cost to income ratio GFDD
Age dependency (% of labor) WB Foreign bank ownership Claessens and Van Horen (2014)
Agriculture value added WB Bank Z-score GFDD
Birth rate (per 1,000 people) WB Bank non-performing loans ratio GFDD
CO2 emissions WB Banking industry H-statistic GFDD
Death rate (per 1,00 people) WB Bank Lerner index Delis et al. (2015), GFDD
DEC alternative conversion factor WB Boone indicator Delis et al. (2015), GFDD
External balance on goods & services WB Remittance inflows GFDD
Electric power consumption WB Banking crisis dummy GFDD
Various employment ratios WB, IMF Consumer price index GFDD
Consumption expenditure WB Capital stringency Barth et al. (2013)
Foreign direct investment inflows WB Bank activity restrictions Barth et al. (2013)
Fertility rate WB Official bank supervisory powers Barth et al. (2013)
Forest area WB Bank private monitoring Barth et al. (2013)
Gini coefficient SWIID Bank external governance Barth et al. (2013)
Lending interest rate WB Bank deposit insurance Barth et al. (2013)
Deposit interest rate WB Bank entry requirements Barth et al. (2013)
Arable land WB Corporate tax rates WB, OECD, Tax foundation
Life expectancy at birth WB Business freedom HF
Mobile subscriptions WB Labor freedom HF
Infant mortality WB Monetary freedom HF
Official exchange rate WB Investment freedom HF
Latitude G-Econ project Financial freedom HF
Longitude G-Econ project Tax burden HF
Mean and standard dev. of elevation G-Econ project Government spending HF, WB
Population in 1 CE Ashraf and Galor (2013) Fiscal health HF
Population density in 1 CE Ashraf and Galor (2013) Fiscal deficit WB
Percentage of arable land area WDI Fiscal debt WB
Soil fertility Michalopoulos (2008) Health indicators (malaria, pathogen) WB
Mean temperature and precipitation G-Econ project Years since stock market creation Own data collection
Democratic conditions Polity IV State fragility Polity IV
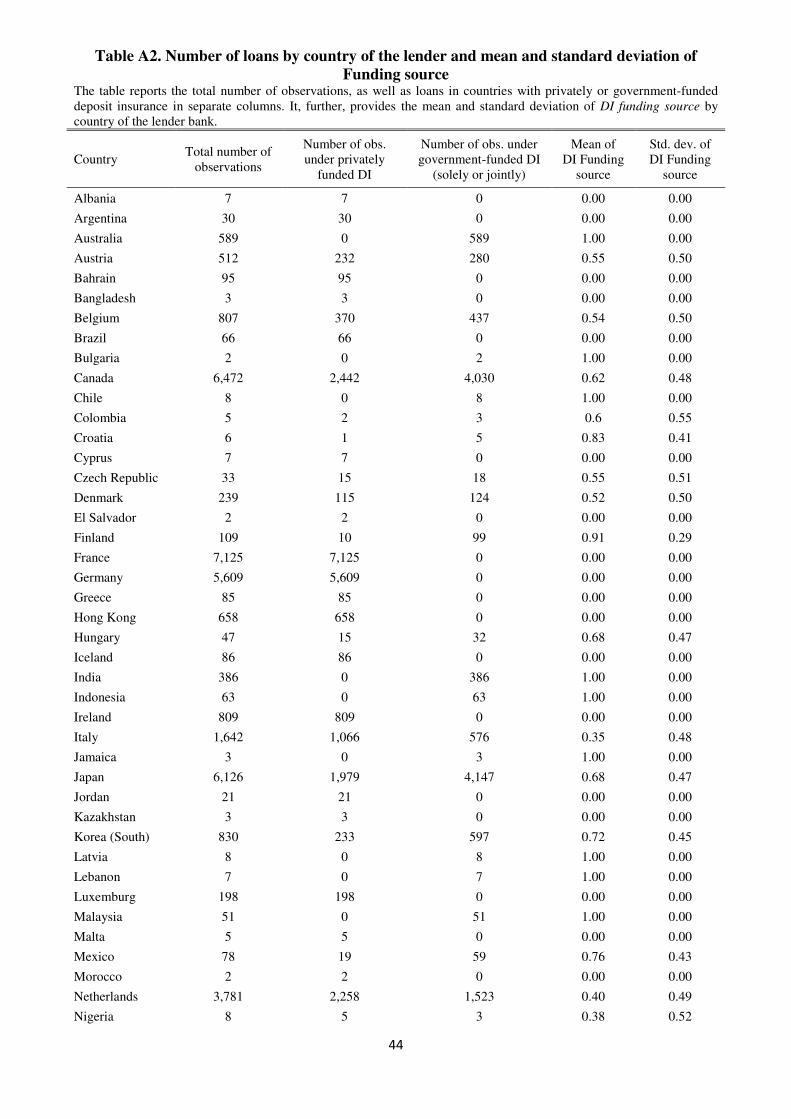
44
Table A2. Number of loans by country of the lender and mean and standard deviation of
Funding source The table reports the total number of observations, as well as loans in countries with privately or government-funded deposit insurance in separate columns. It, further, provides the mean and standard deviation of DI funding source by country of the lender bank.
Country Total number of
observations
Number of obs. under privately
funded DI
Number of obs. under government-funded DI
(solely or jointly)
Mean of DI Funding
source
Std. dev. of DI Funding
source
Albania 7 7 0 0.00 0.00
Argentina 30 30 0 0.00 0.00
Australia 589 0 589 1.00 0.00
Austria 512 232 280 0.55 0.50
Bahrain 95 95 0 0.00 0.00
Bangladesh 3 3 0 0.00 0.00
Belgium 807 370 437 0.54 0.50
Brazil 66 66 0 0.00 0.00
Bulgaria 2 0 2 1.00 0.00
Canada 6,472 2,442 4,030 0.62 0.48
Chile 8 0 8 1.00 0.00
Colombia 5 2 3 0.6 0.55
Croatia 6 1 5 0.83 0.41
Cyprus 7 7 0 0.00 0.00
Czech Republic 33 15 18 0.55 0.51
Denmark 239 115 124 0.52 0.50
El Salvador 2 2 0 0.00 0.00
Finland 109 10 99 0.91 0.29
France 7,125 7,125 0 0.00 0.00
Germany 5,609 5,609 0 0.00 0.00
Greece 85 85 0 0.00 0.00
Hong Kong 658 658 0 0.00 0.00
Hungary 47 15 32 0.68 0.47
Iceland 86 86 0 0.00 0.00
India 386 0 386 1.00 0.00
Indonesia 63 0 63 1.00 0.00
Ireland 809 809 0 0.00 0.00
Italy 1,642 1,066 576 0.35 0.48
Jamaica 3 0 3 1.00 0.00
Japan 6,126 1,979 4,147 0.68 0.47
Jordan 21 21 0 0.00 0.00
Kazakhstan 3 3 0 0.00 0.00
Korea (South) 830 233 597 0.72 0.45
Latvia 8 0 8 1.00 0.00
Lebanon 7 0 7 1.00 0.00
Luxemburg 198 198 0 0.00 0.00
Malaysia 51 0 51 1.00 0.00
Malta 5 5 0 0.00 0.00
Mexico 78 19 59 0.76 0.43
Morocco 2 2 0 0.00 0.00
Netherlands 3,781 2,258 1,523 0.40 0.49
Nigeria 8 5 3 0.38 0.52
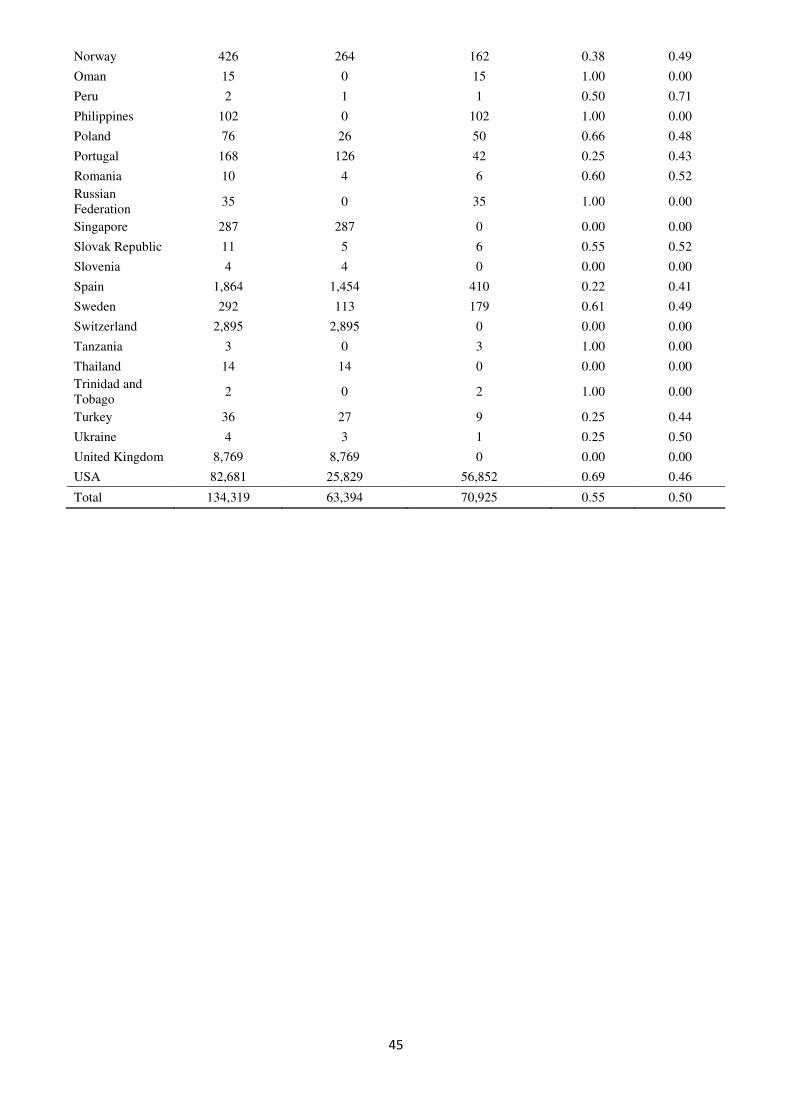
45
Norway 426 264 162 0.38 0.49
Oman 15 0 15 1.00 0.00
Peru 2 1 1 0.50 0.71
Philippines 102 0 102 1.00 0.00
Poland 76 26 50 0.66 0.48
Portugal 168 126 42 0.25 0.43
Romania 10 4 6 0.60 0.52
Russian Federation
35 0 35 1.00 0.00
Singapore 287 287 0 0.00 0.00
Slovak Republic 11 5 6 0.55 0.52
Slovenia 4 4 0 0.00 0.00
Spain 1,864 1,454 410 0.22 0.41
Sweden 292 113 179 0.61 0.49
Switzerland 2,895 2,895 0 0.00 0.00
Tanzania 3 0 3 1.00 0.00
Thailand 14 14 0 0.00 0.00
Trinidad and Tobago
2 0 2 1.00 0.00
Turkey 36 27 9 0.25 0.44
Ukraine 4 3 1 0.25 0.50
United Kingdom 8,769 8,769 0 0.00 0.00
USA 82,681 25,829 56,852 0.69 0.46
Total 134,319 63,394 70,925 0.55 0.50

46
Table A3. Correlation matrix between DI funding source and Other DI features The * mark denotes statistical significance at the 1% level.
(1) (2)
(1) DI funding source 1
(2) Other DI features 0.3592* 1
Table A4. Correlation matrix between DI funding source and the components of Other DI
features The * mark denotes statistical significance at the 1% level.
(1) (2) (3) (4) (5) (6) (7)
(1) DI funding source 1
(2) Foreign currency deposits -0.1340* 1
(3) Interbank deposits 0.3740* 0.2249* 1
(4) Ex-ante funding 0.3321* -0.1847* 0.4301* 1
(5) Risk-adjusted premiums -0.2530* -0.3486* -0.7321* -0.4148* 1
(6) Administration 0.2637* -0.1098* 0.3219* 0.5500* -0.2032* 1
(7) Membership 0.0719* -0.3124* -0.1695* -0.0482* -0.0634* -0.1142* 1
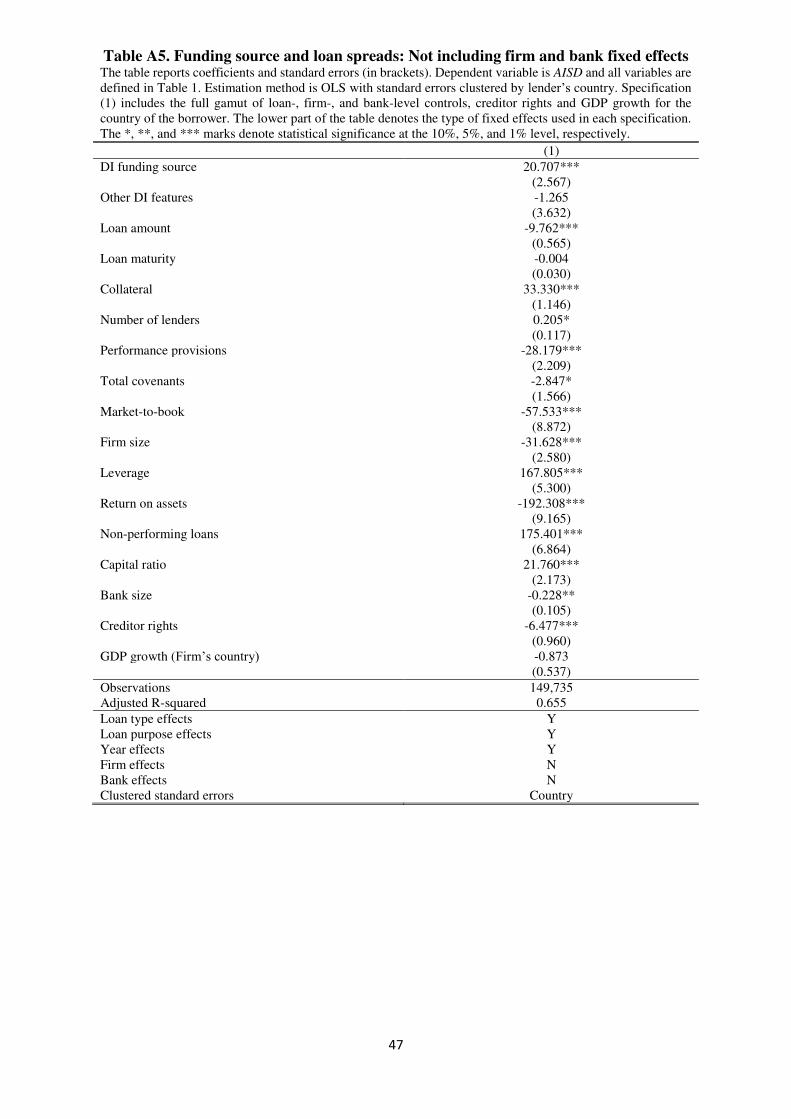
47
Table A5. Funding source and loan spreads: Not including firm and bank fixed effects The table reports coefficients and standard errors (in brackets). Dependent variable is AISD and all variables are defined in Table 1. Estimation method is OLS with standard errors clustered by lender’s country. Specification (1) includes the full gamut of loan-, firm-, and bank-level controls, creditor rights and GDP growth for the country of the borrower. The lower part of the table denotes the type of fixed effects used in each specification. The *, **, and *** marks denote statistical significance at the 10%, 5%, and 1% level, respectively.
(1)
DI funding source 20.707***
(2.567) Other DI features -1.265
(3.632) Loan amount -9.762***
(0.565) Loan maturity -0.004
(0.030) Collateral 33.330***
(1.146) Number of lenders 0.205*
(0.117) Performance provisions -28.179***
(2.209) Total covenants -2.847*
(1.566) Market-to-book -57.533***
(8.872) Firm size -31.628***
(2.580) Leverage 167.805***
(5.300) Return on assets -192.308*** (9.165) Non-performing loans 175.401*** (6.864) Capital ratio 21.760*** (2.173) Bank size -0.228** (0.105) Creditor rights -6.477*** (0.960) GDP growth (Firm’s country) -0.873 (0.537)
Observations 149,735 Adjusted R-squared 0.655
Loan type effects Y Loan purpose effects Y Year effects Y Firm effects N Bank effects N Clustered standard errors Country
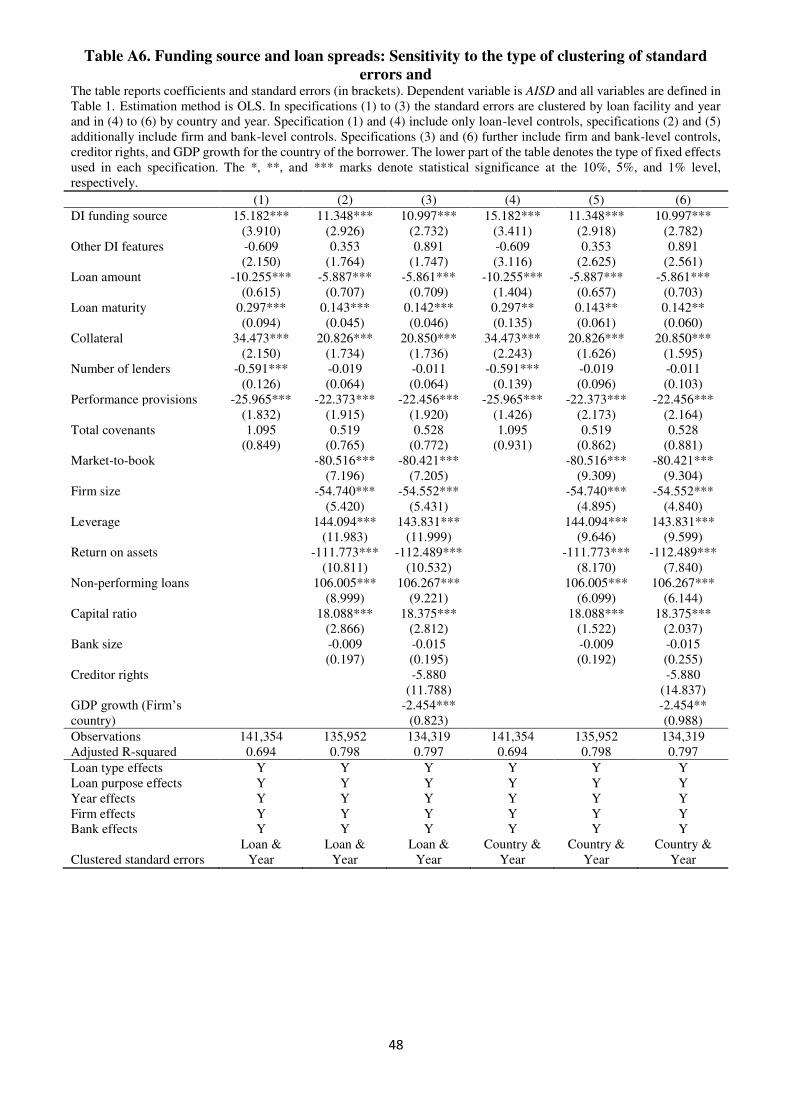
48
Table A6. Funding source and loan spreads: Sensitivity to the type of clustering of standard
errors and The table reports coefficients and standard errors (in brackets). Dependent variable is AISD and all variables are defined in Table 1. Estimation method is OLS. In specifications (1) to (3) the standard errors are clustered by loan facility and year and in (4) to (6) by country and year. Specification (1) and (4) include only loan-level controls, specifications (2) and (5) additionally include firm and bank-level controls. Specifications (3) and (6) further include firm and bank-level controls, creditor rights, and GDP growth for the country of the borrower. The lower part of the table denotes the type of fixed effects used in each specification. The *, **, and *** marks denote statistical significance at the 10%, 5%, and 1% level, respectively. (1) (2) (3) (4) (5) (6)
DI funding source 15.182*** 11.348*** 10.997*** 15.182*** 11.348*** 10.997***
(3.910) (2.926) (2.732) (3.411) (2.918) (2.782) Other DI features -0.609 0.353 0.891 -0.609 0.353 0.891
(2.150) (1.764) (1.747) (3.116) (2.625) (2.561) Loan amount -10.255*** -5.887*** -5.861*** -10.255*** -5.887*** -5.861***
(0.615) (0.707) (0.709) (1.404) (0.657) (0.703) Loan maturity 0.297*** 0.143*** 0.142*** 0.297** 0.143** 0.142**
(0.094) (0.045) (0.046) (0.135) (0.061) (0.060) Collateral 34.473*** 20.826*** 20.850*** 34.473*** 20.826*** 20.850***
(2.150) (1.734) (1.736) (2.243) (1.626) (1.595) Number of lenders -0.591*** -0.019 -0.011 -0.591*** -0.019 -0.011
(0.126) (0.064) (0.064) (0.139) (0.096) (0.103) Performance provisions -25.965*** -22.373*** -22.456*** -25.965*** -22.373*** -22.456***
(1.832) (1.915) (1.920) (1.426) (2.173) (2.164) Total covenants 1.095 0.519 0.528 1.095 0.519 0.528
(0.849) (0.765) (0.772) (0.931) (0.862) (0.881) Market-to-book -80.516*** -80.421*** -80.516*** -80.421***
(7.196) (7.205) (9.309) (9.304) Firm size -54.740*** -54.552*** -54.740*** -54.552***
(5.420) (5.431) (4.895) (4.840) Leverage 144.094*** 143.831*** 144.094*** 143.831***
(11.983) (11.999) (9.646) (9.599) Return on assets -111.773*** -112.489*** -111.773*** -112.489*** (10.811) (10.532) (8.170) (7.840) Non-performing loans 106.005*** 106.267*** 106.005*** 106.267*** (8.999) (9.221) (6.099) (6.144) Capital ratio 18.088*** 18.375*** 18.088*** 18.375*** (2.866) (2.812) (1.522) (2.037) Bank size -0.009 -0.015 -0.009 -0.015 (0.197) (0.195) (0.192) (0.255) Creditor rights -5.880 -5.880 (11.788) (14.837) GDP growth (Firm’s country)
-2.454*** -2.454** (0.823) (0.988)
Observations 141,354 135,952 134,319 141,354 135,952 134,319 Adjusted R-squared 0.694 0.798 0.797 0.694 0.798 0.797
Loan type effects Y Y Y Y Y Y Loan purpose effects Y Y Y Y Y Y Year effects Y Y Y Y Y Y Firm effects Y Y Y Y Y Y Bank effects Y Y Y Y Y Y
Clustered standard errors Loan &
Year Loan &
Year Loan &
Year Country &
Year Country &
Year Country &
Year
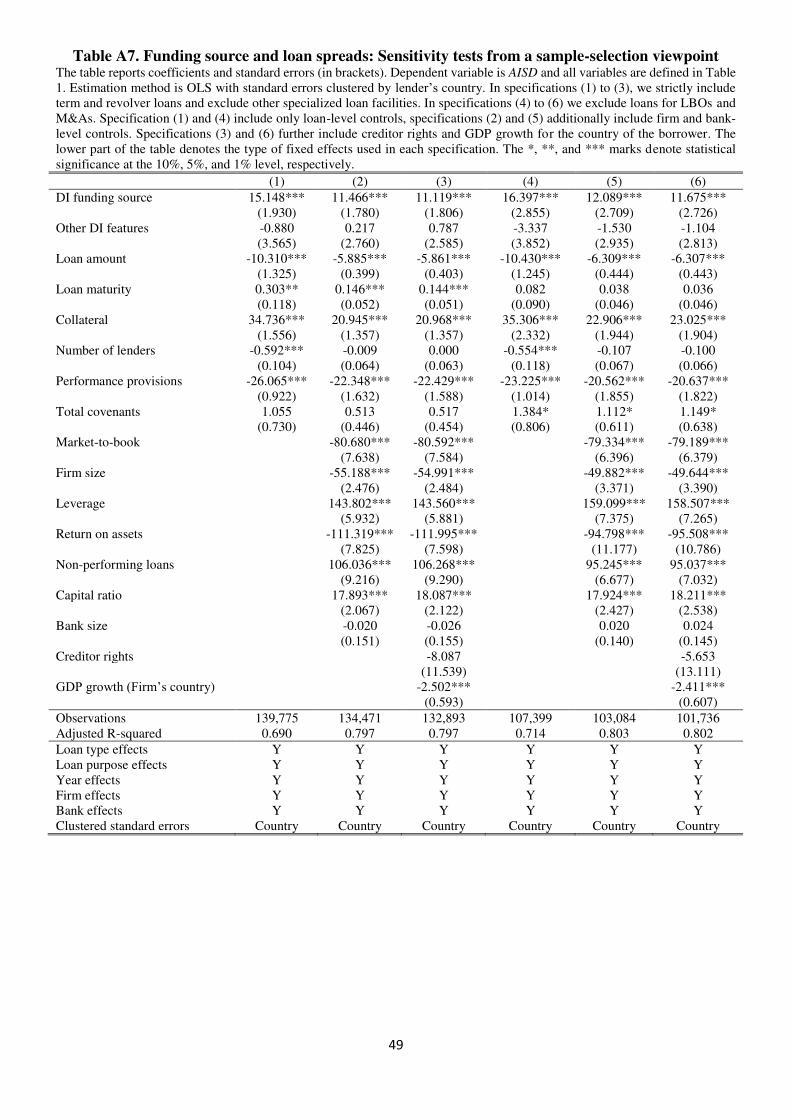
49
Table A7. Funding source and loan spreads: Sensitivity tests from a sample-selection viewpoint The table reports coefficients and standard errors (in brackets). Dependent variable is AISD and all variables are defined in Table 1. Estimation method is OLS with standard errors clustered by lender’s country. In specifications (1) to (3), we strictly include term and revolver loans and exclude other specialized loan facilities. In specifications (4) to (6) we exclude loans for LBOs and M&As. Specification (1) and (4) include only loan-level controls, specifications (2) and (5) additionally include firm and bank-level controls. Specifications (3) and (6) further include creditor rights and GDP growth for the country of the borrower. The lower part of the table denotes the type of fixed effects used in each specification. The *, **, and *** marks denote statistical significance at the 10%, 5%, and 1% level, respectively. (1) (2) (3) (4) (5) (6)
DI funding source 15.148*** 11.466*** 11.119*** 16.397*** 12.089*** 11.675***
(1.930) (1.780) (1.806) (2.855) (2.709) (2.726) Other DI features -0.880 0.217 0.787 -3.337 -1.530 -1.104
(3.565) (2.760) (2.585) (3.852) (2.935) (2.813) Loan amount -10.310*** -5.885*** -5.861*** -10.430*** -6.309*** -6.307***
(1.325) (0.399) (0.403) (1.245) (0.444) (0.443) Loan maturity 0.303** 0.146*** 0.144*** 0.082 0.038 0.036
(0.118) (0.052) (0.051) (0.090) (0.046) (0.046) Collateral 34.736*** 20.945*** 20.968*** 35.306*** 22.906*** 23.025***
(1.556) (1.357) (1.357) (2.332) (1.944) (1.904) Number of lenders -0.592*** -0.009 0.000 -0.554*** -0.107 -0.100
(0.104) (0.064) (0.063) (0.118) (0.067) (0.066) Performance provisions -26.065*** -22.348*** -22.429*** -23.225*** -20.562*** -20.637***
(0.922) (1.632) (1.588) (1.014) (1.855) (1.822) Total covenants 1.055 0.513 0.517 1.384* 1.112* 1.149*
(0.730) (0.446) (0.454) (0.806) (0.611) (0.638) Market-to-book -80.680*** -80.592*** -79.334*** -79.189***
(7.638) (7.584) (6.396) (6.379) Firm size -55.188*** -54.991*** -49.882*** -49.644***
(2.476) (2.484) (3.371) (3.390) Leverage 143.802*** 143.560*** 159.099*** 158.507***
(5.932) (5.881) (7.375) (7.265) Return on assets -111.319*** -111.995*** -94.798*** -95.508*** (7.825) (7.598) (11.177) (10.786) Non-performing loans 106.036*** 106.268*** 95.245*** 95.037*** (9.216) (9.290) (6.677) (7.032) Capital ratio 17.893*** 18.087*** 17.924*** 18.211*** (2.067) (2.122) (2.427) (2.538) Bank size -0.020 -0.026 0.020 0.024 (0.151) (0.155) (0.140) (0.145) Creditor rights -8.087 -5.653 (11.539) (13.111) GDP growth (Firm’s country) -2.502*** -2.411*** (0.593) (0.607)
Observations 139,775 134,471 132,893 107,399 103,084 101,736 Adjusted R-squared 0.690 0.797 0.797 0.714 0.803 0.802
Loan type effects Y Y Y Y Y Y Loan purpose effects Y Y Y Y Y Y Year effects Y Y Y Y Y Y Firm effects Y Y Y Y Y Y Bank effects Y Y Y Y Y Y Clustered standard errors Country Country Country Country Country Country
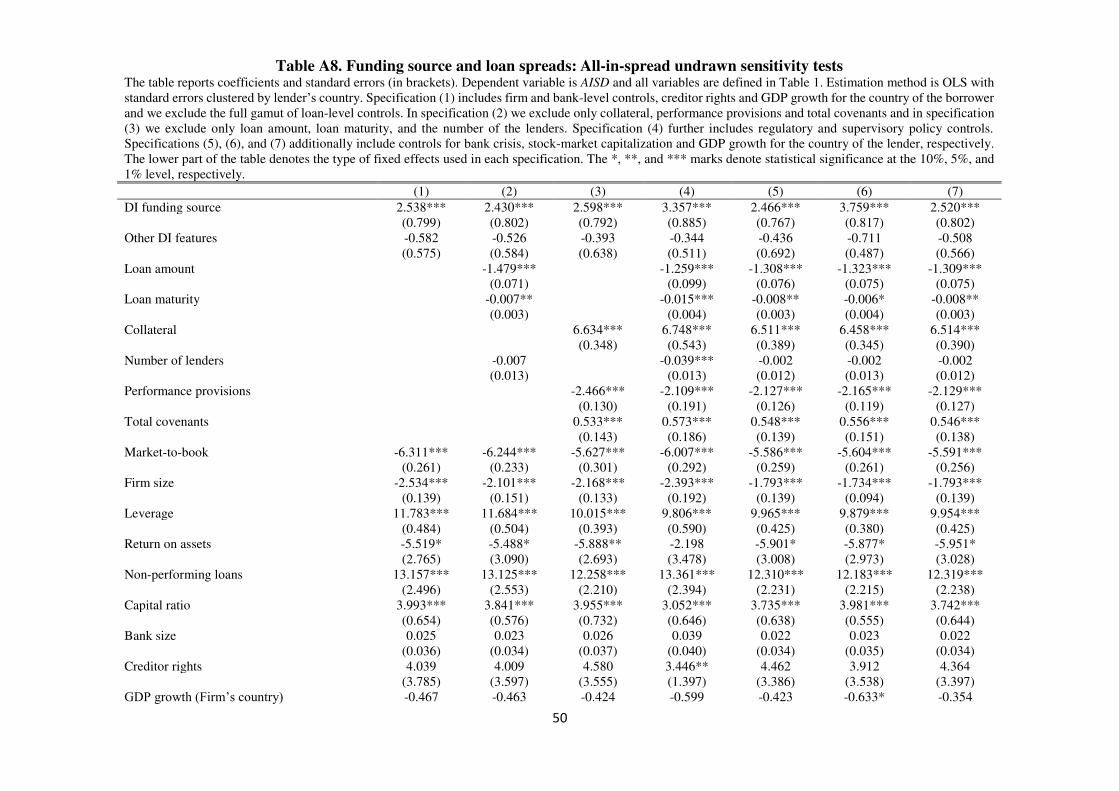
50
Table A8. Funding source and loan spreads: All-in-spread undrawn sensitivity tests The table reports coefficients and standard errors (in brackets). Dependent variable is AISD and all variables are defined in Table 1. Estimation method is OLS with standard errors clustered by lender’s country. Specification (1) includes firm and bank-level controls, creditor rights and GDP growth for the country of the borrower and we exclude the full gamut of loan-level controls. In specification (2) we exclude only collateral, performance provisions and total covenants and in specification (3) we exclude only loan amount, loan maturity, and the number of the lenders. Specification (4) further includes regulatory and supervisory policy controls. Specifications (5), (6), and (7) additionally include controls for bank crisis, stock-market capitalization and GDP growth for the country of the lender, respectively. The lower part of the table denotes the type of fixed effects used in each specification. The *, **, and *** marks denote statistical significance at the 10%, 5%, and 1% level, respectively. (1) (2) (3) (4) (5) (6) (7)
DI funding source 2.538*** 2.430*** 2.598*** 3.357*** 2.466*** 3.759*** 2.520***
(0.799) (0.802) (0.792) (0.885) (0.767) (0.817) (0.802) Other DI features -0.582 -0.526 -0.393 -0.344 -0.436 -0.711 -0.508 (0.575) (0.584) (0.638) (0.511) (0.692) (0.487) (0.566) Loan amount -1.479*** -1.259*** -1.308*** -1.323*** -1.309***
(0.071) (0.099) (0.076) (0.075) (0.075) Loan maturity -0.007** -0.015*** -0.008** -0.006* -0.008**
(0.003) (0.004) (0.003) (0.004) (0.003) Collateral 6.634*** 6.748*** 6.511*** 6.458*** 6.514***
(0.348) (0.543) (0.389) (0.345) (0.390) Number of lenders -0.007 -0.039*** -0.002 -0.002 -0.002 (0.013) (0.013) (0.012) (0.013) (0.012) Performance provisions -2.466*** -2.109*** -2.127*** -2.165*** -2.129***
(0.130) (0.191) (0.126) (0.119) (0.127) Total covenants 0.533*** 0.573*** 0.548*** 0.556*** 0.546***
(0.143) (0.186) (0.139) (0.151) (0.138) Market-to-book -6.311*** -6.244*** -5.627*** -6.007*** -5.586*** -5.604*** -5.591***
(0.261) (0.233) (0.301) (0.292) (0.259) (0.261) (0.256) Firm size -2.534*** -2.101*** -2.168*** -2.393*** -1.793*** -1.734*** -1.793***
(0.139) (0.151) (0.133) (0.192) (0.139) (0.094) (0.139) Leverage 11.783*** 11.684*** 10.015*** 9.806*** 9.965*** 9.879*** 9.954***
(0.484) (0.504) (0.393) (0.590) (0.425) (0.380) (0.425) Return on assets -5.519* -5.488* -5.888** -2.198 -5.901* -5.877* -5.951*
(2.765) (3.090) (2.693) (3.478) (3.008) (2.973) (3.028) Non-performing loans 13.157*** 13.125*** 12.258*** 13.361*** 12.310*** 12.183*** 12.319***
(2.496) (2.553) (2.210) (2.394) (2.231) (2.215) (2.238) Capital ratio 3.993*** 3.841*** 3.955*** 3.052*** 3.735*** 3.981*** 3.742*** (0.654) (0.576) (0.732) (0.646) (0.638) (0.555) (0.644) Bank size 0.025 0.023 0.026 0.039 0.022 0.023 0.022 (0.036) (0.034) (0.037) (0.040) (0.034) (0.035) (0.034) Creditor rights 4.039 4.009 4.580 3.446** 4.462 3.912 4.364 (3.785) (3.597) (3.555) (1.397) (3.386) (3.538) (3.397) GDP growth (Firm’s country) -0.467 -0.463 -0.424 -0.599 -0.423 -0.633* -0.354
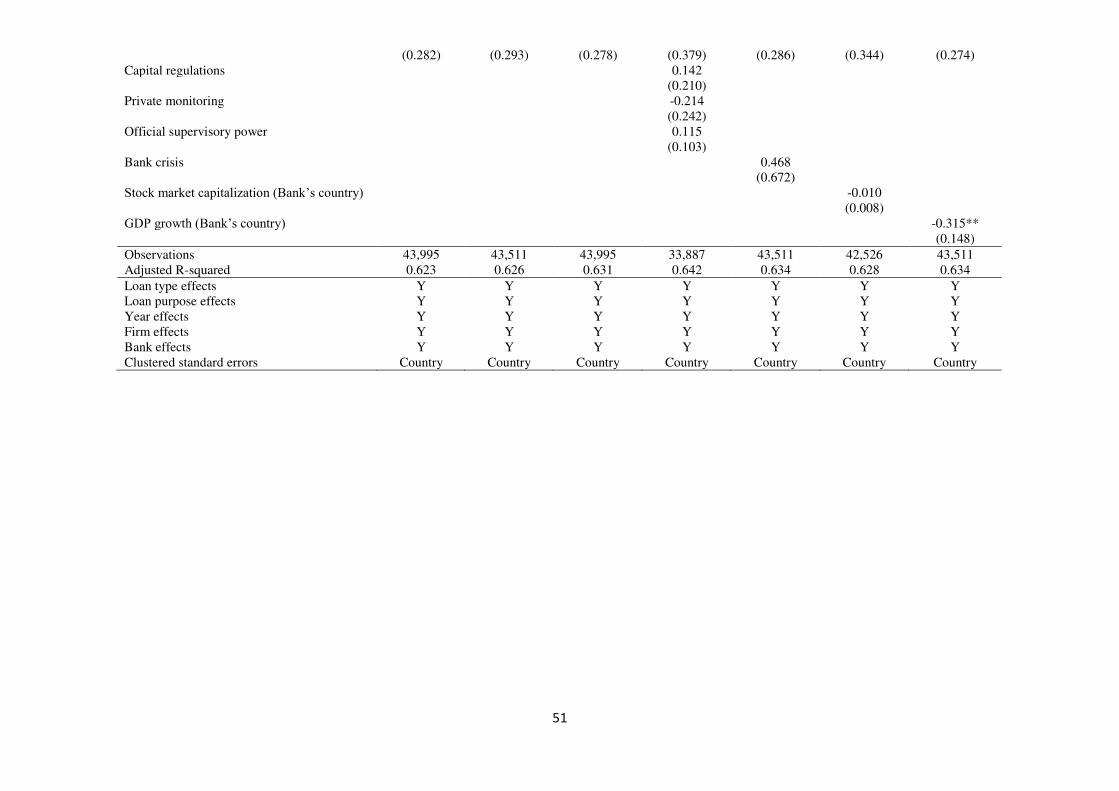
51
(0.282) (0.293) (0.278) (0.379) (0.286) (0.344) (0.274) Capital regulations 0.142 (0.210) Private monitoring -0.214 (0.242) Official supervisory power 0.115 (0.103) Bank crisis 0.468 (0.672) Stock market capitalization (Bank’s country) -0.010 (0.008) GDP growth (Bank’s country) -0.315** (0.148)
Observations 43,995 43,511 43,995 33,887 43,511 42,526 43,511 Adjusted R-squared 0.623 0.626 0.631 0.642 0.634 0.628 0.634
Loan type effects Y Y Y Y Y Y Y Loan purpose effects Y Y Y Y Y Y Y Year effects Y Y Y Y Y Y Y Firm effects Y Y Y Y Y Y Y Bank effects Y Y Y Y Y Y Y Clustered standard errors Country Country Country Country Country Country Country
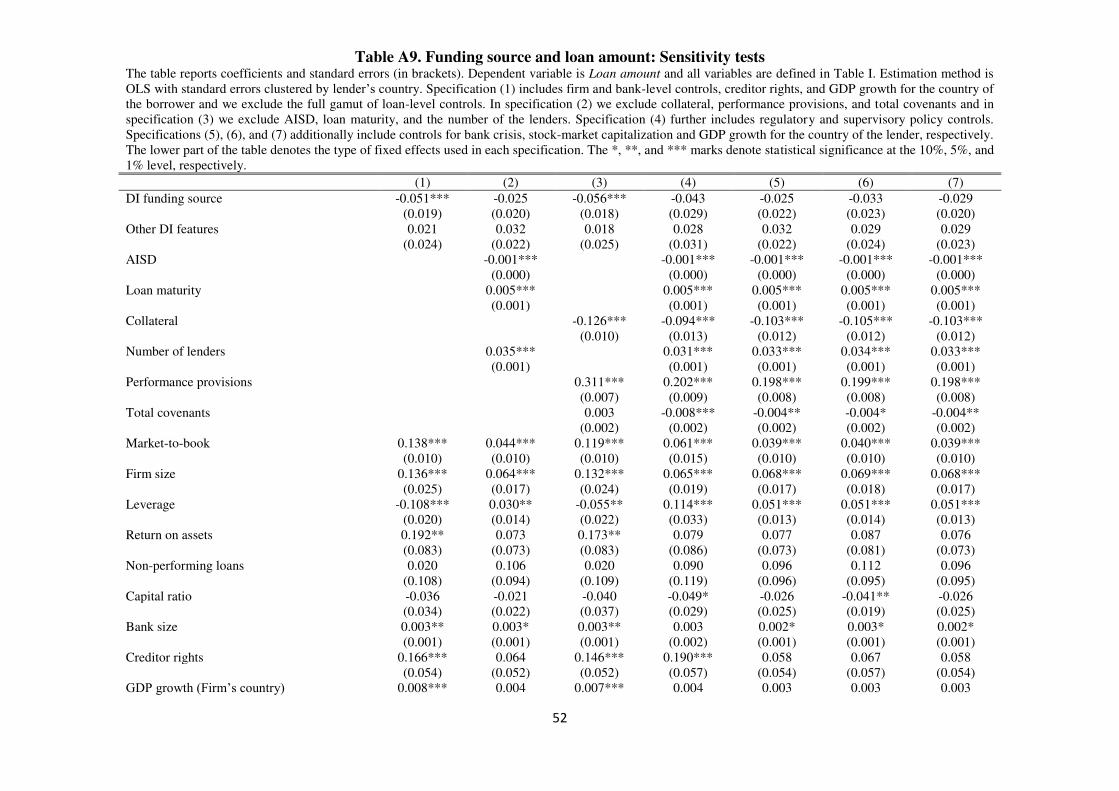
52
Table A9. Funding source and loan amount: Sensitivity tests The table reports coefficients and standard errors (in brackets). Dependent variable is Loan amount and all variables are defined in Table I. Estimation method is OLS with standard errors clustered by lender’s country. Specification (1) includes firm and bank-level controls, creditor rights, and GDP growth for the country of the borrower and we exclude the full gamut of loan-level controls. In specification (2) we exclude collateral, performance provisions, and total covenants and in specification (3) we exclude AISD, loan maturity, and the number of the lenders. Specification (4) further includes regulatory and supervisory policy controls. Specifications (5), (6), and (7) additionally include controls for bank crisis, stock-market capitalization and GDP growth for the country of the lender, respectively. The lower part of the table denotes the type of fixed effects used in each specification. The *, **, and *** marks denote statistical significance at the 10%, 5%, and 1% level, respectively. (1) (2) (3) (4) (5) (6) (7)
DI funding source -0.051*** -0.025 -0.056*** -0.043 -0.025 -0.033 -0.029
(0.019) (0.020) (0.018) (0.029) (0.022) (0.023) (0.020) Other DI features 0.021 0.032 0.018 0.028 0.032 0.029 0.029 (0.024) (0.022) (0.025) (0.031) (0.022) (0.024) (0.023) AISD -0.001*** -0.001*** -0.001*** -0.001*** -0.001***
(0.000) (0.000) (0.000) (0.000) (0.000) Loan maturity 0.005*** 0.005*** 0.005*** 0.005*** 0.005***
(0.001) (0.001) (0.001) (0.001) (0.001) Collateral -0.126*** -0.094*** -0.103*** -0.105*** -0.103***
(0.010) (0.013) (0.012) (0.012) (0.012) Number of lenders 0.035*** 0.031*** 0.033*** 0.034*** 0.033*** (0.001) (0.001) (0.001) (0.001) (0.001) Performance provisions 0.311*** 0.202*** 0.198*** 0.199*** 0.198***
(0.007) (0.009) (0.008) (0.008) (0.008) Total covenants 0.003 -0.008*** -0.004** -0.004* -0.004**
(0.002) (0.002) (0.002) (0.002) (0.002) Market-to-book 0.138*** 0.044*** 0.119*** 0.061*** 0.039*** 0.040*** 0.039***
(0.010) (0.010) (0.010) (0.015) (0.010) (0.010) (0.010) Firm size 0.136*** 0.064*** 0.132*** 0.065*** 0.068*** 0.069*** 0.068***
(0.025) (0.017) (0.024) (0.019) (0.017) (0.018) (0.017) Leverage -0.108*** 0.030** -0.055** 0.114*** 0.051*** 0.051*** 0.051***
(0.020) (0.014) (0.022) (0.033) (0.013) (0.014) (0.013) Return on assets 0.192** 0.073 0.173** 0.079 0.077 0.087 0.076
(0.083) (0.073) (0.083) (0.086) (0.073) (0.081) (0.073) Non-performing loans 0.020 0.106 0.020 0.090 0.096 0.112 0.096
(0.108) (0.094) (0.109) (0.119) (0.096) (0.095) (0.095) Capital ratio -0.036 -0.021 -0.040 -0.049* -0.026 -0.041** -0.026 (0.034) (0.022) (0.037) (0.029) (0.025) (0.019) (0.025) Bank size 0.003** 0.003* 0.003** 0.003 0.002* 0.003* 0.002* (0.001) (0.001) (0.001) (0.002) (0.001) (0.001) (0.001) Creditor rights 0.166*** 0.064 0.146*** 0.190*** 0.058 0.067 0.058 (0.054) (0.052) (0.052) (0.057) (0.054) (0.057) (0.054) GDP growth (Firm’s country) 0.008*** 0.004 0.007*** 0.004 0.003 0.003 0.003
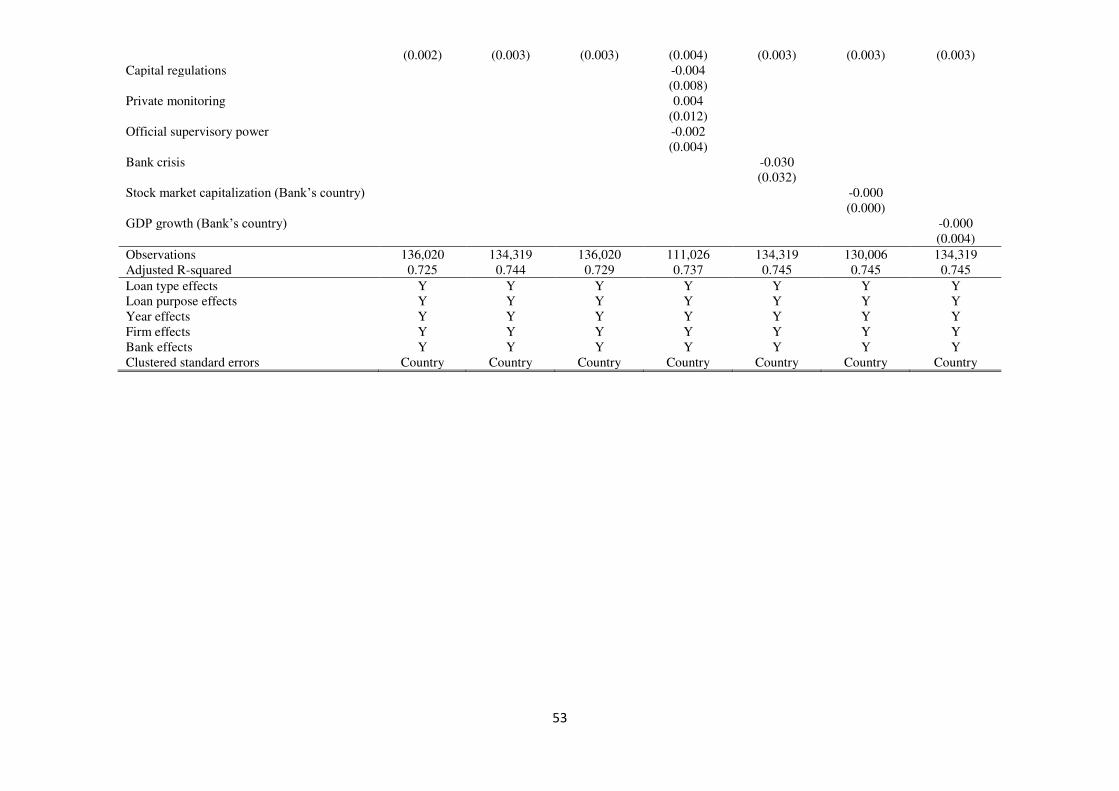
53
(0.002) (0.003) (0.003) (0.004) (0.003) (0.003) (0.003) Capital regulations -0.004 (0.008) Private monitoring 0.004 (0.012) Official supervisory power -0.002 (0.004) Bank crisis -0.030 (0.032) Stock market capitalization (Bank’s country) -0.000 (0.000) GDP growth (Bank’s country) -0.000 (0.004)
Observations 136,020 134,319 136,020 111,026 134,319 130,006 134,319 Adjusted R-squared 0.725 0.744 0.729 0.737 0.745 0.745 0.745
Loan type effects Y Y Y Y Y Y Y Loan purpose effects Y Y Y Y Y Y Y Year effects Y Y Y Y Y Y Y Firm effects Y Y Y Y Y Y Y Bank effects Y Y Y Y Y Y Y Clustered standard errors Country Country Country Country Country Country Country
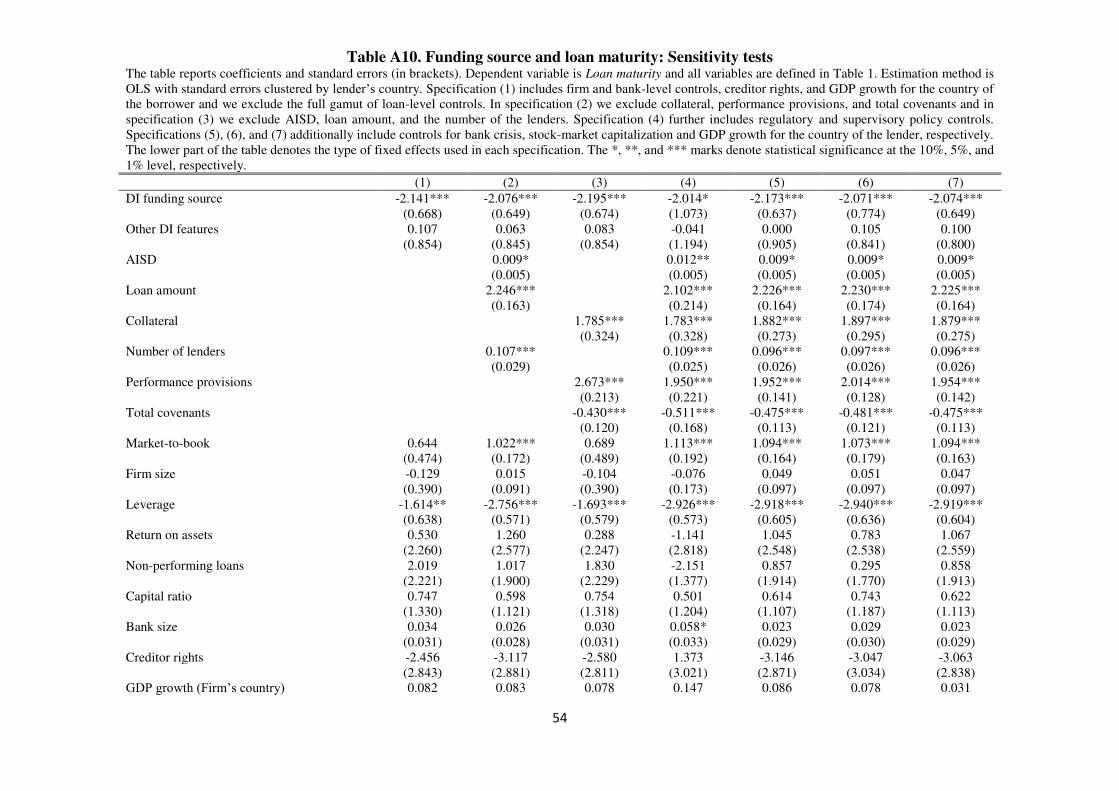
54
Table A10. Funding source and loan maturity: Sensitivity tests The table reports coefficients and standard errors (in brackets). Dependent variable is Loan maturity and all variables are defined in Table 1. Estimation method is OLS with standard errors clustered by lender’s country. Specification (1) includes firm and bank-level controls, creditor rights, and GDP growth for the country of the borrower and we exclude the full gamut of loan-level controls. In specification (2) we exclude collateral, performance provisions, and total covenants and in specification (3) we exclude AISD, loan amount, and the number of the lenders. Specification (4) further includes regulatory and supervisory policy controls. Specifications (5), (6), and (7) additionally include controls for bank crisis, stock-market capitalization and GDP growth for the country of the lender, respectively. The lower part of the table denotes the type of fixed effects used in each specification. The *, **, and *** marks denote statistical significance at the 10%, 5%, and 1% level, respectively. (1) (2) (3) (4) (5) (6) (7)
DI funding source -2.141*** -2.076*** -2.195*** -2.014* -2.173*** -2.071*** -2.074***
(0.668) (0.649) (0.674) (1.073) (0.637) (0.774) (0.649) Other DI features 0.107 0.063 0.083 -0.041 0.000 0.105 0.100 (0.854) (0.845) (0.854) (1.194) (0.905) (0.841) (0.800) AISD 0.009* 0.012** 0.009* 0.009* 0.009*
(0.005) (0.005) (0.005) (0.005) (0.005) Loan amount 2.246*** 2.102*** 2.226*** 2.230*** 2.225***
(0.163) (0.214) (0.164) (0.174) (0.164) Collateral 1.785*** 1.783*** 1.882*** 1.897*** 1.879***
(0.324) (0.328) (0.273) (0.295) (0.275) Number of lenders 0.107*** 0.109*** 0.096*** 0.097*** 0.096*** (0.029) (0.025) (0.026) (0.026) (0.026) Performance provisions 2.673*** 1.950*** 1.952*** 2.014*** 1.954***
(0.213) (0.221) (0.141) (0.128) (0.142) Total covenants -0.430*** -0.511*** -0.475*** -0.481*** -0.475***
(0.120) (0.168) (0.113) (0.121) (0.113) Market-to-book 0.644 1.022*** 0.689 1.113*** 1.094*** 1.073*** 1.094***
(0.474) (0.172) (0.489) (0.192) (0.164) (0.179) (0.163) Firm size -0.129 0.015 -0.104 -0.076 0.049 0.051 0.047
(0.390) (0.091) (0.390) (0.173) (0.097) (0.097) (0.097) Leverage -1.614** -2.756*** -1.693*** -2.926*** -2.918*** -2.940*** -2.919***
(0.638) (0.571) (0.579) (0.573) (0.605) (0.636) (0.604) Return on assets 0.530 1.260 0.288 -1.141 1.045 0.783 1.067
(2.260) (2.577) (2.247) (2.818) (2.548) (2.538) (2.559) Non-performing loans 2.019 1.017 1.830 -2.151 0.857 0.295 0.858
(2.221) (1.900) (2.229) (1.377) (1.914) (1.770) (1.913) Capital ratio 0.747 0.598 0.754 0.501 0.614 0.743 0.622 (1.330) (1.121) (1.318) (1.204) (1.107) (1.187) (1.113) Bank size 0.034 0.026 0.030 0.058* 0.023 0.029 0.023 (0.031) (0.028) (0.031) (0.033) (0.029) (0.030) (0.029) Creditor rights -2.456 -3.117 -2.580 1.373 -3.146 -3.047 -3.063 (2.843) (2.881) (2.811) (3.021) (2.871) (3.034) (2.838) GDP growth (Firm’s country) 0.082 0.083 0.078 0.147 0.086 0.078 0.031

55
(0.093) (0.093) (0.094) (0.103) (0.092) (0.101) (0.086) Capital regulations 0.150 (0.153) Private monitoring -0.061 (0.293) Official supervisory power 0.079 (0.070) Bank crisis 0.411 (0.711) Stock market capitalization (Bank’s country) 0.006 (0.005) GDP growth (Bank’s country) 0.247** (0.097)
Observations 134,529 134,319 134,529 111,026 134,319 130,006 134,319 Adjusted R-squared 0.699 0.704 0.700 0.734 0.704 0.705 0.705
Loan type effects Y Y Y Y Y Y Y Loan purpose effects Y Y Y Y Y Y Y Year effects Y Y Y Y Y Y Y Firm effects Y Y Y Y Y Y Y Bank effects Y Y Y Y Y Y Y Clustered standard errors Country Country Country Country Country Country Country
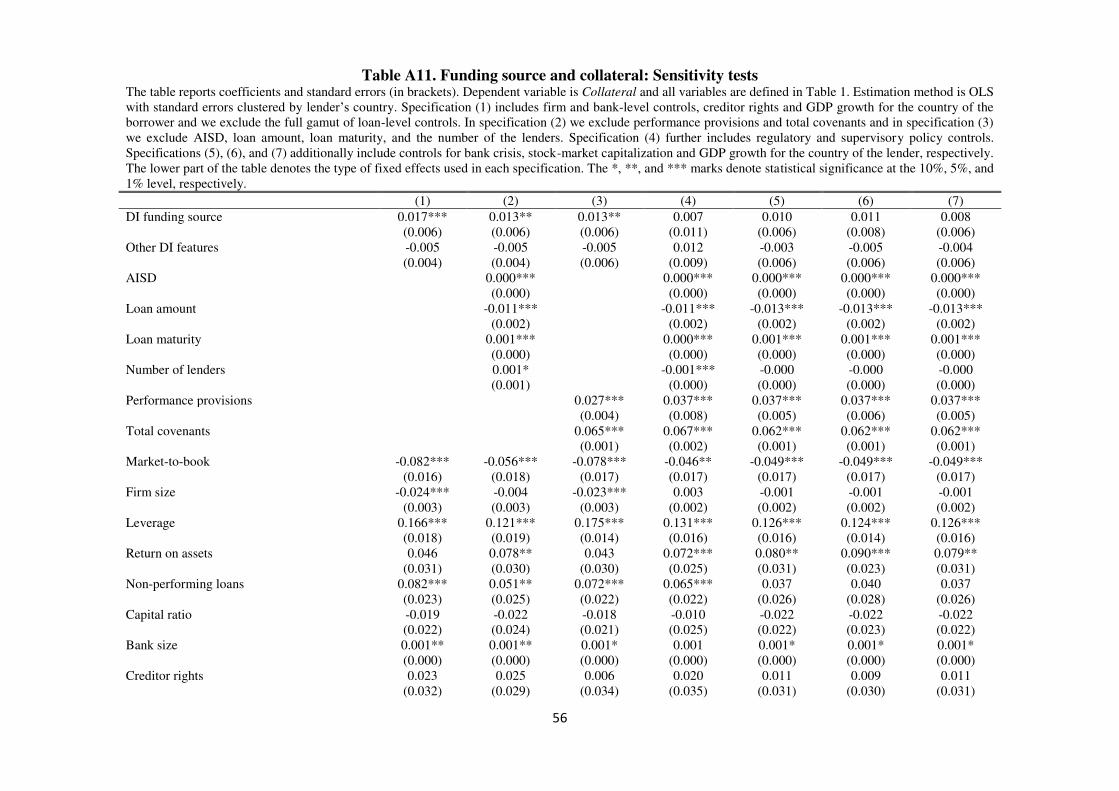
56
Table A11. Funding source and collateral: Sensitivity tests
The table reports coefficients and standard errors (in brackets). Dependent variable is Collateral and all variables are defined in Table 1. Estimation method is OLS with standard errors clustered by lender’s country. Specification (1) includes firm and bank-level controls, creditor rights and GDP growth for the country of the borrower and we exclude the full gamut of loan-level controls. In specification (2) we exclude performance provisions and total covenants and in specification (3) we exclude AISD, loan amount, loan maturity, and the number of the lenders. Specification (4) further includes regulatory and supervisory policy controls. Specifications (5), (6), and (7) additionally include controls for bank crisis, stock-market capitalization and GDP growth for the country of the lender, respectively. The lower part of the table denotes the type of fixed effects used in each specification. The *, **, and *** marks denote statistical significance at the 10%, 5%, and 1% level, respectively. (1) (2) (3) (4) (5) (6) (7)
DI funding source 0.017*** 0.013** 0.013** 0.007 0.010 0.011 0.008
(0.006) (0.006) (0.006) (0.011) (0.006) (0.008) (0.006) Other DI features -0.005 -0.005 -0.005 0.012 -0.003 -0.005 -0.004 (0.004) (0.004) (0.006) (0.009) (0.006) (0.006) (0.006) AISD 0.000*** 0.000*** 0.000*** 0.000*** 0.000***
(0.000) (0.000) (0.000) (0.000) (0.000) Loan amount -0.011*** -0.011*** -0.013*** -0.013*** -0.013***
(0.002) (0.002) (0.002) (0.002) (0.002) Loan maturity 0.001*** 0.000*** 0.001*** 0.001*** 0.001***
(0.000) (0.000) (0.000) (0.000) (0.000) Number of lenders 0.001* -0.001*** -0.000 -0.000 -0.000 (0.001) (0.000) (0.000) (0.000) (0.000) Performance provisions 0.027*** 0.037*** 0.037*** 0.037*** 0.037***
(0.004) (0.008) (0.005) (0.006) (0.005) Total covenants 0.065*** 0.067*** 0.062*** 0.062*** 0.062***
(0.001) (0.002) (0.001) (0.001) (0.001) Market-to-book -0.082*** -0.056*** -0.078*** -0.046** -0.049*** -0.049*** -0.049***
(0.016) (0.018) (0.017) (0.017) (0.017) (0.017) (0.017) Firm size -0.024*** -0.004 -0.023*** 0.003 -0.001 -0.001 -0.001
(0.003) (0.003) (0.003) (0.002) (0.002) (0.002) (0.002) Leverage 0.166*** 0.121*** 0.175*** 0.131*** 0.126*** 0.124*** 0.126***
(0.018) (0.019) (0.014) (0.016) (0.016) (0.014) (0.016) Return on assets 0.046 0.078** 0.043 0.072*** 0.080** 0.090*** 0.079**
(0.031) (0.030) (0.030) (0.025) (0.031) (0.023) (0.031) Non-performing loans 0.082*** 0.051** 0.072*** 0.065*** 0.037 0.040 0.037
(0.023) (0.025) (0.022) (0.022) (0.026) (0.028) (0.026) Capital ratio -0.019 -0.022 -0.018 -0.010 -0.022 -0.022 -0.022 (0.022) (0.024) (0.021) (0.025) (0.022) (0.023) (0.022) Bank size 0.001** 0.001** 0.001* 0.001 0.001* 0.001* 0.001* (0.000) (0.000) (0.000) (0.000) (0.000) (0.000) (0.000) Creditor rights 0.023 0.025 0.006 0.020 0.011 0.009 0.011 (0.032) (0.029) (0.034) (0.035) (0.031) (0.030) (0.031)
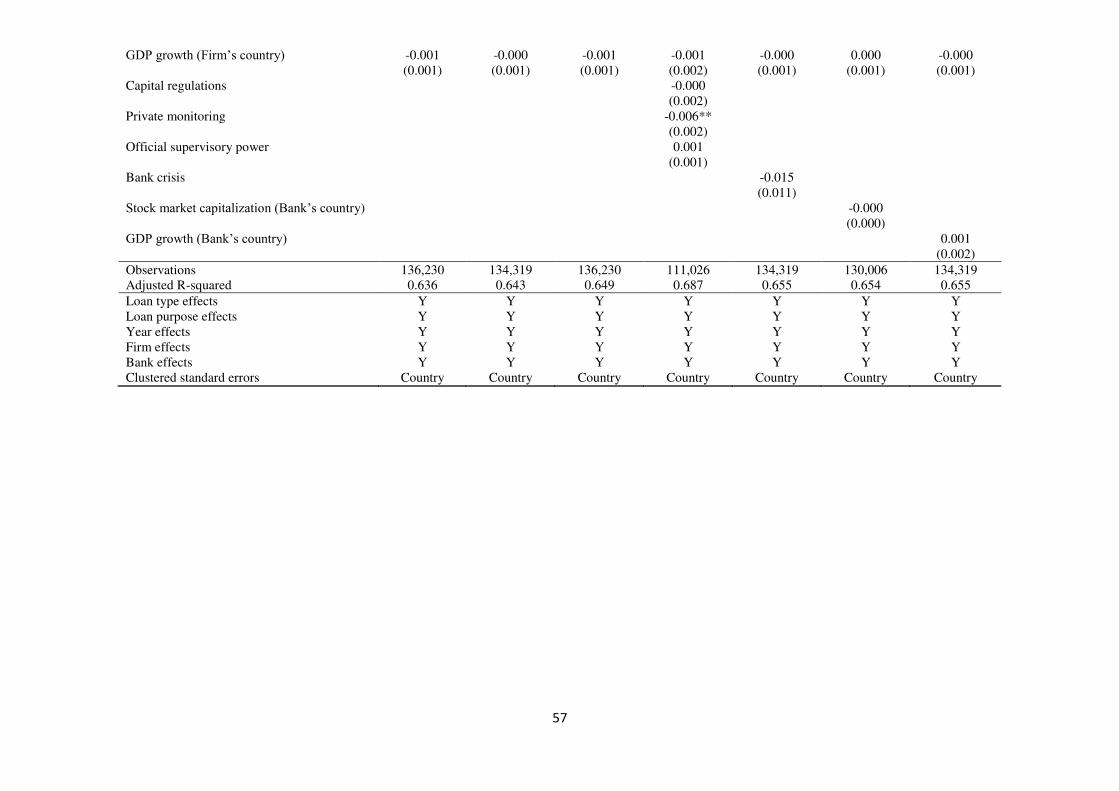
57
GDP growth (Firm’s country) -0.001 -0.000 -0.001 -0.001 -0.000 0.000 -0.000 (0.001) (0.001) (0.001) (0.002) (0.001) (0.001) (0.001) Capital regulations -0.000 (0.002) Private monitoring -0.006** (0.002) Official supervisory power 0.001 (0.001) Bank crisis -0.015 (0.011) Stock market capitalization (Bank’s country) -0.000 (0.000) GDP growth (Bank’s country) 0.001 (0.002)
Observations 136,230 134,319 136,230 111,026 134,319 130,006 134,319 Adjusted R-squared 0.636 0.643 0.649 0.687 0.655 0.654 0.655
Loan type effects Y Y Y Y Y Y Y Loan purpose effects Y Y Y Y Y Y Y Year effects Y Y Y Y Y Y Y Firm effects Y Y Y Y Y Y Y Bank effects Y Y Y Y Y Y Y Clustered standard errors Country Country Country Country Country Country Country
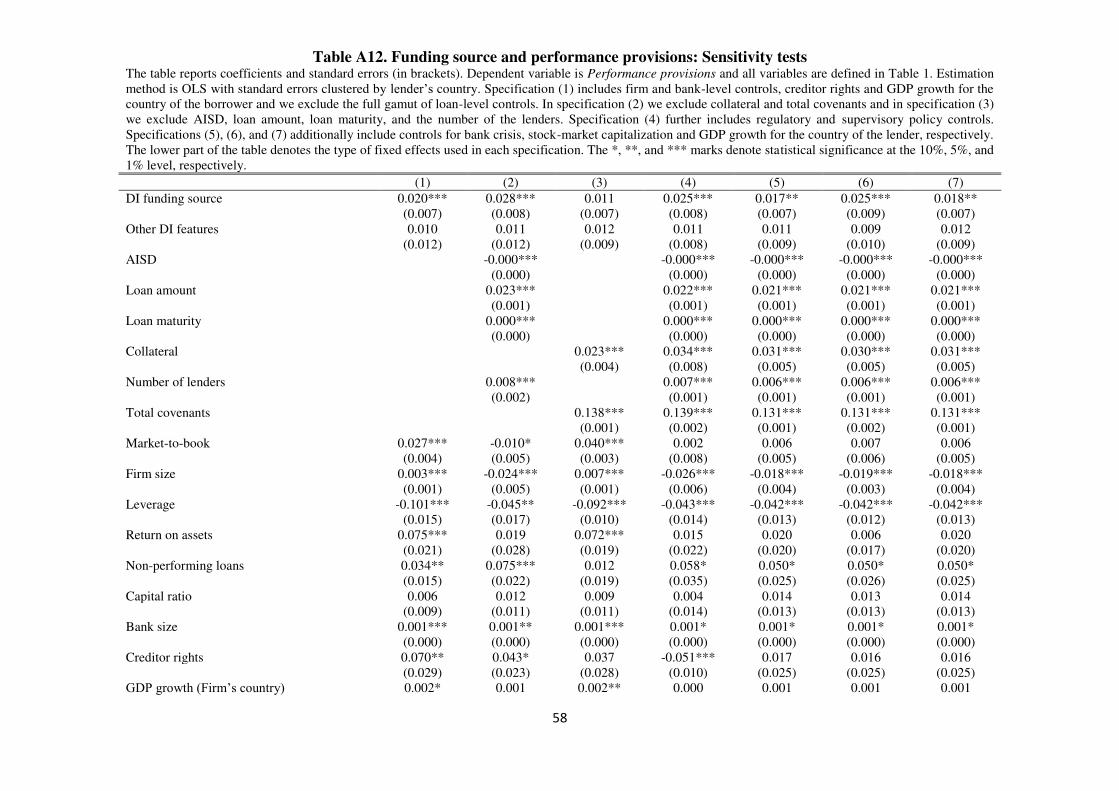
58
Table A12. Funding source and performance provisions: Sensitivity tests The table reports coefficients and standard errors (in brackets). Dependent variable is Performance provisions and all variables are defined in Table 1. Estimation method is OLS with standard errors clustered by lender’s country. Specification (1) includes firm and bank-level controls, creditor rights and GDP growth for the country of the borrower and we exclude the full gamut of loan-level controls. In specification (2) we exclude collateral and total covenants and in specification (3) we exclude AISD, loan amount, loan maturity, and the number of the lenders. Specification (4) further includes regulatory and supervisory policy controls. Specifications (5), (6), and (7) additionally include controls for bank crisis, stock-market capitalization and GDP growth for the country of the lender, respectively. The lower part of the table denotes the type of fixed effects used in each specification. The *, **, and *** marks denote statistical significance at the 10%, 5%, and 1% level, respectively. (1) (2) (3) (4) (5) (6) (7)
DI funding source 0.020*** 0.028*** 0.011 0.025*** 0.017** 0.025*** 0.018**
(0.007) (0.008) (0.007) (0.008) (0.007) (0.009) (0.007) Other DI features 0.010 0.011 0.012 0.011 0.011 0.009 0.012 (0.012) (0.012) (0.009) (0.008) (0.009) (0.010) (0.009) AISD -0.000*** -0.000*** -0.000*** -0.000*** -0.000***
(0.000) (0.000) (0.000) (0.000) (0.000) Loan amount 0.023*** 0.022*** 0.021*** 0.021*** 0.021***
(0.001) (0.001) (0.001) (0.001) (0.001) Loan maturity 0.000*** 0.000*** 0.000*** 0.000*** 0.000***
(0.000) (0.000) (0.000) (0.000) (0.000) Collateral 0.023*** 0.034*** 0.031*** 0.030*** 0.031*** (0.004) (0.008) (0.005) (0.005) (0.005) Number of lenders 0.008*** 0.007*** 0.006*** 0.006*** 0.006***
(0.002) (0.001) (0.001) (0.001) (0.001) Total covenants 0.138*** 0.139*** 0.131*** 0.131*** 0.131***
(0.001) (0.002) (0.001) (0.002) (0.001) Market-to-book 0.027*** -0.010* 0.040*** 0.002 0.006 0.007 0.006
(0.004) (0.005) (0.003) (0.008) (0.005) (0.006) (0.005) Firm size 0.003*** -0.024*** 0.007*** -0.026*** -0.018*** -0.019*** -0.018***
(0.001) (0.005) (0.001) (0.006) (0.004) (0.003) (0.004) Leverage -0.101*** -0.045** -0.092*** -0.043*** -0.042*** -0.042*** -0.042***
(0.015) (0.017) (0.010) (0.014) (0.013) (0.012) (0.013) Return on assets 0.075*** 0.019 0.072*** 0.015 0.020 0.006 0.020
(0.021) (0.028) (0.019) (0.022) (0.020) (0.017) (0.020) Non-performing loans 0.034** 0.075*** 0.012 0.058* 0.050* 0.050* 0.050*
(0.015) (0.022) (0.019) (0.035) (0.025) (0.026) (0.025) Capital ratio 0.006 0.012 0.009 0.004 0.014 0.013 0.014 (0.009) (0.011) (0.011) (0.014) (0.013) (0.013) (0.013) Bank size 0.001*** 0.001** 0.001*** 0.001* 0.001* 0.001* 0.001* (0.000) (0.000) (0.000) (0.000) (0.000) (0.000) (0.000) Creditor rights 0.070** 0.043* 0.037 -0.051*** 0.017 0.016 0.016 (0.029) (0.023) (0.028) (0.010) (0.025) (0.025) (0.025) GDP growth (Firm’s country) 0.002* 0.001 0.002** 0.000 0.001 0.001 0.001

59
(0.001) (0.001) (0.001) (0.001) (0.001) (0.001) (0.001) Capital regulations 0.001 (0.003) Private monitoring -0.004 (0.002) Official supervisory power -0.003* (0.001) Bank crisis 0.009* (0.005) Stock market capitalization (Bank’s country) -0.000 (0.000) GDP growth (Bank’s country) -0.000 (0.001)
Observations 136,230 134,319 136,230 111,026 134,319 130,006 134,319 Adjusted R-squared 0.436 0.464 0.520 0.567 0.538 0.542 0.538
Loan type effects Y Y Y Y Y Y Y Loan purpose effects Y Y Y Y Y Y Y Year effects Y Y Y Y Y Y Y Firm effects Y Y Y Y Y Y Y Bank effects Y Y Y Y Y Y Y Clustered standard errors Country Country Country Country Country Country Country
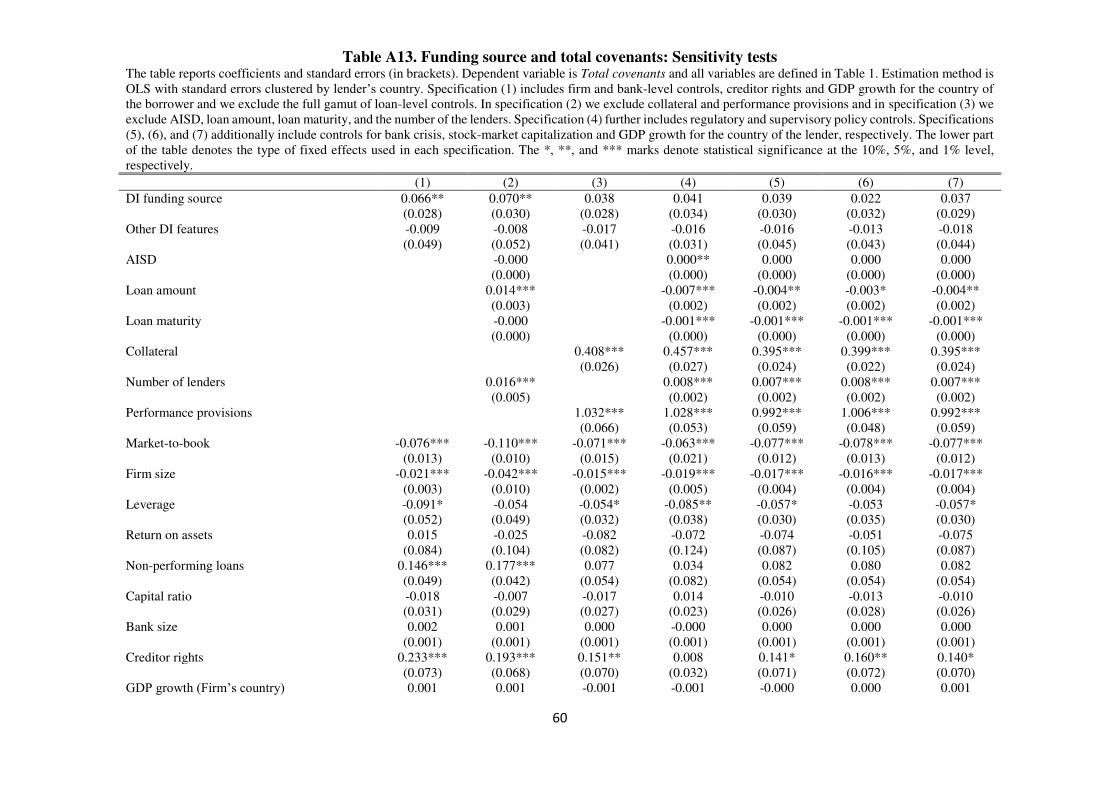
60
Table A13. Funding source and total covenants: Sensitivity tests The table reports coefficients and standard errors (in brackets). Dependent variable is Total covenants and all variables are defined in Table 1. Estimation method is OLS with standard errors clustered by lender’s country. Specification (1) includes firm and bank-level controls, creditor rights and GDP growth for the country of the borrower and we exclude the full gamut of loan-level controls. In specification (2) we exclude collateral and performance provisions and in specification (3) we exclude AISD, loan amount, loan maturity, and the number of the lenders. Specification (4) further includes regulatory and supervisory policy controls. Specifications (5), (6), and (7) additionally include controls for bank crisis, stock-market capitalization and GDP growth for the country of the lender, respectively. The lower part of the table denotes the type of fixed effects used in each specification. The *, **, and *** marks denote statistical significance at the 10%, 5%, and 1% level, respectively. (1) (2) (3) (4) (5) (6) (7)
DI funding source 0.066** 0.070** 0.038 0.041 0.039 0.022 0.037
(0.028) (0.030) (0.028) (0.034) (0.030) (0.032) (0.029) Other DI features -0.009 -0.008 -0.017 -0.016 -0.016 -0.013 -0.018 (0.049) (0.052) (0.041) (0.031) (0.045) (0.043) (0.044) AISD -0.000 0.000** 0.000 0.000 0.000
(0.000) (0.000) (0.000) (0.000) (0.000) Loan amount 0.014*** -0.007*** -0.004** -0.003* -0.004**
(0.003) (0.002) (0.002) (0.002) (0.002) Loan maturity -0.000 -0.001*** -0.001*** -0.001*** -0.001***
(0.000) (0.000) (0.000) (0.000) (0.000) Collateral 0.408*** 0.457*** 0.395*** 0.399*** 0.395*** (0.026) (0.027) (0.024) (0.022) (0.024) Number of lenders 0.016*** 0.008*** 0.007*** 0.008*** 0.007***
(0.005) (0.002) (0.002) (0.002) (0.002) Performance provisions 1.032*** 1.028*** 0.992*** 1.006*** 0.992***
(0.066) (0.053) (0.059) (0.048) (0.059) Market-to-book -0.076*** -0.110*** -0.071*** -0.063*** -0.077*** -0.078*** -0.077***
(0.013) (0.010) (0.015) (0.021) (0.012) (0.013) (0.012) Firm size -0.021*** -0.042*** -0.015*** -0.019*** -0.017*** -0.016*** -0.017***
(0.003) (0.010) (0.002) (0.005) (0.004) (0.004) (0.004) Leverage -0.091* -0.054 -0.054* -0.085** -0.057* -0.053 -0.057*
(0.052) (0.049) (0.032) (0.038) (0.030) (0.035) (0.030) Return on assets 0.015 -0.025 -0.082 -0.072 -0.074 -0.051 -0.075
(0.084) (0.104) (0.082) (0.124) (0.087) (0.105) (0.087) Non-performing loans 0.146*** 0.177*** 0.077 0.034 0.082 0.080 0.082
(0.049) (0.042) (0.054) (0.082) (0.054) (0.054) (0.054) Capital ratio -0.018 -0.007 -0.017 0.014 -0.010 -0.013 -0.010 (0.031) (0.029) (0.027) (0.023) (0.026) (0.028) (0.026) Bank size 0.002 0.001 0.000 -0.000 0.000 0.000 0.000 (0.001) (0.001) (0.001) (0.001) (0.001) (0.001) (0.001) Creditor rights 0.233*** 0.193*** 0.151** 0.008 0.141* 0.160** 0.140* (0.073) (0.068) (0.070) (0.032) (0.071) (0.072) (0.070) GDP growth (Firm’s country) 0.001 0.001 -0.001 -0.001 -0.000 0.000 0.001

61
(0.003) (0.003) (0.003) (0.003) (0.003) (0.003) (0.002) Capital regulations -0.015* (0.008) Private monitoring 0.015 (0.010) Official supervisory power 0.001 (0.005) Bank crisis -0.015 (0.024) Stock market capitalization (Bank’s country) 0.000 (0.000) GDP growth (Bank’s country) -0.004 (0.005)
Observations 136,230 134,319 136,230 111,026 134,319 130,006 134,319 Adjusted R-squared 0.602 0.617 0.670 0.712 0.678 0.679 0.678
Loan type effects Y Y Y Y Y Y Y Loan purpose effects Y Y Y Y Y Y Y Year effects Y Y Y Y Y Y Y Firm effects Y Y Y Y Y Y Y Bank effects Y Y Y Y Y Y Y Clustered standard errors Country Country Country Country Country Country Country