Embed Size (px)
Citation preview
Schools block funding formulae 2018-19
Analysis of local authorities’ schools
block funding formulae
July 2018
2
Contents
Introduction ......................................................................................................................... 3
Commentary ....................................................................................................................... 5
Basic per-pupil entitlement ................................................................................................. 5
Deprivation ......................................................................................................................... 7
Looked-after children ........................................................................................................ 10
Prior attainment ................................................................................................................ 11
English as an additional language (EAL) .......................................................................... 13
Mobility ............................................................................................................................. 14
Total funding through the pupil-led factors........................................................................ 16
Lump sum ......................................................................................................................... 17
Sparsity ............................................................................................................................. 19
Guaranteed minimum per pupil level of funding ............................................................... 22
Other formula factors ........................................................................................................ 24
Primary:secondary funding ratios ..................................................................................... 24
Minimum funding guarantee ............................................................................................. 25
Notional SEN .................................................................................................................... 26
Growth fund ...................................................................................................................... 27
Falling rolls fund ............................................................................................................... 28
Information about the data file .......................................................................................... 29
3
Introduction
In January 2018, local authorities in England submitted to the Education and Skills
Funding Agency (ESFA) their local formulae for allocating their dedicated schools grant
(DSG) schools block funding for 2018-19 to schools in their area. This document
summarises the information on these local formulae.
2018-19 saw the introduction of the national funding formula (NFF). This reform means
that for the first time, school funding is being distributed according to a formula based on
the individual needs and characteristics of every school in the country. In order to
provide stability for schools during the transition to the NFF, we have previously
confirmed that local authorities continue to be responsible for distributing money between
schools in their area in 2018-19 and 2019-20. Detailed information about the NFF can be
found in the national funding formula for schools and high needs: executive summary,
which was published in September 2017.
For 2018-19, each local authorities’ schools block DSG allocation was calculated based
on the notional NFF allocations for schools in their area. Local authorities then set their
own funding formula in order to distribute their schools block allocation. This document
provides an overview of the 2018-19 formula factor values chosen by local authorities as
at 23 March 2018. For 2018-19, schools are funded using a maximum of 14 clearly
defined factors.
The data in this document shows that many authorities have moved towards the values in
the NFF when setting their 2018-19 funding formula. When allowing for the area cost
adjustments (ACA)1 which are applied to each of the factors in the NFF it shows, 73 LAs
have moved every one of their factor values in their local formulae closer to the NFF, with
41 mirroring the NFF factor values almost exactly. Sixty two LAs have set their minimum
funding guarantee at 0.5% or above, meaning all schools in that area will gain in cash
terms compared to 2017-18, and 112 LAs have brought in a minimum per pupil funding
factor, mirroring its introduction in the NFF. In light of this significant progress in the first
year of the NFF, and to continue to support a smooth transition , local authorities will
continue to determine local formulae in 2020-21.
This document provides charts and brief commentary on the ranges of unit funding
amounts authorities have selected in 2018-19, and the proportions of schools block
funding distributed under each of the permitted factors. This document is accompanied
by a data file, more details about which can be found in the “Information about the data
1 The NFF applies an area cost adjustment (ACA) to each of the individual factors. The data shown in this document does not include the ACA adjustment. When comparing the factors used by each authority against the NFF the ACA adjustment, where applicable, should to be taken into account.
4
file” section at the end of this document. Small details of funding formulae may change
subsequently compared to the figures presented here as a result of late amendments.
Note that in the charts shown throughout the document the range of values along the x-
axis include the value at the lower end and exclude the maximum value. So for example
a band labelled 4% to 6% will include values of exactly 4% but will exclude values of
exactly 6%. The charts are colour coded throughout the document:
charts showing percentages are black/grey
all other charts are blue.
A similar summary about local authorities’ funding formulae for 2017-18 was published by
the DfE last year.
5
Commentary
This chapter looks at each of the principal formula factors in turn. It sets out the values
that local authorities have chosen for those factors in their local formulae for 2018-19,
how these have changed from previous years and, where relevant, how they compare to
the values in the NFF, as set out in the NFF technical note. It should be noted that these
comparison to the NFF are not precise, due to the effect of the Area Cost Adjustment
(ACA), which reflects variation in local costs. Individual factor values in the NFF do not
include the impact of the ACA, which is applied (at a rate of 1 - 1.18) as a separate
element within the overall NFF calculation. By contrast, the values of factors in individual
local authorities’ local formulae implicitly include the effect of the ACA. It also sets out the
proportion of funding allocated through each factor2.
Basic per-pupil entitlement
This is a mandatory factor which every local authority must use in their 2018-19 formula.
Local authorities are permitted to choose different age-weighted pupil unit (AWPU) rates
for primary pupils, for key stage 3 pupils and for key stage 4 pupils; but they must specify
a primary AWPU of at least £2,000, and key stage 3 and key stage 4 AWPU values of at
least £3,000.
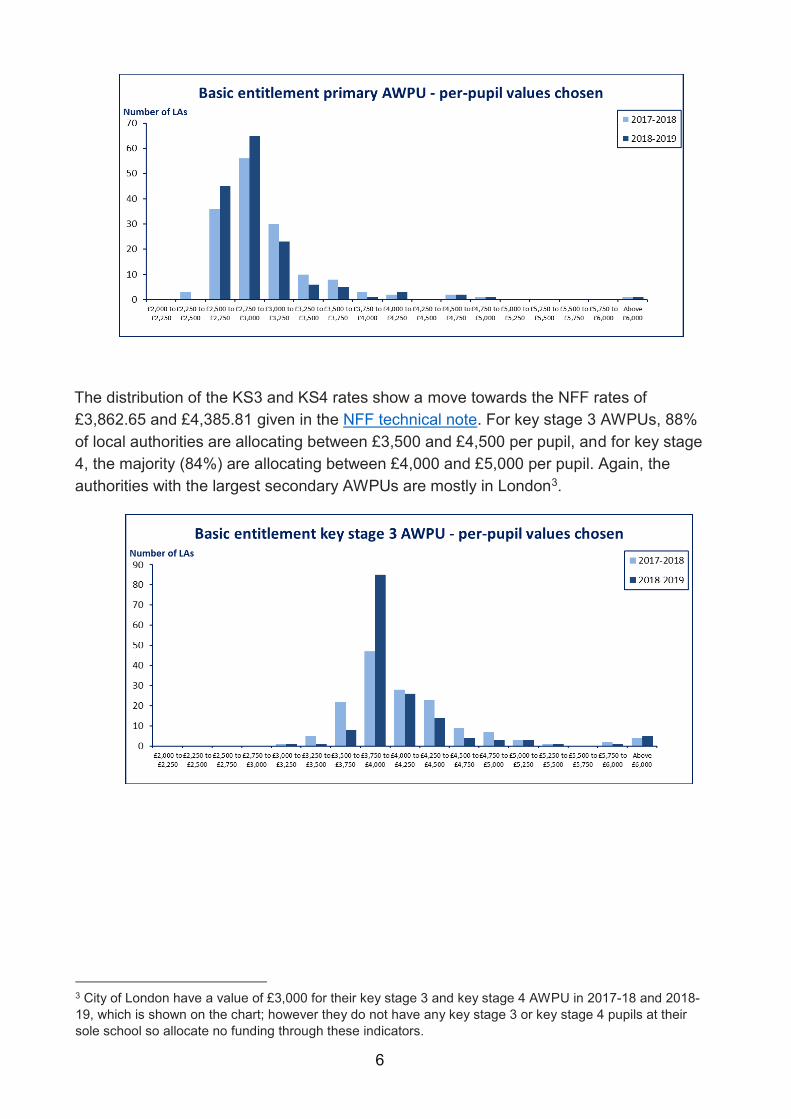
The majority (88%) of primary AWPUs selected by local authorities are in the range of
£2,500 to £3,250, although there are a few significant outliers of over £4,000. Seventeen
of the 20 local authorities with the highest primary AWPUs are in London. The AWPUs
are very similar to last year although the distribution of the primary rate show a move
towards the rate of £2,746.99 stated in the NFF technical note.
2 In the charts showing the ranges of unit funding amounts local authorities have used for the formula
factors, only those authorities which have chosen to use that factor in their formula in each year are shown.
However, in the charts showing the proportion of funding allocated using the factors, all local authorities are
displayed, with those not choosing to use the factor (where its use is not mandatory) shown as allocating
0%.
6
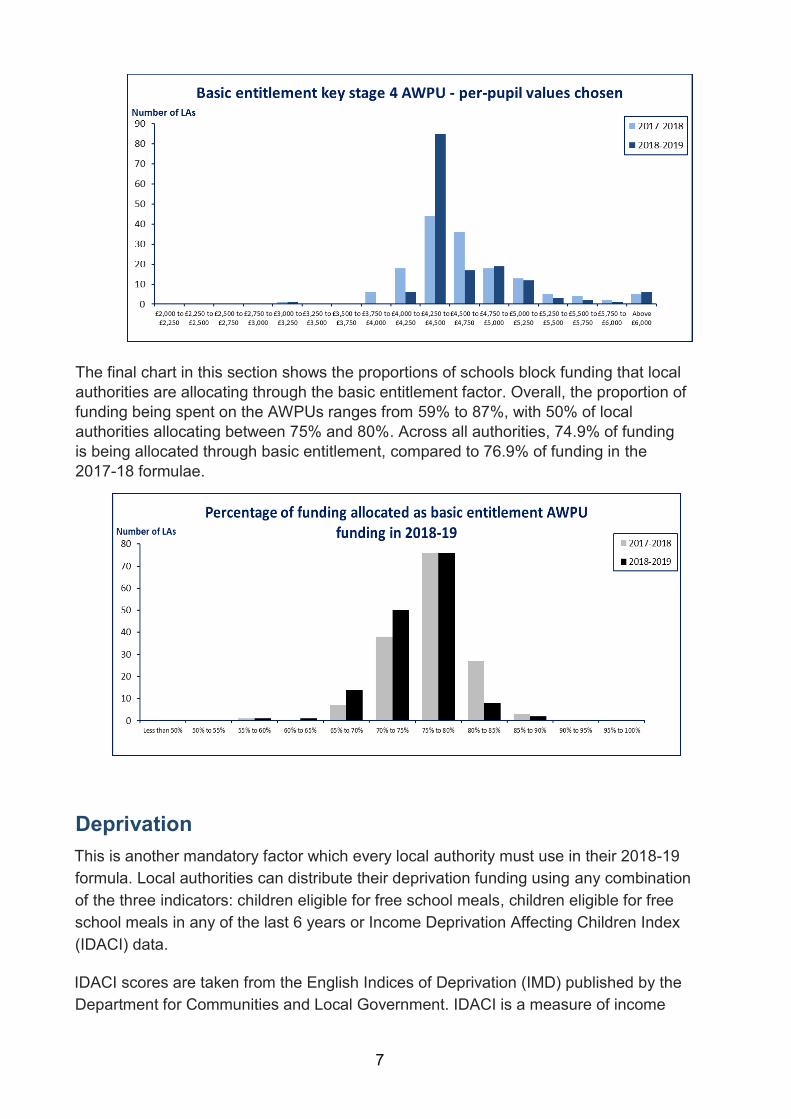
The distribution of the KS3 and KS4 rates show a move towards the NFF rates of
£3,862.65 and £4,385.81 given in the NFF technical note. For key stage 3 AWPUs, 88%
of local authorities are allocating between £3,500 and £4,500 per pupil, and for key stage
4, the majority (84%) are allocating between £4,000 and £5,000 per pupil. Again, the
authorities with the largest secondary AWPUs are mostly in London3.
3 City of London have a value of £3,000 for their key stage 3 and key stage 4 AWPU in 2017-18 and 2018-
19, which is shown on the chart; however they do not have any key stage 3 or key stage 4 pupils at their
sole school so allocate no funding through these indicators.
7
The final chart in this section shows the proportions of schools block funding that local
authorities are allocating through the basic entitlement factor. Overall, the proportion of
funding being spent on the AWPUs ranges from 59% to 87%, with 50% of local
authorities allocating between 75% and 80%. Across all authorities, 74.9% of funding
is being allocated through basic entitlement, compared to 76.9% of funding in the
2017-18 formulae.
Deprivation
This is another mandatory factor which every local authority must use in their 2018-19
formula. Local authorities can distribute their deprivation funding using any combination
of the three indicators: children eligible for free school meals, children eligible for free
school meals in any of the last 6 years or Income Deprivation Affecting Children Index
(IDACI) data.
IDACI scores are taken from the English Indices of Deprivation (IMD) published by the
Department for Communities and Local Government. IDACI is a measure of income
8
deprivation and identifies the proportion of children in out-of-work households or on low
incomes.
The IDACI scores are grouped into 7 bands as per the table below:
IDACI score IDACI band value
x < 0.20 G
0.20 <= x < 0.25 F
0.25 <= x < 0.30 E
0.30 <= x < 0.35 D
0.35 <= x < 0.40 C
0.40 <= x < 0.50 B
x >= 0.50 A
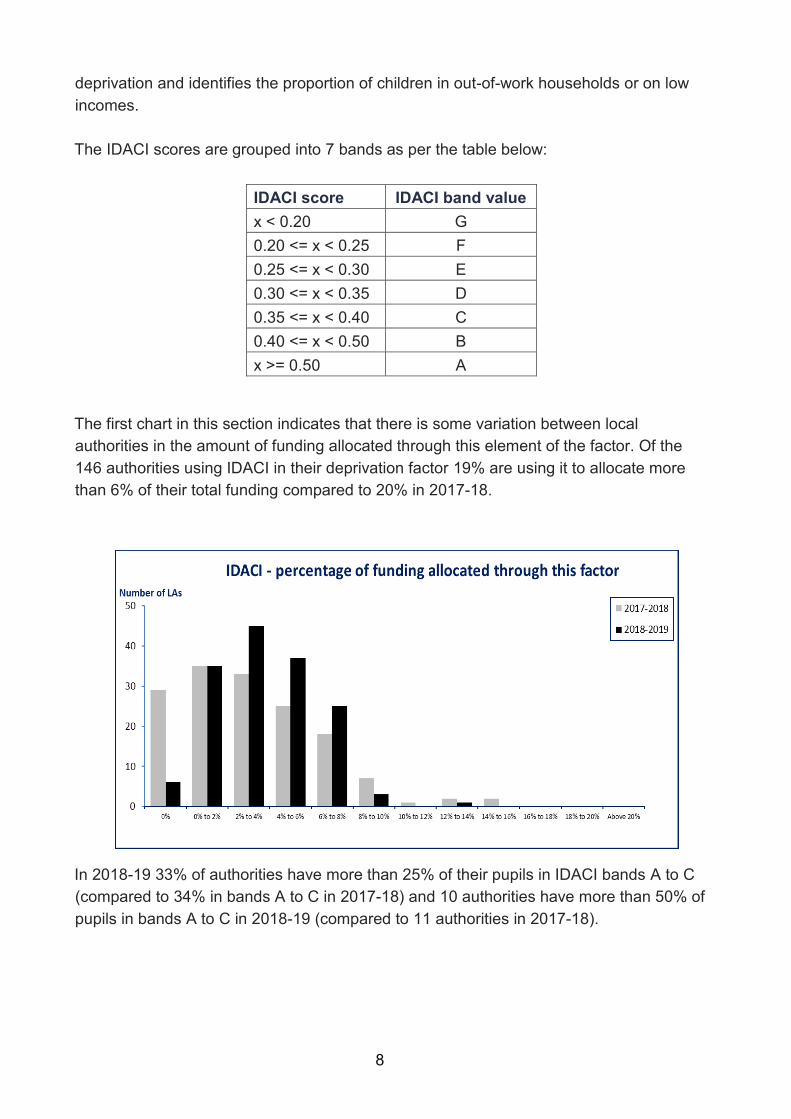
The first chart in this section indicates that there is some variation between local
authorities in the amount of funding allocated through this element of the factor. Of the
146 authorities using IDACI in their deprivation factor 19% are using it to allocate more
than 6% of their total funding compared to 20% in 2017-18.
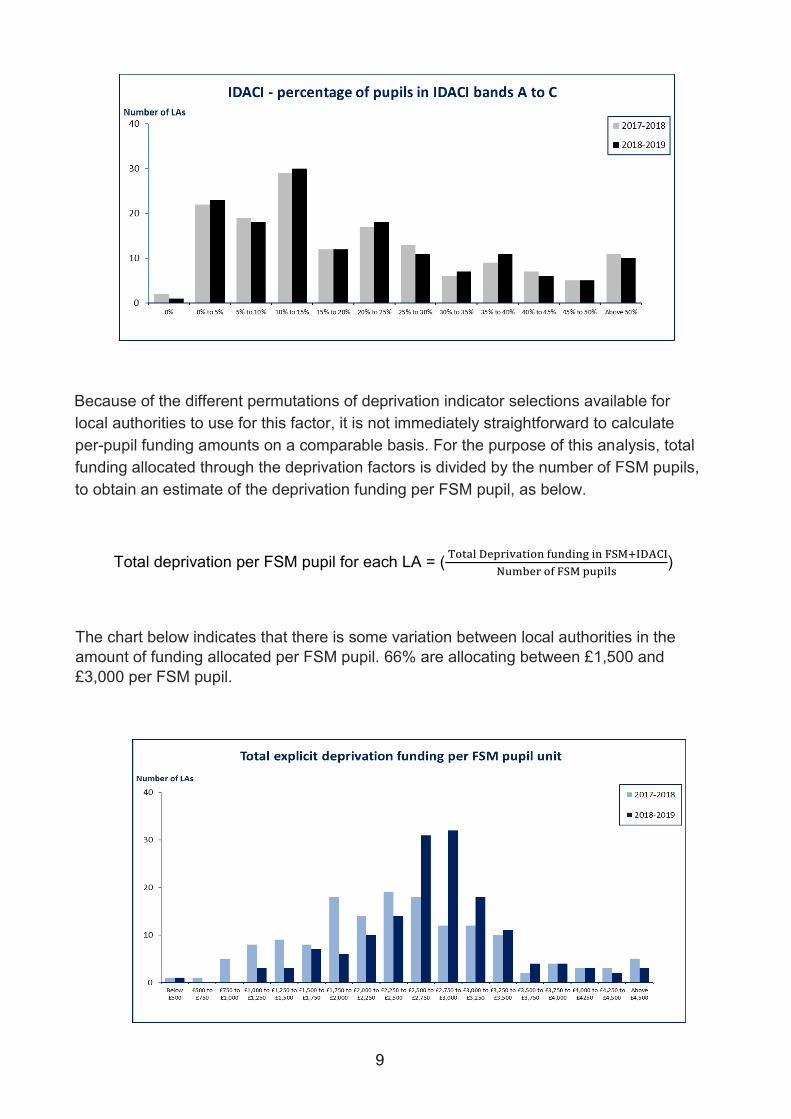
In 2018-19 33% of authorities have more than 25% of their pupils in IDACI bands A to C
(compared to 34% in bands A to C in 2017-18) and 10 authorities have more than 50% of
pupils in bands A to C in 2018-19 (compared to 11 authorities in 2017-18).
9
Because of the different permutations of deprivation indicator selections available for
local authorities to use for this factor, it is not immediately straightforward to calculate
per-pupil funding amounts on a comparable basis. For the purpose of this analysis, total
funding allocated through the deprivation factors is divided by the number of FSM pupils,
to obtain an estimate of the deprivation funding per FSM pupil, as below.
Total deprivation per FSM pupil for each LA = ( Total Deprivation funding in FSM+IDACI
Number of FSM pupils)
The chart below indicates that there is some variation between local authorities in the
amount of funding allocated per FSM pupil. 66% are allocating between £1,500 and
£3,000 per FSM pupil.
10
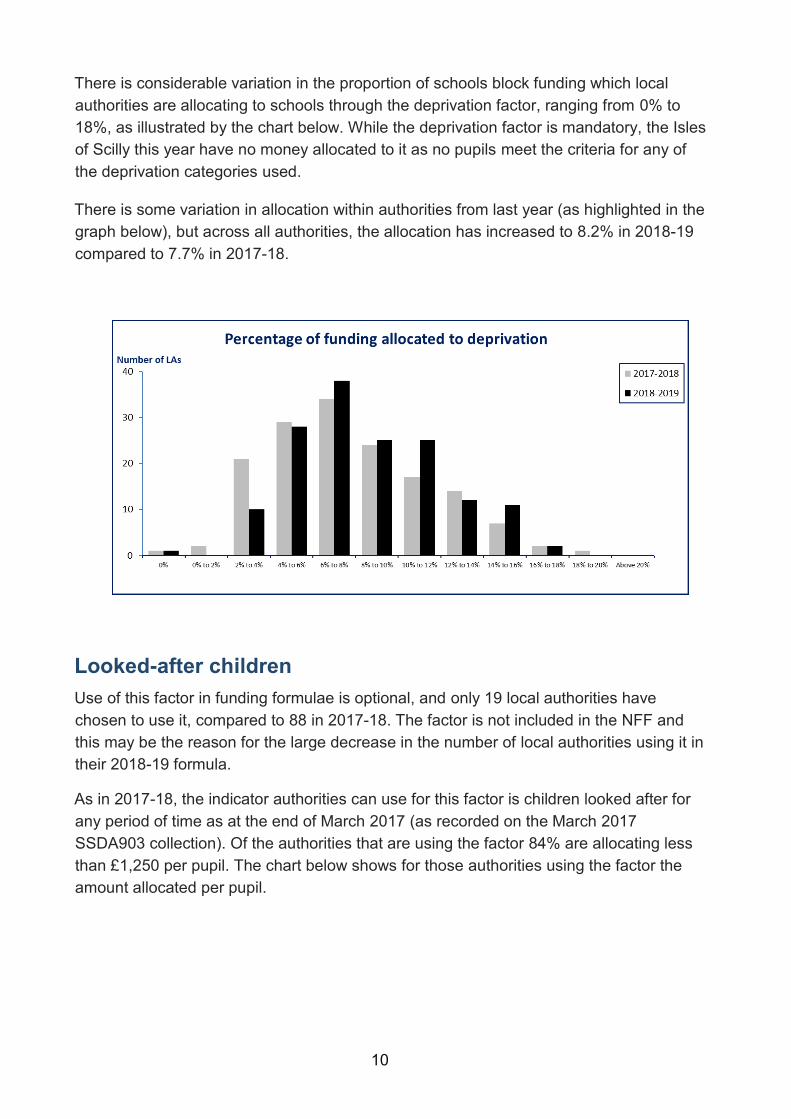
There is considerable variation in the proportion of schools block funding which local
authorities are allocating to schools through the deprivation factor, ranging from 0% to
18%, as illustrated by the chart below. While the deprivation factor is mandatory, the Isles
of Scilly this year have no money allocated to it as no pupils meet the criteria for any of
the deprivation categories used.
There is some variation in allocation within authorities from last year (as highlighted in the
graph below), but across all authorities, the allocation has increased to 8.2% in 2018-19
compared to 7.7% in 2017-18.
Looked-after children
Use of this factor in funding formulae is optional, and only 19 local authorities have
chosen to use it, compared to 88 in 2017-18. The factor is not included in the NFF and
this may be the reason for the large decrease in the number of local authorities using it in
their 2018-19 formula.
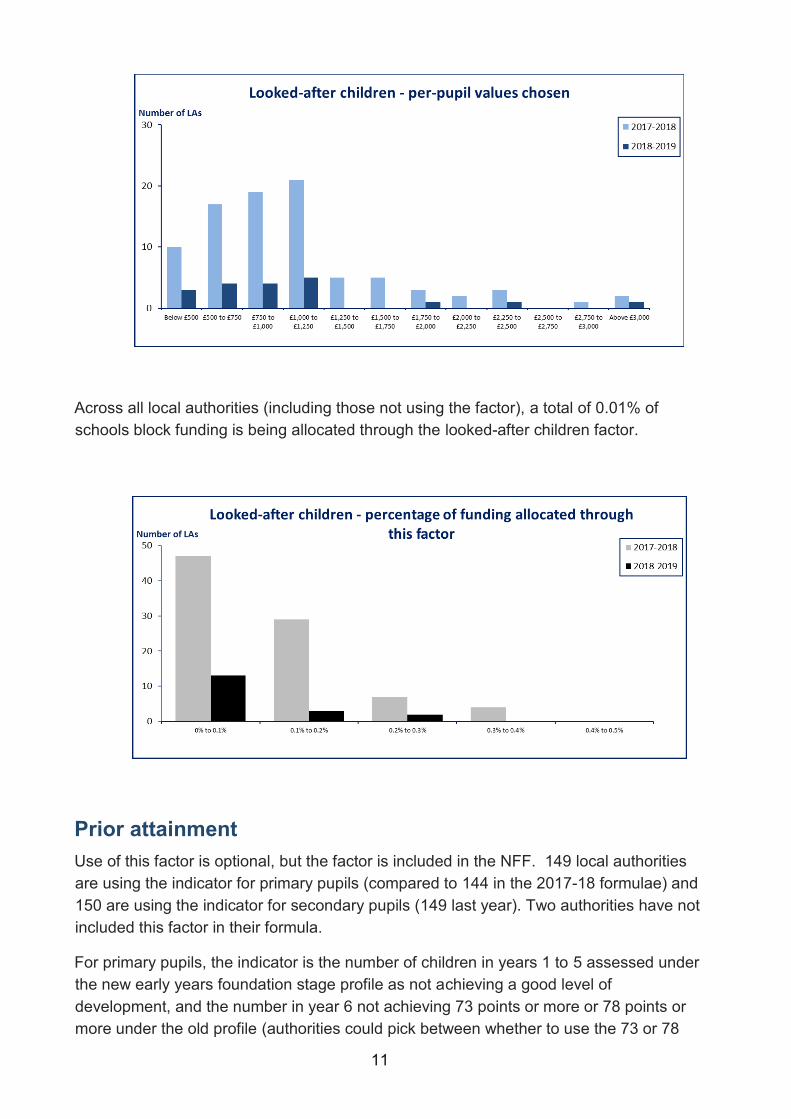
As in 2017-18, the indicator authorities can use for this factor is children looked after for
any period of time as at the end of March 2017 (as recorded on the March 2017
SSDA903 collection). Of the authorities that are using the factor 84% are allocating less
than £1,250 per pupil. The chart below shows for those authorities using the factor the
amount allocated per pupil.
11
Across all local authorities (including those not using the factor), a total of 0.01% of
schools block funding is being allocated through the looked-after children factor.
Prior attainment
Use of this factor is optional, but the factor is included in the NFF. 149 local authorities
are using the indicator for primary pupils (compared to 144 in the 2017-18 formulae) and
150 are using the indicator for secondary pupils (149 last year). Two authorities have not
included this factor in their formula.
For primary pupils, the indicator is the number of children in years 1 to 5 assessed under
the new early years foundation stage profile as not achieving a good level of
development, and the number in year 6 not achieving 73 points or more or 78 points or
more under the old profile (authorities could pick between whether to use the 73 or 78
12
point indicator). In their formula local authorities can scale back the proportion of years 1
to 5 pupils not meeting the ‘good development’ criterion.
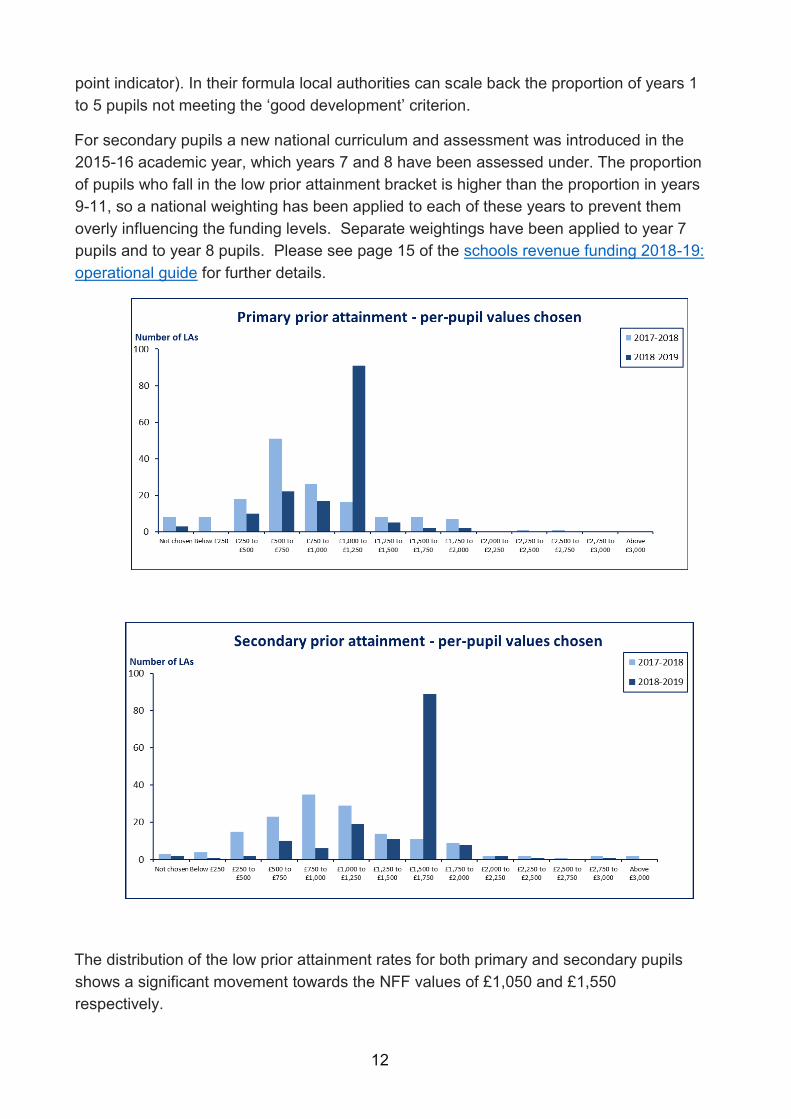
For secondary pupils a new national curriculum and assessment was introduced in the
2015-16 academic year, which years 7 and 8 have been assessed under. The proportion
of pupils who fall in the low prior attainment bracket is higher than the proportion in years
9-11, so a national weighting has been applied to each of these years to prevent them
overly influencing the funding levels. Separate weightings have been applied to year 7
pupils and to year 8 pupils. Please see page 15 of the schools revenue funding 2018-19:
operational guide for further details.
The distribution of the low prior attainment rates for both primary and secondary pupils
shows a significant movement towards the NFF values of £1,050 and £1,550
respectively.
13
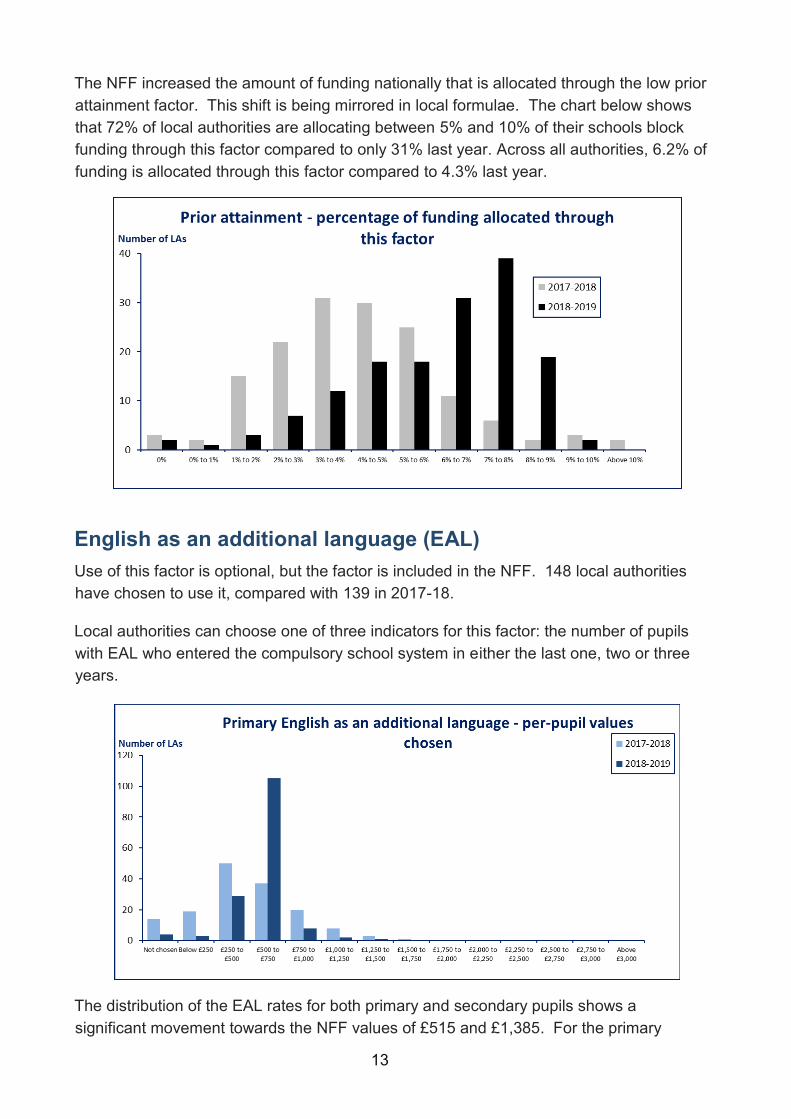
The NFF increased the amount of funding nationally that is allocated through the low prior
attainment factor. This shift is being mirrored in local formulae. The chart below shows
that 72% of local authorities are allocating between 5% and 10% of their schools block
funding through this factor compared to only 31% last year. Across all authorities, 6.2% of
funding is allocated through this factor compared to 4.3% last year.
English as an additional language (EAL)
Use of this factor is optional, but the factor is included in the NFF. 148 local authorities
have chosen to use it, compared with 139 in 2017-18.
Local authorities can choose one of three indicators for this factor: the number of pupils
with EAL who entered the compulsory school system in either the last one, two or three
years.
The distribution of the EAL rates for both primary and secondary pupils shows a
significant movement towards the NFF values of £515 and £1,385. For the primary
14
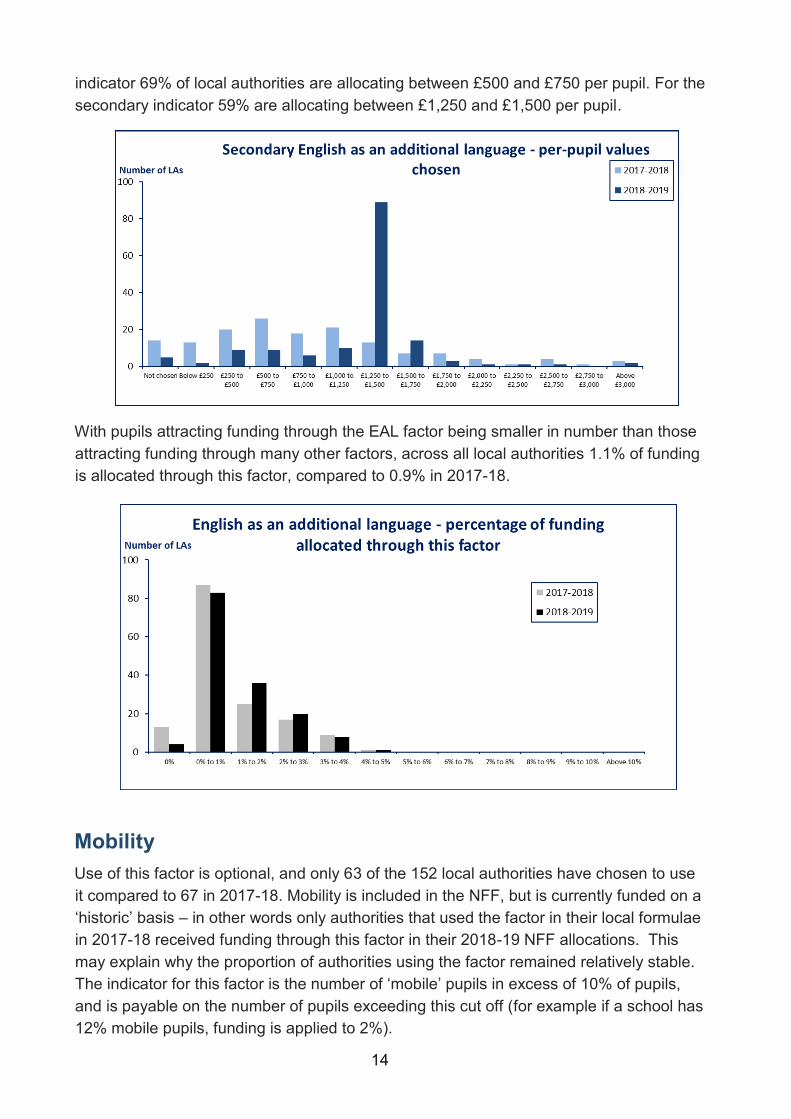
indicator 69% of local authorities are allocating between £500 and £750 per pupil. For the
secondary indicator 59% are allocating between £1,250 and £1,500 per pupil.
With pupils attracting funding through the EAL factor being smaller in number than those
attracting funding through many other factors, across all local authorities 1.1% of funding
is allocated through this factor, compared to 0.9% in 2017-18.
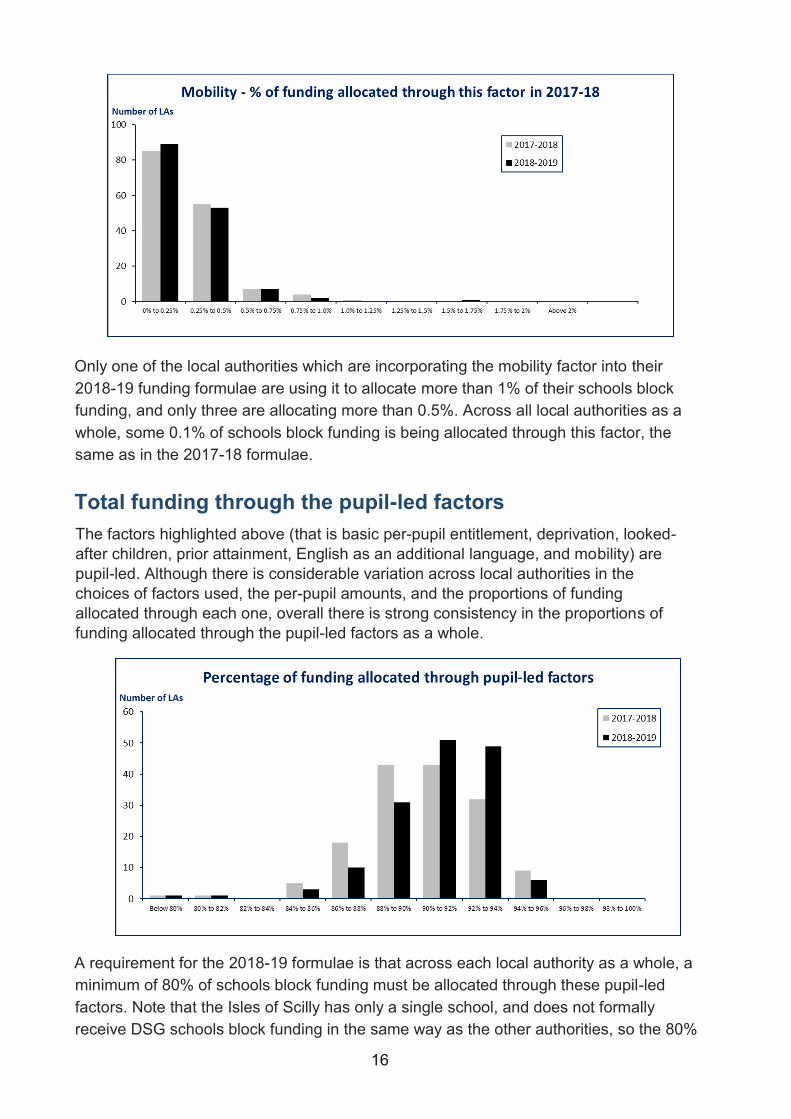
Mobility
Use of this factor is optional, and only 63 of the 152 local authorities have chosen to use
it compared to 67 in 2017-18. Mobility is included in the NFF, but is currently funded on a
‘historic’ basis – in other words only authorities that used the factor in their local formulae
in 2017-18 received funding through this factor in their 2018-19 NFF allocations. This
may explain why the proportion of authorities using the factor remained relatively stable.
The indicator for this factor is the number of ‘mobile’ pupils in excess of 10% of pupils,
and is payable on the number of pupils exceeding this cut off (for example if a school has
12% mobile pupils, funding is applied to 2%).
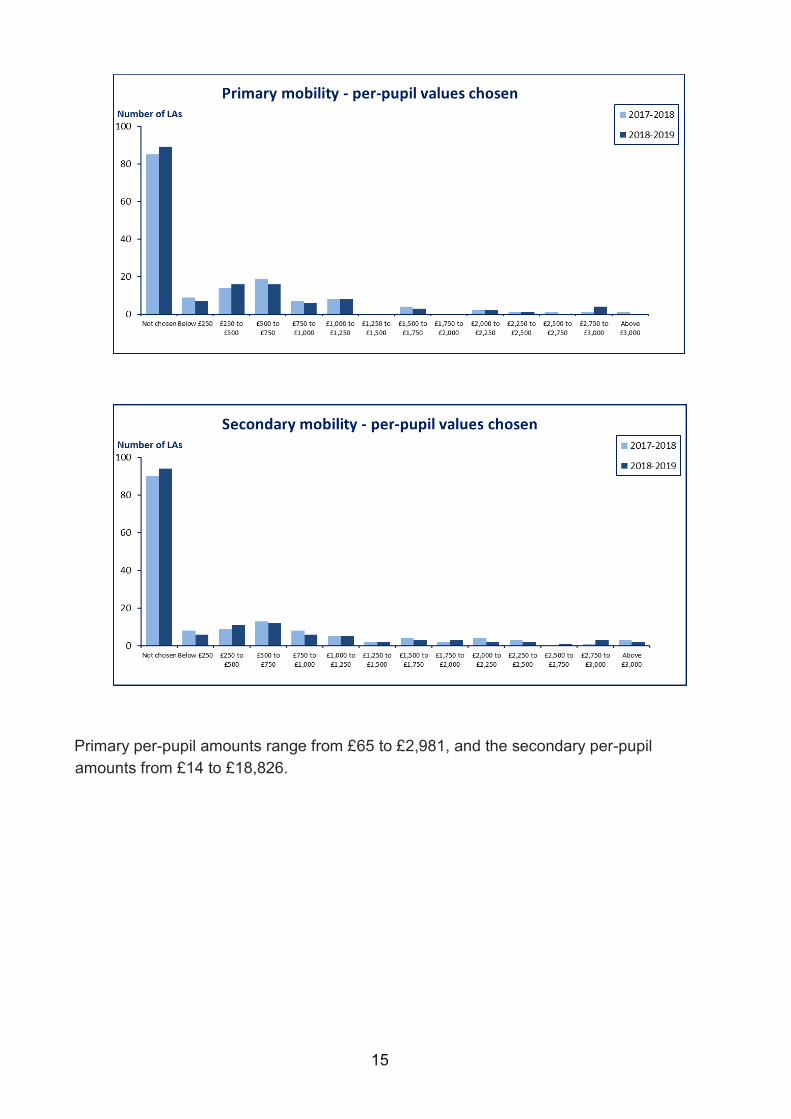
15
Primary per-pupil amounts range from £65 to £2,981, and the secondary per-pupil
amounts from £14 to £18,826.
16
Only one of the local authorities which are incorporating the mobility factor into their
2018-19 funding formulae are using it to allocate more than 1% of their schools block
funding, and only three are allocating more than 0.5%. Across all local authorities as a
whole, some 0.1% of schools block funding is being allocated through this factor, the
same as in the 2017-18 formulae.
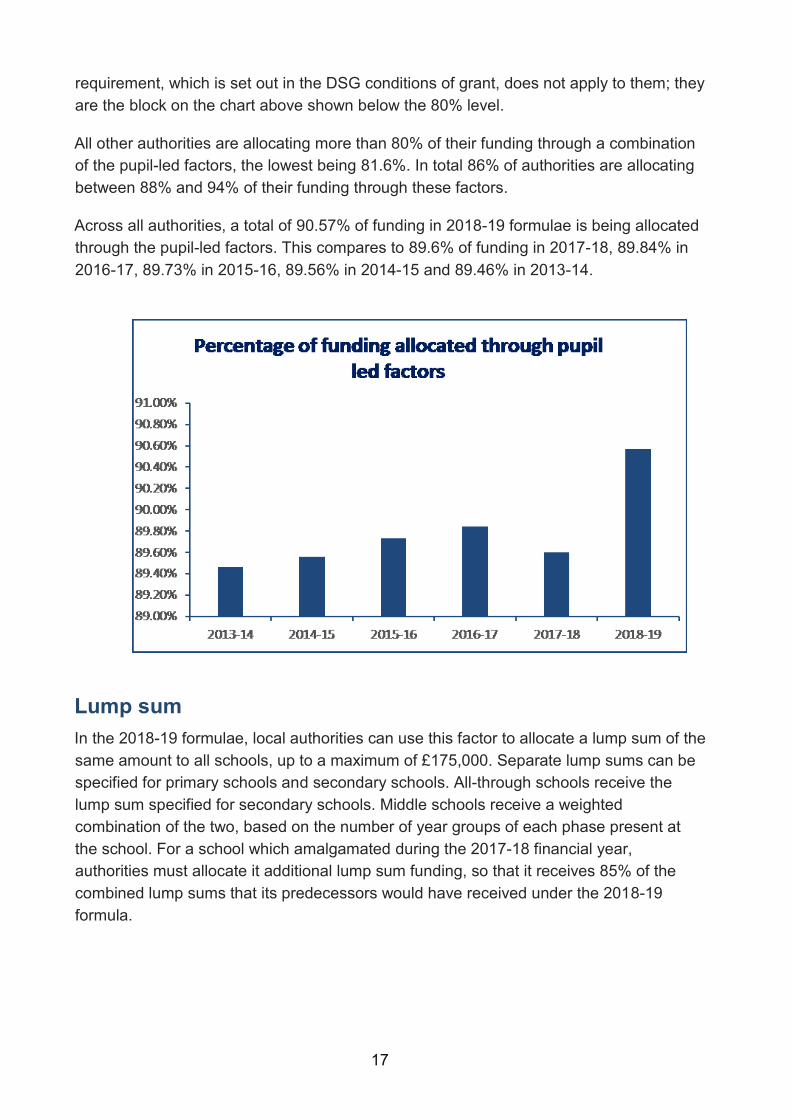
Total funding through the pupil-led factors
The factors highlighted above (that is basic per-pupil entitlement, deprivation, looked-
after children, prior attainment, English as an additional language, and mobility) are
pupil-led. Although there is considerable variation across local authorities in the
choices of factors used, the per-pupil amounts, and the proportions of funding
allocated through each one, overall there is strong consistency in the proportions of
funding allocated through the pupil-led factors as a whole.
A requirement for the 2018-19 formulae is that across each local authority as a whole, a
minimum of 80% of schools block funding must be allocated through these pupil-led
factors. Note that the Isles of Scilly has only a single school, and does not formally
receive DSG schools block funding in the same way as the other authorities, so the 80%
17
requirement, which is set out in the DSG conditions of grant, does not apply to them; they
are the block on the chart above shown below the 80% level.
All other authorities are allocating more than 80% of their funding through a combination
of the pupil-led factors, the lowest being 81.6%. In total 86% of authorities are allocating
between 88% and 94% of their funding through these factors.
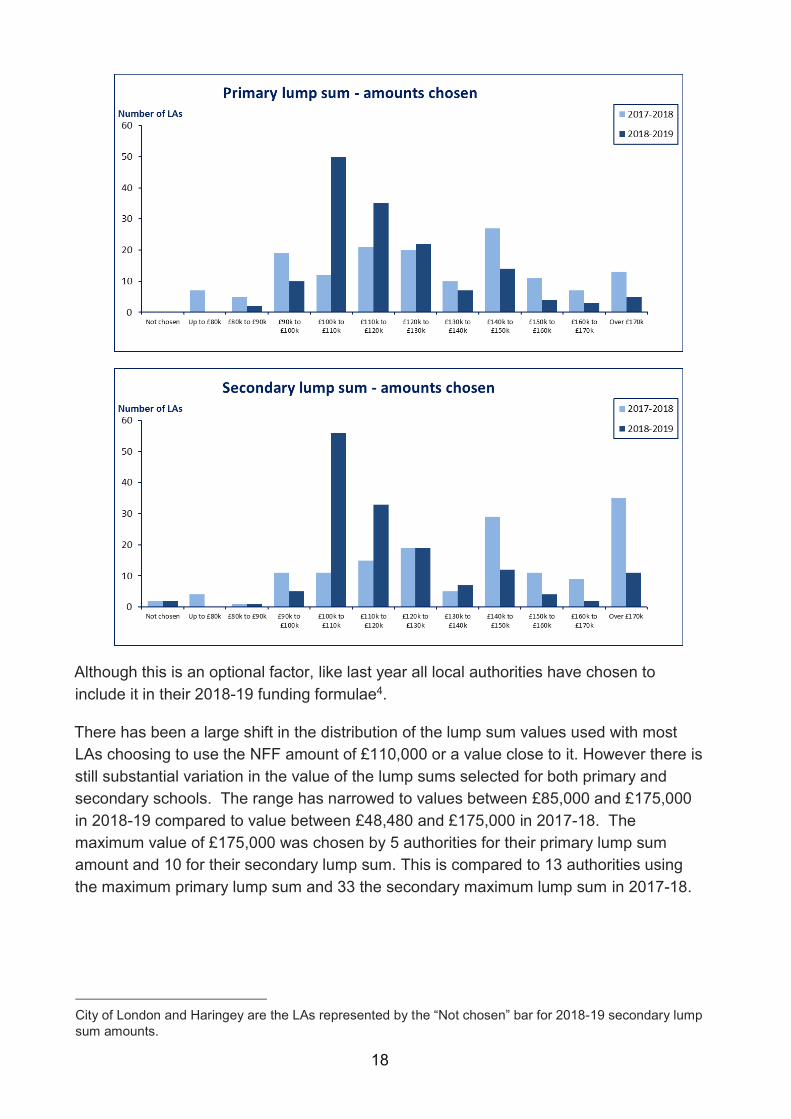
Across all authorities, a total of 90.57% of funding in 2018-19 formulae is being allocated
through the pupil-led factors. This compares to 89.6% of funding in 2017-18, 89.84% in
2016-17, 89.73% in 2015-16, 89.56% in 2014-15 and 89.46% in 2013-14.
Lump sum
In the 2018-19 formulae, local authorities can use this factor to allocate a lump sum of the
same amount to all schools, up to a maximum of £175,000. Separate lump sums can be
specified for primary schools and secondary schools. All-through schools receive the
lump sum specified for secondary schools. Middle schools receive a weighted
combination of the two, based on the number of year groups of each phase present at
the school. For a school which amalgamated during the 2017-18 financial year,
authorities must allocate it additional lump sum funding, so that it receives 85% of the
combined lump sums that its predecessors would have received under the 2018-19
formula.
18
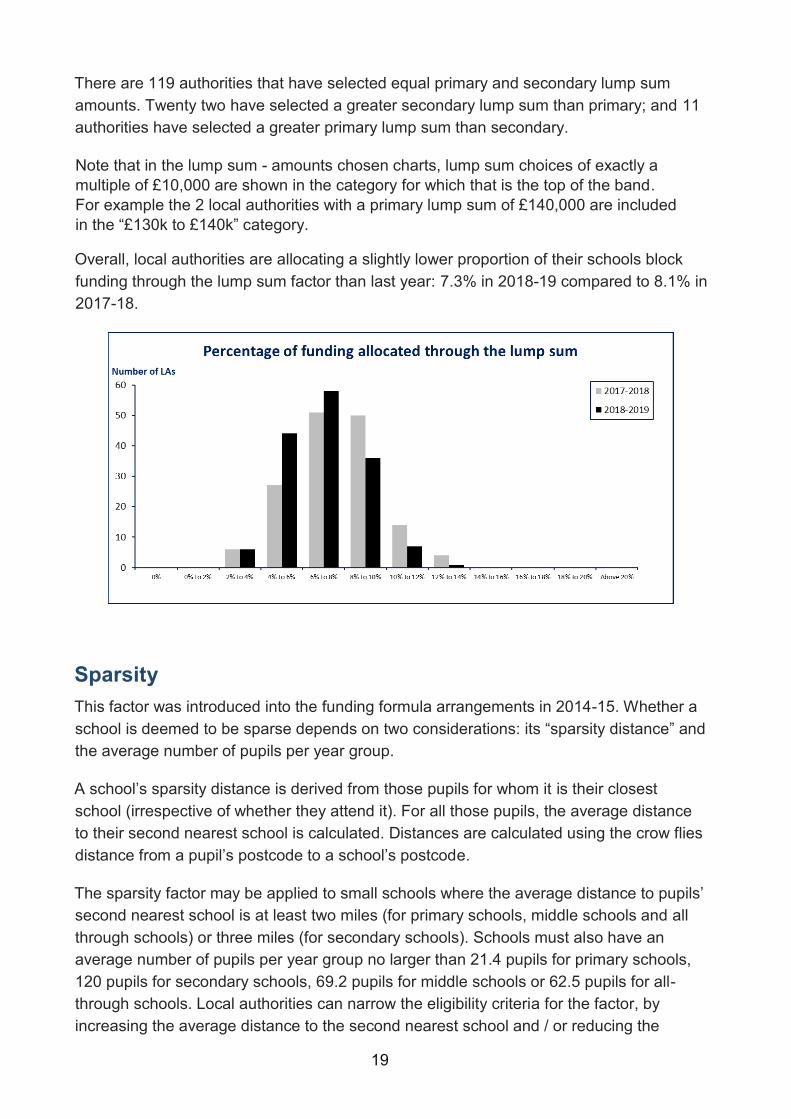
Although this is an optional factor, like last year all local authorities have chosen to
include it in their 2018-19 funding formulae4.
There has been a large shift in the distribution of the lump sum values used with most
LAs choosing to use the NFF amount of £110,000 or a value close to it. However there is
still substantial variation in the value of the lump sums selected for both primary and
secondary schools. The range has narrowed to values between £85,000 and £175,000
in 2018-19 compared to value between £48,480 and £175,000 in 2017-18. The
maximum value of £175,000 was chosen by 5 authorities for their primary lump sum
amount and 10 for their secondary lump sum. This is compared to 13 authorities using
the maximum primary lump sum and 33 the secondary maximum lump sum in 2017-18.
City of London and Haringey are the LAs represented by the “Not chosen” bar for 2018-19 secondary lump
sum amounts.
19
There are 119 authorities that have selected equal primary and secondary lump sum
amounts. Twenty two have selected a greater secondary lump sum than primary; and 11
authorities have selected a greater primary lump sum than secondary.
Note that in the lump sum - amounts chosen charts, lump sum choices of exactly a
multiple of £10,000 are shown in the category for which that is the top of the band.
For example the 2 local authorities with a primary lump sum of £140,000 are included
in the “£130k to £140k” category.
Overall, local authorities are allocating a slightly lower proportion of their schools block
funding through the lump sum factor than last year: 7.3% in 2018-19 compared to 8.1% in
2017-18.
Sparsity
This factor was introduced into the funding formula arrangements in 2014-15. Whether a
school is deemed to be sparse depends on two considerations: its “sparsity distance” and
the average number of pupils per year group.
A school’s sparsity distance is derived from those pupils for whom it is their closest
school (irrespective of whether they attend it). For all those pupils, the average distance
to their second nearest school is calculated. Distances are calculated using the crow flies
distance from a pupil’s postcode to a school’s postcode.
The sparsity factor may be applied to small schools where the average distance to pupils’
second nearest school is at least two miles (for primary schools, middle schools and all
through schools) or three miles (for secondary schools). Schools must also have an
average number of pupils per year group no larger than 21.4 pupils for primary schools,
120 pupils for secondary schools, 69.2 pupils for middle schools or 62.5 pupils for all-
through schools. Local authorities can narrow the eligibility criteria for the factor, by
increasing the average distance to the second nearest school and / or reducing the
20
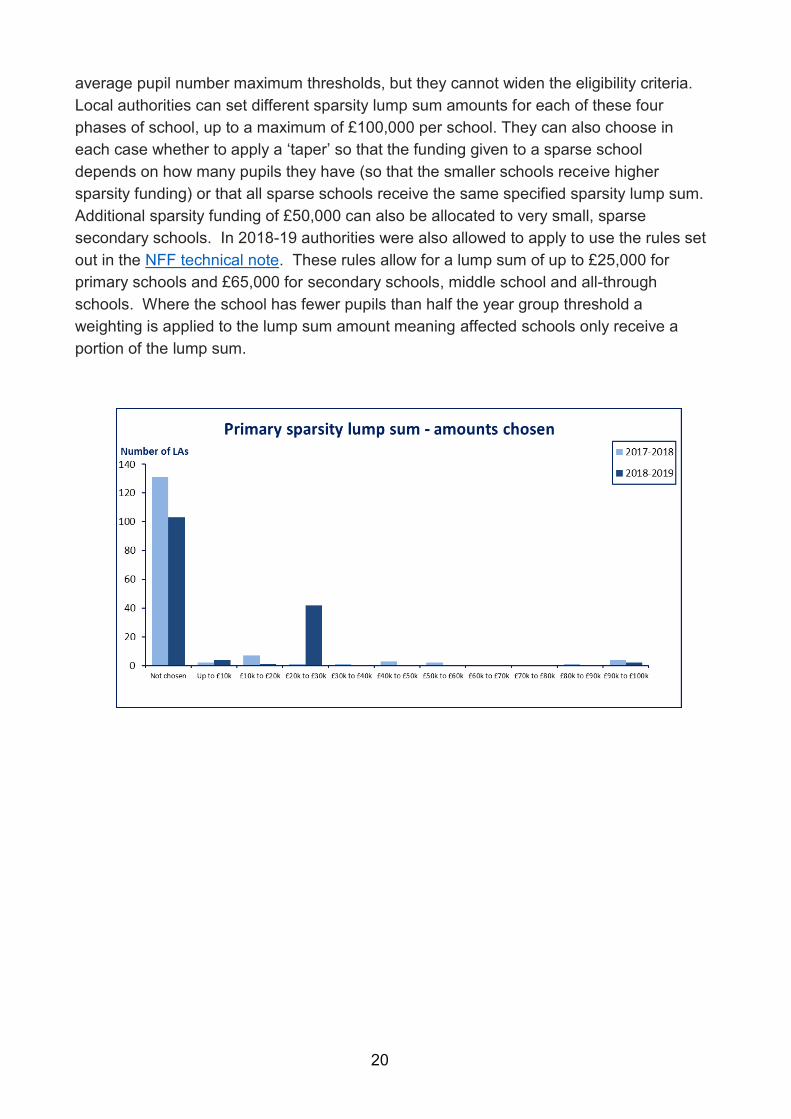
average pupil number maximum thresholds, but they cannot widen the eligibility criteria.
Local authorities can set different sparsity lump sum amounts for each of these four
phases of school, up to a maximum of £100,000 per school. They can also choose in
each case whether to apply a ‘taper’ so that the funding given to a sparse school
depends on how many pupils they have (so that the smaller schools receive higher
sparsity funding) or that all sparse schools receive the same specified sparsity lump sum.
Additional sparsity funding of £50,000 can also be allocated to very small, sparse
secondary schools. In 2018-19 authorities were also allowed to apply to use the rules set
out in the NFF technical note. These rules allow for a lump sum of up to £25,000 for
primary schools and £65,000 for secondary schools, middle school and all-through
schools. Where the school has fewer pupils than half the year group threshold a
weighting is applied to the lump sum amount meaning affected schools only receive a
portion of the lump sum.
21
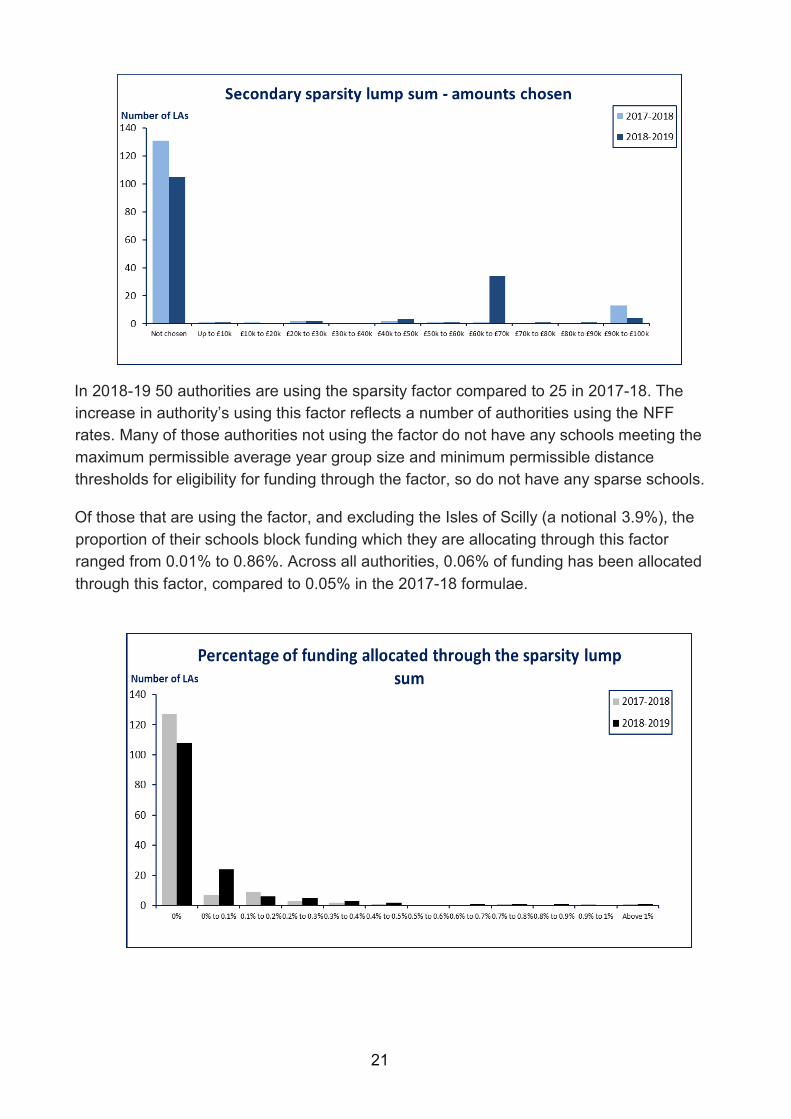
In 2018-19 50 authorities are using the sparsity factor compared to 25 in 2017-18. The
increase in authority’s using this factor reflects a number of authorities using the NFF
rates. Many of those authorities not using the factor do not have any schools meeting the
maximum permissible average year group size and minimum permissible distance
thresholds for eligibility for funding through the factor, so do not have any sparse schools.
Of those that are using the factor, and excluding the Isles of Scilly (a notional 3.9%), the
proportion of their schools block funding which they are allocating through this factor
ranged from 0.01% to 0.86%. Across all authorities, 0.06% of funding has been allocated
through this factor, compared to 0.05% in the 2017-18 formulae.
22
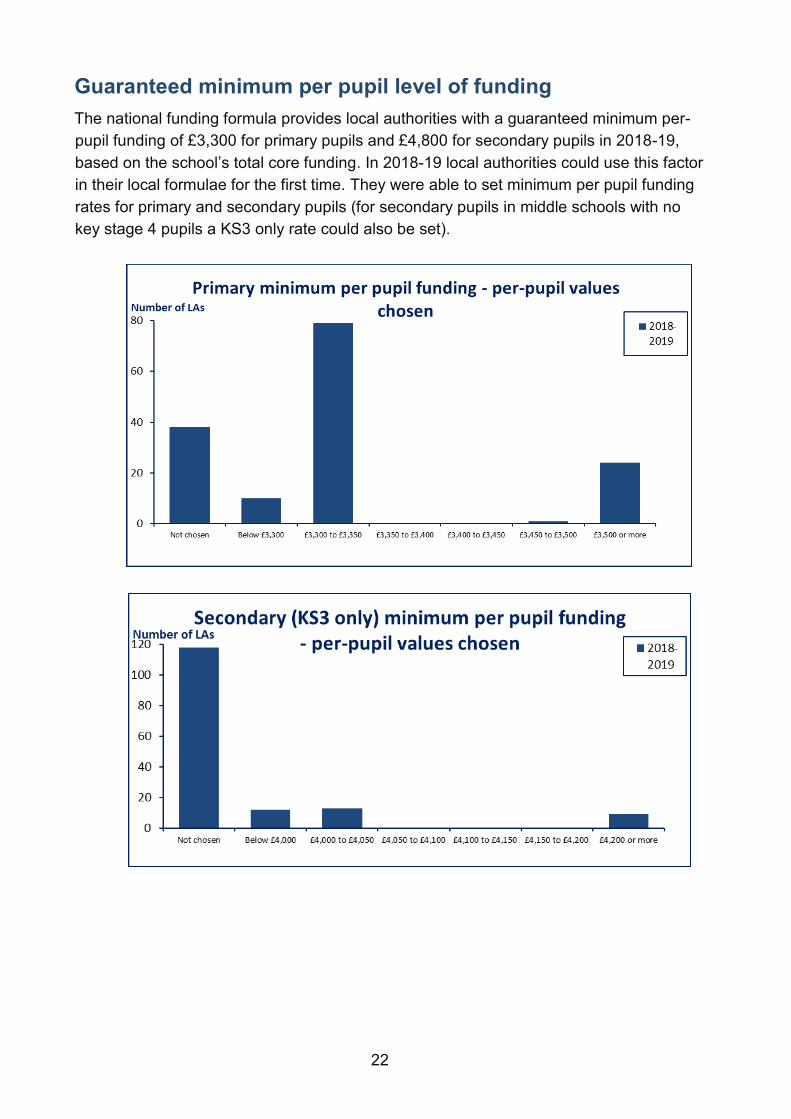
Guaranteed minimum per pupil level of funding
The national funding formula provides local authorities with a guaranteed minimum per-
pupil funding of £3,300 for primary pupils and £4,800 for secondary pupils in 2018-19,
based on the school’s total core funding. In 2018-19 local authorities could use this factor
in their local formulae for the first time. They were able to set minimum per pupil funding
rates for primary and secondary pupils (for secondary pupils in middle schools with no
key stage 4 pupils a KS3 only rate could also be set).
23
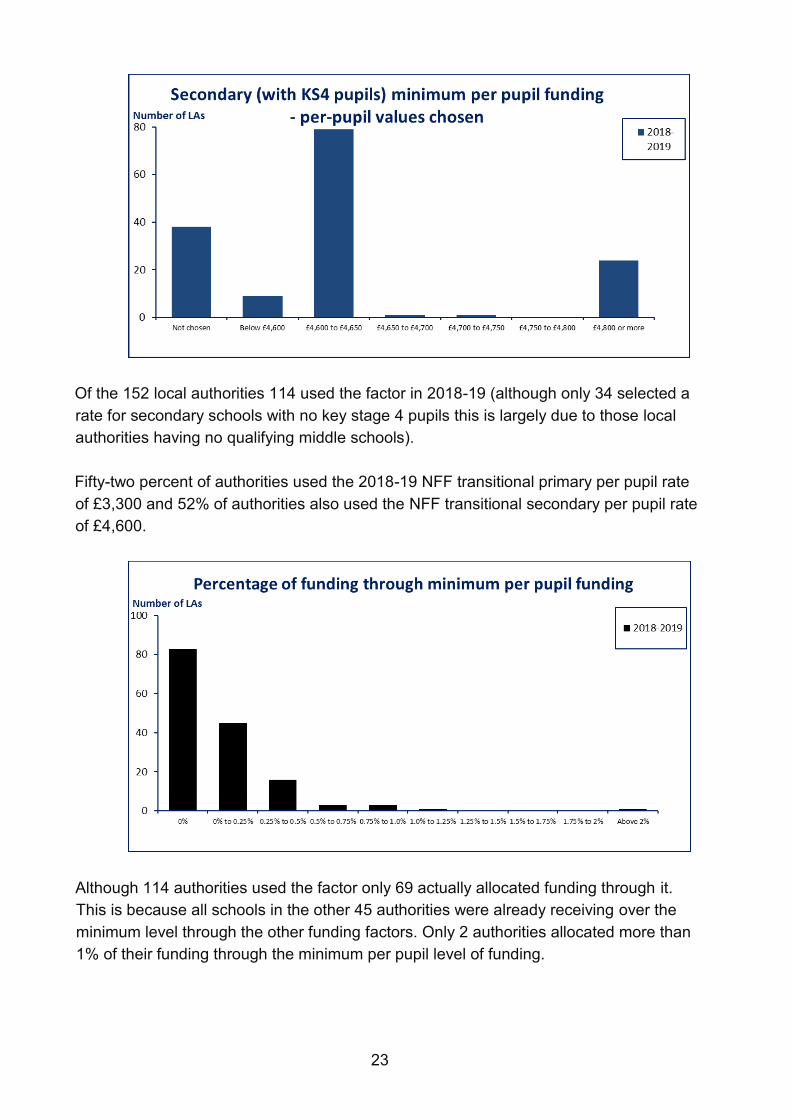
Of the 152 local authorities 114 used the factor in 2018-19 (although only 34 selected a
rate for secondary schools with no key stage 4 pupils this is largely due to those local
authorities having no qualifying middle schools).
Fifty-two percent of authorities used the 2018-19 NFF transitional primary per pupil rate
of £3,300 and 52% of authorities also used the NFF transitional secondary per pupil rate
of £4,600.
Although 114 authorities used the factor only 69 actually allocated funding through it.
This is because all schools in the other 45 authorities were already receiving over the
minimum level through the other funding factors. Only 2 authorities allocated more than
1% of their funding through the minimum per pupil level of funding.
24
Other formula factors
Information for each local authority on the formula factors not discussed in this note
(London fringe, split sites, rates, PFI funding, and exceptional circumstances) can be
found in the accompanying data file.
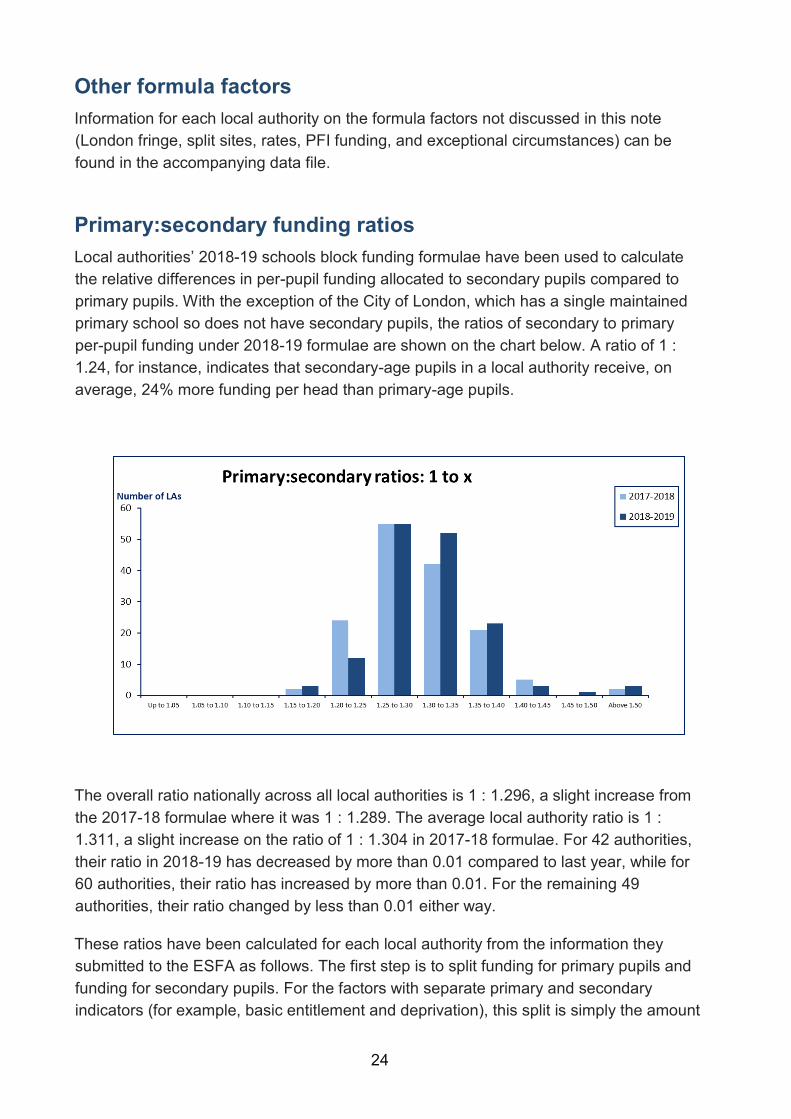
Primary:secondary funding ratios
Local authorities’ 2018-19 schools block funding formulae have been used to calculate
the relative differences in per-pupil funding allocated to secondary pupils compared to
primary pupils. With the exception of the City of London, which has a single maintained
primary school so does not have secondary pupils, the ratios of secondary to primary
per-pupil funding under 2018-19 formulae are shown on the chart below. A ratio of 1 :
1.24, for instance, indicates that secondary-age pupils in a local authority receive, on
average, 24% more funding per head than primary-age pupils.
The overall ratio nationally across all local authorities is 1 : 1.296, a slight increase from
the 2017-18 formulae where it was 1 : 1.289. The average local authority ratio is 1 :
1.311, a slight increase on the ratio of 1 : 1.304 in 2017-18 formulae. For 42 authorities,
their ratio in 2018-19 has decreased by more than 0.01 compared to last year, while for
60 authorities, their ratio has increased by more than 0.01. For the remaining 49
authorities, their ratio changed by less than 0.01 either way.
These ratios have been calculated for each local authority from the information they
submitted to the ESFA as follows. The first step is to split funding for primary pupils and
funding for secondary pupils. For the factors with separate primary and secondary
indicators (for example, basic entitlement and deprivation), this split is simply the amount
25
of funding allocated through each type of indicator. For the other factors (with the
exception of historic commitments for sixth form funding, which is excluded), the amount
of funding allocated to each school in the local authority area is split between primary and
secondary in proportion to the number of pupils in each phase at the school. These
amounts are aggregated to estimate the total funding for primary pupils and the total
funding for secondary pupils. These amounts are then divided, respectively, by the
number of primary schools block-funded pupils on roll and the number of secondary
schools block-funded pupils on roll in the authority. This gives per pupil funding amounts
for primary and secondary phases, and the ratio of the two is taken.
This calculation excludes the effects on schools’ funding of applying the minimum funding
guarantee (MFG), and excludes any further capping or scaling factors applied by local
authorities to ensure that the total funding allocated through their formulae is affordable
within the total DSG schools block they have been allocated for financial year 2018-19.
For academies, the calculation is based on the amount of schools block funding they
would receive in 2018-19 if they were a maintained school.
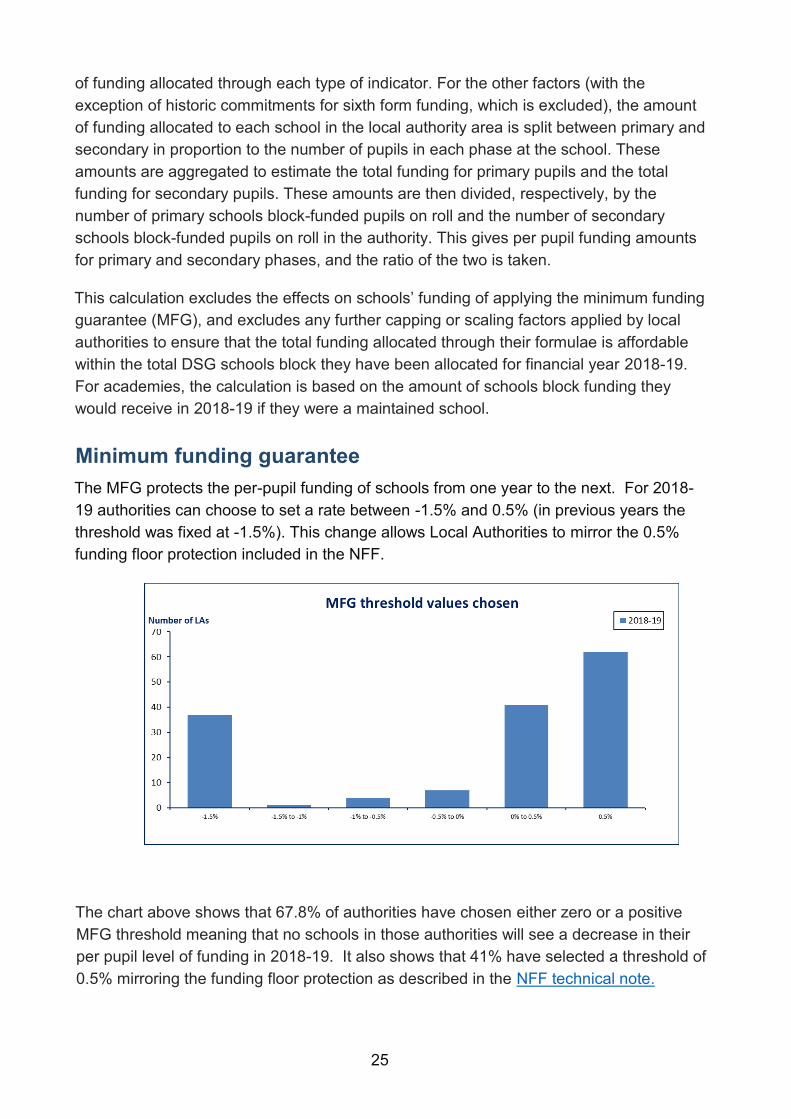
Minimum funding guarantee
The MFG protects the per-pupil funding of schools from one year to the next. For 2018-
19 authorities can choose to set a rate between -1.5% and 0.5% (in previous years the
threshold was fixed at -1.5%). This change allows Local Authorities to mirror the 0.5%
funding floor protection included in the NFF.
The chart above shows that 67.8% of authorities have chosen either zero or a positive
MFG threshold meaning that no schools in those authorities will see a decrease in their
per pupil level of funding in 2018-19. It also shows that 41% have selected a threshold of
0.5% mirroring the funding floor protection as described in the NFF technical note.
26
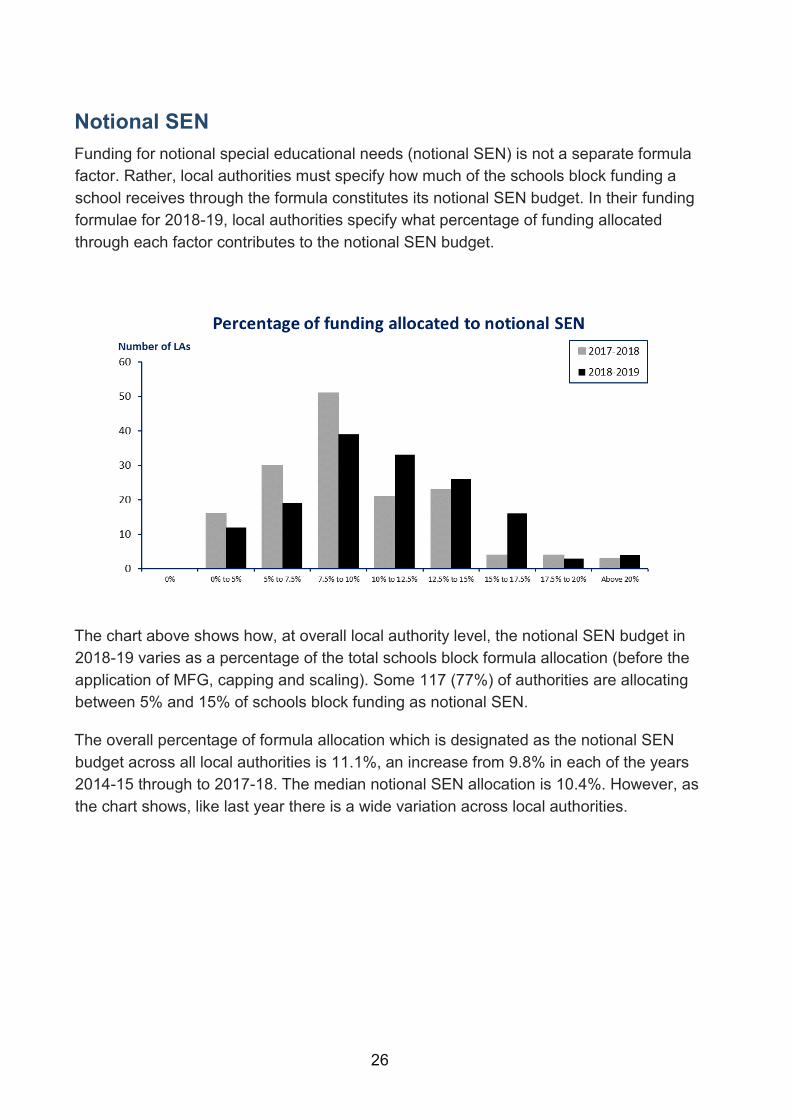
Notional SEN
Funding for notional special educational needs (notional SEN) is not a separate formula
factor. Rather, local authorities must specify how much of the schools block funding a
school receives through the formula constitutes its notional SEN budget. In their funding
formulae for 2018-19, local authorities specify what percentage of funding allocated
through each factor contributes to the notional SEN budget.
The chart above shows how, at overall local authority level, the notional SEN budget in
2018-19 varies as a percentage of the total schools block formula allocation (before the
application of MFG, capping and scaling). Some 117 (77%) of authorities are allocating
between 5% and 15% of schools block funding as notional SEN.
The overall percentage of formula allocation which is designated as the notional SEN
budget across all local authorities is 11.1%, an increase from 9.8% in each of the years
2014-15 through to 2017-18. The median notional SEN allocation is 10.4%. However, as
the chart shows, like last year there is a wide variation across local authorities.
27
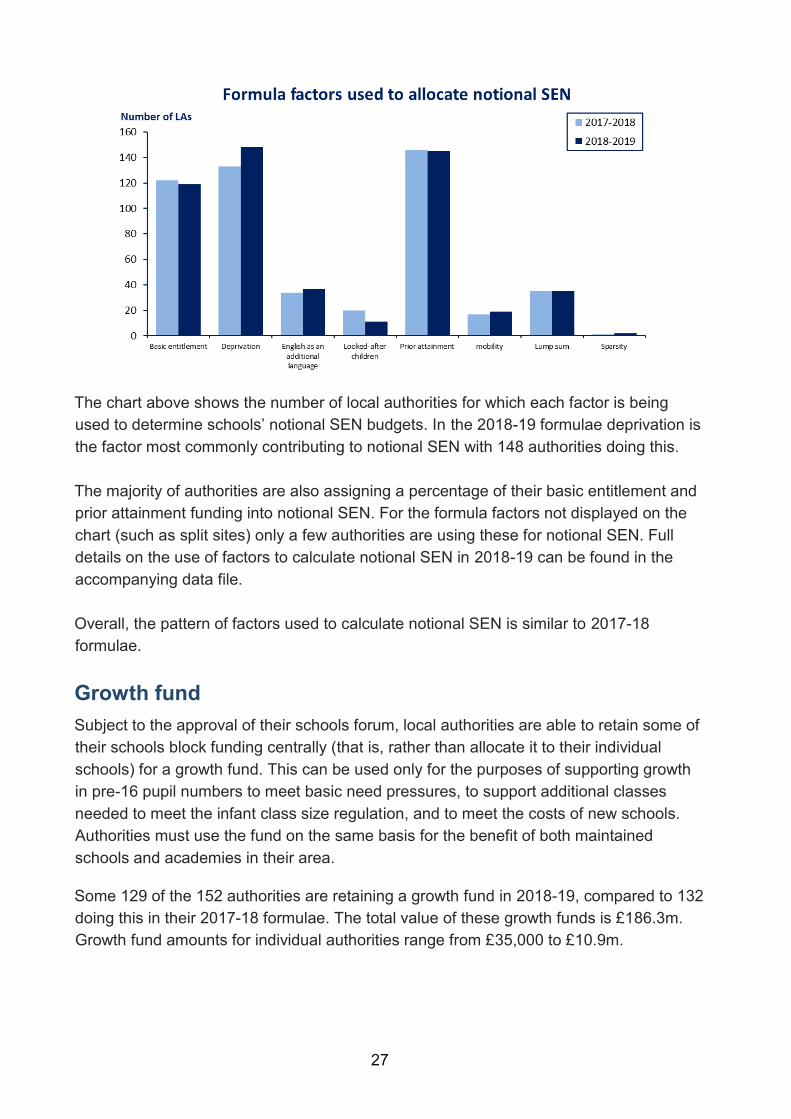
The chart above shows the number of local authorities for which each factor is being
used to determine schools’ notional SEN budgets. In the 2018-19 formulae deprivation is
the factor most commonly contributing to notional SEN with 148 authorities doing this.
The majority of authorities are also assigning a percentage of their basic entitlement and
prior attainment funding into notional SEN. For the formula factors not displayed on the
chart (such as split sites) only a few authorities are using these for notional SEN. Full
details on the use of factors to calculate notional SEN in 2018-19 can be found in the
accompanying data file.
Overall, the pattern of factors used to calculate notional SEN is similar to 2017-18
formulae.
Growth fund
Subject to the approval of their schools forum, local authorities are able to retain some of
their schools block funding centrally (that is, rather than allocate it to their individual
schools) for a growth fund. This can be used only for the purposes of supporting growth
in pre-16 pupil numbers to meet basic need pressures, to support additional classes
needed to meet the infant class size regulation, and to meet the costs of new schools.
Authorities must use the fund on the same basis for the benefit of both maintained
schools and academies in their area.
Some 129 of the 152 authorities are retaining a growth fund in 2018-19, compared to 132
doing this in their 2017-18 formulae. The total value of these growth funds is £186.3m.
Growth fund amounts for individual authorities range from £35,000 to £10.9m.
28
Falling rolls fund
Local authorities were also able to retain funding centrally to support schools currently
experiencing falling rolls to prepare for an expected future population bulge, again subject
to the approval of their schools forum. The falling rolls fund should be restricted to
population increases expected in two to three years in necessary schools which are
classed by Ofsted as good or outstanding. The fund cannot be used by authorities to prop
up unpopular or failing schools.
Only 27 authorities are retaining a falling rolls fund in their 2018-19 formulae (down from
28 in 2017-18), with a total value of £9m. Falling rolls fund amounts for individual
authorities range from £50,000 to £1.8m.
29
Information about the data file
Alongside this document, the DfE has published a detailed data file in Microsoft Excel
format showing the 2018-19 funding formula used by each local authority, as they stood
at 23 March 2018.
“Proforma” sheet
The sheet entitled “Proforma” allows the full data for a single authority to be displayed on
the screen. Click on the purple cell near the top of the page next to the LA Name label,
then click on the drop-down arrow that appears alongside, to select a new local authority.
“Final MI data 1819” sheet
The sheet entitled “Final MI data 1819” gives the proforma data values for each authority
in a large table. This section provides a description of all the columns displayed here.
Minimum level of per pupil funding
This section shows which local authorities have chosen to use the guaranteed minimum
per pupil level of funding introduced in 2018-19. The section includes details of the rates
applied to each of the year groups as well as details of whether mobility and premises
funding has been excluded from the allocation when calculating if additional funding is
due under the factor.
Reception Uplift
The “Reception Uplift” column indicates which local authorities have opted to increase the
count of primary pupils to which the basic entitlement primary indicator applies, to include
pupils with deferred entry into reception later in the year. The other column in this section
indicates the number of pupils this applies to.
Basic entitlement
This section shows the per-pupil funding amounts local authorities have chosen for the
primary and secondary indicators in their 2018-19 formulae; the number of pupils in
mainstream maintained schools and academies in the authority as a whole to which each
indicator applies; the total amount of schools block funding allocated to maintained
schools and academies through each factor; the proportion of schools block funding
allocated through each factor; and the proportion of the factor’s funding which contributes
towards notional SEN budgets.
30
Deprivation, looked-after children, prior attainment, English as an
additional language, mobility
These sections also show the per-pupil amounts chosen, the number of pupils, the
total/proportion of funding allocated to schools through each factor, and contribution to
notional SEN budgets. For the indicators where local authorities had a choice as to which
specific measure to use for their formulae, columns indicate the selection. Explanations
for the entries in these columns are given below. For each, the entry “N/A” means that a
local authority has chosen not to use a particular factor or indicator.
English as an additional language – Primary (1/2/3/NA), Secondary (1/2/3/NA):
• EAL 1 Primary / EAL 1 Secondary: Indicator used is the number of pupils with EAL
who entered the compulsory school system in the last year.
• EAL 2 Primary / EAL 2 Secondary: Indicator used is the number of pupils with EAL
who entered the compulsory school system in either of the last 2 years.
• EAL 3 Primary / EAL 3 Secondary: Indicator used is the number of pupils with EAL
who entered the compulsory school system in any of the last 3 years.
Prior attainment – Primary Low Attainment (73/78/NA):
• Low Attainment % old FSP 73: Indicator used is the number pupils in year 6 who
did not achieve 73 points or more in the old early years foundation stage profile.
• Low Attainment % old FSP 78: Indicator used is the number pupils in year 6 who
did not achieve 78 points or more in the old early years foundation stage profile.
Lump sum
Lump sum funding is shown in two places in the data file. Most funding through the lump
sum factor is shown in the group of columns entitled “Lump sum”. However there is also
a small amount of lump sum funding displayed in the “Exceptional circumstances”
section, in columns 2 to 5 of this group (all of which have a column title “Additional lump
sum…”). The data here relates specifically to additional lump sum funding which
authorities are allocating to schools which amalgamated during the 2017-18 financial
year. As explained previously, authorities must allocate such schools additional lump sum
funding, so that they receive 85% of the combined lump sums of its predecessors.
Authorities could also apply to continue protection for schools which amalgamated during
the 2016-17 financial year. The data are presented in this way because authorities
recorded any additional lump sum funding for previous year amalgamations in a different
section of their formula submission.
Therefore the total amount of funding that each authority is allocating through the lump
sum factor is obtained by summing the values in the “Lump Sum total” and “Additional
lump sum total” columns. Similarly, the proportion allocated through the lump sum factor
31
is obtained by summing the values in the “Lump Sum proportion” and “Additional lump
sum proportion” columns.
Sparsity
Sparsity funding is also shown in two places in the data file. Most funding through the
sparsity factor is shown in the group of columns entitled “Sparsity”. However there is also
a small amount of sparsity funding displayed in the “Exceptional circumstances” section,
in the group of three columns (headed “Additional sparsity lump sum…”) following the
additional lump sum data. The data here relates specifically to additional sparsity funding
which authorities are allocating to very small, sparse secondary schools.
(London) fringe payments, split sites, rates, PFI funding, sixth form,
exceptional circumstances
These sections of the data file show the total funding and proportions of funding allocated
to schools through each factor.
Schools block
The “Total Funding Schools Block Formula Excl MFG Funding Total (£)” column gives the
total amount of money allocated to mainstream maintained schools and academies in
2018-19 under local authorities’ basic funding formulae. This section also includes any
additional funding allocated through the guaranteed minimum per pupil level of funding.
Minimum funding guarantee
The MFG protects the per-pupil funding of schools from one year to the next and for
2018-19 authorities can choose to set a rate between -1.5% and 0.5%. The column
“Minimum Funding Guarantee (£)” is the total funding authorities are allocating to their
schools, over and above the amounts derived through their basic formula, to ensure this
condition is met.
In addition, local authorities are allowed to set capping and scaling factors to ensure that
the amount of funding allocated through their formula (and including any additional
funding to ensure the MFG is met) fits within the total DSG schools block available to
them. Any change in the per-pupil funding amount in 2018-19 compared to 2017-18 for
an individual school can be capped at a level specified by the local authority: these caps
are given in the column “Capping Factor”. Any school which sees its per-pupil funding
increase by more than the level of the cap will see any additional increase scaled back, to
some extent (see next paragraph). For example, in this column a 0% cap means that the
local authority will start scaling back any increase in per-pupil funding. A capping factor of
2% means that any rise in per-pupil funding of more than 2% will be scaled back. Where
a local authority has set an MFG rate greater than zero then where a cap is applied it is
32
calculated from the MFG value (so if the authority chooses an MFG rate of 0.5% and a
cap of 2.5% then gains exceeding 3% will be capped).
The column “Scaling Factor” indicates the amounts by which schools’ increases in per
pupil funding over the level of the cap will be reduced. So, for example, a 100% scaling
factor means that ALL increases in per-pupil funding above the level of the cap will be
removed – in other words the cap is a strict limit on the increase in per-pupil funding in
2018-19 compared to 2017-18. Similarly, a 50% scaling factor means that schools will
lose half of any per-pupil funding increase above the level of the cap. Authorities showing
0% values in both the “Capping Factor” column and the “Scaling Factor” column are not
restricting per-pupil increases compared to 2017-18 in order to stay within their available
funding.
The “Total deduction if capping and scaling factors are applied (£)” column shows the
total amounts that have been taken off school budgets due to the application of the
capping and scaling factors. Clearly, any school requiring additional funding in addition to
that specified by a local authority’s basic formula in order to meet the MFG will not also
be subject to capping and scaling reductions. Any entry of zero in this column means that
capping and scaling has not led to any deductions in funding compared to the basic
formula for any schools in the local authority area.
Totals
The “Total Funding for Schools Block Formula (£)” column shows the total schools block
funding allocated to mainstream maintained schools and academies in each local
authority under their 2018-19 formulae, after additions for MFG funding and deductions
from capping and scaling. The total funding figure is higher than the total schools block
formula funding plus the net MFG total as it also includes any adjustments made to
schools 2017-18 budgets in 2018-19 not included in this publication. Note that the totals
will not exactly match the total DSG schools block funding for 2018-19 that has been
allocated to each local authority. This is for a number of reasons. The funding formulae
specify the funding allocated to individual schools, and so exclude authority level
allocations such as the growth fund and falling rolls fund, which are shown in the
correspondingly named columns. In addition to this in some cases local authorities can
move funding to the high needs block and the funding formulae will reflect any brought
forward over- and under-spends, and authorities supplementing DSG from other funding
sources.
For the other columns in this section:
• % Distributed through Basic Entitlement – the proportion of schools block funding
being allocated through the basic entitlement factor in each local authority, prior to
MFG and capping and scaling.
• % Pupil Led Funding – the proportion of schools block funding being allocated
through the pupil-led factors (i.e. basic entitlement, deprivation, looked-after
33
children, prior attainment, English as an additional language, and mobility), prior to
MFG and capping and scaling.
• Primary/Secondary Ratio – the local authority’s primary:secondary funding ratio; a
figure of 1.24, for example, denotes a ratio of 1 : 1.24, meaning that secondary
age pupils in a local authority receive, on average, 24% more funding per head
than primary-age pupils.
34
© Crown copyright 2018
This publication (not including logos) is licensed under the terms of the Open
Government Licence v3.0 except where otherwise stated. Where we have identified any
third party copyright information you will need to obtain permission from the copyright
holders concerned.
To view this licence:
visit www.nationalarchives.gov.uk/doc/open-government-licence/version/3
email [email protected]
write to Information Policy Team, The National Archives, Kew, London, TW9 4DU
About this publication:
enquiries www.education.gov.uk/contactus
download www.gov.uk/government/publications
Reference: EFA-00166-2016
Follow us on Twitter:
@educationgovuk
Like us on Facebook: facebook.com/educationgovuk