Embed Size (px)
Citation preview

“Blocks and Ribbons: A Public Involvement Tool for Transportation Planning ”
Franco Saraceno/Mary Ross, P.E.
2
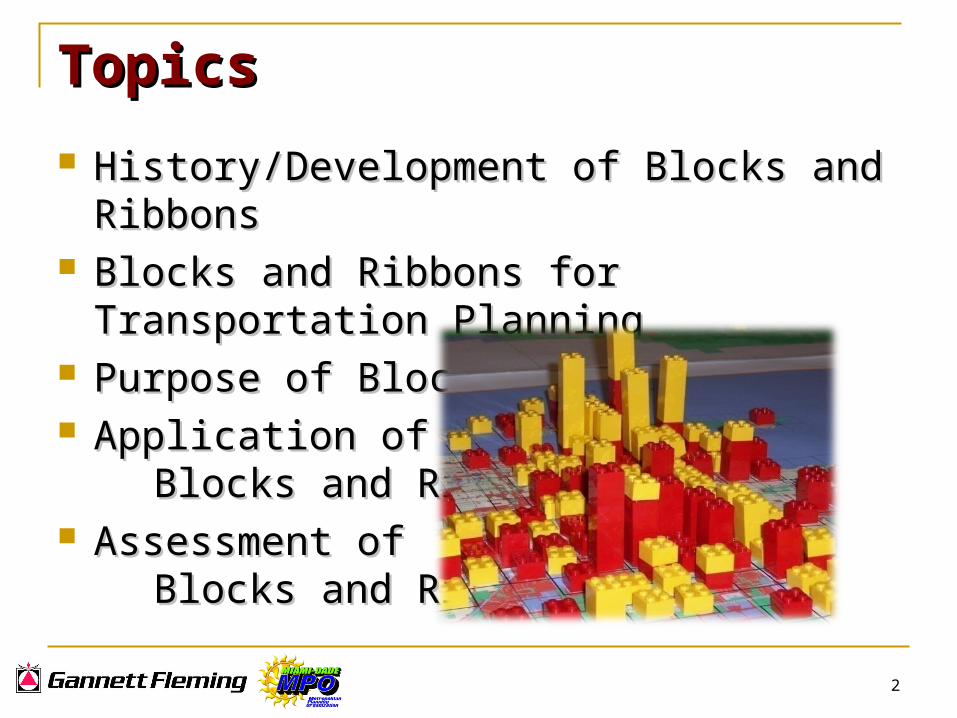
TopicsTopics
History/Development of Blocks and RibbonsHistory/Development of Blocks and Ribbons Blocks and Ribbons for Transportation PlanningBlocks and Ribbons for Transportation Planning Purpose of Blocks and RibbonsPurpose of Blocks and Ribbons Application of Application of Blocks and RibbonsBlocks and Ribbons Assessment of Assessment of Blocks and RibbonsBlocks and Ribbons
3
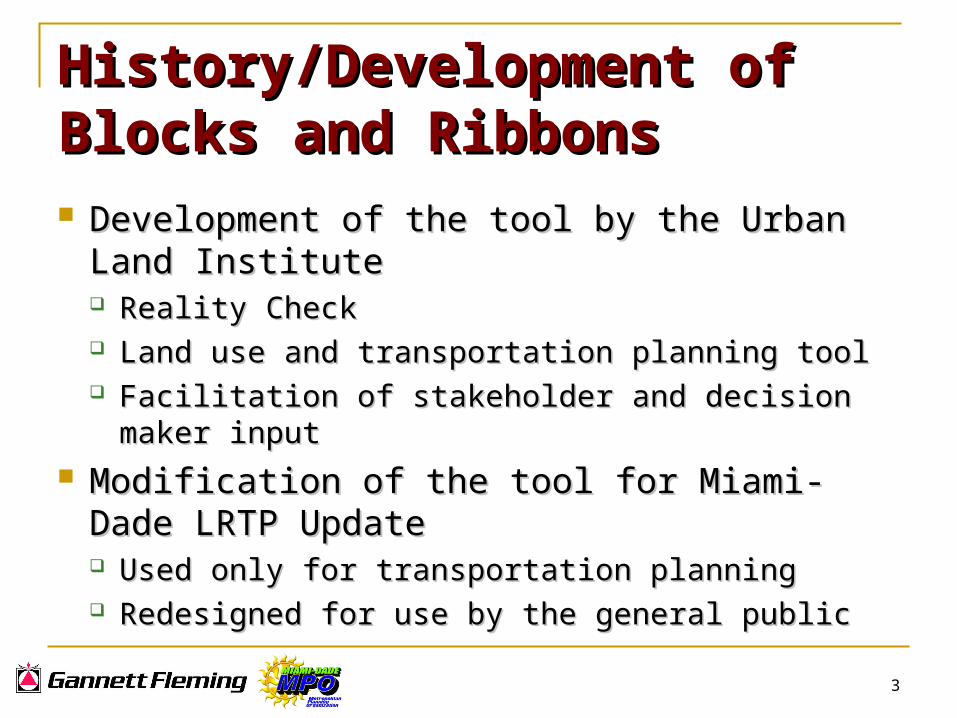
History/Development of Blocks and History/Development of Blocks and RibbonsRibbons Development of the tool by the Urban Land InstituteDevelopment of the tool by the Urban Land Institute
Reality CheckReality Check Land use and transportation planning toolLand use and transportation planning tool Facilitation of stakeholder and decision maker inputFacilitation of stakeholder and decision maker input
Modification of the tool for Miami-Dade LRTP UpdateModification of the tool for Miami-Dade LRTP Update Used only for transportation planningUsed only for transportation planning Redesigned for use by the general publicRedesigned for use by the general public
4
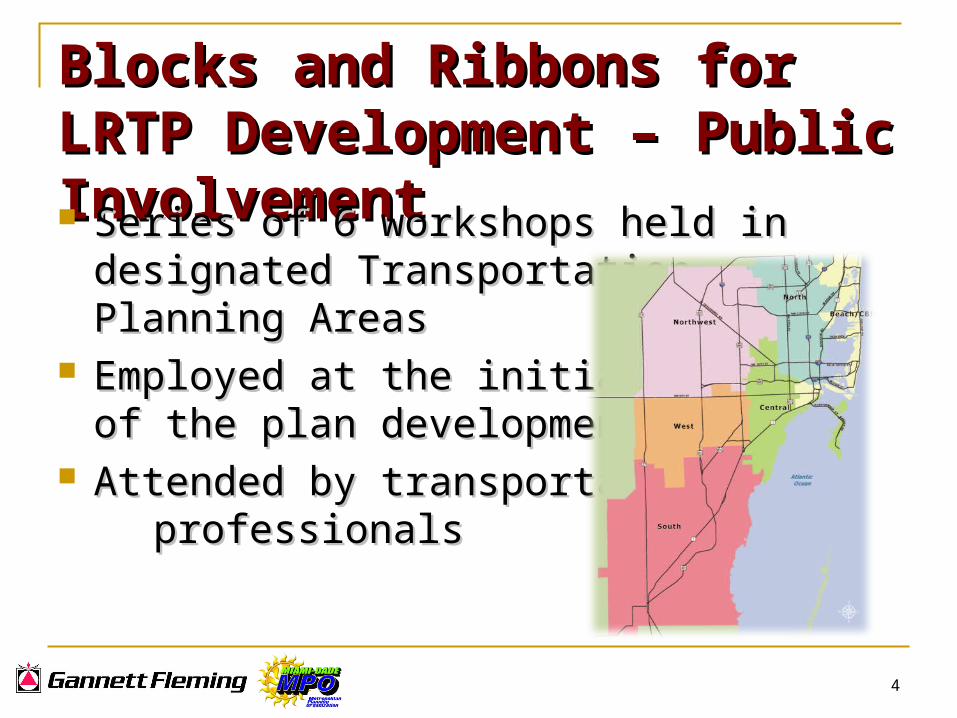
Blocks and Ribbons for LRTP Blocks and Ribbons for LRTP Development – Public InvolvementDevelopment – Public Involvement Series of 6 workshops held in designated Series of 6 workshops held in designated
Transportation Planning AreasTransportation Planning Areas Employed at the initial phase Employed at the initial phase
of the plan development processof the plan development process Attended by transportation Attended by transportation professionalsprofessionals
5
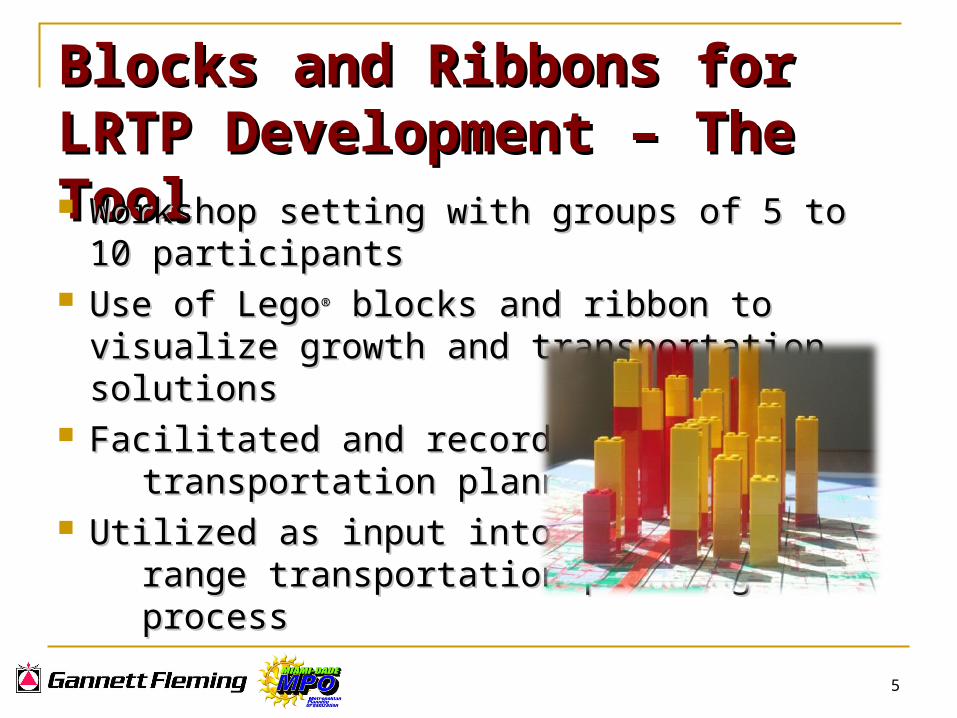
Blocks and Ribbons for LRTP Blocks and Ribbons for LRTP Development – The ToolDevelopment – The Tool Workshop setting with groups of 5 to 10 participantsWorkshop setting with groups of 5 to 10 participants Use of LegoUse of Lego®® blocks and ribbon to visualize growth and blocks and ribbon to visualize growth and
transportation solutionstransportation solutions Facilitated and recorded by Facilitated and recorded by transportation plannerstransportation planners Utilized as input into the long Utilized as input into the long range transportation planning range transportation planning processprocess
6
Purpose of Blocks and RibbonsPurpose of Blocks and Ribbons
Hands-on educational experienceHands-on educational experience Raise awareness and stimulate dialogue about Raise awareness and stimulate dialogue about
projected growthprojected growth Fulfill SAFETEA-LU’s visualization requirementFulfill SAFETEA-LU’s visualization requirement Incorporate public opinion and priorities in the planning Incorporate public opinion and priorities in the planning
processprocess
7
Hands-on Educational ExperienceHands-on Educational Experience
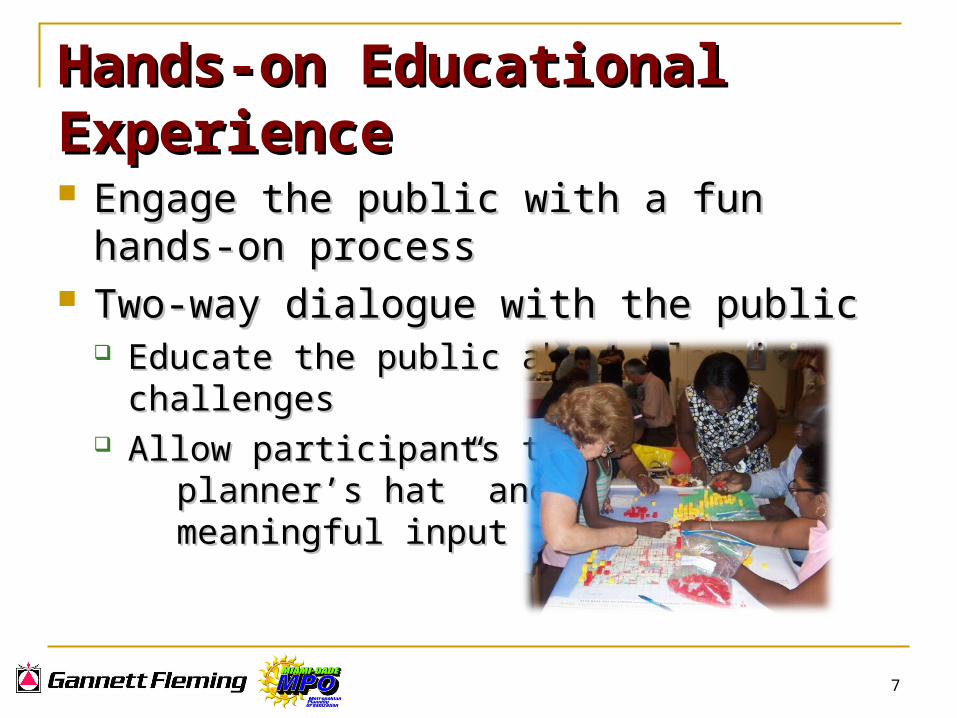
Engage the public with a fun hands-on processEngage the public with a fun hands-on process Two-way dialogue with the publicTwo-way dialogue with the public
Educate the public about planning challengesEducate the public about planning challenges Allow participants to “wear the Allow participants to “wear the planner’s hat” and provide planner’s hat” and provide meaningful inputmeaningful input
8
Raise Awareness about Projected Raise Awareness about Projected GrowthGrowth 39% Population growth expected in Miami-Dade 39% Population growth expected in Miami-Dade
County by 2035County by 2035 45% Employment growth expected in Miami-Dade 45% Employment growth expected in Miami-Dade
County by 2035County by 2035 How best to address this growth with transportation How best to address this growth with transportation
solutionssolutions
9
VisualizationVisualization SAFETEA-LU requires MPO’s to employ visualization SAFETEA-LU requires MPO’s to employ visualization
techniques to describe metropolitan transportation techniques to describe metropolitan transportation plansplans
FHWA examples of visualization techniques include:FHWA examples of visualization techniques include: SketchesSketches DrawingsDrawings Artist renderingsArtist renderings Physical models and mapsPhysical models and maps Simulated photosSimulated photos VideosVideos
Computer modeled imagesComputer modeled images Interactive GIS systemsInteractive GIS systems GIS based scenario GIS based scenario
planning toolsplanning tools Photo manipulationPhoto manipulation Computer simulationComputer simulation
10
Application of Blocks and RibbonsApplication of Blocks and Ribbons
Elements of the toolElements of the tool Blocks allocationBlocks allocation Ribbon allocationRibbon allocation Prioritization of ribbonPrioritization of ribbon Discussion of implicationsDiscussion of implications
11
Blocks AllocationBlocks Allocation
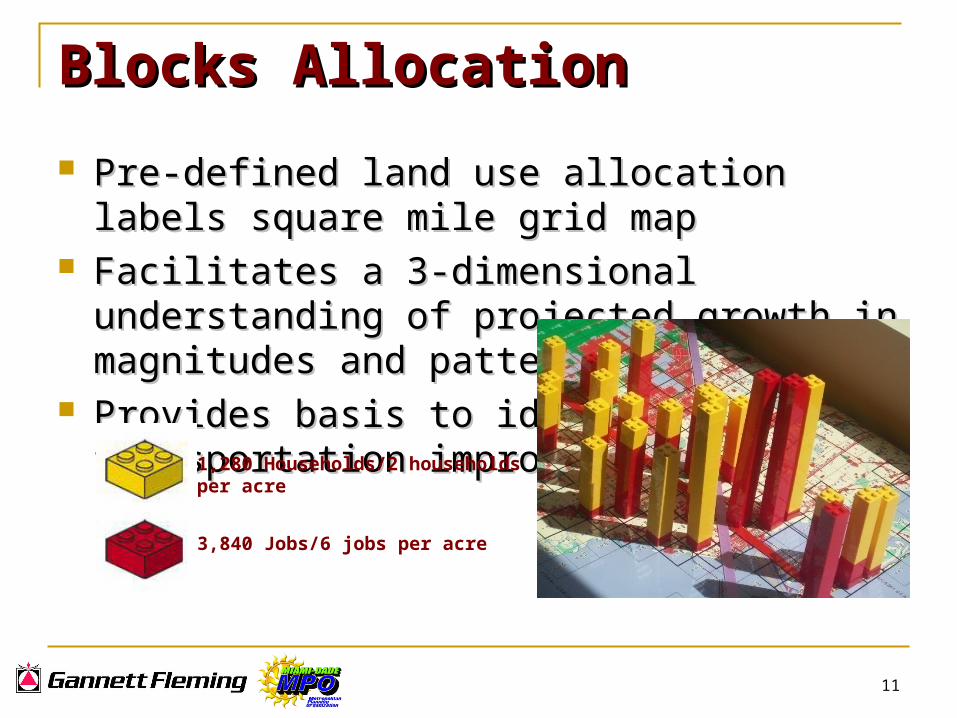
Pre-defined land use allocation labels square mile grid mapPre-defined land use allocation labels square mile grid map Facilitates a 3-dimensional understanding of projected Facilitates a 3-dimensional understanding of projected
growth in magnitudes and patternsgrowth in magnitudes and patterns Provides basis to identify/justify Provides basis to identify/justify
transportation improvementstransportation improvements
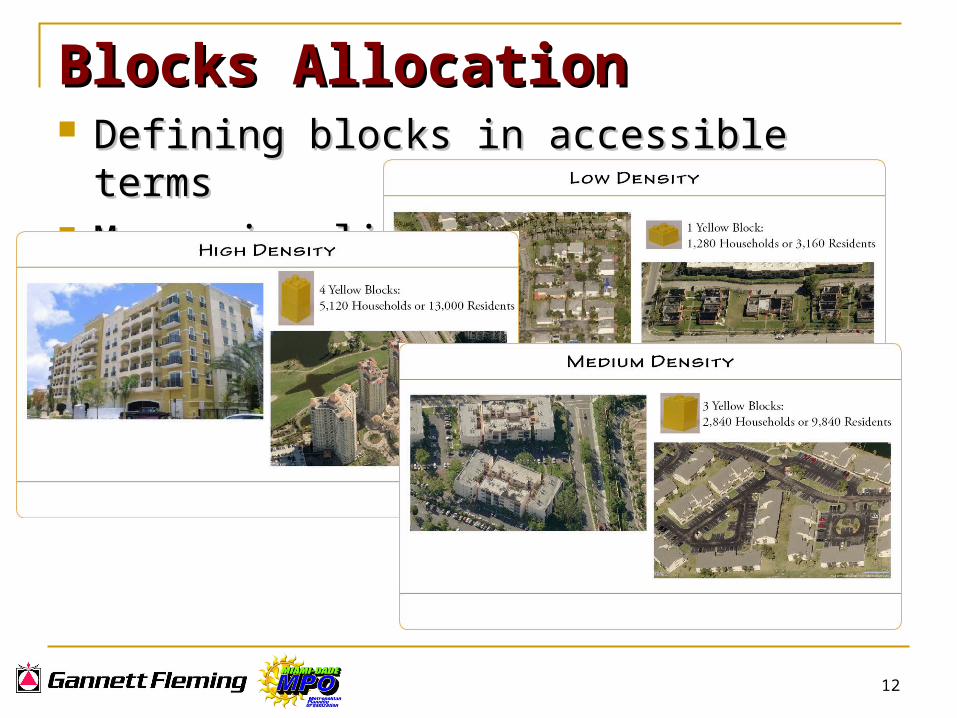
1,280 Households/2 households per acre
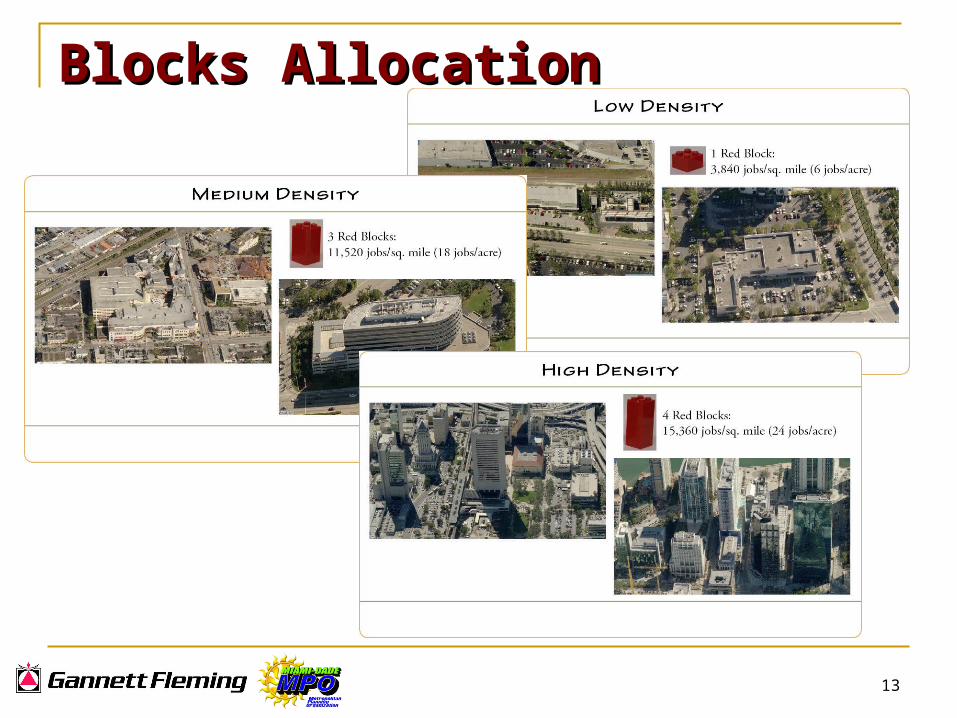
3,840 Jobs/6 jobs per acre
12
Blocks AllocationBlocks Allocation Defining blocks in accessible termsDefining blocks in accessible terms More visualizationMore visualization
13
Blocks AllocationBlocks Allocation
14
Ribbon AllocationRibbon Allocation
Unlimited ribbon available to recommend transportation Unlimited ribbon available to recommend transportation improvementsimprovements
Ribbon provided in two colors to distinguish Ribbon provided in two colors to distinguish improvement typesimprovement types Purple ribbon – highway improvementsPurple ribbon – highway improvements Orange ribbon – transit improvementsOrange ribbon – transit improvements Purple and orange combined – multimodal corridorsPurple and orange combined – multimodal corridors
15
Prioritization of RibbonPrioritization of Ribbon
Tape measure provided to measure used ribbonTape measure provided to measure used ribbon Allowable lengths of ribbon providedAllowable lengths of ribbon provided
Purple (Highways/Roadways) = 80 inchesPurple (Highways/Roadways) = 80 inches Orange (Transit) = 40 inchesOrange (Transit) = 40 inches
Allocated ribbon scaled back to allowable lengthsAllocated ribbon scaled back to allowable lengths Resulting prioritized ribbon recorded on plotsResulting prioritized ribbon recorded on plots Prioritization process facilitates understanding of Prioritization process facilitates understanding of
limitationslimitations
16
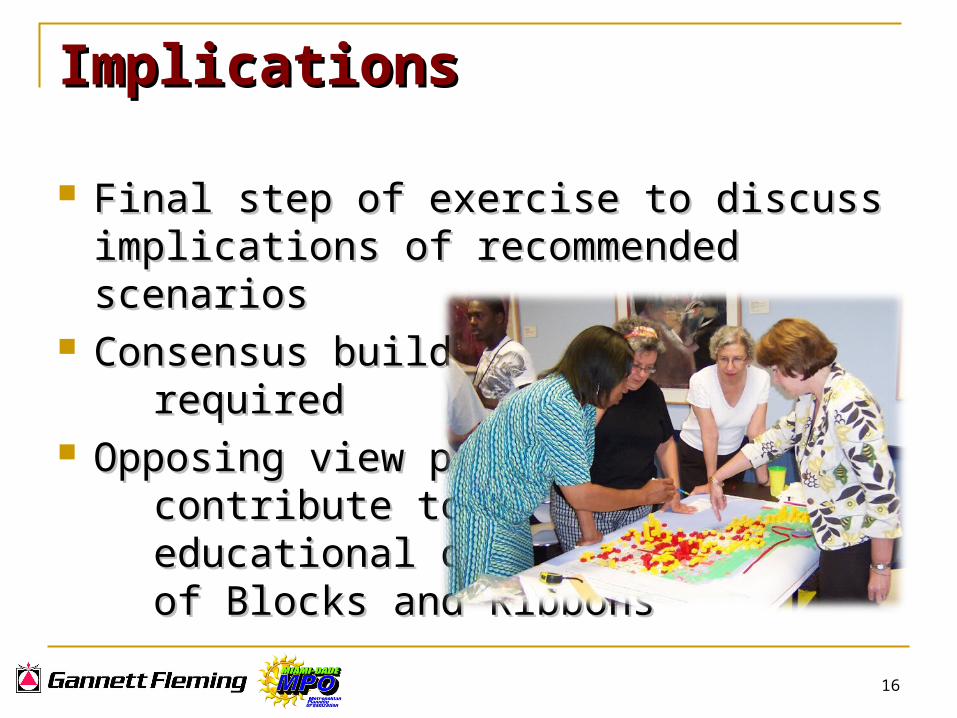
ImplicationsImplications
Final step of exercise to discuss implications of Final step of exercise to discuss implications of recommended scenariosrecommended scenarios
Consensus building Consensus building requiredrequired Opposing view pointsOpposing view points contribute to contribute to educational quality educational quality of Blocks and Ribbonsof Blocks and Ribbons
17
Results of Blocks and RibbonsResults of Blocks and Ribbons Transportation improvement scenarios generalized Transportation improvement scenarios generalized
across 6 workshopsacross 6 workshops Recommended improvements provided to LRTP Recommended improvements provided to LRTP
Steering Committee for their considerationSteering Committee for their consideration
18
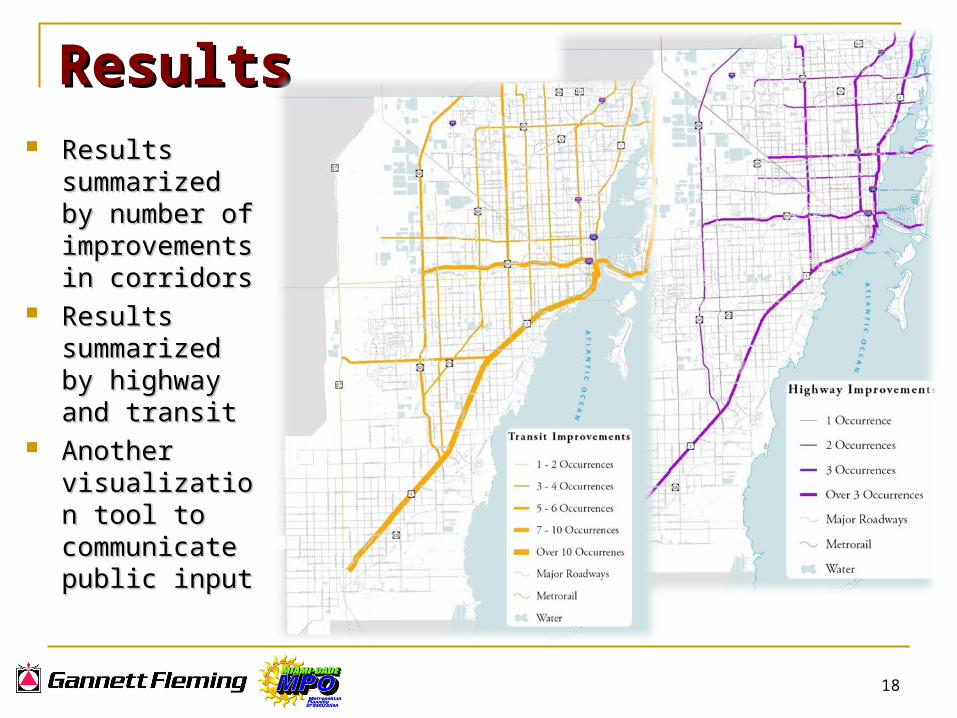
ResultsResults Results summarized Results summarized
by number of by number of improvements in improvements in corridorscorridors
Results summarized Results summarized by highway and by highway and transittransit
Another Another visualization tool to visualization tool to communicate public communicate public inputinput
19
Assessment of Blocks and RibbonsAssessment of Blocks and Ribbons
Well attended workshopsWell attended workshops Positive public responsePositive public response High engagement of participantsHigh engagement of participants Meaningful input from the processMeaningful input from the process
20
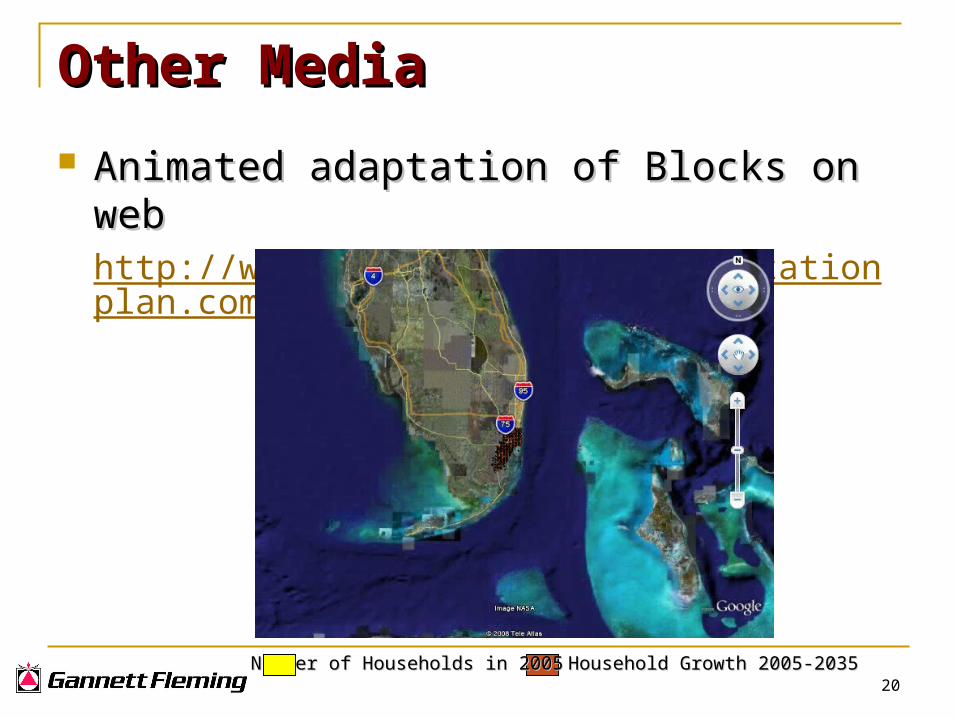
Other MediaOther Media
Animated adaptation of Blocks on webAnimated adaptation of Blocks on webhttp://www.miamidade2035transportationplan.com/public.htm
Number of Households in 2005Number of Households in 2005 Household Growth 2005-2035Household Growth 2005-2035

21
Blocks and RibbonsBlocks and Ribbons
Franco SaracenoFranco [email protected]
813.882.4366813.882.4366