Embed Size (px)
Citation preview
826
Blood Flow in Microvascular NetworksExperiments and Simulation
A.R. Pries, T.W. Secomb, P. Gaehtgens, and J.F. Gross
A theoretical model has been developed to simulate blood flow through large microcirculatorynetworks. The model takes into account the dependence of apparent viscosity of blood on vesseldiameter and hematocrit (the Fahraeus-Lindqvist effect), the reduction of intravascularhematocrit relative to the inflow hematocrit of a vessel (the Fahraeus effect), and thedisproportionate distribution of red blood cells and plasma at arteriolar bifurcations (phaseseparation). The model was used to simulate flow in three microvascular networks in the ratmesentery with 436, 583, and 913 vessel segments, respectively, using experimental data (length,diameter, and topological organization) obtained from the same networks. Measurements ofhematocrit and flow direction in all vessel segments of these networks tested the validity ofmodel results. These tests demonstrate that the prediction of parameters for individual vesselsegments in large networks exhibits a high degree of uncertainty; for example, the squaredcoefficient of correlation between predicted and measured hematocrit of single vessel segmentsranges only between 0.15 and 0.33. In contrast, the simulation of integrated characteristics ofthe network hemodynamics, such as the mean segment hematocrit or the distribution of bloodflow velocities, is very precise. In addition, the following conclusions were derived from thecomparison of predicted and measured values: 1) The low capillary hematocrits found inmesenteric microcirculatory networks as well as their heterogeneity can be explained on thebasis of the Fahraeus effect and phase-separation phenomena. 2) The apparent viscosity ofblood in vessels of the investigated tissue with diameters less than 15 gm is substantially higherthan expected compared with measurements in glass tubes with the same diameter. (CirculationResearch 1990;67:826-834)
In recent years, the fast development of newmethods in microcirculatory research has madeit possible to determine a large number of
rheologically and functionally relevant parameters inindividual microvessels down to the capillary level.On the other hand, it is still very difficult to predictthe functional behavior of a tissue or organ fromprocesses observed on the level of individual vessels.For example, if it were known from intravital micro-scopic observation in a given tissue that following anischemia-reperfusion procedure 20% of the capillaryvessels of a certain diameter are plugged by leuko-cytes, what would be the expected increase in overallresistance to blood flow?
Such questions, which relate to the influence of theangioarchitecture of a network on its hemodynamic
From the Department of Physiology, Freie Universitat Berlin(A.R.P., P.G.), FRG, and the Department of Physiology, Univer-sity of Tucson (T.W.S., J.F.G.), Ariz.
Supported by National Institutes of Health grants HL-17421 andHL-34555 and the Deutsche Forschungsgemeinschaft (Pr 271/1-1and Pr 271/1-2).Address for correspondence: Dr. A.R. Pries, Freie Universitat
Berlin, Department of Physiology, Arnimallee 22, D-1000 Berlin33, FRG.
Received November 6, 1989; accepted May 17, 1990.
and rheological properties, cannot easily beanswered by direct in vivo investigation alone, espe-cially in large networks in which it is impractical tomeasure all relevant quantities. In contrast, a con-ceptual framework is needed that would take intoaccount the effects of the various elementary rheo-logical and hemodynamic factors and processeswithin a complex network and their interactions.Such a framework can be realized in the form oftheoretical models that simulate blood flow throughmicrocirculatory networks and are based on availableexperimental information on elementary rheologicalphenomena. However, any model that simulatesblood flow through the microcirculation must bevalidated by comparison with experimental resultsbefore it can be used to predict the behavior of thenetwork under varying functional conditions.
Therefore, the present study was aimed at devel-oping a theoretical flow model and testing it in atissue that allows the observation of complete micro-circulatory networks. The experimental databaseconsists of complete sets of topological, morpholog-ical, and hemodynamic parameters for all vesselsegments in networks that extend from the maininput and output vessels to the capillary level. This
by guest on June 17, 2018http://circres.ahajournals.org/
Dow
nloaded from
Phes et al Blood Flow in Microcirculatory Networks 827
allows a comparison of measured data with thoseobtained from the corresponding simulation, therebyproviding a critical test of the assumptions underlyingthe theoretical modeling of blood flow. Therefore,the present study represents a major improvement incomparison with previous investigations in whichcomplete sets of morphological, hemodynamic, andrheological parameters were not available and thetopological organization of the networks was notprecisely defined.
Materials and MethodsNetwork Flow Simulation
Several simulations of blood flow in microvesselnetworks have been reported. One method, involvingtracking of individual blood cells, was developed bySchmid-Schonbein et al.1 Subsequently, it was usedby Fenton et a12 to analyze the effect of white bloodcell entrance times in a model for the hamstercremaster muscle microcirculation and by Furmanand Olbricht,3 who simulated the motion of individ-ual red and white blood cells through a small net-work. An alternative approach was described byPapenfuf and Gross,4 who simulated blood flow in aseven-segment microvascular network. They used acontinuum model, in which the red blood cell contentof each segment was represented by a uniformhematocrit. Hematocrit varied from segment to seg-ment due to the effect of phase separation (unevenpartition of hematocrit) at diverging bifurcations,whereas apparent viscosity and the Fahraeus effectvaried as functions of tube diameter, hematocrit, andflow rate, according to in vitro experimental data.The continuum approach was also used by Levin etal5 to investigate the effects of phase separation atbifurcations on the distribution of hematocrit instochastic networks.PapenfuB and Gross6 and Secomb et a17 modified
and extended the original approach to allow simula-tion of much larger networks and to incorporatemore recent data concerning the rheological behav-ior of blood. In the present study, simulations thatmake use of these developments are reported.The network flow simulation provides predictions
of flow rate and hematocrit in each segment, giveninformation on network architecture and rheologicalbehavior of blood. In addition, the inflow and outflowconditions must be defined either by the flow rate orthe pressure at the terminal node for each segmententering or leaving the network, as discussed in detailbelow. The numerical method consists essentially oftwo procedures, which are carried out alternatelyuntil the solution to the governing equations isreached. The first procedure ("linear analysis")involves computation of the flow in each segment andthe pressure at each node, assuming that the rheo-logical parameters are known, including the apparentviscosity in each segment. This is a linear problem ofstandard type,8 and the governing equations are as
Q is flow rate and Ap is pressure drop) is given byPoiseuille's law. Since the sum of the inflows minusthe sum of the outflows at a node must equal zero,the following condition is satisfied at any node atwhich three segments meet:
Ql+Q2+Q3=°=J(Pl -PO) +J2(P2-PO) +J3(P3 -PO)where po is the pressure at the node; Pl, P2, and p3 arethe pressures at the adjacent nodes; Q1, Q2, and Q3are the corresponding segment flows (negative foroutflows from the node); and J1, J2, and J3 are thecorresponding conductances. These relations, whenapplied at every node in the network, yield a systemof linear equations in which the unknowns are thepressures at the nodes. This system is large, butsparse, and is solved efficiently using the iterativemethod of successive overrelaxation.9 At the firstapplication of this procedure, a uniform apparentviscosity is assumed throughout the network. Subse-quently, the final result of the previous linear analysisis used as the starting condition for the iteration.The second procedure ("rheological analysis")
involves computation of the hematocrit and apparentviscosity in each segment, using the flow rates andpressures from the linear analysis. The assignment ofhematocrits is carried out in terms of dischargehematocrits. Conservation of red blood cell andplasma flow rates is applied at every node, and thehematocrit in each segment entering the network isspecified as described below. In addition, a relation isapplied that describes the disproportionate distribu-tion of red blood cells and plasma at nodes corre-sponding to diverging bifurcations (phase separa-tion). This relation gives the hematocrits in the twodaughter segments as a function of the hematocrit inthe parent segment, the flow rates, and the segmentdiameters. Since the hematocrit in each segmentdepends on the phase separation at all upstreambifurcations, the hematocrits at a given node cannotbe computed until all upstream nodes have beenconsidered. To guarantee this, we first perform apartial sorting of the nodes satisfying the conditionthat any two connected nodes appear in order ofdecreasing pressure. The nodes are then consideredfrom high to low pressures along every flow pathway.Once the discharge hematocrit has been computed ineach segment, the apparent viscosity is deducedaccording to an empirical relation for the Fahraeus-Lindqvist effect. The tube hematocrit is estimatedfrom the discharge hematocrit according to anotherempirical relation for the Fahraeus effect.The two procedures (linear and rheological analy-
sis) are applied alternately ("outer" iteration) untilsatisfactory convergence is achieved, typically after20-30 iterations. These procedures were imple-mented using PASCAL language on a personal com-puter. Simulation of flow in a 913-segment networkrequired several minutes of computer time.
Empirical Data InputNetwork data. Male Wistar rats were prepared for
intravital microscopy as described in detail previouslyfollows. T.e- segment conductance Q=Q/Ap, where
by guest on June 17, 2018http://circres.ahajournals.org/
Dow
nloaded from
828 Circulation Research Vol 67, No 4, October 1990
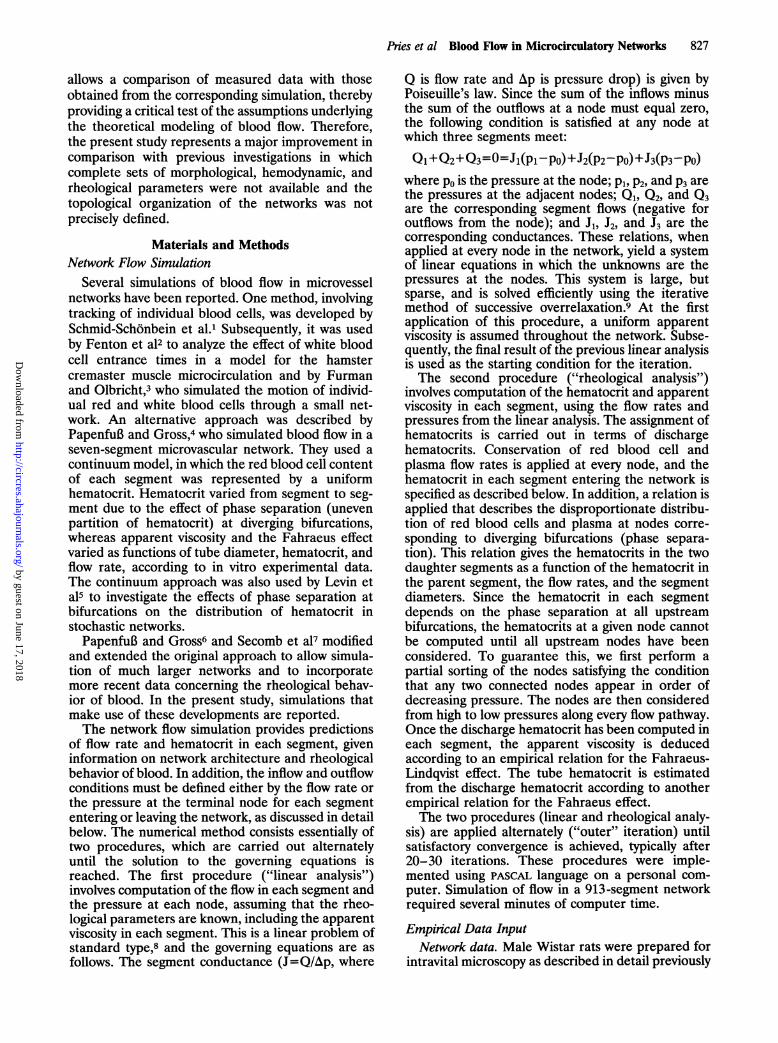
TABLE 1. Evaluation of Boundary Conditions in Three Microvascular Networks in the Rat Mesentery
No. of No. of No. of Starting After modification of Starting After modification ofNetwork segments nodes boundary nodes conditions boundary conditions conditions boundary conditionsA 913 652 65 41 0 30 25B 546 389 36 101 0 39 24c 436 325 50 27 4 16 7
NNEG, nodes with negative pressure values; N1Nv, segments in which calculated and observed flow direction did not agree.
(Pries et al10). Mesenteric areas of 50-80 mm2 werescanned in about 40 minutes, taking both videorecordings and photographs from each field of view.During that time, no change in microvessel diametersdue to change in vascular tone or vasomotion wasobserved. The photographs were assembled into pho-tomontages of the entire networks (up to 300 fields ofview) and were used to determine diameter and lengthfor each vessel segment between two bifurcations.From the corresponding video recordings, tube
hematocrit and discharge hematocrit values weredetermined using a microphotometric method.10,11 Inthose cases where the photographs allowed identifi-cation of individual red blood cells (mostly in thediameter range below 10 ,um), the tube hematocritwas calculated from the number of red blood cellscounted in a vessel segment of known length. Thisvalue was then converted into the discharge hemat-ocrit using compiled literature data on the Fahraeuseffect. The video recordings also served to determineflow direction in every vessel segment.The topological structure of the network was
recorded by labeling each vessel segment and branch-ing point (node) in the network and generating a listof all segments together with the connecting nodes.On the basis of the flow directions in the individualvessel segments, the network was subdivided intoarterial and venous vessel trees.10 The vessel seg-ments connecting arterial and venous vessel treeswere classified as arteriovenous segments. Each seg-ment within the trees was assigned a generationnumber equal to the number of branch pointsbetween that segment and the main vessel feeding ordraining the tree plus one.Network simulations were performed on the basis
of data obtained from three microvessel networks inthe rat mesentery. These networks consisted of 913,546, and 436 segments, respectively, and were eachfed predominantly by one major arteriole (diameter-35 gtm). The inflow hematocrits for the two largernetworks were 0.56 and 0.54; for the smaller network,the inflow hematocrit was 0.31, due to isovolemichemodilution of the animal with hydroxyethyl starchsolution (60 g/l, molecular weight 450.000, Plasmas-teril, Fresenius, Bad Homburg, FRG).Boundary conditions. Although the region scanned
during intravital microscopy was chosen to includefairly self-contained microvessel networks, a numberof small vessels, in addition to the major feedingarterioles and draining venules, inevitably crossed
the boundaries of the selected area. The total num-ber of nodes connected to inflow or outflow segments(boundary nodes) was 65, 36, and 50 for the threenetworks, respectively. To carry out the simulation,values of flow or pressure for the input and outputsegments are required. Since these qualities were notmeasured, appropriate values had to be estimated.While the absolute values of pressures and flows inthe network segments depend on the assumed inputand output values, the distribution of these parame-ters throughout the network is quite independent ofthese assumptions. Furthermore, the main conclu-sions drawn from the analysis do not critically dependon the values chosen, due to the large number ofsegments in each network.
In each network, a pressure of zero was assigned tothe main venular draining segments. Volume flowwas assigned to the main arteriolar input segmentaccording to its diameter, assuming a linear relationbetween internal diameter (D, in micrometers) andaverage blood flow velocity (v, in millimeters persecond):
v=0.4.D- 1.9
This equation was designed to provide values corre-sponding approximately to experimental dataobtained in the cat mesentery.1213 For other inflowand outflow segments, volume flows were assigned bycalculating the average volume flow in the arteriove-nous segments supplied by the main arteriolar feed-ing vessel (flow rate in the main arteriole/number ofarteriovenous segments supplied) and multiplyingthat value with the number of arteriovenous seg-ments supplied or drained by the respective inflow oroutflow.The choice of boundary conditions was checked
with runs of the simulation, assuming zero hemato-crit in all input nodes, to exclude the influence of thelaws that were applied for the Fahraeus-Lindqvisteffect and phase-separation effect. By use of theabove-described procedure to define boundary con-ditions, a substantial number of nodes with negativepressure values (NNEG in Table 1) and segments inwhich calculated and observed flow direction did notagree (NINV in Table 1) were found. The negativepressure values were obviously due to an inappropri-ate choice of boundary conditions, with excessivelyhigh volume flows assigned to some output segments.Therefore, these flows were reduced by multiplying
by guest on June 17, 2018http://circres.ahajournals.org/
Dow
nloaded from
Pries et al Blood Flow in Microcirculatory Networks 829
with factors between 0.85 and 0.2. Flow had to bechanged in approximately 10% of the output seg-ments to reduce the number of nodes with negativepressures to a satisfactory level (Table 1). Thisprocedure also reduced the number of segments withinverted flow direction to 1-4% of the total numberof segments. Extensive tests with additional changesof boundary conditions with both the assumption ofzero hematocrit as well as the use of measuredhematocrit levels for the input segments were per-formed to achieve a further significant reduction inNINV. However, this turned out to be impossible sincethe remaining segments with inverted flow directionswere disseminated over the entire network area.Although the flow direction in each of these seg-ments could individually be changed by appropriateadjustments of boundary conditions, these manipula-tions were accompanied by the generation of addi-tional segments with inverted flow in the adjacentnetwork areas leading to an increase in NINV.
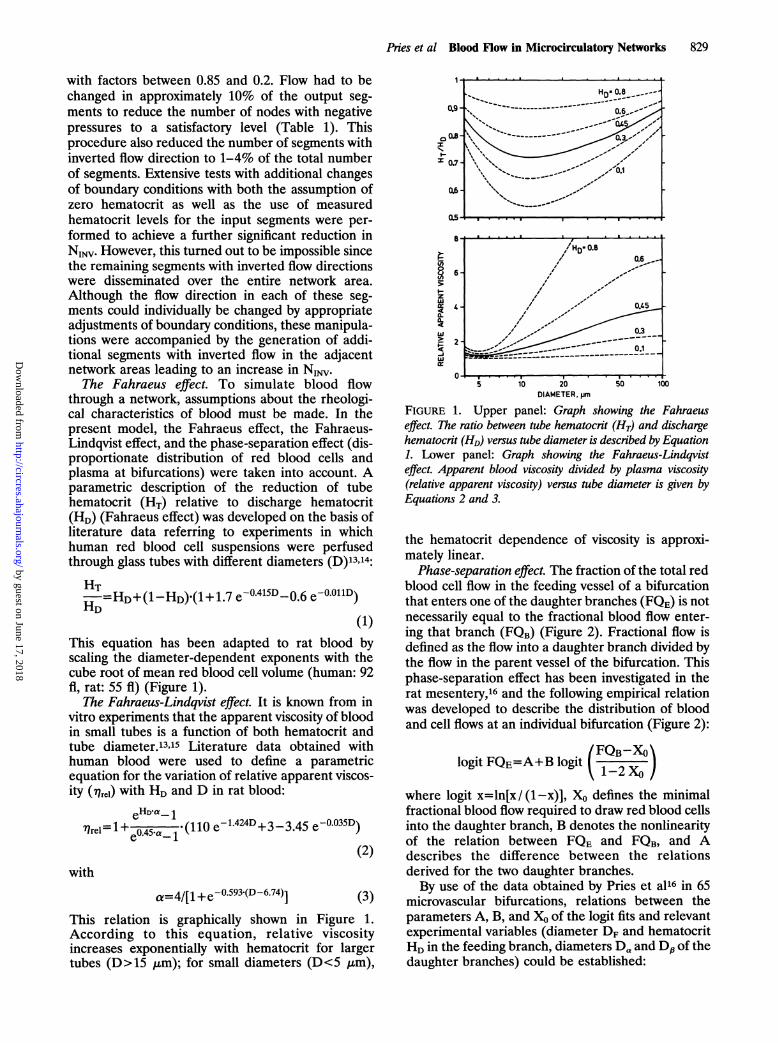
The Fahraeus effect. To simulate blood flowthrough a network, assumptions about the rheologi-cal characteristics of blood must be made. In thepresent model, the Fahraeus effect, the Fahraeus-Lindqvist effect, and the phase-separation effect (dis-proportionate distribution of red blood cells andplasma at bifurcations) were taken into account. Aparametric description of the reduction of tubehematocrit (HT) relative to discharge hematocrit(HD) (Fahraeus effect) was developed on the basis ofliterature data referring to experiments in whichhuman red blood cell suspensions were perfusedthrough glass tubes with different diameters (D)13,14:
HT-=HD+(1-HD)'(1+ 1.7 e-04D 0.6 e0OllD)HD
(1)This equation has been adapted to rat blood byscaling the diameter-dependent exponents with thecube root of mean red blood cell volume (human: 92fil, rat: 55 fl) (Figure 1).
The Fahraeus-Lindqvist effect. It is known from invitro experiments that the apparent viscosity of bloodin small tubes is a function of both hematocrit andtube diameter.13"15 Literature data obtained withhuman blood were used to define a parametricequation for the variation of relative apparent viscos-ity (7qrel) with HD and D in rat blood:
eHD.a- 1l1rel=l 0e045Hal' (110 e-1.424D+3 -3.45 e-0.035D)
(2)
with
a=4/[1 +e-0 593.(D-6.74)] (3)This relation is graphically shown in Figure 1.According to this equation, relative viscosityincreases exponentially with hematocrit for largertubes (D> 15 gm); for small diameters (D<5 gm),
O Q8 -
XO0J -~
0
6-
hi-
zW
4x 4
> 2 -
0iWwr
FIGURE 1.
; . , .o .
5 10 20 50 100
DIAMETER, pm
Upper panel: Graph showing the Fahraeuseffect. The ratio between tube hematocrit (HT) and dischargehematocrit (HD) versus tube diameter is described by Equation1. Lower panel: Graph showing the Fahraeus-Lindqvisteffect. Apparent blood viscosity divided by plasma viscosity(relative apparent viscosity) versus tube diameter is given byEquations 2 and 3.
the hematocrit dependence of viscosity is approxi-mately linear.
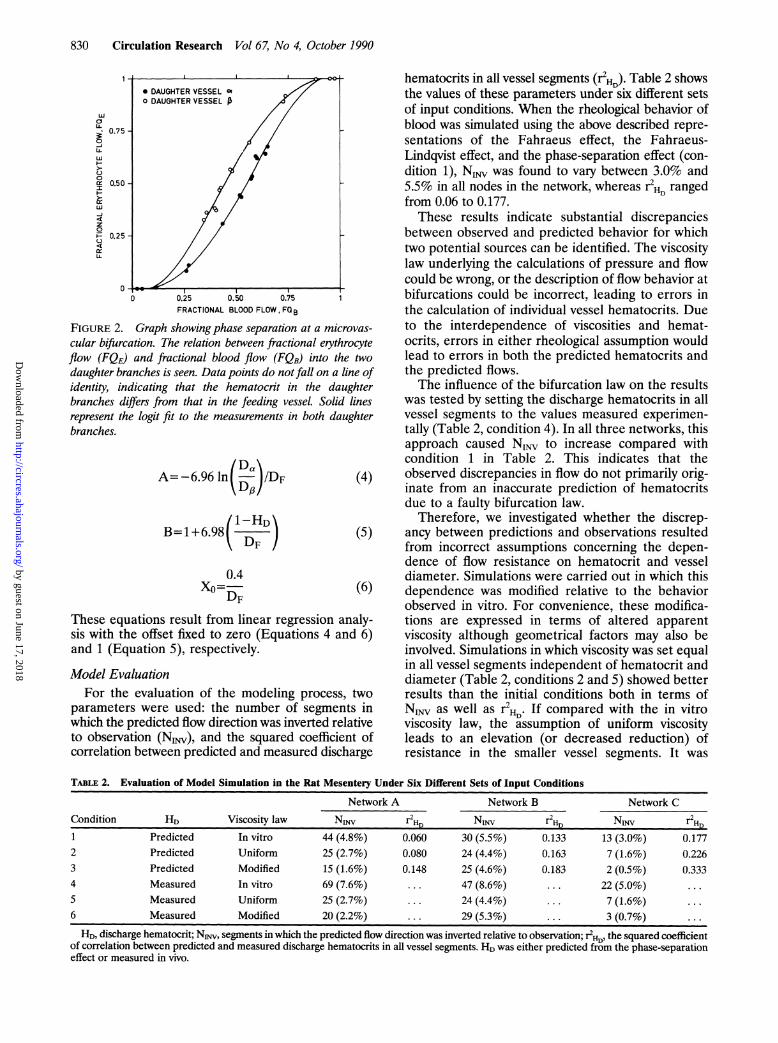
Phase-separation effect. The fraction of the total redblood cell flow in the feeding vessel of a bifurcationthat enters one of the daughter branches (FQE) is notnecessarily equal to the fractional blood flow enter-ing that branch (FQB) (Figure 2). Fractional flow isdefined as the flow into a daughter branch divided bythe flow in the parent vessel of the bifurcation. Thisphase-separation effect has been investigated in therat mesentery,16 and the following empirical relationwas developed to describe the distribution of bloodand cell flows at an individual bifurcation (Figure 2):
logit FQE=A+B logit (FQB-XO
where logit x=ln[x/(1-x)], X< defines the minimalfractional blood flow required to draw red blood cellsinto the daughter branch, B denotes the nonlinearityof the relation between FQE and FQB, and Adescribes the difference between the relationsderived for the two daughter branches.By use of the data obtained by Pries et al16 in 65
microvascular bifurcations, relations between theparameters A, B, and XO of the logit fits and relevantexperimental variables (diameter DF and hematocritHD in the feeding branch, diameters Da and Dp of thedaughter branches) could be established:
HD- 0.8
0.45
02
-0.1---
R ' * * - - . . . .T-U w . ..... ......... . . . . ....
by guest on June 17, 2018http://circres.ahajournals.org/
Dow
nloaded from
830 Circulation Research Vol 67, No 4, October 1990
W
0Li.
0.75-
W
0 .5
Li.
0 0.25 0.50 0.75 1FRACTIONAL BLOOD FLOW, FQOB
FIGURE 2. Graph showing phase separation at a microvas-cular bifurcation. The relation between fractional erythrocyteflow (FQE) and fractional blood flow (FQB) into the twodaughter branches is seen. Data points do not fall on a line ofidentity, indicating that the hematocrit in the daughterbranches differs fiom that in the feeding vessel. Solid linesrepresent the logit fit to the measurements in both daughterbranches.
I~ ~ ~ IA
(DO
~ ~ /- D
DFJ
0.4XO= (6)
DFThese equations result from linear regression analy-sis with the offset fixed to zero (Equations 4 and 6)and 1 (Equation 5), respectively.Model Evaluation
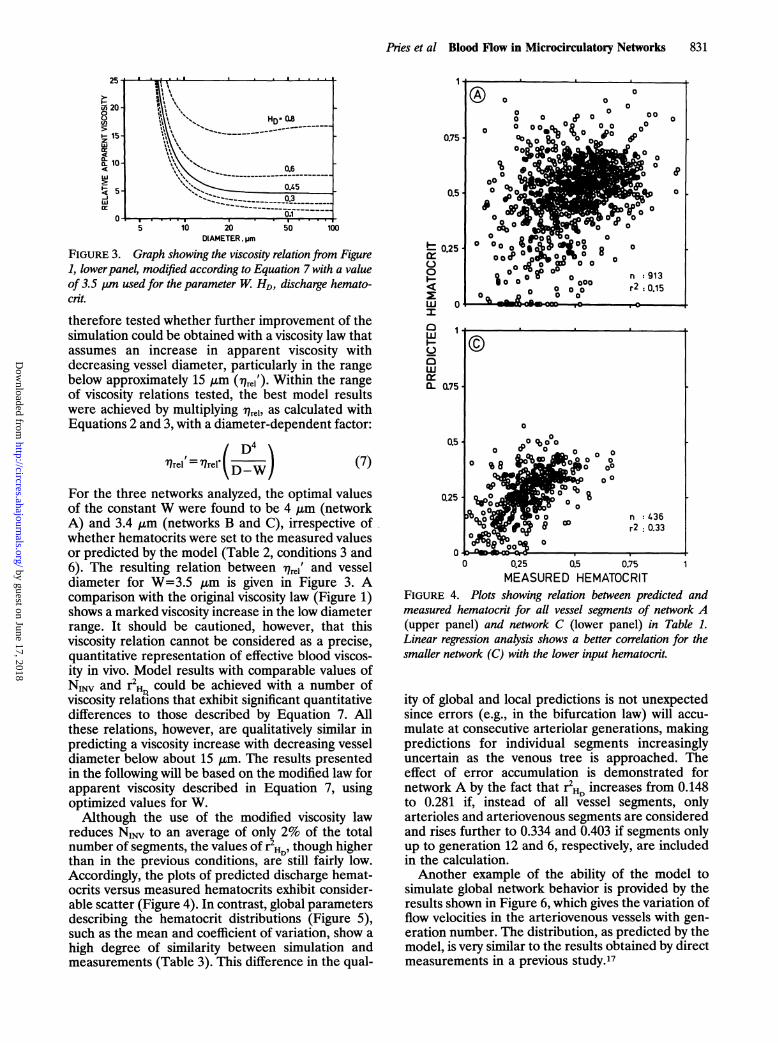
For the evaluation of the modeling process, twoparameters were used: the number of segments inwhich the predicted flow direction was inverted relativeto observation (NINV), and the squared coefficient ofcorrelation between predicted and measured discharge
hematocrits in all vessel segments (r2HD). Table 2 showsthe values of these parameters under six different setsof input conditions. When the rheological behavior ofblood was simulated using the above described repre-sentations of the Fahraeus effect, the Fahraeus-Lindqvist effect, and the phase-separation effect (con-dition 1), NINV was found to vary between 3.0% and5.5% in all nodes in the network, whereas r2HD rangedfrom 0.06 to 0.177.These results indicate substantial discrepancies
between observed and predicted behavior for whichtwo potential sources can be identified. The viscositylaw underlying the calculations of pressure and flowcould be wrong, or the description of flow behavior atbifurcations could be incorrect, leading to errors inthe calculation of individual vessel hematocrits. Dueto the interdependence of viscosities and hemat-ocrits, errors in either rheological assumption wouldlead to errors in both the predicted hematocrits andthe predicted flows.The influence of the bifurcation law on the results
was tested by setting the discharge hematocrits in allvessel segments to the values measured experimen-tally (Table 2, condition 4). In all three networks, thisapproach caused NINV to increase compared withcondition 1 in Table 2. This indicates that theobserved discrepancies in flow do not primarily orig-inate from an inaccurate prediction of hematocritsdue to a faulty bifurcation law.
Therefore, we investigated whether the discrep-ancy between predictions and observations resultedfrom incorrect assumptions concerning the depen-dence of flow resistance on hematocrit and vesseldiameter. Simulations were carried out in which thisdependence was modified relative to the behaviorobserved in vitro. For convenience, these modifica-tions are expressed in terms of altered apparentviscosity although geometrical factors may also beinvolved. Simulations in which viscosity was set equalin all vessel segments independent of hematocrit anddiameter (Table 2, conditions 2 and 5) showed betterresults than the initial conditions both in terms ofNINV as well as r2H. If compared with the in vitroviscosity law, the assumption of uniform viscosityleads to an elevation (or decreased reduction) ofresistance in the smaller vessel segments. It was
TABLE 2. Evaluation of Model Simulation in the Rat Mesentery Under Six Different Sets of Input Conditions
Network A Network B Network CCondition HD Viscosity law NINV r2HD NINV r2DHD1 Predicted In vitro 44 (4.8%) 0.060 30 (5.5%) 0.133 13 (3.0%) 0.1772 Predicted Uniform 25 (2.7%) 0.080 24 (4.4%) 0.163 7 (1.6%) 0.2263 Predicted Modified 15 (1.6%) 0.148 25 (4.6%) 0.183 2 (0.5%) 0.3334 Measured In vitro 69 (7.6%) ... 47 (8.6%) ... 22 (5.0%) ...
5 Measured Uniform 25 (2.7%) ... 24 (4.4%) ... 7 (1.6%) ...
6 Measured Modified 20 (2.2%) ... 29 (5.3%) ... 3 (0.7%)
HD, discharge hematocrit; NINV, segments in which the predicted flow direction was inverted relative to observation; r2HW, the squared coefficientof correlation between predicted and measured discharge hematocrits in all vessel segments. HD was either predicted from the phase-separationeffect or measured in vivo.
by guest on June 17, 2018http://circres.ahajournals.org/
Dow
nloaded from
Pries et al Blood Flow in Microcirculatory Networks 831
20DIAMETER. pm
0.25 0.5 0.75MEASURED HEMATOCRIT
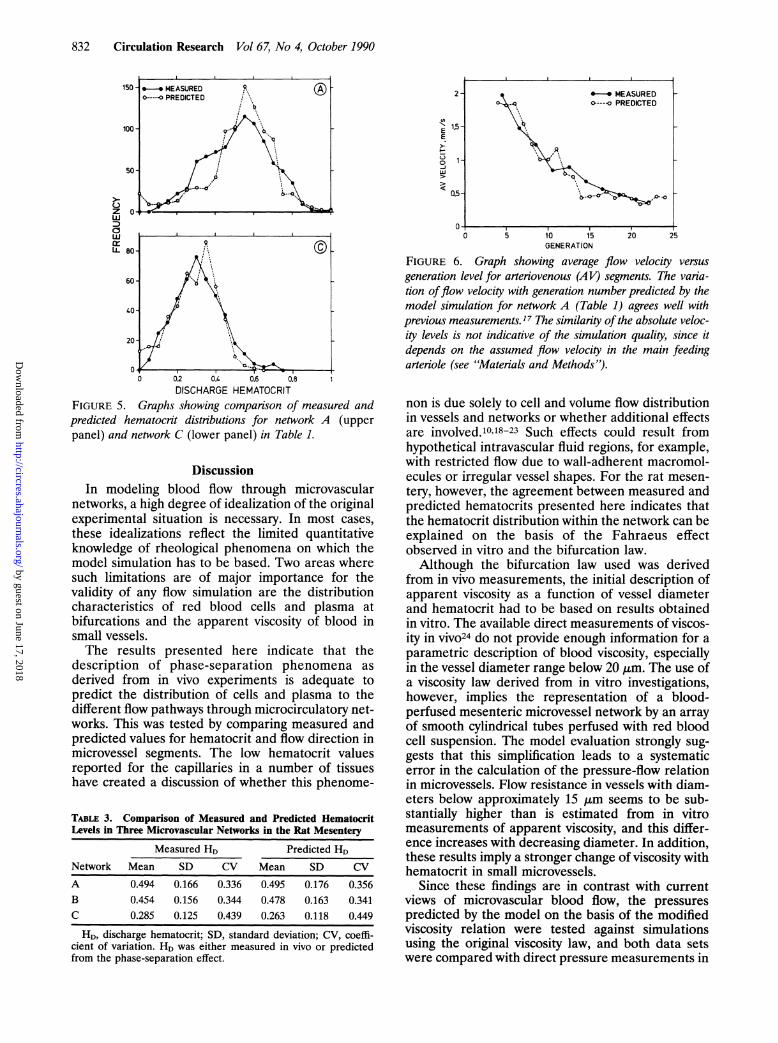
FIGURE 4. Plots showing relation between predicted andmeasured hematocrit for all vessel segments of network A(upper panel) and network C (lower panel) in Table 1.Linear regression analysis shows a better correlation for thesmaller network (C) with the lower input hematocrit.
ity of global and local predictions is not unexpectedsince errors (e.g., in the bifurcation law) will accu-mulate at consecutive arteriolar generations, makingpredictions for individual segments increasinglyuncertain as the venous tree is approached. Theeffect of error accumulation is demonstrated fornetwork A by the fact that r2HD increases from 0.148to 0.281 if, instead of all vessel segments, onlyarterioles and arteriovenous segments are consideredand rises further to 0.334 and 0.403 if segments onlyup to generation 12 and 6, respectively, are includedin the calculation.Another example of the ability of the model to
simulate global network behavior is provided by theresults shown in Figure 6, which gives the variation offlow velocities in the arteriovenous vessels with gen-eration number. The distribution, as predicted by themodel, is very similar to the results obtained by directmeasurements in a previous study.17
0.75
0.5
FIGURE 3. Graph showing the viscosity relation from Figure1, lowerpanel, modified according to Equation 7 with a valueof 3.5 mn used for the parameter W. HD, discharge hemato-crit.
therefore tested whether further improvement of thesimulation could be obtained with a viscosity law thatassumes an increase in apparent viscosity withdecreasing vessel diameter, particularly in the range
below approximately 15 gm (7rei'). Within the rangeof viscosity relations tested, the best model resultswere achieved by multiplying 71rel, as calculated withEquations 2 and 3, with a diameter-dependent factor:
D4
71rel=̀77rel' D-W
= 0.25
0
0
I-
cz
W 07
a
CL 0.75
(7)
For the three networks analyzed, the optimal valuesof the constant W were found to be 4 ,um (networkA) and 3.4 ,um (networks B and C), irrespective ofwhether hematocrits were set to the measured valuesor predicted by the model (Table 2, conditions 3 and6). The resulting relation between 77rei' and vesseldiameter for W=3.5 ,um is given in Figure 3. Acomparison with the original viscosity law (Figure 1)shows a marked viscosity increase in the low diameterrange. It should be cautioned, however, that thisviscosity relation cannot be considered as a precise,quantitative representation of effective blood viscos-ity in vivo. Model results with comparable values ofNINV and r2H could be achieved with a number ofviscosity relations that exhibit significant quantitativedifferences to those described by Equation 7. Allthese relations, however, are qualitatively similar inpredicting a viscosity increase with decreasing vesseldiameter below about 15 gm. The results presentedin the following will be based on the modified law forapparent viscosity described in Equation 7, usingoptimized values for W.Although the use of the modified viscosity law
reduces NINV to an average of only 2% of the totalnumber of segments, the values of r2HD, though higherthan in the previous conditions, are still fairly low.Accordingly, the plots of predicted discharge hemat-ocrits versus measured hematocrits exhibit consider-able scatter (Figure 4). In contrast, global parametersdescribing the hematocrit distributions (Figure 5),such as the mean and coefficient of variation, show a
high degree of similarity between simulation andmeasurements (Table 3). This difference in the qual-
0 0 0\C o o
c°o o ° °o0 00 ~0 00
0 0 00,% ( 0 01 0C%0 0000 9
00
0~~~~~~~~~~
0~~~~~~
Q o 0 0 n :913o o 0 °°0° r2:015
0 j 0 0 0
by guest on June 17, 2018http://circres.ahajournals.org/
Dow
nloaded from
832 Circulation Research Vol 67, No 4, October 1990
2 -
n 15-EE
1-
w
0 02 0.4 0.6 0.8DISCHARGE HEMATOCRIT
FIGURE 5. Graphs showing comparison of measured andpredicted hematocrit distributions for network A (upperpanel) and network C (lower panel) in Table 1.
DiscussionIn modeling blood flow through microvascular
networks, a high degree of idealization of the originalexperimental situation is necessary. In most cases,these idealizations reflect the limited quantitativeknowledge of rheological phenomena on which themodel simulation has to be based. Two areas wheresuch limitations are of major importance for thevalidity of any flow simulation are the distributioncharacteristics of red blood cells and plasma atbifurcations and the apparent viscosity of blood insmall vessels.The results presented here indicate that the
description of phase-separation phenomena asderived from in vivo experiments is adequate topredict the distribution of cells and plasma to thedifferent flow pathways through microcirculatory net-works. This was tested by comparing measured andpredicted values for hematocrit and flow direction inmicrovessel segments. The low hematocrit valuesreported for the capillaries in a number of tissueshave created a discussion of whether this phenome-
TABLE 3. Comparison of Measured and Predicted HematocritLevels in Three Microvascular Networks in the Rat Mesentery
Measured HD Predicted HDNetwork Mean SD CV Mean SD CV
A 0.494 0.166 0.336 0.495 0.176 0.356B 0.454 0.156 0.344 0.478 0.163 0.341C 0.285 0.125 0.439 0.263 0.118 0.449
O0-0 5 10 15 20 25
GENERATION
FIGURE 6. Graph showing average flow velocity versusgeneration level for arteriovenous (AV) segments. The varia-tion offlow velocity with generation number predicted by themodel simulation for network A (Table 1) agrees well withprevious measurements.17 The similarity of the absolute veloc-ity levels is not indicative of the simulation quality, since itdepends on the assumed flow velocity in the main feedingarteriole (see "Materials and Methods").
non is due solely to cell and volume flow distributionin vessels and networks or whether additional effectsare involved.10'18-23 Such effects could result fromhypothetical intravascular fluid regions, for example,with restricted flow due to wall-adherent macromol-ecules or irregular vessel shapes. For the rat mesen-tery, however, the agreement between measured andpredicted hematocrits presented here indicates thatthe hematocrit distribution within the network can beexplained on the basis of the Fahraeus effectobserved in vitro and the bifurcation law.Although the bifurcation law used was derived
from in vivo measurements, the initial description ofapparent viscosity as a function of vessel diameterand hematocrit had to be based on results obtainedin vitro. The available direct measurements of viscos-ity in vivo24 do not provide enough information for aparametric description of blood viscosity, especiallyin the vessel diameter range below 20 gtm. The use ofa viscosity law derived from in vitro investigations,however, implies the representation of a blood-perfused mesenteric microvessel network by an arrayof smooth cylindrical tubes perfused with red bloodcell suspension. The model evaluation strongly sug-gests that this simplification leads to a systematicerror in the calculation of the pressure-flow relationin microvessels. Flow resistance in vessels with diam-eters below approximately 15 ,um seems to be sub-stantially higher than is estimated from in vitromeasurements of apparent viscosity, and this differ-ence increases with decreasing diameter. In addition,these results imply a stronger change of viscosity withhematocrit in small microvessels.
Since these findings are in contrast with currentviews of microvascular blood flow, the pressurespredicted by the model on the basis of the modifiedviscosity relation were tested against simulationsusing the original viscosity law, and both data setswere compared with direct pressure measurements in
*---* MEASURED R"o PREDICTED , \
.'1
11
2 b ' s L~~~~~~~
150 -
100 -
50 -
Z 0tW
0cxIL 80-
*- MEASUREDo----.o PREDICTED
$1
&,,.C_-- a , P.---c
HD, discharge hematocrit; SD, standard deviation; CV, coeffi-cient of variation. HD was either measured in vivo or predictedfrom the phase-separation effect.
0 .- -
by guest on June 17, 2018http://circres.ahajournals.org/
Dow
nloaded from
Pries et al Blood Flow in Microcirculatory Networks 833
60 40 20 0 20 40 60VESSEL DIAMETER,pm
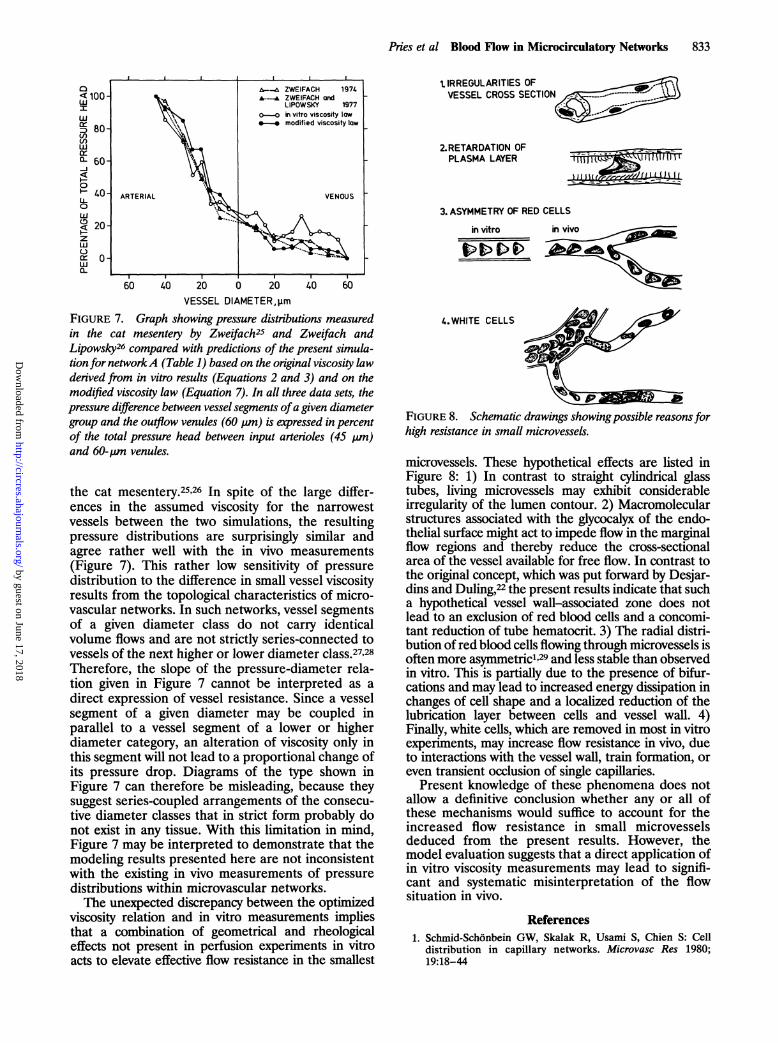
FIGURE 7. Graph showing pressure distributions measuredin the cat mesentery by Zweifach25 and Zweifach andLipowsky26 compared with predictions of the present simula-tion for networkA (Table 1) based on the original viscosity lawderived from in vitro results (Equations 2 and 3) and on themodified viscosity law (Equation 7). In all three data sets, thepressure difference between vessel segments ofa given diametergroup and the outflow venules (60 pum) is expressed in percentof the total pressure head between input arterioles (45 p,m)and 60-pm venules.
the cat mesentery.25'26 In spite of the large differ-ences in the assumed viscosity for the narrowestvessels between the two simulations, the resultingpressure distributions are surprisingly similar andagree rather well with the in vivo measurements(Figure 7). This rather low sensitivity of pressuredistribution to the difference in small vessel viscosityresults from the topological characteristics of micro-vascular networks. In such networks, vessel segmentsof a given diameter class do not carry identicalvolume flows and are not strictly series-connected tovessels of the next higher or lower diameter class.27,28Therefore, the slope of the pressure-diameter rela-tion given in Figure 7 cannot be interpreted as adirect expression of vessel resistance. Since a vesselsegment of a given diameter may be coupled inparallel to a vessel segment of a lower or higherdiameter category, an alteration of viscosity only inthis segment will not lead to a proportional change ofits pressure drop. Diagrams of the type shown inFigure 7 can therefore be misleading, because theysuggest series-coupled arrangements of the consecu-tive diameter classes that in strict form probably donot exist in any tissue. With this limitation in mind,Figure 7 may be interpreted to demonstrate that themodeling results presented here are not inconsistentwith the existing in vivo measurements of pressuredistributions within microvascular networks.The unexpected discrepancy between the optimized
viscosity relation and in vitro measurements impliesthat a combination of geometrical and rheologicaleffects not present in perfusion experiments in vitroacts to elevate effective flow resistance in the smallest
t IRREGULARITIES OFVESSEL CROSS SECTION
2.RETARDATION OFPLASMA LAYER
3. ASYMMETRY OF RED CELLS
in vitro in vivo
4.WHITE CELLS
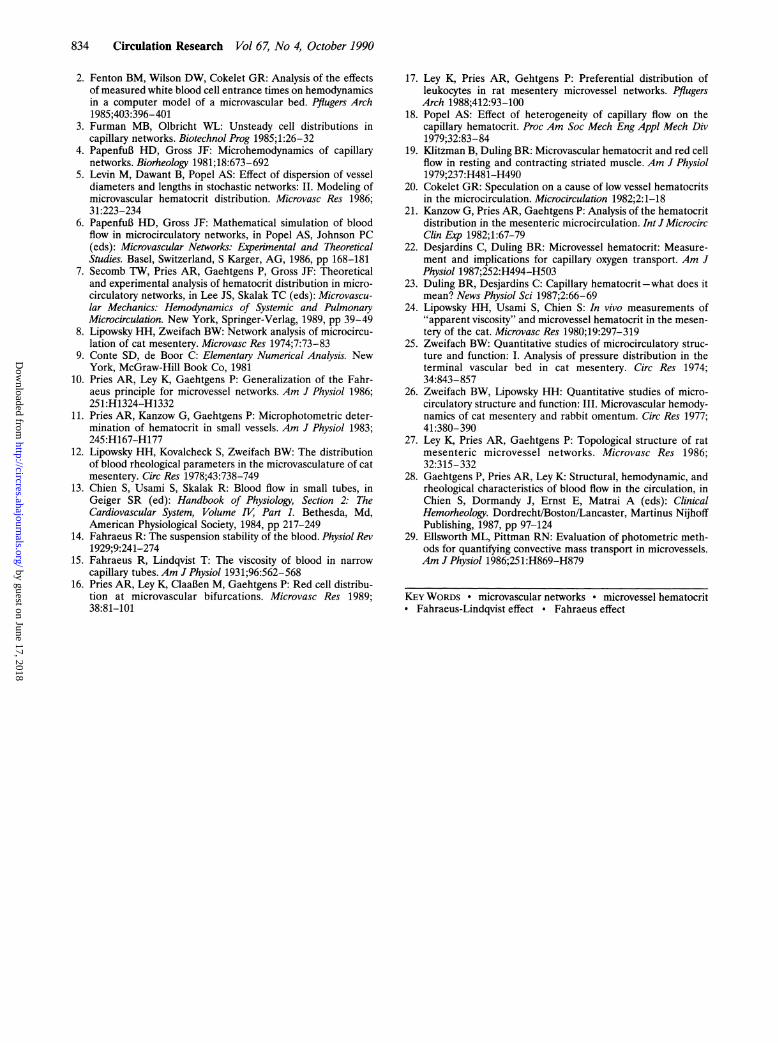
FIGURE 8. Schematic drawings showingpossible reasons forhigh resistance in small microvessels.
microvessels. These hypothetical effects are listed inFigure 8: 1) In contrast to straight cylindrical glasstubes, living microvessels may exhibit considerableirregularity of the lumen contour. 2) Macromolecularstructures associated with the glycocalyx of the endo-thelial surface might act to impede flow in the marginalflow regions and thereby reduce the cross-sectionalarea of the vessel available for free flow. In contrast tothe original concept, which was put forward by Desjar-dins and Duling,22 the present results indicate that sucha hypothetical vessel wall-associated zone does notlead to an exclusion of red blood cells and a concomi-tant reduction of tube hematocrit. 3) The radial distri-bution of red blood cells flowing through microvessels isoften more asymmetricl129 and less stable than observedin vitro. This is partially due to the presence of bifur-cations and may lead to increased energy dissipation inchanges of cell shape and a localized reduction of thelubrication layer between cells and vessel wall. 4)Finally, white cells, which are removed in most in vitroexperiments, may increase flow resistance in vivo, dueto interactions with the vessel wall, train formation, oreven transient occlusion of single capillaries.
Present knowledge of these phenomena does notallow a definitive conclusion whether any or all ofthese mechanisms would suffice to account for theincreased flow resistance in small microvesselsdeduced from the present results. However, themodel evaluation suggests that a direct application ofin vitro viscosity measurements may lead to signifi-cant and systematic misinterpretation of the flowsituation in vivo.
References1. Schmid-Schonbein GW, Skalak R, Usami S, Chien S: Cell
distribution in capillary networks. Microvasc Res 1980;19:18-44
' z------ . wp n-R-
1 1 j t 11 till
1 j i 1 W
by guest on June 17, 2018http://circres.ahajournals.org/
Dow
nloaded from
834 Circulation Research Vol 67, No 4, October 1990
2. Fenton BM, Wilson DW, Cokelet GR: Analysis of the effectsof measured white blood cell entrance times on hemodynamicsin a computer model of a microvascular bed. Pflugers Arch1985;403:396-401
3. Furman MB, Olbricht WL: Unsteady cell distributions incapillary networks. Biotechnol Prog 1985;1:26-32
4. PapenfuB HD, Gross JF: Microhemodynamics of capillarynetworks. Biorheology 1981;18:673-692
5. Levin M, Dawant B, Popel AS: Effect of dispersion of vesseldiameters and lengths in stochastic networks: II. Modeling ofmicrovascular hematocrit distribution. Microvasc Res 1986;31:223-234
6. PapenfuB HD, Gross JF: Mathematical simulation of bloodflow in microcirculatory networks, in Popel AS, Johnson PC(eds): Microvascular Networks: Experimental and TheoreticalStudies. Basel, Switzerland, S Karger, AG, 1986, pp 168-181
7. Secomb TW, Pries AR, Gaehtgens P, Gross JF: Theoreticaland experimental analysis of hematocrit distribution in micro-circulatory networks, in Lee JS, Skalak TC (eds): Microvascu-lar Mechanics: Hemodynamics of Systemic and PulmonaryMicrocirculation. New York, Springer-Verlag, 1989, pp 39-49
8. Lipowsky HH, Zweifach BW: Network analysis of microcircu-lation of cat mesentery. Microvasc Res 1974;7:73-83
9. Conte SD, de Boor C: Elementary Numerical Analysis. NewYork, McGraw-Hill Book Co, 1981
10. Pries AR, Ley K, Gaehtgens P: Generalization of the Fahr-aeus principle for microvessel networks. Am J Physiol 1986;251:H1324-H1332
11. Pries AR, Kanzow G, Gaehtgens P: Microphotometric deter-mination of hematocrit in small vessels. Am J Physiol 1983;245:H167-H177
12. Lipowsky HH, Kovalcheck S, Zweifach BW: The distributionof blood rheological parameters in the microvasculature of catmesentery. Circ Res 1978;43:738-749
13. Chien S, Usami S, Skalak R: Blood flow in small tubes, inGeiger SR (ed): Handbook of Physiology, Section 2: TheCardiovascular System, Volume 1I Part 1. Bethesda, Md,American Physiological Society, 1984, pp 217-249
14. Fahraeus R: The suspension stability of the blood. Physiol Rev1929;9:241-274
15. Fahraeus R, Lindqvist T: The viscosity of blood in narrow
capillary tubes. Am J Physiol 1931;96:562-56816. Pries AR, Ley K, ClaaBen M, Gaehtgens P: Red cell distribu-
tion at microvascular bifurcations. Microvasc Res 1989;38:81-101
17. Ley K, Pries AR, Gehtgens P: Preferential distribution ofleukocytes in rat mesentery microvessel networks. PfiugersArch 1988;412:93-100
18. Popel AS: Effect of heterogeneity of capillary flow on thecapillaiy hematocrit. Proc Am Soc Mech Eng Appl Mech Div1979;32:83-84
19. Klitzman B, Duling BR: Microvascular hematocrit and red cellflow in resting and contracting striated muscle. Am J Physiol1979;237:H481-H490
20. Cokelet GR: Speculation on a cause of low vessel hematocritsin the microcirculation. Microcirculation 1982;2:1-18
21. Kanzow G, Pries AR, Gaehtgens P: Analysis of the hematocritdistribution in the mesenteric microcirculation. Int J MicrocircClin Exp 1982;1:67-79
22. Desjardins C, Duling BR: Microvessel hematocrit: Measure-ment and implications for capillary oxygen transport. Am JPhysiol 1987;252:H494-H503
23. Duling BR, Desjardins C: Capillary hematocrit -what does itmean? News Physiol Sci 1987;2:66-69
24. Lipowsky HH, Usami S, Chien S: In vivo measurements of"apparent viscosity" and microvessel hematocrit in the mesen-tery of the cat. Microvasc Res 1980;19:297-319
25. Zweifach BW: Quantitative studies of microcirculatory struc-ture and function: I. Analysis of pressure distribution in theterminal vascular bed in cat mesentery. Circ Res 1974;34:843-857
26. Zweifach BW, Lipowsky HH: Quantitative studies of micro-circulatory structure and function: III. Microvascular hemody-namics of cat mesentery and rabbit omentum. Circ Res 1977;41:380-390
27. Ley K, Pries AR, Gaehtgens P: Topological structure of ratmesenteric microvessel networks. Microvasc Res 1986;32:315-332
28. Gaehtgens P, Pries AR, Ley K: Structural, hemodynamic, andrheological characteristics of blood flow in the circulation, inChien S, Dormandy J, Ernst E, Matrai A (eds): ClinicalHemorheology. Dordrecht/Boston/Lancaster, Martinus NijhoffPublishing, 1987, pp 97-124
29. Ellsworth ML, Pittman RN: Evaluation of photometric meth-ods for quantifying convective mass transport in microvessels.Am J Physiol 1986;251:H869-H879
KEY WORDS * microvascular networks * microvessel hematocrit* Fahraeus-Lindqvist effect * Fahraeus effect
by guest on June 17, 2018http://circres.ahajournals.org/
Dow
nloaded from
A R Pries, T W Secomb, P Gaehtgens and J F GrossBlood flow in microvascular networks. Experiments and simulation.
Print ISSN: 0009-7330. Online ISSN: 1524-4571 Copyright © 1990 American Heart Association, Inc. All rights reserved.is published by the American Heart Association, 7272 Greenville Avenue, Dallas, TX 75231Circulation Research
doi: 10.1161/01.RES.67.4.8261990;67:826-834Circ Res.
http://circres.ahajournals.org/content/67/4/826World Wide Web at:
The online version of this article, along with updated information and services, is located on the
http://circres.ahajournals.org//subscriptions/
is online at: Circulation Research Information about subscribing to Subscriptions:
http://www.lww.com/reprints Information about reprints can be found online at: Reprints:
document. Permissions and Rights Question and Answer about this process is available in the
located, click Request Permissions in the middle column of the Web page under Services. Further informationEditorial Office. Once the online version of the published article for which permission is being requested is
can be obtained via RightsLink, a service of the Copyright Clearance Center, not theCirculation Researchin Requests for permissions to reproduce figures, tables, or portions of articles originally publishedPermissions:
by guest on June 17, 2018http://circres.ahajournals.org/
Dow
nloaded from