Embed Size (px)
Citation preview
1
Blood from a stone? Using qualitative techniques to understand why households don’t participate in surveys

2
Overview of Methodology
Andrew Zukerberg (NCES), Becca Medway, Melissa Scardaville, Ashley Kaiser, Mahi Megra (AIR)
This presentation is intended to promote ideas. The views expressed are part of ongoing research and do not necessarily reflect the position of the U.S. Department of Education or AIR.

National Household Education Survey (NHES)
3
• Repeated cross-sectional survey
• Address Based Sample fielded in 2012, 2016 and 2019
• Start with approximately 200,000 addresses
• Conducted primarily by mail with push to internet and paper questionnaires
• Two stage survey: first screen household for children under 21 then select a child for topical survey
• Multiple mailings at each stage
• Topical surveys collect data on childcare arrangements, parent involvement in learning, homeschooling and related topics
• Offer a $5 prepaid screener incentive and $5 or $15 topical incentive
• Conducted by NCES through the U.S. Census Bureau

Motivation
4
• Response rates to household surveys including NHES continue to fall• Increasing costs are driving more self-administered modes like paper and web• Frames provide minimal information about address• Appended data is often not accurate and can have a high missing rate• Have tried increasing incentives and other approaches to motivate response• We often don’t hear from over 1/3 of households
– About 10% are Undeliverable As Addressed (UAA)– Are the remainder silent refusals or not occupied addresses?
Goals
5
• Understand characteristics of addresses that did not respond– Are there characteristics that we can observe / measure with this study that are not
directly available on the frame but might be correlated with ones that are available?– Can this information be used to tailor future contact strategies?
• Understand how members of household view research requests• Understand how non-responding households prioritize their time and
the activities they consider most important• Understand how households handle mail
– What happened to NHES:2019 materials once in the house?– Incentives cannot work if envelope is not opened
• Identify the barriers to response

Research Design Overview
6
• Utilized two approaches:– Observations – In depth qualitative interviews
• Observations– Answer questions specifically about characteristics of the address
• Was it vacant?• Did it appear children lived there?• Were there commonalities across the addresses?
• In depth qualitative interviews– Focused on understanding the context of non responding households– Who opens our mail? Why or why wasn’t it opened?
Why Two Approaches?
7
• Complementary approaches– Address observations could be conducted at more sites– Address observations allowed field staff to focus on characteristics of the
address (e.g., where is mail received, Is UAA status impacted by this?) – Provided more quantifiable data about the address– In depth qualitative interviews provided rich details, as well as
observation within the household (e.g, what does household do with mail? why? How were our mailings perceived?)
Observation Site Selection
8
• Total of 760 addresses selected for observation across seven sites– 400 for in depth qualitative interview recruitment– 360 for observation only
• Three sites selected for observation only based on proximity to observers
– Texas, Illinois, Washington, DC area– Addresses were non respondents or soft refusal before the fourth mailing– Subsample had at least one mailing returned as UAA and at least one not returned UAA – 100 non-UAA selected and 20 partial-UAA selected per site (120 addresses total)
• Four sites selected for in depth qualitative interviews– Constrained to four sites and 100 observations per site by budget– Represented four Census regions (Northeast, Midwest, South, and West)– Expect at least 100 eligible cases within a 30 mile radius– Ensure that at least 100 addresses from key nonresponding subgroups could be sampled across the 4 sites (Hispanic
households, households with children, low education household)

Sites Selected
Texas observation
OhioConnecticut
Washington, D.C.
Illinois
CaliforniaTexas
interview
Selection of Cases Within Sites
10
• Addresses needed to meet all the following criteria to be eligible:– Lie within a 30-mile radius of the site’s center, as defined by
latitude/longitude– A non respondent after the third NHES screener mailing– Not a drop point address, P.O. box, or rural route address – Not a hard refusal or an ineligible address
• Eligible addresses were put into strata by crossing the sampling frame data about Hispanic status, presence of children in the hh, and if the head of household has a high school diploma
• Within each stratum, a systematic random sample was selected after sorting on an indicator for multi-unit dwellings and then on the nine-digit ZIP code.
Observation sites:• Sampled 100 non UAA and 20 addresses with a UAA
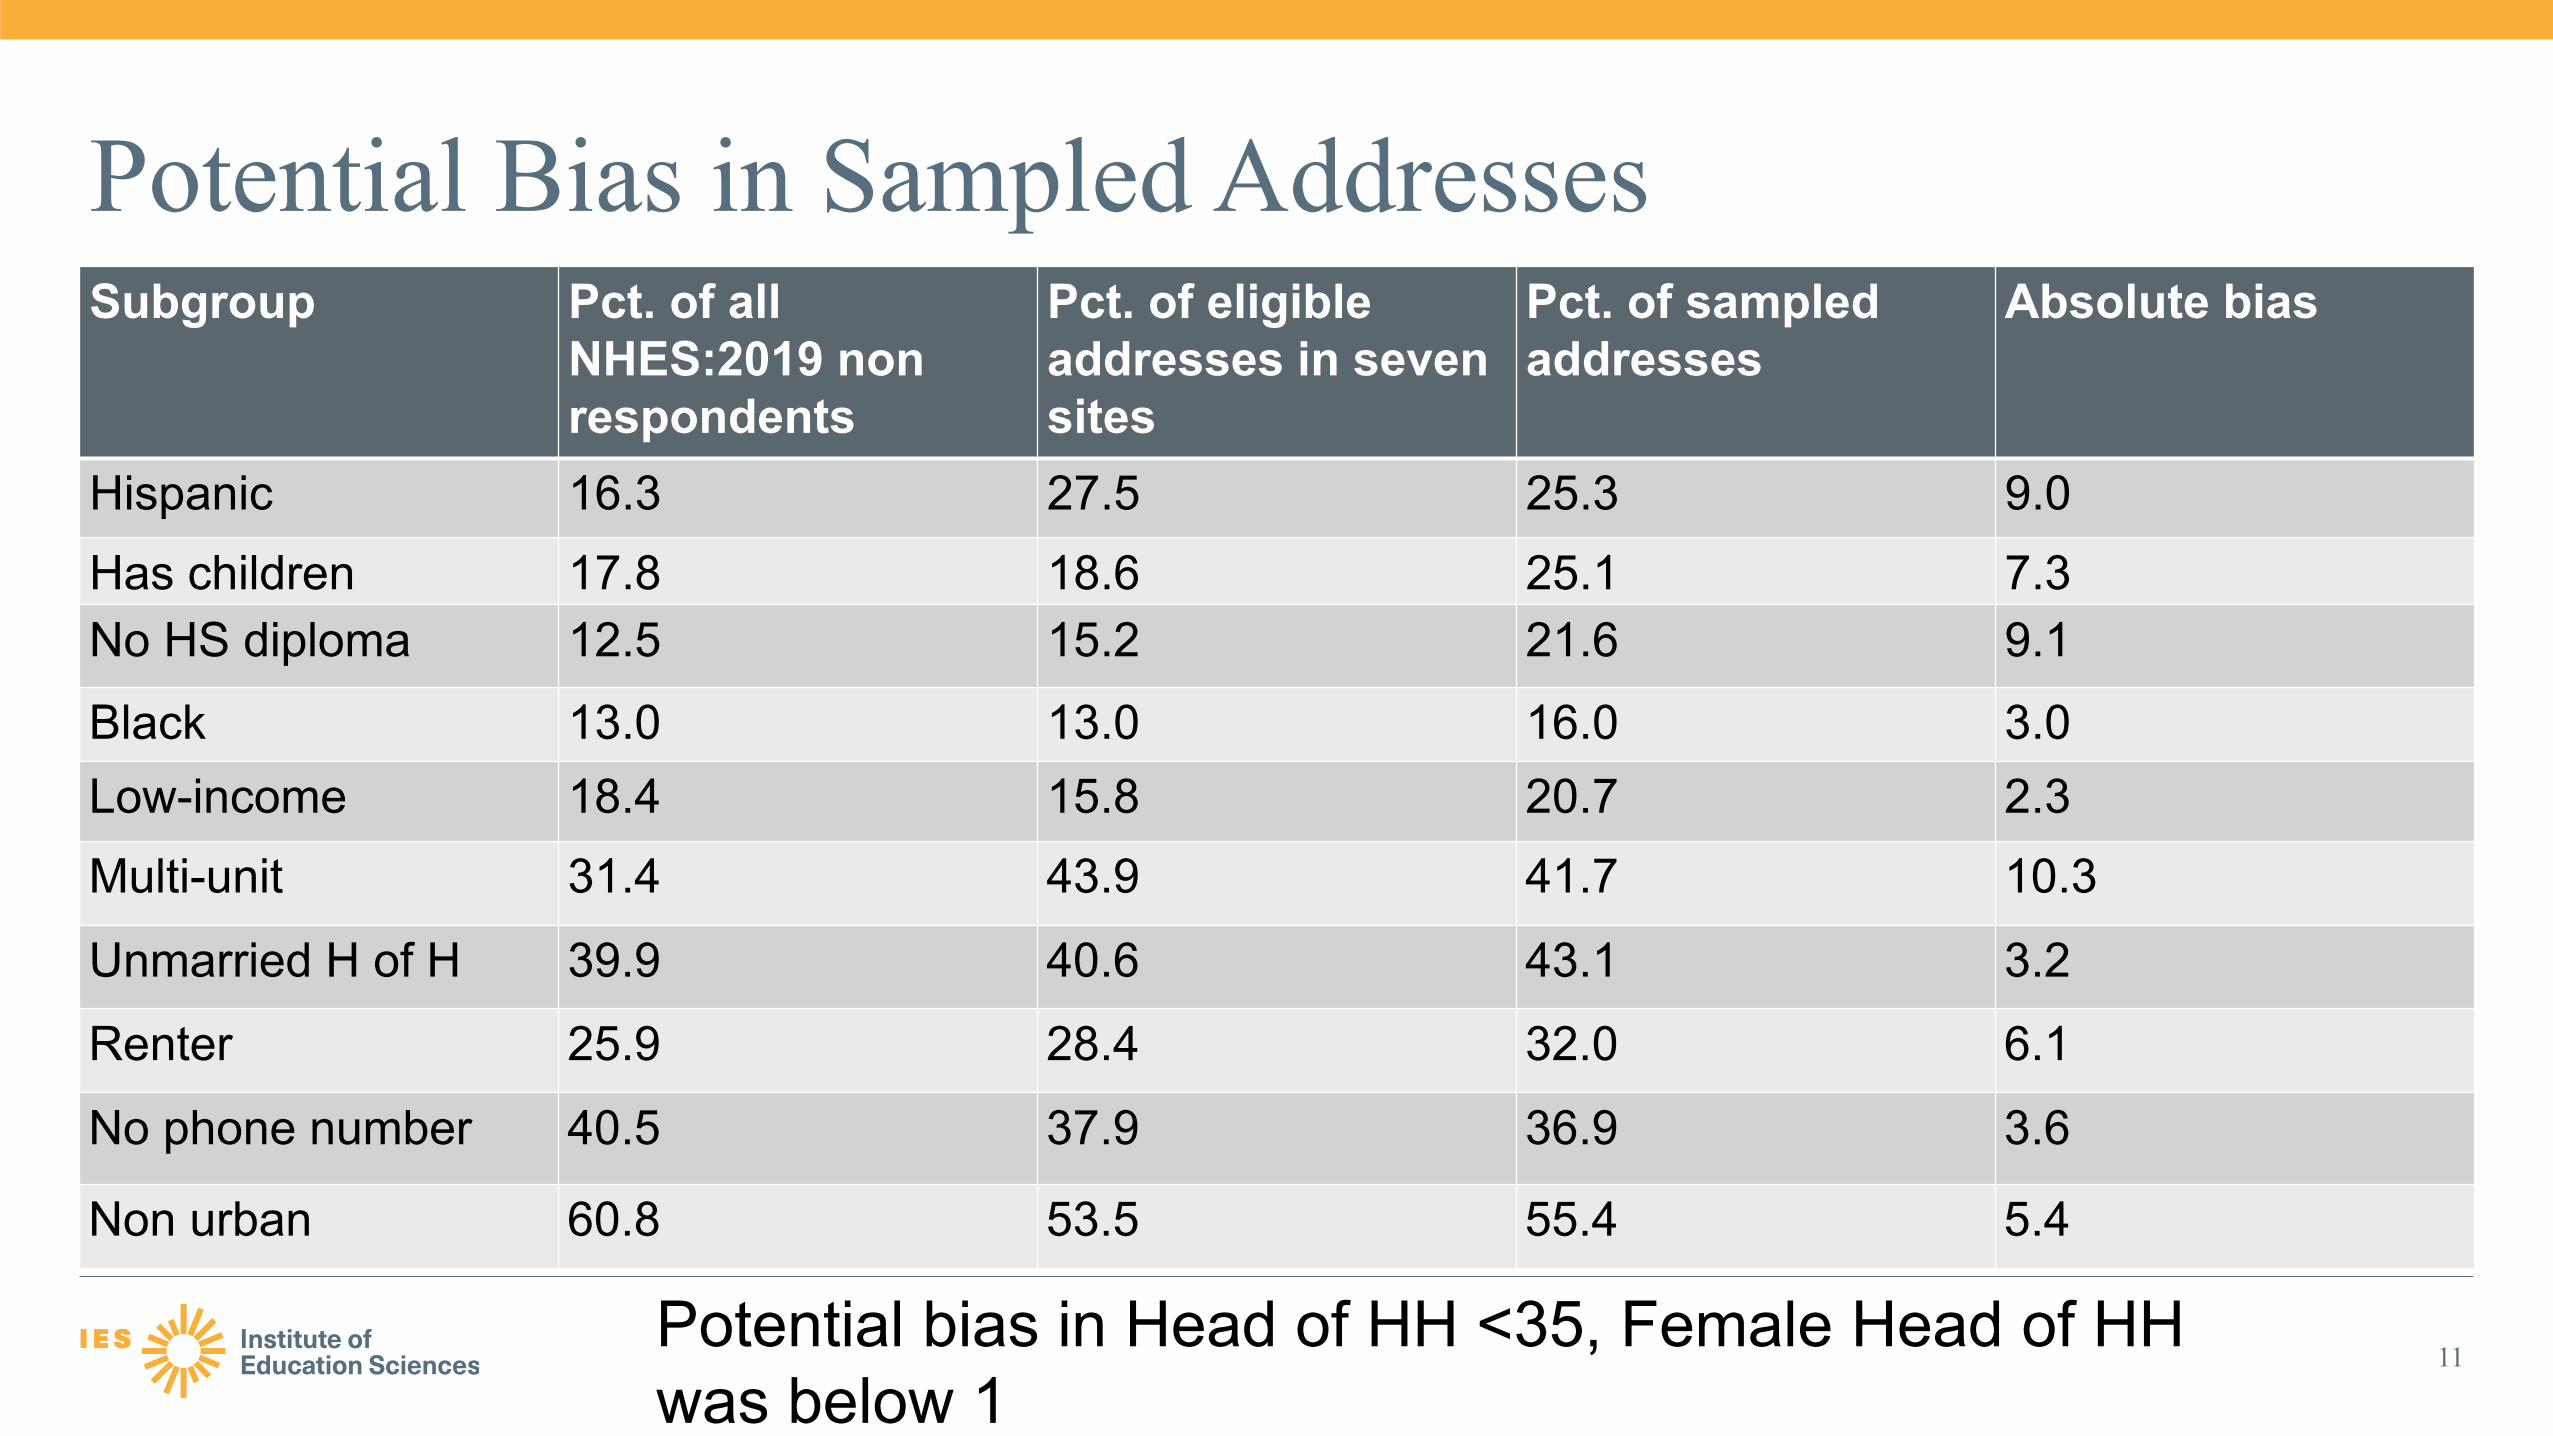
11
Subgroup Pct. of all NHES:2019 non respondents
Pct. of eligible addresses in seven sites
Pct. of sampled addresses
Absolute bias
Hispanic 16.3 27.5 25.3 9.0Has children 17.8 18.6 25.1 7.3No HS diploma 12.5 15.2 21.6 9.1
Black 13.0 13.0 16.0 3.0Low-income 18.4 15.8 20.7 2.3Multi-unit 31.4 43.9 41.7 10.3
Unmarried H of H 39.9 40.6 43.1 3.2
Renter 25.9 28.4 32.0 6.1
No phone number 40.5 37.9 36.9 3.6
Non urban 60.8 53.5 55.4 5.4
Potential Bias in Sampled Addresses
Potential bias in Head of HH <35, Female Head of HH was below 1
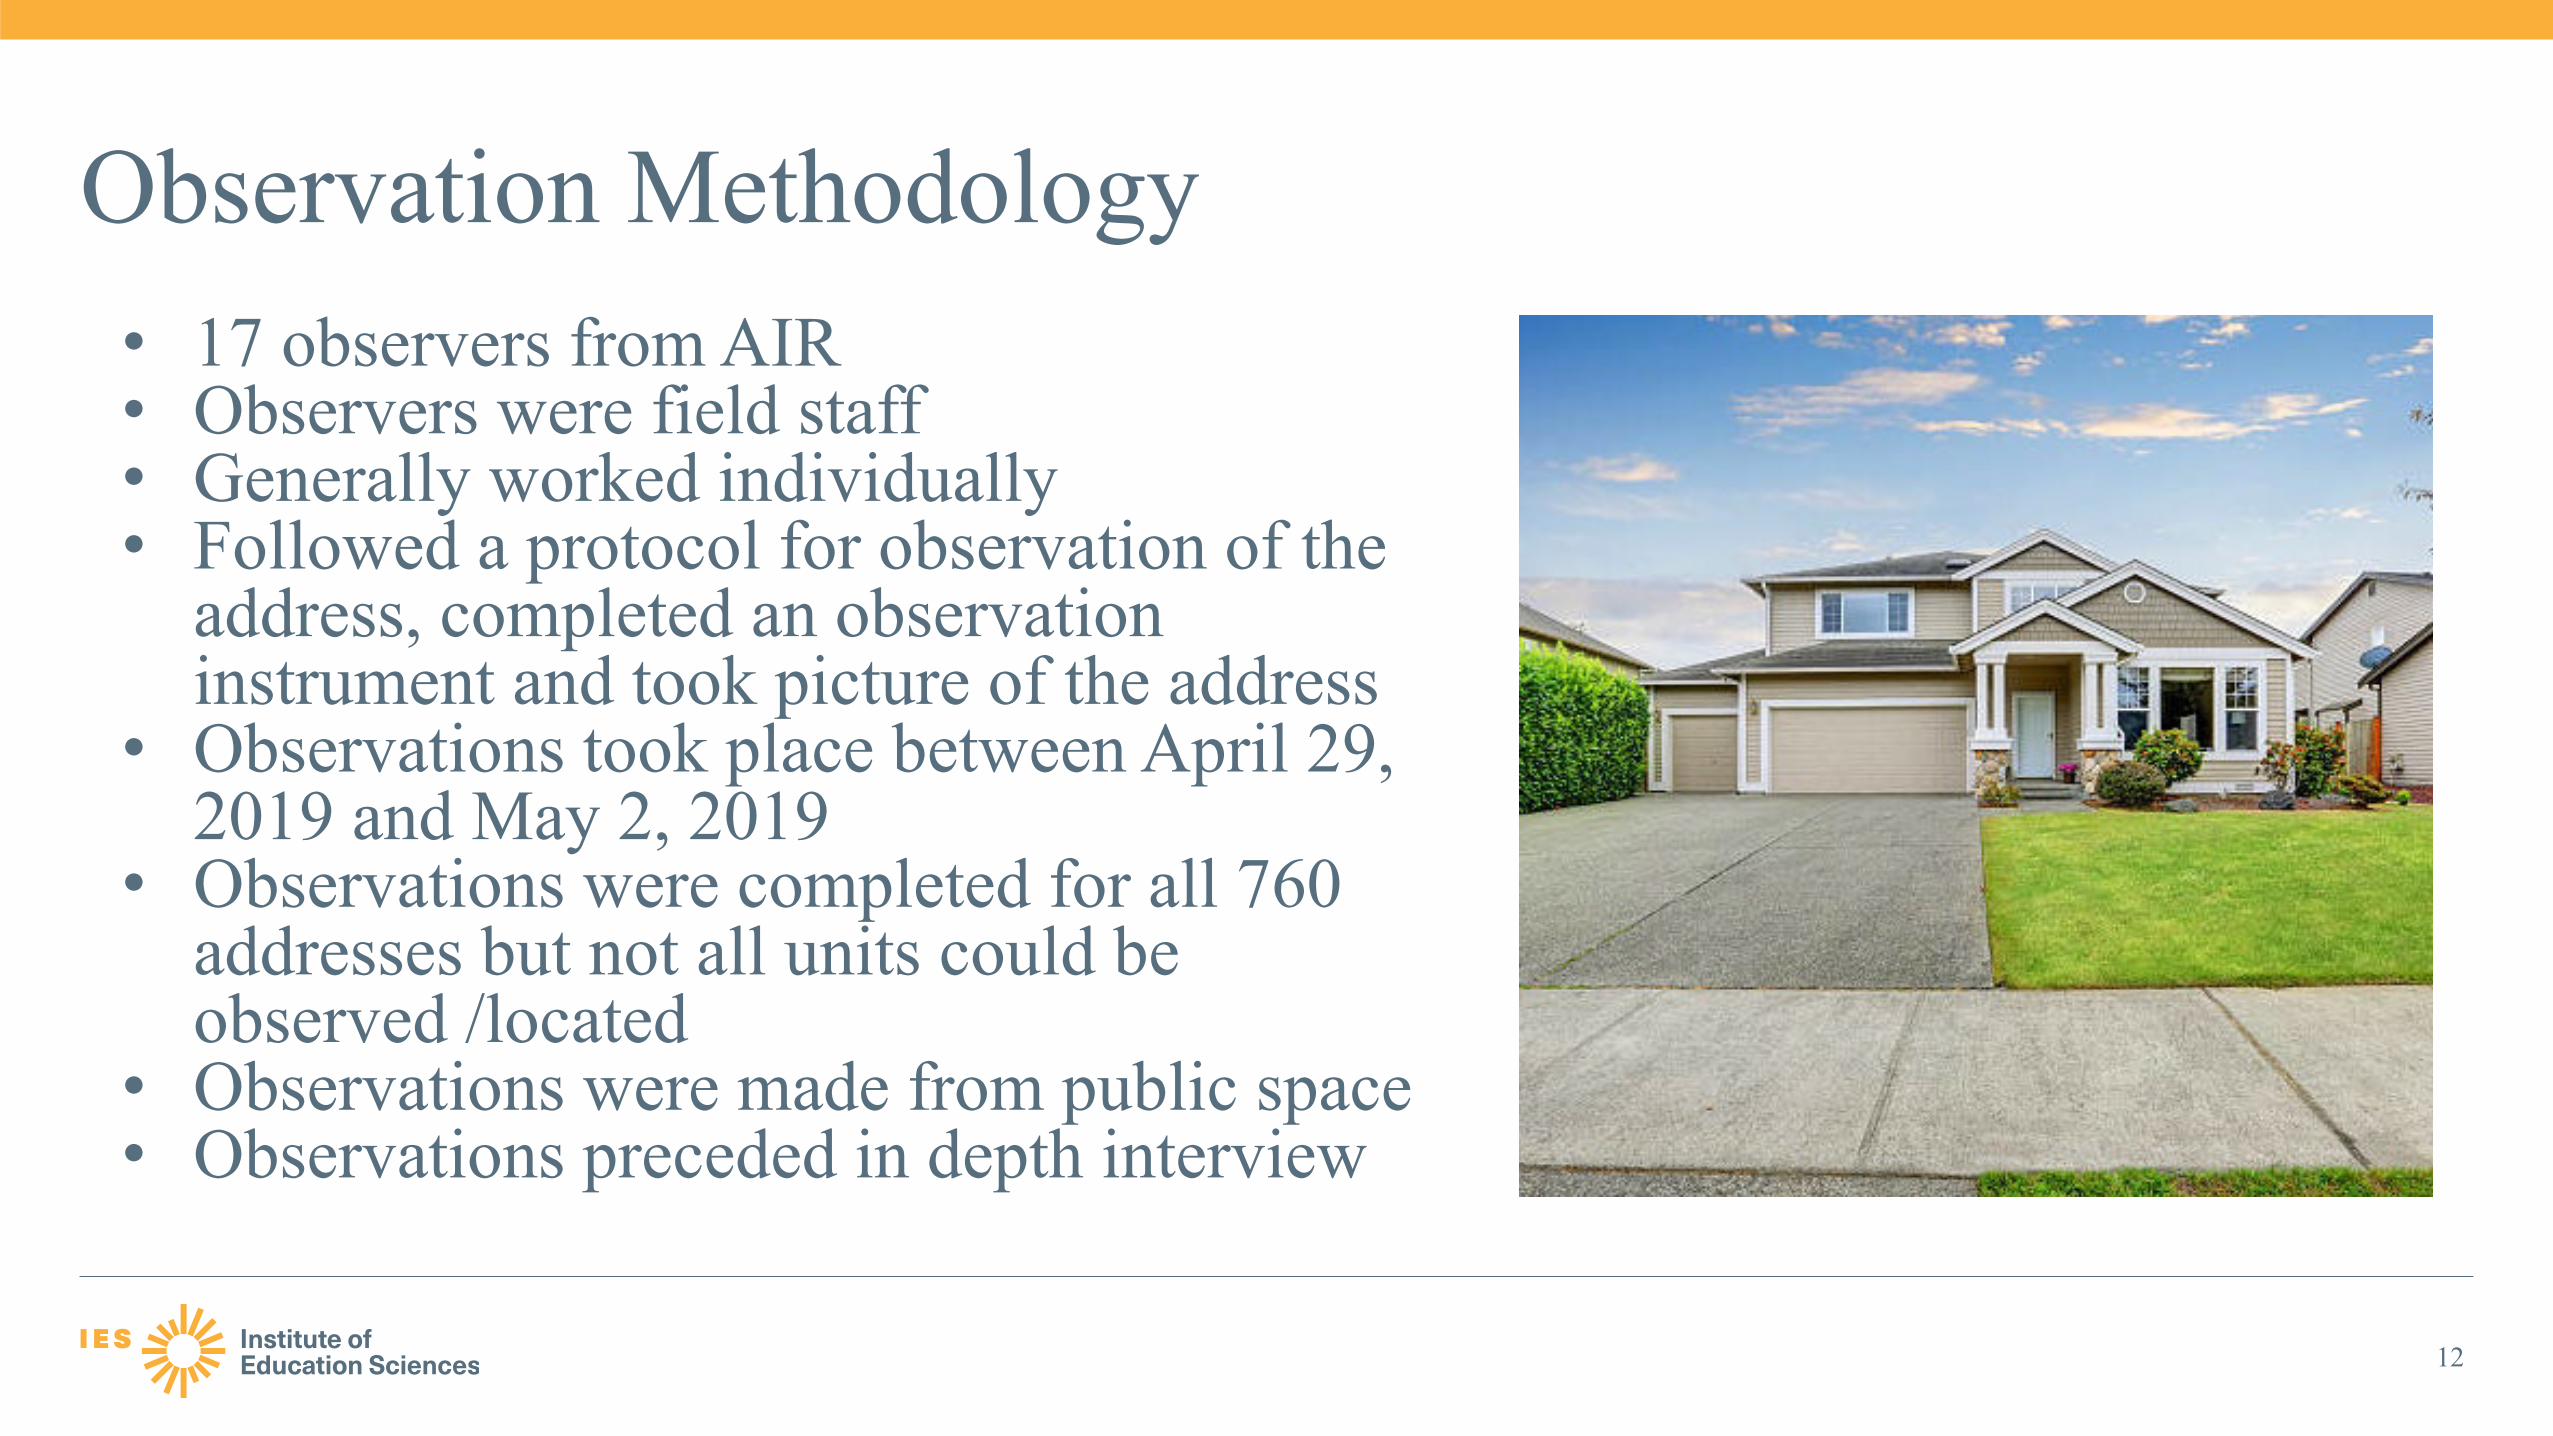
Observation Methodology
12
• 17 observers from AIR • Observers were field staff• Generally worked individually• Followed a protocol for observation of the
address, completed an observation instrument and took picture of the address
• Observations took place between April 29, 2019 and May 2, 2019
• Observations were completed for all 760 addresses but not all units could be observed /located
• Observations were made from public space• Observations preceded in depth interview
Observation Instrument
13
Observers followed structured instrument to capture information about:• Whether address could be located / observed• Type of housing unit• Occupancy status• Mail access• Indications of children at address• Unique attributes of housing unit ( indicators of
pride in education, community involvement, privacy, patriotism, language spoken, etc.)
• Income• General description of the neighborhood• Many write in items to describe address and
household
Recruiting for In depth Interviews
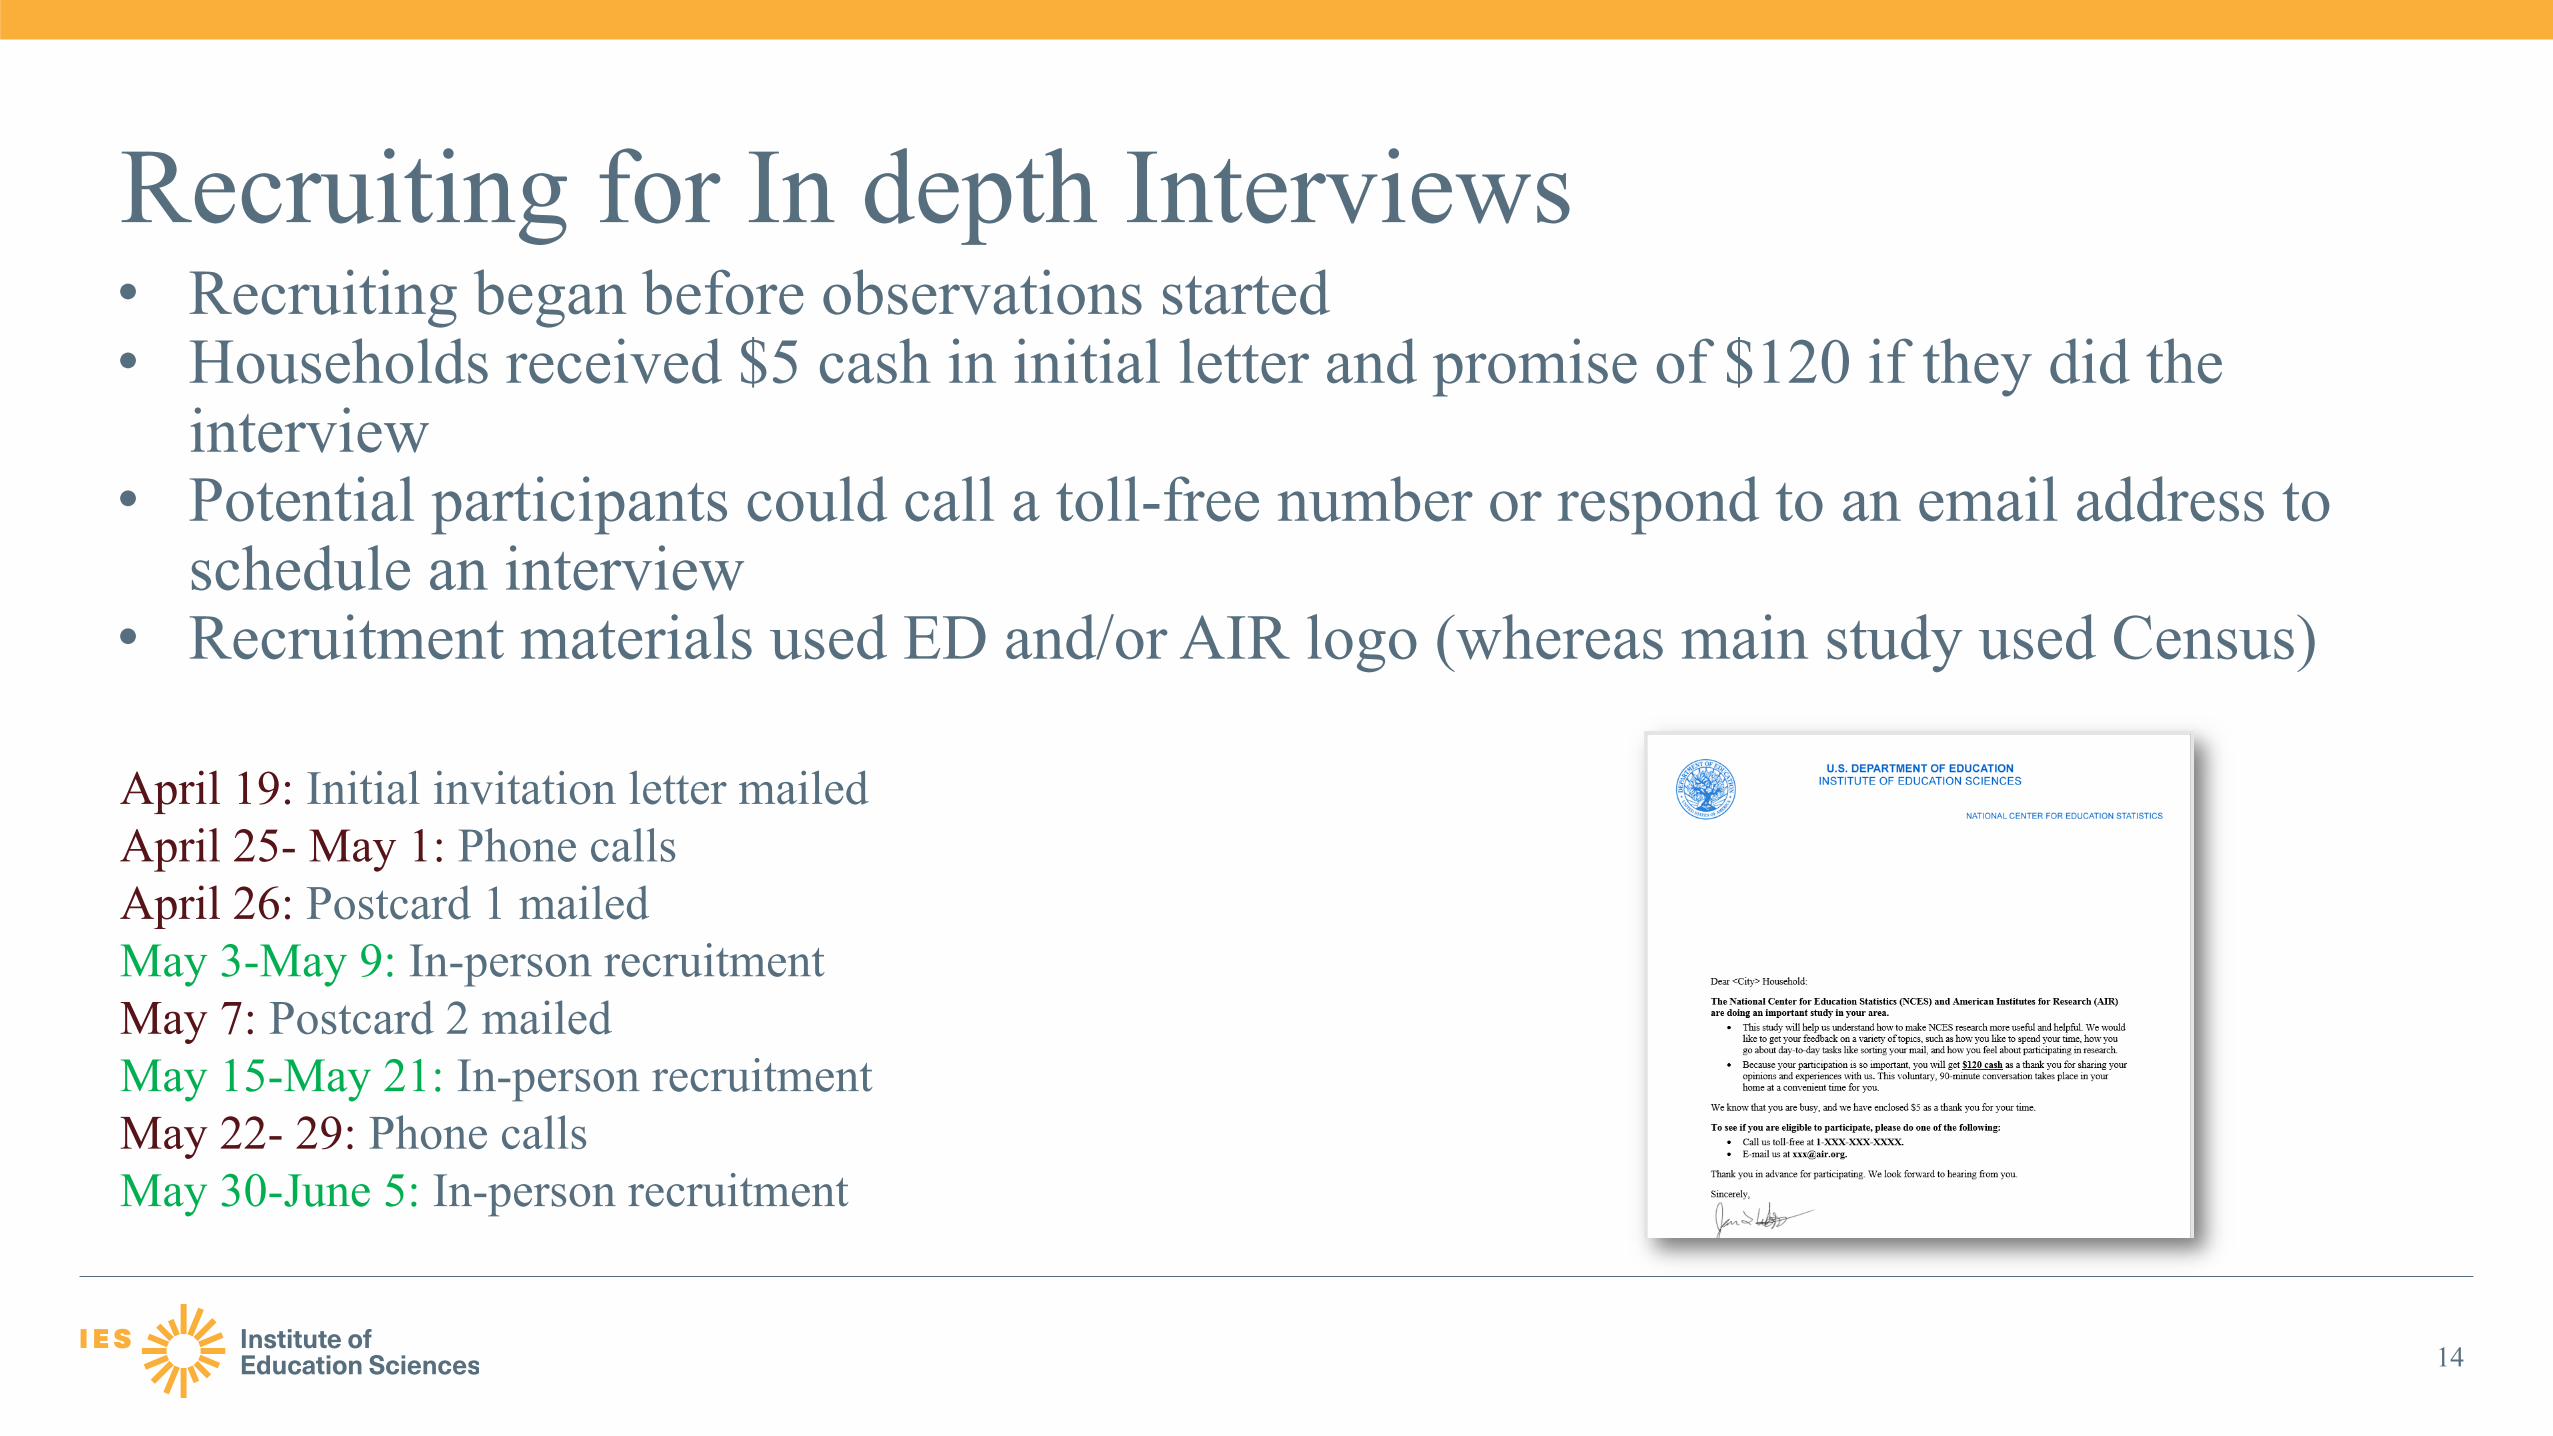
14
• Recruiting began before observations started• Households received $5 cash in initial letter and promise of $120 if they did the
interview• Potential participants could call a toll-free number or respond to an email address to
schedule an interview• Recruitment materials used ED and/or AIR logo (whereas main study used Census)
April 19: Initial invitation letter mailedApril 25- May 1: Phone callsApril 26: Postcard 1 mailedMay 3-May 9: In-person recruitmentMay 7: Postcard 2 mailedMay 15-May 21: In-person recruitmentMay 22- 29: Phone calls May 30-June 5: In-person recruitment
Interviewing
15
Two teams each composed of a Senior Researcher and Field Staff were assigned to each site• Senior Researchers had extensive qualitative
interviewing experience and received training on the goals and methodology of the non-response study
Interviewers visited each site 3 times and stayed at the site for a week each time
The teams conducted interviews and worked to recruit other sampled addresses while on site
Study participants needed to speak English or Spanish and have some involvement in handling the household’s mail
Results of Recruiting Effort
16
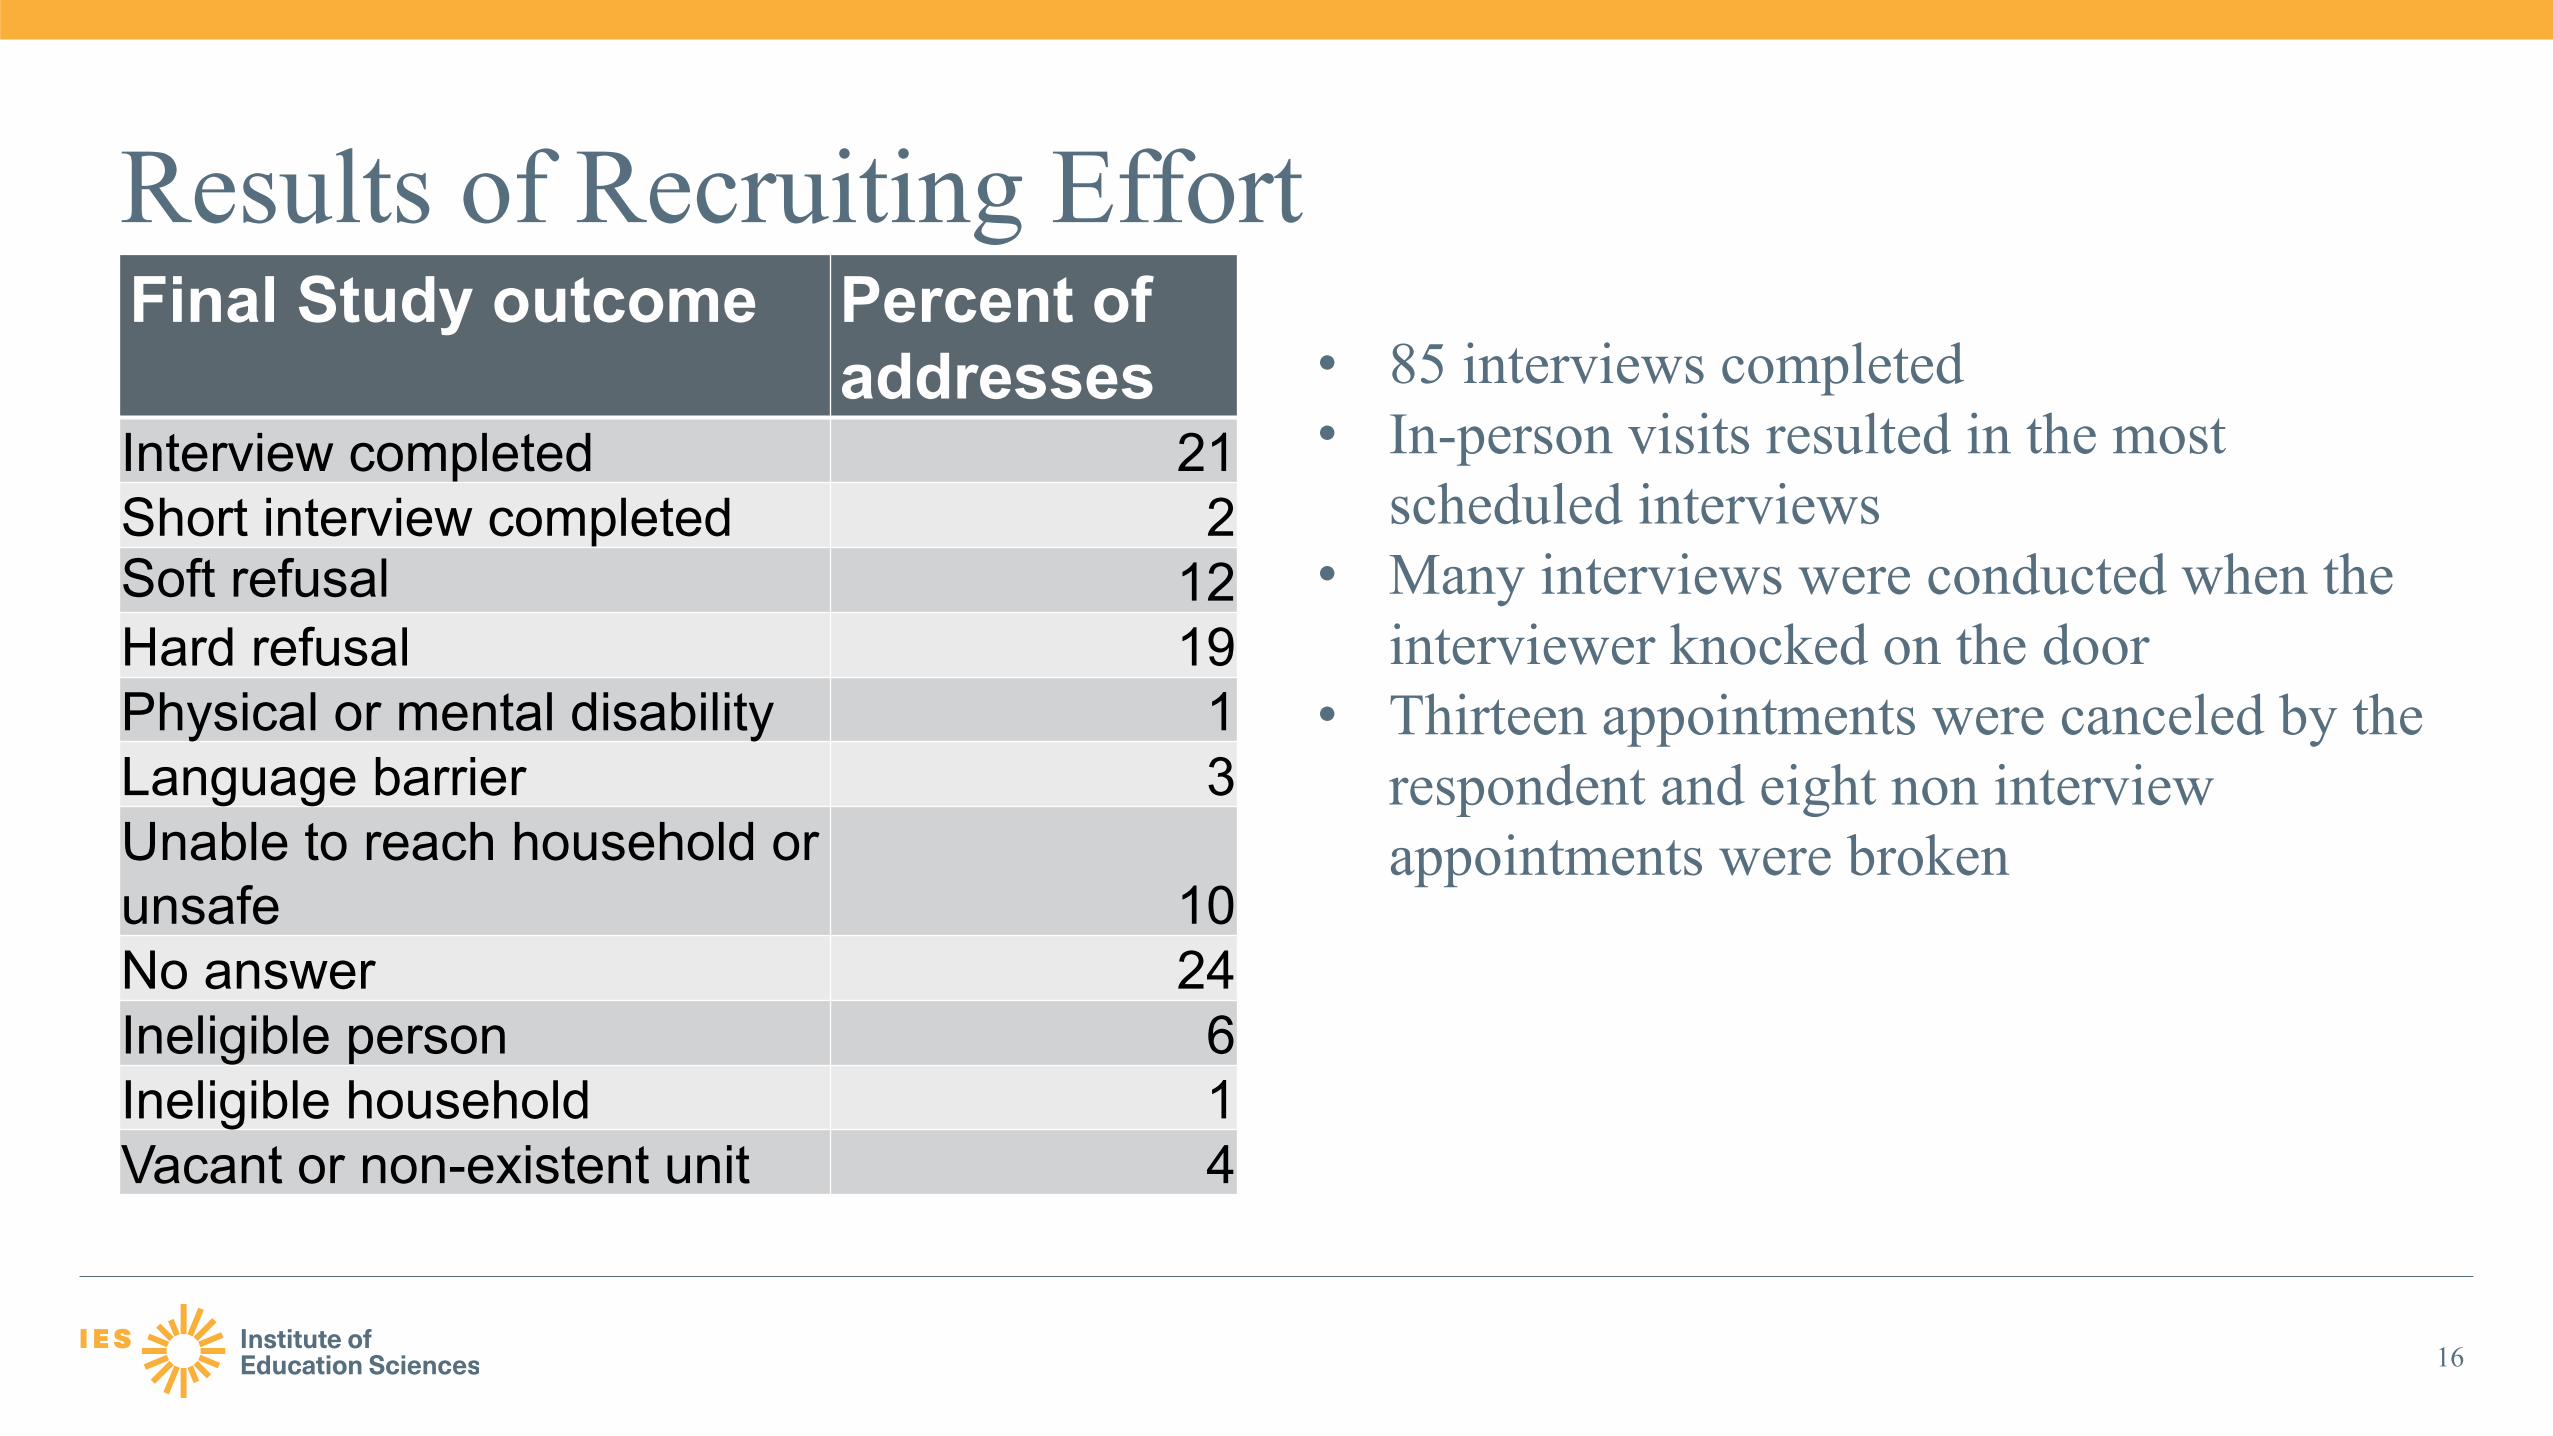
Final Study outcome Percent of addresses
Interview completed 21Short interview completed 2Soft refusal 12Hard refusal 19Physical or mental disability 1Language barrier 3Unable to reach household or unsafe 10No answer 24Ineligible person 6Ineligible household 1Vacant or non-existent unit 4
• 85 interviews completed• In-person visits resulted in the most
scheduled interviews• Many interviews were conducted when the
interviewer knocked on the door• Thirteen appointments were canceled by the
respondent and eight non interview appointments were broken

17
In depth Interview Overview 90 minutes long with a shorter doorstep option
Most took place in participant’s house
Conducted in English or Spanish
Audio recorded with participant’s permission and fully transcribed
Team prepared a memo of each interview which included in home
observations and themes that might not directly appear in the transcript
In depth Interviews
18
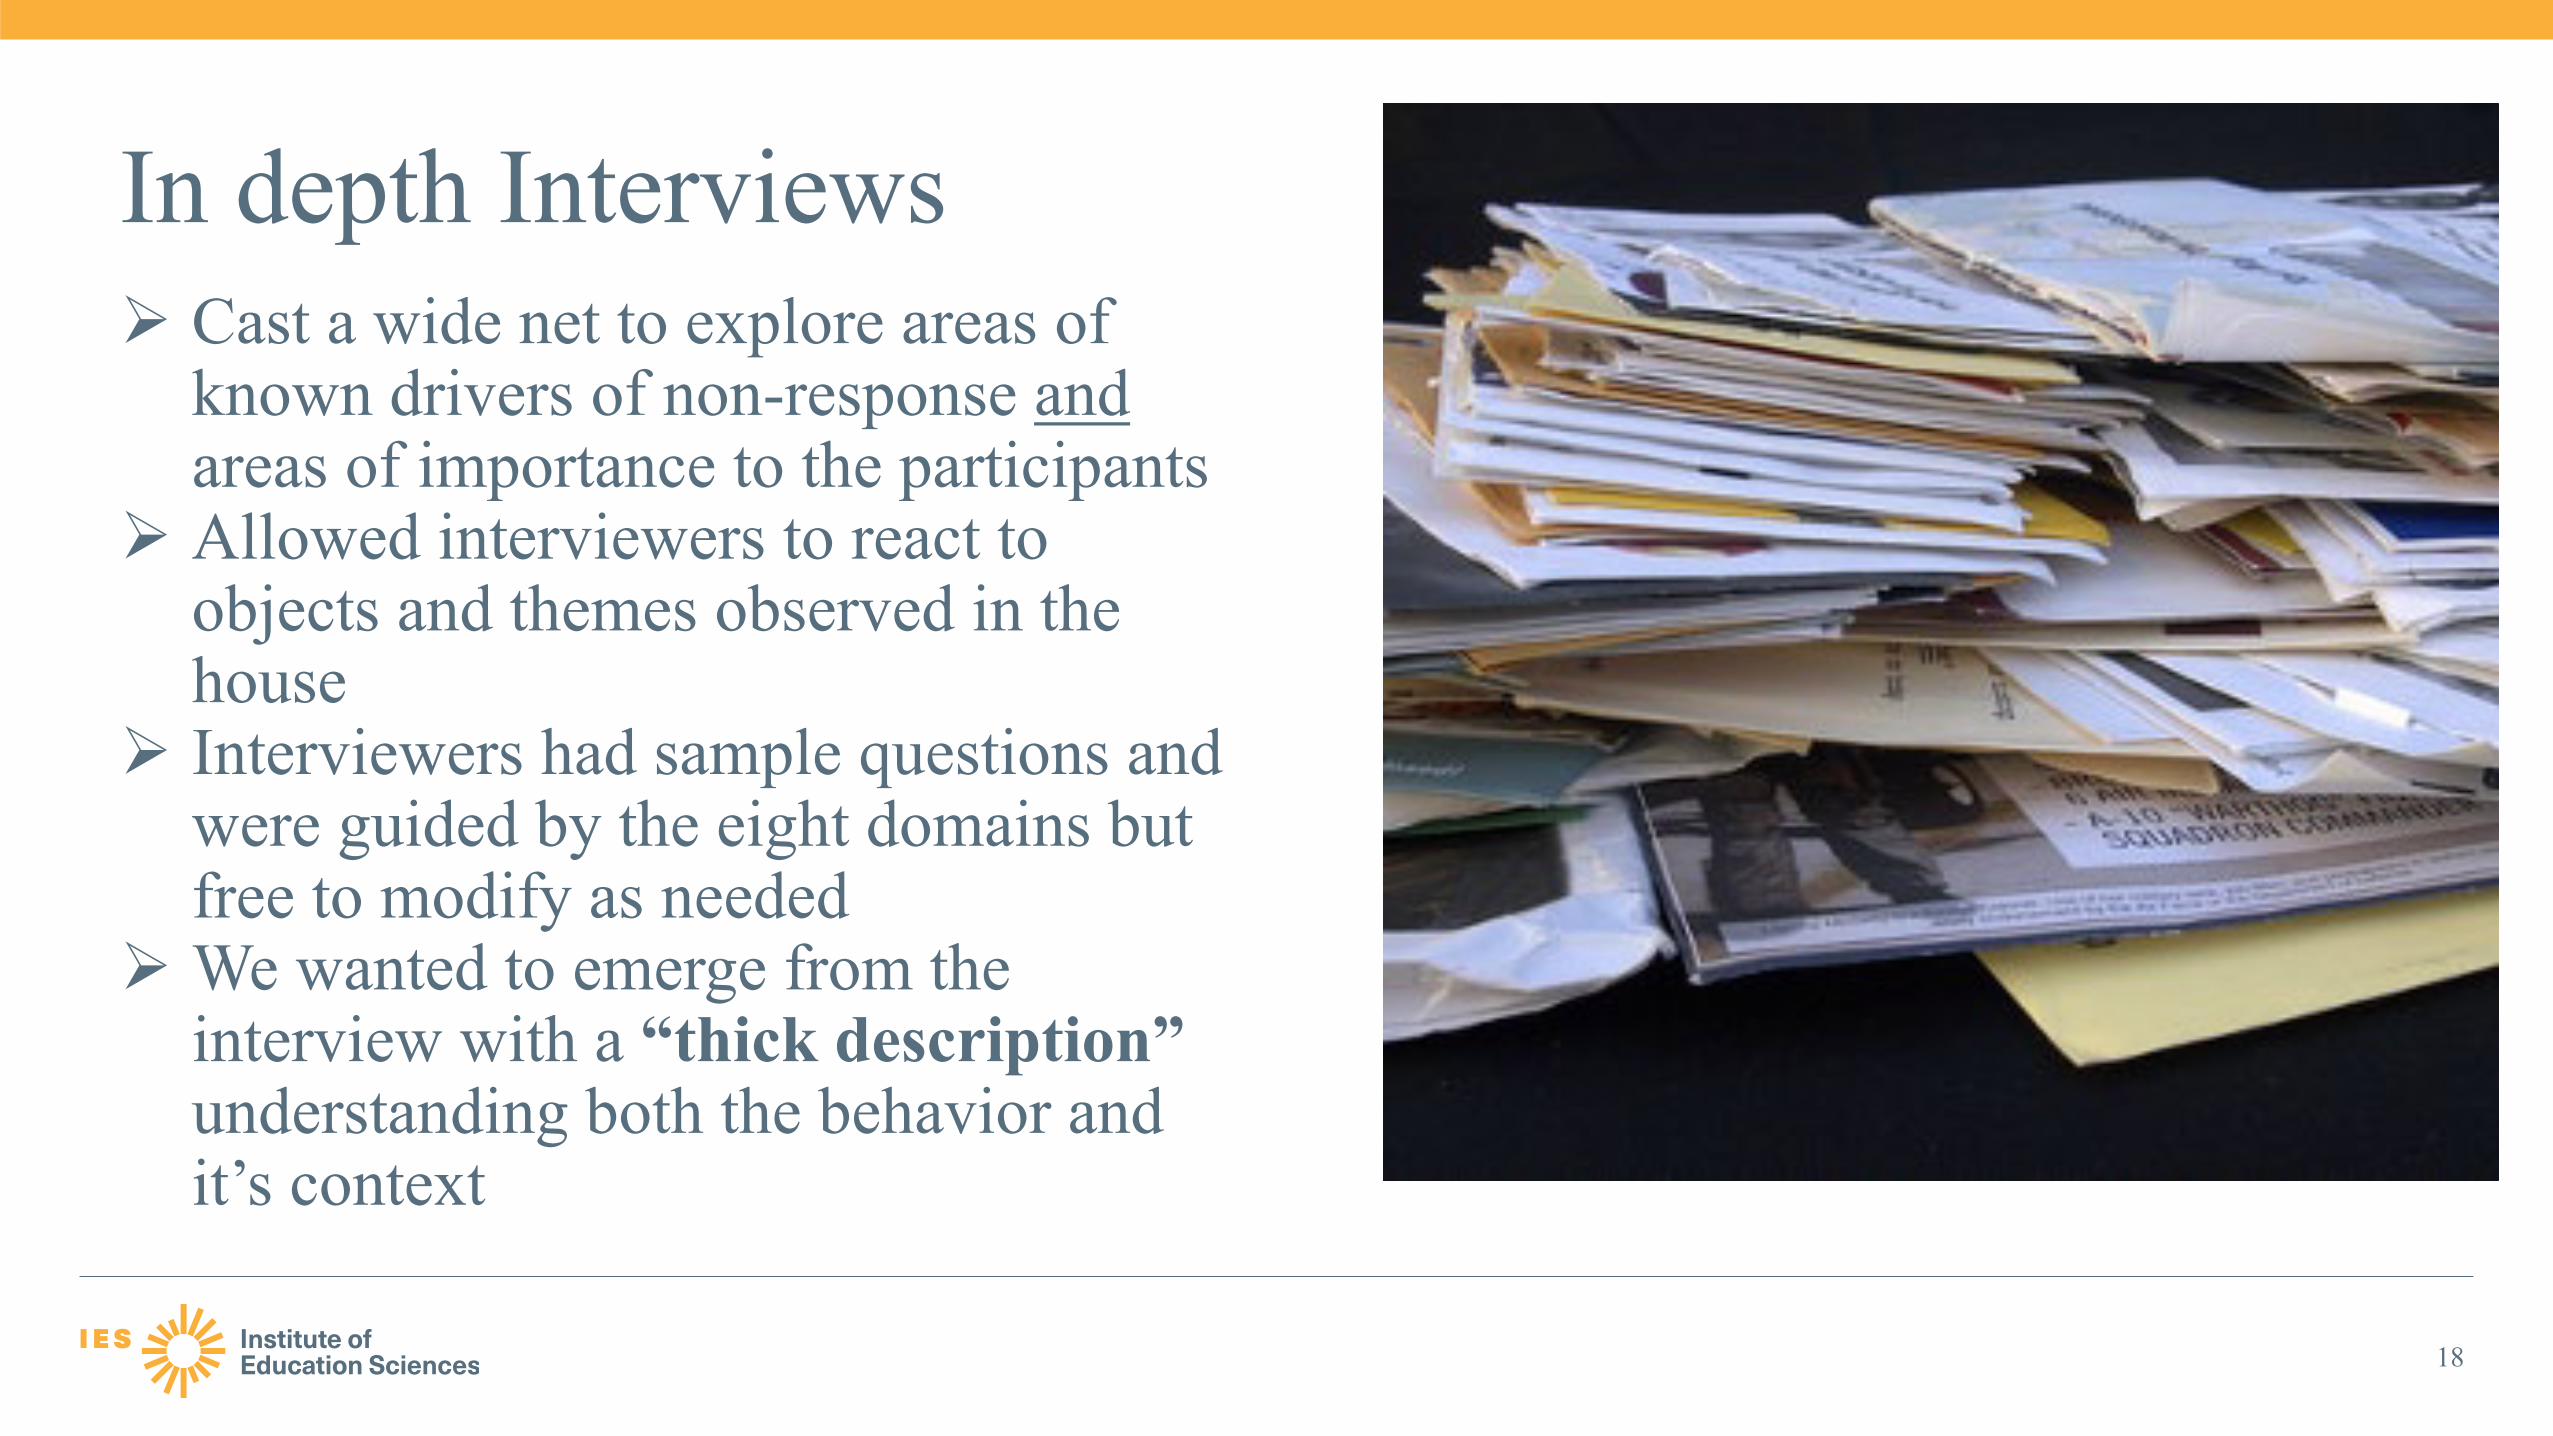
Cast a wide net to explore areas of known drivers of non-response andareas of importance to the participants
Allowed interviewers to react to objects and themes observed in the house
Interviewers had sample questions and were guided by the eight domains but free to modify as needed
We wanted to emerge from the interview with a “thick description” understanding both the behavior and it’s context

In depth Interviews
19
Unstructured interview covered eight domains
Household composition / demographics Understanding of surveys and research Privacy concerns Attitudes towards government Education Time use Civic engagement Experiences with mail
Two activities Mail sorting Review of NHES materials
20
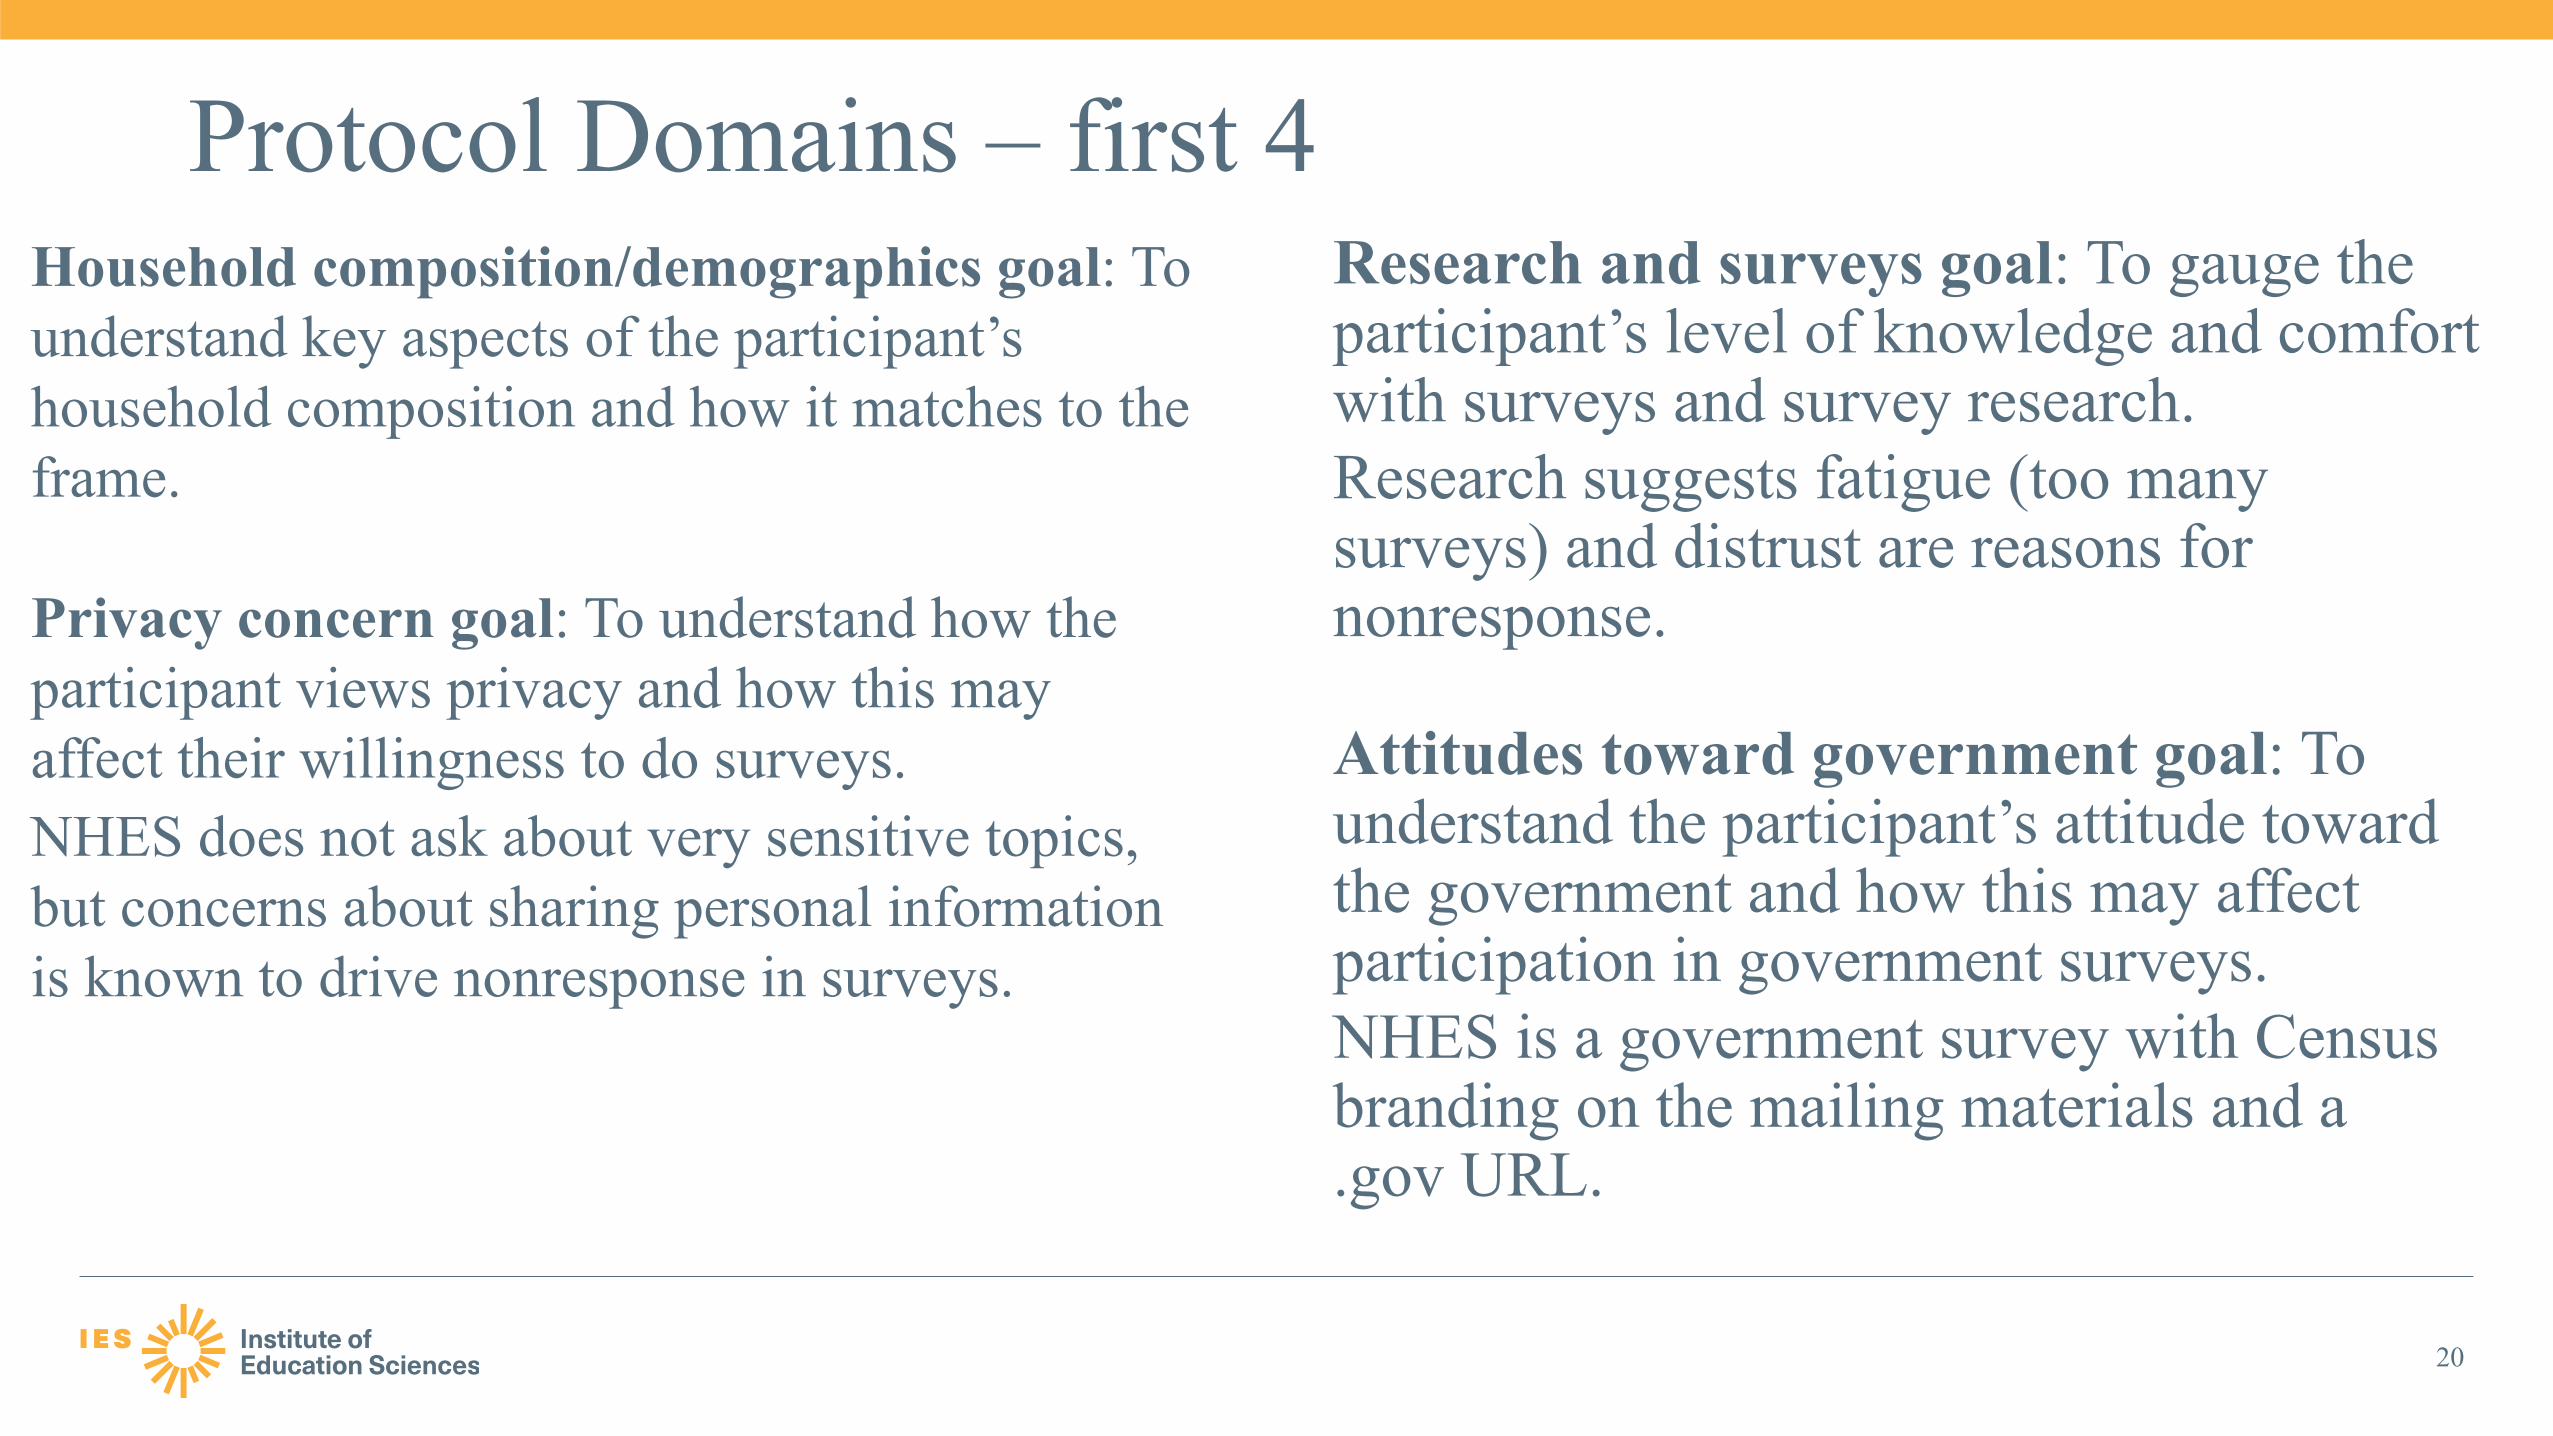
Protocol Domains – first 4Research and surveys goal: To gauge the participant’s level of knowledge and comfort with surveys and survey research.Research suggests fatigue (too many surveys) and distrust are reasons for nonresponse.
Attitudes toward government goal: To understand the participant’s attitude toward the government and how this may affect participation in government surveys.NHES is a government survey with Census branding on the mailing materials and a .gov URL.
Household composition/demographics goal: To understand key aspects of the participant’s household composition and how it matches to the frame.
Privacy concern goal: To understand how the participant views privacy and how this may affect their willingness to do surveys.NHES does not ask about very sensitive topics, but concerns about sharing personal information is known to drive nonresponse in surveys.
21
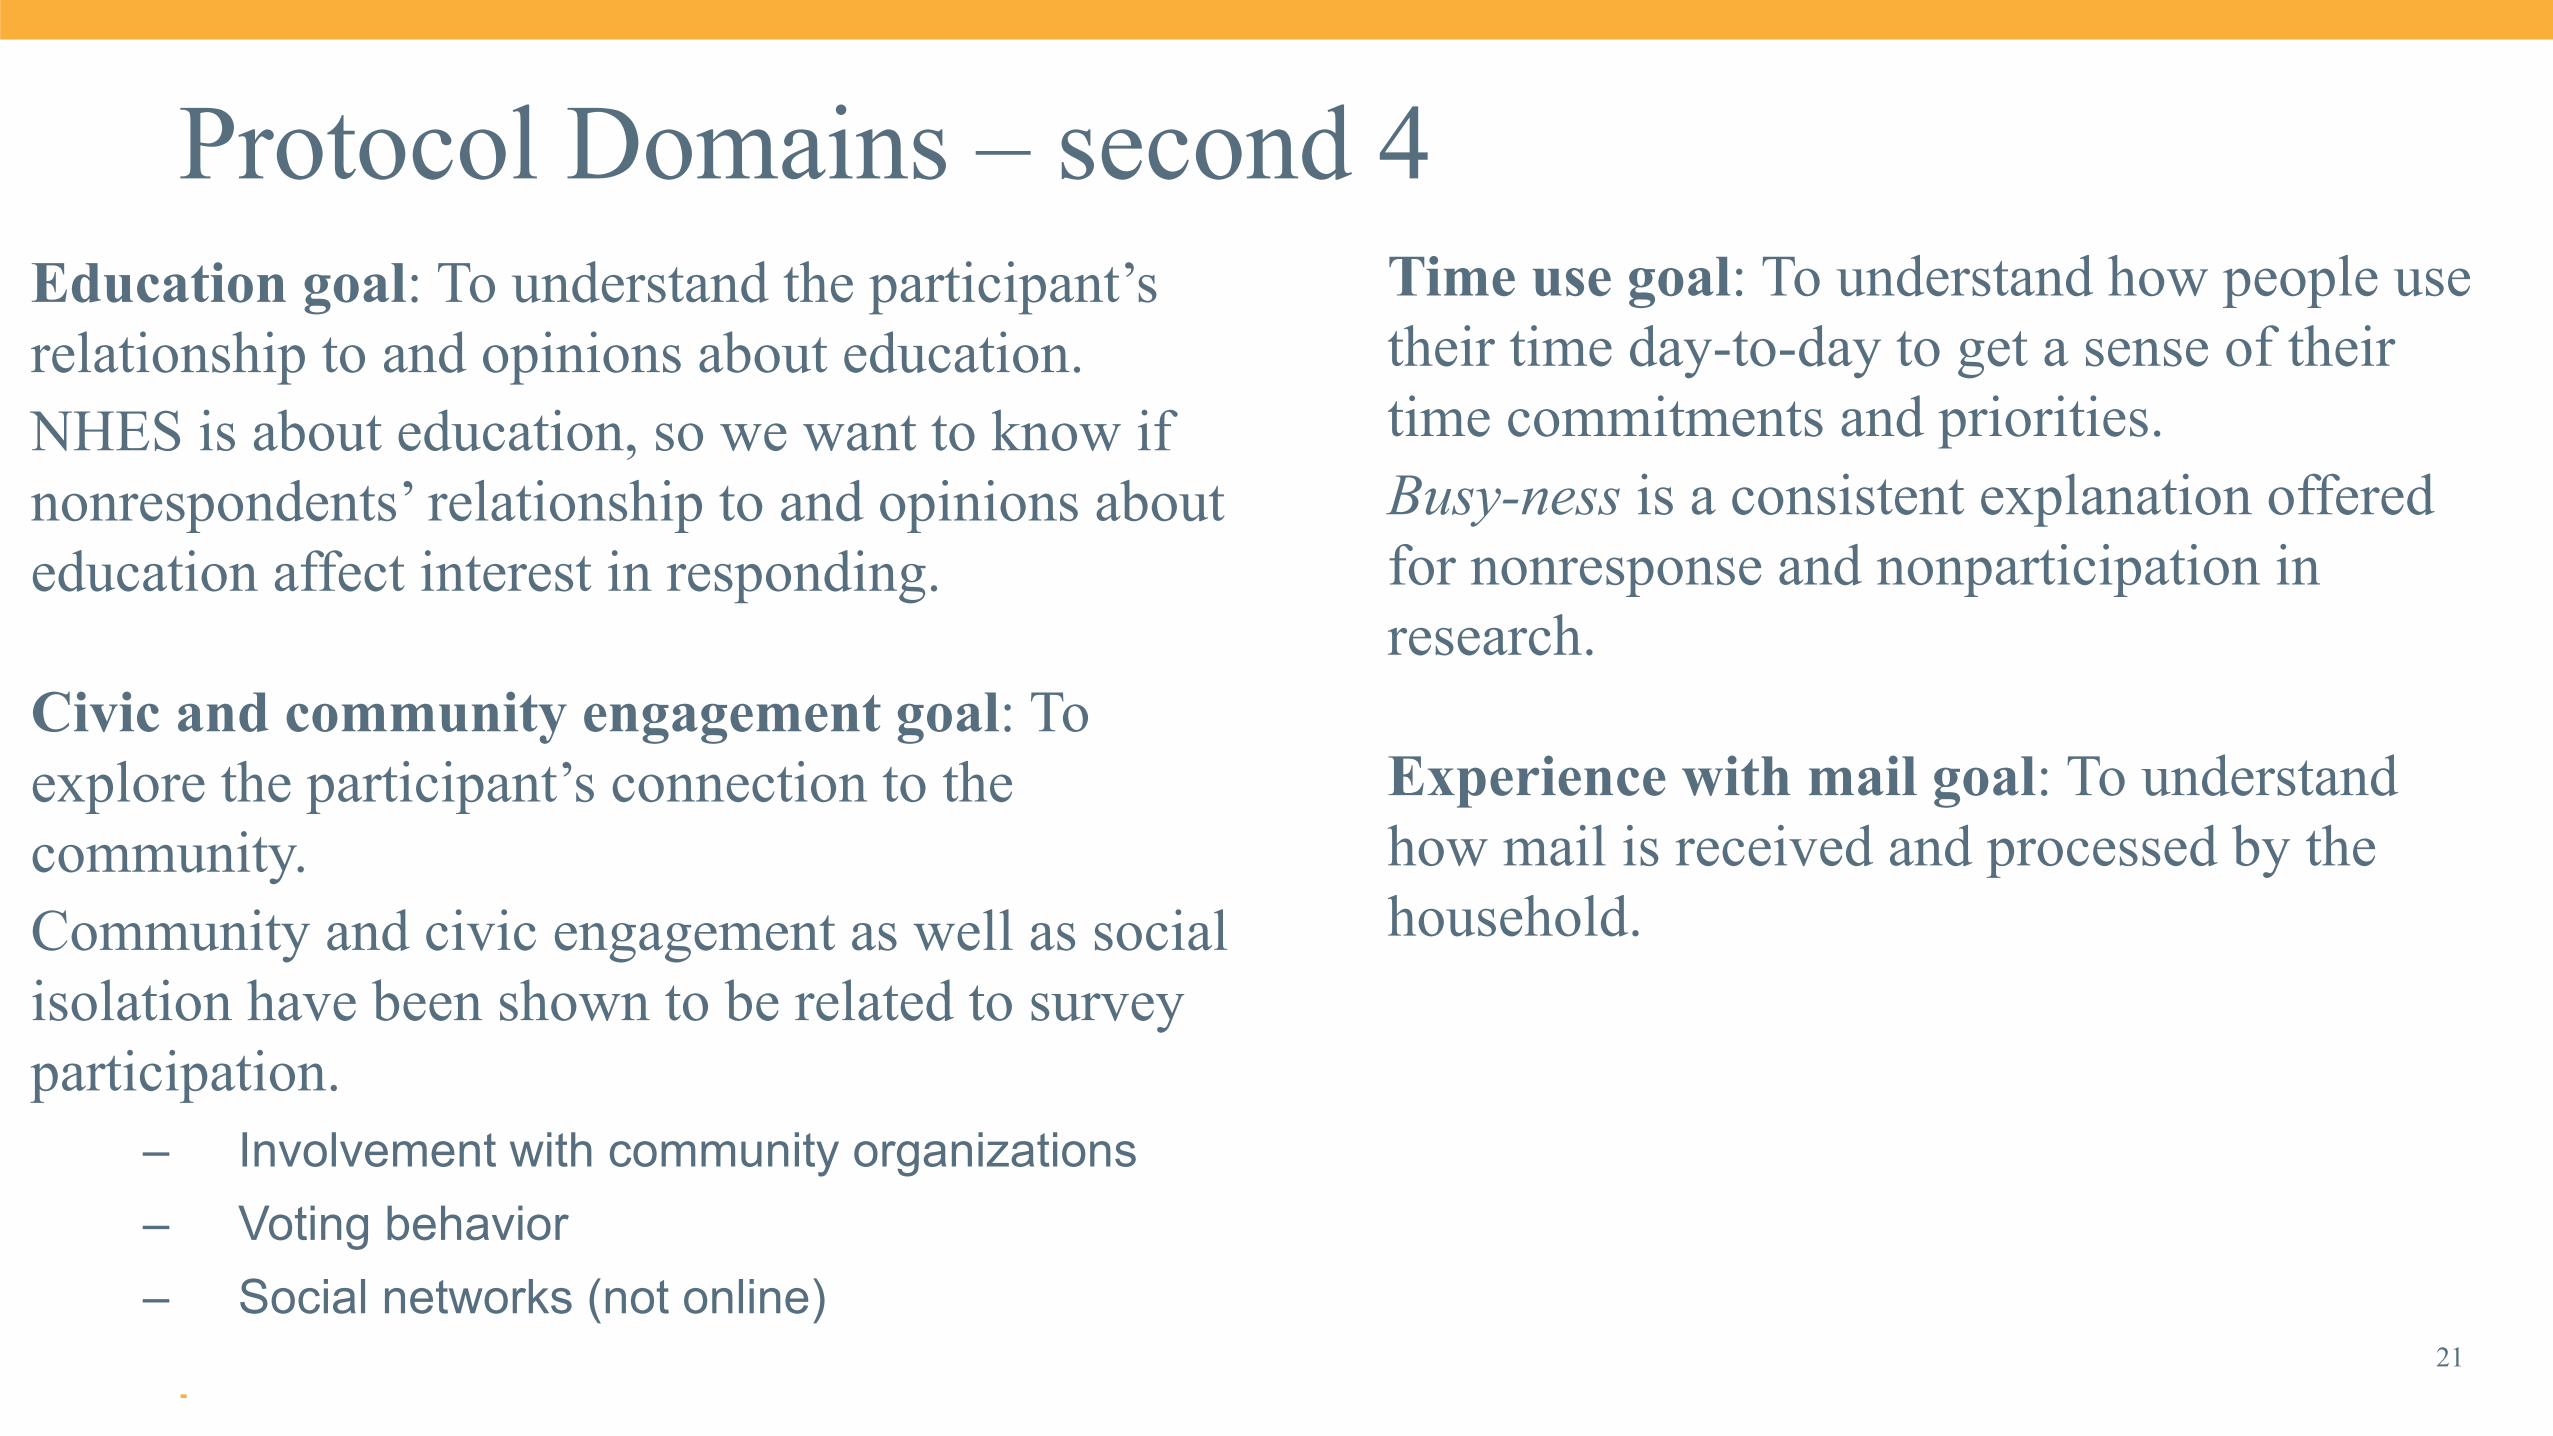
Protocol Domains – second 4Education goal: To understand the participant’s relationship to and opinions about education.NHES is about education, so we want to know if nonrespondents’ relationship to and opinions about education affect interest in responding.
Civic and community engagement goal: To explore the participant’s connection to the community. Community and civic engagement as well as social isolation have been shown to be related to survey participation.
– Involvement with community organizations– Voting behavior– Social networks (not online)
Time use goal: To understand how people use their time day-to-day to get a sense of their time commitments and priorities.Busy-ness is a consistent explanation offered for nonresponse and nonparticipation in research.
Experience with mail goal: To understand how mail is received and processed by the household.

22
Mail ActivitiesExample mail activity• Respondents were asked to think aloud
while sorting a bundle of mail that contained a variety of different things (catalogs, advertising circulars, NHES survey invite, etc.)
NHES materials• Interviewer walked respondent through all
of the NHES materials that had been sent to date and asked if they recognized the mailing piece and their reaction to it.

Completed Interviews and Analysis
23
85 regular interviews and 6 short interviews were conducted
Transcripts were entered into Nvivo(qualitative data software)
Codebook was developed from an initial pass through the transcripts and memos
5 coders were trained and overseen by 3 senior staff members
Codebook was revised after coding 25% of interviews and these interviews were recoded using the updated codebook

Respondent Characteristics
24
Characteristic Percent of Respondents
Age18 - 24 10.625 - 34 17.735 - 44 21.245 - 54 22.455 - 64 16.565 and older 9.4GenderMale 40.0Female 58.8EducationHigh school or less 44.7Some college, but no bachelor's degree 29.4Bachelor's degree 17.7Graduate degree 8.2
Characteristic Percent of Respondents
Race/ethnicityWhite, non-Hispanic 29.4Black, non-Hispanic 31.8Hispanic 27.1Other race, non-Hispanic 7.1Refused 4.7Employment statusEmployed for pay 68.2Not employed for pay 31.8Enrollment statusEnrolled 11.8Not enrolled 87.1Child in householdYes 49.4No 50.6
Respondent Characteristics (continued)
25
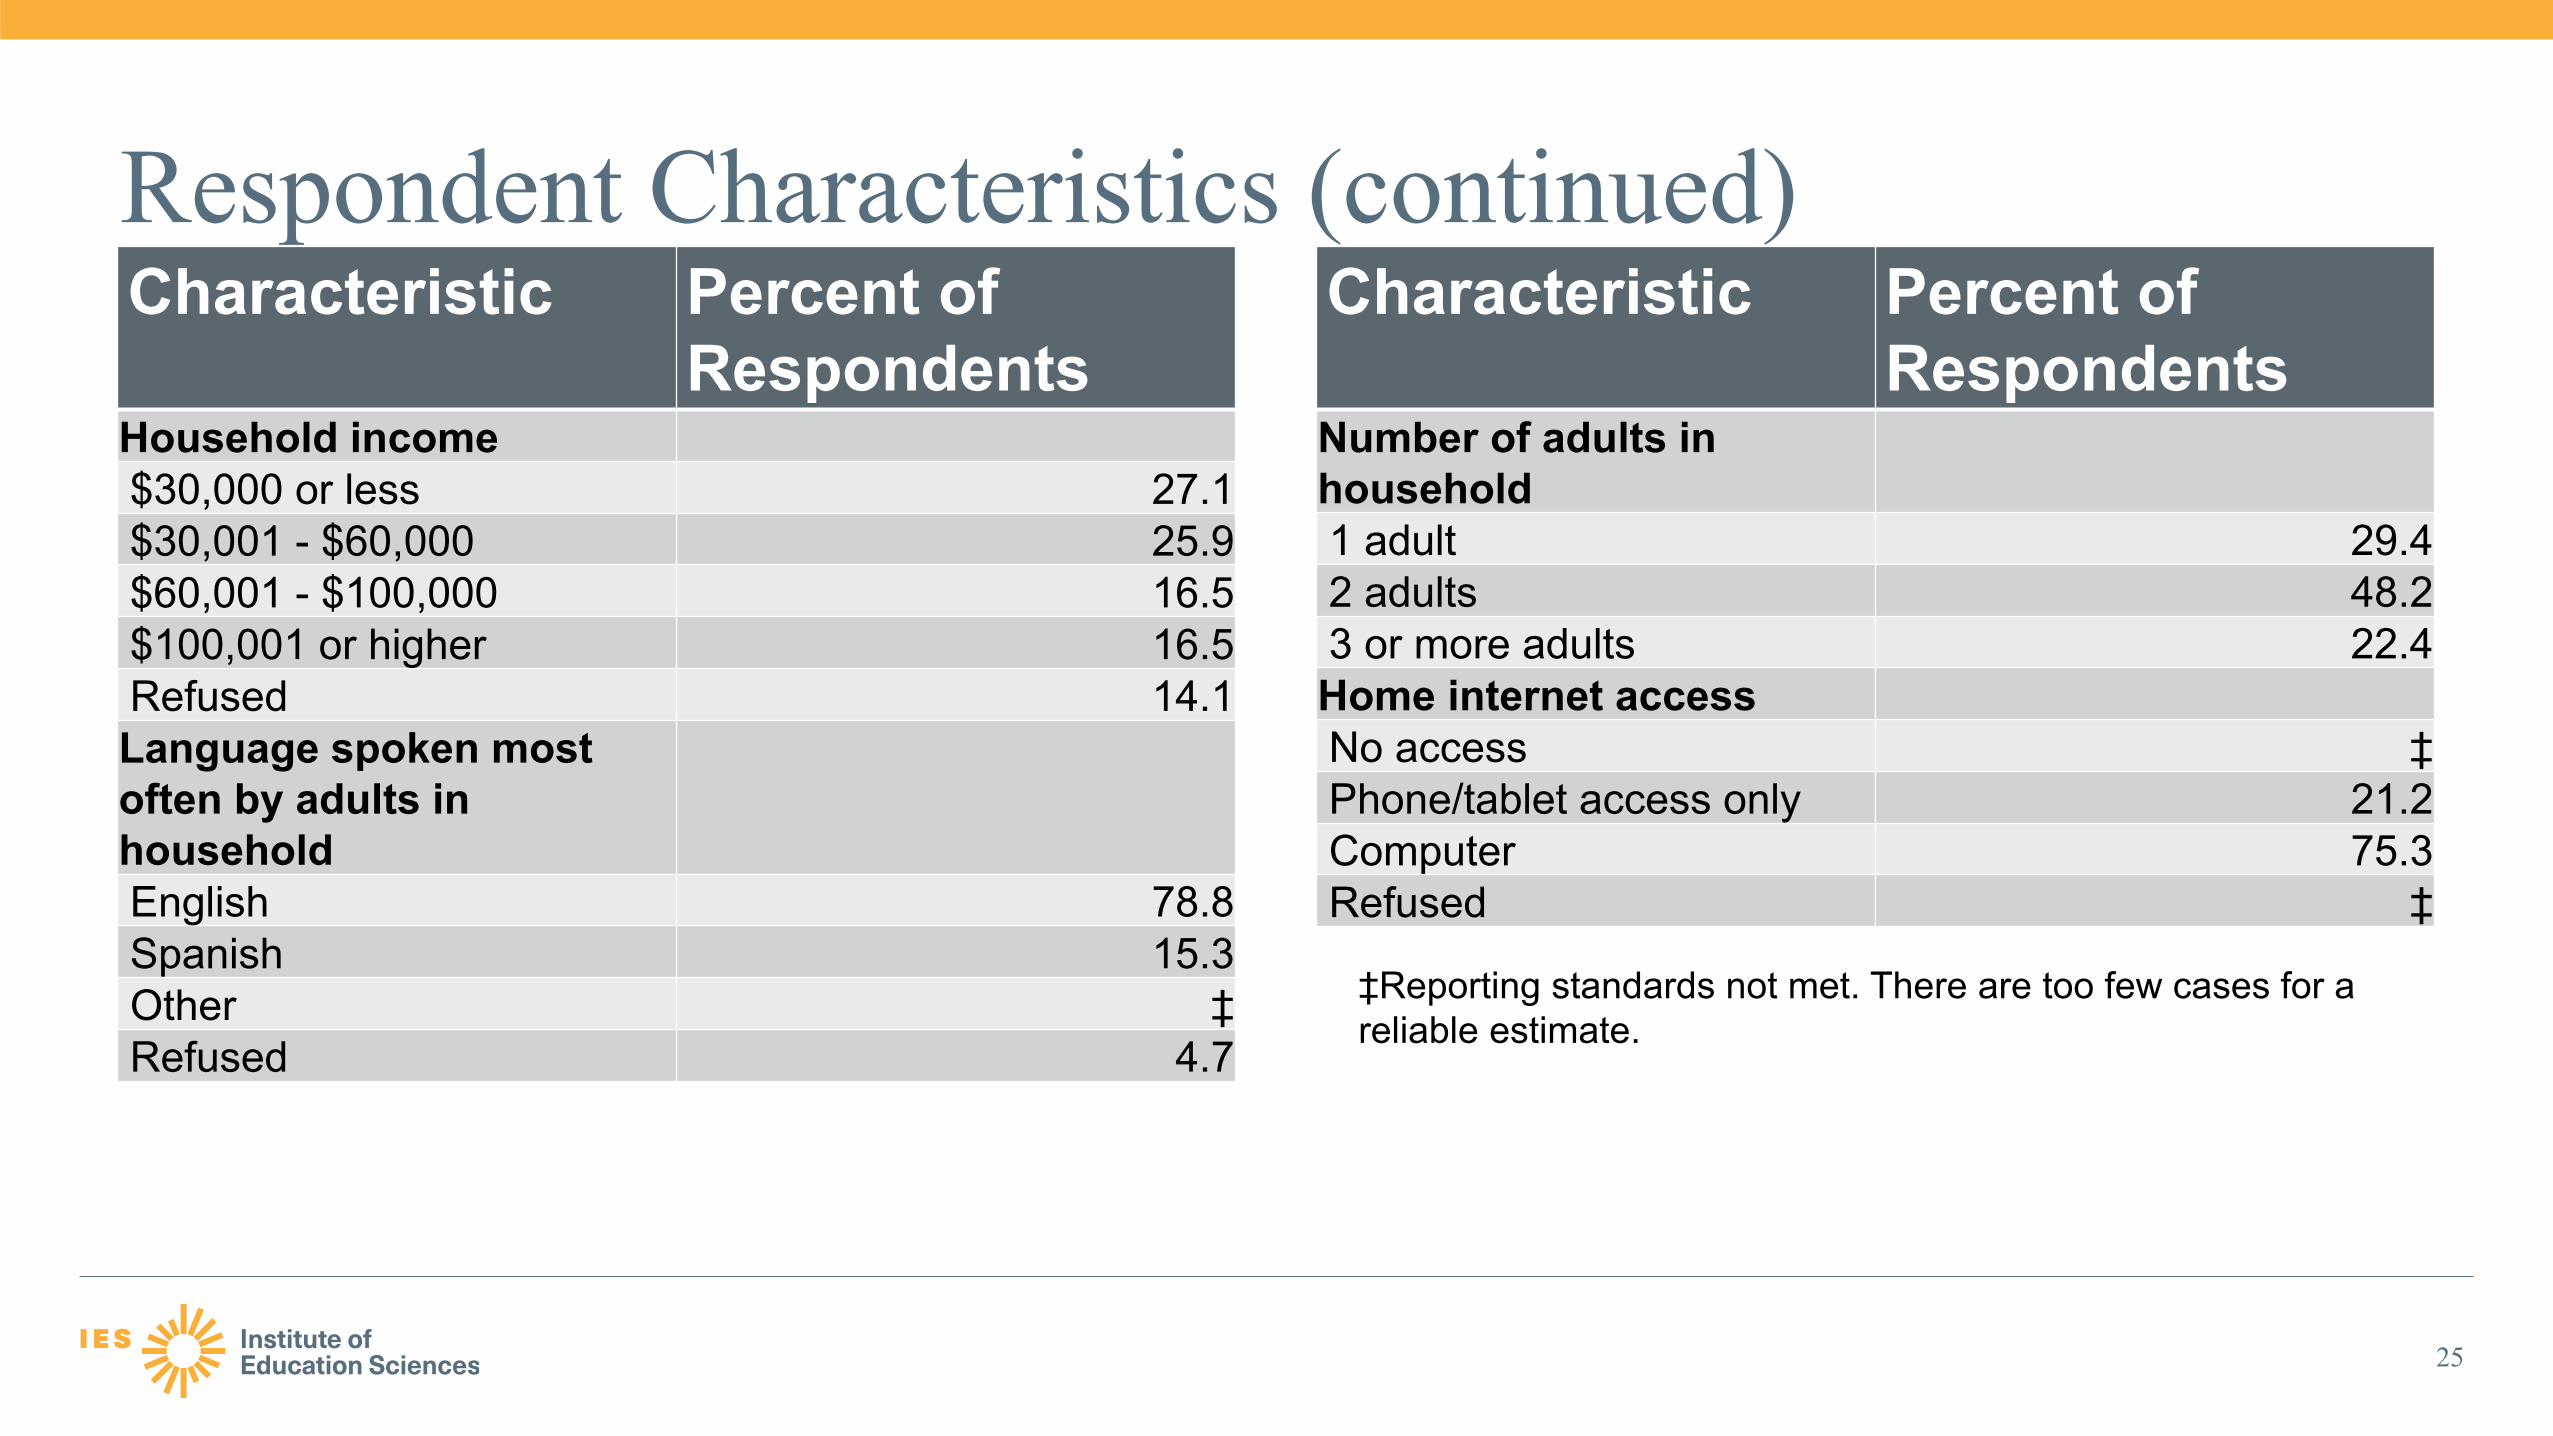
Characteristic Percent of Respondents
Household income$30,000 or less 27.1$30,001 - $60,000 25.9$60,001 - $100,000 16.5$100,001 or higher 16.5Refused 14.1Language spoken most often by adults in householdEnglish 78.8Spanish 15.3Other ‡Refused 4.7
Characteristic Percent of Respondents
Number of adults in household1 adult 29.42 adults 48.23 or more adults 22.4Home internet accessNo access ‡Phone/tablet access only 21.2Computer 75.3Refused ‡
‡Reporting standards not met. There are too few cases for a reliable estimate.

26
Thank You

Extra slides
27
Observation Site Selection
28
Seven sites were selected for the study• Four where the in depth interviews would take place following observations
Constrained to four sites and 100 observations per site by budgetRepresent four Census regions (Northeast, Midwest, South, and West)Expect at least 100 eligible cases within a 30 mile radiusWanted to ensure that at least 100 addresses from key nonresponding subgroups could be sampled across the 4 sites (Hispanic households, households with children, households in which the head has less than a high school diploma)
Steps to select the 4 in depth interview sitesUsing NHES:2016 data identified cases that were non responders at the third mailingMerged these cases to a Geographic Information System file of US cities and townsDrew a 30 mile buffer around each city/townKept any city/town with at least 100 cases expectedDropped the three observation only sites and any city/towns within their 30 mile radiiDropped any city/towns that did not meet region targetsRan a k-means clustering algorithm to divide the remaining cities into four clusters (minimize within cluster variation and maximize between cluster variation around the key subgroups) Selected the cities that were closest to the center of each clusterThis provided five possible sets of four sitesSelected the site that provided the best mix of small and large metropolitan areasTexas, Ohio, California, Connecticut
Selection of Cases Within Observation Sites
29
• Similar eligibility criteria as in depth qualitative sites
• Only explicit stratification criteria was if the address ever had a UAA or not
• Within each explicit stratum we implicitly stratified on the Hispanic indicator, the child indicator, low education, dwelling type, and nine-digit ZIP code
• Sampled 100 non UAA and 20 addresses with a UAA

Selection of Cases Within In depth Qualitative Sites
30
• Addresses needed to meet all the following criteria to be eligible:– Lie within a 30-mile radius of the site’s center, as defined by latitude/longitude– A non respondent after the third NHES screener mailing– Not a drop point address, P.O. box, or rural route address – Not a hard refusal or an ineligible address
• Eligible addresses were put into strata by crossing the sampling frame data about Hispanic status, presence of children in the hh, and if the head of household has a high school diploma
• The sample size for each stratum was chosen using a constrained optimization routine that minimized the variation in sampling rates across strata and sites while requiring at least 120 addresses to be sampled from each key subgroup (Hispanics, households with children, and low-education households) across the sites.
• Within each stratum, a systematic random sample was selected after sorting on an indicator for multi-unit dwellings and then on the nine-digit ZIP code.