Embed Size (px)
Citation preview
Occupational Wage Survey
LOS ANGELES-LONG BEACH, CALIFORNIA
MARCH 1962
Bulletin No. 1303 -53
UNITED STATES DEPARTMENT OF LABOR Arthur J. Goldberg, Secretary
BUREAU OF LABOR STATISTICS Ewan Clague, Commissioner
Digitized for FRASER http://fraser.stlouisfed.org/ Federal Reserve Bank of St. Louis
Digitized for FRASER http://fraser.stlouisfed.org/ Federal Reserve Bank of St. Louis
Occupational Wage Survey
LOS ANGELES-LONG BEACH, CALIFORNIA
MARCH 1962
Bulletin No. 1303-53June 1962
UNITED STATES DEPARTMENT OF LABOR Arthur J. Goldberg, Secretary
BUREAU OF LABOR STATISTICS Ewan Clague, Commissioner
For sale by the Superintendent of Documents, U.S. Government Printing Office, Washington 25, D .C Price 30 centsDigitized for FRASER http://fraser.stlouisfed.org/ Federal Reserve Bank of St. Louis

Digitized for FRASER http://fraser.stlouisfed.org/ Federal Reserve Bank of St. Louis
Preface Contents
Page
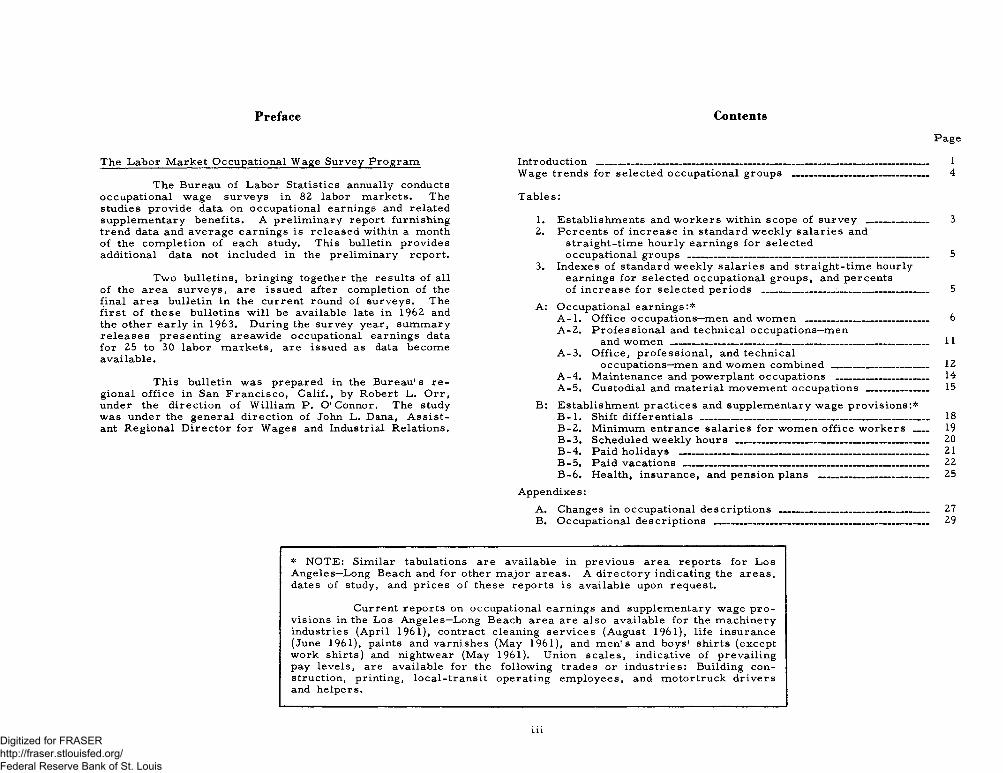
The L abor M arket O ccupational Wage Survey P rogra m
The Bureau o f L abor Statistics annually conducts occu pation a l w age su rveys in 82 labor m arkets. The studies p rov id e data on occupational earnings and re la ted supplem entary ben efits . A pre lim in a ry report furnishing trend data and average earn ings is re lea sed within a month o f the com p letion o f each study. This bulletin p rov ides additional data not included in the pre lim in a ry report.
Tw o bu lletin s, bringing together the resu lts o f all o f the area su rvey s , are issu ed after com pletion o f the final a rea bu lletin in the current round of su rveys. The f ir s t o f these bu lletins w ill be available late in 1962 and the other e a r ly in 1963. D uring the survey year, sum m ary r e le a s e s p resen tin g areaw ide occupational earnings data fo r 25 to 30 la bor m a rk ets, are issu ed as data b ecom e availab le .
T his bu lletin w as prepared in the B u reau 's r e g ional o f f ic e in San F r a n c is c o , C a lif., by R obert L. O rr , under the d ire c tio n o f W illiam P. O 'C onnor. The study was under the gen era l d irection o f John L. Dana, A s s is t ant R eg ion a l D ire c to r fo r W ages and Industrial R elations.
Introduction __________________________________________________________________ 1W age trends fo r se le cte d occu pation al groups ___________________________ 4
T ab les :
1. E stablishm ents and w o rk e rs within scope of su rvey _____________ 32. P ercen ts o f in cre a se in standard w eek ly sa la rie s and
stra igh t-tim e h ourly earn ings fo r se le ctedoccu pation al groups ________________________________________________ 5
3. Indexes o f standard w eek ly sa la rie s and stra igh t-tim e hourlyearnings fo r se le cted occu pation al grou ps, and percen ts o f in cre a se fo r se le cte d p er iod s ______________ 5
A: O ccupational earn ings:*A - 1. O ffice occupations—m en and w om en ________________________ 6A - 2. P ro fe ss io n a l and tech n ica l occu pation s—m en
and w om en ____________________________________________________ 11A -3 . O ffice , p ro fe ss io n a l, and tech n ica l
occu pation s—m en and w om en com bined ___________________ 12A -4 . M aintenance and pow er plant occu pation s __________________ 14A -5 . Custodial and m a teria l m ovem ent occupations ____________ 15
B: E stablishm ent p ra c tice s and supplem entary w age p ro v is io n s :*B - l . Shift d ifferen tia ls _____________________________________________ 18B -2 . M inim um entrance sa la rie s fo r w om en o ff ic e w ork ers __ 19B - 3. Scheduled w eek ly hours ______________________________________ 20B -4 . P aid holidays _________________________________________________ 21B -5 . P aid vacations ________________________________________________ 22B -6 . Health, in su ran ce, and pension plans _____________________ 25
Appendixe s :A. Changes in occu pation al d escr ip tion s ______________________________ 27B. O ccupational descr ip tion s ___________________________________________ 29
* NOTE: S im ilar tabulations are availab le in prev iou s area rep orts fo r L os A ngeles—Long Beach and fo r other m a jor areas . A d ire c to ry indicating the areas , dates of study, and p r ic e s o f these rep orts is availab le upon request.
Current rep orts on occu pation al earn ings and supplem entary wage p r o v ision s in the Los A n geles—Long B each area are a lso available fo r the m ach in ery industries (A pril 1961), con tract cleaning se r v ice s (August 1961), life insurance (June 1961), paints and varn ishes (M ay 1961), and m en 's and boys ' sh irts (except w ork sh irts) and nightwear (M ay 1961). Union s ca le s , indicative of p reva ilin g pay le v e ls , are availab le fo r the fo llow in g trades or in du stries : Building co n struction , printing, lo c a l-t ra n s it operating em p loyees , and m otortru ck d r iv e rs and h elpers.
mDigitized for FRASER http://fraser.stlouisfed.org/ Federal Reserve Bank of St. Louis

Digitized for FRASER http://fraser.stlouisfed.org/ Federal Reserve Bank of St. Louis
Occupational Wage Survey—Los Angeles—Long Beach, Calif.Introduction
This area is 1 of 82 labor markets in which the U.S. Department of Labor's Bureau of Labor Statistics has conducted surveys of occupational earnings and related wage benefits on an area- wide basis. In this area, data were obtained by personal visits of Bureau field economists1 to representative establishments within six broad industry divisions: Manufacturing; transportation, communication, and other public utilities; wholesale trade; retail trade; finance, insurance, and real estate; and services. Major industry groups excluded from these studies are government operations and the construction and extractive industries. Establishments having fewer than a prescribed number of workers are omitted also because they tend to furnish insufficient employment in the occupations studied to warrant inclusion. Separate tabulations are provided for each of the broad industry divisions which meet publication criteria.
These surveys are conducted on a sample basis because of the unnecessary cost involved in surveying all establishments. To obtain optimum accuracy at minimum cost, a greater proportion of large than of small establishments is studied. In combining the data, however, all establishments are given their appropriate weight. Estimates based on the establishments studied are presented, therefore, as relating to all establishments in the industry grouping and area, except for those below the minimum size studied.
Occupations and Earnings
The occupations selected for study are common to a variety of manufacturing and nonmanufacturing industries. Occupational classification is based on a uniform set of job descriptions designed to take account of interestablishment variation in duties within the same job. (See appendix for listing of these descriptions.) Earnings data are presented (in the A-series tables) for the following types of occupations: (a) Office clerical; (b) professional and technical; (c) maintenance and powerplant; and (d) custodial and material movement.
1 Data were obtained by mail from some of the smaller establishments for which visits by Bureau field economists in the last previous survey indicated employment in relatively few of the occupations studied. Unusual changes reported by mail were verified with employers.
Occupational employment and earnings data are shown for full-time workers, i. e . , those hired to work a regular weekly schedule in the given occupational classification. Earnings data exclude premium pay for overtime and for work on weekends, holidays, and late shifts. Nonproduction bonuses are excluded also, but cost-of- living bonuses and incentive earnings are included. Where weekly hours are reported, as for office clerical occupations, reference is to the work schedules (rounded to the nearest half hour) for which straight-time salaries are paid; average weekly earnings for these occupations have been rounded to the nearest half dollar.
Average earnings of men and women are presented separately for selected occupations in which both sexes are commonly employed. Differences in pay levels of men and women in these occupations are largely due to (1) differences in the distribution of the sexes among industries and establishments; (2) differences in specific duties performed, although the occupations are appropriately classified within the same survey job description; and (3) differences in length of service or merit review when individual salaries are adjusted on this basis. Longer average service of men vould result in higher average pay when both sexes are employed within the same rate range. Job descriptions used in classifying employees in these surveys are usually more generalized than those used in individual establishments to allow for minor differences among establishments in specific duties performed.
Occupational employment estimates represent the total in all establishments within the scope of the study and not the number actually surveyed. Because of differences in occupational structure among establishments, the estimates of occupational employment obtained from the sample of establishments studied serve only to indicate the relative importance of the jobs studied. These differences in occupational structure do not materially affect the accuracy of the earnings data.
Establishment Practices and Supplementary Wage Provisions
Information is presented (in the B-series tables) on selected establishment practices and supplementary benefits as they relate to office and plant workers. The concept "office workers, " as used in this bulletin, includes working supervisors and nonsupervisory workers performing clerical or related functions, and excludes administrative, executive, and professional personnel. "Plant workers" include working foremen and all nonsupervisory workers (including lead- men and trainees) engaged in nonoffice functions. Administrative,
1
Digitized for FRASER http://fraser.stlouisfed.org/ Federal Reserve Bank of St. Louis
%
executive, and professional employees, and force-account construction employees who are utilized as a separate work force are excluded. Cafeteria workers and routemen are excluded in manufacturing industries, but are included as plant workers in nonmanufacturing industries.
Shift differential data (table B -l) are limited to manufacturing industries. This information is presented both in terms of (a) establishment policy, 2 presented in terms of total plant worker employment, and (b) effective practice, presented in terms of workers actually employed on the specified shift at the time of the survey. In establishments having varied differentials, the amount applying to a majority was used or, if no amount applied to a majority, the classification "other" was used. In establishments in which some late- shift hours are paid at normal rates, a differential was recorded only if it applied to a majority of the shift hours.
Minimum entrance salaries (table B-2) relate only to the establishments visited. They are presented in terms of establishments with formal minimum salary policies.
The scheduled hours (table B-3) of a majority of the first- shift workers in an establishment are tabulated as applying to all of the plant or office workers of that establishment. Paid holidays; paid vacations; and health, insurance, and pension plans (tables B-4 through B-6) are treated statistically on the basis that these are applicable to all plant or office workers if a majority of such workers are eligible or may eventually qualify for the practices listed. Sums of individual items in tables B-3 through B-6 may not equal totals because of rounding.
The first part of the paid holidays table (table B-4) presents the number of whole and half holidays actually provided. The second part combines whole and half holidays to show total holiday time.
The summary of vacation plans (table B-5) is limited to formal policies, excluding informal arrangements whereby time off with pay is granted at the discretion of the employer. Separate estimates are provided according to employer practice in computing vacation payments, such as time payments, percent of annual earnings, or flat-sum amounts. However, in the tabulations of vacation pay, payments not on a time basis were so converted; for example, a payment of 2 percent of annual earnings was considered as the equivalent of 1 week’s pay.
2 An establishment was considered as having a policy if it met either of the following; conditions: (l) Operated late shifts at the time of the survey, or (2) had formal provisions covering late shifts.
Data are presented for all health, insurance, and pension plans (table B-6) for which at least a part of the cost is borne by the employer, excepting only legal requirements such as workmen’s compensation, social security, and railroad retirement. Such plans include those underwritten by a commercial insurance company and those provided through a union fund or paid directly by the employer out of current operating funds or from a fund set aside for this purpose. Death benefits are included as a form of life insurance.
Sickness and accident insurance is limited to that type of insurance under which predetermined cash payments are made directly to the insured on a weekly or monthly basis during illness or accident disability. Information is presented for all such plans to which the employer contributes. However, in New York and New Jersey, which have enacted temporary disability insurance laws which require employer contributions,3 plans are included only if the employer (1) contributes more than is legally required, or (2) provides the employee with benefits which exceed the requirements of the law. Tabulations of paid sick-leave plans are limited to formal plans4 which provide full pay or a proportion of the worker’ s pay during absence from work because of illness. Separate tabulations are presented according to (1) plans which provide full pay and no waiting period, and (2) plans which provide either partial pay or a waiting period. In addition to the presentation of the proportions of workers who are provided sickness and accident insurance or paid sick leave, an unduplicated total is shown of workers who receive either or both types of benefits.
Catastrophe insurance, sometimes referred to as extended medical insurance, includes those plans which are designed to protect employees in case of sickness and injury involving expenses beyond the normal coverage of hospitalization, medical, and surgical plans. Medical insurance refers to plans providing for complete or partial payment of doctors’ fees. Such plans may be underwritten by commercial insurance companies or nonprofit organizations or they may be self-insured. Tabulations of retirement pension plans are limited to those plans that provide monthly payments for the remainder of the worker’s life.
3 The temporary disability laws in California and Rhode Island do not require employer contributions.
4 An establishment was considered as having a formal plan if it established at least the minimum number of days of sick leave that could be expected by each employee. Such a plan need not be written, but informal sick-leave allowances, determined on an individual basis, were excluded.
Digitized for FRASER http://fraser.stlouisfed.org/ Federal Reserve Bank of St. Louis
3
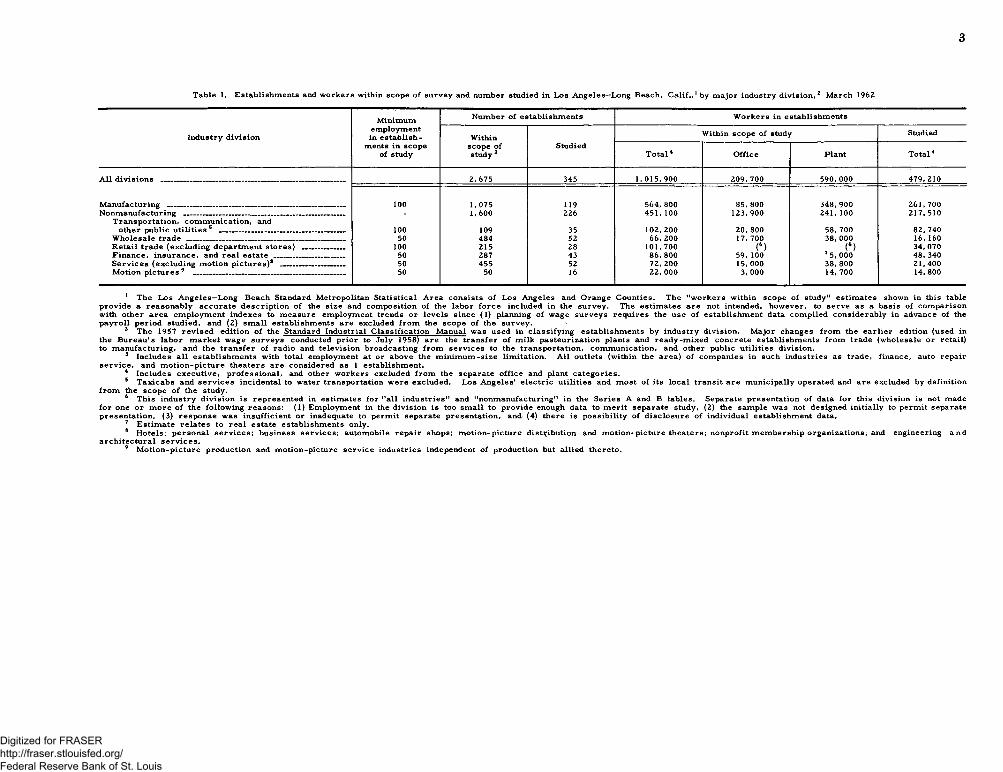
Table Establishments and workers within scope of survey and number studied in Los Angeles—Long Beach, C alif.,1 by major industry division, 2 March 1962
Minimum Number of establishments Workers in establishments
Industry divisionemployment in establish- Within Within scope of study Studied
ments in scope of study
scope of study 1 2 3
StudiedTotal4 Office Plant Total4
All divisions _________ _________________________________________ 2, 675 345 1,015, 900 209,700 590,000 479,210
Manufacturing _________________________________________ _____ 100 1, 075 119 564, 800 85,800 348,900 261, 700Nonmanufacturing _________________________________ ______ _
Transportation, communication, and- 1, 600 226 451,100 123,900 241,100 217,510
other public utilities 5 __________________________________ 100 109 35 102, 200 20,800 58,700 82, 740Wholesale trade ___________________________________________ 50 484 52 66, 200 17, 700 38,000 16, 160Retail trade (excluding department stores) ___________ 100 215 28 101,700 (6 7) 7 (6) 34, 070Finance, insurance, and real estate ___________________ 50 287 43 86, 800 59,100 7 5, 000 48, 340Services (excluding motion pictures)8 __ ______________ 50 455 52 72, 200 15, 000 38,800 21,400Motion pictures 9 _________________________________________ 50 50 16 22, 000 3, 000 14,700 14,800
1 The Los Angeles—Long Beach Standard Metropolitan Statistical Area consists of Los Angeles and Orange Counties. The "workers within scope of study" estimates shown in this table provide a reasonably accurate description of the size and composition of the labor force included in the survey. The estimates are not intended, however, to serve as a basis of comparison with other area employment indexes to measure employment trends or levels since (1) planning of wage surveys requires the use of establishment data compiled considerably in advance of the payroll period studied, and (2) sm all establishments are excluded from the scope of the survey.
2 The 1957 revised edition of the Standard Industrial Classification Manual was used in classifying establishments by industry division. Major changes from the earlier edition (used in the Bureau's labor market wage surveys conducted prior to July 1958) are the transfer of milk pasteurization plants and ready-mixed concrete establishments from trade (wholesale or retail) to manufacturing, and the transfer of radio and television broadcasting from services to the transportation, communication, and other public utilities division.
3 Includes all establishments with total employment at or above the m inim um -size limitation. All outlets (within the area) of companies in such industries as trade, finance, auto repair service, and motion-picture theaters are considered as 1 establishment.
4 Includes executive, professional, and other workers excluded from the separate office and plant categories.5 Taxicabs and services incidental to water transportation were excluded. Los Angeles' electric utilities and most of its local transit are municipally operated and are excluded by definition
from the scope of the study.6 This industry division is represented in estimates for "a ll industries" and "nonmanufacturing" in the Series A and B tables. Separate presentation of data for this division is not made
for one or more of the following reasons: (1) Employment in the division is too small to provide enough data to merit separate study, (2) the sample was not designed initially to permit separate presentation, (3) response was insufficient or inadequate to permit separate presentation, and (4) there is possibility of disclosure of individual establishment data.
7 Estimate relates to real estate establishments only.8 Hotels; personal services; business services; automobile repair shops; motion-picture distribution and motion-picture theaters; nonprofit membership organizations; and engineering and
architectural services.9 Motion-picture production and motion-picture service industries independent of production but allied thereto.
Digitized for FRASER http://fraser.stlouisfed.org/ Federal Reserve Bank of St. Louis
4
Wage Trends for Selected Occupational Groups
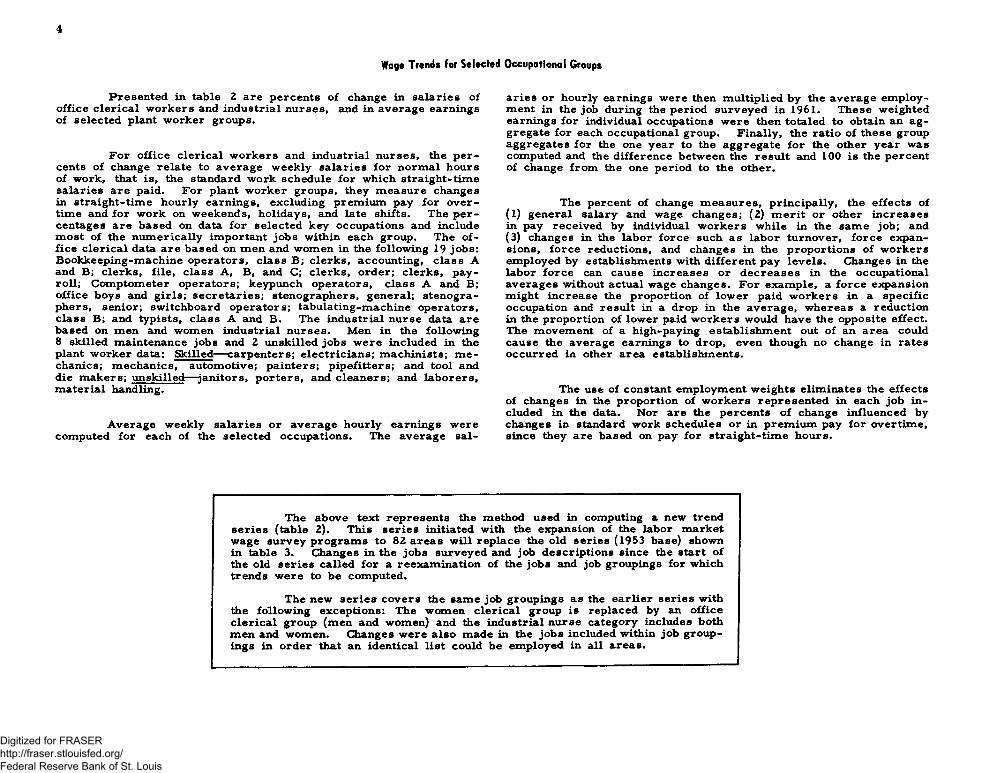
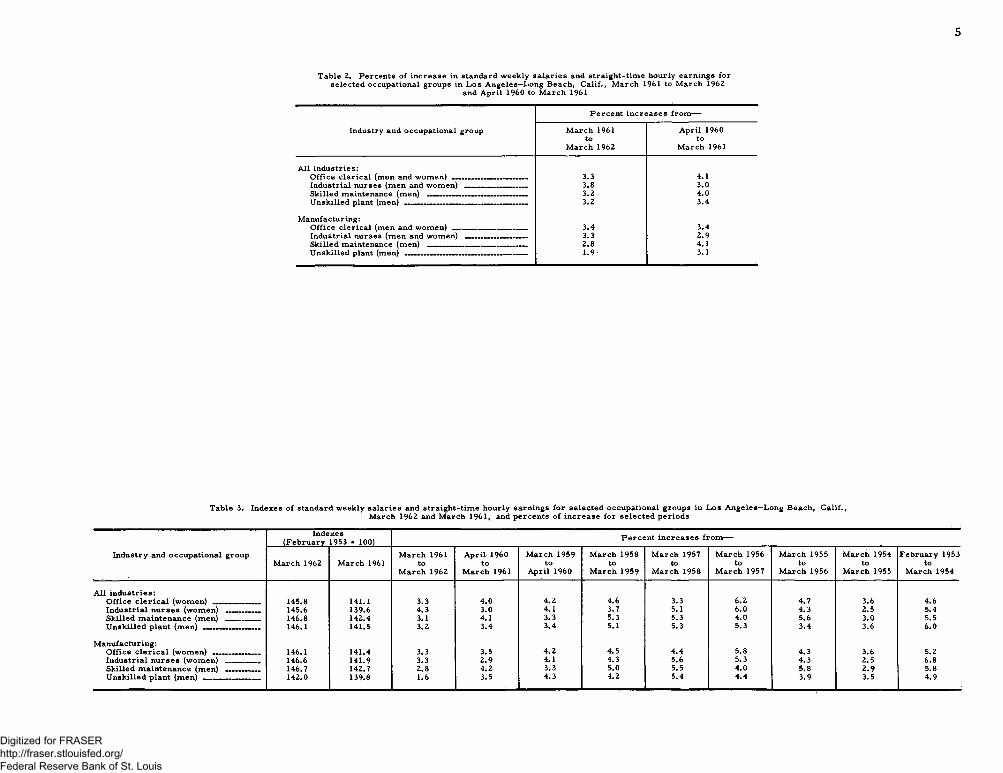
Presented in table 2 are percents of change in salaries of office clerical workers and industrial nurses, and in average earnings of selected plant worker groups.
For office clerical workers and industrial nurses, the percents of change relate to average weekly salaries for normal hours of work, that is, the standard work schedule for which straight-time salaries are paid. For plant worker groups, they measure changes in straight-time hourly earnings, excluding premium pay for overtime and for work on weekends, holidays, and late shifts. The percentages are based on data for selected key occupations and include most of the numerically important jobs within each group. The office clerical data are based on men and women in the following 19 jobs: Bookkeeping-machine operators, class B; clerks, accounting, class A and B; clerks, file, class A, B, and C; clerks, order; clerks, payroll; Comptometer operators; keypunch operators, class A and B; office boys and girls; secretaries; stenographers, general; stenographers, senior; switchboard operators; tabulating-machine operators, class B; and typists, class A and B. The industrial nurse data are based on men and women industrial nurses. Men in the following 8 skilled maintenance jobs and 2 unskilled jobs were included in the plant worker data: Skilled— carpenters; electricians; machinists; mechanics; mechanics, automotive; painters; pipefitters; and tool and die makers; unskilled—janitors, porters, and cleaners; and laborers, material handling.
Average weekly salaries or average hourly earnings were computed for each of the selected occupations. The average sal
aries or hourly earnings were then multiplied by the average employment in the job during the period surveyed in 1961. These weighted earnings for individual occupations were then totaled to obtain an aggregate for each occupational group. Finally, the ratio of these group aggregates for the one year to the aggregate for the other year was computed and the difference between the result and 100 is the percent of change from the one period to the other.
The percent of change measures, principally, the effects of (1) general salary and wage changes; (2) merit or other increases in pay received by individual workers while in the same job; and (3) changes in the labor force such as labor turnover, force expansions, force reductions, and changes in the proportions of workers employed by establishments with different pay levels. Changes in the labor force can cause increases or decreases in the occupational averages without actual wage changes. For example, a force expansion might increase the proportion of lower paid workers in a specific occupation and result in a drop in the average, whereas a reduction in the proportion of lower paid workers would have the opposite effect. The movement of a high-paying establishment out of an area could cause the average earnings to drop, even though no change in rates occurred in other area establishments.
The use of constant employment weights eliminates the effects of changes in the proportion of workers represented in each job included in the data. Nor are the percents of change influenced by changes in standard work schedules or in premium pay for overtime, since they are based on pay for straight-time hours.
The above text represents the method used in computing a new trend series (table 2). This series initiated with the expansion of the labor market wage survey programs to 82 areas will replace the old series (1953 base) shown in table 3. Changes in the jobs surveyed and job descriptions since the start of the old series called for a reexamination of the jobs and job groupings for which trends were to be computed.
The new series covers the same job groupings as the earlier series with the following exceptions: The women clerical group is replaced by an office clerical group (men and women) and the industrial nurse category includes both men and women. Changes were also made in the jobs included within job groupings in order that an identical list could be employed in all areas.
Digitized for FRASER http://fraser.stlouisfed.org/ Federal Reserve Bank of St. Louis
5
Table 2. Percents of increase in standard weekly salaries and straight-time hourly earnings for selected occupational groups in Los Angeles—Long Beach, Calif., March 1961 to March 1962
and April I960 to March 1961
Industry and occupational group
Percent increases from—
March 1961 to
March 1962
April I960 to
March 1961
All industries:Office clerical (men and women) _____________ __ — 3.3 4.1Industrial nurses (men and women) ____ ____ _____ 3.8 3.0Skilled maintenance (men) ______ __ __ __ _ __ 3.2 4.0Unskilled plant (men) ___ _________________ _ __ _____ 3.2 3.4
Manufacturing:Office clerical (men and women) ________ ________ 3.4 3.4Industrial nurses (men and women) __ __ _____ — 3.3 2.9Skilled maintenance (men) ___ _____ _____ _______ _ 2 .8 4.1Unskilled plant (men) ___________________ ____ ______ 1 .9 ' 3.1
Table 3. Indexes of standard weekly salaries and straight-time hourly earnings March 1962 and March 1961, and percents
for selected occupational groups in Los Angeles—Long Beach, of increase for selected periods
Calif.,
Industry and occupational group
Indexes(February 1953 - 100) Percent increases from—
March 1962 March 1961March 1961
toMarch 1962
April I960 to
March 1961
March 1959 to
April 1960
March 1958 to
March 1959
March 1957 to
March 1958
March 1956 to
March 1957
March 1955 to
March 1956
March 1954 to
March 1955
February 1953 to
March 1954
All industries:145.8 141.1 3.3 4.0 4.2 4.6 3.3 6 .2 4.7 3.6 4.6
Industrial nurses (women) ______ 145.6 139.6 4.3 3.0 4.1 3.7 5.1 6 .0 4.3 2.5 5.4146.8 142.4 3.1 4.1 3.3 5.3 5.3 4.0 5.6 3.0 5.5146.1 141.5 3.2 3.4 3.4 5.1 5.3 5.3 3.4 3.6 6 .0
Manufacturing:146.1 141.4 3.3 3.5 4.2 4.5 4.4 5.8 4.3 3.6 5.2
Industrial nurses (women) _______ _ 146.6 141.9 3.3 2.9 4.1 4.3 5.6 5.3 4.3 2.5 6 .8146.7 142.7 2 .8 4.2 3.3 5.0 5.5 4.0 5.8 2.9 5.8
Unskilled plant (men) _________ __ _ 142.0 139.8 1 .6 3.5 4.3 4.2 5.4 4.4 3.9 3.5 4.9
Digitized for FRASER http://fraser.stlouisfed.org/ Federal Reserve Bank of St. Louis
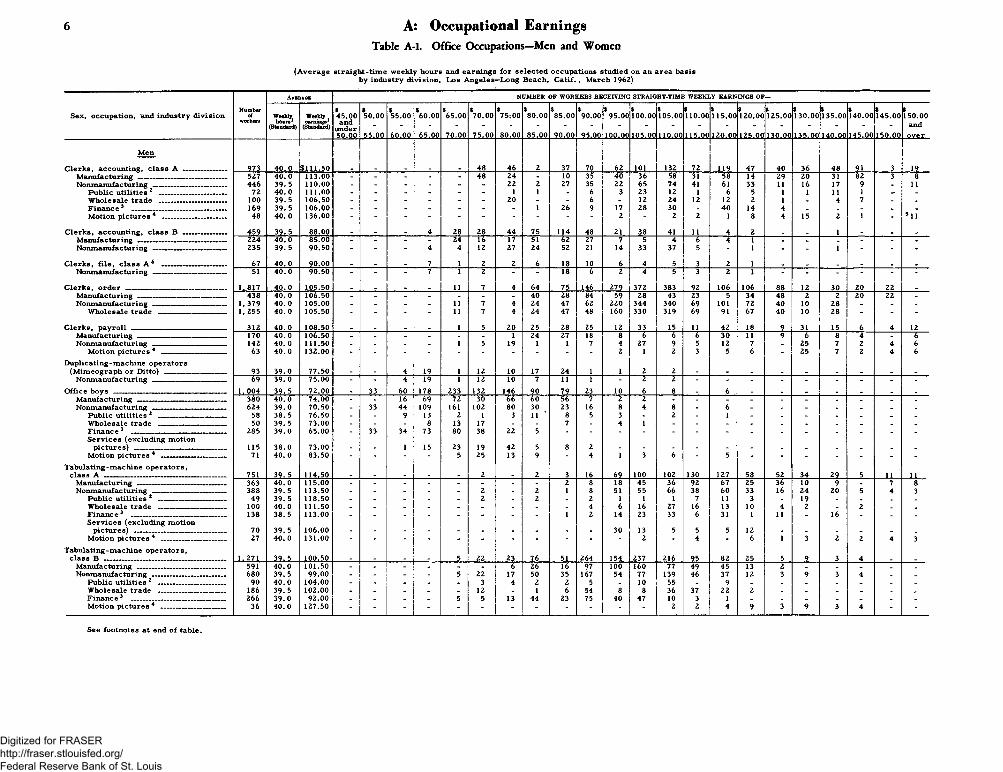
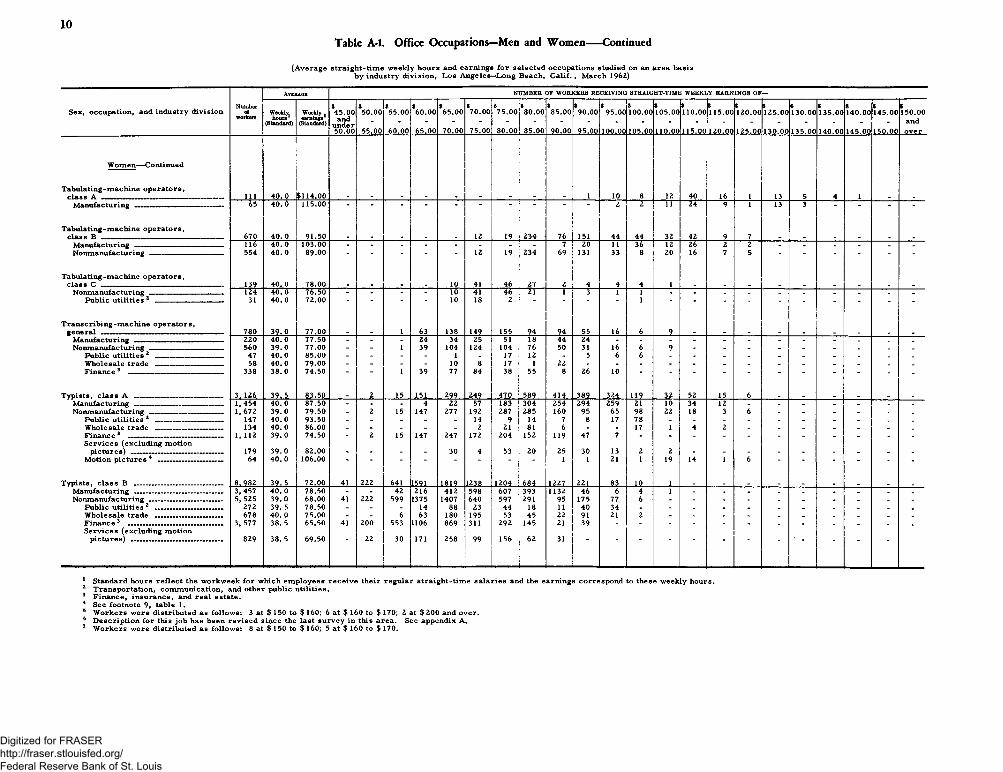
6 A: Occupational EarningsTable A-l. Office Occupations—Men and Women
(Average straight-time weekly hours and earnings for selected occupations studied on an area basis by industry division, Los Angeles—Long Beach, C alif., March 1962)
Sex, occupation, and industry divisionNumber
ofworkers
Atebaok NUM BER OF WORKERS RECEIVING STRAIGHT-TIME WEEKLY EARNINGS OF
(Standard)
W eekly.earnings1
(Standard)
45.00 and
under50.00
50.00
55.00
55.00
60.00
*60.00
65.00
*65.00
70.00
*70.00
75.00
*75;00
80.00
$80.00
85.00
*85.00
90.00
s90 .0 0
95.00
$95.00
10 0 .0 0
$10 0 .0 0
105.00
$105.00
1 1 0 .0 0
S1 1 0 .0 0
115.00
$115.00
1 2 0 .0 0
S1 2 0 .0 0
125.00
s125.00
130.00
$130.00
135.00
$135.00
140.00
$140.00
145.00
S145.00
150.00
S150.00
andover
Men
Clerks, accounting, class A ------------------ 973 40.0 $111.50 _ _ _ _ _ 48 46 2 37 70 62 1 0 1 132 72 119 47 40 36 48 91 3 19Manufacturing------------------------------------- 527 40.0 113.00 - _ _ - - 48 24 - 10 35 40 36 58 31 58 14 29 20 31 82 3 8Nonmanufacturing------------------------------- 446 39.5 1 1 0 .0 0 - - - - - - 2 2 2 27 35 2 2 65 74 41 6 1 33 1 1 16 17 9 - 1 1
Public utilities 2 __________________ 72 40.0 1 1 1 . 0 0 - - - - - - 1 1 - 6 3 23 1 2 1 6 5 1 1 1 1 1 - -Wholesale trade _ _ ----- 10 0 39.5 106.50 - - - - - - 20 - - 6 - 1 2 24 1 2 1 2 2 1 _ 4 7 - -Finance2 ...... , 169 39.5 106.00 - - - - - - - 1 26 9 17 28 30 - 40 14 4 . _ - _ _Motion pictures 4 --------------------------- 48 40.0 136.00 - - - - “ - - - - - 2 - 2 2 1 8 4 15 2 1 - 5 1 1
Clerks, accounting, class B ______ —------ 459 39.5 8 8 .0 0 _ _ _ 4 28 28 44 75 • 114 48 2 1 38 41 1 1 4 2 _ _ 1 _ _ _Manufacturing------------------------------------- 224 40.0 85.00 - - - - 24 16 17 51 62 27 7 5 4 6 4 1 - - . - - -Nonmanufacturing------------------------------- 235 39.5 90.50 - - - 4 4 1 2 27 24 52 21 14 33 37 5 1 - 1 - - -
Clerks, file, class A 6 --------------------------- 67 40.0 90.00 _ _ _ 7 1 2 2 6 18 10 6 4 5 3 2 1 _ _ _ _ _ _Nonmanufacturing ------------------------------- 51 40.0 90.50 - - 7 1 2 - - 18 6 2 4 5 3 2 1 - - - - - -
Clerks, order __ _______ __ ____ 1.817 40.0 105.50 _ _ _ _ 1 1 7 4 64 75 146 279 372 383 92 106 106 88 1 2 30 20 2 2 _Manufacturing __________ ____ __ - 438 40.0 106.50 - - - - - - - 40 28 84 59 28 43 23 5 34 48 2 2 20 2 2 -Nonmanufacturing ____________________ 1,379 40.0 105.00 - - - - 1 1 7 4 24 47 62 2 2 0 344 340 69 1 0 1 72 40 10 28 - _ -
Wholesale trade ---------------------------- 1, 255 40.0 105.50 - - - - 1 1 7 4 24 47 48 16 0 330 319 69 91 67 40 10 28 - - -
Clerks, payroll_______________ __________ 312 40.0 108.50 _ _ _ _ 1 5 20 25 28 25 1 2 33 15 1 1 42 18 9 31 15 6 4 1 2Manufacturing________________________ 170 40.0 106.50 - - - - - - 1 24 27 18 8 6 6 6 30 1 1 9 6 8 4 - 6Nonmanufacturing ____________________ 142 40.0 111.50 - - - - 1 5 19 1 1 7 4 27 9 5 1 2 7 - 25 7 2 4 6
Motion pictures 4 _________________ 63 40.0 132.00 - - - - - - - - - - 2 1 2 3 5 6 - 25 7 2 4 6
Duplicating-machine operators(Mimeograph or Ditto) _________________ 93 39.0 77.50 - - 4 19 1 1 2 10 17 24 1 1 2 2 - - - - - - - _ _
Nonmanufacturing ------------------------------- 69 39.0 75.00 - - 4 19 1 1 2 10 7 1 1 1 - 2 2 - - - - - - - - -Office boys _____ _____________ _ 1.004 39.5 72.00 . 33 60 178 233 132 146 90 79 23 10 6 8 _ 6 _ _ _ _ _ _ _
Manufacturing ________________________ 380 40. 0 74.00 - - 16 69 72 30 66 60 56 7 2 2Nonmanufacturing ____________________ 624 39. 0 70.50 - 33 44 109 1 6 1 1 0 2 80 30 23 16 8 4 8 - 6 - - - - - - -
Public utilities 2 __________________ 58 38. 5 76.50 - - 9 13 2 1 3 1 1 ‘ 8 5 3 - 2 - 1 - - - - _ _ _Wholesale trade __________________ 50 39. 5 73.00 - - _ 8 13 17 _ - 7 - 4 1Finance 2 ____ ___________________ 285 39.0 65.00 - 33 34 73 80 38 2 2 5 - - - - - - - _ _ _ _ _ _ _Services (excluding motion
pictures) _____ _____________ _____ 115 38.0 73.00 - - 1 15 23 19 42 5 8 2Motion pictures4 __ _ _____ ____ 71 40.0 83.50 - - - - 5 25 13 9 - 4 1 3 6 - 5 - - - - - - -
Tabulating-machine operators,class A _ _ _____ ____ ______________ 751 39.5 114.50 _ _ _ _ _ 2 _ 2 3 16 69 10 0 10 2 130 127 58 52 34 29 5 1 1 1 1
Manufacturing ------------------------------------- 363 40. 0 115.00 - - - - - - - - 2 8 18 45 36 92 67 25 36 10 9 _ 7 8Nonmanufacturing__ ________________ 388 39.5 113.50 - - - - - 2 - 2 1 8 51 55 66 38 60 33 16 24 20 5 4 3
Public utilities 2 __ ___________ __ 49 39.5 118.50 - - - - - 2 - 2 - 2 1 1 1 7 1 1 3 - 19 - _ _ .Wholesale trade __ ________ ___ 10 0 40.0 111.50 - _ _ - - - - _ - 4 6 16 27 16 13 10 4 2 _ 2 _ _Finance 2 _____________________ _____ 138 38.5 113.00 _ _ _ _ _ _ _ _ 1 2 14 23 33 6 31 1 1 1 _ 16 _ _ _Services (excluding motion
pictures) _________________________ 70 39.5 106.00 30 13 5 5 5 1 2 - . - - - _ _Motion pictures 4 --------------------------- 27 40.0 131.00 - - - - - - - - - - - 2 - 4 - 6 1 3 2 2 4 3
Tabulating-machine operators,class B ___________ ______________________ 1.271 39.5 100.50 - - - - 5 2 2 23 76 51 264 154 237 2 1 6 95 82 25 5 9 3 4 _ _
Manufacturing ________________________ 591 40.0 101.50 - - - - - - 6 26 16 97 10 0 16 0 77 49 45 13 2 _ _ _ _Nonmanufacturing ---------------- ------------ 680 39.5 99.00 - - - - 5 2 2 17 50 35 167 54 77 139 46 37 1 2 3 9 3 4 _ _
Public utilities 2 __________________ 90 40.0 104.00 - _ - - 3 4 2 2 5 - 10 55 - 9 - - - - _ _ _Wholesale trade __________________ 186 39.5 1 0 2 .0 0 _ . _ _ _ 1 2 _ 1 6 54 8 8 36 37 2 2 2 _ _ _ _ _ _Finance 3 ___________ „ 266 39.0 92.00 - _ - _ 5 5 13 44 23 75 40 47 10 3 1 - - - _ . _ _M o t i o n p i r t i i r p s 4 36 40.0 127.50 2 2 4 9 3 9 3 4
See footnotes at end of table.
Digitized for FRASER http://fraser.stlouisfed.org/ Federal Reserve Bank of St. Louis
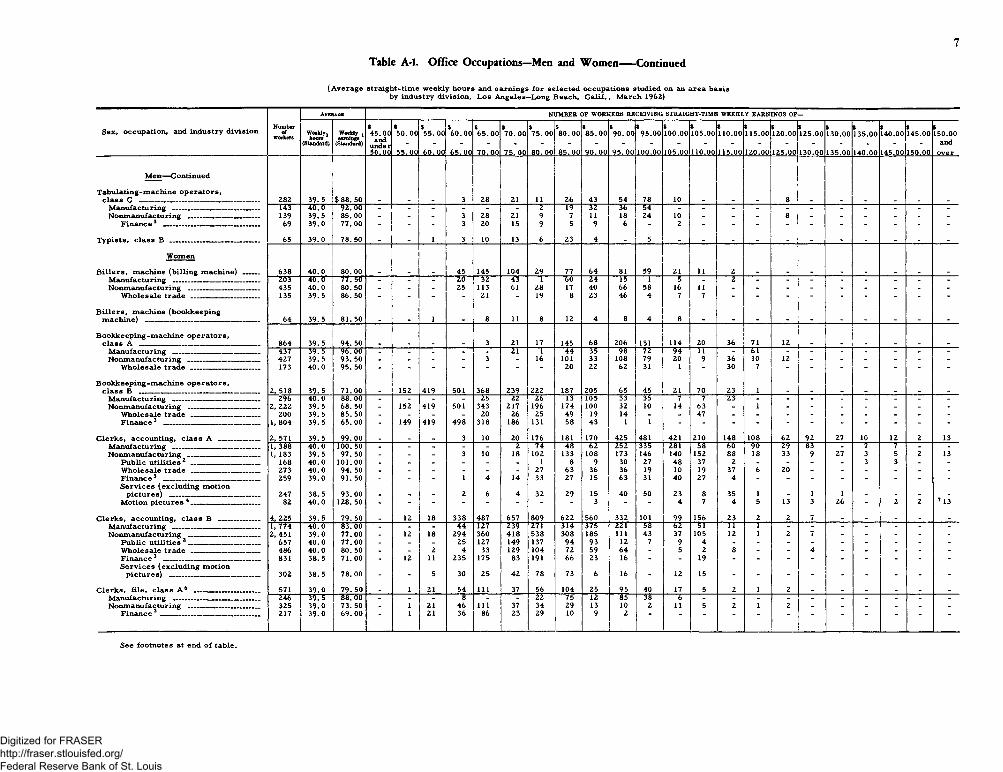
Table A-L Office Occupations—Men and W omen-----Continued
7
(Average straight-time weekly hours and earnings for selected occupations studied on an area basis by industry division, Los Angeles—Long Beach, Calif., March 1962)
Avebaok NUMBER OF WORKERS RECEIVING STRAIGHT-TIME WEEKLY EARNINGS OF-
Sex, occupation, and industry division Numberofworkers Weekly.hours(Standard)Weekly , earnings (Standard)
$45.00
andunder50.00
$50.00
55.00
$55.00
60.00
S60.00
65.00
*65. 00
70.00
$70.00
75.00
$75.00
80.00
$80.00
85.00
$85.00
90.00
$90.00
95.00
S95.00
100.00
$100.00
105.00
S105.00
110.00
$110.00
115.00
S115.00
120.00
$120.00
125.00
$125.00
130.00
$130.00
135.00
$135.00
140.00
$140.00
145.00
145.00
150.00
S150.00
andover
M en— Continued
Tabulating-m achine operators,cla ss C _____________________ ______ __ 282 39.5 $ 88.50 - - - 3 28 21 11 26 43 54 78 10 - - - 8 - - - - - -
Manufacturing ___ _____ __ ____ __ 143 40.0 92.00 - - - - - - 2 1$ 36 *4Nonmanufacturing _______ __ __ __ 139 39.5 85.00 - - - 3 28 21 9 7 l i 18 24 10 - - - 8 - - - - - -
F inan ce3 __________________________ 69 39.0 77.00 " - 3 20 15 9 5 9 6 - 2 - - - -
Typists, c la ss B ________________________ 65 39.0 78. 50 _ _ 1 3 10 13 6 23 4 _ 5 _ _ _ _ _ _ _ _ _ _ _
Women
B illers , m achine (billing m a c h in e )____ 638 40.0 80.00 _ _ _ 45 145 104 29 77 64 81 59 21 11 2 _ _ _ - _ . _ -Manufacturing ______ __ __ __ __ 203 40.0 77.60 - - - 20 3fc 43 1 60 24 1* 1 5 - 2 - - - - - - - -Nonmanufacturing __ __ ____ __ __ 435 40.0 80.50 - - - 25 113 61 28 17 40 66 58 16 11 - - - - - - - - -
W holesale trade ___________________ 135 39.5 86. 50 - - - - 21 “ 19 8 23 46 4 7 7 " - - - - - - -
B illers , m achine (bookkeepingm achine) ___________________ _____ _ 64 39.5 81.50 - - 1 - 8 11 8 12 4 8 4 8 - - - - - - - - - -
Bookkeeping-m achine operators,c la ss A ________ ___ ______ ____ __ 864 39.5 94. 50 - - - - 3 21 17 145 68 206 151 114 20 36 71 12 - - 1 - - -
Manufacturing ___ __ __ __ __ _____ *9.5 l O T _ _ _ - - 21 1 44 35 96 72 94 11 - 61 - - - - - - -Nonmanufacturing _____ __ __ __ __ 427 39.5 93. 50 - - - - 3 - 16 101 33 108 79 20 9 36 10 12 - - - - - -
W holesale trade ___________________ 173 40.0 95.50 - - - - - - 20 22 62 31 1 - 30 7 - - - - -
Bookkeeping-m achine operators,clas s B ________________________ 2, 518 39.5 71.00 - 152 419 501 368 239 222 187 205 65 45 21 70 23 1 - - - - - - -
Manufacturing ___ __ __ __ 2 % 40.0 88.00 - - - - 25 22 26 13 105 33 35 7 7 23 - - - - - - - -Nonmanufacturing _________ __ __ — 2, 222 39.5 68. 50 - 152 419 501 343 217 196 174 100 32 10 14 63 - 1 - - - - - - -
W holesale trade _____ __ __ __ __ 200 39.5 85.50 - - - - 20 26 25 49 19 14 - - 47 - - - - - - - - -F inan ce3 __________________________ 1, 804 39. 5 65.00 - 149 419 498 318 186 131 58 43 1 1
C lerks, accounting, c la ss A ___________ 2, 571 39.5 99.00 _ _ _ 3 10 20 176 181 170 425 481 421 210 148 108 62 92 27 10 12 2 13Manufacturing ________________________ 1, 388 40. 0 100. 50 - - - - - 2 74 48 62 252 335 281 58 60 90 29 63" - 7 7 - -Nonmanufacturing ___________________ 1, 183 39.5 97. 50 - - - 3 10 18 102 133 108 173 146 140 152 88 18 33 9 27 3 5 2 13
Public u tilit ie s2 ____________ _____ 168 40.0 101.00 - - - - - - 1 8 9 30 27 48 37 2 - - - - 3 3 - -W holesale trade ___________________ 273 40.0 94. 50 . - - - - - 27 63 36 36 19 10 19 37 6 20 - - - - - -Finance 3 ________________„ ____ 259 39.0 91. 50 - - - 1 4 14 33 27 15 63 31 40 27 4 - - - - - - - -Services (excluding m otion
pictures) ____ __ ______ 247 38.5 93.00 - - - 2 6 4 32 29 15 40 50 23 8 35 1 - 1 1 - - - -Motion pictures 4___________________ 82 40.0 128.50 - - - - - - - 3 - - 4 7 4 5 13 3 26 " 2 2 7 13
C lerks, accounting, c la ss B ___________ 4, 225 39. 5 79. 50 _ 12 18 338 487 657 809 622 560 332 101 99 156 23 2 2 7 _ _ _ _ _Manufacturing __ __ __ __ __ __ — 1, 774 40.0 8*. 00 - - - 44 127 239 271 314 375 221 58 62 51 11 1 - - - - - - -Nonmanufacturing ___________________ 2,451 39.0 77.00 - 12 18 294 360 418 538 308 185 111 43 37 105 12 1 2 7 - - - - -
Public utilities 2___________________ 657 40.0 77.00 . _ _ 25 127 149 137 94 93 12 7 9 4 - - - - - - - - -W holesale trade ___________________ 486 40.0 80. 50 - _ 2 4 33 129 104 72 59 64 - 5 2 8 - - 4 - - - - -F inan ce3 __ __ _ __ __ __ __ __ 831 38.5 71.00 - 12 11 235 175 83 191 66 23 16 - - 19 - - - - - - - - -S ervices (excluding m otion
pictures) -------------------------------------- 302 38.5 78. 00 - - 5 30 25 42 78 73 6 16 - 12 15 - " “ - - - - -
C lerks, file , c la ss A 6 __________________ 571 39.0 79. 50 _ 1 21 54 111 37 56 104 25 95 40 17 5 2 1 2 _ _ _ _ _ _Manufacturing -------------------- __ __ __ 246 39.5 88.00 - - - 8 - - 22 75 12 85 *6 6 - - - - - - - - - -Nonmanufacturing ___________________ 325 39.0 73. 50 - 1 21 46 I l l 37 34 29 13 10 2 11 5 2 1 2 - - - - - -
F in an ce3 ___ ____ __ __ __ __ __ 217 39.0 69. 00 1 21 36 86 23 29 10 9 2
See footnotes at end of table,
Digitized for FRASER http://fraser.stlouisfed.org/ Federal Reserve Bank of St. Louis
8
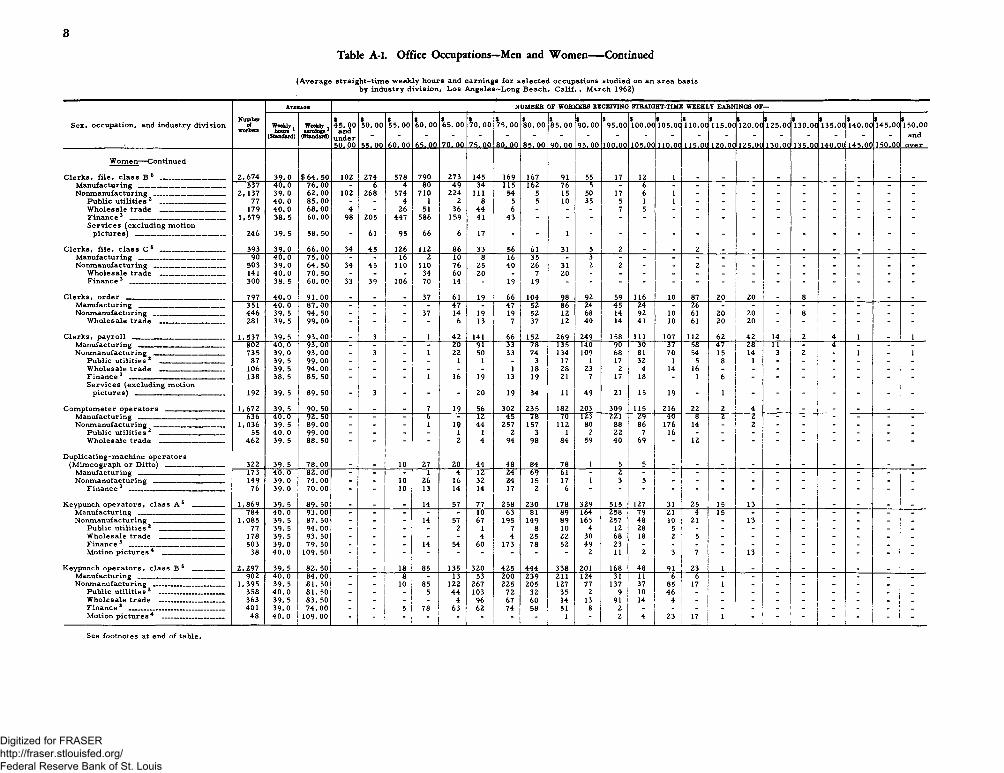
Table A-l. Office Occupations—Men and W omen— Continued
(Average straight-time weekly hours and earnings for selected occupations studied on an area basisby industry division, Los Angeles—Long Beach, Calif. , March 1962)
Sex, occupation, and industry divisionNumber
ofworkers
Avebaox NUMBER OF WORKERS RECEIVING STRAIGHT-TIME WEEKLY EARNINGS OF
Weekly hours 1 (Standard)Weeklyearnings1(Standard)
45.00 and
under50.00
50.00
55. 00
55.00
60. 00
l o . 00
65.00
I s . 00
70.00
70. 00
75.00
S75. 00
80.00
80.00
85.00
85.00
90.00
90. 00
95.00
S95.00
100.00
*100.00
105.00
S105.00
110.00
$110.00
115.00
S115.00
120.00
1120.00
125.00
1125.00
130.00
$130.00
135.00
*135.00
140.00
s140.00
145.00
*145.00
150.00
*150.00and
over
Women— Continued
Clerks, file , class B 6 _ _ . . . 2,674 39.0 $ 64. 50 102 274 578 790 273 145 169 167 91 55 17 12 1 _ _ _ _ _ _ _ _ _34 115 l62 76 5 g
Nonmanufacturing 2, 137 39.0 62.00 102 268 574 710 224 111 54 5 15 50 17 6 1 - _ _ _ _ _ _ _ _Public utilities 2 ______ 77 40 .0 85.00 - - 4 1 2 8 5 5 10 35 5 1 1 - - - - - - - - -W holesale trade __ 179 40 .0 68.00 4 - 26 51 36 44 6 - - - 7 5Finance3 _________________________ 1,579 38. 5 60.00 98 205 447 586 159 41 43Services (excluding motion
pictures) 246 39.5 58. 50 - 61 95 66 6 17 - - 1
Clerks, file , class C 6 __________________ 593 39.0 66.00 34 45 126 112 86 33 56 61 31 5 2 _ _ 2 _ _ _ _ _ _ _ _M anufacturin g_______________________ 90 40 .0 75.00 - - 16 2 10 8 16 35 - 3Nonmanufacturing ___________________ 503 39.0 64. 50 34 45 110 110 76 25 40 26 31 2 2 - - 2 - - - - - - - -
W holesale trade __________________ 141 40 .0 70. 50 - - - 34 60 20 - 7 20Finance3 _ 300 38. 5 60.00 33 39 106 70 14 - 19 19 - - - - - - - " - " - - -
Clerks, order 797 40 .0 91. 00 _ _ _ 37 61 19 66 104 98 92 59 116 10 87 20 20 _ 8 _ _ _ _Manufacturing 351 40 .0 87. 00 - - - - 47 - 47 52 86 ZT 45 24 - 26 - - - - - - - -Nonmanufacturing 446 39.5 94. 50 - - - 37 14 19 19 52 12 68 14 92 10 61 20 20 - 8 - - - -
W holesale trade __________________ 281 39.5 99.00 - " - - 6 13 7 37 12 40 14 41 10 61 20 20 " " " -
Clerks, payroll ___ ... 1,537 39. 5 93. 00 _ 3 _ 1 42 141 66 152 269 249 158 111 107 112 62 42 14 2 4 1 _ 1Manufacturing 802 40. 0 93.00 - - - - — Z0" 91 33 78 135 140 90 """50 37 58 47 28 11 - ----- T ~ - - -Nonmanufacturing __ 735 39. 0 93. 00 - 3 - 1 22 50 33 74 134 109 68 81 70 54 15 14 3 2 - 1 - 1
Public utilities 2 87 39. 5 99.00 - - - - 1 1 - 3 17 1 17 32 1 5 8 1 - - - - - -W holesale trade __ _ _ 106 39.5 94.00 - - - - - - 1 18 28 23 2 4 14 16 - - - - - - - -F inance3 _________ __ __ __ _ __ 138 38. 5 85. 50 - - - 1 16 19 13 19 21 7 17 18 - 1 6 - - - - - - -Services (excluding motion
p i c t u r e s ) ___________ 192 39. 5 89. 50 3 - - 20 19 34 11 49 21 15 19 - 1 " - - - - - -
Comptometer operators ________________ 1,672 39.5 90. 50 _ _ _ 7 19 56 302 235 182 203 309 115 216 22 2 4 - - _ _ > _Manufacturing _ __________ .... 65T" 40. 0 92. 50 - - - 6 - 12 45 78 70 i2S 221 29 40 8 2 2 - - - - - -Nonmanufacturing ___________________ 1,036 39. 5 89.00 - - - l 19 44 257 157 112 80 88 86 176 14 - 2 - - - - - -
Public u tilit ies2 _ _ _ __ _ 55 4 0 .0 99. 00 - - - - 1 1 2 3 1 2 22 7 16 - - - - - - - - -W holesale trade __________________ 462 39. 5 88. 50 - - - - 2 4 94 98 84 59 40 69 " 12 - - - - - -
Duplicating-machine operators(Mimeograph or Ditto) ________________ 322 39. 5 78.00 - - 10 27 20 44 48 84 78 1 5 5
Manufacturing _ _ _ 173 40. 0 82. 00 - - - 1 4 12 24 69 61 - 2 - - - - - - - - - - -Nonmanufacturing ___ 149 39.0 74. 00 - - 10 26 16 32 24 15 17 1 3 5
Finance3 __________________________ 76 39.0 70.00 - 10 13 14 14 17 2 6
Keypunch operators, class A 6 _________ 1,869 39.5 89. 50 _ - _ 14 57 77 258 230 178 329 515 127 3 1 i 25 15 13 - - _ - _ _Manufacturing _______________________ 784 40. 0 93. 00 - - - - - 10 63 81 89 164 258 79 21 ! 4 15 - - - - - - -Nonmanufacturing ___________________ 1,085 39. 5 87. 50 - - - 14 57 67 195 149 89 165 257 48 io ! 21 - 13 - - - - - -
Public utilities 2 _________________ 77 39. 5 94.00 - - - - 2 1 7 8 10 4 12 28 5 ! - - - - - - - - _W holesale trade __________________ 178 39.5 93. 50 - - - - - 4 4 25 22 30 68 18 2 5 - - - - - - _ _F inance3 _______ __ __ 503 39. 0 79. 50 - - - 14 54 60 173 78 52 49 23 - - - - - - - - - - -Motion p ictu res4 38 40 .0 109.50 - - - - " “ - - - 2 11 2 3 7 - 13 - - - - -
Keypunch operators, class B 6 _________ 2,297 39. 5 82. 50 - - 18 85 135 320 425 444 338 201 168 48 91 23 1 - - - - - _ _Manufacturing _______________________ 9 0 2 40 .0 84. 00 - - 8 - 13 53 200 239 211 124 31 11 6 6 - - - - - - - -Nonmanufacturing __ __ __ 1,395 39. 5 81. 50 - - 10 85 122 267 225 205 127 77 137 37 85 17 1 - - - - - - _
Public u tilit ies2 __ __ _ 358 40. 0 81. 50 - - - 5 44 103 72 32 35 2 9 10 46 - - - - - - - _ _Wholesale trade __________________ 363 39. 5 83. 50 - - - - 4 96 67 60 14 13 91 14 4 - - - - - - _ _ _Finance 2 401 39. 0 74. 00 5 78 63 62 74 58 51
1g 2
Motion pictures4 _________________ 48 40.0 1 0 9 .0 0 - -_ i
2 4 23 i 17 1 - ' - | | - - _ i -
See footnotes at end of table,
Digitized for FRASER http://fraser.stlouisfed.org/ Federal Reserve Bank of St. Louis
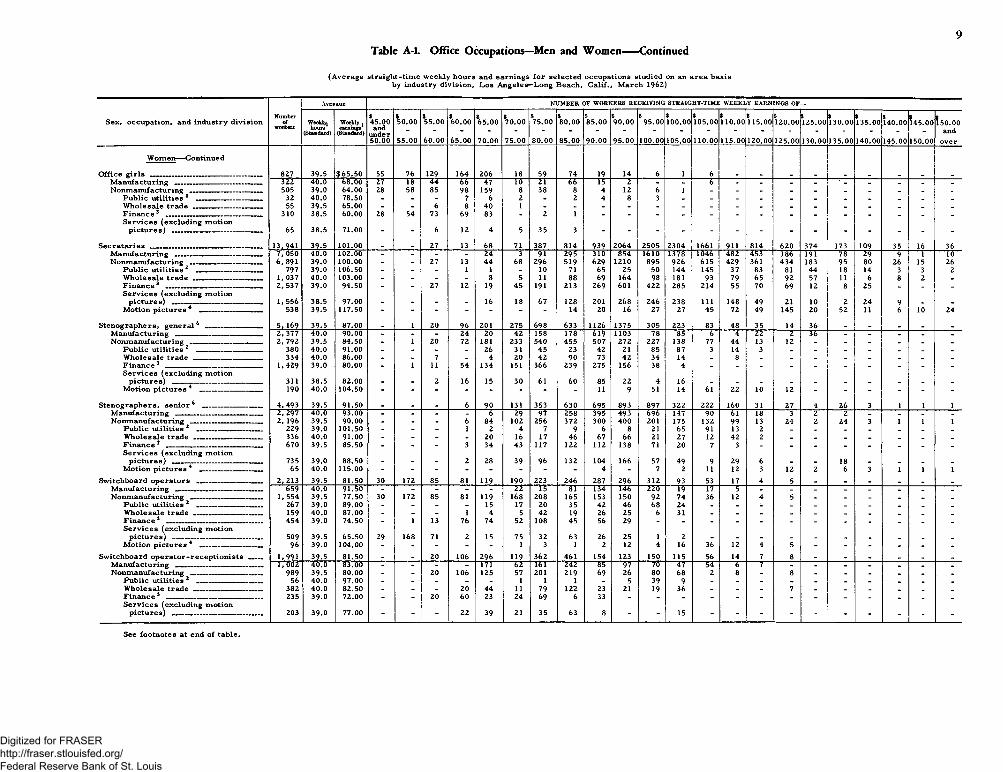
Table A-l. Office Occupations—Men and W omen-----Continued9
(Average straight-time weekly hours and earnings for selected occupations studied on an area basisby industry division, Los AngelesHLong Beach, Calif., March 1962)
Average NUM BER OF WORKERS RECEIVING STRAIGH T-TIM E WEEKLY EARNINGS OF—
Sex, occupation, and industry division
Women— Continue d
Office g i r l s _______________________Manufacturing ________________Nonmanufacturing ____________
Public utilities 2 __________Wholesale tra d e ___________Finance3 __________________Services (excluding motion
pictures) _________________
Secretaries _______________________Manufacturing ________________Nonmanufacturing____________
Public utilities 2 __________Wholesale tra d e ___________Finance3 __________________Services (excluding motion
pictures) _________________Motion pictures4 _________
Stenographers, general6 ________Manufacturing ________________Nonmanufacturing ____________
Public utilities 2 __________Wholesale tra d e___________Finance 3 __________________Services (excluding motion
pictures) _________________Motion pictures 4 _________
Stenographers, senior6 ___________Manufacturing __________________Nonmanufacturing ______________
Public utilities 2 ____________Wholesale tr a d e _____________Finance3 _____________________Services (excluding motion
Motion pictures 4 ____________Switchboard operators __________
Manufacturing________________Nonmanufacturing ____________
Public utilities 2 __________Wholesale tra d e___________Finance3 __________________Services (excluding motion
pictures) _________________Motion pictures 4 _________
Switchboard operator-receptionists____Manufacturing ________________________Nonmanufacturing ___________________
Public utilities 2 __________________Wholesale tra d e___________________
Services (excluding motion pictures) _________________________
Number $ $ $ $ $ $ $ $ $ $ $ $ S $ $ $ $ $ $1 4 5 .0 0
$of Weekly Weekly j 4 5 .0 0 5 0 .0 0 5 5 .0 0 6 0 .0 0 6 5 .0 0 7 0 .0 0 7 5 .0 0 8 0 .0 0 8 5 .0 0 9 0 .0 0 9 5 .0 0 1 0 0 .0 0 1 0 5 .0 0 1 1 0 .0 0 1 1 5 .0 0 1 2 0 .0 0 1 2 5 .0 0 1 3 0 .0 0 1 3 5 .0 0 1 4 0 .0 0 1 5 0 .0 0workers hours earnings and and(Standard) (Standard)
5 0 .0 0 5 5 .0 0 6 0 .0 0 6 5 .0 0 7 0 .0 0 7 5 .0 0 8 0 .0 0 8 5 .0 0 9 0 .0 0 9 5 .0 0 1 0 0 .0 0 1 0 5 .0 0 1 1 0 .0 0 1 1 5 .0 0 1 2 0 .0 0 1 2 5 .0 0 1 3 0 .0 0 1 3 5 .0 0 1 4 0 .0 0 1 4 5 .0 0 1 5 0 .0 0 o v e r
827 3 9 .5 $ 6 5 .5 0 55 76 129 1 64 2 0 6 18 59 74 19 14 6 1 63^2 4 0 .0 6 8 .0 0 27 18 4 4 66 47 10 21 66 15 2 - - 6 - _ _ _ • _ _ _ _ _505 3 9 .0 6 4 .0 0 28 58 85 9 8 159 8 38 8 4 12 6 1
32 4 0 .0 7 8 .5 0 _ _ _ 7 6 2 _ 2 4 8 355 3 9 .5 6 5 .0 0 _ _ 6 8 4 0 1
310 3 8 .5 6 0 .0 0 28 54 73 69 83 - 2 1
65 3 8 .5 7 1 .0 0 - - 6 12 4 5 35 3
1 3 ,9 4 1 3 9 .5 1 0 1 .0 0 _ _ 27 13 68 71 3 8 7 8 1 4 9 39 2 0 6 4 2 5 0 5 2 3 0 4 1661 911 8 1 4 6 2 0 3 7 4 173 109 35 16 367 , 050 4 0 .0 1 0 2 .0 0 - - - - 24 3 91 2 9 5 3 1 0 8 5 4 1610 137 8 104 6 4 8 2 4 53 186 191 78 29 9 1 106 ,8 9 1 3 9 .0 1 0 0 .0 0 _ _ 27 13 4 4 68 2 96 5 1 9 629 1 21 0 8 9 5 9 2 6 6 1 5 429 361 4 3 4 183 9 5 80 26 15 26
797 3 9 .0 1 0 6 .5 0 - - - 1 1 - 10 71 65 25 50 144 145 37 83 81 4 4 18 14 3 3 21, 037 4 0 .0 1 0 3 .0 0 _ - - _ 8 5 11 88 69 164 98 181 93 79 65 9 2 57 11 6 8 2 _2 , 537 3 9 .0 9 4 .5 0 " " 27 12 19 4 5 191 213 269 601 4 2 2 2 8 5 2 14 55 70 69 12 8 25 - - -
1 , 556 3 8 .5 9 7 .0 0 _ _ _ _ 16 18 67 128 201 268 2 4 6 238 111 148 4 9 21 10 2 24 9 . _538 3 9 .5 1 1 7 .5 0 - - - - - 14 20 16 27 27 45 72 49 145 20 52 11 6 10 24
5 , 169 3 9 .5 8 7 .0 0 _ 1 20 9 6 201 275 6 9 8 6 3 3 112 6 1 37 5 3 0 5 223 83 4 8 35 14 36 _ _ _ _ _2 , 377 4 0 .0 9 0 .0 0 - - - 2 4 20 4 2 158 178 6 19 1103 78 85 6 4 22 2 36 - - _ _ _2 , 792 3 9 .5 8 4 .5 0 - 1 20 72 181 233 5 40 4 5 5 507 2 7 2 2 2 7 138 77 4 4 13 12 _ _ _ _ _ _
380 4 0 .0 9 1 .0 0 _ - - - 26 31 4 5 23 42 21 85 87 3 14 3 _ _ _ _ _ _ _334 4 0 .0 8 6 .0 0 - - 7 _ 4 20 4 2 90 73 4 2 34 14 _ 8 _ _ _ _ _ _ _ _
1 ,4 2 9 3 9 .0 8 0 .0 0 1 11 5 4 1 3 4 151 3 66 2 39 275 156 38 4
311 3 8 .5 8 2 .0 0 _ _ 2 16 15 30 61 60 85 22 4 16190 4 0 .0 1 0 4 .5 0 " - - - - - 11 9 51 14 61 22 10 12 - - - - - -
4 ,4 9 3 3 9 .5 9 1 .5 0 _ _ _ 6 9 0 131 353 6 3 0 6 95 893 897 3 2 2 222 160 31 27 4 26 3 1 1 12 , 297 4 0 .0 9 3 .0 0 - - - - 6 29 97 2 58 395 4 9 3 6 9 6 147 90 61 18 3 2 2 - _ _ _2 , 196 3 9 .5 9 0 .0 0 - - - 6 8 4 102 256 3 7 2 300 4 0 0 201 175 132 99 13 24 2 24 3 1 1 1
229 3 9 .0 1 0 1 .5 0 - - - 1 2 4 7 9 6 8 21 65 91 13 2 _ _ > _ _ _ _336 4 0 .0 9 1 .0 0 - - _ _ 20 16 17 4 6 67 66 21 27 12 4 2 2 _ _ _ _ _ _ _670 3 9 .5 8 5 .5 0 - - - 3 3 4 43 117 122 112 138 71 20 7 3 - - - - - - - -
735 3 9 .0 8 8 .5 0 _ _ _ 2 28 39 96 132 104 166 57 49 9 29 6 _ _ 18 _ .65 4 0 .0 115.0.0 - - - - - - - - 4 - 7 2 11 12 3 12 2 6 3 1 1 1
2 , 213 3 9 .5 8 1 .5 0 30 172 85 81 119 190 223 246 287 2 96 3 12 93 53 17 4 5 _ _ _ _ _659 4 0 .0 9 1 .5 0 - - - - - 22 15 81 134 146 2 20 19 17 5 _ _ _ _ _ _ _ _
1, 5 5 4 3 9 .5 7 7 .5 0 30 172 85 81 119 168 208 165 153 150 92 74 36 12 4 5 _ _ _ _ _ _267 3 9 .0 8 9 .0 0 _ _ _ _ 15 17 20 35 42 4 6 68 24159 4 0 .0 8 7 .0 0 _ . _ 1 4 5 4 2 19 26 25 6 314 5 4 3 9 .0 7 4 .5 0 - 1 13 76 74 52 108 4 5 56 29 - - - - - - - - - - -
509 3 9 .5 6 5 .5 0 29 168 71 2 15 75 3 2 63 26 25 1 2 _ _ _ _ _ _ _ _ . _96 3 9 .0 1 0 4 .0 0 - - - - - 1 3 1 2 12 4 16 36 12 4 5 - - - - - -
1 ,9 9 1 3 9 .5 8 1 .5 0 - - 20 106 2 9 6 119 3 6 2 461 154 123 150 115 56 14 7 8 _ _ _ _ _ _1 , 002 4 0 .0 8 3 .0 0 - - - - 171 62 161 2 4 2 85 97 70 47 54 6 7 - - _ _ _ _ _
989 3 9 .5 8 0 .0 0 _ _ 20 106 125 57 201 2 19 69 26 80 68 2 8 _ 8 _ _ _ _ _ _56 4 0 .0 9 7 .0 0 _ - _ _ _ 1 1 1 _ 5 39 9
3 82 4 0 .0 8 2 .5 0 - - - 20 4 4 11 79 122 23 21 19 36 _ - - 7 _ _ _ _ _235 3 9 .0 7 2 .0 0 - - 20 6 0 23 24 69 6 33
203 3 9 .0 7 7 .0 0 - - - 22 39 21 35 63 8 - - 15
See footnotes at end of table.
Digitized for FRASER http://fraser.stlouisfed.org/ Federal Reserve Bank of St. Louis
10Table A-L Office Occupations—Men and W omen— Continued
(Average straight-time weekly hours and earnings for selected occupations studied on an area basisby industry division, Los Angeles-Long Beach, C alif., March 1962)
Sex, occupation, and industry division
Average NUMBER OF W ORKERS RECEIVING STRAIGHT-TIME WEEKLY EARNINGS OF
Number $ $ $ $ s $ $ $ $ $ $ $ $ $ $ $ s $ $ $ S tof
workersWeekly.hours
(Standard)
W eekly.earnings
(Standard)
45.00 and
under50.00
50.00
55.00
55.00
60.00
60.00
65.00
65.00
70.00
70.00
75.00
75.00
80.00
80.00
85.00
85.00
90.00
90.00
95.00
95.00
100.00
100.00
105.00
105.00
110.00
110.00
115.00
115.00
120.00
120.00
125.00
125.00
130.00
130.00
135.00
135.00
140.00
140.00
145.00
145.00
150.00
150.00andover
111 40 .0 $114.00 10 8 12 40 16 13 5 4 165 40 .0 115.00 - " “ " “ “ 2 2 11 24 9 1 13 3 _
670 40 .0 91.50 12 19 234 76 151 44 44 32 42 9 7116 40 .0 103.00 - - - - - - - - 7 20 11 36 12 26 2 2 _ _ _ _ _ _554 40 .0 89.00 ~ ~ ■ ■ 12 19 234 69 131 33 8 20 16 7 5 • ■ " - -
139 40 .0 78.00 10 41 46 27 2 4 4 4124 40 .0 76.50 - - - - 10 41 46 21 1 3 1 1 - - _ _ _ _ _ _ _ .31 40 .0 72.00 ■ ■ " 10 18 2 " " " ■ 1 ■ ■ • - • - -
780 39.0 77.00 1 63 138 149 155 94 94 55 16 6 9220 40 .0 77.50 - - - 24 34 25 51 18 44 24 - _ - _ - _ . _ . _ _560 39.0 77.00 _ _ 1 39 104 124 104 76 50 31 16 6 9 _ _ _ _ _ _ _ _ _47 40 .0 85.00 _ - _ _ 1 - 17 12 - 5 6 658 40 .0 79.00 _ _ - . 10 8 17 1 22 . - _ _ _ _ _ . _ _ _ _ .
338 38.0 74.50 - - 1 39 77 84 38 55 8 26 10 - - - “ - - - - - - -
3. 126 39.5 83.50 2 15 151 299 249 470 589 414 389 324 119 32 52 15 61,454 40 .0 87.50 - - - 4 22 57 183 304 254 294 259 21 10 34 12 - _ _ _ _ _ _1, 672 39.0 79.50 - 2 15 147 277 192 287 285 160 95 65 98 22 18 3 6 _ - _ _ _ _
147 40 .0 93.50 _ _ _ _ _ 14 9 14 7 8 17 78 - _ _ _ _ _ _ _ _ _134 40 .0 86.00 - - _ - - 2 21 81 6 - - 17 1 4 2 - - - _ _ _ _
1, 112 39. 0 74.50 - 2 15 147 247 172 204 152 119 47 7 - - - - - - - - - -
179 39.0 82.00 _ _ _ _ 30 4 53 20 25 30 13 2 2 _ _ _ _ _ _ .64 40 .0 106.00 - - - - - - 1 1 21 1 19 14 1 6 - - - - - -
8.982 39. 5 72.00 41 222 641 1591 1819 1238 1204 684 1227 221 83 10 !3,457 40. 0 78.50 - - 42 216 412 598 607 393 1132 46 6 4 1 - - _ _ _ _ _ _ _5, 525 39.0 68.00 41 222 599 1375 1407 640 597 291 95 175 77 6
272 39.5 78.50 - - _ 14 88 23 44 18 11 40 34 - _ - _ - . _ _ _ _ .678 40 .0 75.00 - - 6 63 180 195 53 45 22 91 21 2 - _ - _ _ - _ _ _ _
3, 577 38. 5 65.50 41 200 553 1106 869 311 292 145 21 39
829 38. 5 69.50
'
22 30 171 258 99 156 62 31
' ' ' '
“
'
■ - ■
Women— Continued
Tabulating-machine operators, class A .
Manufacturing
Tabulating-machine operators, class B _______________________
Manufacturing------Nonmanufacturing
Tabulating-machine operators, class C
Nonmanufacturing ___Public utilities 1 2
Transcribing-machine operators,
Manufacturing Nonmanufacturing _
Public utilities 2 Wholesale trade Finance3 ----------
Typists, class AManufacturing _____Nonmanufacturing
Public utilities 2 Wholesale trade Finance 3Services (excluding motion
pictures)Motion pictures 4 5 6 7 ____
Typists, class B ----Manufacturing Nonmanufacturing —
Public utilities 2 Wholesale trade Finance 3Services (excluding motion
pictures)
1 Standard hours reflect the workweek for which employees receive their regular straight-time salaries and the earnings correspond to these weekly hours.2 Transportation, communication, and other public utilities.3 Finance, insurance, and real estate.4 See footnote 9, table 1.5 Workers were distributed as follows: 3 at $ 150 to $ 160; 6 at $ 160 to $ 170; 2 at $200 and over.6 Description for this job has been revised sipce the last survey in this area. See appendix A.7 Workers were distributed as follows: 8 at $ 150 to $ 160; 5 at $ 160 to $ 170.
Digitized for FRASER http://fraser.stlouisfed.org/ Federal Reserve Bank of St. Louis
11
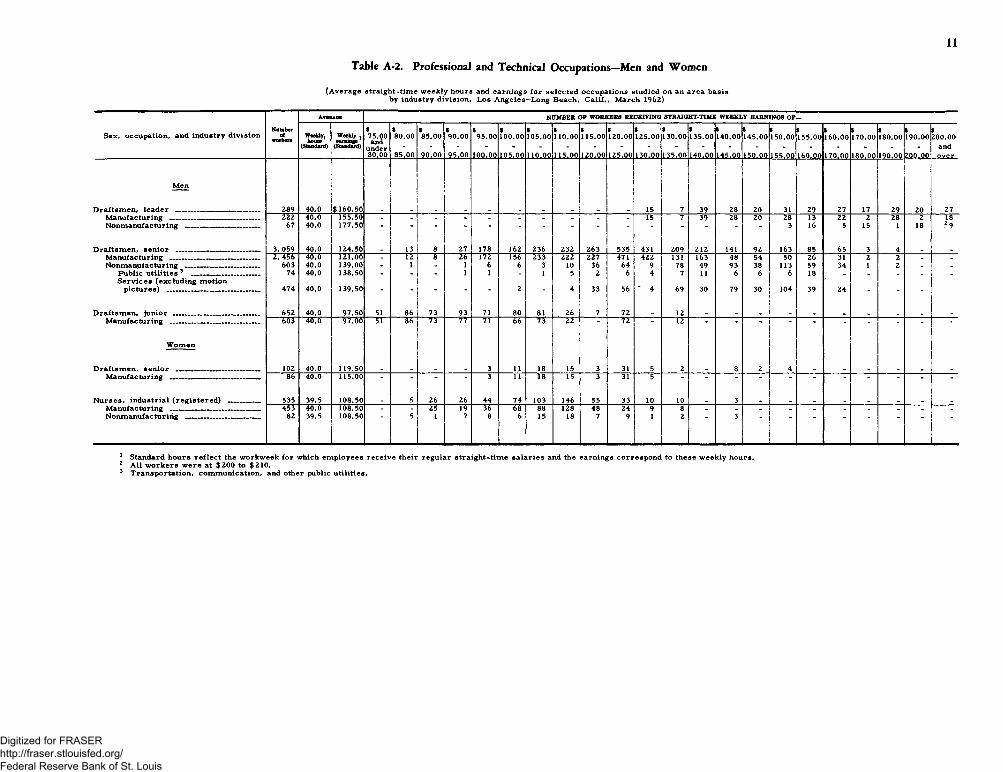
Table A-2. Professional and Technical Occupations—Men and W omen
(Average straight-time weekly hours and earnings for selected occupations studied on an area basis by industry division, Los Angeles—Long Beach, Calif., March 1962) 1 2 3
Sex, occupation, and industry divisionNumber
ofworkers
Avbbaqb NUMBER OF WORKERS RECEIVING STRAIGHT-TIME WEEKLY EARNINGS OF-
Weekly,hours(Standard)Weekly,earnings(Standard)
S75.00 and
under80.00
$80.00
85.00
t85.00
90.00
S90.00
95.00
$95.00
100.00
*100.00
105.00
$105.00
110.00
$110.00
115.00
$115.00
120.00
$120.00
125.00
$125.00
130.00
$130.00
135.00
$135.00
140.00
S140.00
145.00
$145.00
150.00
1150.00
155.00
S155.00
160.00
s160.00
170.00
S170.00
180.00
S180.00
150.00
S190.00
200.00
*200.00
andover
Men
D raftsm en, leader ________— — -------------- 289 40.0 $160.50 _ _ _ _ . . . . . 15 7 39 28 20 31 29 27 17 29 20 27Manufacturing ________________ _________ 222 40.0 155.50 - - - - - - - - - - 15 7 39 28 20 28 13 2 2 2 28 2 18Nonmanufacturing ------------------------------- 67 40.0 177.50 ■ • ■ - - - - - “ - - 3 16 5 15 1 18 2 9
Draftsm en, senior ----------------------------------- 3, 059 40.0 124.50 . 13 8 27 178 162 236 232 263 535 431 209 212 141 92 163 85 65 3 4Manufacturing __________ ______________ 2, 456 40.0 121.00 - 12 8 £ 6 172 156 233 2 2 2 227 471 422 131 163 48 54 50 26 31 2 2 . -Nonmanufacturing ______ _______ _____ 603 40.0 139.00 - 1 - 1 6 6 3 10 36 64 9 78 49 93 38 113 59 34 1 2 - -
Public utilities 3 _ __ ________ _ 74 40.0 138.50 - - - 1 1 _ 1 5 2 6 4 7 11 6 6 6 18 _ _ _ _ _S erv ices (excluding motion
pictures) --------------------------------------- 474 40.0 139.50 - - “ “ 2 - 4 33 56 ' 4 69 30 79 30 104 39 24 - - -
D raftsm en, junior _____________________ _ 652 40.0 97.50 51 86 73 93 71 80 81 26 7 72 . 12 . .Manufacturing ________________________ 50T 40.0 r u m 51 86 73 77 71 66 73 22 72 - 12 - - - - - - - - -
Women
D raftsm en, senior _______________________ 102 40.0 119.50 _ _ 3 11 18 15 3 31 5 2 . 8 2 4 . . .Manufacturing ________________________ 86 40.0 115.00 " ■ " " 3 11 18 15 3 31 5
N urses, industrial (reg istered) _____ 535 39.5 108.50 _ 5 26 26 44 74 103 146 55 33 10 10 . 3 . . _Manufacturing ________________________ 453 ” 4 0 108.50 - - 25 19 36 68 88 128 48 24 9 8 - - _ _ _ - _ _ - _Nonmanufacturing ____________________ 82 39.5 108.50 5 1 7 8 6 15 18 7 9 2 3
1 Standard hours reflect the workweek for which employees receive their regular straight-time salaries and the earnings correspond to these weekly hours.2 All workers were at $200 to $210.3 Transportation, communication, and other public utilities.
Digitized for FRASER http://fraser.stlouisfed.org/ Federal Reserve Bank of St. Louis
12
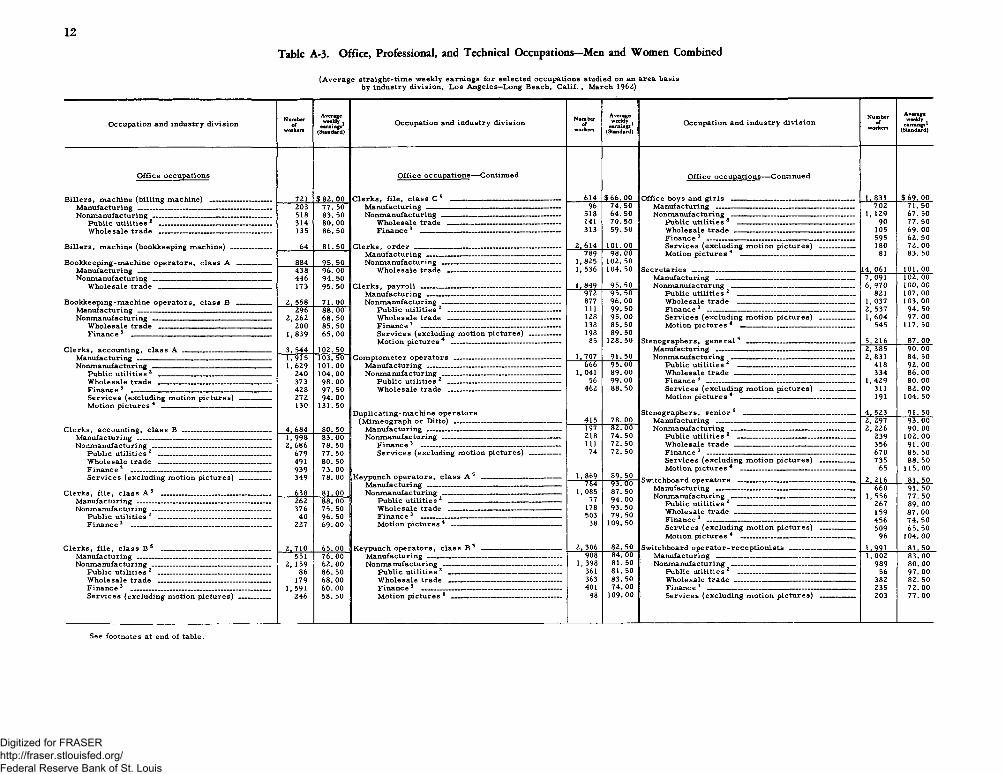
Table A-3. Office, Professional, and Technical Occupations—Men and Women Combined
(Average straight-time weekly earnings for selected occupations studied on an area basisby industry division, Los Angeles—Long Beach, Calif. , March 1962)
Occupation and industry division
O ffice occupations
B illers, machine (billing machine)Manuf a c tu r i ng ---------------------------Nonmanufacturing ----------------- -—
Public utilities 2 ____________W holesale trade ____________
Numberof
workers
Average weekly ,
earnings1 (Standard)
721203518314135
$82 . 00 77. 50 83. 50 80.00 86. 50
Occupation and industry division
O ffice occupations— Continued
C lerks, file , c la ss C 5Manufacturing -------Nonmanufacturing
W holesale trade F inan ce3 ______
B illers, machine (bookkeeping machine) _______
Bookkeeping-machine operators, cla ss A __Manufacturing _____________________________Nonmanufacturing
Wholesale trade
Bookkeeping-machine operators, class BManufacturing _________________________Nonmanufacturing _____________________
Wholesale trade ____________________
Clerks, accounting, c la ss A ______________Manufacturing __________________________Nonmanufacturing ----------------------------------
Public utilities 2 _____________________Wholesale trade _____________________F inan ce3 ____________________________Services (excluding m otion pictures) Motion pictures 4 ____________________
Clerks, accounting, class B _____________________Manufacturing ----------------------------------------------------Nonmanufacturing ---------------------------------------------
Public utilities 2 ____________________________W holesale trade ____________________________F inan ce3 ___________________________________Services (excluding motion pictures) ---------
C lerks, file , class A 5 _____Manufacturing ------------------Nonmanufacturing -----------
Public utilities 2 ______F inance3 _____________
64 81.50
884 95. 50438 96. 00446 94.50173 95. 50
2. 558 71.00296 88. 00
2, 262 68. 50200 85. 50
1, 839 65. 00
3. 544 102.501,915 103.501,629 101.00
240 104.00373 98.00428 97. 50272 94. 00130 131.50
4. 684 80. 501,998 83. 002, 686 78. 50
679 77. 50491 80. 50939 73.00349 78. 00
638 81.00262 88. 00376 75. 50
40 96. 50227 69. 00
C lerks, order ______________________________Manufacturing -----------------------------------------Nonmanufacturing ______________________
W holesale trade _____________________
C lerks, payroll -------------------------------------------Manufacturing -----------------------------------------Nonmanufacturing ----------------------------------
Public utilities 2 _____________________W holesale trade _____________________F inan ce3 ____________________________Services (excluding m otion pictures) Motion pictures 4 -------------------------------
Com ptom eter operators ___________________Manufacturing -----------------------------------------Nonmanufacturing ----------------------------------
Public utilities 2 _____________________W holesale trade _____________________
Duplicating-machine operators(M im eograph or Ditto) ___________________
Manufacturing -----------------------------------------Nonmanufacturing ----------------------------------
F inan ce3 -------------------------------------------Services (excluding m otion pictures)
Keypunch operators, class A 5Manufacturing _____________Nonmanufacturing --------------
Public utilities 2 _______Wholesale trade ------------Finance3 _______________Motion pictures 4 _______
Clerks, file , cla ss B 5 ____________________Manufacturing -----------------------------------------Nonmanufacturing ______________________
Public utilities 2 _____________________Wholesale trade _____________________
Services (excluding m otion pictures)
2.710 551
2, 159 86
179 1, 591
246
65.0076.00 62. 00 86. 5068.00 60.00 58. 50
Keypunch operators, classManufacturing --------------Nonmanufacturing --------
Public utilities 2 ____W holesale trade ___F inan ce3 ___________Motion pictures 4 ___
B 5
Numberofworkeri
Average weekly . earnings (Standard)Occupation and industry d ivision
Numberof
Averageweeklyearnings1(Standard)
O ffice occupations— Continued
614 $66 .00 Office boys and g ir ls _________ __ __ __ ____ __ 1.831 $69. 0096 74. 50 702 71. 50
518 64. 50 Nonmanufacturing ---------------------------------------------------- 1, 129 67. 50141 70. 50 Public utilities 2 ------------------------------------------------- 90 77. 50313 59. 50 Wholesale trade -------------------------------------------------- 105 69. 00
1 Finance3 595 62. 502, 614 101.00 1 Services (excluding m otion pictures) _________ 180 72. 00
789 1, 825
98.00 I Motion p ictu res4 __ ___ _ ____ 81 83. 50102.50
1, 536 104.50 Secretaries ___ ________ _____________ ____ ______ 14,061 101. 00M anufacturin g_-________ __________ ____________ 7, 091 102.00
1,849 95. 50 Nonmanufacturing __ _______ ____ ________ 6, 970 100. 00972 95. 50 Public utilities 2 821 107.00877 96. 00 Wholesale trade ---------------- ------------ ------------ 1,037 103. 00111 99.50 Finance 3 ____ _____ ____________________ ______ 2, 537 94. 50128 95.00 Services (excluding m otion pictures) _________ 1, 604 97. 00138 85.50 Motion p ictu res4 __________ ____ ___________ 545 117.50198 89. 5085 128.50 Stenographers, g en era l5 ------------ -------- _ _____ „ 5. 216 87. 00
Manufacturing ----------- --------------------- — --------------- 2, 385 90. 001,707 91.50 Nonmanufacturing __ ___ ________________________ 2, 831 84. 50
666 95. 00 Public utilities c _ ____________ 418 92. 00 86. 001, 041 89. 00 Wholesale trade ----------------- __ — ----------------- 334
56 99.00 1 Fi nanc e 3 . . 1,429 80. 00462 88.50 Services (excluding m otion pictures) _________ 311 82. 00
Motion pictures 4 ------------------------------------------------ 191 104.50
Stenographers, s e n io r5 ______________________________ 4, 523 91. 50415 78.00 | Manufacturing -___—_____ _______________________ 2, 297 93. 00197 82.00 Nonmanufacturing ---------------------------------------------------- 2, 226 90. 00218 74.50 Public u tilit ie s2 __ ______ __ __ _____ 239 102.00111 72. 50 Wholesale trade __ ---------------------- ----- — __ 356 91. 0074 72. 50 Finance 3 -______ _______ _____ ____________ _____ 670 85. 50
Services (excluding m otion pictures) _________ 735 88. 50
1,869 89. 50Motion p ictu res4 ------ ----- ----------------------------- 65 115. 00
Switchboard operators ____ 2. 216 81 50784 1, 085
93. 00 87. 50 660 91. 50
77 94. 00 Nonmanufacturing --------------------------------------------------- 1, 556 77. 50Public utilities 2 _ _____ ______ 267 89. 00
87. 00 74. 50 65. 50
178 93. 50 Wholesale trade _ __ 159456509
503 79. 50 Finance3 _ ___38 109.50 Services (excluding m otion pictures) _________Motion pictures 4 --------------------- ----------------------- 96 104.00
2, 306 82.50 |Switchboard o p e ra to r -re ce p t io n is ts --------------------------- 1.991 81. 509081 84.00 Manufacturing ....... .. ............... 1, 002 83. 00
1, 398 81.50 Nonmanufacturing ------------------- __ — — ------- — 989 80. 00361 81.50 Public u tilit ie s 2 56 97. 00
82. 50363 83. 50 W h o lesa le t r a d e ___ ___ ________ _________ 382401 74. 00 F in a n c e 3 _____________ _____________________ ____ _ 235 72. 00
48 109.00 Services (excluding m otion pictures) --------------- 203 77. 00
See footnotes at end of table.
Digitized for FRASER http://fraser.stlouisfed.org/ Federal Reserve Bank of St. Louis
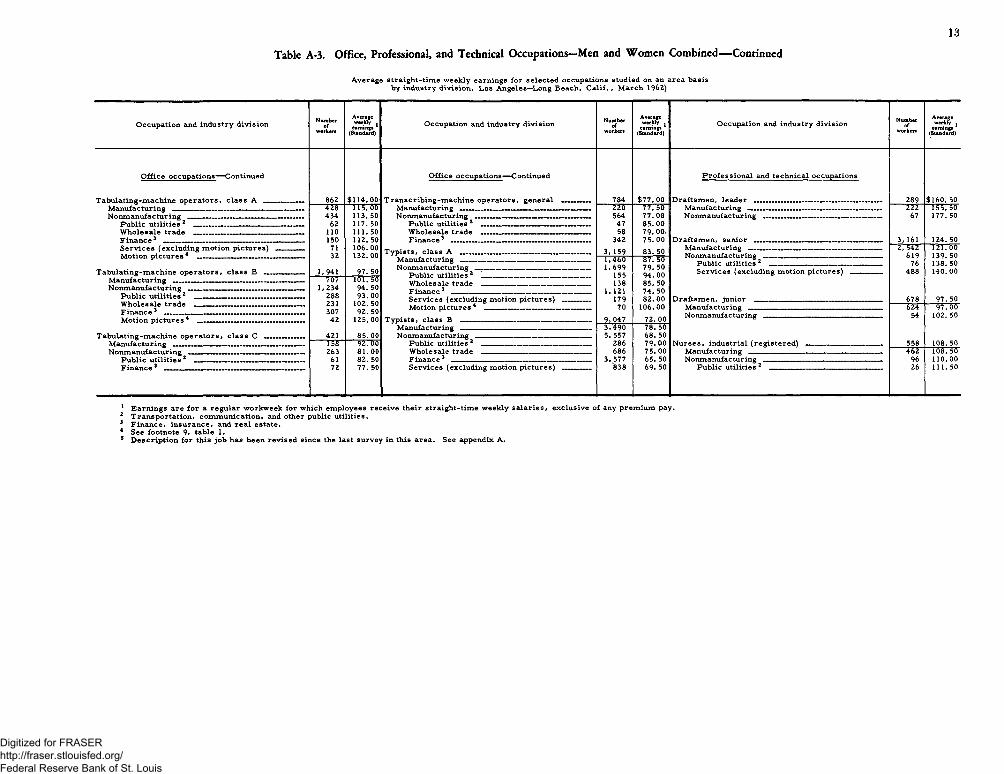
Table A-3. Office, Professional, and Technical Occupations—Men and W omen Combined— Continued
13
Average straight-tim e weekly earnings for selected occupations studied on an area basis by industry division, Los Angeles—Long Beach, Calif. , M arch 1962)
Occupation and industry division
O ffice occupations— Continued
Tabulating-m achine operators, c la ss A _Manufacturing __________________________Nonmanufacturing ---------------- ------------------
Public u tilit ie s1 2 _____________________W holesale trade _____________________F inan ce3 ___________________ _________Serv ices (excluding m otion pictures) Motion pictures 4 5 ____________________
Tabulating-m achine operators, c la ss BManufacturing _______________________N onm anufacturing___________________
Public utilities 2 _________________W holesale trade _________________F in an ce3 __________________________Motion p ictu res4 ________________
Tabulating-m achine operators, cla ss CManufacturing _______________________Nonmanufacturing ___________________
Public utilities 2 _________________F in an ce3 __________________________
Numberofworkers
Average weekly , earnings (Standard)Occupation and industry division Numberof
Average weekly , earnings (Standard)
O ffice occupations— Continued
862 $114.00 Transcribing-m achine operators, general 784 $77.00----- 428“ 115. 00 Manufacturing _____ __ ____ ___ 2 2 0 77. 50
434 113.50 Nonmanufacturing — __ ____ ___ 564 77.0062 117.50 Public u tilit ies2 . ______ __ — 47 85.00
1 1 0 111 .50 W holesale trade __ — __ _ ___ 58 79.00.150 112.50 F inance3 ____ 342 75.0071 106.00 T yp ists, class A ___ 3, 159 83. 5032 132.00 Manufacturing _ _ __ __ ____ __ __ __ “ l','4S0' 87. 50
1 Q11 97. 50 N onm anufacturing_______________________________ 1,699 79. 50PiiHir ntiliHes ® 155 94. 00707 101.50 W holesale trade ____ - ___ __ __ 138 85. 501,234 94. 50o l Aft Finance 3 __________ _____ _______________ ____ 1 , 1 2 1 74. 50288
231y5. UU
102. 50 Services (excluding motion pictures) 179 82.00307 92*. 50 Motion p ictu res4 ___________________ _________ 70 106.0042 125.00 T yp ists, class B __ ____ _ __ __ __ ____ 9,047 72. 00
Manufacturing __ __ ___ __ _ __ -------- 3,490 78. 50421 85.00 N onmanufac tur ing _______________________________ 5, 557 6 8 . 50158 9 2 . 00 Public utilities 2 ______________________________ 286 79-00263 81.00 W holesale trade ________ ____ __ _ ____ 686 75.00
61 82. 50 Finance 3 _____ __________________________ _ 3,577 65. 5072 77. 50 Services (excluding motion pictures) ________ 838 69. 50
Occupation and industry division Numberof weekly j earnings (Standard)
P rofessional and technical occupations
Draftsm en, leader _ _____ __ — __ __________ ___ 289 $160. 50Manufacturing ____________ _____________________ 222 155. 50Nonmanufacturing ____________ ____ _ ____ __ 67 177.50
D raftsm en, senior ____ __ __________________ _ _ 3, 161 124.502, 542 121. 00
Nonmanufacturing ______ ___ ____ __ _________ 619 139. 50Public u tilit ies2 _ __ _________________ ____ 76 138.50Services (excluding m otion pictures) ____ ___ 488 140. 00
Draftsm en, junior . _ __ _ __ _ _ ____ 678 97. 50Manufacturing ____ _ _ ___________ _____ _ ------ 624" 97.00Nonmanufacturing __ __ __ ___ _________________ 54 102. 50
N urses, industrial (reg istered) -------------------------------- 558 108. 50Manufacturing __ __ __ __ ___________ ____ 462 108.50Nonmanufacturing __ ______________________ ___ 96 110.00
Public u tilit ies2 _ ___________ _ _____________ 26 111 .50
1 Earnings are fo r a regular workweek for which em ployees receive their straight-tim e weekly sa laries, exclusive of any prem ium pay.2 Transportation, com m unication, and other public utilities.3 Finance, insurance, and rea l estate.4 See footnote 9» table 1.5 D escription for this job has been revised since the last survey in this area. See appendix A.
Digitized for FRASER http://fraser.stlouisfed.org/ Federal Reserve Bank of St. Louis
14
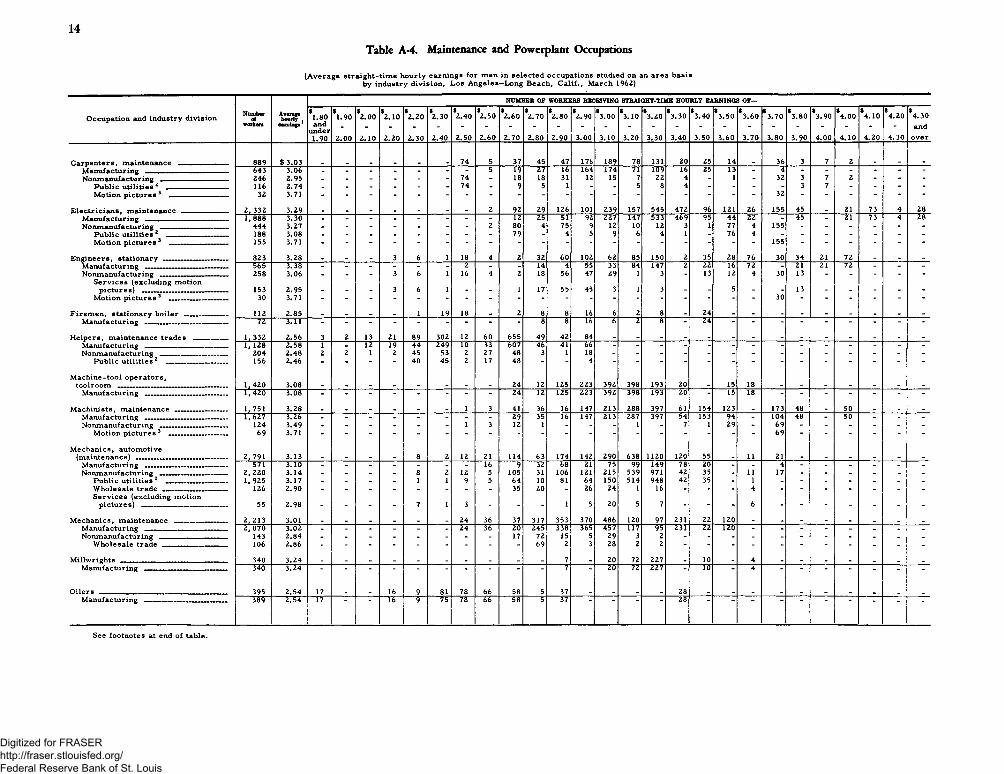
Table A-4. Maintenance and Powerplant Occupations
(Average straight-tim e hourly earnings for men in selected occupations studied on an area basis by industry division, Los Angeles—Long Beach, C alif., March 1962)
NUMBER OF WORKERS RECEIVING STRAIGHT-TIME HOURLY EARNINGS OF—
Occupation and industry division Numberof Averagehourly .
<1.80
$1.90
$2 .0 0
92 . 1 0
92 .2 0
92.30
92.40
92.50 *2 .6 0
92.70
92.80 *2.90 93.00
93.10 *3.20 *3.30 *3.40 *3.50 *3.60 *3.70 *3.80 *3.90
94.00 *4.10 *4.20 *4.30
workers earnings and an<junder1.90 2 .0 0 2 . 1 0 2 .2 0 2.30 2.40 2.50 2.60 2.70 2.80 2.90 3.00 3.10 3.20 3.30 3.40 3.50 3.60 3.70 3.80 3.90 4.00 4.10 4.20 4.30 over
Carpenters, maintenance 889 $3.03 74 5 37 45 47 176 189 78 131 20 25 14 36 3 7 2Manufacturing 643 3.06 - - - - - - - 5 19 27 16 164 174 71 109 16 25 13 - 4 - - - - - -Nonmanufacturing . . . 246 2.95 - - - - - - 74 - 18 18 31 12 15 7 2 2 4 - 1 - 32 3 7 2 - - -
Public utilities 2 _________________ 116 2.74 - - - - - - 74 - 9 5 1 - - 5 8 4 - - - - 3 7 - - - -M otion pictures 3 32 3.71 - - - - " - - - " - " - “ - - - - " 32 " - - -
E lectricians, maintenance ------------------- 2, 332 3.29 _ _ _ _ _ _ 2 92 29 126 1 0 1 239 157 545 472 96 1 2 1 26 155 45 _ 2 1 73 4 28Manuf actur ing 1 , 8 8 8 3.30 - - - - - - - - 1 2 25 51 92 227 147 533 469 95 44 2 2 - 45 - 2 1 73 4 28Nonmanufacturing __________________ 444 3.27 - - - - - - - 2 80 4 75 9 1 2 10 1 2 3 1 77 4 155 - - - - - -
Public utilities 2 _________________ 188 3.08 - - - - - - - - 79 - 4 5 9 6 4 1 - 76 4 - - - - - - -M otion pictures 3 ________________ 155 3.71 - - - * - - - - - - - - - - - - - - - 155 - - - - - -
Engineers, s ta tion a ry ____________— __ 823 3.28 _ _ 3 6 1 18 4 2 32 60 1 0 2 62 85 150 2 35 28 76 30 34 2 1 72 _ _ _Manufacturing 565 3.38 - - - - - - 2 - - 14 4 55 33 84 147 2 11 16 72 - 2 1 2 1 72 - - -Nonmanufacturing 258 3.06 - - - 3 6 1 16 4 2 18 56 47 29 1 3 - 13 1 2 4 30 13 - - - - -
Services (excluding m otionpictures) _____ ____ ______ ....___ 153 2.95 - - - 3 6 1 - - 1 17 55 45 3 1 3 - - 5 - - 13 - - - - -
Motion pictures 3 30 3.71 - " - - " - " - - - - " - - 30 " - “ - -
Firem en, stationary boiler 1 1 2 2.85 _ _ _ _ 1 19 18 _ 2 8 8 16 6 2 8 _ 24Manufacturing __ _ _ 72 3.11 - - - - - ~ - - 8 8 16 6 2 8 24
H elpers, maintenance trades ---- ------- 1,332 2.56 3 2 13 2 1 89 302 1 2 60 655 49 42 84M anufacturin g___________ ___________ 1 , 128 2.58 1 - 1 2 19 44 249 1 0 33 607 46 41 66Nonmanufacturing _ _ 204 2.48 2 2 1 2 45 53 2 27 48 3 1 18
Public u tilit ies2 . _ . 156 2.46 - - - 40 45 2 17 48 " 4
M achine-tool operators.toolroom ___________ __________ 1,420 3.08 - - - - - - - - 24 1 2 125 223 392 398 193 20 - 15 18 - - - - - - -
Manufacturing ______________________ 1,420 3.08 * - - - - - 24 1 2 125 223 392 398 193 20 15 18 - - - -M achinists, m ain ten an ce______________ 1, 751 3.28 _ _ _ _ _ 1 3 41 36 16 147 213 288 397 61 154 123 _ 173 48 _ 50 _ _ _
Manufacturing _ _ . . . . . 1, 627 3.26 - _ - - _ - - - 29 35 16 147 213 287 397 54 153 94 - 104 48 - 50 - - -Nonmanufacturing . . . 124 3.49 - - - - - - 1 3 1 2 1 - - - 1 - 7 1 29 - 69 - - - - - -
Motion pictures 3 _______________ 69 3.71 - " - - - - - - - ~ - - - - " 69 " - -
M echanics, automotive(maintenance) . . . . . — — 2,791 3.13 _ - - _ 8 2 1 2 2 1 114 63 174 142 290 638 1 1 2 0 1 2 0 55 - 1 1 2 1 - - - - - -
M anufacturin g----------------------------------- 571 3.10 _ _ - _ _ _ . 16 9 32 68 2 1 75 99 149 78 20 - - 4 - - - - - -Nonmanufacturing ---------------------------- 2 ,2 2 0 3.14 - - - - 8 2 1 2 5 105 31 106 1 2 1 215 539 971 42 35 - 1 1 17 - - - - - -
Public u tilit ies2 . . 1,925 3.17 _ - _ _ 1 1 9 5 64 10 81 64 150 514 948 42 35 - 1 - - - - - - -W holesale trade . . . . ____ 126 2.90 _ _ _ _ . _ - _ 35 20 _ 26 24 1 16 - - - 4 - - - - _ _ _Services (excluding motion
pictures) ------------------------------------ 55 2.98 - - 7 1 3 - - - 1 5 20 5 7 - 6 " - - - -
M echanics, maintenance . . . . 2, 213 3.01 _ _ _ _ _ _ 24 36 37 317 353 370 486 12 0 97 231 22 1 2 0 _ _ _ _ _ _ _ _Manufacturing _______________ _____ 2,070 3.02 _ _ - - _ _ 24 36 20 245 338 365 457 117 95 231 22 1 2 0 - - - - _ - _N onm anufacturing__________________ 143 2.84 - - - - - - - - 17 72 15 5 29 3 2
W holesale t r a d e __________________ 106 2 .8 6 - - - - " - 69 2 3 28 2 2
M i l l w r i g h t s _ _ __ ___ __ 340 3.24 _ _ _ _ _ _ _ _ _ _ 7 _ 20 72 227 _ 10 _ 4 _ _ _ _ _ _Manufacturing _ _ ____ __ 340 3.24 - - - - - 7 “ 20 72 227 - 10 4 - - " - -
O i l e r s _____ 395 2.54 17 16 9 81 78 66 58 5 37 . . . 28 . . . . _ .Manufacturing ______________________ 389 2.54 17 16 9 75 78 58 5 37 28
See footnotes at end of table.
Digitized for FRASER http://fraser.stlouisfed.org/ Federal Reserve Bank of St. Louis
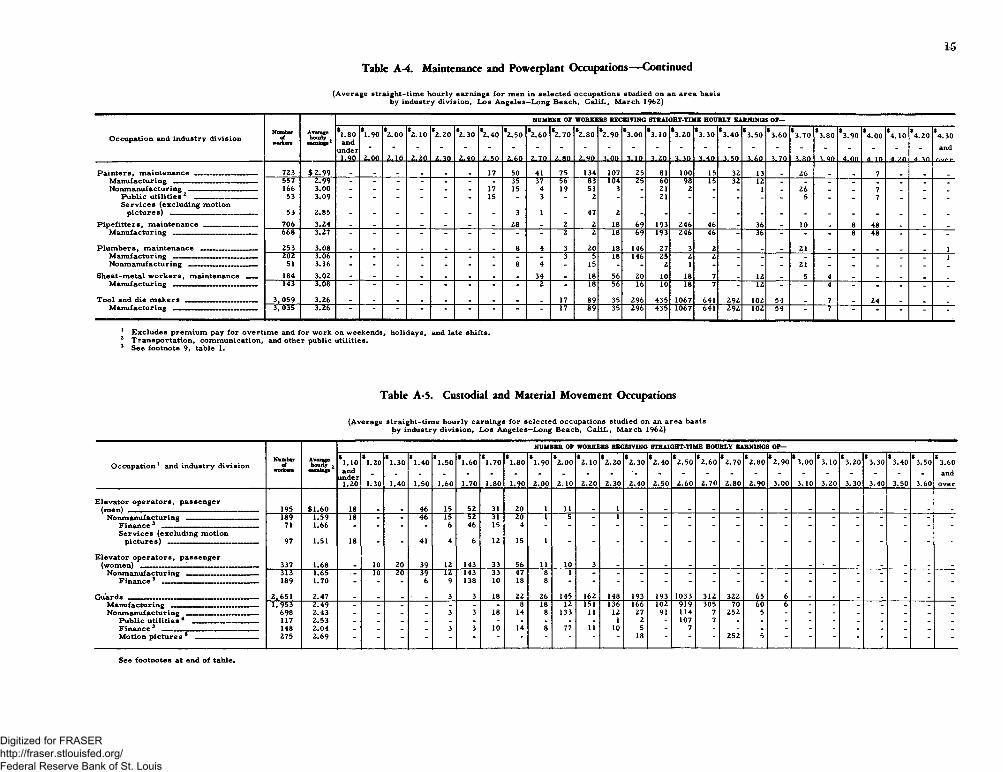
Table A-4. Maintenance and Powerplant Occupations— Continued
(Average straight-time hourly earnings for men in selected occupations studied on an area basisby industry division, Los Angeles—Long Beach, Calif., March 1962)
NUMBER OP WORKERS RECEIVING STRAIGHT-TIME HOURLY EARNINGS OF—
Occupation and industry divisionNumber Average hourly j *1.80 *1.90 *2 .0 0 *2 . 1 0 *2 .2 0 *2.30 *2.40 *2.50 *2.60 *2.70 *2.80 *2.90 *3.00 *3.10 *3.20 *3.30 *3.40 *3.50 *3.60 *3.70 *3.80 *3.90 *4.00 *4.10 *4.20 *4.30
under and1.90 2 .0 0 2 . 1 0 2 .2 0 2.30 2.40 2.50 2.60 2.70 2.80 2.90 3.00 3.10 3.20 3.30 3.40 3.50 3.60 3.70 3.80 3.90 4.00 4. 10 4.20 4 30 n w r
Painters, m a in ten a n ce-------------------------- 723 $2.99 _ 17 50 41 75 134 107 25 81 10 0 15 32 13 26 7M an u factu rin g ----------------------------------- 557 2.99 - - - - - - - 35 37 56 83 104 25 60 98 15 32 1 2Nonmanufacturing 166 3.00 - - - - - - 17 15 4 19 51 3 - 2 1 2 - - 1 _ 26 _ 7 _ _ _
Public utilities 2 __ 53 3.09 - - - - _ _ 15 _ 3 _ 2 - _ 2 1 _ _ _ _ _ 5 _ _ 7 _ _ _Serv ices (excluding m otion
p i c t u r e s ) ------------------------------------ 53 2.85 - - - - - - - 3 1 - 47 2
P ipefitters, m a in ten an ce___—____ _____ 706 3.24 - - - - - - - 28 - 2 2 18 69 193 246 46 - 36 - 1 0 _ 8 48 . _ _M an u factu rin g_______________________ 668 3.27 2 2 18 69 193 246 46 - 36 - 8 48 - - -
P lum bers, maintenance 253 3.08 _ - _ _ _ _ _ 8 4 3 20 18 146 27 3 2 _ _ _ 2 1 _ _ _ _ _ 1Manufacturing _______________________ 2 0 2 37oS~ 3 5 18 146 25 2 2 1Nonmanufacturing ----------------------------- 51 3.16 - - - - - - - 8 4 - 15 - - 2 1 - - - - 2 1 - - - - - -
Sheet-m etal w ork ers, maintenance ___ 184 3.02 34 - 18 56 20 10 18 7 _ 1 2 _ 5 4 _ _ _ _ _Manufacturing ----------------------------------- 143 3.08 2 - 18 56 16 10 18 7 - 1 2 - 4 - - - -
T ool and die m akers ------------------------------ 3,059 3.26 17 89 35 296 435 1067 641 292 1 0 2 54 _ 7 _ 24 _ .Manufacturing ----------------------------------- 3, 035 LIS- 17 89 35 296 435 1067 641 292 1 0 2 54 7 ■ - " - -
1 Excludes prem ium pay for overtim e and for work on weekends, holidays, and late shifts.2 Transportation, com munication, and other public utilities.3 See footnote 9, table 1.
Table A>5. Custodial and Material Movement Occupations
(Average straight-tim e hourly earnings for selected occupations studied on an area basis by industry division, Los Angeles—Long Beach, C alif., M arch 1962)
NUMBER OP WORKERS RECEIVING STRAIGHT-TIME HOURLY EARNINGS OP—
O ccupation 1 and industry divisionNumber
ofworkers
Average hourly ,
earning!
«1 . 1 0and
under1 .2 0
S1 .2 0
1.30
$1.30
1.40
$1.40
1.50
$1.50
1.60
*1.60
1.70
S1.70
1.80
*1.80
1.90
$1 .9 0
2 .0 0
*2 .0 0
2 . 1 0
*2 . 1 0
2 .2 0
*2 .2 0
2.30
*2.30
2.40
t 2.40
2.50
*2.50
2.60
*2.60
2.70
*2.70
2.80
*2.80
2.90
*2.90
3.00
*3.00
3.10
*3.10
3.20
S3.20
3.30
*3.30
3.40
*3.40
3.50
*3.50
3.60
*3.60and
over
Elevator operators, passenger(men) __ 195 $1.60 18 - - 46 15 52 31 20 1 1 1 - 1
N onm anufacturing------------------------------ 189 1.59 18 - - 46 15 52 31 20 1 5 - 1Finance ̂ _ 71 1 .6 6 - - - - 6 46 15 4S ervices (excluding m otion
pictures) 97 1.51 18 - - 41 4 6 1 2 15 1Elevator operators, passenger
(women) - - - - 337 1 .6 8 _ 10 20 39 1 2 143 33 56 11 10 3----- 313 1.65 10 20 39 — r r 143 33 47 g 1
189 1.70 & 9 138 10 18 g
Guards 2,651 2.47 3 3 18 22 26 145 162 148 193 193 1033 312 322 65 6Manufacturing 1,953 2.49 _ _ _ _ _ _ - 8 18 1 2 151 136 166 1 0 2 919 305 70 60 6 - - _ _ . _ _Nonmanufacturing _____—— 698 2.43 - - _ - 3 3 18 14 8 133 11 1 2 27 91 114 7 252 5
iJPllK11 S* lltlllfl AA ^ 117 2.53 1 2 107 7Finance 3 148 2 ! 04 _ _ _ _ 3 3 10 14 8 77 11 10 5 _ 7 _ _ _ _ _ _ _ _M otion p ictu res 5 -------------------------- 275 2.69 - - - - - - “ - - “ " ■ 18 " “ “ 252 5
See footnotes at end of table,
Digitized for FRASER http://fraser.stlouisfed.org/ Federal Reserve Bank of St. Louis
16
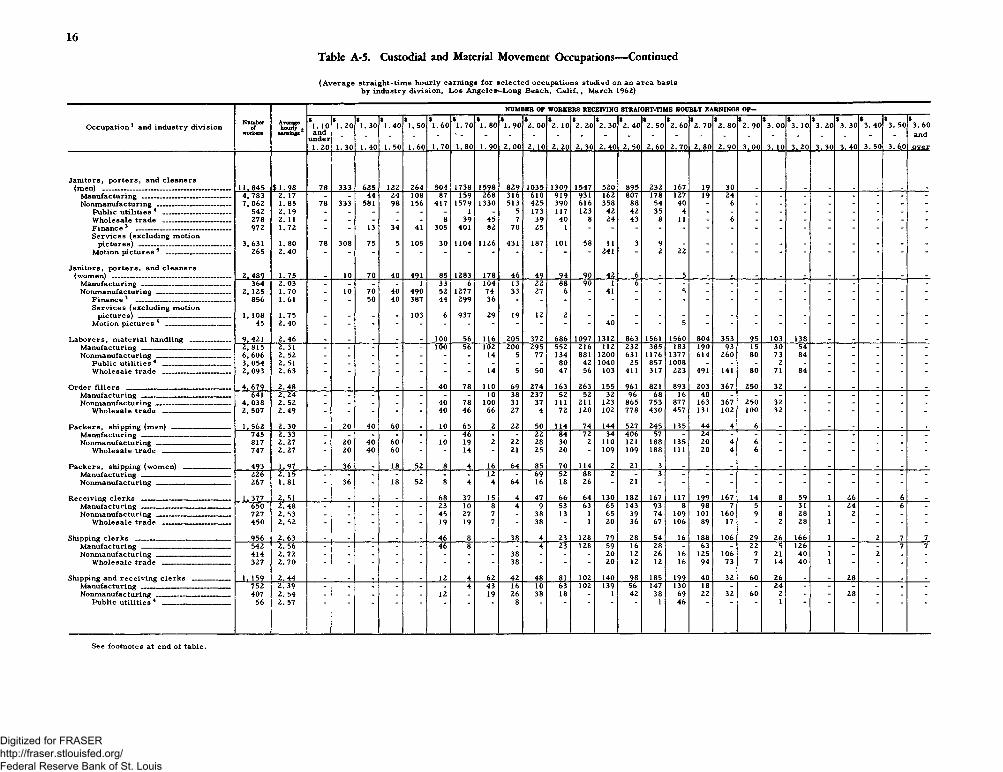
Table A-5. Custodial and Material Movement Occupations— Continued
(Average straight-tim e hourly earnings for selected occupations studied on an area basis by industry division, Los Angeles—Long Beach, C a lif . , March 1962)
NUMBER OF WORKERS RECEIVING STRAIGHT-TIME HOURLY EARNINGS OF—
O ccupation 1 and industry division Numberof Averagehourly ?$
1 . 1 0$
1 . 2 0$1. 30
$1.40
S1. 50 *1.60
$1.70
S1 . 80
$1.90
S2 .0 0
$2 . 1 0
«2 . 20
$2.30
$2.40
S2.50 *2 . 60
$2. 70
S2 . 80
$2 . 90
$3. 00
S3. 10
$3. 20
S3. 30
S3.40
$3. 50
$3.60
workers earnings and andunder1 . 2 0 1.30 1.40 1. 50 1.60 1.70 1.80 1.90 2 .0 0 2 . 10 2 .2 0 2. 30 2.40 2. 50 2.60 2.70 2.80 2.90 3.00 3. 10 3. 20 3. 30 3.40 3. 50 3. 60 over
Janitors, porters, and cleaners11.845 $ 1 .9 8 78 333 625 1 2 2 264 504 1738 1598 829 1035 1309 1547 520 895 232 167 19 30 . _ . - _ _ -
Manufacturing ------------- ------------------------ 4,783 2. 17 . _ 44 24 108 87 159 268 316 610 919 931 162 807 178 127 19 24 - - - - - - - -Nonmanufacturing ____________________ 7, 062 1.85 78 333 581 98 156 417 1579 1330 513 425 390 6 1 6 358 88 54 40 - 6 - - - - - - - -
Public utilities 4 __________________ 542 2. 19 - - - - - - 1 - 5 173 117 123 42 42 35 4W holesale trade ---------------------------- 278 2 . 1 1 - _ - - - 8 39 45 7 39 40 8 24 43 8 1 1 - 6 - - - - - - - -F inan ce3 ---------------------------------------- 972 1.72 - - 13 34 41 305 401 82 70 25 1Services (excluding m otion
pictures) --------------- — ---------------- 3,631 1 . 80 78 308 75 5 105 30 1104 1126 431 187 1 0 1 58 1 1 3 9Motion pictures 5 --------------------------- 265 2.40 241 - 2 2 2
Janitors, porters, and cleaners2.489 1.75 10 70 40 491 85 1283 178 46 49 94 90 42 6 . 5
Manufacturing _________ ____________ 364 2. 03 - - - 1 33 6 104 13 2 2 88 90 1 6Nonmanufacturing ------------------------------- 2, 125 1.70 - 10 70 40 490 52 1277 74 33 27 6 - 41 - - 5 - - - - - - - - - -
F inan ce3 ______ ______ ____ ______ 856 1 . 6 1 - - 50 40 387 44 299 36Services (excluding motion
pictures) _______________ _____ _ 1 , 108 1.75 - - - - 103 6 937 29 19 1 2 2Motion pictures 5 --------------------------- 45 2.40 40 - - 5
L aborers, m aterial handling ___________ 9.421 2.46 _ _ _ _ _ 10 0 56 1 1 6 205 372 686 1097 1312 863 1561 1560 804 353 95 103 138 _ _ _ _ _Manufacturing ------------------------------------- 2, 815 2. 31 - - - - - 10 0 56 1 0 2 2 0 0 295 552 216 1 1 2 232 385 183 19 0 93 15 30 54 - - - - -Nonmanufacturing ------------------------------- 6,606 2. 52 - - - - - - - 14 5 77 134 881 12 0 0 631 1176 1377 614 2 6 0 80 73 84 - - - - -
Public utilities 4 __________________ 3, 054 2. 51 - - - - - - - - - - 80 42 1040 25 857 1008 - - - 2 - - - - - -W holesale trade __________________ 2, 093 2.63 - - - - - - - 14 5 50 47 56 103 411 317 223 491 141 80 71 84 - - - - -
Order fillers ______________________ ____ 4, 679 2.48 . . . 40 78 1 1 0 69 274 163 263 155 9 6 1 821 893 203 367 250 32 _ _ . . . _Manufacturing ________________________ 641 2.24 _ _ - _ - - - 10 38 237 52 52 32 96 68 16 40Nonmanufacturing ______________ ____ 4, 038 2. 52 - - - - - 40 78 10 0 31 37 1 1 1 2 1 1 123 865 753 877 163 367 250 32 - - - - - -
W holesale trade __________________ 2, 507 2 . 49 - - - 40 46 66 27 4 72 1 2 0 1 0 2 778 430 457 131 1 0 2 1 0 0 32 - - - - - -
Packers, shipping (men) ________________ 1. 562 2. 30 _ 20 40 60 _ 10 65 2 2 2 50 114 74 144 527 245 135 44 4 6 _ _ _ _ _ _ _Manufacturing __ _____________________ 745 2. 33 - - - - - - 46 - - 2 2 84 72 34 406 57 - 24Nonmanufacturing ____________________ 817 2. 27 - 20 40 60 - 1 0 19 2 2 2 28 30 2 1 1 0 1 2 1 188 135 20 4 6 - - - - - - -
W holesale trade __________________ 747 2. 27 - 20 40 60 - - 14 - 2 1 25 20 - 109 109 188 1 1 1 20 4 6 - - - - - - -
Packers, shipping (women) -------------------- 493 1.97 _ 36 _ 18 52 8 4 16 64 85 70 114 2 2 1 3Manufacturing ------------------------------------- 226 2. 15 - - - - - - - 1 2 - 69 52 88 2 - 3Nonmanufacturing ------------------------------- 267 1.81 - 36 18 52 8 4 4 64 16 18 26 - 2 1
Receiving clerks ________________________ 1. 377 2. 51 _ _ _ _ _ 68 37 15 4 47 66 64 130 182 167 117 199 167 14 8 59 1 26 _ 6 _Manufacturing ------------------------------------- 650 2.48 - - - - - 23 10 8 4 9 53 63 65 143 93 8 98 7 5 - 31 - 24 - 6 -Nonmanufacturing ____________________ 727 2. 53 - - - - - 45 27 7 - 38 13 1 65 39 74 109 1 0 1 16 0 9 8 28 1 2 - - -
W holesale trade __________________ 450 2. 52 - - - - - 19 19 - 38 - 1 20 36 67 106 89 17 - 2 28 1 - - - -
Shipping c lerks __________________________ 956 2. 63 46 8 38 4 23 128 79 28 54 16 188 106 29 26 1 6 6 1 2 7 7Manufacturing ------------------------------------- 542 2. 56 _ _ _ _ . 46 8 - _ 4 23 128 59 1 6 28 - 63 - 2 2 5 126 - _ _ 7 7Nonmanufacturing ____________________ 414 2. 72 - - - - - - - - 38 - - - 20 1 2 26 16 125 106 7 2 1 40 1 - 2 - -
W holesale trade __________________ 327 2.70 - - - - - - - 38 - - - 20 1 2 1 2 16 94 73 7 14 40 1 - - - -
Shipping and receiving clerks __________ 1. 159 2.44 . 1 2 4 62 42 48 81 10 2 140 98 185 199 40 32 60 26 _ _ 28 . .Manufacturing ________________________ 752 2.39 _ _ - - - - 4 43 1 6 10 63 10 2 139 56 147 130 18 - - 24 - - - - _ -Nonmanufacturing ____________________ 407 2. 54 - - - - - 1 2 - 19 26 38 18 - 1 42 38 69 2 2 32 60 2 - - 28 - - -
Public utilities 4 __________________ 56 2. 57 8 1 46
See footnotes at end of table,
Digitized for FRASER http://fraser.stlouisfed.org/ Federal Reserve Bank of St. Louis
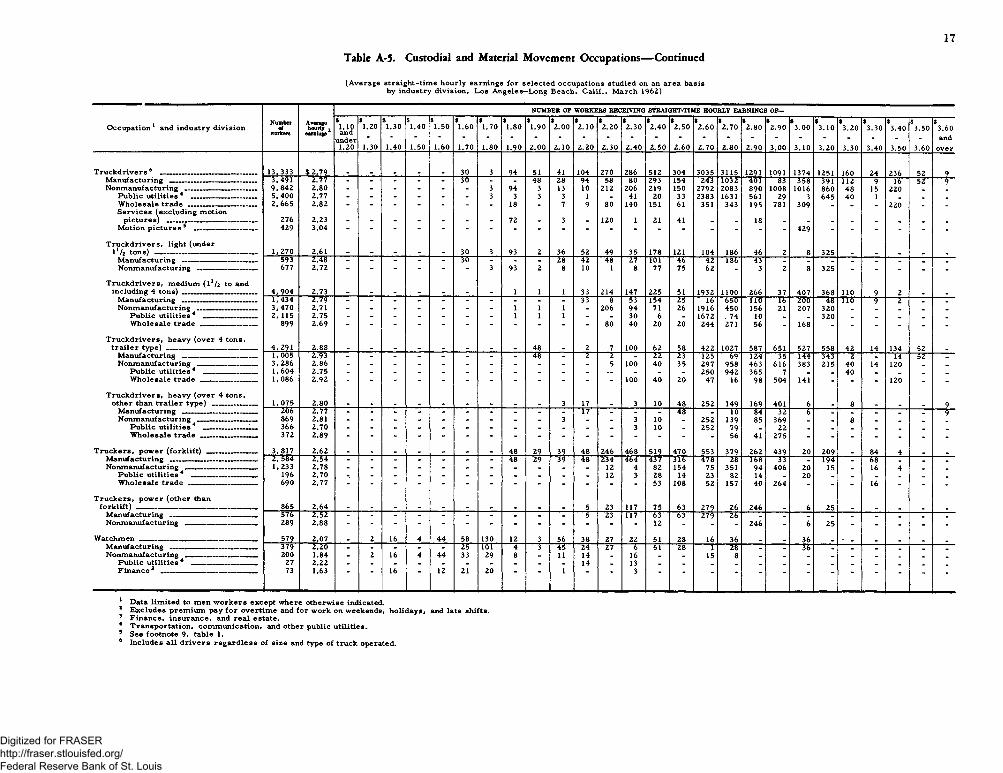
17
Tabic A-5. Custodial and Material Movement Occupations— Continued
(Average straight-tim e hourly earnings for selected occupations studied on an area basis by industry division, Los Angele&-Long Beach, C alif., M arch 1962)
O ccupation 1 and industry divisionNumberofworkers
Average hourly 2 earnings
NUMBER OP WORKERS RECEIVING STRAIGHT-TIME HOURLY EARNINGS OP—
under1 .2 0
$1 .2 0
1.30
$1.30
1.40
$1.40
1.50
$1.50
1 .6 0
$1.60
1.70
$1.70
1.80
$1.80
1 .9 0
$1.90
2 .0 0
$2 .0 0
2 .1 0
$2 . 1 0
2 .2 0
$2 .2 0
2.30
$2.30
2.40
$2.40
2.50
$2.50
2.60
$2 .6 0
2.70
$2.70
2.80
S2.80
2.90
$2.90
3.00
$3.00
3.10
$3.10
3.20
$3.20
3.30
$3.30
3.40
$3.40
3.50
$3.50
3.60
S3.60and
over
T ru ck d rivers 6 __________________________ 13,333 $2.79 30 3 94 51 41 104 270 286 512 304 3035 3115 1291 1091 1374 1251 160 24 236 52 9Manufacturing ________________________ 3,491 2.77 - - - - - 30 - - 48 28 94 58 80 293 154 243 1032 401 83 358 391 1 1 2 9 16 52 9Nonmanufacturing ____________________ 9,842 2.80 - - - - - - 3 94 3 13 10 2 1 2 206 219 150 2792 2083 8 9 0 1008 1016 860 48 15 2 2 0 _
Public u tilit ie s 1 2 3 4 __________________ 5,400 2.77 - - - - - - 3 3 3 3 1 - 41 20 33 2383 1631 561 29 3 645 40 1 _ _ _W holesale trade __ __ __ __ — __ 2,665 2.82 _ _ _ - _ _ _ 18 _ 7 9 80 140 151 6 1 351 343 195 781 309 _ _ _ 2 20 _ _S ervices (excluding m otion
pictures) __________ __ 276 2.23 - - - - - - - 72 - 3 - 1 2 0 1 2 1 41 _ _ 18 _ _ _ _ _ _ _ _Motion pictu res 5 _________________ 429 3.04
T ruckdrivers, light (under1 V2 t o n s ) ____________________________ 1,270 2.61 - - - - - 30 3 93 2 36 52 49 35 178 1 2 1 104 186 46 2 8 325 _ _ _ _ _
M a n u fa ctu r in g ------------------------------- 593 2.48 - - - - - 30 - - - 28 42 48 27 1 0 1 46 42 186 43Nonmanufacturing — -_ __ — — 677 2.72 - “ - - " 3 93 2 8 10 1 8 77 75 6 2 - 3 2 8 325 - - - -
T ruckdrivers, m edium ( l 1^ to andincluding 4 t o n s )______ _____________ 4, 904 2.73 - - - - - - - 1 1 1 33 214 147 225 51 1932 1 1 0 0 266 37 407 368 n o 9 2 _ _
Manufacturing ____________________ 1,434 2.79 33 8 53 154 25 16 T 5 0 - 1 1 0 16 2 0 0 48 1 1 0 9 -----— _ _N onm anufacturing_______________ _ 3,470 2.71 - - - - - - - 1 1 1 - 206 94 71 26 1 9 1 6 450 156 2 1 207 320 _ _ _ _
Public u tilit ie s4 ______________ 2, 115 2.75 - - - - - - - 1 1 1 - - 30 6 _ 1672 . 74 10 _ _ 320 _ _ _ _ _W holesale t r a d e _______________ 899 2.69 80 40 20 20 244 271 56 - 168 - - - - - -
T ruckdrivers, heavy (over 4 tons,tra iler type) _________________________ 4, 291 2 .8 8 - - - - - - - - - 48 - 2 7 10 0 62 58 422 1027 587 651 527 558 42 14 134 52 _
Manufacturing ____________________ 1,005 2.93 48 - 2 2 - 2 2 23 125 69 124 ---- 3 F 144 343 2 _ 14 52 _Nonmanufacturing ________________ 3, 286 2 .8 6 5 10 0 40 35 297 958 463 616 383 215 40 14 1 2 0 _ _
Public utilities * _ 1, 604 2.75 250 942 365 7 40W holesale t r a d e _______________ 1,086 2 .9 2 10 0 40 20 47 16 98 504 141 - - 1 2 0 - -
T ruckdrivers, heavy (over 4 tons,other than tra iler type) ____________ 1, 075 2.80 3 17 - 3 10 48 252 149 169 401 6 _ 8 _ _ _ 9
Manufacturing ____________________ 20T" 2.77 - - - - - - - - - - 17 - - - 48 - 10 84 32 6 _ _ _ _ _ 9Nonmanufacturing ________________ 869 2.81 - - - - - - - - - 3 - - 3 10 - 252 139 85 369 _ _ 8 _ _ _
Public u tilit ie s4 ____________ _ 366 2.70 3 10 - 252 79 _ 2 2 _ _ _ _ _ _ _W holesale t r a d e _______________ 372 2.89 56 41 275 - - - - - - -
T ruckers, pow er (forklift) ______________ 3,817 2 .6 2 _ _ _ _ _ _ _ 48 29 39 48 246 468 519 470 553 379 262 439 20 209 _ 84 4 _ .Manufacturing ________________________ 2, 584 2.54 - - - - - - - 48 29 39 48 234 464 437 316 478 28 T 5 T 33 _ 194 _ 68 _ _ _Nonmanufacturing ____________________ 1,233 2.78 1 2 4 82 154 75 351 94 406 20 15 _ 16 4 _ _
Public utilities 4 __________________ 196 2.70 1 2 3 28 14 23 82 14 _ 20 _ _ _ _ _ _Whn1«>fialA trarle 690 2 77 53 108 52 157 40 264 16
T ruckers, pow er (other thanfo r k l i f t )__ __ __ __ _ __ __ __ 865 2.64 5 23 117 75 63 279 26 246 _ 6 25 _ _ _ _ _
Manufacturing 576 2.52 5 23 117 53 63 279 26Nonmanufacturing ___________________ 289 2.88 - - - - - - - - - - 12 246 - 6 25 - - - - -
Watchmen __ __ __ _ __ __ __ ____ _ 579 2.07 _ 2 16 4 44 58 130 12 3 56 38 27 22 51 28 16 36 _ _ 36 _ .Manufacturing ___ __ __ ____ ______ 379 2.20 - - - - - 25 101 4 3 45 24 27 ~ T ~ 51 28 1 28 _ _ 36 _ _ _ _ _ _Nonmanufacturing ____________________ 200 1.84 - 2 16 4 44 33 29 8 _ 11 14 _ 16 _ _ 15 8
P u b lic u t i l i t ie s 4 27 2.22 14 1373 1.63 “ “ 16 “ 12 21 20 “ 1 ~ 3 ■ ~ " - - - ~ “ " -
1 Data lim ited to men w ork ers except where otherwise indicated.2 Excludes prem ium pay fo r overtim e and for work on weekends, holidays, and late shifts.3 Finance, insurance, and real estate.4 Transportation, com m unication, and other public utilities.5 See footnote 9> table 1.6 Includes all d rivers regardless o f size and type of truck operated.
Digitized for FRASER http://fraser.stlouisfed.org/ Federal Reserve Bank of St. Louis
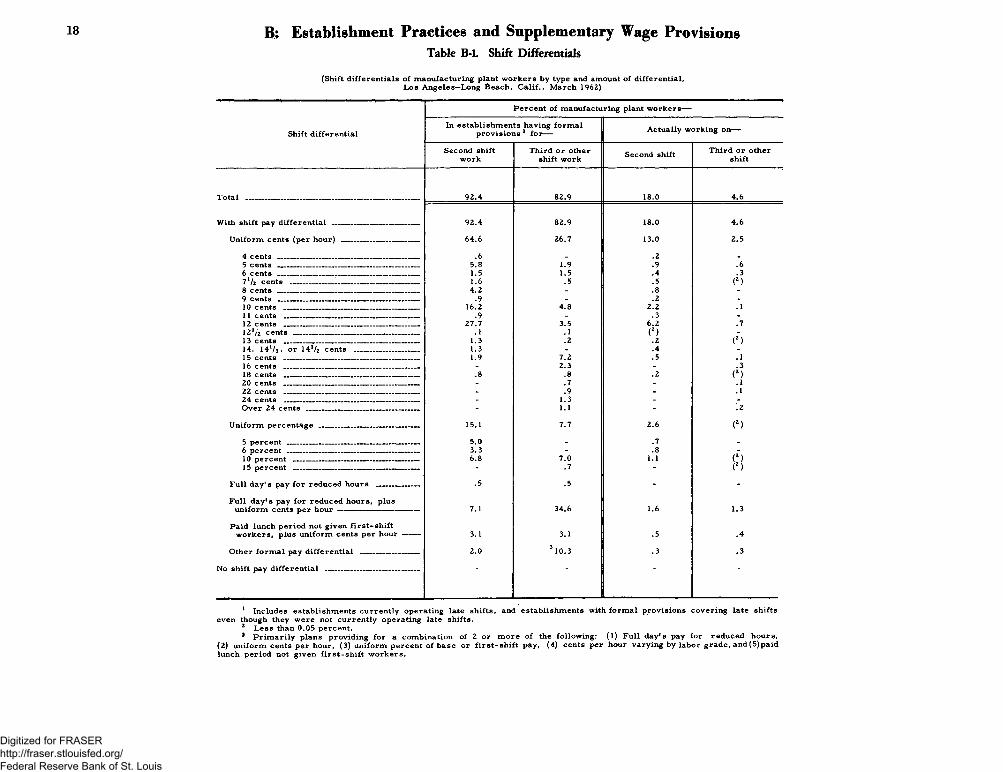
18 B; Establishment Practices and Supplementary Wage ProvisionsTable B-l. Shift Differentials
(Shift differentials of manufacturing plant workers by type and amount of differential, Los Angeles—Long Beach, Calif., March 1962)
Percent of manufacturing plant workers—
Shift differentialIn establishments having formal
provisions 1 for— Actually working on—
Second shift work
Third or other shift work Second shift Third or other
shift
92.4 82.9 18.0 4.6
With shift pay differential __________ ___ ___ 92.4 82.9 18.0 4.6
Uniform cents (per hour) _____________________ 64.6 26.7 13.0 2.5
4 cent* .6 _ .2 _5 cents ______ ___________________ _________ 5.8 1.9 .9 .66 cents ___________________ ______ ________ 1.5 1.5 .4 .37 l /z cents ___________________________________ 1.6 .5 .5 (1 2 3)8 cents ___________________________________ ___ 4.2 - .8 -9 cents _____ ______ ________ __________ .9 - .2 -10 cents ____ __ ________________________ __ 16.2 4.8 2.2 .111 cents __ ____ _ ________ ________ __ .9 - .3 -12 cents ___________________ ______ ___'___ 27.7 3.5 6.2 .7121/z cents ______ ________ ___— --------- .1 .1 (2) -13 cents ______ __________________ ______ 1.3 .2 .2 (2)14, 1 4 V3 . or 14l/2 cents __ _____________ 1.3 - .4 -15 cents ___ _________ _______ _______________ 1.9 7.2 .5 .116 cents ______________ __ _________________ - 2.3 - .318 cents _____________________________ ______ .8 .8 .2 (2)20 cents _____________________________________ - .7 - .122 cents _____________________________________ - .9 - . 124 cents __________________ _________________ - 1.3 - -Over 24 cents _______________________________ - 1.1 - .2
Uniform percentage _ _____________________ 15.1 7.7 2.6 (2)
5 percent ____________________________________ 5.0 - .7 -6 p e rce n t_________ _____-________ _______ 3.3 - .8 -10 percent __________________ ____ 6.8 7.0 1.1 (\\i5 percent ----------------------------------------------------- - .7 - (2 )
Full day's pay for reduced hours _____ _____ .5 .5 - -
Full day's pay for reduced hours, plusuniform cents per h o u r------— —--------------------- 7.1 34.6 1.6 1.3
Paid lunch period not given first-shiftworkers, plus uniform cents per h o u r------- 3.1 3.1 .5 .4
Other formal pay differential ________________ 2.0 3 10.3 .3 .3
No shift pay differential __________________________
1 Includes establishments currently operating late shifts, and establishments with formal provisions covering late shifts even though they were not currently operating late shifts.
2 Less than 0.05 percent.3 Primarily plans providing for a combination of 2 or more of the following: (1) Full day's pay for reduced hours,
(2) uniform cents per hour, (3) uniform percent of base or first-shift pay, (4) cents per hour varying by labor grade, and(5)paid lunch period not given first-shift workers.
Digitized for FRASER http://fraser.stlouisfed.org/ Federal Reserve Bank of St. Louis
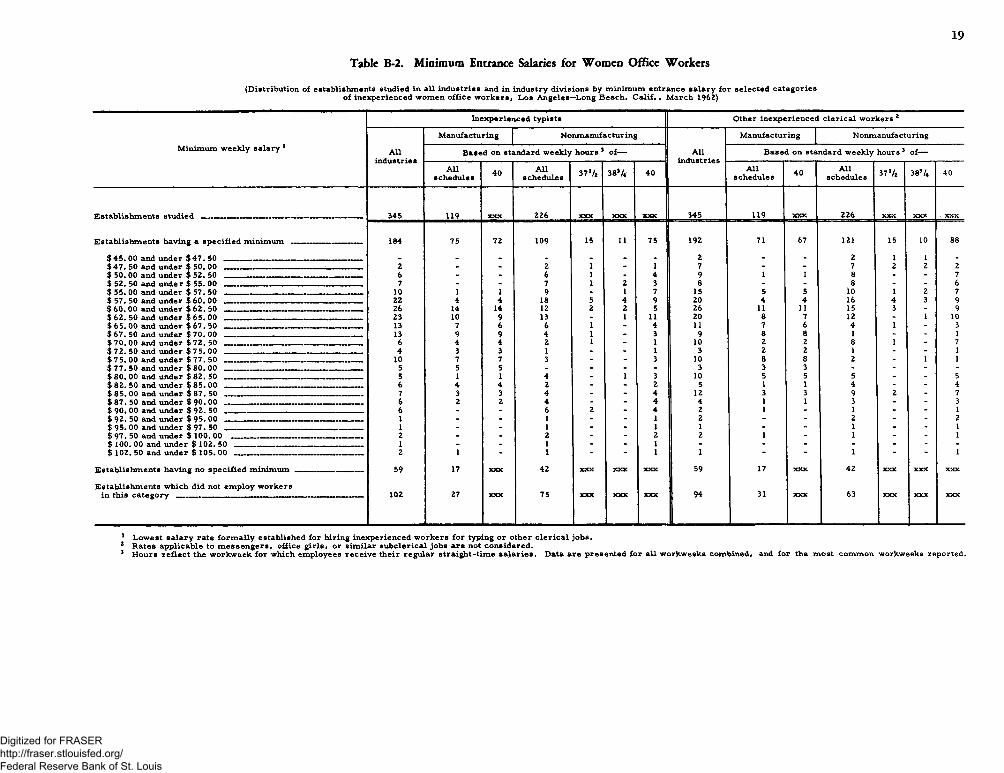
19
Table B>2. Minimum Entrance Salaries for Women Office Workers
(Distribution ol establishments studied in all industries and in industry divisions by minimum entrance salary for selected categories of inexperienced women office workers, Los Angeles—Long Beach, C a lif ., March 1962)
M inim um w eek ly sa la ry 1
Inexperienced typists Other inexperienced c le r ic a l w o rk e rs2
A llindu stries
M anufacturing N onm anufacturing M anufacturing Nonmanufacturing
B ased on standard w eekly hours 3 of---- A llindu stries
B ased on standard w eekly hours 3 of—
A llschedules 40 A ll
schedules 3 7 1/* 383/4 40 A llschedules 40 A ll
schedules 37 V2 383/4 40
E stab lish m e n ts studied ______________ _____ — — ----- 345 119 XXX 226 XXX XXX XXX 345 119 XXX 226 XXX XXX . XXX
E stab lish m e n ts having a sp e cified m inim um - ------ 184 75 72 109 15 11 75 192 71 67 121 15 10 88
$ 4 5 .0 0 and under $ 4 7 .5 0 _____ _______ - - - - . - - - 2 - - 2 1 1 -$ 4 7 . 50 and under $ 5 0 .0 0 . 2 - - 2 1 - 1 7 - - 7 2 2 2$ 50. 00 and under $ 52. 50 — — — -------- -------- 6 - - 6 1 - 4 9 1 1 8 - - 7$ 52. 50 and unde r $ 55. 00 ______________________ — ----------,---------- ... 7 - - 7 1 2 3 8 - - 8 - - 6$ 55 . 00 and under $ 57 . 50 ________________________________________ 10 1 1 9 - 1 7 15 5 5 10 1 2 7$ 57. 50 and under $ 6 0 . 00 __ _ _ _ _____ ___ ____ . . . 22 4 4 18 5 4 9 20 4 4 16 4 3 9$ 6 0 . 00 and under $ 6 2 . 50 ______ . . ___ — -- ----------- 26 14 14 12 2 2 5 26 11 11 15 3 - 9$ 6 2 . 50 and under $ 6 5 . 00 ______ _________ ___ —----------- ------------------ 23 10 9 13 - 1 11 20 8 7 12 - 1 10$ 6 5 . 00 and under $ 6 7 . 50 _ _ _ ——-------- ----- 13 7 6 6 1 - 4 11 7 6 4 1 - 3$ 6 7 . 50 and under $ 7 0 . 00 ____ __ ______ ________ _______ ___________ 13 9 9 4 1 - 3 9 8 8 1 - - 1$ 7 0 . 00 and under $ 7 2 . 50 ---- ----- ----------- ----- ---------- 6 4 4 2 1 - 1 10 2 2 8 1 - 7$ 7 2 . 50 and under $ 7 5 .0 0 ____ _____ _______ _____________ _________ 4 3 3 1 - - 1 3 2 2 1 - - 1$ 7 5 . 00 and under $ 7 7 . 50 _________________________________________ 10 7 7 3 - - 3 10 8 8 2 - 1 1$ 7 7 . 50 and under $ 8 0 . 00 ________ _ ___ _______ _____ ___ 5 5 5 - - - - 3 3 3 - - - -$ 8 0 . 00 and under $ 8 2 . 50 __ ... ----- ----------- 5 1 1 4 - 1 3 10 5 5 5 - - 5$ 8 2 . 50 and under $ 8 5 .0 0 -------------- ----------------- 6 4 4 2 - - 2 5 1 1 4 - - 4$ 8 5 . 00 and under $ 8 7 . 50 __ _ ___ _______ ___ __________ 7 3 3 4 - - 4 12 3 3 9 2 - 7$ 8 7 . 50 and under $ 9 0 . 00 _______________________________ __________ 6 2 2 4 - - 4 4 1 1 3 - - 3$ 9 0 . 00 and under $ 9 2 . 50 _______ _ — ----------- 6 - - 6 2 - 4 2 1 - 1 - - 1$ 9 2 . 50 and under $ 9 5 . 00 ------------------------ -------------------------------------- 1 - - 1 - - 1 2 - - 2 - - 2$ 9 5 . 00 and under $ 9 7 . 50 _ __ ;— —. . _ 1 - - 1 - - 1 1 - - 1 - - 1$ 9 7 . 50 and under $ 100 . 00 __ _____ ____ ___ 2 - - 2 - - 2 2 1 - 1 - - 1$ 100. 00 and under $ 102 . 50 __ _____ _ ___ ___ 1 - - 1 - - 1 - - - - - - -$ 102. 50 and under $ 105. 00 ___ ___ _______ —_____________________ 2 1 - 1 - - 1 1 “ - 1 - “ 1
E stab lish m e n ts having no sp e cified m in im u m __ ___________ ______ 59 17 XXX 42 XXX XXX XXX 59 17 XXX 42 XXX XXX XXX
E stab lish m e n ts which did not em ploy w orkersin this categ ory _________ _ __ _ _ 102 27 XXX 75 XXX XXX XXX 94 31 XXX 63 XXX XXX XXX
Lowest salary rate form ally established for hiring inexperienced workers for typing or other clerical jobs.Rates applicable to m essengers, office girls, or sim ilar subclerical jobs are not considered.Hours reflect the workweek for which employees receive their regular straight-time salaries. Data are presented for all workweeks combined, and for the most common workweeks reported.
Digitized for FRASER http://fraser.stlouisfed.org/ Federal Reserve Bank of St. Louis
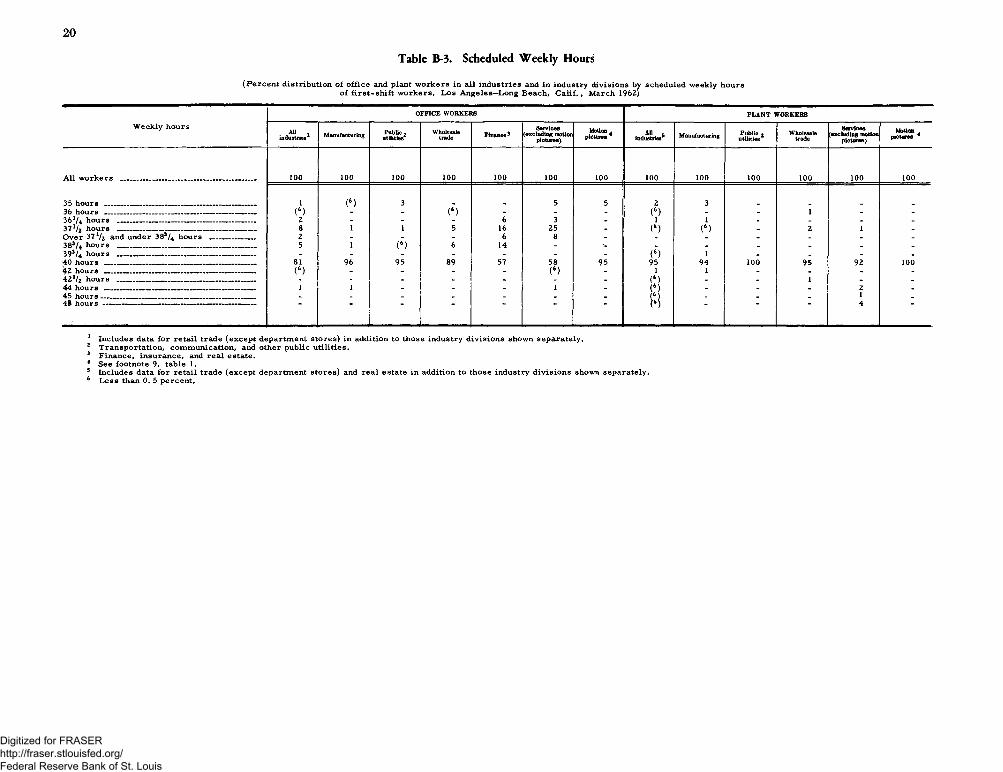
20
Table B-3. Scheduled W eekly Hours
(Percent distribution of office and plant workers in all industries and in industry divisions by scheduled weekly hoursof first-shift workers, Los Angeles—Long Beach, C a lif., March 1962)
Weekly hours
OFFICE WORKERS PLANT WORKERS
All . industries Manufacturing Public , utilities
Wholesaletrade Finance 3
Services(excluding motion
piotures)Motion .
pictures All - industries Manufacturing Public , utilities
Wholesaletrade
Services[excluding motion
piotures)Motion
pictures *
All workers ______ — ________ ______________ 1 0 0 1 0 0 1 0 0 1 0 0 1 0 0 1 0 0 1 0 0 1 0 0 10 0 1 0 0 1 0 0 10 0 1 0 0
35 hours ________________________________________ - (6 ) 3 5 5 2 336 hours _____ _____________________.____________ (*> - (6_) - - - (6) - - 1 - _36 V4 hours ----------------- -------------------------------------- 2 - - 6 3 _ 1 _ _ _ _37 V2 hours ....................................... _ ........................... 8 1 1 5 16 25 - (‘ ) (6) - 2 1 _Over 37 V2 and under 383/4 hours ____________ 2 - - - 6 8 _ _ _ _ _383/4 hours ______________________________________ 5 1 (6) 6 14 - ■- - - - _ - -3 9 3/4 hours ____ — ~ __ __ — — ----------- - - - - - - _ (6) 1 _ _ _ _<40 h o u r s __ ............... . 81 96 95 89 57 58 95 95 94 1 0 0 95 92 1 0 042 hours __________________ ___ ___ _________ (6) - _ _ _ (6) _ 1 1 _ _ _ _4 2 V2 hours _______ ________ __________________ - - - - - (6) - - 1 - -44 hours -------------- --------— __ __ --------------------- _ 1 1 - - - 1 - (6) - - _ 2 _45 hours---------------------------------- ------- ----------------- _ _ _ _ _ _ _ (M _ _ _ 1 _48 hours ---------------------------------------------------------------- 6 4
1 Includes data for retail trade (except department stores) in addition to those industry divisions shown separately.2 Transportation, communication, and other public utilities.3 Finance, insurance, and real estate.4 See footnote 9, table 1.5 Includes data for retail trade (except department stores) and real estate in addition to those industry divisions shown separately.6 Less than 0. 5 percent.
Digitized for FRASER http://fraser.stlouisfed.org/ Federal Reserve Bank of St. Louis
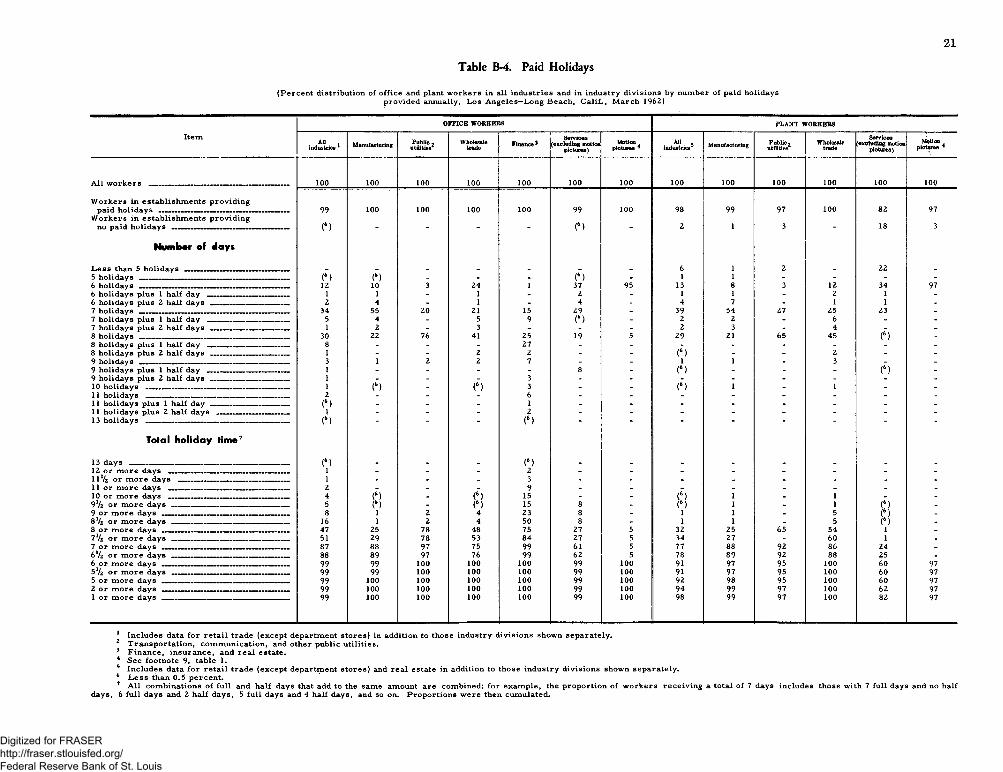
21
Table B-4. Paid Holidays
(Percent distribution of office and plant workers in all industries and in industry divisions by number of paid holidaysprovided annually, Los Angeles—Long Beach, Calif., March 1962)
Item
OFFICE WORKERS PLANT WORKERS
Allindustries 1 Manufacturing Public ,
utilities1 2Wholesale
trade Finance3Services
(excluding motion pictures)
Motion pictures *
All 5 industries Manufacturing Public,utilities2
WholesaletradeServices
(excluding motion pictures)
Motion pictures 4 5
A ll w o rk e rs ___ __ - --------- ---------— -------- — 100 100 100 100 100 100 100 100 100 100 100 100 1 0 0
W ork ers in estab lish m en ts p rov id in gpaid holid ays ___ ____ . . . _ _______ . . . 99 100 100 100 100 99 100 98 99 97 100 82 97
W ork ers in estab lish m en ts p rov id in gno paid h olid ays ------------------------------------------------- (6 ) “ - - (6 ) 2 1 3 " 18 3
N u m b e r o f d a y s
L e ss than 5 holid ays ____________________________ _ _ _ _ _ _ _ 6 1 2 _ 22 _5 holidays ____________ __ __ __________ ___ _ (6) (6) - - - (6 ) - 1 1 - - - -6 holidays _______r—ri—,____________ ..r____________ r_ 12 10 3 24 1 37 95 13 8 3 12 34 976 holidays plus 1 half day — _ _ _____ __ . 1 1 - 1 - 2 - 1 1 - 2 1 -6 holidays plus 2 half d a y s _____________________ 2 4 - 1 - 4 - 4 7 - 1 1 -7 holid ays , ...... _. ________________ ,____ _̂_________ 34 55 20 21 15 29 - 39 54 27 25 23 -7 holidays plus 1 half day __ __ _ 5 4 - 5 9 (6) - 2 2 - 6 - -7 holidays plus 2 half days _____________________ 1 2 - 3 - - - 2 3 - 4 - -8 holidays ....... ............. -.. _________ ______________ 30 22 76 41 25 19 5 29 21 65 45 (6) -8 holidays plus 1 half day ______ _____ __ _ 8 - - - 27 - - - - - - - -8 holidays plus 2 ha lf d a y s --------------------------------- 1 - - 2 2 - - (6 ) - - 2 - -9 holidays _______ _ _ _ _ _ _ __ _ __ ___ __ 3 1 2 2 7 - - 1 1 - 3 - -9 holidays plus 1 half day ___ ___________________ 1 - - - - 8 - (6) - - - (6 ) -9 holidays plus 2 half days _____________________ 1 - - - 3 - - - - - - - -10 holidays ________________ _ __ __ __ _ __ 1 (6) - (6) 3 - - (6) 1 - 1 - -11 holidays ________________ ___________ ____ _____ 2 - - - 6 - - - - - - - -11 holidays plus 1 half day _ — ______ (6) - - - 1 - - - - - - - -11 holidays plus 2 half days __ _____ _____ __ 1 - - - 2 - - - - - - - -13 holidays ------------------------------------------------------------ (6) - - - (6) - - - - - - - -
T o ta l h o l i d a y t im e 7
13 days ______ _ __ ._ _ ____ ____ _ _ (6 ) _ _ _ (6 ) _ _ _ _ _ _ _ _12 o r m o re days ______________________________________ 1 - - - 2 - - - - - - - -IIV 2 o r m o re days ___________ ______________ ____ 1 - - - 3 - - - - - - - -11 o r m ore days __ __ __ _ __ __ ____ 2 - - - 9 - - - - - - - -10 o r m ore days _______________________________ _ 4 (?) - (?) 15 - - (?) 1 - 1 - -9 V2 o r m ore days __ __ __ _ _ _ 5 (6) - (6) 15 8 - (6 ) 1 - 1 (?) -9 o r m o re days ______________r________________rT_r_ 8 1 2 4 23 8 - 1 1 - 5 (?) _8 V2 o r m ore days _ _ __ _ __ _ 16 1 2 4 50 8 - 1 1 - 5 (6) -8 o r m ore days ________________ __________________ 47 25 78 48 75 27 5 32 25 65 54 1 -7V2 o r m ore days ___________________ ___ _______ 51 29 78 53 84 27 5 34 27 - 60 1 -7 o r m ore d a y s ___________________________________ 87 88 97 75 99 61 5 77 88 92 86 24 -6 V2 o r m ore days __ _ __ __ _______ _____ 88 89 97 76 99 62 5 78 89 92 88 25 -6 o r m o re days _________________________________ 99 99 1 0 0 1 0 0 1 0 0 99 1 0 0 91 97 95 1 0 0 60 975 V2 o r m o re days ________________________________ 99 99 1 0 0 1 0 0 1 0 0 99 1 0 0 91 97 95 1 0 0 60 975 o r m o re days ___________________________________ 99 1 0 0 1 0 0 1 0 0 1 0 0 99 1 0 0 92 98 95 1 0 0 60 972 o r m ore days ------ ---- 99 10 0 1 0 0 1 0 0 1 0 0 99 1 0 0 94 99 97 1 0 0 62 971 o r m o re d a y s ___________________________________ 99 10 0 1 0 0 1 0 0 1 0 0 99 1 0 0 98 99 97 1 0 0 82 97
1 Inclu des data fo r re ta il trade (except departm ent s tores) in addition to those industry d iv ision s shown separately .2 T ra n sp orta tion , com m u n ication , and other public u tilities .3 F in an ce , in su ran ce , and re a l estate.4 See footn ote 9, table 1.5 Inclu des data fo r re ta il trade (except departm ent sto res) and rea l estate in addition to those industry d iv ision s shown separately .6 L e s s than 0.5 p ercen t.7 A ll com bin ations o f fu ll and half days that add to the sam e amount are com bin ed; fo r exam ple, the p rop ortion o f w ork ers re ce iv in g a total o f 7 days includes those w ith 7 fu ll days and no half
days, 6 fu ll days and 2 half days, 5 fu ll days and 4 half days, and so on. P rop ortion s w ere then cum ulated.
Digitized for FRASER http://fraser.stlouisfed.org/ Federal Reserve Bank of St. Louis
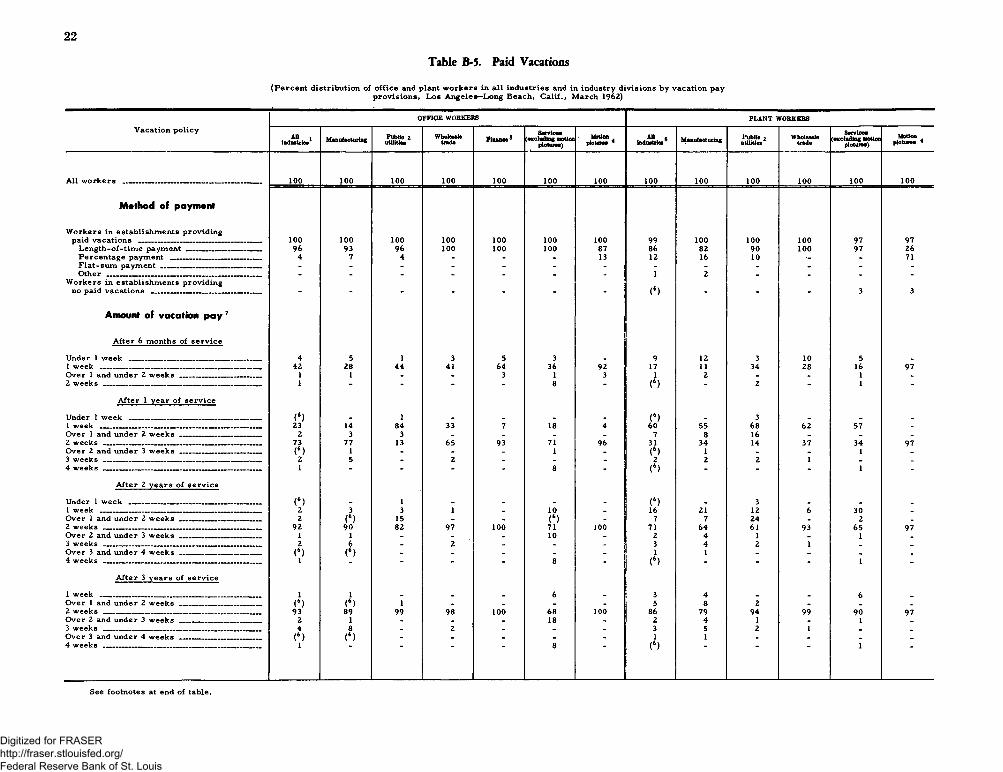
22
Tabic B-5. Paid Vacations
(Percent distribution of office and plant workers in all industries and in industry divisions by vacation payprovisions, Los Angeles—Long Beach, Calif., March 1962)
O FFICE W ORKERS P L A N T W O RK ER S
Vacation p o licyAll ,
industries Manufacturing Public 2 utilities
Wholesaletrade Finance 3
Services(excluding motion
pioturee)Motion
pictures 4All «
industries Manufacturing Public 2 utilitiesWholesaletrade
Services(excluding motion
pictures)Motion
pictures 4
A ll w ork ers ______ — __ __ _ __ _____ __ __ 100 100 100 100 100 sBasg_ io o _ = 100 100 100 100 100 100 100
M e t h o d o f p a y m e n t
W orkers in estab lishm ents provid ingpaid vacations __ __ _ _____ __ __ _______ 100 100 100 100 100 100 100 99 100 100 100 97 97
L en g th -o f-tim e paym ent _____ ______________ 96 93 96 100 100 100 87 86 82 90 100 97 26P ercen tage paym ent __ _____ __ __ ______ 4 7 4 - - - 13 12 16 10 - - 71F la t-su m p a y m e n t__ __ __ __ __ _______ - - - - - - - - - - - - -Other __ __ __ __ __ __ __ __ __ __ __ __ _ - - - - . - 1 2 _ . _ -
W orkers in estab lishm ents provid ingno paid vacations __________ ____ _______ ______ - - - - - - - (6) - " 3 3
A m ou n t o f v a c a t io n p a y 7
A fter 6 m onths o f se rv ice
Under 1 w eek ____________________________________ 4 5 1 3 5 3 _ 9 12 3 10 5 _1 w eek ____________ . 42 28 44 41 64 36 92 17 11 34 28 16 97O ver 1 and under 2 w e e k s ____________________ 1 1 _ - 3 1 3 1 2 . - 1 _2 w eeks _ _ _____ ___________ ____ 1 - - - - 8 - (6) - 2 - 1 -
A fter 1 year o f s e rv ice
Under 1 w eek _ ________ __ __ __ __ __ __ __ (6) » 1 _ _ _ _ (6) _ 3 _ _ _1 w eek _______________ _________________________ __ 23 14 84 33 7 18 4 60 55 68 62 57 _O ver 1 and under 2 w eeks _ __ _ ________ ____ 2 3 3 _ _ - _ 7 8 16 _ _ _2 w eeks ____________ _____________ ,,_ _________..r, 73 77 13 65 93 71 96 31 34 14 37 34 97O ver 2 and under 3 w e e k s __________ _______ ___ _ (6) 1 - - - 1 _ (6) 1 _ . 1 _3 w eeks _ __ _____ __ _____ _____ __ — w_ 2 5 _ 2 _ _ _ 2 2 2 1 _ _4 w eeks ------------------------------------------------------------------ 1 - - " - 8 - (6) - - - 1 -
A fter 2 y ea rs o f s e rv ice
Under 1 w eek ____________________________________ (6) _ 1 _ _ _ _ (6) _ 3 _ _ _1 w eek __ _______ _______ ___________ __ _ 2 3 3 1 _ 10 _ 16 21 12 6 30 _O ver 1 and under 2 w e e k s ______________________ 2 (6) 15 _ - (6) - 7 7 24 _ 2 _2 w eeks 92 90 82 97 100 71 100 71 64 61 93 65 97O ver 2 and under 3 w e e k s ______________________ 1 1 _ - . 10 _ 2 4 1 _ 13 w eeks . .. 2 6 _ 2 _ - - 3 4 2 1 _ _O ver 3 and under 4 w eeks ______________________ (*> (6) _ _ _ - - 1 1 _ _ _ _4 w eeks - - - 8 - (6) - - - 1 -
A fter 3 y ea rs o f s e rv ice
1 w eek __ 1 1 _ _ _ 6 _ 3 4 _ _ 6O ver 1 and under 2 w eeks ______________________ (6) (6) 1 _ _ _ _ 5 8 2 - _ _2 w eeks _________________________________ _________ 93 89 99 98 100 68 100 86 79 94 99 90 97O ver 2 and under 3 w e e k s ______________________ 2 1 _ - _ 18 - 2 4 1 _ 13 w eeks ____ __ _ ̂ „ r„r. 4 8 _ 2 _ _ - 3 5 2 1 _ _O ver 3 and under 4 w eeks ____ (6) (6) _ _ _ _ _ 1 1 _ _ _ _4 w eeks _ _____ __ _ _ 1 8 (6) 1
See footnotes at end of table.
Digitized for FRASER http://fraser.stlouisfed.org/ Federal Reserve Bank of St. Louis
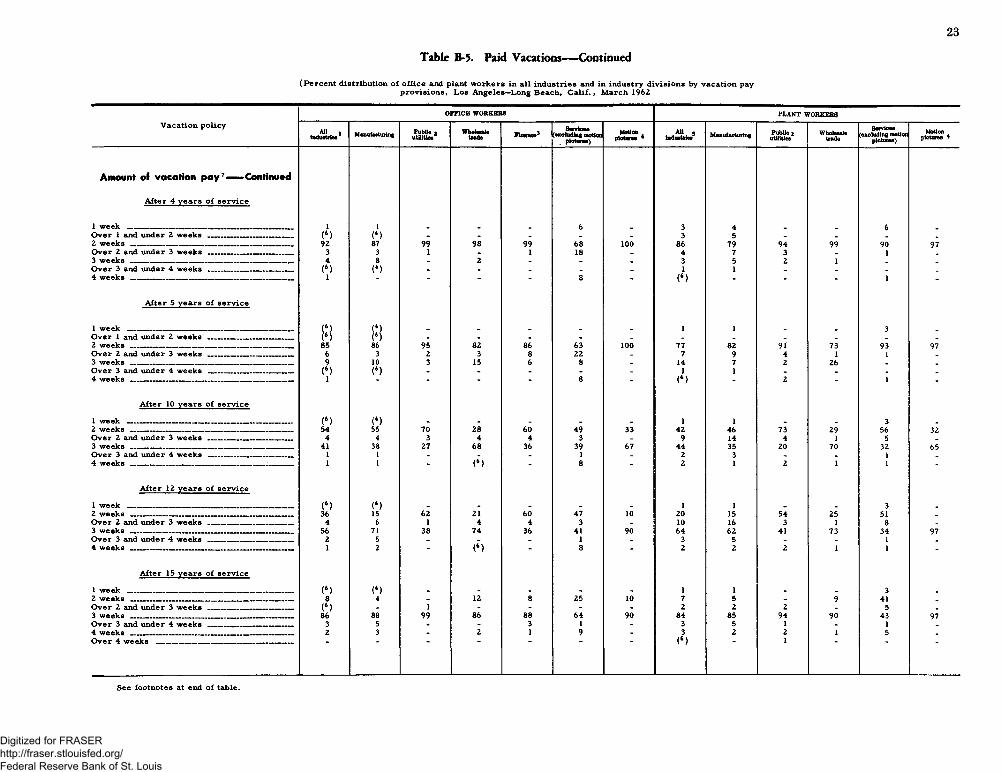
23
Table B-5. Paid Vacations— Continued
(Percent distribution of office and plant workers in all industries and in industry divisions by vacation payprovisions, Los Angeles—Long Beach, C alif., March 1962
OFFICE WORKERS PLANT WORKERSV a ca tion p o licy All .
industries Manufacturing Public 2 utilities
Wholesaletrade Finance3
Servioes(excluding motion pictures)
Motion , pictures *
All 5 industries Manufacturing Public 2 utilities Wholesaletrade
Services(excluding motion
pictures)Motion
pictures *
A m o u n t o f v a c a t i o n p a y 7— C o n tin u e d
A fter 4 y e a rs o f s e r v ic e
2 w eek _____________________________________________ 1 1(4>
6 3 4 6O ver 1 and under 2 w eeks _______________________ (6) - - - _ _ 3 5 _ _ _ _2 w eeks ____________________________________________ 92 87 99 98 99 68 100 86 79 94 99 90 97O ver 2 and under 3 w eeks __ _ __ __ _____ 3 3 1 _ 1 18 _ 4 7 3 _ 13 w eeks ... ......., . . . . . . . . . . 4 8 _ 2 _ _ _ 3 5 2 1 _ _O ver 3 and under 4 w eeks _______________________ (6 ) (6) _ _ _ _ _ 1 1 _ _ _ _4 w e e k s -------------------------------------------------------------------- 1 - - - 8 - (6 ) - - - 1 -
A fter 5 y e a rs o f s e rv ice
, — v <!> (6) 1 1 3O ver 1 and under 2 w e e k s __ __ __ __ __ _____ (6) (*) _ _ _ _ _ _ _ - _ _ _2 w eeks ______ __ __ __ __ __ __ __ _____ 85 86 95 82 86 63 100 77 82 91 73 93 97O ver 2 and under 3 w e e k s __ __ __ __ __ __ 6 3 2 3 8 22 _ 7 9 4 1 13 w eeks __ ________ _____ ________ __ ____ 9 10 3 15 6 8 _ 14 7 2 26 _ _O ver 3 and under 4 w eeks _______________________ (6) (6) _ _ _ - _ 1 1 _ _ _ _4 w e e k . -------- . . . --------- - - ------ ----- 1 - - - 8 - (6 ) - 2 " 1 -
A fter 10 y e a rs o f s e r v ic e
1 w eek _________________ —__________________________ (6) (6) _ _ _ _ _ 1 1 _ _ 32 w eeks T... _ .... . ___ . 54 55 70 28 60 49 33 42 46 73 29 56 32O ver 2 and under 3 w e e k s _______________________ 4 4 3 4 4 3 - 9 14 4 1 5 _3 w eeks ____________________................. . ........ .... . 41 38 27 68 36 39 67 44 35 20 70 32 65O ver 3 and under 4 w e e k s __ ________ __ 1 1 _ _ _ 1 _ 2 3 _ _ 1 _4 w e e k s -------------------------------------------------------- ----------- 1 1 - (6 ) - 8 - 2 1 2 1 1 -
A fte r 12 y e a rs o f s e r v ic e
1 w eek __ _____ ______ _ __ ____ __ __ __ (6) (6) _ _ _ _ 1 1 _ _ 32 w eeks — ------- _ __ . . __ _ _ ________ 36 15 62 21 60 47 10 20 15 54 25 51 _O ver 2 and under 3 w eeks _______________________ 4 6 1 4 4 3 _ 10 16 3 1 8 _3 w eeks ____ _ ___ __ _ _ _ _ _ _ ___ ____ _ 56 71 38 74 36 41 90 64 62 41 73 34 97O ver 3 and under 4 w e e k s _______________________ 2 5 _ _ _ 1 _ 3 5 _ _ 1 _4 w eeks __ __ __ _______ _ ___ __ ____ __ __ 1 2 - (6 ) - 8 - 2 2 2 1 1 -
A fter 15 y e a rs o f s e rv ice
1 w eek __________ _ _ _ _ _ _ __ ___ (6) (6) _ _ . _ _ 1 1 _ _ 3 .
2 w eeks _______________________ _____________________ 8 4 - 12 8 25 10 7 5 - 9 41 _O ver 2 and under 3 w eeks __ _______ __ _____ (6 ) - 1 - - - - 2 2 2 _ 5 _3 w eeks __ _____ _______ _ _ _______ 86 88 99 86 88 64 90 84 85 94 90 43 97O ver 3 and under 4 we e k s __ __ __ __ ___ 3 5 _ - 3 1 - 3 5 1 _ 14 w eeks __ _ _______ __ __ __ __ _____ 2 3 _ 2 1 9 - 3 2 2 1 5 _O ver 4 w eeks __ __ __ __ __ __ _____ (6 ) 1
See footn otes at end o f table,
Digitized for FRASER http://fraser.stlouisfed.org/ Federal Reserve Bank of St. Louis
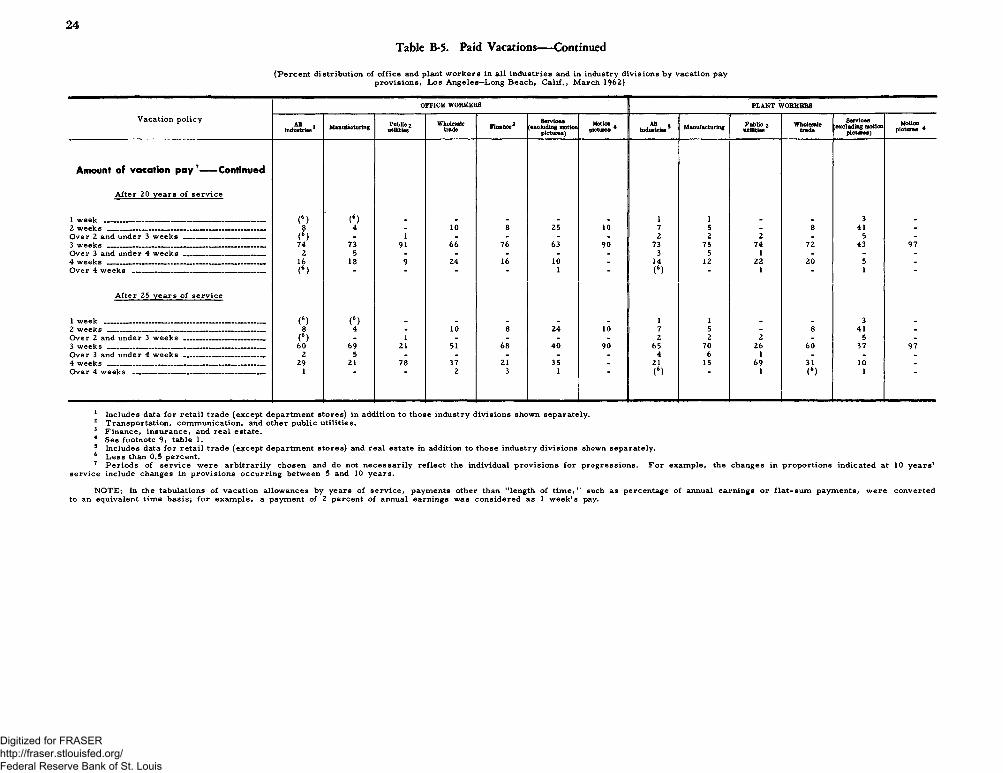
24
Table B-5. Paid Vacations— Continued
(Percent distribution of office and plant workers in all industries and in industry divisions by vacation payprovisions, Los Angeles—Long Beach, Calif., March 1962)
OFFICE WORKERS PLANT WORKERSVacation p o licy All !
industries Manufacturing Public 2 utilities
Wholesaletrade Finance3
Services(excluding motion
pictures)Motion
pictures *All 5
industries Manufacturing Public 2 utilities
WholesaletradeServices
(excluding motion pictures)
Motion pictures *
A m o u n t off v a c a t io n p a y 7-------C o n tin u e d
A fter 20 y ea rs o f s e rv ice
1 w eek ________ — — — — ------------- — — — (6) (6) . „ _ . 1 1 . 3 _
2 week s ________ ___________________ ____ 8 4 - 10 8 25 10 7 5 - 8 41 -O ver 2 and under 3 w eeks _______ _____________ (6) - 1 - - - - 2 2 2 - 5 -3 w eeks __ ., . ,. , .......... , . „ 74 73 91 66 76 63 90 73 75 74 72 43 97O ver 3 and under 4 w eeks _ __ ________________ 2 5 _ _ - - - 3 5 1 _ - -4 w e e k s_________________ ______________ ____ 16 18 9 24 16 10 - 14 12 22 20 5 -Over 4 w e e k s -------------------------------------------------------- (6) - - - - 1 - (6) - 1 “ 1 -
After 25 years of service
! week ____________________________________________ (6) (6) . _ . 1 1 . 3 .2 weeks _ ___________________ _______________ _ 8 4 - 10 8 24 10 7 5 - 8 41 -Over 2 and under 3 weeks _ _____ ___________ (6) - 1 - - - - 2 2 2 - 5 -3 weeks ___________ __ _____ __________________ 60 69 21 51 68 40 90 65 70 26 60 37 97Over 3 and under 4 weeks ______________________ 2 5 - - - - - 4 6 1 - - -
4 weeks ____ __ __ _____ — ________ _______ 29 21 78 37 21 35 _ 21 15 69 31 10 _
Over 4 weeks _ __ ____ _____________________ 1 2 3 1 (6) 1 (6)
1 Includes data for retail trade (except department stores) in addition to those industry divisions shown separately.2 Transportation, communication, and other public utilities.3 Finance, insurance, and real estate.4 See footnote 9, table 1.5 Includes data for retail trade (except department stores) and real estate in addition to those industry divisions shown separately.6 Less than 0.5 percent.7 Periods of service were arbitrarily chosen and do not necessarily reflect the individual provisions for progressions. For example, the changes in proportions indicated at 10 years'
service include changes in provisions occurring between 5 and 10 years.
NOTE: In the tabulations of vacation allowances by years of service, payments other than "length of t im e ," such as percentage of annual earnings or flat-sum payments, were converted to an equivalent time basis; for example, a payment of 2 percent of annual earnings was considered as 1 week's pay.
Digitized for FRASER http://fraser.stlouisfed.org/ Federal Reserve Bank of St. Louis
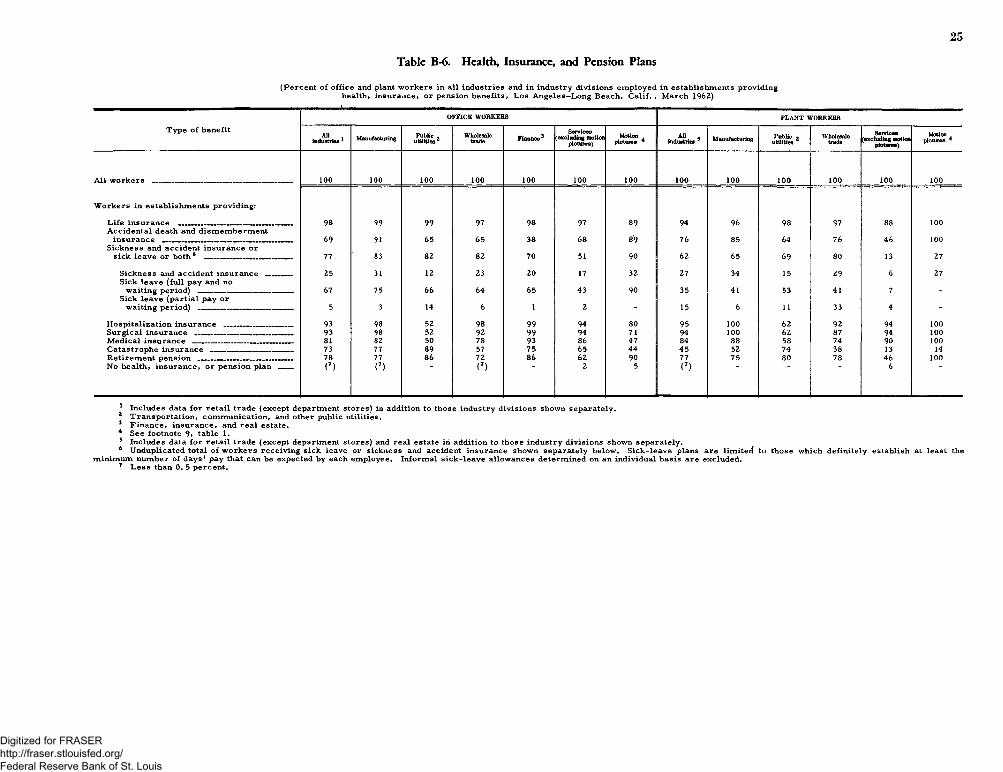
25
Table B-6. Health, Insurance, and Pension Plans
(Percent of office and plant workers in all industries and in industry divisions employed in establishments providing health, insurance, or pension benefits, Los Angeles—Long Beach, Calif. , March 1962)
OF FICE W ORKERS P L A N T W O RK ERS
Type of benefitAll
industries 1 Manufacturing Public , u tilities1 2
Wholesaletrade Finance3
Services(excluding motion
pictures)Motion
pictures 4 5All .
industries 9 Manufacturing Public 2 utilities
Wholesaletrade
Services[excluding motion
piotures)
Motion pictures 4
All workers ___ __________ __________ ______ 100 100 100 100 100 100 100 100 100 100 100 100 100
Workers in establishments providing:
Life insurance _______________________________Accidental death and dismemberment
98 99 99 97 98 97 89 94 96 98 97 88 100insurance _______________________ ____________
Sickness and accident insurance or69 91 65 65 38 68 89 76 85 64 76 46 100
sick leave or both6 ________________________ 77 83 82 82 70 51 90 62 65 69 80 13 27
Sickness and accident insurance _______Sick leave (full pay and no
25 31 12 23 20 17 32 27 34 15 29 6 27
waiting period) __ __ _______Sick leave (partial pay or
67 75 66 64 65 43 90 35 41 53 41 7 ”
waiting period) _ _____ _____ ___ 5 3 14 6 1 2 - 15 6 11 33 4 -
Hospitalization insurance _______ ____ ___ 93 98 52 98 99 94 80 95 100 62 92 94 100Surgical insurance _____ ________ ________ 93 98 52 92 99 94 71 94 100 62 87 94 100Medical insurance __ _____ _______ ___________ 81 82 50 78 93 86 47 84 88 58 74 90 100Catastrophe insurance _______________________________ 73 77 89 57 75 65 44 45 52 74 38 13 14Retirement pension _ ______________________ _____ 78 77 86 72 86 62 90 77 75 80 78 46 100No health, insurance, or pension plan ____ (7) (7) (7) 2 5 (7) 6
1 Includes data for retail trade (except department stores) in addition to those industry divisions shown separately.2 Transportation, communication, and other public utilities.3 Finance, insurance, and real estate.4 See footnote 9, table 1.5 Includes data for retail trade (except department stores) and real estate in addition to those industry divisions shown separately.6 Unduplicated total of workers receiving sick leave or sickness and accident insurance shown separately below. Sick-leave plans are limited to those which definitely establish at least the
minimum number of days' pay that can be expected by each employee. Informal sick-leave allowances determined on an individual basis are excluded.7 Less than 0. 5 percent.
Digitized for FRASER http://fraser.stlouisfed.org/ Federal Reserve Bank of St. Louis

Digitized for FRASER http://fraser.stlouisfed.org/ Federal Reserve Bank of St. Louis
Appendix A: Changes in Occupational Descriptions
Since the Bureau’ s last survey in this area, occupational descriptions for three office jobs were revised in order to obtain salary information for more specific categories. Therefore, data presented for these jobs in table A -l are not comparable to data presented in last year’ s bulletin.
Revisions were made in the descriptions for file clerks, keypunch operators, and stenographers. The revised description for file clerk groups these workers into three levels (class A, B, and C) in
stead of two (class A and B). The revised description for keypunch operator groups these workers into two defined classes (A and B) instead of a single category. Previously data were presented separately for general stenographers and technical stenographers. The revision combines general stenographers, with more responsible duties, and technical stenographers to form a new senior stenographer category; other general stenographers are maintained in that classification.
The revised occupational descriptions used this year are included in appendix B.
27Digitized for FRASER http://fraser.stlouisfed.org/ Federal Reserve Bank of St. Louis

Digitized for FRASER http://fraser.stlouisfed.org/ Federal Reserve Bank of St. Louis
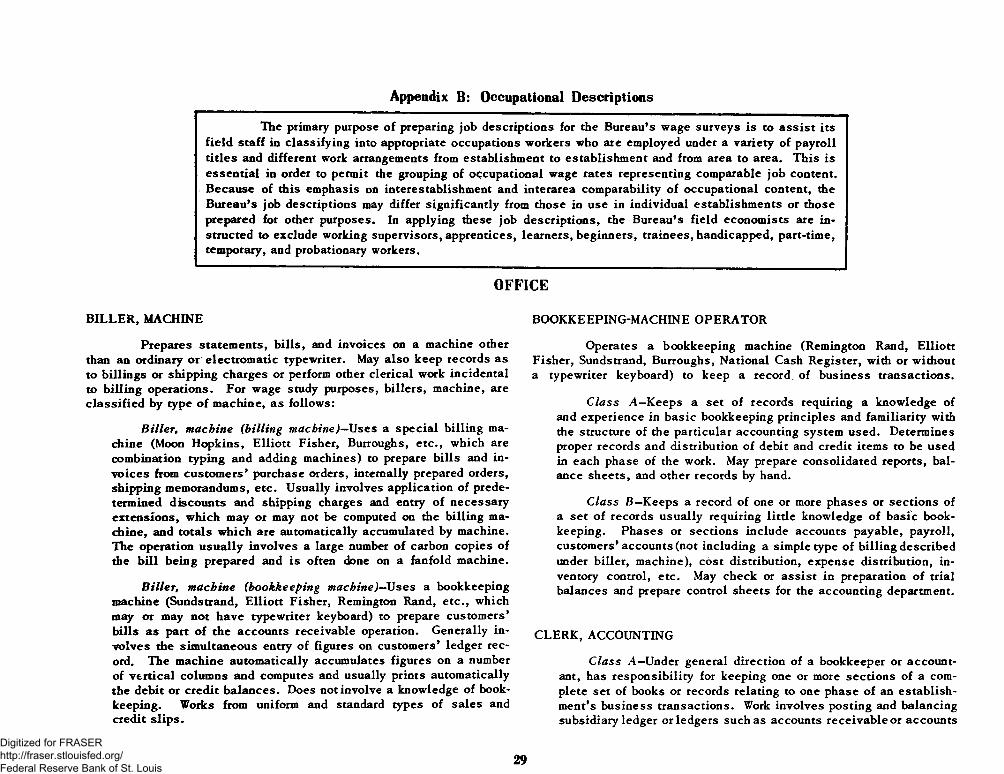
Appendix B: Occupational Descriptions
The primary purpose of preparing job descriptions for the Bureau’s wage surveys is to assist its field staff in classifying into appropriate occupations workers who are employed under a variety of payroll titles and different work arrangements from establishment to establishment and from area to area. This is essential in order to permit the grouping of occupational wage rates representing comparable job content. Because of this emphasis on interestablishment and interarea comparability of occupational content, the Bureau’s job descriptions may differ significantly from those in use in individual establishments or those prepared for other purposes. In applying these job descriptions, the Bureau’s field economists are instructed to exclude working supervisors, apprentices, learners, beginners, trainees, handicapped, part-time, temporary, and probationary workers.
OFFICE
BILLER, MACHINE
Prepares statements, bills, and invoices on a machine other than an ordinary or electromatic typewriter. May also keep records as to billings or shipping charges or perform other clerical work incidental to billing operations. For wage study purposes, billers, machine, are classified by type of machine, as follows:
Biller, machine (billing machine)—Uses a special billing machine (Moon Hopkins, Elliott Fisher, Burroughs, etc., which are combination typing and adding machines) to prepare bills and invoices from customers’ purchase orders, internally prepared orders, shipping memorandums, etc. Usually involves application of predetermined discounts and shipping charges and entry of necessary extensions, which may or may not be computed on the billing machine, and totals which are automatically accumulated by machine. The operation usually involves a large number of carbon copies of the bill being prepared and is often done on a fanfold machine.
Billet, machine (bookkeeping machine)—U ses a bookkeeping machine (Sundstrand, Elliott Fisher, Remington Rand, etc., which may or may not have typewriter keyboard) to prepare customers’ bills as part of the accounts receivable operation. Generally involves the simultaneous entry of figures on customers’ ledger record. The machine automatically accumulates figures on a number of vertical columns and computes and usually prints automatically the debit or credit balances. Does not involve a knowledge of bookkeeping. Works from uniform and standard types of sales and credit slips.
BOOKKEEPING-MACHINE OPERATOR
Operates a bookkeeping machine (Remington Rand, Elliott Fisher, Sundstrand, Burroughs, National Cash Register, with or without a typewriter keyboard) to keep a record, of business transactions.
Class A—Keeps a set of records requiring a knowledge of and experience in basic bookkeeping principles and familiarity with the structure of the particular accounting system used. Determines proper records and distribution of debit and credit items to be used in each phase of the work. May prepare consolidated reports, balance sheets, and other records by hand.
Class B — Keeps a record of one or more phases or sections of a set of records usually requiring little knowledge of basic bookkeeping. Phases or sections include accounts payable, payroll, customers’ accounts (not including a simple type of billing described under biller, machine), cost distribution, expense distribution, inventory control, etc. May check or assist in preparation of trial balances and prepare control sheets for the accounting department.
CLERK, ACCOUNTING
Class A—Under general direction of a bookkeeper or accountant, has responsibility for keeping one or more sections of a complete set of books or records relating to one phase of an establishment’s business transactions. Work involves posting and balancing subsidiary ledger or ledgers such as accounts receivable or accounts
29Digitized for FRASER http://fraser.stlouisfed.org/ Federal Reserve Bank of St. Louis
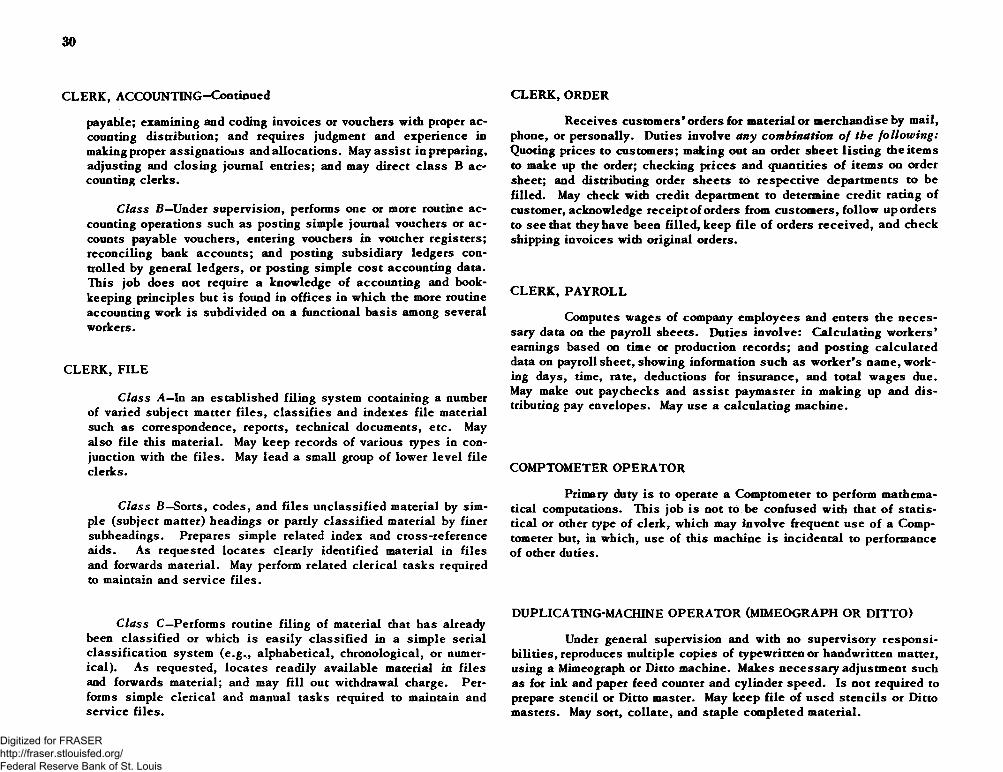
30
CLERK, ACCOUNTING—Continued
payable; examining and coding invoices or vouchers with proper accounting distribution; and requires judgment and experience in making proper assignations and allocations. May assist in preparing, adjusting and closing journal entries; and may direct class B accounting clerks.
Class B —Under supervision, performs one or more routine accounting operations such as posting simple journal vouchers or accounts payable vouchers, entering vouchers in voucher registers; reconciling bank accounts; and posting subsidiary ledgers controlled by general ledgers, or posting simple cost accounting data. This job does not require a knowledge of accounting and bookkeeping principles but is found in offices in which the more routine accounting work is subdivided on a functional basis among several workers.
CLERK, FILE
Class A—In an established filing system containing a number of varied subject matter files, classifies and indexes file material such as correspondence, reports, technical documents, etc. May also file this material. May keep records of various types in conjunction with the files. May lead a small group of lower level file clerks.
Class B—Sorts, codes, and files unclassified material by simple (subject matter) headings or partly classified material by finer subheadings. Prepares simple related index and cross-reference aids. As requested locates clearly identified material in files and forwards material. May perform related clerical tasks required to maintain and service files.
Class C—Performs routine filing of material that has already been classified or which is easily classified in a simple serial classification system (e.g., alphabetical, chronological, or numerical). As requested, locates readily available material in files and forwards material; and may fill out withdrawal charge. Performs simple clerical and manual tasks required to maintain and service files.
CLERK, ORDER
Receives customers9 orders for material or merchandise by mail, phone, or personally. Duties involve any combination o f the following: Quoting prices to customers; making out an order sheet listing the items to make up the order; checking prices and quantities of items on order sheet; and distributing order sheets to respective departments to be filled. May check with credit department to determine credit rating of customer, acknowledge receipt of orders from customers, follow up orders to see that they have been filled, keep file of orders received, and check shipping invoices with original orders.
CLERK, PAYROLL
Computes wages of company employees and enters the necessary data on the payroll sheets. Duties involve: Calculating workers* earnings based on time or production records; and posting calculated data on payroll sheet, showing information such as worker’s name, working days, time, rate, deductions for insurance, and total wages due. May make out paychecks and assist paymaster in making up and distributing pay envelopes. May use a calculating machine.
COMPTOMETER OPERATOR
Primary duty is to operate a Comptometer to perform mathematical computations. This job is not to be confused with that of statistical or other type of clerk, which may involve frequent use of a Comptometer but, in which, use of this machine is incidental to performance of other duties.
DUPLICATING-MACHINE OPERATOR (MIMEOGRAPH OR DITTO)
Under general supervision and with no supervisory responsibilities, reproduces multiple copies of typewritten or handwritten matter, using a Mimeograph or Ditto machine. Makes necessary adjustment such as for ink and paper feed counter and cylinder speed. Is not required to prepare stencil or Ditto master. May keep file of used stencils or Ditto masters. May sort, collate, and staple completed material.
Digitized for FRASER http://fraser.stlouisfed.org/ Federal Reserve Bank of St. Louis
KEYPUNCH OPERATOR
Class A—Operates a numerical and/or alphabetical or combination keypunch machine to transcribe data from various source documents to keypunch tabulating cards. Performs same tasks as lower level keypunch operator but in addition, work requires application of coding skills and the making of some determinations, for example, locates on the source document the items to be punched; extracts information from several documents; and searches for and interprets information on the document to determine information to be punched. May train inexperienced operators.
CZass fi—Under close supervision or following specific procedures or instructions, transcribes data from source documents to punched cards. Operates a numerical and/or alphabetical or combination keypunch machine to keypunch tabulating cards. May verify cards. Working from various standardized source documents, follows specified sequences which have been coded or prescribed in detail and require little or no selecting, coding, or interpreting data to be punched. Problems arising from erroneous items or codes, missing information, etc., are referred to supervisor.
OFFICE BOY OR GIRL
Performs various routine duties such as running errands, operating minor office machines such as sealers or mailers, opening and distributing mail, and other minor clerical work.
SECRETARY
Performs secretarial and clerical duties for a superior in an administrative or executive position. Duties include making appointments for superior; receiving people coming into office; answering and
31
making phone calls; handling personal and important or confidential mail, and writing routine correspondence on own initiative; and taking dictation (where transcribing machine is not used) either in shorthand or by Stenotype or similar machine, and transcribing dictation or the recorded information reproduced on a transcribing machine. May prepare special reports or memorandums for information of superior.
SECRETARY — Continued
STENOGRAPHER, GENERAL
Primary duty is to take dictation from one or more persons either in shorthand or by Stenotype or similar machine, involving a normal routine vocabulary; and transcribe dictation. May also type from written copy. May maintain files, keep simple records, or perform other relatively routine clerical tasks. May operate from a stenographic pool. Does not include transcribing-machine work. (See transcribing-machine operator.)
STENOGRAPHER, SENIOR
Primary duty is to take dictation from one or more persons, either in shorthand or by Stenotype or similar machine, involving a varied technical or specialized vocabulary such as in legal briefs or reports on scientific research and transcribe dictation. May also type from written copy. May also set up and maintain files, keep records, etc.
OR
Performs stenographic duties requiring significantly greater independence and responsibility than stenographers, general as evidenced by die following: Work requires high degree of stenographerspeed and accuracy; and a thorough working knowledge of general business and office procedures and of the specific business operations, organization, policies, procedures, files, workflow, etc. Uses this knowledge in performing stenographic duties and responsible clerical tasks such as, maintaining followup files; assembling material for reports, memorandums, letters, etc,; composing simple letters from general instructions; reading and routing incoming mail; and answering routine questions, etc. Does not include transcribing-machine work.
Digitized for FRASER http://fraser.stlouisfed.org/ Federal Reserve Bank of St. Louis
32
SWITCHBOARD OPERATOR
Operates a single- or multiple-position telephone switchboard. Duties involve handling incoming, outgoing, and intraplant or office calls. May record toll calls and take messages. May give information to persons who call in, or occasionally take telephone orders. For workers who also act as receptionists see switchboard operator- receptionist.
SWITCHBOARD OPERATOR-RECEPTIONIST
In addition to performing duties of operator, on a single position or monitor-type switchboard, acts as receptionist and may also type or perform routine clerical work as part of regular duties. This typing or clerical work may take the major part of this worker’ s time while at switchboard.
TABULA TING-MACHINE OPERATOR
Class A— Operates a variety of tabulating or electrical accounting machines, typically including such machines as the tabulator, calculator, interpreter, collator, and others. Performs complete reporting assignments without close supervision, and performs difficult wiring as required. The complete reporting and tabulating assignments typically involve a variety of long and complex reports which often are of irregular or nonrecurring type requiring some planning and sequencing of steps to be taken. As a more experienced operator, is typically involved in training new operators in machine operations, or partially trained operators in wiring from diagrams and operating sequences of long and complex reports, Does not include working supervisors performing tabulating-machine operations and day-to-day supervision of the work and production of a group of tabulating-machine operators.
Class B—Operates more difficult tabulating or electrical accounting machines such as the tabulator and calculator, in addition to the sorter, reproducer, and collator. This work is performed under specific instructions and may include the performance of some wiring from diagrams. The work typically involves, for example, tabulations involving a repetitive accounting exercise, a complete but small tabulating study, or parts of a longer and more complex report. Such reports and studies are usually of a recurring nature where the procedures are well established. May also include the training of new employees in the basic operation of the machine.
TABULATING-MACHINE OPERATOR-Continued
Class C—Operates simple tabulating or electrical accounting machines such as the sorter, reproducing punch, collator, etc., with specific instructions. May include simple wiring from diagrams and some filing work. The work typically involves portions of a work unit, for example, individual sorting or collating runs or repetitive operations.
TRANSCRIBING-MACHINE OPERATOR, GENERAL
Primary duty is to transcribe dictation involving a normal routine vocabulary from transcribing-machine records. May also type from written copy and do simple clerical work. Workers transcribing dictation involving a varied technical or specialized vocabulary such as legal briefs or reports on scientific research are not included. A worker who takes dictation in shorthand or by Stenotype or similar machine is classified as a stenographer, general.
TYPIST
Uses a typewriter to make copies of various material or to make out bills after calculations have been made by another person. May include typing of stencils, mats, or similar materials for use in duplicating processes. May do clerical work involving little special training, such as keeping simple records, filing records and reports, or sorting and distributing incoming mail.
Class A—Performs one or more o f the following: Typing material in final form when it involves combining material from several sources or responsibility for correct spelling, syllabication, punctuation, etc., of technical or unusual words or foreign language material; and planning layout and typing of complicated statistical tables to maintain uniformity and balance in spacing. May type routine form letters varying details to suit circumstances.
Class B—Performs one or more o f the following: Copy typing from rough or clear drafts; routine typing of forms, insurance policies, etc.; and setting up simple standard tabulations, or copying more complex tables already set up and spaced properly.
Digitized for FRASER http://fraser.stlouisfed.org/ Federal Reserve Bank of St. Louis
33
PROFESSIONAL AND TECHNICALDRAFTSMAN, JUNIOR
(Assistant draftsman)Draws to scale units or parts of drawings prepared by drafts
man or others for engineering, construction, or manufacturing purposes. Uses various types of drafting tools as required. May prepare drawings from simple plans or sketches, or perform other duties under direction of a draftsman.
DRAFTSMAN, LEADER
Plans and directs activities of one or more draftsmen in preparation of working plans and detail drawings from rough or preliminary sketches for engineering, construction, or manufacturing purposes. Duties involve a combination o f the following: Interpreting blueprints, sketches, and written or verbal orders; determining work procedures; assigning duties to subordinates and inspecting their work; and performing more difficult problems. May assist subordinates during emergencies or as a regular assignment, or perform related duties of a supervisory or administrative nature.
DRAFTSMAN, SENIOR
Prepares working plans and detail drawings from notes, rough or detailed sketches for engineering, construction, or manufacturing purposes. Duties involve a combination o f the following: Preparing working plans, detail drawings, maps, cross-sections, etc., to scale by use of drafting instruments; making engineering computations such as those involved in strength of materials, beams and trusses; verifying
DRAFTSMAN, SENIOR-Continued
completed work, checking dimensions, materials to be used, and quantities; writing specifications; and making adjustments or changes in drawings or specifications. May ink in lines and letters on pencil drawings, prepare detail units of complete drawings, or trace drawings. Work is frequently in a specialized field such as architectural, electrical, mechanical, or structural drafting.
NURSE, INDUSTRIAL (REGISTERED)
A registered nurse who gives nursing service to ill or injured employees or other persons who become ill or suffer an accident on the premises of a factory or other establishment. Duties involve a combination o f the following: Giving first aid to the ill or injured; attending to subsequent dressing of employees’ injuries; keeping records of patients treated; preparing accident reports for compensation or other purposes; conducting physical examinations and health evaluations of applicant^ and employees; and planning and carrying out programs involving health education, accident prevention, evaluation of plant environment, or other activities affecting the health, welfare, and safety of all personnel.
TRACER
Copies plans and drawings prepared by others, by placing tracing cloth or paper over drawing and tracing with pen or pencil. Uses T-square, compass, and other drafting tools. May prepare simple drawings and do simple lettering.
MAINTENANCE AND POWERPLANT
CARPENTER, MAINTENANCE
Performs the carpentry duties necessary to construct and maintain in good repair building woodwork and equipment such as bins, cribs, counters, benches, partitions, doors, floors, stairs, casings, and trim made of wood in an establishment. Work involves most o f the following: Planning and laying out of work from blueprints, drawings, models, or verbal instructions; using a variety of carpenter’ s handtools, portable
CARPENTER, MAINTENANCE-Continued
power tools, and standard measuring instruments; making standard shop computations relating to dimensions of work; and selecting materials necessary for the work. In general, the work of the maintenance carpenter requires rounded training and experience usually acquired through a formal apprenticeship or equivalent training and experience.
Digitized for FRASER http://fraser.stlouisfed.org/ Federal Reserve Bank of St. Louis
34
Performs a variety of electrical trade functions such as the installation, maintenance, or repair of equipment for the generating, distribution, or utilization of electric energy in an establishment. Work involves most o f the following: Installing or repairing any of a variety of electrical equipment such as generators, transformers, switchboards, controllers, circuit breakers, motors, heating units, conduit systems, or other transmission equipment; working from blueprints, drawings, layout, or other specifications; locating and diagnosing trouble in the electrical system or equipment; working standard computations relating to load requirements of wiring or electrical equipment; and using a variety of electrician’ s handtools and measuring and testing instruments. In general, the work of the maintenance electrician requires rounded training and experience usually acquired through a formal apprenticeship or equivalent training and experience.
ELECTRICIAN, MAINTENANCE
ENGINEER, STATIONARY
Operates and maintains and may also supervise the operation of stationary engines and equipment (mechanical or electrical) to supply the establishment in which employed with power, heat, refrigeration, or air-conditioning. Work involves: Operating and maintainingequipment such as steam engines, air compressors, generators, motors, turbines, ventilating and refrigerating equipment, steam boilers, and boiler-fed water pumps; making equipment repairs; and keeping a record of operation of machinery, temperature, and fuel consumption. May also supervise these operations. Head or chief engineers in establish• ments employing more than one engineer are excluded.
FIREMAN, STATIONARY BOILER
Fire stationary boilers to furnish the establishment in which employed with heat, power, or steam. Feeds fuels to fire by hand or operates a mechanical stoker, gas, or oil burner; and checks water and safety valve. May clean, oil, or assist in repairing boilerroom equipment.
HELPER, MAINTENANCE TRADES
Assists one or more workers in the skilled maintenance trades, by performing specific or general duties of lesser skill, such as keeping a worker supplied with materials and tools; cleaning working area, machine, and equipment; assisting worker by holding materials or tools; and performing other unskilled tasks as directed by journeyman. The kind of work the helper is permitted to perform varies from trade to trade: In some trades the helper is confined to supplying, lifting, and holding materials and tools and cleaning working areas; and in others he is permitted to perform specialized machine operations, or parts of a trade that are also performed by workers on a full-time basis.
MACHINE-TOOL OPERATOR, TOOLROOM
Specializes in the operation of one or more types of machine tools, such as jig borers, cylindrical or surface grinders, engine lathes, or milling machines in the construction of machine-shop tools, gages, jigs, fixtures, or dies. Work involves m ost o f the following: Planning and performing difficult machining operations; processing items requiring complicated setups or a high degree of accuracy; using a variety of precision measuring instruments; selecting feeds, speeds, tooling and operation sequence; and making necessary adjustments during operation to achieve requisite tolerances or dimensions. May be required to recognize when tools need dressing, to dress tools, and to select proper coolants and cutting and lubricating oils. For cross-industry wage study purposes, machine-tool operators, toolroom, in tool and die jobbing shops are excluded from this classification.
MACHINIST, MAINTENANCE
Produces replacement parts and new parts in making repairs of metal parts of mechanical equipment operated in an establishment. Work involves most o f the following: Interpreting written instructions andspecifications; planning and laying out of work; using a variety of machinist’ s handtools and precision measuring instruments; setting up and operating standard machine tools; shaping of metal parts to close tolerances; making standard shop computations relating to dimensions of work, tooling, feeds and speeds of machining; knowledge of the working
Digitized for FRASER http://fraser.stlouisfed.org/ Federal Reserve Bank of St. Louis
MACHINIST, MAINTENANCE-Continued
properties of the common metals; selecting standard materials, parts, and equipment required for his work; and fitting and assembling parts into mechanical equipment. In general, the machinist’s work normally requires a rounded training in machine-shop practice usually acquired through a formal apprenticeship or equivalent training and experience.
MECHANIC, AUTOMOTIVE (MAINTENANCE)
Repairs automobiles, buses, motortrucks, and tractors of an establishment. Work involves most o f the following: Examining automotive equipment to diagnose source of trouble; disassembling equipment and performing repairs that involve the use of such handtools as wrenches, gages, drills, or specialized equipment in disassembling or fitting parts; replacing broken or defective parts from stock; grinding and adjusting valves; reassembling and installing the various assemblies in the vehicle and making necessary adjustments; and alining wheels, adjusting brakes and lights, or tightening body bolts. In general, the work of the automotive mechanic requires rounded training and experience usually acquired through a formal apprenticeship or equivalent training and experience.
MECHANIC, MAINTENANCE
Repairs machinery or mechanical equipment of an establishment. Work involves most o f the following: Examining machines and mechanical equipment to diagnose source of trouble; dismantling or partly dismantling machines and performing repairs that mainly involve the use of handtools in scraping and fitting parts; replacing broken or defective parts with items obtained from stock; ordering the production of a replacement part by a machine shop or sending of the machine to a machine shop for major repairs; preparing written specifications for major repairs or for die production of\parts ordered from machine shop; reassembling machines; and making all necessary adjustments for operation. In general, the work of a maintenance mechanic requires rounded training and experience usually acquired through a formal apprenticeship or equivalent training and experience. Excluded from this classification are workers whose primary duties involve setting up or adjusting machines.
35
Installs new machines or heavy equipment and dismantles and installs machines or heavy equipment when changes in the plant layout are required. Work involves most o f the following: Planning and laying out of the work; interpreting blueprints or other specifications; using a variety of handtools and rigging; making standard shop computations relating to stresses, strength of materials, and centers of gravity; alining and balancing of equipment; selecting standard tools, equipment and parts to be used; and installing and maintaining in good order power transmission equipment such as drives and speed reducers. In general, the millwright’ s work normally requires a rounded training and experience in die trade acquired through a formal apprenticeship or equivalent training and experience.
OILER
MILLWRIGHT
Lubricates* with oil or grease, the moving parts or wearing surfaces of mechanical equipment of an establishment.
PAINTER, MAINTENANCE
Paints and redecorates walls, woodwork, and fixtures of an establishment. Work involves the following: Knowledge of surface peculiarities and types of paint required for different applications; preparing surface for painting by removing old finish or by placing putty or filler in nail holes and interstices; and applying paint with spray gun or brush. May mix colors, oils, white lead, and other paint ingredients to obtain proper color or consistency. In general, the work of the maintenance painter requires rounded training and experience usually acquired through a formal apprenticeship or equivalent training and experience.
PIPEFITTER, MAINTENANCE
Installs or repairs water, steam, gas, or other types of pipe and pipefittings in an establishment. Work involves most o f the following: Laying out of work and measuring to locate position of pipe from drawings or other written specifications; cutting various sizes of pipe to correct lengths with chisel and hammer or oxyacetylene torch or pipecutting machine; threading pipe with stocks and dies; bending pipe by hand-driven or power-driven machines; assembling pipe with couplings
Digitized for FRASER http://fraser.stlouisfed.org/ Federal Reserve Bank of St. Louis
36
and fastening pipe to hangers; making standard shop computations relating to pressures, flow, and size of pipe required; and making standard tests to determine whether finished pipes meet specifications. In general the work of the maintenance pipefitter requires rounded training and experience usually acquired through a formal apprenticeship or equivalent training and experience. Workers primarily engaged in installing and repairing building sanitation or heating system s are excluded .
PLUMBER, MAINTENANCE
Keeps the plumbing system of an establishment in. good order. Work involves: Knowledge of sanitary codes regarding installation of vents and traps in plumbing system; installing or repairing pipes and fixtures; and opening clogged drains with a plunger or plumber’s snake. In general, the work of the maintenance plumber requires rounded training and experience usually acquired through a formal apprenticeship or equivalent training and experience.
SHEET-METAL WORKER, MAINTENANCE
Fabricates, installs, and maintains in good repair the sheet- metal equipment and fixtures (such as machine guards, grease pans, shelves, lockers, tanks, ventilators, chutes, ducts, metal roofing) of an establishment. Work involves most o f the following: Planning and laying out all types of sheet-metal maintenance work from blueprints, models, or other specifications; setting up and operating all available
PIPEFITTER, MAINTENANCE-Continued
types of sheet-metal-working machines; using a variety of handtools in cutting, bending, forming, shaping, fitting, and assembling; and installing sheet-metal articles as required. In general, the work of the maintenance sheet-metal worker requires rounded training and experience usually acquired through a formal apprenticeship or equivalent training and experience.
TOOL AND DIE MAKER
(Die maker; jig maker; tool maker; fixture maker; gage maker)
Constructs and repairs machine-shop tools, gages, jigs, fixtures or dies for forgings, punching, and other metal-forming work. Work involves most of the following: Planning and laying out of work from models, blueprints, drawings, or other oral and written specifications; using a variety of tool and die maker’s handtools and precision measuring instruments, understanding of the working properties of common metals and alloys; setting up and operating of machine tools and related equipment; making necessary shop computations relating to dimensions of work, speeds, feeds, and tooling of machines; heattreating of metal parts during fabrication as well as of finished tools and dies to achieve required qualities; working to close tolerances; fitting and assembling of parts to prescribed tolerances and allowances; and selecting appropriate materials, tools, and processes. In general, the tool and die maker’s work requires a rounded training in machine-shop and toolroom practice usually acquired through a formal apprenticeship or equivalent training and experience.
For cross-industry wage study purposes, tool and die makers in tool and die jobbing shops are excluded from this classification.
SHEET-METAL WORKER, MAINTENANCE—Continued
CUSTODIAL AND MATERIAL MOVEMENT
ELEVATOR OPERATOR, PASSENGER
Transports passengers between floors of an office building apartment house, department store, hotel, or similar establishment. Workers who operate elevators in conjunction with other duties such as those of starters and janitors are excluded.
GUARD
Performs routine police duties, either at fixed post or on tour, maintaining order, using arms or force where necessary. Includes gate- men who are stationed at gate and check on identity o f em ployees and other persons entering.
Digitized for FRASER http://fraser.stlouisfed.org/ Federal Reserve Bank of St. Louis
JANITOR, PORTER, OR CLEANER
(Sweeper; charwomen; janitress)
Cleans and keeps in an orderly condition factory working areas and washrooms, or premises of an office, apartment house, or commercial or other establishment. Duties involve a combination o f the following: Sweeping, mopping or scrubbing, and polishing floors; removing chips, trash, and other refuse; dusting equipment, furniture, or fixtures; polishing metal fixtures or trimmings; providing supplies and minor maintenance services; and cleaning lavatories, showers, and restrooms. Workers who specialize in window washing are excluded.
LABORER, MATERIAL HANDLING
(Loader and unloader; handler and stacker; shelver; trucker; stock- man or stock helper; warehouseman or warehouse helper)
A worker employed in a warehouse, manufacturing plant, store, or other establishment whose duties involve one or more o f the following: Loading and unloading various materials and merchandise on orfrom freight cars, trucks, or other transporting devices; unpacking, shelving, or placing materials or merchandise in proper storage location; and transporting materials or merchandise by hand truck, car, or wheelbarrow. Longshoremen, who load and unload ships are excluded.
ORDER FILLER
(Order picker; stock selector; warehouse stockman)
Fills shipping or transfer orders for finished goods from stored merchandise in accordance with specifications on sales slips, customers’ orders, or other instructions. May, in addition to filling orders and indicating items filled or omitted, keep records of outgoing orders requisition additional stock, or report short supplies to supervisor, and perform dther related duties.
37
PACKER, SHIPPING
Prepares finished products for shipment or storage by placing them in shipping containers, the specific operations performed being dependent upon the type, size, and number of units to be packed, the type of container employed, and method of shipment. Work requires the placing of items in shipping containers and may involve one or more o f the following: Knowledge of various items of stock in order to verify content; selection of appropriate type and size of container; inserting enclosures in container; using excelsior or other material to prevent breakage or damage; closing and sealing container; and applying labels or entering identifying data on container. Packers who also make wooden boxes or crates are excluded.
SHIPPING AND RECEIVING CLERK
Prepares merchandise for shipment, or receives and is responsible for incoming shipments of merchandise or other materials. Shipping work involves: A knowledge of shipping procedures, practices,routes, available means of transportation and rates; and preparing records of the goods shipped, making up bills of lading, posting weight and shipping charges, and keeping a file of shipping records. May direct or assist in preparing the merchandise for shipment. Receiving work in volves: Verifying or directing others in verifying the correctness of shipments against bills of lading, invoices, or other records; checking for shortages and rejecting damaged goods; routing merchandise or materials to proper departments; and maintaining necessary records and files.
For wage study purposes, workers are classified as follows:
Receiving clerk Shipping clerkShipping and receiving clerk
Digitized for FRASER http://fraser.stlouisfed.org/ Federal Reserve Bank of St. Louis
38
TRUCKDRIVER
Drives a truck within a city or industrial area to transport materials, merchandise, equipment, or men between various types of establishments such as: Manufacturing plants, freight depots, warehouses,wholesale and retail establishments, or between retail establishments and customers* houses or places of business. May also load or unload truck with or without helpers, make minor mechanical repairs, and keep truck in good working order. Driver-salesmen and over-the-road drivers are excluded.
For wage study purposes, truckdrivers are classified by size and type of equipment, as follows: (Tractor-trailer should be rated onthe basis of trailer capacity.)
Truckdriver (combination o f s iz e s listed separately) Truckdriver, light (under l l/2 tons)Truckdriver, medium (1% to and including 4 tons) Truckdriver, heavy (over 4 tons, trailer type) Truckdriver, heavy (over 4 tons, other than trailer type)
TRUCKER, POWER
Operates a manually controlled gasoline- or electric-powered truck or tractor to transport goods and materials of all kinds about a warehouse, manufacturing plant, or other establishment.
For wage study purposes, workers are classified by type of truck, as follows:
Trucker, power (forklift)Trucker, power (other than forklift)
WATCHMAN
Makes rounds of premises periodically in protecting property against fire, theft, and illegal entry.
☆ U .S . GOVERNMENT PRINTING OFFICE: 1 9 6 2 O — 6 4 3 8 3 8
Digitized for FRASER http://fraser.stlouisfed.org/ Federal Reserve Bank of St. Louis


![H20youryou[2] · 2020. 9. 1. · 65 pdf pdf xml xsd jpgis pdf ( ) pdf ( ) txt pdf jmp2.0 pdf xml xsd jpgis pdf ( ) pdf pdf ( ) pdf ( ) txt pdf pdf jmp2.0 jmp2.0 pdf xml xsd](https://img.pdfslide.net/doc/110x75/60af39aebf2201127e590ef7/h20youryou2-2020-9-1-65-pdf-pdf-xml-xsd-jpgis-pdf-pdf-txt-pdf-jmp20.jpg)


