Embed Size (px)
Citation preview

INDUSTRY WAGE SURVEYFootwear
IAPRIL 1962
Bulletin No. 1360
UNITED STATES DEPARTMENT OF LABOR W. Willard Wirtz, Secretary
BUREAU OF LABOR STATISTICS Ewan Clague, Commissioner
Digitized for FRASER http://fraser.stlouisfed.org/ Federal Reserve Bank of St. Louis

INDUSTRY WAGE SURVEY
Footwear
APRIL 1962
Bulletin No. 1360April 1963
UNITED STATES DEPARTMENT OF LABOR W. Willard Wirtz, Secretary
BUREAU OF LABOR STATISTICS Ewan Cfague, Commissioner
y
For sale by the Superintendent of Documents, U.S. Government Printing Office, Washington 25, D.C. Price 45 cents
Digitized for FRASER http://fraser.stlouisfed.org/ Federal Reserve Bank of St. Louis

Digitized for FRASER http://fraser.stlouisfed.org/ Federal Reserve Bank of St. Louis

Preface
The results of a survey of wages and supplementary practices in the footwear manufacturing industry in April 1962, conducted by the Bureau of Labor Statistics, are summarized in this bulletin. Separate releases for 15 areas, issued within a few months after the payroll period studied, may be obtained from the Bureau of Labor Statistics, Washington 25, D .C., or from any of its regional offices.
This bulletin was prepared by Fred W. Mohr of the Bureau's Division of Occupational Pay, under the general direction of H. M. Douty, Assistant Commissioner for Wages and Industrial Relations. Field work for the survey was directed by the Assistant Regional Directors for Wages and Industrial Relations.
Other reports available from the Bureau's program of industry wage studies as well as the addresses of the Bureau's six regional offices are listed at the end of this bulletin.
Digitized for FRASER http://fraser.stlouisfed.org/ Federal Reserve Bank of St. Louis

Digitized for FRASER http://fraser.stlouisfed.org/ Federal Reserve Bank of St. Louis

Contents
Page
Summary _______________________________________________________________________ 1Industry characteristics ________________________________ 1Average hourly earnings _______________________________ 3Occupational earnings _________________________________________________________ 5Establishment practices and supplementary wage provisions ______________ 6
Scheduled weekly hours and shift practices _______________________________ 6Paid holidays _______________________________________________________________ 7Paid vacations ______________________________________________________________ 7Health, insurance, and pension plans ____________________________________ 7Nonproduction bonuses _____________________________________________________ 8
Tables:
Average hourly earnings:
1. By selected characteristics— Footwear industry _________________ 9
Earnings distribution:
2. Footwear industry __________________________________________________ 103. Men's Goodyear-welt dress shoes _________________________________ 114. Men's Goodyear-welt work shoes __________________________________ 115. Men's cement-process shoes ______________________________________ 126. Women's cement-process (conventional-lasted) shoes ___________ 137. Women's cement-process (slip-lasted) shoes _____________________ 148. Women's McKay (including Littleway) shoes ______________________ 149. Misses' and children's cement-process
(conventional-lasted) shoes _______________________________________ 1510. Misses' and children's Goodyear-welt shoes ______________________ 1611. M isses', children's, and infants' stitchdown shoes ______________ 16
Occupational earnings:
Men's Goodyear-welt dress shoes:
12. All establishments _____________________________________________ 1713. By size of establishment _______________________________________ 1914. By size of community __________________________________________ 2015. By size of establishment and size of community _____________ 2116. Brockton, Mass. _______________________________________________ 2317. Wisconsin ______________________________________________________ 25
Men's Goodyear-welt work shoes:
18. All establishments _____________________________________________ 27
Men's cement-process shoes:
19. All establishments _____________________________________________ 27
v
Digitized for FRASER http://fraser.stlouisfed.org/ Federal Reserve Bank of St. Louis

Contents— Continued
Page
T able s— C ontinuedOccupational earnings— Continued
Women's cement-process (conventional-lasted) shoes:
20. All establishments ________________________________ ;______________ 2821. By size of establishment _________________________________________ 3022. By size of community ___________________________________________ 3223. By size of establishment and size of community _______________ 3424. Auburn—Lewiston, Maine ________________________________________ 3625. Maine (except Auburn—Lewiston) ________________________________ 3726. Boston, Mass. ___________________________________________________ 3827. Haverhill, Mass. _________________________________________________ 3928. Lawrence—Lowell, Mass. ________________________________________ 4029. Lynn, Mass. ______________________________________________________ 4130. Worcester, Mass. _____________________________________ 4231. Southeastern New Hampshire ____________________________________ 4332. St. Louis, M o.—111. 4433. Missouri (except St. Louis) _____________________________________ 4534. Los Angeles—Long Beach, Calif. _______________________________ 47
Women's cement-process (slip-lasted) shoes:35. All establishments _______________________________________________ 48
Women's McKay (including Littleway) shoes:36. All establishments _______________________________________________ 49
M isses1 and children's cement-process (conventional-lasted) shoes:37. All establishments _______________________________________________ 50
Misses' and children's Goodyear-welt shoes:38. All establishments _______________________________________________ 5139. Southeastern Pennsylvania ______________________________________ 52
M isses', children's, and infants' stitchdown shoes:40. All establishments _______________________________________________ 5341. New York, N. Y. __________________________________________________ 54
Establishment practices and supplementary wage provisions:
42. Scheduled weekly hours _____________________________________________ 5543. Shift differential practices __________________________________________ 5544. Paid holidays ________________________________________________________ 5645. Paid vacations ______________________________________________________ 5746. Health, insurance, and pension plans ______________________________ 5947. Nonproduction bonuses ________ _____________________________________ 60
Appendixes:
A. Scope and method of survey _____________________________________________ 61B. Occupational descriptions ___________________________ 65
vi
Digitized for FRASER http://fraser.stlouisfed.org/ Federal Reserve Bank of St. Louis

Industry Wage Survey
Footwear, April 1962
Summary
Production workers in the footwear manufacturing industry averaged $1.64 an hour in April 1962, exclusive of premium pay for overtime and for work on weekends, holidays, and late shifts. A fifth of the 182, 449 workers covered by a Bureau of Labor Statistics survey1 earned between $1.15 and $1.20 an hour; earnings of the remainder of the workers were widely dispersed, as would be expected in an industry that is broadly distributed geographically, employs workers with a variety of skills, and pays most of them on a piecework basis.
Pay levels varied from $1.79 an hour in New England to $1.41 in the Southwest. Among nine product branches, nationwide average hourly earnings ranged from $1.46 to $1.79. Earnings data were also tabulated by size of community and plant employment, and for selected representative occupations.
Plants employing a substantial majority of the workers had work schedules of 40 hours a week and provided at least 6 paid holidays a year, paid vacations, life insurance, and various types of health insurance benefits.
Industry Characteristics
In the first 11 months of 1962, the shoe manufacturing industry in the United States produced nearly 577 million pairs of footwear, except rubber,2 about 5 percent above the corresponding 1961 period.
Shoes are produced in a wide variety of sizes, styles, and shapes, and by many different methods of construction.3 Classification by type of shoe refers basically to the means by which the outsole is attached to the remainder of the shoe. Thus, shoes are designated as sewed, cemented, or nailed. Within these groups there are distinctive methods such as Goodyear-welt, McKay-welt, and stitchdown sewed shoes, and conventional-lasted and slip-lasted cemented shoes. The major types of shoe construction, based on production-worker employment in April 1962, were women's cement-process (conventional-lasted) and men's Goodyear-welt dress shoes ( 79 , 000 and 36,000 workers, respectively). Among seven other types for which separate data are presented in table 1, production- worker employment ranged from 3,300 in establishments making primarily men's cement-process shoes to 10,700 in misses' and children's cement-process (conventional-lasted) shoes.
1 See appendix A for scope and method of survey; also for definition of regions and the term "production workers" as used in this study.
2 Current Industrial Reports, January 17, 1963, Series M31A (62)—11,U.S. Department of Commerce, Bureau of the Census.
3 A description of the various methods of construction appears in How American Shoes are Made (United Shoe Machinery Corporation, I960).
1
Digitized for FRASER http://fraser.stlouisfed.org/ Federal Reserve Bank of St. Louis

2
Four regions together accounted for more than four-fifths of the work force: New England, one-third; Middle Atlantic, one-fifth; Great Lakes, one-sixth; and the Middle West, one-eighth.
The relative importance of the different types of shoes manufactured differed among the regions. For example, plants manufacturing women’ s cement-process (conventional-lasted) shoes accounted for more than half of the workers in New England compared with slightly more than a third in the Middle Atlantic and Great Lakes regions. Plants primarily manufacturing men's Goodyear-welt dress shoes accounted for a fifth of the workers in New England and more than a third in the Great Lakes region. Three-fifths of the women’ s McKay shoe plant workers were in New England; half of the women's cement- process (slip-lasted) shoe plant workers were in the Middle Atlantic region.
Slightly more than two-fifths of the workers were employed in metropolitan areas4 in April 1962. The proportions differed, however, among the major regions— approximately one-tenth in the Middle West, one-fourth in the Great Lakes region, one-half in New England, and four-fifths in the Middle Atlantic region. The proportions also differed by branch of industry.
Percent of workers in
metropolitan areas
Men's Goodyear-welt dress shoes -------------------------------- 43Men's Goodyear-welt work shoes _____________________ 30Men's cement-process shoes ----------------------------------------- 5Women's cement-pro cess (conventional-
lasted) shoes __________________________________________ 46Women's cement-process (slip-lasted) shoes--------------- 50Women's McKay (including Little way) shoes -------------- 26Misses' and children's cement-process
(conventional-lasted) shoes----------------------------------------- 35Misses' and children's Goodyear-welt shoes --------------- 54Misses', children's, and infants'
stitchdown shoes --------------------------------------------------------- 39
Establishments employing 250 or more workers accounted for nearly three-fourths of the workers in the study; approximately three-fifths in the Middle Atlantic region, three-fourths in New England, four-fifths in the Great Lakes and seven-eighths in the Middle West. The proportions of workers in these larger factories also varied by branch of industry, as indicated in the tabulation on the next page.
4 Standard Metropolitan Statistical Areas as defined by the U.S. Bureau of the Budget.
Digitized for FRASER http://fraser.stlouisfed.org/ Federal Reserve Bank of St. Louis

3
Percent of workers in establishments with 250 or more
workers
Men's Goodyear-welt dress shoes---------------------------- 83Men's Goodyear-welt work shoes---------------------------- 71Men's cement-process shoes------------------------------------ 81Women's cement-process (conventional-
lasted) shoes----------------------------------------------------------- 83Women's cement-process (slip-lasted) shoes---------- 66Women's McKay (including Littleway) sh oes-------- 59Misses' and children's cement-process
(conventional-lasted) shoes ---------------------------------- 71Misses' and children's Goodyear-welt sh oes______ 55Misses', children's, and infants'
stitchdown shoes __________________________________ 56
Establishments in which a majority of the workers were covered by terms of labor-management agreements accounted for approximately half of the industry's production workers. About seven-tenths in the Great Lakes and Middle West regions, one-half in New England, and two-fifths of the workers in the Middle Atlantic region were employed in plants with such contract coverage. Nearly three-fifths of the workers in the women's cement-process (conventional- lasted) and men's Goodyear-welt dress shoes branches of the industry were in this category. Unionization was less prevalent in the women's McKay, m isses', children's, and infants' stitchdown; and men's cement-process shoe factories than in the other branches of the industry studied separately. The United Shoe Workers of America and the Boot and Shoe Workers' Union (both AFL—CIO) are the two major unions. Nonaffiliated unions also have representation in the industry.
The making of a shoe involves the assembly of many separate parts through a long series of carefully controlled, skillfully executed operations. The types of occupations in shoe factories vary from those requiring a relatively short period of training to highly skilled jobs involving the cutting and trimming of leather parts. Women are commonly employed in stitching operations; men, in the cutting and lasting operations and in plant maintenance work.
Incentive systems of wage payment (usuallybased on individual piecework) applied to seven-tenths of the production workers. The proportions of incentive workers ranged from nearly half in the Pacific region to approximately four-fifths in the Great Lakes, Middle West, and Southwest. By major type of footwear produced, the proportions ranged from about two-thirds in plants making misses' and children's Goodyear-welt and m isses', children's, and infants' stitchdown shoes to slightly more than three-fourths in plants producing men's Goodyear-welt work shoes, men's cement-process shoes, women's McKay (including Littleway) shoes, and misses' and children's cement-process shoes. Workers in most occupations for which separate data were obtained were generally paid incentive rates. However, floor boys and girls, inspectors, janitors, and maintenance mechanics were usually paid on a time basis.
Average Hourly Earnings
Straight-time hourly earnings of production workers in the footwear manufacturing industry averaged $1.64 in April 1962 (table 1). The estimated 107, 146 women in the industry averaged $1.47, compared with $1.88 for the
Digitized for FRASER http://fraser.stlouisfed.org/ Federal Reserve Bank of St. Louis

4
75, 303 men. In the major regions of industry concentration (together accounting for more than four-fifths of the work force) New England, Middle Atlantic, Great Lakes, and Middle West, the earnings of all production workers averaged $1.79, $1.57, $1.68, and $1.53 an hour, respectively. Among the areas for which dataare presented for selected branches of the industry, average hourly earnings of production workers ranged from $1.51 in women's cement-process (conventional- lasted) shoe plants in Missouri, except St. Louis, to $2.06 in the same branch of the industry in Haverhill, Mass.
Nationwide, average earnings had increased about 12 percent (17 cents) since April 1957, when the Bureau last made a comprehensive study of occupational earnings in the industry.5 During this period, the Federal minimum wage was increased from $1 to $1.15 an hour (effective September 3, 1961). In April 1962, 20 percent of the workers were in the $1.15 to $1.20 earnings interval(table 2);6 in April 1957, approximately the same proportion (19 percent) were in the $1 to $1.05 interval. As indicated in the following tabulation, the degree of clustering at or just above the Federal minimum wage in effect at the time of the studies varied among regions.
Percent of production workers with average hourly earnings of—
$1. 15 $ 1 .0 0and under and under
$1. 20 $1 .05
April 1962 April 1957
New England------------------------------ 14.9 16.7Middle Atlantic ------------------------ 24. 2 20. 2Border States------------------------------ 29.5 31.9Southwest----------------------------------- 35 .2 38.7Great Lakes -------------------------------- 12 .4 12.6Middle W est_____________________ 23.2 22 .2Pacific -------------------------------------------------- 7. 4 17. 8
The $1.15 to $1.20 earnings interval was the only one in which there was a sizable concentration of workers in April 1962. A small number of workers earned less than $1.15 an hour;7 three percent received $3 or more. The middle half of the workers had hourly earnings within a range of $1.24 to $1.88. Men's earnings were more widely dispersed than women's earnings; the middle half of their earnings ranged from $1.34 to $2.26 and $1.20 to $1.63, respectively. The comparatively wide dispersion of earnings may be partially attributable to the wide geographical distribution of the industry, the variety of skill and training requirements of the occupations, and the widespread use of incentive wage payments.
5 See Wage Structure: Footwear Industry, April 1957 (BLS Report 133, 1958).6 For ease of reading in this and subsequent discussions of tables, the
limits of the class (earnings) intervals are designated as $1. 15 to $1.20 instead of using the more precise terminology of $1.15 and under $1.20.
7 Under specified conditions, workers certified as learners or handicapped workers may be paid less than the Federal legal minimum.
Digitized for FRASER http://fraser.stlouisfed.org/ Federal Reserve Bank of St. Louis

5
Among nine product groups for which separate data were tabulated, nationwide average hourly earnings ranged from $1.46 in plants primarily manufacturing women's cement-process (slip-lasted) shoes and in plants making m isses', children's, and infants' stitchdown shoes to $1.79 in misses' and children's Goodyear-welt shoe plants (tables 3 to 11). Workers in women's cement-process (conventional-lasted) shoe plants averaged $1.68 an hour compared with $1.71 in men's Goodyear-welt dress shoe plants.
Earnings relationships among the product groups differed by region. For example, in New England, workers in plants using the cement-process (conventional-lasted) method of producing women's shoes and those in plants manufacturing misses' and children's shoes by this method had approximately the same average hourly earnings ($1.77 and $1.78, respectively). In the Great Lakes region, average earnings for the former were 18 cents higher than the average for the latter branch of the industry ($1.64 and $1.46, respectively).
Production workers' earnings also differed by plant size. In the New England and Great Lakes regions, average hourly earnings were 7 cents higher in establishments employing 250 or more workers than in smaller establishments ($1.81 and $1.74 and $1.69 and $1.62, respectively); and in the Middle West, 2 cents more ($1.54 and $1.52). In the, Middle Atlantic region, however, the hourly average for the smaller establishment size group was 12 cents higher than the larger establishment size average ($1.65 and $1.53). Nationwide, the averages differed by 1 cent ($1.64 and $1.63), in favor of the larger plants.
Metropolitan area workers averaged 17 cents an hour more than those in nonmetropolitan areas. The difference amounted to 21 cents in New England, 20 cents in the Middle West, 18 cents in the Great Lakes, and 13 cents in the Middle Atlantic region. In the Border States, however, workers in nonmetropolitan areas averaged 5 cents an hour more than those in metropolitan areas.
In considering the wage differences noted in the preceding paragraphs and in the later discussion of occupational earnings, it must be emphasized that it is not possible to isolate and measure the impact on wage levels of any one of these factors. To illustrate their interrelationship, slightly more than half of the New England workers in establishments employing 250 or more workers were in nonmetropolitan areas compared with a third in the smaller establishments. Approximately three-fourths of the workers in both establishment-size groups in the Great Lakes region were in nonmetropolitan areas. Two-fifths of the workers in women's cement-process (conventional-lasted) shoe plants in New England were in metropolitan area establishments with 250 or more workers. The corresponding proportion in the Great Lakes region was one-eighth.
Occupational Earnings
Average hourly earnings of workers in selected occupations for the major branches of the industry are presented in tables 12 through 41. The jobs are grouped according to the general sequence of operations in the manufacture of shoes.
The first of these operations, cutting shoe uppers and linings, is performed by both hand and machine methods. Average earnings of machine cutters (vamp and whole shoe)— predominantly men— ranged from $1.79 in m isses', children's, and infants' stitchdown shoe plants and $1.83 in women's cement-process (slip-lasted) shoe plants to $2.54 in the misses'and children's Goodyear-welt branch of the industry.
Digitized for FRASER http://fraser.stlouisfed.org/ Federal Reserve Bank of St. Louis

6
The fitting operations, assembling and stitching the upper leather parts and the lining together to make a completed upper, were usually performed by women. Fancy stitchers, who sew decorative designs on shoe uppers, were numerically the most important occupation studied. Workers in this job had average hourly earnings ranging from $1.43 in the m isses', children's, and infants' stitchdown branch to $1.62 in the men's Goodyear-welt work shoe branch of the industry. Average earnings of pasters, backers, or fitters ranged from $ 1.27 to $ 1.45 an hour among the industry branches.
Lasting, one of the most important parts of the shoemaking process, includes the drawing of the upper and lining over the last and attaching the insole. Machine assemblers for pullover averaged from $1.46 to $2.18 an hour among the industry branches; averages for pullover-machine operators in most branches for which comparisons could be made were from 35 to 43 cents an hour higher. Average earnings of heel-seat lasters and side lasters, machine ranged from $1.60 to $2.01 and $1.57 to $2.43 an hour, respectively, among the industry branches.
The method of attaching the outsole to the shoe, in the bottoming department, differs by type of construction (e.g., Goodyear-welt or cement-process). In the men's Goodyear-welt dress and work shoe branches of the industry, Goodyear stitchers averaged $2.12 and $1.97 an hour, respectively. Sole attachers in plants manufacturing women's cement-process shoes averaged $2.10 an hour in the conventional-lasted branch compared with $1.62 for these workers in the slip-lasted branch.
Occupational earnings data were tabulated by size of establishment and size of community for the two largest branches of the industry: men's Goodyear-welt dress shoes and women's cement-process (conventional-lasted) shoes. In both of these branches, occupational earnings were almost always higher in metropolitan areas than in nonmetropolitan areas. (See tables 14 and 22.) In the men's Goodyear-welt dress shoe branch, occupational earnings were usually higher in plants with 250 or more employees than in the smaller plants; however, there was a lack of any consistent pattern of wages in the other branch. (See tables 13 and 21.) Tables 15 and 23 provide occupational earnings data in metropolitan and nonmetropolitan areas by establishment size.
Earnings of individuals performing similar tasks also varied within the same industry branch and labor market. This was particularly evident for jobs usually paid on an incentive basis. For example, hourly earnings of women fancy stitchers in plants making men's Goodyear-welt dress shoes in the Brockton, Mass., area ranged from less than $1.40 to more than $4.20 (table 16).
Establishment Practices and Supplementary Wage ProvisionsData were also obtained on certain establishment practices such as work
schedules, late-shift work and selected supplementary wage benefits including paid holidays and vacations, health, insurance, and pension plans, and nonproduction bonuses.
Scheduled Weekly Hours and Shift Practices. Work schedules of 40 hours a week were in effect in establishments with 92 percent of the production workers in April 1962 (table 42). The Southwest and Middle West were the only regions shown in which less than nine-tenths of the workers were scheduled to work 40-hour weeks. In the former region, almost one-fifth had weekly schedules of 45 hours; in the Middle West, about the same proportion had weekly schedules of 32 hours. Second-shift operations accounted for less than 2 percent of the workers (table 43); third-shift operations were almost nonexistent. Most second- shift workers were paid the same rates as day-shift workers.
Digitized for FRASER http://fraser.stlouisfed.org/ Federal Reserve Bank of St. Louis

7
Paid Holidays. Nine-tenths of the production workers were employed in establishments which provided paid holidays. Almost three-fourths of the workers received 6 or more days annually. Six days a year was the most common provision in all but two of the regions shown in table 44. In New England, three-fifths received at least 7 days and in the Pacific region, almost nine-tenths received 8 days. Holiday provisions differed among the areas for which data were tabulated separately for selected branches of the industry.8 For example, 7 days were provided in all women's cement-process (conventional-lasted) shoe plants in Auburn—Lewiston, Maine; and 6 days in this industry branch in St. Louis, Mo.—111. Workers in m isses', children's, and infants' stitchdown shoes in New York City received either 8 days or 8 days plus 1 half day. Holiday provisions for office workers were generally more liberal than those for production workers.
Paid Vacations. Paid vacations after qualifying periods of service were provided by nearly all establishments studied. Almost all production and office workers were in establishments granting at least 1 week after 1 year of service (table 45). After 5 years of service, nearly four-fifths of the production workers and a slightly larger proportion of the office workers were eligible for 2 weeks. Approximately a fourth of both plant and office workers were in establishments providing 3 weeks' vacation after 15 years of service. Among the four major regions, vacation provisions were generally similar for workers with less than 5 years' service. After longer periods of service, vacation provisions were usually more liberal in the Great Lakes and Middle West. Two-thirds or more of the production workers in these two regions were in establishments granting 3 weeks' vacation pay after 15 years of service; the proportions were about 5 percent in the New England and Middle Atlantic regions.
Although the most common vacation provisions among the areas for which data are available for selected branches of the industry were 1 week after 1 year and 2 weeks after 5 years of service, significant differences were recorded.For example, in the women's cement-process (conventional-lasted) branch, slightlymore than a third of the production workers in Maine, except Auburn—Lewiston, were in plants providing 2 weeks' vacation after 5 years' service, compared with all workers in the plants studied in Haverhill. Provisions for 3 weeks' vacation pay after 15 years' service were in effect in all plants studied in this branch ofthe industry in St. Louis and in plants with two-thirds of the workers in theremainder of Missouri. Such provisions were not common in other areas for which data were tabulated separately, except in men's Goodyear-welt dress shoe plants in Wisconsin.
Health, Insurance, and Pension Plans. Life, hospitalization, and surgical insurance, for which employers paid at least part of the cost were available to four-fifths of both production and office worker groups (table 46). Approximately two-thirds of the workers were in establishments providing sickness and accident insurance and three-fifths in establishments providing medical insurance. Regional variations differed by type of insurance. For example, the proportions of production workers eligible for life insurance ranged from 59 percent in the Southwest to 93 percent in the Middle West; for medical insurance, from 40 percent in the Middle Atlantic to 90 percent in the Middle West.
8 Separate area reports which include supplementary benefits data, as well as the wage information shown in tables 16, 17, 24—34, 39> and 41 are available upon request.
Digitized for FRASER http://fraser.stlouisfed.org/ Federal Reserve Bank of St. Louis

8
Retirement pension benefits (other than those available under Federal old-age, survivors', and disability insurance) were provided by establishments employing two-fifths of the production workers. These establishments accounted for three-fourths of the workers in the Great Lakes and Middle West and seven-tenths in the Pacific region.
Nonproduction Bonuses. Nearly one-fifth of the production workers and two-fifths of the office workers were in establishments which provided nonproduction bonuses, usually at Christmas or yearend. These provisions were more common in the Middle Atlantic and Southwest than in the other regions for which data are shown in table 47.
Digitized for FRASER http://fraser.stlouisfed.org/ Federal Reserve Bank of St. Louis

(Num ber and average straight-tim e hourly earnings 1 of production w orkers in footwear manufacturing establishm ents by selected ch aracteristics,United States and selected regions, A pril 1962)
Table 1. Average Hourly Earnings: By Selected Characteristics— Footwear Industry
Item
United States 2 New England Middle Atlantic Border States Southwest Great Lakes Middle W est Pacific
Numberof
w orkers
Averagehourly
earnings
Numberof
workers
Averagehourly
earnings
Numberof
workers
Averagehourly
earnings
Numberof
w orkers
Averagehourly
earnings
Numberof
wo rkers
Averagehourly
earnings
Numberof
w orkers
Averagehourly
earnings
Numberof
w orkers
Averagehourly
earnings
Numberof
workers
Averagehourly
earnings
A ll w orkers --------------------------------------------------- 182, 449 $ 1. 64 65, 688 $1 . 79 35, 958 $ 1. 57 7, 795 $ 1. 47 7, 509 $ 1 .41 28, 586 $ 1. 68 21, 361 $ 1. 53 1, 589 $ 1. 73Men ------------------------------------------------------------- 75, 303 1. 88 28, 691 2. 08 16, 081 1 .81 2, 727 1 .6 2 2, 475 1. 53 10 ,461 1 .9 5 8, 139 1 .71 673 1.99W om en ------------------------------------------------------- 10 7 ,14 6 1.47 36 ,997 1. 57 19 ,877 1. 38 5, 068 1. 39 5, 034 1. 34 18, 125 1. 52 13, 222 1. 43 916 1. 55
Predom inant type of s h o e :3M en 's G oodyear-w elt d ress
shoes ------------------------------------------------------- 3 6 ,0 3 7 1.71 13, 137 1. 87 - - - 10, 013 1. 77 _ _M en 's G oodyear-w elt work
shoes ------------------------------------------------------- 7, 046 1. 57 1, 924 1. 58 - - - - - - 1, 674 1. 75 - _ _ _M en 's c em e n t-p ro ce ss shoes ------------ 3, 269 1. 53 1, 626 1. 53 - - - - - - - - - - - _W om en's c em e n t-p ro ce ss
(conventional-lasted) shoes -------------- 78, 998 1 .6 8 36, 404 1. 77 13, 027 1 .6 6 2, 557 1. 52 2, 372 1. 39 10, 605 1. 64 10, 112 1. 56 1, 317 1. 79W om en's c em e n t-p ro ce ss
(slip -la sted ) shoes ___________________ 9, 407 1 .4 6 - 4, 674 1 .4 5 - - - - - - 823 1. 47 - -W om en's McKay (including
Littleway) shoes ---------------------------------- 6, 268 1. 59 3, 679 1. 72 - - - - - - - -M isse s ' and children 's cem e n t-
p ro ce ss (conventional-lasted)shoes ------------------------------------------------------- 1 0 ,7 4 4 1 .5 4 2, 087 1. 78 1, 865 1. 57 1, 155 1 .4 2 - 1, 209 1. 46 2, 765 1. 51 -
M is s e s ' and children 'sG oodyear-w elt shoes ________________ 8, 806 1 .7 9 - - 2, 807 1. 52 - - - 1, 158 1. 83 - - -
M is s e s ', ch ild ren 's, and infants'stitchdown shoes ______________________ 8, 535 1 .4 6 - 3, 231 1. 59 - - 1, 105 1. 41 - "
Size of establish m en t:50—249 w orkers -------------------------------------- 4 6 ,6 7 8 1. 63 16, 464 1. 74 13, 696 1 .6 5 2, 772 1. 38 1, 805 1. 37 6, 138 1. 62 2, 874 1. 52 1, 039 1. 76250 or m ore w orkers ---------------------------- 135, 771 1 .6 4 4 9 ,2 2 4 1. 81 22, 262 1. 53 5, 023 1. 52 5, 704 1. 42 22, 448 1 .6 9 18, 487 1. 54 - -
Size of com m unity:M etropolitan areas 4 ___________________ 80, 243 1. 74 34, 554 1. 89 28, 655 1. 60 3, 045 1. 44 637 1. 46 7, 512 1. 81 2, 420 1. 73 1, 589 1. 73Nonm etropolitan areas ------------------------- 102, 206 1. 57 31, 134 1. 68 7, 303 1. 47 4, 750 1. 49 6, 872 1 .4 0 21, 074 1. 63 18, 941 1. 53
1 Excludes prem ium pay for overtim e and for work on weekends, holidays, and late shifts.2 Includes data for regions in addition to those shown separately. A laska and Hawaii were not included in the study.3 Establishm ents w ere c lassified on the basis of the m ajor types of shoes produced during the preceding year. The a ll-w orker total above includes data for establishm ents producing
other types of shoes in addition to those shown separately.4 The term "m etropolitan a r e a " as used in this study refers to the Standard M etropolitan Statistical A reas established under the sponsorship of the U. S. Bureau of the Budget.
N O T E : D ashes indicate no data reported or data that do not meet publication c riteria .
VO
Digitized for FRASER http://fraser.stlouisfed.org/ Federal Reserve Bank of St. Louis

(P ercen t distribution of production workers by average stra ight-tim e hourly earnings, 1 United States and selected regions, A pril 1962)
Tabic 2. Earnings Distribution: Footwear Industry o
A verage hourly earnings 1United States 2
New England Middle Atlantic Border States Southwest Great Lakes Middle W est PacificTotal Men Women
Under $ 1 . 1 5 ______ 0. 3 0. 2 0. 4 0. 3 0. 6 0. 1 0. 5 (3) (3) 0. 9$ 1 .1 5 and unde r $ 1 .2 0 _____ ____________________ 20. 2 12. 4 25. 7 14. 9 24. 2 29. 5 35. 2 1 2 .4 23. 2 7. 4$ 1. 20 and under $ 1 .2 5 ____________________________ 5. 8 3. 7 7. 4 5. 2 6. 5 6. 7 8. 5 4. 6 6. 3 4. 2
$ 1 .2 5 and under $ 1. 30 7. 5 5. 6 8. 8 7. 6 8. 0 6. 5 8. 2 6. 6 7. 6 7. 4$ 1. 30 and under $ 1 .3 5 5. 5 3. 7 6. 8 4. 5 5. 7 6. 6 7. 1 5 .9 6. 3 9 .4$ 1 .3 5 and under $ 1 .4 0 _ ... 5. 0 3. 7 5. 8 4. 6 4. 2 4. 9 5. 2 5. 8 5. 8 4. 2$ 1 .4 0 and under $ 1 .4 5 4. 4 3. 5 5. 0 3. 7 4. 3 4. 6 3. 5 5. 3 4. 7 4. 1$ 1 .4 5 and under $ 1. 50 3. 9 2. 8 4. 7 3. 7 3. 6 4. 3 3. 8 4. 1 4. 8 2. 6
$ 1. 50 and under $ 1 .6 0 7. 5 6. 6 8. 1 6. 9 7. 0 7. 6 6. 2 9. 1 8. 3 9. 0$ 1. 60 and under $ 1 .7 0 6. 1 5. 7 6. 4 5. 4 6. 1 6 .9 5. 3 7. 7 6. 5 7. 4$ 1. 70 and under $ 1 .8 0 ____________________ _____ 5. 2 5. 4 5. 0 5. 1 4. 5 5. 7 5. 0 6. 1 5. 4 7. 6$ 1. 80 and under $ 1 .9 0 4. 4 5. 2 3. 8 4. 5 4. 2 4. 1 2. 6 5 .4 4. 4 5. 1$ 1. 90 and under $ 2. 00 3. 7 4. 6 3. 0 3. 8 3. 6 2. 8 2. 4 4. 8 3. 1 4. 3
$ 2. 00 and under $ 2 .1 0 3. 7 5. 4 2. 6 4. 4 3. 5 2. 7 1 .8 4. 6 3. 2 4. 0$ 2. 10 and under $ 2. 20 2. 8 4. 3 1 .7 3 .4 2. 7 1. 3 1. 0 3. 4 2. 3 3. 3$ 2. 20 and under $ 2. 30 ____________________________ 2. 3 3. 6 1. 3 2 .9 2. 1 1 .4 1. 1 2. 6 2. 0 3. 8$ 2. 30 and under $ 2. 40 __________._________________ 2. 0 3. 6 • 9 2. 6 1. 6 1. 4 . 8 2. 6 1. 6 2. 9$ 2. 40 and under $ 2 .5 0 ____________________________ 1 .7 3. 0 . 7 2. 5 1. 3 . 4 . 5 2. 0 . 9 1. 6
$ 2. 50 and under $ 2. 60 ____________________________ 1. 5 2 .9 . 5 2. 1 1 .4 . 8 . 5 1 .6 1. 0 2. 0$ 2. 60 and under $ 2. 70 ____________________________ 1. 2 2. 4 . 4 1. 8 . 9 . 6 . 2 1 .5 . 6 2. 3$ 2. 70 and under $ 2. 80 _______________________ __ . 9 1. 8 . 2 1. 5 . 6 . 4 . 2 . 9 . 4 1. 6$ 2. 80 and under $ 2. 90 ____________________________ . 8 1. 7 . 2 1. 3 . 7 . 3 . 1 . 8 . 4 1. 2$ 2. 90 and under $ 3. 00 ____________________________ . 6 1. 3 . 1 1. 1 . 5 . 1 . 1 . 4 . 3 1. 2
$ 3. 00 and over _____________________________________ 3. 1 6. 9 . 4 6. 4 2. 2 . 2 . 3 1 .9 . 8 2. 5
Total _____________ ____________________________ 100. 0 100. 0 100. 0 100. 0 100. 0 100. 0 100. 0 100. 0 100. 0 100. 0
Number of w orkers _________________________________ 1 8 2 ,4 4 9 75, 303 107 ,14 6 65, 688 35, 958 7, 795 7, 509 28, 586 2 1 ,361 1, 589A verage hourly earnings 1 __ ____________________ $ 1 .6 4 $ 1 .8 8 $ 1.47 $ 1 .7 9 $ 1. 57 $ 1 .47 $ 1. 41 $ 1. 68 $ 1. 53 $ 1 .7 3
1 Excludes prem ium pay for overtim e and for work on weekends, holidays, and late sh ifts.2 Includes data for regions in addition to those shown separately.3 L e ss than 0 .0 5 percent.
NOTE: Because of rounding, sums of individual items may not equal 100,
Digitized for FRASER http://fraser.stlouisfed.org/ Federal Reserve Bank of St. Louis

Table 3. Earnings Distribution: Men’s Goodyear-Welt Dress Shoes
(P ercent distribution of production w orkers by average straight-tim e hourly earnings, 1 United States and selected regions, April 1962)
A verage hourly earnings 1United States 2 New
EnglandGreatLakesTotal Men Women
Under $ 1 .1 5 ___ 0. 1 0. 1 0., 1 0. 2$ 1 .1 5 and under $ 1 .2 0 _____________ 15. 5 9. 9 20., 3 11. 6 6. 1$ 1 .2 0 and under $ 1. 25 _____________ 5. 0 2. 8 6.. 9 4. 8 4. 2
$ 1 .2 5 and under $ 1. 30 _____________ 6. 6 4. 9 8. 1 5. 7 6. 9$ 1 .3 0 and under $ 1. 35 _____________ 5. 4 3. 4 7. 1 3. 9 6. 6$ 1. 35 and under $ 1 .4 0 _____________ 5. 3 4. 5 6., 0 4. 9 5. 8$ 1 .4 0 and under $ 1 .4 5 _____________ 4. 6 3. 7 5., 3 3. 8 4. 8$ 1 .4 5 and under $ 1. 50 _____________ 3. 9 2. 6 4., 9 3. 0 4. 0
$ 1. 50 and under $ 1 .6 0 _____________ 7. 3 6. 4 8., 0 6. 2 8. 1$ 1 .6 0 and under $ 1 .7 0 _____________ 7. 4 6. 4 8., 3 6. 6 8. 5$ 1. 70 and under $ 1 .8 0 _____________ 6. 1 6. 5 5., 8 5. 9 6. 8$ 1 .8 0 and under $ 1 .9 0 ------------------- 4. 6 5. 3 4., 1 4. 3 5. 1$ 1. 90 and under $ 2. 00 _____________ 4. 4 5. 2 3., 7 4. 6 5. 8
$ 2 .0 0 and under $ 2. 10 _____________ 4. 5 5. 8 3., 3 5. 1 4 .9$ 2 .1 0 and under $ 2. 20 _____________ 2 .9 4. 3 1 ., 8 3. 4 3. 6$ 2. 20 and under $ 2. 30 _____________ 2. 4 3. 2 1., 8 2. 9 2. 9$ 2. 30 and under $ 2 .4 0 _____________ 2. 5 4. 2 1 .. 0 2. 9 3. 4$ 2. 40 and under $ 2. 50 ....................... 2. 1 3. 4 1., 0 3. 1 2. 5
$ 2. 50 and under $ 2. 60 _____________ 1. 5 2. 5 . 6 2. 3 1 .7$ 2. 60 and under $ 2. 70 _____________ 1. 5 2. 7 . 5 2. 2 1. 9$ 2. 70 and under $ 2 .8 0 _____________ 1 .0 1. 8 . 4 1. 8 1 .2$ 2. 80 and under $ 2 .9 0 ------------------- .9 1. 6 . 2 1. 4 1. 1$ 2 .9 0 and under $ 3 .0 0 _____________ . 7 1. 2 . 2 1. 4 . 4
$ 3. 00 and over 3. 9 7. 6 . 7 7. 7 3. 4
Total ------------------------------------------
Num ber of w orkers A verage hourly earnings 1
100. 0 100. 0 100,. 0 100. 0 100. 0
36, 037 $ 1 .7 1
16, 679 $ 1. 92
19, 358 $ 1. 52
13 ,137 $ 1 .87
10, 013 $ 1 .7 7
1 Excludes prem ium pay for overtim e and for work on weekends, holidays, and latesh ifts.
2 Includes data for regions in addition to those shown separately.
NOTE: Because of rounding, sums of individual items may not equal 100.
Table 4. Earnings Distribution: Men’s Goodyear-Welt W ork Shoes
(Percent distribution of production w orkers by average stra ight-tim e hourly earnings, 1 United States and selected regions, April 1962)
Average hourly earnings 1United States 2
NewEngland
GreatLakesTotal Men Women
Under $ 1 .1 5 _________________________ 0. 1 0. 2 0. 1 0. 5$ 1 .1 5 and under $ 1. 20 ____________ 22. 3 16. 1 28. 4 15. 1 5. 0$ 1. 20 and under $ 1. 25 ____________ 6 .4 5. 0 7. 7 9 .4 2. 5
$ 1. 25 and under $ 1. 30 ____________ 8. 9 7. 5 10. 4 13 .7 7. 1$ 1. 30 and under $ 1 .3 5 ____________ 5. 7 5. 1 6. 4 5 .4 7. 9$ 1. 35 and under $ 1 .4 0 ____________ 4 .9 3. 3 6. 5 4. 7 5. 8$ 1. 40 and under $ 1 .4 5 ___ 5. 4 5. 3 5. 6 2 .7 9. 0$ 1 .4 5 and under $ 1 .5 0 ____________ 3. 5 2. 8 4. 2 4. 3 3. 3
$ 1. 50 and under $ 1. 60 ____________ 7. 1 7. 3 6. 9 8. 9 8. 9$ 1. 60 and under $ 1 .7 0 ____________ 5. 8 5. 4 6. 2 4. 2 7. 0$ 1. 70 and under $ 1 .8 0 ____________ 5. 0 5. 3 4. 7 6 .0 5 .9$ 1. 80 and under $ 1 .9 0 ____________ 4. 2 5. 0 3. 5 4. 8 5. 9$ 1 .9 0 and under $ 2. 00 ____________ 3. 8 4. 8 2. 7 3. 0 5. 9
$ 2. 00 and under $ 2. 10 ____________ 3. 6 4. 7 2. 5 4. 0 4. 1$ 2. 10 and under $ 2. 20 ____________ 2. 8 4. 5 1. o 2. 3 3. 7$ 2 . 20 and under $ 2 . 30 ____________ 2. 0 2. 8 1. 2 2. 0 3. 0$ 2. 30 and under $ 2 .4 0 __________ 1 .8 2. 9 . 8 2. 1 2. 2$ 2. 40 and under $ 2 .5 0 ____________ 1 .4 2. 6 . 2 1. 1 2. 6
$ 2. 50 and under $ 2. 60 ____________ 1 .4 2. 5 . 3 1. 1 2. 6$ 2. 60 and under $ 2. 70 ____________ . 6 . 9 . 3 . 6 1. 3$ 2. 70 and under $ 2. 80 ____________ . 6 1. 2 . 1 . 6 1. 3$ 2. 80 and under $ 2. 90 ____________ . 6 1. 1 . 1 . 6 1. 2$ 2. 90 and under $ 3. 00 _______ ______ . 6 1. 1 - . 7 1. 0
$ 3 .0 0 and over ______________________ 1 .4 2. 5 . 2 2. 2 2. 9
Total ___________________________ 100. 0 100. 0 100. 0 100. 0 100. 0
Number of w orkers _________________ 7, 046 3, 514 3, 532 1, 924 1, 674A verage hourly earnings 1 _________ $ 1. 57 $ 1 .7 1 $ 1 .4 3 $ 1. 58 $ 1 .7 5
1 Excludes prem ium pay for overtim e and for work on weekends, holidays, and lateshifts.
2 Includes data for regions in addition to those shown separately.
NOTE: Because of rounding, sums of individual items may not equal 100.
Digitized for FRASER http://fraser.stlouisfed.org/ Federal Reserve Bank of St. Louis

Table 5. Earnings Distribution: Men’s Cement-Process Shoes
(Percent distribution of production w orkers by average stra ight-tim e hourly earnings, United States and New England, A p ril 1962)
A verage hourly earnings 1United States 2
New EnglandTotal Men Women
Under $ 1.15 ________________________________________ 0.1 0.2 0.1 0.2$ 1 .1 5 and under $ 1 .2 0 ------------------------------------------ 23.6 13.4 30.2 29.7$ 1.20 and under $ 1.25 ___________________________ 4.9 4 .7 5.0 4 .8
$ 1.25 and under $ 1.30 ------------------------------------------ 8.5 11.2 6.7 7.7$ 1.30 and under $ 1.35 ------------------------------------------ 5.3 4 .8 5.6 5.4$ 1.35 and under $ 1.40 ------------------------------------------ 7.2 6 .3 7.7 4.8$ 1.40 and under $ 1.45 ___________________________ 4.0 3.6 4 .3 4 .4$ 1.45 and under $ 1.50 ------------------------------------------ 4 .3 3.6 4.8 3.0
$ 1.50 and under $ 1.60 ------------------------------------------ 7.8 7 .8 7.7 7.0$ 1.60 and under $ 1.70 ------------------------------------------ 7.6 7.4 7.8 5.4$ 1.70 and under $ 1.80 ------------------------------------------ 6.5 6.7 6 .4 5.4$ 1.80 and under $ 1.90 ------------------------------------------ 3.7 4 .2 3.4 4 .4$ 1.90 and under $ 2 .0 0 ------------------------------------------ 3.4 4.7 2.5 3.1
$ 2 .0 0 and under $ 2 .1 0 ------------------------------------------ 2.3 2.4 2.3 2 .4$ 2 .1 0 and under $ 2 .2 0 ___________________________ 2.9 4 .6 1.8 3.7$ 2 .2 0 and under $ 2 .3 0 ------------------------------------------ 2.1 2 .4 1.9 2.0$ 2 .3 0 and under $ 2 .4 0 ------------------------------------------ 1.9 4 .3 .3 2.0$ 2 .4 0 and under $ 2 .5 0 ___________________________ .7 1.2 .3 .6
$ 2 .5 0 and under $ 2 .6 0 ___________________________ .9 1.4 .5 .9$ 2 .6 0 and under $ 2 .7 0 ___________________________ .7 1.4 .3 .7$ 2 .7 0 and under $ 2 .80 ___________________________ .3 .5 .2 .6$ 2 .8 0 and under $ 2 .9 0 ___________________________ .3 .5 .2 .4$ 2 .90 and under $ 3 .0 0 ------------------------------------------ .3 .5 .2 .6
$ 3.00 and over _____________________________________ .9 2.0 .1 .9
Total __________________________________________ 100.0 100.0 100.0 100.0
Num ber of w orkers _______________________________ 3, 269 1, 290 1 ,9 79 1, 626Average hourly earnings 1 ___ __________________ $ 1 .5 3 $ 1.65 $ 1.45 $ 1.53
1 Excludes prem ium pay for overtim e and for work on weekends, holidays, and late shifts.2 Includes data for regions in addition to New England.
NOTE: Because of rounding, sums of individual items may not equal 100,
Digitized for FRASER http://fraser.stlouisfed.org/ Federal Reserve Bank of St. Louis

(P ercen t distribution of production workers by average stra ight-tim e hourly earnings,1 United States and selected regions, A pril 1962)
Table 6. Earnings Distribution: W om en’s Cement-Process (Conventional-Lasted) Shoes
Average hourly earnings 1United States2
New England Middle Atlantic Border States Southwest Great Lakes Middle W est PacificTotal Men Women
Under $ 1 .1 5 _________ _____________ ________________ 0. 3 0. 2 0. 3 0. 3 0. 7 0. 4 0. 4 0. 1 0. 9$ 1 .1 5 and under $ 1. 20 ___________________________ 18. 2 10 .6 23. 0 15. 1 21. 8 24. 0 41. 8 14. 6 22. 5 6. 5$ 1. 20 and under $ 1. 25 ___________________________ 5. 5 3. 3 6. 8 5. 2 5. 9 5 .9 4. 6 5. 2 6. 5 3. 2
$ 1. 25 and under $ 1. 30 ___ _____________ ______ 7. 3 4 .9 8. 8 7 .9 7. 1 6. 8 8. 4 5. 5 7. 2 4. 7$ 1. 30 and under $ 1. 35 _______________ ___________ 5. 5 3. 3 6. 8 4. 6 5. 4 7. 6 10. 2 5. 2 6. 2 9. 3$ 1. 35 and under $ 1. 40 ___________________________ 5. 1 3. 2 6. 3 4. 8 4. 4 6. 3 4. 3 5. 8 5. 4 3. 9$ 1. 40 and under $ 1. 45 ___________________________ 4. 3 2 .9 5. 2 3 .9 4. 0 4. 7 3. 1 5. 5 4. 4 3. 9$ 1. 45 and under $ 1. 50 ___________________________ 4. 1 2. 5 5. 2 4. 0 3. 9 4 .9 3. 1 4 .4 4. 3 2. 5
$ 1. 50 and under $ 1. 60 ___________________________ 7 .6 5 .9 8. 7 7. 1 6. 8 7. 2 4. 5 9. 8 8. 5 9. 0$ 1. 60 and under $ 1. 70 ___ _____________________ 5. 7 4 .6 6. 4 5. 2 5. 4 5. 9 4. 3 6 .9 6. 6 7. 4$ 1. 70 and under $ 1. 80 __________________ ________ 5. 1 4. 8 5. 3 4 .9 4. 1 5. 6 4. 4 5. 9 5. 5 8. 1$ 1. 80 and under $ 1. 90 ___________________________ 4. 5 4 .9 4. 2 4. 3 4. 5 4. 9 1. 8 6. 0 4. 4 5. 7$ 1. 90 and under $ 2. 00 _____ _________ ______ 3. 5 4. 5 2. 9 3 .6 3. 6 2 .9 2. 7 4. 1 2. 8 4. 0
$ 2 .0 0 and under $ 2 . 10 .................................................. 4. 0 6. 0 2. 7 4. 1 3. 8 3. 8 1. 4 5. 1 3. 5 4. 6$ 2. 10 and under $ 2. 20 ___________________________ 2 .9 4. 6 1. 9 3. 2 2. 9 1 .6 . 5 3. 4 2. 5 4. 0$ 2 . 20 and under $ 2 . 30 ___________________________ 2. 6 4. 3 1. 5 3 .0 2. 4 1. 4 1. 1 2. 6 2. 3 4. 4$ 2. 30 and under $ 2. 40 ---------------------------------- ---- 2. 2 4. 1 1. 1 2. 7 1. 7 1. 8 1 .0 2. 6 1. 6 3. 5$ 2. 40 and under $ 2. 50 ___________________________ 1. 7 3. 2 . 8 2. 3 1. 4 . 5 . 4 1 .6 .9 1. 6
$ 2. 50 and under $ 2. 60 ___ _____________________ 1. 8 3. 7 . 6 2. 3 1. 8 1. 5 . 5 1. 6 1. 2 2. 4$ 2. 60 and under $ 2. 70 ___________________________ 1 .4 2. 8 . 5 1. 8 1. 2 . 7 . 4 1 .4 . 8 2. 7$ 2. 70 and under $ 2. 80 ___________________________ 1. 0 2. 3 . 2 1. 5 . 7 . 7 . 1 . 8 . 5 2. 0$ 2. 80 and under $ 2. 90 ___________________________ 1 .0 2. 4 . 2 1 .4 1. 1 . 6 . 3 . 6 . 7 1 .4$ 2. 90 and under $ 3. 00 ----------------------------------------- . 8 1. 8 . 1 1. 1 . 9 . 1 . 4 . 4 1. 4
$ 3 .0 0 and over _____________________________________ 3. 8 9. 1 . 5 5 .9 4. 5 . 4 . 7 . 7 1. 3 2. 7
Total ---------------------------------------------------------------- 100. 0 100. 0 100. 0 100. 0 100. 0 100. 0 100. 0 100. 0 100. 0 100. 0
Num ber of w orkers ________________________________ 78, 998 3 0 ,6 9 3 48, 305 36, 404 13, 027 2, 557 2, 372 10, 605 10, 112 1, 317A verage hourly earnings 1 ----------------------------------- $ 1 .6 8 $ 1 .9 8 $ 1 .4 9 $ 1. 77 $ 1. 66 $ 1. 52 $ 1. 39 $ 1. 64 $ 1. 56 $ 1 .7 9
1 Excludes prem ium pay for overtim e and for work on weekends, holidays, and late shifts.2 Includes data for regions in addition to those shown separately.
NOTE: Because of rounding, sums of individual items may not equal 100,
Digitized for FRASER http://fraser.stlouisfed.org/ Federal Reserve Bank of St. Louis

(Percent distribution of production w orkers by average straight-tim e hourly e a rn in g s ,1 United States and selected regions, A pril 1962)
Table 7. Earnings Distribution: W om en ’s Cement-Process (Slip-Lasted) Shoes
United States 2Middle MiddleAverage hourly earnings 1
Total Men Women Atlantic W est
Under $ 1 .1 5 __________________________ 0.7 0.8 0.6 1.2$ 1 .1 5 and under $ 1.20 _____________ 27.9 20 .9 32.1 27 .3 31.0$ 1.20 and under $ 1.25 ______________ 8.3 5.8 9.8 9.2 11.7
$ 1.25 and under $ 1.30 .... 8.1 7.8 8.4 8.3 5.5$ 1.30 and under $ 1.35 7.0 5.4 8.0 6.7 5.3$ 1.35 and under $ 1.40 _ 4 .6 4 .9 4.5 3.8 3.8$ 1.40 and under $ 1.45 .. 4 .4 5.1 4.0 5.0 2.1$ 1 .4 5 and under $ 1 .5 0 ... 4.0 4.1 4.0 3.6 3.2
$ 1.50 and under $ 1.60 _____________ 7.9 8.5 7.5 8.8 7.0$ 1.60 and under $ 1.70 _____________ 6.5 8.7 5.1 6.3 7.2$ 1.70 and under $ 1.80 _____________ 4 .5 5 .3 4.1 5.1 5.0$ 1.80 and under $ 1.00 .. .. 3.7 5.2 2.8 3.4 6 .0$ 1.90 and under $ 2 .0 0 ........ 2 .8 3.1 2.6 2.8 2.3
$ 2 .0 0 and under $ 2 .1 0 2.2 2.9 1.8 2.3 3.2$ 2 .1 0 and under $ 2 .2 0 _____________ 2.0 2.9 1.4 1.7 2.4$ 2 .2 0 and under $ 2 .3 0 _____________ .9 1.2 .8 1.0 .9$ 2 .3 0 and under $ 2 .4 0 _____________ .7 1.0 .5 .9 .4$ 2 .4 0 and under $ 2 .5 0 _____________ .9 1.2 .7 .8 -
$ 2 .5 0 and under $ 2 .6 0 _____________ .7 1.5 .2 .5 .7$ 2 .6 0 and under $ 2 .7 0 _____________ .6 1.3 .2 .2 .4$ 2 .7 0 and under $ 2 .8 0 _____________ .5 .9 .2 .1 .5$ 2 .8 0 and under $ 2 .9 0 _____________ .2 .3 .2 . 1 -$ 2 .9 0 and under $ 3 .0 0 _____________ .2 .2 .2 .1 .5
$ 3.00 and over _______________________ .6 1.1 .3 .5 1.1
Total ___________ _______ ________ 100.0 100.0 100.0 100.0 100.0
Number of w orkers _________________ 9, 407 3, 509 5, 898 4, 674 823A verage hourly earnings 1 _________ $ 1.46 $ 1.55 $ 1.41 $ 1.45 $ 1.47
1 Excludes prem ium pay for overtim e and for work on weekends, holidays, and late shifts.
2 Includes data for regions in addition to those shown separately.
NOTE: Because of rounding, sums of individual items may not equal 100.
Table 8. Earnings Distribution: W om en’s McKay (Including Littleway) Shoes
(Percent distribution of production w orkers by average stra ight-tim e hourly earnings, 1 United States and New England, A pril 1962)
Average hourly earnings 1United States 2 New
EnglandTotal Men Women
Under $ 1.15 _________________________________ 0.5 0.6 0.5 0 .4$ 1 .1 5 and under $ 1.20 _____________________ 25 .6 14.7 32.5 19.8$ 1.20 and under $ 1.25 _____________________ 5.4 3.9 6.3 3.5
$ 1.25 and under $ 1.30 _____________________ 7.8 5.5 9 .3 8.0$ 1 .3 0 and under $ 1 .3 5 _____________________ 4.6 2.7 5.8 3.4$ 1.35 and under $ 1.40 _____________________ 4.7 3.9 5.2 3.8$ 1.40 and under $ 1.45 _____________________ 3.8 3.2 4.2 3.3$ 1.45 and under $ 1.50 _____________________ 3.3 1.9 4.2 3.2
$ 1.50 and under $ 1.60 _____________________ 7.2 7.0 7 .4 6.5$ 1.60 and under $ 1.70 _____________________ 5.6 6.1 5.2 5.2$ 1.70 and under $ 1.80 _____________________ 4.5 4.9 4.2 4.8$ 1.80 and under $ 1.90 _____________________ 4.9 6.6 3.8 6.2$ 1.90 and under $ 2 .0 0 _____________________ 3.8 4 .4 3.4 4.4
$ 2 .0 0 and under $ 2 .1 0 _____________________ 3.8 5.9 2.4 5.0$ 2 .1 0 and under $ 2 .2 0 _____________________ 3.4 5.4 2.1 4.7$ 2 .2 0 and under $ 2 .3 0 _____________________ 2.4 4 .3 1.1 3.3$ 2 .3 0 and under $ 2 .4 0 _____________________ 1.4 3.0 .4 2.4$ 2 .4 0 and under $ 2 .5 0 _____________________ 1.5 2.6 .7 2.2
$ 2 .5 0 and under $ 2 .6 0 _____________________ 1.0 2.0 .3 1.5$ 2 .6 0 and under $ 2 .7 0 _____________________ .7 1.4 .2 1.1$ 2 .7 0 and under $ 2 .8 0 _____________________ 1.3 2.6 .4 2.1$ 2 .8 0 and under $ 2 .9 0 _____________________ .1 .3 - .2$ 2 .9 0 and under $ 3 .0 0 _____________________ .6 1.3 .1 1.0
$ 3.00 and over ______________________________ 2.4 5.7 .3 4.1
Total ___________________________________ 100.0 100.0 100.0 100.0
Number of w orkers _________________________ 6, 268 2, 440 3, 828 3, 679Average hourly earnings 1 ________________ $ 1 .5 9 $ 1.82 $ 1.44 $ 1.72
1 Excludes prem ium pay for overtim e and for work on weekends, holidays, and late shifts.
2 Includes data for regions in addition to New England.
NOTE: Because of rounding, sums of individual items may not equal 100.
Digitized for FRASER http://fraser.stlouisfed.org/ Federal Reserve Bank of St. Louis

Table 9. Earnings Distribution: Misses’ and Children’s Cement-Process (Conventional-Lasted) Shoes
(Percent distribution of production w orkers by average stra ight-tim e hourly earnings, United States and selected regions, A pril 1962)
A verage hourly earnings 1United States '2 New Middle Border Great Middle
Total Men Women England Atlantic States Lakes W est
Under $ 1 .1 5 ..____ .. . . . . . 0.2 0 .2 0.4 0.6 0.6 0.1 0.1$ 1.15 and under $ 1.20 24.8 18.3 28.6 9.9 20.2 36.1 29.0 24.4$ 1.20 and under $ 1.25 8.1 4 .7 10.1 11.1 6.8 7.7 5.2 4 .7
$ 1.25 and under $ 1.30 7.5 6 .2 8.4 6.7 10.7 4 .2 9.7 7.5$ 1.30 and under $ 1.3 5 ____________________ 5.3 4.1 6.1 3.1 5.1 6.3 5.5 6.5$ 1.35 and under $ 1.40 ... .... 5.0 4.1 5.5 3.0 3.9 5.3 6.7 6.6$ 1.40 and under $ 1.45 ____________________ 4.3 3.3 4.9 3.1 3.3 6.8 3.5 5.0$ 1.45 and under $ 1.50 ____________________ 3.7 3.3 4.0 4 .0 3.9 2.9 2.2 4 .8
$ 1.50 and under $ 1.60 ___ 7.9 7.4 8.3 6 .2 9 .0 5.2 10.9 10.2$ 1.60 and under $ 1.70 _____ 5.8 6.3 5.6 6.3 6.7 6.5 5.7 5.3$ 1.70 and under $ 1.80 ____________________ 4.8 5.2 4.6 4 .4 4 .5 6.2 4.7 5.9$ 1.80 and under $ 1.90 ____________________ 4.3 5.5 3.6 6.3 2.8 2.2 6.0 5.1$ 1.90 and under $ 2.00 ____ 3.6 4 .8 2.8 5.1 4.9 2.8 2.2 3.3
$ 2 .00 and under $ 2.10 3.3 4 .9 2.4 5.6 4 .0 3.5 3.0 2.7$ 2 .10 and under $ 2.20 ____________________ 2.1 3.3 1.4 3.5 2.6 1.4 1.5 1.7$ 2 .20 and under $ 2.30 ____________________ 1.5 2.6 .8 2.3 2.4 1.8 1.7 .8$ 2 .3 0 and under $ 2.40 _ . .. .. 1.3 2.4 .7 3.0 1.9 . 1 .5 1.2$ 2 .40 and under $ 2.50 ... ___ ___ 1.2 2.3 .6 2.6 1.3 - 1.5 .9
$ 2 .5 0 and under $ 2 .6 0 1.3 2.5 .5 2.7 1.1 .1 .2 1.7$ 2 .60 and under $ 2.70 ____________________ 1.0 2.4 .2 2.3 .9 .5 .2 .9$ 2 .70 and under $ 2.80 ____________________ .6 1.4 .1 1.1 1.0 .3 .4$ 2 .80 and under $ 2.90 ____________________ .6 1.5 .1 2.0 1.1 . 1$ 2 .90 and under $ 3.00 ____________________ .4 .9 .1 1.0 .6 .3 - .2
$ 3 .0 0 and over 1.0 2.4 .2 4.3 .8 . 1
Total 100.0 100.0 100.0 100.0 100.0 100.0 100.0 100.0
Num ber of w orkers ... ......... . 1 0 ,744 4 , 011 6, 733 2, 087 1, 865 1, 155 1, 209 2, 765A verage hourly ea rn in g s1 ... . _ . ... $ 1.54 $ 1.72 $ 1.43 $ 1.78 $ 1.57 $ 1.42 $ 1.46 $ 1 .5 1
* Excludes premium pay for overtim e and for work on weekends, holidays, and late shifts. Includes data for regions in addition to those shown separately.
NOTE; Because of rounding, sums of individual items may not equal 100.
Digitized for FRASER http://fraser.stlouisfed.org/ Federal Reserve Bank of St. Louis

Table 10. Earnings Distribution: Misses’ and Children’s Goodyear-Welt Shoes
(P e r t ent d i s t r ib u t i o n o f p r o d u c t i o n w o r k e r s b y a v e r a g e s t r a i g h t - t im e ho u r ly e a r n i n g s , 1 United Sta te s and s e l e c t e d r e g i o n s , A p r i l 1962)
A v e r a g e h o u r ly e a rn in g s 1United Sta te s 2 Middle
At lant icG re a tLak esT o t a l M e n W o m e n
Under $ 1.15 __________________________ ( 3 ) 0.1$ 1 . 1 5 and under $ 1.20 ______________ 16.8 9.4 22.9 23.9 3.8$ 1 . 2 0 and under $ 1 . 2 5 ....... .......... 4.5 2.3 6.3 5.2 4.6
$ 1.25 and und e r $ 1.30 _____________ 6.7 4.5 8.5 9.5 7.1$ 1.30 and under $ 1.35 ______________ 4.5 2.9 5.8 4.5 4.8$ 1 . 3 5 and und e r $ 1.40 ______________ 4.1 2.7 5.2 4.7 4 .4$ 1.40 and under $ 1.45 ______________ 4.2 2.3 5.7 5.6 3.5$ 1.45 and und e r $ 1.50 _____________ 4.0 3.5 4.3 4.0 4.0
$ 1.50 and und e r $ 1.60 7. 1 5.5 8.3 8.3 8. 1$ 1 . 6 0 and under $ 1 . 7 0 ... _ .. 6.8 7.3 6.4 6.4 8.6$ 1.70 and und e r $ 1.80 ______________ 5.7 6.4 5.1 5.9 6.0$ 1.80 and und e r $ 1.90 5.4 6.9 4.1 6.4 6.0$ 1 . 9 0 and und e r $ 2 . 0 0 _____________ 4. 1 4.7 3.6 3.7 7.3
$ 2 . 0 0 and und e r $ 2 . 1 0 ______________ 3.6 4.7 2.6 3.3 6.0$ 2 . 1 0 and und e r $ 2 . 2 0 ______________ 3. 1 4.8 1.7 2.2 4.3$ 2 . 2 0 and und e r $ 2 . 3 0 ______________ 2.7 3.9 1.7 1.3 2.0$ 2 . 3 0 and und e r $ 2 . 4 0 _____________ 2.2 3.5 1.1 1.6 2.2$ 2 . 4 0 and un d e r $ 2 . 5 0 ______________ 2. 1 3.4 .9 1.1 3.4
$ 2 . 5 0 and und e r $ 2 . 6 0 _____________ 1.8 3.0 .8 .6 4.6$ 2 . 6 0 and und e r $ 2 . 7 0 ______________ 1.5 2.4 .5 2.8$ 2 . 7 0 and und er $ 2 . 8 0 ______________ .7 .9 .4 .3 1.3$ 2 . 8 0 and under $ 2 . 9 0 --------------------- 1.0 1.4 .7 .4 1.6$ 2 . 9 0 and und er $ 3 . 0 0 --------- ----------- .8 1.2 .4 .2 .6
$ 3 . 0 0 and o v e r _____ — -------------- ------- 6.9 11.8 2.9 .5 3. 1
T o t a l ____________________________ 100.0 100.0 100.0 100.0 100.0
N u m b e r o f w o r k e r s -------------------------- 8, 806 4, 002 4, 804 2, 807 1, 158A v e r a g e h o u r lv e a rn in g s 1 --------- . $ 1.79 $ 2 . 0 3 $ 1.60 $ 1.52 $ 1.83
1 E x c l u d e s p r e m i u m pay f o r o v e r t i m e and f o r w o r k on w e e ke n d s , h o l ida y s , and late sh i ft s .
2 In c lu de s da ta f o r r e g i o n s in a dd i t io n to th o se shown se p ar ate ly .3 L e s s than 0 .05 p e r c e n t .
NOTE: Because of rounding, sums of individual items may not equal 100.
Table 11. Earnings Distribution: Misses’, Children’s, and Infants’ Stitchdown Shoes
( P e r c e n t d i s t r ib u t io n o f p r o d u c t io n w o r k e r s by a v e r a g e s t r a i g h t - t im e h o u r ly e a rn in g s , 1 United Sta tes and s e l e c t e d r e g i o n s , A p r i l 1962)
Average hourly earnings 1Unites States 2
MiddleAtlantic
GreatLakesTotal Men Women
Under $ 1.15 ________________ _________ (3 ) 0.1$ 1 .1 5 and under $ 1 .2 0 _____________ 35. 1 21.9 43 .3 23.2 37.5$ 1.20 and under $ 1.25 _____________ 6.4 5.1 7.3 7.7 4.3
$ 1.25 and under $ 1.30 _____________ 8.9 7.3 9.8 9.5 7. 1$ 1.30 and under $ 1.35 _____________ 6.8 4.5 8.3 8.6 5.7$ 1.35 and under $ 1.40 _____________ 4.1 3.3 4.7 4.5 5.2$ 1.40 and under $ 1.45 _____________ 3.9 4 .4 3.7 2.5 6.4$ 1.45 and under $ 1.50 _____________ 3.4 3.2 3.5 2.8 3.3
$ 1.50 and under $ 1.60 _____________ 6.7 7.9 5.9 6.6 6.4$ 1.60 and under $ 1.70 _____________ 4.4 5.5 3.8 4.5 5.5$ 1.70 and under $ 1.80 _____________ 3.2 4.2 2.5 3.5 3.0$ 1.80 and under $ 1.90 _____________ 3.3 4.8 2.3 3.3 5.2$ 1.90 and under $ 2 .0 0 _____________ 2.8 4.4 1.8 3.3 3.2
$ 2 .0 0 and under $ 2 .1 0 _____________ 2.4 3.9 1.4 3.0 3.0$ 2 .1 0 and under $ 2 .2 0 _____________ 1.3 2.5 .6 2.3 1.7$ 2 .2 0 and under $ 2 .3 0 _____________ 1.3 2.9 .3 2.9 .5$ 2 .3 0 and under $ 2 .4 0 ______ ____ .9 2.1 .2 1.6 .7$ 2 .4 0 and under $ 2 .5 0 _____________ 1.0 2.4 .1 2.0
$ 2 .5 0 and under $ 2 .6 0 _____________ 1.1 2.6 .2 2.3 .5$ 2 .6 0 and under $ 2 .7 0 _____________ .7 1.8 - 1.1 . 1$ 2 .7 0 and under $ 2 .8 0 __________ .4 1.0 (3 ) .9 -$ 2 .8 0 and under $ 2 .9 0 .............. . .5 1.2 .8 .1$ 2 .9 0 and under $ 3 .0 0 _____________ .2 .6 - .5 *
$ 3 .0 0 and over ____ ____ _______ ______ 1.1 2.6 .2 2.5 .5
Total ___________________________ 100.0 100.0 100.0 100.0 100.0
Number of w orkers ____ _____________ 8, 535 3, 283 5, 252 3, 231 1, 105Average hourly ea rn in g s1 _________ $ 1.46 $ 1.67 $ 1.32 $ 1.59 $ 1.41
1 E x c l u d e s p r e m i u m pay f o r o v e r t i m e and f o r w o r k on w e e k e n d s , h o l id a y s , and late sh if ts.
2 I nc lude s data f o r r e g i o n s in addi t io n to t h o se shown s e p a r a t e ly .3 L e s s than 0.05 p e r c e n t .
NOTE: Because of rounding, sums of individual items may not equal 100.
Digitized for FRASER http://fraser.stlouisfed.org/ Federal Reserve Bank of St. Louis

Table 12. Occupational Earnings: Men’s Goodyear-Welt Dress Shoes, All Establishments
(Number and average straight-tim e hourly earnings 1 of w orkers in selected occupations, United States and selected regions, A pril 1962)
United States 2 New England Great Lakes
Departm ent, occupation, and sex Numberof
wo rkers
Averagehourly
earnings
Numberof
workers
Averagehourly
earnings
Numberof
w orkers
A veragehourly
earnings
Cutting:$ 1. 87 $ 2. 18 $ 1. 88C utters, cloth lining, machine -------------------- 157 61 40
Men ----------------------------------------------------------------- 126 1. 94 57 2. 24 24 2. 02W om en ------------------------------------------------------------ 31 1. 55 - - 16 1. 66
Cutters, leather lining, machine __________ 410 1. 82 120 2. 17 124 1. 85Men ----------------------------------------------------------------- 217 1. 96 95 2. 19 38 2. 05W om en _______________________________________ 193 1. 66 25 2. 12 86 1. 75
Cutters, vamp and whole shoe, hand(57 m en, 3 women) __________________________ 60 2. 46 10 2. 70 - -
Cutters, vamp and whole shoe,m achine --------------------------------------------- ------------- 1, 405 2. 37 495 2. 87 400 2. 29
Men ----------------------------------------------------------------- 1, 126 2. 51 490 2. 87 251 2. 49Women _______________________________________ 279 1. 80 - - 149 1. 96
F ittin g :Fancy stitchers (1, 195 women,
5 men) -------------------------------------------------------------- 1, 200 1. 56 282 1. 85 248 1. 68P asters , backers, or fitters, upper,
hand (517 women, 14 men) -------------------------- 531 1. 37 156 1. 39 202 1. 39Top stitchers (871 women, 7 men) ------------- 878 1. 64 287 1. 87 246 1. 77V am pers ------------------------------------------------------------- 1 ,0 13 1. 73 318 2. 06 250 1. 84
Men ----------------------------------------------------------------- 93 2. 26 71 2. 34 - -W omen .................. ...................................................... 920 1. 68 247 1. 97 237 1. 83
L astin g :A sse m b le rs for pullover, machine ------------- 359 1. 98 126 2. 56 91 1. 75
Men ----------------------------------------------------------------- 305 2. 08 116 2. 63 67 1. 83W omen ------------------------------------------------------------ 54 1. 46 10 1. 71 24 1. 54
B ed-m ach ine operators (all m e n )___________ 102 2. 27 35 2. 22 - -H e e l-se a t la sters (149 men,
5 women) ---------------------------------------------------------- 154 1. 95 43 2. 40 48 1.91P ullover-m achin e operators
(442 m en, 1 woman) -------------------------------------- 443 2. 36 144 2. 91 127 2. 52Side la ste rs , machine (a ll men ) _____________ 434 2. 11 142 2. 47 121 2. 19Toe la ste rs , automatic or sem iautomatic
(397 m en, 1 woman) ------------------------------------- 398 2. 16 129 2. 53 121 2. 33Bottoming and m aking:
Bottom fille rs _________________________________ 147 1. 63 51 1. 81 38 1. 67Men ----------------------------------------------------------------- 85 1. 69 36 1. 90 16 1. 61W omen ------------------------------------------------------------ 62 1. 55 15 1. 59 22 1. 71
Edge trim m ers (540 men,1 woman) ______________________________________ 541 2. 55 186 3. 23 147 2. 50
Goodyear stitchers (588 men,16 women) ----------------------------------------------- ------- 604 2. 12 172 2. 52 193 2. 15
Heel attachers, machine (258 men,8 women) ______________________________________ 266 2. 10 87 2. 43 76 2. 24
In seam ers (324 men, 7 women) ____________ 331 2. 40 120 2. 85 91 2. 53Jointers, machine -------------------------------------------- 62 1. 97 38 2. 09 12 2. 13
Men ----------------------------------------------------------------- 51 2. 09 38 2. 09 - -W omen ----------------------- ------------------------------------ 11 1. 41 - - - -
Rough rounders (274 men,3 women) ---------------------------------------------------------- 277 2. 24 83 2. 77 80 2. 34
Shank tackers ---------------------------------------------------- 47 1. 59 17 2. 01 - -Men ----------------------------------------------------------------------------------- 25 1 . 66 15 1. 99 - -W omen ---------------------------------------------------------------------------- 22 1. 52 - - - -
Sole le v e le rs , machine(100 m en, 5 women) _________________________ 105 1. 65 41 1. 70 28 1 . 89
See footnotes at end of table. < 1
Digitized for FRASER http://fraser.stlouisfed.org/ Federal Reserve Bank of St. Louis

Table 12. Occupational Earnings: Men’s Goodyear-Welt Dress Shoes, All Establishments— Continued 00(Number and average straight-tim e hourly earnings 1 of w orkers in selected occupations,
United States and selected regions, A pril 1962)
Departm ent, occupation, and sex
United S tates2 New England Great Lakes
Numberof
workers
Averagehourly
earnings
Numberof
w orkers
Averagehourly
earnings
Numberof
workers
Averagehourly
earnings
Fin ish in g:Bottom scou rers ------------------------------------------------ 2 0 1 $ 1. 89 51 $ 2 . 2 9 87 $ 1. 87
Men ------------------------------------------------------------------ 165 1. 96 51 2 . 2 9 54 2 . 10W om en ------------------------------------------------------------- 36 1. 53 - - 33 1. 50
Edge setters (all men) -------------------------------------- 340 2. 57 156 2 . 9 0 105 2. 54R epairers ------ ------------------------------------------ ----------- 464 1. 51 151 1. 67 1 21 1. 51
Men ------------------------------------------------------------------ 39 1 . 82 13 1 .9 6 - -W om en ------------------------------------------------------------- 425 1 .4 8 138 1 .6 4 1 21 1. 51
T re ers ------------------------------------------------------------------ 405 1. 83 1 0 2 2. 37 149 1. 78Men ------------------------------------------------------------------ 1 6 8 2 . 11 90 2. 44 - -W omen ------------------------------------------------------------- 237 1. 63 12 1. 83 141 1. 76
M iscellan eou s:Floor boys (or girls) ---------------- ---------------- ----- 462 1. 39 156 1. 36 158 1. 50
Men ------------------------------------------------------------------ 1 6 2 1. 35 58 1. 31 - -Women ________________________________________ 300 1.41 98 1. 38 123 1 .4 8
Inspectors (crow ners) ------------------------------------ 721 1. 54 291 1. 53 191 1. 67Men ------------------------------------------------------------------ 341 1. 64 159 1 .6 3 67 1. 92Women ________________________________________ 380 1. 44 132 1. 42 124 1. 54
Janitors __________________________________________ 297 1. 31 71 1. 33 98 1. 41Men ------------------------------------------------------------------ 272 1. 32 67 1. 33 83 1. 43Women ------------------------------------------------------------- 25 1. 25 - - 15 1. 31
M echanics, m aintenance (all men) __________ 173 2 . 01 33 2 . 21 61 2. 23
1 Excludes prem ium pay for overtim e and for work on weekends, holidays, and late shifts.2 Includes data for regions in addition to those shown separately.
N O T E : D ashes indicate no data reported or data that do not m eet publication criteria .
Digitized for FRASER http://fraser.stlouisfed.org/ Federal Reserve Bank of St. Louis

Table 13. Occupational Earnings: Men’s Goodyear-Wclt Dress Shoes, by Size o f Establishment
(Number and average straight-time hourly earnings 1 of workers in selected occupations, United States and selected regions, April 1962)
United States New England Great Lakes
Establishm ents with—
Sex, departm ent, and occupation 50-249workers
250 or m ore workers
50 -2 49w orkers
250 or m ore workers
50 -2 49workers
250 or m ore workers
Numberof
workers
Averagehourly
earnings
Numberof
w orkers
Averagehourly
earnings
Numberof
workers
Averagehourly
earnings
Numberof
w orkers
Averagehourly
earnings
Numberof
w orkers
Averagehourly
earnings
Numberof
workers
Averagehourly
earnings
Men
Cutting:$2 . 03 $2. 30 $ 2 . 2 0C u tters, cloth lining, machine --------------------- 24 $1. 85 1 0 2 $ 1 .9 7 13 44 - - 15
C utters, leather lining, machine ___________ 34 2. 05 183 1 .9 4 21 2 . 12 74 2 . 21 1 1 $ 1 .9 3 27 2 . 10
C utters, vamp and whole shoe,machine ________________________________________ 188 2. 27 938 2. 56 94 2 .4 6 396 2. 97 56 2 . 0 9 195 2 . 60
Fitting:2 .4 2V am pers _________________________________________ 2 0 2 . 08 73 2. 30 19 2 . 11 52 - - -
Lasting:A sse m b le rs for pullover, m achine _________ 69 2 . 21 236 2. 04 28 2. 84 8 8 2. 57 28 1 .7 3 39 1 .9 0B ed-m ach ine operators _______________________ 18 1. 98 84 2. 33 13 1 .9 2 2 2 2 . 39 - - - -H e e l-se a t la ste rs _______________________________ 42 1.8 9 107 2 . 0 0 16 2. 05 27 2 . 61 2 0 1.61 25 2. 72P u llover-m achin e operators ________________ 84 2 .4 7 358 2. 34 32 2. 83 1 1 2 2 . 94 38 2. 37 89 2 . 59Side la s te r s , m achine _________________________ 8 8 2 . 12 346 2 . 11 33 2. 29 109 2. 53 37 2. 04 84 2 . 26Toe la s te r s , autom atic or
sem iautom atic ________________________________ 80 2. 17 317 2 . 16 33 2 .4 4 96 2. 56 37 2 . 01 83 2 .4 9Bottom ing and making:
1 .6 0 26Bottom fille rs ______________ _________________ 24 1. 54 61 1 .7 5 10 2 . 01 - - 9 1 .7 9Edge trim m ers __________ _________ __________ 91 2. 57 449 2. 55 33 3. 22 152 3. 24 39 2. 25 108 2 . 59Goodyear stitchers _____________________________ 117 2. 13 471 2. 13 35 2 .4 4 135 2. 54 62 1.9 7 117 2. 32H eel attachers , machine -------------------------------- 60 1. 97 198 2. 14 25 2. 03 61 2 . 60 23 1. 97 52 2. 35In seam ers ___________________ _________________ 70 2 .4 7 254 2 .3 9 24 2. 93 91 2. 87 29 2. 37 60 2 . 62Join ters, machine __________ _______________ _ 9 1 .7 9 42 2 . 16 7 1.71 31 2. 17 - - - -Rough rounders ________________________________ 56 2 .2 9 218 2. 23 2 0 2 . 6 6 63 2 . 81 24 2. 14 53 2 .4 5Sole le v e le r s , machine _______________________ 31 1. 64 69 1 .6 5 15 1. 50 26 1 . 82 12 1 . 8 8 13 1.9 6
F inishing:2 . 12Bottom scou rers ___________________ __________ 23 1. 95 142 1.97 7 1 .8 9 44 2. 35 9 1 .9 8 45
Edge setters ------------------------------------------------------- 64 2. 53 276 2. 58 25 2 . 82 31 2. 91 23 2 .4 3 82 2. 57T re e rs ____________________________________________ 26 2. 32 142 2. 07 2 2 2 . 39 6 8 2. 45 - - - -
M iscellaneous:F loor boys _______________ _____________________ 12 1.2 7 150 1. 35 10 1. 23 48 1. 33 - - - -Inspectors (crow ners) _________________________ 76 1 .6 9 265 1.6 3 49 1.61 1 1 0 1 .6 4 12 2. 15 55 1.87Janitors ---------------------------------- --------------------------- 28 1 .3 3 244 1 .3 2 11 1 .3 2 56 1. 34 9 1.41 74 1.4 4M echanics, maintenance _____________________ 35 2. 25 138 1 .9 5 - - 30 2. 23 25 2. 31 36 2. 17
W om en
Cutting:1 . 6 8 1. 52C u tters, leather lining, m achine ___________ 39 1 . 59 154 - - 23 2 . 11 35 51 1 .9 2
Fitting:1 . 60 164Fancy stitchers _________________________________ 252 1 .6 0 943 1. 55 93 1 .7 2 189 1. 91 83 1.7 2
P a ste rs , b ack ers, or fitte rs ,upper, hand ------------------------------------------------------ 149 1. 31 368 1. 38 48 1. 32 108 1.4 3 67 1 . 26 135 1.4 6
Top stitchers ------------------------------------------------------ 152 1 .6 4 719 1 .6 4 50 1 .6 9 231 1 .8 9 71 1 .6 5 175 1.81Vam pers _____________________ _________________ 161 1 . 6 8 759 1 . 6 8 56 1 .8 2 191 2 . 0 2 74 1 .6 2 163 1. 93
Lasting:1 .6 5A sse m b le rs for p ullover, m achine _________ 7 1. 27 47 1 .4 9 - 10 1. 71 7 1. 27 17
Bottoming and making:Bottom fille rs ---------------------------------------------------- 8 1. 52 54 1. 55 - - 15 1. 59 7 1 .4 8 15 1.8 2
F inishing:8 6R epairers ________________________________________ 78 1. 55 347 1.4 7 29 1 . 8 6 109 1. 58 35 1 .3 3 1 . 59
T re e rs ------------------------- -------------------- --------------- 51 1.81 186 1. 58 - - - - 35 1 .8 2 106 1. 74M iscellaneous:
F loor girls -------------- __ __ ______________ __ 53 1 .4 3 247 1.41 17 1. 35 81 1 . 39 26 1 .4 5 97 1 .4 976 1 .4 4 304 1 .4 4 15 1. 38 117 1.42 47 1 .4 9 77 1. 57
1 Excludes prem ium pay for overtim e and for work on weekends, h olidays, and late shifts.2 Includes data for regions in addition to those shown separately.
NOTE: Dashes indicate no data reported or data that do not meet publication criteria.
Digitized for FRASER http://fraser.stlouisfed.org/ Federal Reserve Bank of St. Louis
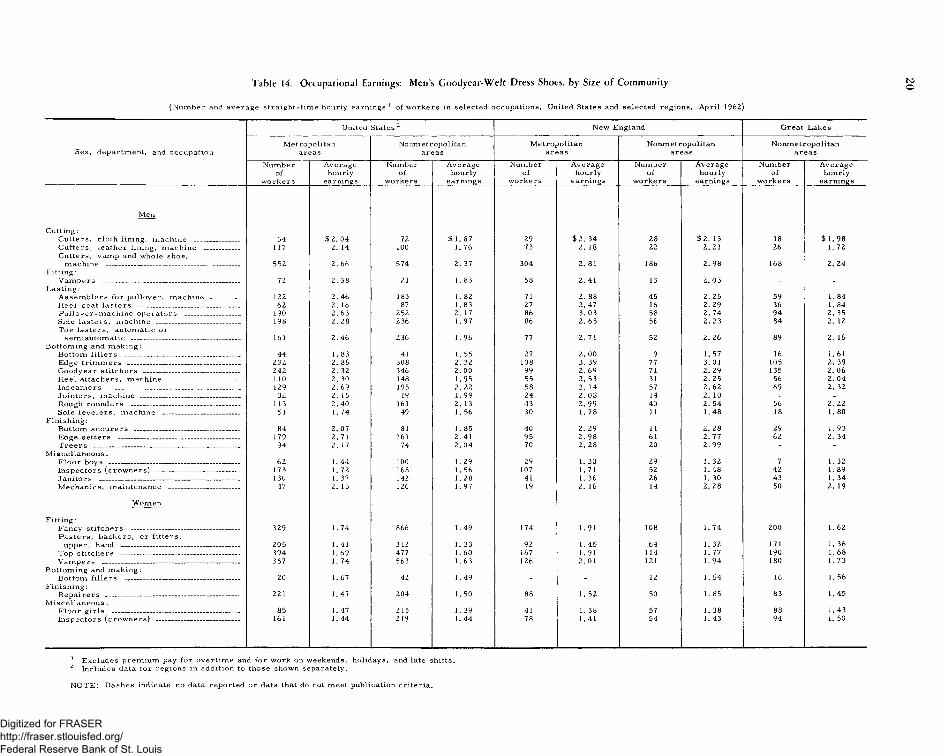
(Num ber and average stra ight-tim e hourly earnings 1 of w orkers in selected occupations, United States and selected regions, April 1962)
Table 14. Occupational Earnings: Men’s Goodyear-Welt Dress Shoes, by Size o f Community too
United States 1 2 New England Great Lakes
Metropolitan Nonmetropolitan M etropolitan Nonmetropolitan NonmetropolitanSex, departm ent, and occupation areas areas areas areas areas
Number Average Number Average Number Average Number Average Number Averageof hourly of hourly of hourly of hourly of hourly
w orkers earnings workers earnings w orkers earnings workers earnings workers earnings
Men
Cutting:Cutters, cloth lining, machine _____________ 54 $ 2. 04 72 $ 1 .8 7 29 $ 2 . 34 28 $ 2 . 13 18 $ 1. 98Cutters, leather lining, machine ___________ 117 2. 14 1 0 0 1 .7 6 73 2 . 18 2 2 2 . 21 26 1 .7 2Cutters, vamp and whole shoe,
machine ------------------------------------------------------------- 552 2 . 6 6 574 2. 37 304 2 . 81 186 2 . 98 168 2. 24Fitting :
Vam pers -------------------------------------------------------------- 72 2. 38 21 1. 83 58 2. 41 13 2. 03 - -L a stin g :
A sse m b le rs for pullover, m achine _________ 1 2 2 2. 46 183 1 . 82 71 2 . 8 8 45 2. 25 59 1. 84H ee l-se a t la sters ---------------------------------------------- 62 2 . 16 87 1.8 3 27 2. 47 16 2 .2 9 36 1. 84P ullover-m achin e operators ------------------------- 190 2. 63 252 2. 17 8 6 3. 03 58 2. 74 94 2. 35Side la ste rs , m achine -------------------------------------- 1 9 8 2 . 28 236 1.97 86 2. 63 56 2. 23 84 2 . 12Toe la sters , autom atic or
sem iautom atic -------------------------------------------------- 161 2 .4 6 2 36 1 . 9 6 77 2. 71 52 2 . 26 89 2 . 16Bottoming and m aking:
Bottom fille rs ---------------------------------------------------- 44 1. 83 41 1. 55 27 2 . 0 0 9 1. 57 16 1 . 61Edge trim m ers --------------------------------------------------- 232 2 . 8 6 308 2. 32 108 3. 39 77 3. 01 105 2 . 39Goodyear stitchers -------------------------------------------- 242 2. 32 346 2 . 0 0 99 2 . 69 71 2 . 29 135 2 . 06Heel attachers, m achine -------------------------------- 1 10 2. 30 148 1 .9 5 55 2. 53 31 2. 25 56 2. 04Inseam ers ----------------------------------------------------------- 129 2. 69 195 2 . 2 2 58 3. 14 57 2 .6 2 69 2. 32Jointers, machine --------------------------------------------- 32 2. 15 19 1 .9 9 24 2 . 08 14 2 . 10 - -Rough rounders -------------------------------------------------- 113 2. 40 161 2. 13 43 2 . 99 40 2. 54 56 2 . 2 2Sole le v e le rs , machine _______________________ 51 1 .7 4 49 1. 56 30 1. 78 11 1 .4 8 18 1 . 80
F in ishin g:Bottom scou rers ------------------------------------------------- 84 2. 07 81 1. 85 40 2 . 29 11 2 . 28 29 1. 93Edge setters _______________ ___________________ 179 2. 71 161 2. 41 95 2 . 98 61 2. 77 62 2. 34T re ers ------------------------------------------------------------------- 94 2. 17 74 2. 04 70 2 . 28 2 0 2 .9 9 - -
M isc e lla n e o u s:F loor boys ------------------------------------------------------------ 62 1 .4 4 100 1. 29 29 1. 30 29 1. 32 7 1. 32Inspectors (crow ners) -------------------------------------- 173 1. 72 1 6 8 1. 56 107 1.71 52 1 .4 8 42 1. 89Janitors ---------------------------------------------------------------- 130 1. 37 142 1 . 28 41 1. 36 26 1. 30 43 1. 34M echanics, m aintenance -------------------------------- 47 2. 13 126 1. 97 19 2 . 16 14 2 . 28 50 2 . 19
Women
F ittin g :1 . 62Fancy stitchers -------------------------------------------------- 329 1 .7 4 8 6 6 1.4 9 174 1.91 108 1 .7 4 2 0 0
P asters , backers, or fitters,upper, hand ------------------------------------------------------ 205 1.41 312 1. 33 92 1 .4 5 64 1. 32 171 1. 36
Top stitchers ------------------------------------------------------ 394 1 . 69 477 1 .6 0 167 1. 91 114 1. 77 1 9 0 1 . 6 8V am pers ---------------------- --------------------------------------- 357 1. 74 563 1 .6 3 126 2 . 01 1 21 1 .9 4 180 1 .7 3
Bottoming and m aking:1. 56Bottom fille rs --------- ------------------------------------------ 2 0 1. 67 42 1.4 9 - - 12 1. 54 16
F in ish in g:R epairers ---------------.--------- -— -------- ,--------------- 2 2 1 1.47 204 1. 50 8 8 1. 52 50 1. 85 83 1 . 45
M iscellaneous :F loor g ir ls , -------------------------------------------------------- 85 1 .47 215 1. 39 41 1. 38 57 1. 38 8 8 1 .4 3Inspectors (crow ners) -------------------------------------- 161 1 .4 4 219 1. 44 78 1.41 54 1 .4 3 94 1. 50
1 Excludes prem ium pay for overtim e and for work on weekends, holidays, and late shifts.2 Includes data for regions in addition to those shown separately.
NOTE: Dashes indicate no data reported or data that do not meet publication criteria.
Digitized for FRASER http://fraser.stlouisfed.org/ Federal Reserve Bank of St. Louis

Table 15. Occupational Earnings: Men’s Goodyear-Welt Dress Shoes, by Size o f Establishment and Size o f Community
(Number and average stra ight-tim e hourly earnings 1 of w orkers in selected occupations, United States and New England, A pril 1962)
Sex, departm ent, occupation, and community size
United 1States 2 New England
Establishm ents with—50-2 49
workers250 or m ore
w orkers5 0 -2 49
w orkers250 or m ore
w orkersNumber
ofworkers
Averagehourly
earnings
Numberof
w orkers
Averagehourly
earnings
Numberof
w orkers
Averagehourly
earnings
Numberof
w orkers
A veragehourly
earnings
Men
Cutting:Cutters, cloth lining, machine:
M etropolitan areas 10 $ 2.16 44 $ 2 . 0 1 10 $ 2.16 19 $ 2 .4 4Nonm etropolitan areas ____________________ 14 1.63 58 1.93 _ _ 25 2.19
Cutters, leather lining, machine:M etropolitan areas ________________________ 19 2.06 98 2.15 18 2.07 55 2 . 2 2Nonm etropolitan areas 15 2.05 85 1.70 - _ 19 2.18
Cutters, vamp and whole shoe, machine:M etropolitan areas __ _ 82 2.47 470 2.69 6 6 2.48 238 2 . 9 0Nonm etropolitan areas ____________________ 1 0 6 2 . 1 1 468 2.42 _ _ 158 3.08
Lasting:A sse m b le rs for pullover, machine:
M etropolitan areas ________________________ 23 2.97 99 2.35 17 3.37 54 2.73N onm etropolitan areas 46 1.83 137 1.82 11 2 . 0 2 34 2.32
H e e l-se a t la ste rs :M etropolitan areas . 13 1.98 49 2 . 2 1 9 1.87 18 2.77Nonm etropolitan areas ____________________ 29 1.85 58 1.83 7 2.27 9 2.30
P u llover-m ach in e operators:M etropolitan areas __ _____________________ 27 2.80 163 2 . 6 0 2 0 3.05 6 6 3.02N onm etropolitan areas _ 57 2.30 195 2.13 12 2.46 46 2.82
Side la s te r s , m achine:M etropolitan areas _ 29 2 . 2 6 169 2.29 21 2.34 65 2.73Nonm etropolitan areas 59 2.05 177 1.95 12 2 . 2 0 44 2.24
Toe la s te r s , autom atic orsem iautom atic:
M etropolitan areas __ 26 2.56 135 2.44 23 2.65 54 2.74Nonm etropolitan areas _ ........... 54 1.98 182 1.95 10 1.95 42 2.33
Bottoming and making:Bottom fille r s :
M etropolitan areas . _ ........ 13 1 . 6 8 31 1.89 9 1.57 18 2 . 2 2Nonm etropolitan areas ____________________ 11 1.36 30 1.62 _ _ 8 1.55
Edge tr im m e rs :M etropolitan areas 29 3.00 203 2.84 21 3.24 87 3.43Nonm etropolitan areas ____________________ 62 2.36 246 2.31 1 2 3.18 65 2.98
Goodyear stitchers:M etropolitan areas 34 2.51 208 2.29 25 2.57 74 2.72Nonm etropolitan areas ____________________ 83 1.98 263 2 . 0 1 10 2 . 1 1 61 2.31
Heel attachers, m achine:M etropolitan areas ________________________ 2 0 2.03 90 2.36 13 2.18 42 2.64Nonm etropolitan areas ____________________ 40 1.94 108 1 . 9 6 12 1 . 8 6 19 2.50
Inseam er s:M etropolitan areas 21 2.70 108 2.69 12 3.29 46 3.10Nonm etropolitan areas r ........... 49 2.37 146 2.17 12 2.56 45 2.64
Rough rounders:M etropolitan areas 19 2.43 94 2.39 12 2.69 31 3.11Nonm etropolitan areas 37 2 . 2 1 124 2 . 1 0 8 2 . 6 1 32 2.52
Sole le v e le r s , machine:M etropolitan areas _______________ _______ 15 1.53 36 1.82 1 2 1.56 18 1.94Nonm etropolitan area s . ___ 16 1.75 33 1.47 8 1.55
See footnotes at end of table.
Digitized for FRASER http://fraser.stlouisfed.org/ Federal Reserve Bank of St. Louis

Table 15. Occupational Earnings: Men’s Goodyear-Welt Dress Shoes, by Size o f Establishment and Size o f Community-----Continued toto
(Number and average straight-tim e hourly earnings 1 of w orkers in selected occupations, United States and New England, A pril 1962)
Sex, departm ent, occupation, and com m unity size
United States 2 New England
Establishm ents with----
50 -249workers
250 or m ore w orkers
50 -2 49 worker s
250 or m ore w orkers
Numberof
w orkers
Averagehourly
earnings
Numberof
workers
A veragehourly
earnings
Numberof
w orkers
Averagehourly
earnings
Numberof
workers
Averagehourly
earnings
Men— Continued
Finishing:Bottom sc o u re rs:
M etropolitan areas __ __ __ _____ __ — 8 $ 1.90 76 $ 2.09 7 $ 1.89 33 $ 2 .3 8Nonm etropolitan areas ________ _____ ____ 15 1.98 6 6 1.82 - - 11 2.28
Edge setters :M etropolitan a r e a s ____ ___ ___ __ ____ ____ 32 2 . 6 6 147 2.72 2 2 2 . 8 8 73 3.01Nonm etropolitan areas ------------ ------------------ 32 2.39 129 2.41 - - 58 2.79
M iscellaneous:Inspectors (crow n ers):
M etropolitan areas _________________________ 45 1 . 6 6 128 1.74 37 1.70 70 1.71N onm etropolitan areas ____ _______ ___ ____ 31 1.74 137 1.52 - - 40 1.52
J anitor s:M etropolitan areas _____ ___ _______ __ __ 16 1.31 114 1.37 7 1.38 34 1.35Nonm etropolitan areas ____________________ 12 1.36 130 1.27 - 2 2 1.31
Women
Fitting:Fancy stitch ers:
M etropolitan areas _____ ___ _______ __ __ 114 1.57 215 1.84 65 1.67 109 2.06N onm etropolitan areas ____ ___ __ ____ ____ 138 1.62 728 1.46 28 1.85 80 1.70
P a ste rs , back ers, or fitte rs , upper, hand:M etropolitan areas _____ _________ __ __ 60 1.39 145 1.42 36 1.32 56 1.53Nonm etropolitan areas _ _ 89 1.26 223 1.36 - - 52 1.32
Top stitch ers:M etropolitan areas __ __ _________ __ __ 48 1.71 346 1 . 6 8 34 1.78 133 1.95Nonm etropolitan areas _ _____ __ __ __ 104 1 . 6 1 373 1.60 16 1.52 98 1.81
V am pers:M etropolitan areas __ __ _____ _______ __ 55 1 . 6 6 302 1.76 32 1.78 94 2.09Nonm etropolitan areas _ _____ __ __ __ 1 0 6 1.69 457 1.62 - - 97 1.95
Finishing:R e p airers:
M etropolitan areas 29 1.58 1 9 2 1.45 21 1 . 6 0 67 1.50N onm etropolitan areas _ „ _____ __ __ 49 1.53 155 1.50 - - 42 1.72
M iscellaneous:Floor g ir ls :
M etropolitan areas _________________________ 6 1.31 79 1.48 6 1.31 35 1.39N onm etropolitan areas ____________________ 47 1.44 168 1.37 - - 46 1.38
Inspectors (crow n ers):M etropolitan a r e a s ________ _____ __ __ 16 1.34 145 1.45 70 1.42N onm etropolitan areas _ _____ __ __ __ 60 1.47 159 1.43 47 1.43
1 Excludes prem ium pay for overtim e and for work on weekends, holidays, and late shifts.2 Includes data for regions in addition to New England.
NOTE; Dashes indicate no data reported or data that do not meet publication criteria.
Digitized for FRASER http://fraser.stlouisfed.org/ Federal Reserve Bank of St. Louis

Table 16. Occupational Earnings: Men’s Goodyear-Welt Dress Shoes, Brockton, Mass.
(Number and average straight-tim e hourly earnings 1 of production w orkers in selected occupations, A pril 1962)
Number of \workers receiving straight:-tim e hourly earnings of—
Sex, departm ent, and occupation of hourly U J$1.20 $1.30 $1.40 $1.50 $1.60 $1.70 $1.80 $1.90 $2 .00 $2. 10 $2.20 $2. 30 $2 .40 $2.50 $2.60 $2.70 $2.80 $2.96 $3.00 $3720 $3740 $3.60 $3.80 $4 . 00 ' $4 .20
w orkers earnings1 $1.20 under and$1.30 $1.40 $1.50 $1.60 $1.70 $1.80 $1.90 $2.00 $2. 10$2 .20 $2.30 $2.40 $2.50 $2 .60 $2.70 $2.80 $2.90 $3.00 $3.20 $3.40 $3.60 $3.80 $4.00 $4 . 2 0 over
A ll production w orkers _____________ 4 ,5 2 9 $ 1. 98 307 506 353 333 255 294 295 175 214 274 171 155 119 145 107 94 90 75 43 132 95 95 67 52 23 60Men ________________________________ 2 ,4 5 8 2. 24 102 151 111 1 14 79 109 176 1 16 164 169 121 88 91 88 80 69 70 60 34 106 87 89 58 49 20 57W om en _____________________________ 2, 071 1. 66 205 355 242 219 176 185 119 59 50 105 50 67 28 57 27 25 20 15 9 26 8 6 9 3 3 3
Selected occupations
Men
Cutting:C utters, cloth lining,
machine . _ _ . ___ 17 2. 23 _ _ _ _ _ 1 2 2 1 2 2 1 1 1 _ _ _ 1 1 2 _ _ _ _ _ _9 1. 90 1 2 z 2 2
Incentive 8 2. 61 1 1 1 1 _ _ _ 1 1 2 _C utters, leather lining,
machine 2b / 40 2. 13 - - 1 5 2 - 5 5 3 3 3 2 2 2 _ _ _ _ 2 3 _ _ _ 2 _ _C utters, vam p and whole
■shop . ha nri 2 10 2. 70 3 3 2C utters, vamp and whole
shoe, m achine 2b / 171 2. 93 - - - _ _ _ _ 6 _ 13 2 5 3 12 15 8 14 7 7 23 21 15 10 4 2 4Fitting:
V am pers 2b / ... _ 44 2. 38 - - 2 2 - 2 1 5 - 7 - - 1 3 2 2 6 3 _ 6 2 _ _ _ _ _Lasting:
A sse m b le rs for pullover,machine 2b / . 38 3. 21 - - - - - - 1 3 _ 1 2 1 _ 1 - 1 3 3 2 2 _ 1 4 3 5 35
B ed-m ach ine operators 2a / ___ 13 2. 14 10 1 _ _ _ 1 _ _ 1 _ _ _ _ _ _ _ _H e e l-se a t la s t e r s 2b / _ _ _ 23 2. 35 _ _ _ _ 2 _ _ 3 2 1 3 1 3 _ 2 _ 1 1 1 1 1 _ _ 1 _ _Pullover -m achine
operators 2b / 50 3. 27 - - - - - - - - _ - 2 - 2 2 1 1 5 4 4 4 4 7 3 5 1 5Side la s te r s . machine 2b / 58 2 . 60 - - _ _ _ 1 2 _ _ 4 3 6 6 3 6 5 5 6 1 3 4 2 _ _ 1 _Toe la s te r s , autom atic or
sem iautom atic 2b / _____________ 43 2 . 92 4 _ _ 5 3 6 2 1 4 2 4 _ 2 6 1 2 1Bottoming and making:
Bottom fille rs 2b / 15 2. 07 - - - 2 - 1 2 1 1 2 _ 1 2 2 _ _ _ _ _ _ _ 1 _ _ _ _Edge trim m ers 2b / 58 3. 41 1 _ 2 1 4 5 _ 6 _ _ 5 5 7 3 6 3 4 10Goodyear stitchers 2b / 6 8 2. 64 - - - - _ 1 1 3 2 3 12 2 3 4 4 5 4 2 4 9 _ 4 2 1 _ 2Heel attacher s . machine 32 2. 44 - - - - - - _ 4 2 7 3 3 2 _ 2 _ 1 _ 2 3 _ _ 2 1 _ _
Tim e ___________________________ 6 1. 91 _ _ _ _ _ _ _ 3 1 2Incentive ______________________ 26 2. 56 _ - _ _ _ _ _ 1 1 5 3 3 2 _ 2 _ 1 _ 2 3 _ 2 1 _ _
Tn « a m t* s / 36 3. 35 2 3 1 4 3 5 5 3 2Jointers, machine 2b / 18 1. 92 _ 3 _ _ _ _ 5 2 _ 2 3 _ 1 _ 2Rough rounders 2b / 26 3. 20 2 1 3 1 3 1 1 2 2 3 2 53Shank tackers 2b / ------------------------ 11 2 . 0 0 _ _ 2 _ _ 1 _ _ _ 2 3 2 _ 1Sole le v e le rs , machine 21 1. 79 - 1 _ 6 3 3 _ 2 _ 2 _ . 2 1 _ _ _ _ _ 1 _ _ _ _ _ _
Incentive ______________________ 17 1. 84 _ 1 _ 5 2 1 _ 2 _ 2 _ _ 2 1 _ _ _ _ _ 1 _ _ _ _ _ _Finishing: 2b /
Bottom scou rers ________________ 19 2. 23 - - 2 1 - _ 4 - 2 - - 1 3 _ _ 2 _ 2 1 _ _ _ _ 1 _ _Edge setters _____________________ 52 3. 01 - - - _ - - _ - 2 2 - 4 3 2 2 4 1 1 2 9 7 5 4 _ 2 2T re e rs _____________________________ 51 2. 30 - _ _ _ _ 2 15 _ 1 _ 6 5 2 2 3 2 7 2 _ 1 2 _ _ _ _ 1
Other:Floor boys 2a / ___________________ 16 1. 29 63 11 - - 1 - - - 1TnRpprtnr q IrrnwnprcJ 72 1. 79 6 1 6 10 12 2 30 3 1 l
Tim e ______________ ___________ 64 1. 78 _ 6 _ 6 4 12 2 30 3 1Incentive _ 8 1. 87 _ _ _ 1 _ 6 1 _ _ _ _
Janitors 2a / _______________________ 2 5 1. 35 65 7 3 5 1 4
See footnotes at end of table, tou>
Digitized for FRASER http://fraser.stlouisfed.org/ Federal Reserve Bank of St. Louis

Table 16. Occupational Earnings: Men’s Goodyear-Welt Dress Shoes, Brockton, Mass.___Continued
(Number and average straight-time hourly earnings 1 of production workers in selected occupations, April 1962)
to
AverageSex, departm ent, and occupation of
w orkershourly
earnings 1 Under$ 1 . 2 0
$ 1 . 2 0and
under$1.30
$1.30
$1.40
$1.40
$1.50
$1.50
$ 1 . 6 0
$1.60
$1.70
Selected occupations— Continued
Women
F ittin g :Fancy stitchers 137 $ 1. 98 _ _ 1 11 32 12
Incentive ______________________ 116 2 . 06 _ _ 1 11 14 10P asters, backers, or fitters,
upper, hand ------------------------------- 65 1 .4 6 10 28 4 2 4 5Tim e __________________ _________ 35 1. 25 6 10 21 1 1 1 1Incentive _____________ ______ 30 1. 71 _ 7 3 1 3 4
Top stitchers 2 3 4 5 6 b / 77 1. 93 _ 2 4 7 6 9Vam pers __________________________ 62 2. 17 _ _ _ 1 3 5
Incentive ---------------------------------- 56 2 . 21 _ _ _ 1 3 5F in ishin g:
R epairers -------------------------------------- 46 1. 59 4 1 9 9 3 6Tim e ----------------------------------------- 23 1. 41 6 3 1 8 8 1 2Incentive ---------------------------------- 23 1. 76 1 _ 1 1 2 4
O th er : 2 a/Floor g irls _______________________ 28 1. 37 . 7 11 5 4 1Inspectors (crow ners) --------------- 31 1. 52 2 5 3 11 2 3
Number of workers receiving stra ight-tim e hourly earnings of—
1 Excludes prem ium pay for overtim e and for work on weekends, holidays, and late shifts.Insufficient data to warrant presentation of separate averages by method of wage paym ent; (a) all or predominantly tim ew orkers, and (b) all or predominantly incentive w orkers.
3 A ll workers w ere at $ 4 . 20 to $ 4 . 40.4 W orkers were distributed as follow s : 5 at $ 4. 20 to $ 4. 40; 2 at $ 4. 40 to $ 4. 60 ; 1 at $ 4. 80 to $ 5; and 2 at $ 5. 20 to $ 5. 40.5 W orkers were distributed as fo llow s: 2 at $ 4 .2 0 to $ 4 .4 0 ; and 1 at $ 5 .6 0 to $ 5 .8 0 .6 A ll w orkers were at $ 1. 10 to $ 1. 20.
Digitized for FRASER http://fraser.stlouisfed.org/ Federal Reserve Bank of St. Louis

Table 17. Occupational Earnings: Men’s Goodyear-Welt Dress Shoes, W isconsin
(Number and average straight-time hourly earnings1 of production workers in selected occupations, April 1962)
Sex, departm ent, and occupation
A ll production w orkersMen ___________________Women _______________
Selected occupations
Men
Cutting: 2 b /Cutters, cloth lining,
machine _________________________Cutters, leather lining,
machine •_________________________Cutters, vamp and whole
shoe, machine _________________Lasting:
A sse m b le rs for pullover,m achine 2 b / ____________________
H e e l-se a t la ste rs _______________Incentive ______________________
Pullover -m achineoperators 2 b / __________________
Side la s te rs , machine 2 b / _____Toe la ste rs , autom atic or
sem iautom atic 2 b / _____________Bottoming and m aking: 2 b /
Edge trim m ers __________________Goodyear stitchers ______________Heel attachers, m achine ______In seam ers ________________________Rough rounders _________________Sole le v e le r s , machine ________
Finishing: 2 b /Bottom scou re rs ________________Edge setters _____________________T re ers _____________________________
Other;Inspectors (crow ners) __________
T im e ___________________________Janitors 2 a / ______________________M echanics, maintenance 2 a / __
Women
Cutting: 2 b /Cutters, cloth lining,
machine _________________Cutters, leather lining,
machine _________________Cutters, vamp and whole
shoe, machine __________
Numb e :r of worke rs receiving straight -tim e: hour■ly earning s of—
of hourly $1.15 $ 1 . 2 0 $1.25 $T7Io $1735 $1.40 $1.45 $1.50 $1.55 $ 1 . 6 0 $1.65 $1.70 $1.80 $1.90 $2700 $ 2 . 1 0 $ 2 . 2 0 $2.30 $2.40 $2750 $27613$2770 $2.80' $2.90- $3.00 $3.10w orkers earnings 1
cilldunder - and$ 1 . 2 0 $1.25 $1.30 $1.35 $1.40 $1 .45 $1.50 $1.55 $1.60 $1.65 $1.70 $1.80 $ 1 . 9 0 $ 2 . 0 0 $2 . 1 0 $ 2 . 2 0 $2.30 $2.40 $2.50 $2.60 $2 .70 $2.80 $ 2 . 9 0 $3.00 $3.10 over
4 ,4 4 7 $ 1.76 278 138 266 340 225 2 0 1 194 185 217 140 197 316 245 262 229 172 155 146 129 96 103 72 36 25 29 511 ,6 33 2.05 69 18 53 42 72 24 24 6 6 54 34 47 91 93 67 106 82 107 1 1 0 93 81 96 69 33 24 27 512, 814 1.59 209 1 2 0 213 298 153 177 170 119 163 106 150 225 152 195 123 90 48 36 36 15 7 3 3 1 2
6 2.39 1 1 2 1 1
11 1.97 - - - - - - - 3 - - 1 - 1 2 1 - - 1 1 - - 1 - - - -
132 2.42 - - - - 3 3 - 4 1 - 1 6 10 5 7 2 5 5 9 16 8 28 - 6 2 11
25 2 . 0 2 1 _ . 5 1 2 1 2 1 6 4 1 12 2 2.04 - - - 4 - _ - 1 _ 1 _ 2 3 _ 1 1 3 _ 1 1 1 _ _ 2 117 2.25 - 1 - 2 3 - 1 1 3 - 1 1 1 - - 2 1 -
51 2.58 _ - - - 1 2 1 4 _ 9 3 6 10 2 2 5 3 347 2.26 3 2 4 3 3 2 5 7 6 4 5 2 1 - -
63 2.33 - - - - 4 1 - - - - 3 - 4 2 2 2 7 10 5 2 10 5 2 2 1 1
62 2.56 _ _ _ 1 4 4 1 6 3 8 12 1 5 3 2 9 371 2.38 - - - - - 1 - 2 2 - - 1 4 2 9 3 2 10 4 8 8 5 2 4 431 2 . 2 0 - - - - - 1 - - - - _ 2 7 _ 1 4 3 5 4 _ 3 _ _ _ _ 139 2.51 - 1 3 2 3 _ _ 5 _ 8 2 5 4 1 4 128 2.45 - 2 _ _ _ 1 4 3 2 4 4 1 3 1 313 1.87 - 2 - - - - - - 1 1 1 1 - - - 3 4
30 2.17 - - - _ 1 1 _ _ 2 _ 2 1 1 3 3 2 4 1 2 2 3 248 2.36 - - - 1 - - - 2 3 _ 1 1 1 1 1 2 4 12 1 3 7 . 3 1 4
8 2.14 - 2 1 - 1 1 1 2 - -
33 1.95 _ _ _ 1 _ _ _ _ 3 _ _ 8 5 4 2 2 1 5 1 123 1.82 - - - - - - - - 3 _ _ 8 5 4 2 140 1.38 - 2 7 1 19 3 1 3 2 _ 22 0 2.45 3 6 2 4 1 3 1
15 1.65 1 4 1 1 5 1 1 1
42 1.93 - - - 2 1 3 - 1 - - 6 2 7 3 5 1 5 1 1 - 4 - - - -
72 2 . 0 1 2 2 1 8 4 5 11 10 6 4 3 2 4 2 3 “ 2 1 2
See footnotes at end of table. to
Digitized for FRASER http://fraser.stlouisfed.org/ Federal Reserve Bank of St. Louis

(Num ber and average straight-tim e hourly earnings 1 of production w orkers in selected occupations, April 1962)
Table 17. Occupational Earnings: Men’s Goodyear-Welt Dress Shoes, W isconsin— Continued toON
Ntimber of workers receiving straight- time hourly earnings: of----
Sex, departm ent, and occupation of hourly $1.15 $ 1 . 2 0 $1.25 $1730 fl .3 5 $1.40 $1.45 $1.50 $1 .55 $1.60 $1.65 $1.70 $1.80 $1.90 $ 2 . 0 0 $2 . 1 0 $2 . 2 0 $2.30 $2.40 $2750 $2.60 $2 .70 $2.80 $2 . 9 0 $3.00 $5. iow orkers earnings 1 under " and
$ 1 . 2 0 $1.25 $1.30 $1.35 $1.40 $1.45 $1.50 $1.55 $1.60 $1.65 $1.70 $1.80 $ 1 . 9 0 $ 2 . 0 0 $ 2 . 1 0 $ 2 . 2 0 $2.30 $2.40 $2.50 $2.60 $2.70 $2.80 $2 . 9 0 $3.00 $3.10 over
Selected occupations— Continued
W omen— Continued
Fitting:Fancy stitchers _________________ 135 $ 1.70 6 5 2 10 9 - 6 8 10 5 9 14 7 16 17 6 2 1 1 - - - 1 - - -
Tim e _____________ ____ ________ 15 1.56 _ 1 - - 3 - 4 - - - 3 4 -Incentive ______________________ 1 2 0 1.72 6 * 4 2 10 6 - 2 8 10 5 6 10 7 16 17 6 2 1 1 - - - 1 - - -
P a ste rs , backers, or fitte rs ,upper, hand ____________________ 125 1.38 32 8 12 17 7 7 16 5 . - 3 7 6 2 1 2
Tim e ........ ...................... ................... 21 1.19 16 2 1 2Incentive ______________________ 104 1.41 16 6 11 17 7 5 16 5 - 3 7 6 2 1 2
Top stitchers ____________________ 113 1.77 1 - 5 3 8 4 9 6 8 9 3 7 8 8 8 7 10 6 2 1 - - - - - -Tim e ___________________________ 13 1.46 - - 3 - 3 - - 1 - 6 - - - - - - - - - - - - - - - -Incentive ______________________ 1 0 0 1.81 1 _ 2 3 5 4 9 5 8 3 3 7 8 8 8 7 10 6 2 1 - - - - - -
V am pers __________________________ 123 1.81 1 8 8 2 4 3 4 9 7 3 3 11 9 14 8 6 5 3 7 5 - 3 - - - -T im e ___________________________ 12 1.47 - 6 - - 1 - 1 1 3Incentive ______________________ 1 1 1 1.85 1 2 8 2 3 3 3 8 7 3 3 11 9 14 5 6 5 3 7 5 - 3 - - - -
Lasting:A sse m b le rs for pullover,
machine -------------------------------------- 16 1.56 3 3 - 1 - - - - 1 - - 5 1 - 1 - 1 - - - - - - - - -Incentive ______________________ 10 1.78 - - - 1 - - - - 1 - - 5 1 - 1 - 1 - - - - - - - - -
Bottoming and making:Bottom fille r s ___________________ 18 1.54 1 1 4 1 - 1 - - 1 2 2 - 3 1 1
Tim e ___________________________ 7 1.48 - 1 3Incentive ______________________ 11 1.58 1 - 1 1 - 1 - - 1 2 2 - - 1 1
Finishing:Bottom scou rers 2 b / ____________ 14 1.59 - - 3 1 - 1 - - 2 2 1 1 - 3R epairers _________________________ 48 1.49 2 - 1 7 6 9 10 - 3 - 3 1 1 3 1 - 1 - - - - - - - - -
Tim e ___________________________ 32 1.44 - - 1 3 6 8 9 - 2 - 3 - - - - - - - - - - - - - - -Incentive ______________________ 16 1.61 2 - - 4 - 1 1 - 1 - - 1 1 3 1 - 1 - - - - - - - - -
T r e e r s 2 b / _ _____________________ 38 1.79 - 2 1 2 1 1 - 4 1 2 - 7 3 5 - 2 4 2 1 - - - - - - -Other:
F loor g ir ls 2 a / __________________ 50 1.45 1 1 1 9 9 9 2 6 1 - 8 2 - 1Inspectors (crow ners) --------------- 49 1.53 - 3 5 5 5 1 3 2 7 2 1 0 1 - 1 3 1
Tim e ----------------------------------------- 27 1.42 - 3 5 2 3 1 3 1 5 2 2Incentive ______________________ 2 2 1.67 - - - 3 2 - - 1 2 - 8 1 - 1 3 1
J an itresses 2 a / __________________ 11 1.28 1 2 3 1 4
1 Excludes prem ium pay for overtim e and for work on weekends, holidays, and late shifts.2 Insufficient data to warrant presentation of separate averages by method of wage payment; (a) all or predominantly tim ew orkers, and (b) all or predominantly incentive w orkers.
Digitized for FRASER http://fraser.stlouisfed.org/ Federal Reserve Bank of St. Louis

Table 18. Occupational Earnings: Men’s Goodyear-Welt W ork Shoes, All Establishments
(Number and average stra igh t-tim e hourly earnings 1 of workers in selected occupations, United States and selected regions, A pril 1962)
United States 2 New England Great Lakes
Departm ent, occupation, and sex Numberof
w orkers
Averagehourly
earnings
Numberof
workers
Averagehourly
earnings
Numberof
w orkers
Averagehourly
earnings
Cutting:C utters, vam p and whole
shoe, machine __________________ 394 $ 2. 13 95 $ 2 . 34 103 $ 2 . 16Men --------------------------------------------- 333 2 . 19 87 2 . 39 77 2. 24W om en _ _ 61 1. 79 8 1 . 80 26 1. 93
Fitting:Fancy stitchers (123 w om en,
1 man) ____________________________ 124 1 . 62 2 2 1. 67 63 1. 77P a ste r s , b a ck e rs, or fitte rs ,
upper, hand (all w om en)_______ 136 1. 27 57 1. 31 2 2 1. 40Top stitchers (a ll w om en )_______ 6 6 1. 36 14 1.71 - -V am pers (49 w om en, 3 men) — 52 1. 64 17 1. 83 - -
Lasting:A sse m b le rs for pullover,
machine (78 m en,2 women) _________________________ 80 1 . 79 14 1 . 8 8 17 2 . 0 0
H ee l-se a t la sters (37 men,3 women) _________________________ 40 1 . 60 11 1 . 61 7 1. 75
Side lasters, m achine (a llm en )__ 106 1. 97 2 2 2 . 16 21 2 . 39Toe la s te r s , autom atic or
sem iautom atic (18 m en,1 woman) _________________________ 19 1 . 9 0 8 1 . 9 2 - -
Bottoming and making:Bottom fille rs ___ 33 1. 63 - - 10 2. 09
Men ______________________________ 24 1 . 59 - - - -W om en __________________________ 9 1. 74 - - 7 1 . 89
Edge trim m ers (all men) _______ 108 2 . 2 2 21 2. 52 36 2 . 39Goodyear stitchers (145 m en,
6 women) _________________________ 151 1. 97 41 2 . 11 24 2. 48Heel a ttach ers, machine
(46 m en, 1 woman) _____________ 47 1 . 95 12 1. 96 11 2. 34In seam ers (all men) _____________ 74 2. 03 15 2. 52 16 2. 64Rough rounders (63 m en,
2 women) _________________________ 65 1. 99 15 2. 15 13 2. 55Sole leveler s, m achine (all men) — 13 1. 58 - - 7 1. 72
Finishing:R epairers (50 w om en, 4 men) — 54 1 . 49 14 1. 48 19 1. 49
M iscellaneous:Floor boys (or g irls) ____________ 79 1. 35 26 1. 33 14 1. 48
Men ______________________________ 40 1. 32 9 1. 31 - -W om en __________________________ 39 1. 37 17 1. 33 13 1. 49
Inspectors (crow ners) ______________ 117 1. 37 42 1. 33 19 1. 47Men _____________________________________ 43 1. 42 9 1. 58 - -W omen __________________________ 74 1. 34 - - - _
Janitors (65 m en, 4 women) ____ 69 1 . 28 10 1. 33 21 1 . 38M ech anics, maintenance
(all men) ________________________________ 51 1. 91 7 2 . 10 17 2 . 06
1 Excludes prem ium pay for overtim e and for work on weekends, holidays, and late shifts.
2 Includes data for regions in addition to those shown separately.
NOTE: D ashes indicate no data reported or data that do not meet publication criteria .
Table 19. Occupational Earnings: Men’s Cement-Process Shoes,All Establishments
(Number and average stra ight-tim e hourly earnings 1 of w orkers in selected occupations, United States and New England, A p ril 1962)
United States 2 New England
Departm ent, occupation, and sex Numberof
w orkers
Averagehourly
earnings
Numberof
workers
Averagehourly
earnings
Cutting:C utters, vamp and whole
shoe, machine __ 170 $ 2 . 01 57 $ 2 . 26Men _____________________________________ 109 2. 27 54 2. 29Women 61 1. 56 _ _
Fitting:Fancy stitchers (all w om en )___________ 10 1 1. 45 21 1. 64P a ste rs , back ers, or fitte rs ,
upper, hand (all women) ___ . _ . 75 1. 29 29 1 . 28Top stitchers (all women) 16 1. 70 - _Vam pers (all women) ....... . 26 1. 94 - _
Lasting:A sse m b le rs for pullover,
machine . ......... 29 1. 70 12 2. 15Men _____________________________________ 17 1 . 82 9 2. 15W om en _ 12 1. 53 _ _
H ee l-se a t lasters (11 m en,1 woman) _ __ __ _ . _ 12 1. 92 7 1. 96
Side la ste rs . machine (all men) 15 2. 05 6 2. 24Toe la ste rs , automatic or
sem iautom atic (all men) .. _ ... 12 1. 85 - _Bottoming and making:
Edge trim m ers (all m e n )_______________ 41 2 . 21 21 2. 56Sole attachers, cement process
( 2 0 m en. 8 women) 28 1. 84 10 1. 91Finishing:
R epairers (all w om en )___________________ 55 1. 30 42 1 . 21M iscellaneous:
Floor boys (or girls) ___________________ 63 1 . 28 41 1. 25Men _____________________________________ 24 1 . 2 2 - -
W om en _________________________________ 39 1. 32 21 1. 30Inspectors (crowners) ---------------------------- 50 1 . 39 - -
Men _____________________________________ 8 1. 55 - -Women _________________________________ 42 1. 36
1 Excludes prem ium pay for overtim e and for work on weekends, holidays, and late sh ifts.
2 Includes data for regions in addition to New England.
NO TE: Dashes indicate no data reported or data that do not m eet publication criteria .
to
Digitized for FRASER http://fraser.stlouisfed.org/ Federal Reserve Bank of St. Louis

(Num ber and average stra ight-tim e hourly earnings 1 of workers in selected occupations, United States and selected regions, April 1962)
Table 20. Occupational Earnings: W om en’s Cement-Process (Conventional-Lasted) Shoes, A ll Establishments toCO
United States 2 New England Middle Atlantic Border States Southwest Great Lakes Middle W est Pacific
Departm ent, occupation, and sex Numberof
w orkers
Averagehourly
earnings
Numberof
workers
Averagehourly
earnings
Numberof
workers
Averagehourly
earnings
Numberof
w orkers
Averagehourly
earnings
Numberof
w orkers
Averagehourly
earnings
Numberof
w orkers
Averagehourly
earnings
Numberof
w orkers
Averagehourly
earnings
Numberof
w orkers
Averagehourly
earnings
Cutting:C utters, cloth lining, m achine ______ 437 $ 2. 07 181 $ 2. 40 49 $ 2. 03 21 $ 1. 37 27 $ 1 . 60 91 $ 1. 83 36 $ 2. 03 6 $ 2 . 30
Men ------------------------------------------------------- 317 2 . 26 158 2. 50 43 2 . 06 _ - 14 1. 97 36 2 . 21 2 2 2. 25 - -Women ------------------------------------------------- 1 2 0 1 . 60 23 1.71 6 1 . 79 7 1 .4 4 13 1. 19 55 1. 58 14 1. 70 - -
Cutters, leather lining, m achine ___ 519 1. 97 177 2. 36 56 2 . 19 27 1 .9 4 13 1. 36 106 1.61 118 1. 76 - -Men ------------------------------------------------------- 321 2. 14 159 2. 41 45 2. 23 - - - - 21 1. 57 6 6 1. 73 - -W omen ------------------------------------------------- 1 9 8 1. 71 18 1 . 9 2 11 2. 05 17 1. 70 12 1. 31 85 1 .6 2 52 1. 78 - -
Cutters, vamp and wholeshoe, hand ______________________________ 462 2. 46 23 2. 31 189 2 . 80 27 1. 77 - - 6 8 2 . 19 136 2. 38 10 2. 30
Men ------------------------------------------------------- 418 2. 55 21 2. 31 189 2 . 80 15 1 . 9 2 - - 54 2. 31 128 2. 42 10 2. 30W omen ------------------------------------------------- 44 1 . 62 . - - - - - - - 14 1. 75 8 1. 69 - -
Cutters, vamp and wholeshoe, m achine -------------------------------------- 2, 368 2 . 26 1, 178 2 . 59 319 1 . 8 8 65 1. 89 81 1. 87 317 2 . 09 244 1. 89 39 2. 48
Men ------------------------------- --------------------- 1, 887 2 . 39 1, 114 2 . 62 215 1. 96 33 2. 04 45 2. 24 2 0 2 2. 25 145 1. 98 34 2 . 49Women ------------------------------------------------- 481 1. 76 64 1.99 104 1. 71 32 1 .7 3 36 1. 40 115 1.79 99 1. 77 - -
F ittin g :Fancy stitchers _________________________ 3, 609 1 . 60 1, 435 1 .75 645 1. 54 144 1. 34 72 1. 30 541 1. 54 537 1. 45 109 1. 84
M en ------------------------------------------------------- 136 2. 30 10 1.9 9 60 2. 78 - - - - - - - - 51 1 . 8 8W om en ------------------------- --------------------- 3, 473 1. 58 1, 425 1 .7 5 585 1. 41 140 1. 35 72 1. 30 535 1. 53 537 1. 45 58 1 . 80
P asters , backers, or fitters,upper, hand ------ ----------- ------------------------ 2, 536 1. 42 1 , 1 1 0 1.41 498 1. 46 65 1. 37 94 1. 34 307 1 .4 5 315 1 .4 4 - -
Men ------------------------------------------------------- 55 1. 73 _ _ 30 2. 04 - - - - - - - - - -Women _________________________________ 2, 481 1. 42 1 , 108 1.41 468 1. 42 64 1. 37 94 1. 34 306 1. 45 315 1. 44 - -
Top stitchers ------------------------------------------ 1, 995 1. 75 977 1.93 289 1. 83 84 1 .4 2 28 1 . 28 244 1. 46 258 1. 54 38- 1. 85Men ------------------------------------------------------- 1 2 0 2. 41 27 2. 13 69 2. 70 _ - - - - - - - 13 1 . 81W omen ------------------------------------------------- 1, 875 1. 71 950 1 . 9 2 2 2 0 1. 55 80 1 . 39 28 1 . 28 240 1. 44 258 1. 54 25 1 . 8 6
Vam pers --------------------------------------------------- 846 1. 54 304 1. 78 30 3 1. 35 35 1.49 - - 105 1 .4 9 34 1. 48 10 1.99Men ------ ------------------------------------------------ 53 1 . 6 6 15 1. 84 _ - - - - - - - - - - -Women ------------------------------------------------- 793 1. 54 289 1.7 8 27 1 1. 33 35 1.49 - - 105 1. 49 34 1. 48 - -
L astin g :A sse m b le rs for pullover,
machine ------------------------------------------------- 940 2 . 18 409 2. 52 160 1. 99 40 1 . 6 0 35 1. 34 118 2. 15 117 2 . 06 14 2. 36Men ------------------------------------------------------- 794 2. 23 342 2. 56 131 2 . 08 27 1 . 6 6 31 1. 36 105 2 . 19 108 2. 07 13 2. 33Women ________________________________ 146 1. 93 67 2 . 29 29 1 . 61 13 1 .4 8 - - 13 1 . 8 8 9 1 . 92 - -
B ed-m ach ine operators (1 ,0 3 1 m en,5 women) ------------------------------------------------ 1 ,0 3 6 2. 48 513 2 . 79 143 2 . 18 46 2 . 0 0 42 1. 78 123 2 . 28 1 6 0 2 . 28 - -
H e e l-se a t lasters (414 m en,10 women) ----- ---------------------------------------- 424 2 . 0 1 172 2. 27 8 8 1 . 99 19 1. 56 16 1. 55 57 1 .9 4 50 1. 67 6 2. 30
P ullover-m achin e operators(762 m en, 1 woman) --------------------------- 763 2. 56 336 2 . 96 136 2. 25 25 2 . 28 30 1. 64 1 01 2. 31 92 2. 51 6 2. 84
Side la s te rs , machine(1, 130 m en, 5 women) ---------------------- 1, 135 2. 43 514 2. 85 190 2. 23 47 1 . 9 0 47 1. 59 159 2. 17 124 2 . 16 8 2. 44
Toe la s te rs , automatic or sem iautom atic (7 82 m en,5 women) ________________________________ 787 2 . 21 294 2. 84 1 90 1. 90 26 1. 27 93 1 . 8 6 94 1. 91 7 2 . 21
Bottom ing and making:1 . 82Bottom fille rs ----------------------------------------- 151 1. 69 16 1 . 8 8 52 1. 67 - - 9 2. 54 37 1. 54 18 1. 53 6
Men --------------------------- ---------------------------- 34 1. 85 - - 2 1 2. 07 - - - - 8 1. 37 - - - -Women ------------------------------------------------- 117 1. 65 16 1 . 8 8 31 1. 40 - - 9 2. 54 29 1. 59 17 1. 56 - -
Edge trim m ers (787 m en,2. 5221 women) --------------------------------------------- 808 2. 45 334 2. 87 114 2 . 39 35 1.9 7 34 1. 75 124 2 . 06 124 2 . 21 7
Heel attachers, machine (297 m en,2. 332 2 women) ------------- -------- ----------------------- 319 1. 93 73 2. 14 114 1. 89 - - 9 1. 56 59 1. 87 35 1. 70 7
Rough rounders .................. - --------------------- 182 1. 71 6 2. 67 18 1 . 80 - - - - 65 1 .6 9 59 1. 73 - -Men ------------------------------------------------------- 126 1. 77 6 2. 67 18 1 . 80 - - - - 33 1 .7 9 44 1. 76 - -W omen -------------------------------------------------- 56 1. 59 - - - - - - - - - - 15 1 . 61 - -
Shank tackers ---------- ------------------------------- 128 1 . 60 . _ 47 1. 51 - - 7 1 .4 3 19 1.7 0 40 1 . 6 6 7 2 . 08Men ------------------------------------------------------- 96 1 .6 2 - - 36 1. 52 - - - - 16 1 .7 5 26 1. 70 6 1.99W om en ------------------------------------------------- 32 1. 57 * - 11 1. 47 “ - " ■ 14 1 . 6 0
“ "
See footnotes at end of table,
Digitized for FRASER http://fraser.stlouisfed.org/ Federal Reserve Bank of St. Louis

(Num ber and average straight-tim e hourly earnings 1 of w orkers in selected occupations, United States and selected regions, A pril 1962)
Table 20. Occupational Earnings: Women’s Cement-Process (Conventional-Lasted) Shoes, All Establishments—Continued
Departm ent, occupation, and sex
United States 2 New England Middle Atlantic B order States Southwest Great Lakes Middle W est Pacific
Numberof
workers
Averagehourly
earnings
Numberof
workers
Averagehourly
earnings
Numberof
workers
Averagehourly
earnings
Numberof
workers
Averagehourly
earnings
Numberof
w orkers
Averagehourly
earnings
Numberof
workers
A veragehourly
earnings
Numberof
w orkers
Averagehourly
earnings
Numberof
workers
Averagehourly
earnings
Bottoming and making— ContinuedSole attachers, cem ent p ro ce ss _____ 871 $ 2 . 10 391 $ 2 . 38 139 $ 2 . 0 1 39 $ 1 .4 9 26 $ 1. 54 133 $ 1 . 82 99 $ 1. 96 12 $ 2 . 33
Men ____________________________________ 710 2 . 21 343 2 .4 6 103 2 . 2 0 37 1. 51 17 1. 57 76 2 . 0 2 91 1. 99 11 2. 41Women -------------------------------------------------- 161 1 . 60 48 1.8 0 36 1. 45 _ _ 9 1. 50 _ _ 8 1 . 62
W ood-h eel seat fitte rs , hand(28 m en, 1 woman) ----------------------------- 29 2 . 12 13 2 . 2 2 - _ _ _ _ _ _ _ 8 1 . 89
W ood-h eel seat fitte rs , machine(127 m en, 4 women) _________________ 131 2. 23 65 2. 42 - _ 7 2 . 12 _ . 29 2. 05 15 1. 93
Fin ish in g:Bottom scou rers ------------------ --------------- 291 2 . 0 1 43 2 . 0 9 95 2 . 16 15 1. 85 7 1 . 16 49 2 . 10 59 1 . 81 _ _
Men ------------------------------------------------------- 255 2 . 09 42 2 . 11 83 2 . 26 15 1 .8 5 _ _ 48 2 . 12 44 1. 87 .Women -------------------------------------------------- 36 1. 44 _ - 12 1. 41 - _ _ _ _ _ 15 1 . 61 _ _
Edge setters (409 m en,9 women) ------------------------------------------------ 418 2. 51 183 2 . 81 74 2. 67 18 1 .9 6 _ _ 73 2. 07 58 2 . 1 2 6 2 . 91
R epairers _________ _____________________ 2, 183 1. 43 1, 239 1 . 39 332 1 . 62 49 1 .4 7 45 1. 27 181 1. 48 235 1. 38 57 1. 54Men ____________________________________ 109 2. 27 - - 92 2. 44 - _ - _ _ _ _ _ _ _Women _________________________________ 2, 074 1 . 39 1, 231 1 . 39 240 1. 31 49 1.4 7 40 1 . 29 179 1 .4 9 234 1. 38 56 1. 54
T re e rs ------------------------------------------------------- 1, 596 1. 84 677 2. 25 199 1. 57 6 6 1 .4 0 71 1. 31 252 1 . 62 258 1. 56 6 1.6 3Men ------------------- -------------------------------- 854 2 . 18 616 2. 30 85 1. 98 - - _ _ 76 1. 87 48 2 . 0 2 _ _W omen -------------------------------------------------- 742 1. 45 61 1 .7 8 114 1. 27 54 1. 37 58 1. 34 176 1. 51 2 1 0 1. 46 _ _
M isc ella n e o u s:F loor boys (or g irls) __________________ 1, 232 1. 36 581 1. 37 181 1. 33 41 1. 29 56 1 . 2 0 166 1 .4 2 154 1. 37 6 1 .4 8
Men ____________________ ______________ 479 1. 33 2 2 2 1. 30 109 1. 32 _ _ 24 1. 19 37 1 .5 4 61 1. 36 _ _Women ------------------------- --------------------- 753 1. 38 359 1.41 72 1. 34 36 1 .2 9 32 1 . 21 129 1. 39 93 1. 37 _ _
Inspectors (crow n ers) _________________ 1, 172 1. 44 345 1 .4 4 237 1. 42 56 1 .4 0 54 1. 34 207 1. 51 208 1. 42 18 1 . 59Men ------------------------------------------------------- 338 1 . 59 1 2 0 1. 57 85 1. 63 - - 10 1. 41 36 1. 72 64 1. 54 _W omen -------------------------------------------------- 834 1. 38 225 1. 38 152 1. 30 53 1 .4 0 44 1. 33 171 1 .4 7 144 1. 36 16 1. 56
Janitors (427 m en, 21 women) ----------- 448 1 . 28 154 1. 23 91 1. 29 27 1 . 2 0 12 1. 17 64 1 .4 5 75 1 . 2 2 7 1 .4 4M echanics, m aintenance (all men) — 275 2 . 12 51 2 . 61 56 2. 15 17 1. 95 15 1. 76 69 2 . 0 2 55 1. 87
'-
1 Excludes prem ium pay for overtim e and for work on weekends, holidays, and late shifts.2 Includes data for regions in addition to those shown separately.
N O T E : D ashes indicate no data reported or data that do not meet publication criteria .
vO
Digitized for FRASER http://fraser.stlouisfed.org/ Federal Reserve Bank of St. Louis

Table 21. Occupational Earnings: W om en’s Cement-Process (Conventional-Lasted) Shoes, by Size o f Establishment
(Number and average straight-time hourly earnings 1 of workers in selected occupations, United States and selected regions, April 1962)
ooo
Sex, departm ent, and occupation
Men
Cutting:C utters, cloth lining,
machine _________________________C utters, leather lining,
m achine --------------------------------------C utters, vamp and whole
sh oe, hand ______________________C utters, vam p and whole
shoe, m achine _________________Lasting:
A sse m b le rs for pullover,m achine _________________________
B ed-m achine operators ________H e e l-se a t la ste rs ------------------------P ullover-m achin e
operators _______________________Side la s te r s , machine ---------------Toe la s te r s , autom atic or
sem iautom atic _________________Bottoming and making:
Edge trim m ers ---------------------------H eel attachers,
machine _________________________Rough rounders _________________Sole attachers, cement
process __________________________W ood-h eel seat fitte rs ,
machine _________________________Finishing:
Bottom scou rers ________________Edge setters _____________________T re e rs --------------------------------------------
M iscellaneous:F lo or boys ------------------------------------Inspectors (crow ners) __________Janitors ___________________________M ech anics, maintenance ______
W om en
Cutting:C u tters, cloth lining,
m achine ------------------------C utters, leather lining,
machineC u tters, vam p and whole
sh oe, machine ---------------------------
United States 2 New England Middle Atlantic Great Lakes Middle W est
Establishm ents with
5 0 -2 4 9w orkers
250 or m ore workers
50 -249workers
250 or m ore workers
5 0 -2 49w orkers
250 or m ore workers
250 or m ore w orkers
50 -2 49w orkers
250 or m ore w orkers
Num ber Average Number Average Number Average Number Average Number Average Number Average Number A verage Number A verage Number Averageof hourly of hourly of hourly of hourly of hourly of hourly of hourly of hourly of hourly
w orkers earnings w orkers earnings w orkers earnings w orkers earnings w orkers earnings w orkers earnings w orkers earnings w orkers earnings workers earnings
84 $2 . 13 233 $2. 30 49 $ 2 . 39 109 $2. 54 12 $2. 05 31 $2. 07 30 $2. 24 2 2 $2. 25
94 2 . 18 227 2 . 12 41 2. 37 118 2 .4 2 26 2 . 18 19 2. 30 17 1 . 59 53 1.78
151 2 . 8 8 267 2. 36 - - 17 2. 38 117 3. 06 72 2 .4 0 36 2 . 2 0 126 2 .4 3
299 2. 53 1, 588 2. 36 242 2 . 6 6 872 2 . 61 16 2. 05 199 1. 95 190 2. 30 133 1. 97
136 2 .4 1 658 2. 19 57 2. 70 285 2. 54 . _ 91 1 .8 7 99 2. 17 11 $1. 79 97 2 . 10
161 2. 83 870 2 .4 3 89 3. 14 424 2. 71 39 2 .4 0 104 2 . 10 115 2. 29 - - 143 2. 2774 2. 27 340 1.97 35 2 .4 6 136 2 . 2 2 2 0 2. 51 6 8 1 .8 4 51 2 . 0 0 - 45 1.63
137 2. 77 625 2. 51 77 3. 08 259 2. 92 29 2 . 6 6 107 2. 14 99 2. 30 9 2. 53 82 2. 51204 2. 73 926 2. 37 99 3. 20 414 2. 76 44 2. 90 145 2. 03 147 2 . 16 15 1. 90 107 2 . 21
1 2 1 2. 31 6 6 1 2 . 19 77 2. 73 217 2 . 8 8 8 1 .91 179 1 .8 9 8 6 1 .8 5 - - 90 1. 93
130 2. 56 657 2 .4 6 53 2. 83 280 2 . 8 8 37 2. 72 75 2. 24 106 2 . 0 9 10 2. 17 1 1 0 2 . 26
71 2. 24 226 1 . 8 8 25 2. 03 46 2 . 19 34 2 .4 0 74 1.71 50 1. 93 . - 28 1.7423 1 . 9 6 103 1 .7 2 - “ - - 7 1.91 - - 31 1 .7 8 7 1 .4 9 37 1.8 2
119 2. 37 591 2 . 18 6 8 2. 34 27 5 2 .4 9 25 3. 09 78 1. 92 74 2 . 0 1 7 1 . 6 8 84 2 . 01
27 2 .4 3 1 0 0 2 . 21 13 2 .7 5 52 2. 34 - - - - 27 2 . 10 - - 11 1. 98
61 2 .4 8 194 1.97 11 2 . 11 31 2 . 11 35 2. 71 48 1. 93 44 2 . 16 - - 40 1 .8787 2. 85 322 2 .4 4 37 2 .9 6 146 2. 77 31 3. 06 41 2 .4 4 65 2. 07 - - 50 2. 17
169 2 .0 4 685 2 . 2 2 109 2. 05 507 2. 36 47 2 . 18 38 1 .7 2 76 1. 87 - - 45 2. 03
108 1. 31 371 1 .3 3 40 1 . 29 182 1. 30 45 1. 33 64 1.31 37 1. 54 - - 44 1. 3757 1 .7 4 281 1. 55 12 1. 57 108 1. 57 32 1 .8 9 53 1 .4 8 32 1 .7 1 7 1 . 26 57 1. 5785 1 . 28 342 1 .2 8 34 1 . 2 2 119 1 .2 3 25 1 . 39 56 1. 27 59 1 .4 6 6 1 . 2 0 61 1.2 337 2. 30 238 2 . 0 9 10 2. 70 41 2 . 59 53 2 . 12 65 2 . 0 2 7 1 . 8 6 48 1. 87
17 1. 27 103 1 .6 5 21 1 .6 9 6 1 .7 9 51 1.6 1 14 1.7 0
18 1 . 62 180 1 .7 2 - 18 1 .9 2 - - - 83 1 .6 2 - - 48 1 .8 3
72 1. 53 409 1 .8 0 61 1 .9 9 97 1 .7 2 109 1 .7 9 17 1. 53 82 1.8 2
See footnotes at end of table
Digitized for FRASER http://fraser.stlouisfed.org/ Federal Reserve Bank of St. Louis

Table 21. Occupational Earnings: W om en’s Cement-Process (Conventional-Lasted) Shoes, by Size o f Establishment— Continued
(Number and average straight-time hourly earnings 1 of workers in selected occupations, United States and selected regions, April 1962)
Sex, departm ent, and occupation
ontinued
F itting:Fancy stitchers ---------------------------P a ste rs , b ack ers, or fitte rs ,
upper, hand ____________________Top stitchers -------------------------------V am pers __________________________
Lasting:A sse m b le rs for pullover,
m achine _________________________Bottoming and making:
Bottom fille rs ___________________Sole attach ers, cem ent
p roce ss __________________________Finishing:
R epairers _________________________
M iscellan eou s:F lo or g irls -----------------------------------Inspectors (crow ners) __________
United States 2 New England Middle Atlantic Great Lakes Middle W est
Establishm ents with—
50 -2 49w orkers
250 or m ore workers
50 -2 4 9workers
250 or m ore w orkers
50 -2 49w orkers
250 or m ore workers
250 or m ore w orkers
50 -2 49w orkers
250 or m ore workers
Number Average Number Average Number Average Number A verage Number Average Number Averagel Number Average Number A verage Numbe r Averageof hourly of hourly of hourly of hourly of hourly of hourly of hourly of hourly of hourly
w orkers earnings workers earnings workers earnings w orkers earnings w orkers earnings w orkers earnings w orkers earnings w orkers earnings workers earnings
559 $ 1 .6 3 2 ,9 1 4 $1. 56 319 $ 1 .7 4 1 , 106 $ 1 .7 6 519 $ 1 .4 0 517 $1. 53 49 $1 . 57 488 $ 1 .4 4
540 1 .4 3 1,941 1.41 251 1 .4 0 857 1.41 152 $1. 52 316 1. 37 274 1 .4 7 29 1. 51 286 1.44287 1 .8 4 1 ,5 88 1.69 186 1 .9 9 764 1 .9 1 - - 189 1. 56 228 1 .4 5 16 1 .7 3 242 1. 53115 1 . 6 6 678 1. 51 72 1.71 217 1 . 80 “ 263 1. 32 97 1. 51 7 1 .8 4 27 1. 38
38 2. 19 108 1. 84 23 2. 65 44 2 . 11 - 27 1 .6 2 11 1 .9 5 7 2 . 12
16 2. 13 1 01 1. 57 - - 12 1 .9 5 - 28 1 .4 0 29 1 . 59 17 1. 56
26 1. 57 135 1 . 60 16 1 .7 0 32 1. 85 - - 36 1 .4 5 - - - -
369 1 .4 5 1 ,7 05 1. 38 253 1 .4 3 978 1. 38 2 0 1 . 62 2 2 0 1 .2 8 165 1 .4 9 _ _ •207 1. 3675 1 .4 6 667 1.45 - - 53 1 .7 4 - - 109 1. 27 156 1. 52 - - 193 1 .46
106 1. 37 647 1 . 38 59 1 .3 9 300 1.4 1 15 1 .4 5 57 1. 31 123 1 . 39 7 1. 36 8 6 1. 37144 1. 31 6 9 0 1.40 54 1.3 1 171 1 .4 0 2 0 1.3 1 132 1. 30 155 1 .4 8 14 1. 33 130 1. 37
1 Excludes prem ium pay for overtim e and for work on weekends, holidays, and late sh ifts.2 Includes data for regions in addition to those shown separately.
N O T E : Dashes indicate no data reported or data that do not meet publication criteria .
Digitized for FRASER http://fraser.stlouisfed.org/ Federal Reserve Bank of St. Louis

(Num ber and average stra ight-tim e hourly earnings 1 of w orkers in selected occupations, United States and selected regions, A pril 1962)
Table 22. Occupational Earnings: W omen’s Cement-Process (Conventional-Lasted) Shoes, by Size o f Community COto
United States New England Middle Atlantic Southwest Great Lakes Middle W est PacificM e tro - N onm etro- M etro- Nonm etro- M e tro - N onm etro N onm etro M e tro N onm etro M etro N onm etro M etro politan politan politan politan politan politan politan politan politan politan politan politan
Sex, departm ent, and occupation areas ar sas areas areas areas areas areas areas areas areas areas areasN u m - A v e r - N u m - A v e r- Num - A v e r- N um - A ver- N um - A v e r Num A v e r Num A v e r N um A v e r Num A v e r N u m A v e r Num A v e r Num A v e r
ber age ber age ber age ber age ber age ber age ber age ber age ber age ber age ber age ber ageof hourly of hourly of hourly of hourly of hourly of hourly of hourly of hourly of hourly of hourly of hourly of hourly
w ork- ea rn - w ork- earn- w ork- earn - w ork- earn- w ork- earn w ork earn w ork earn w ork earn wo rk- earn w ork earn w ork earn w ork earners ings ers ings ers ings ers ings ers ings ers ings ers ings ers ings ers ings ers ings ers ings ers ings
Men
Cutting:Cutters, cloth lining,
machine -------------------------------------- 165 $ 2. 35 152 $ 2 . 16 109 $ 2 . 59 49 $ 2 .2 9 28 $ 1. 97 15 $ 2 . 2 2 14 $ 1. 97 31 $ 2 . 24 19 $ 2 . 2 2Cutters, leather lining,
machine -------------------------------------- 167 2. 35 154 1. 91 114 2. 36 45 2. 52 41 2 . 28 21 1. 57 10 $ 2 . 54 56 1. 59Cutters, vamp and whole
shoe, hand --------------------------- — 308 2. 76 1 1 0 1. 95 19 2. 31 165 2. 94 23 2. 14 74 2. 78 54 1 . 9 2 10 $ 2 . 30C utters, vamp and whole
shoe, machine _________________ 897 2. 57 990 2 . 2 2 670 2 .6 9 444 2. 51 1 1 0 2 . 08 105 1. 83 45 2. 24 30 $ 2 . 06 172 2 . 29 17 3. 05 128 1. 84 34 2 . 49L asting:
A sse m b le rs for pullover, m achine -------------------------------------- 363 2. 48 431 2 . 01 198 2. 73 144 2. 34 99 2. 13 32 1. 92 31 1. 36 13 2. 41 92 2 . 16 2 2 2. 75 8 6 1. 90 13 2. 33
B ed-m ach ine operators ________ 407 2 . 69 624 2. 36 252 2 .9 3 261 2. 65 80 2 . 28 63 2. 05 42 1. 78 16 2. 31 107 2. 27 26 2. 97 131 2. 17 _ _H e e l-se a t la sters _______________ 193 2 . 16 2 2 1 1. 91 99 2. 31 72 2 . 21 6 6 2. 04 2 2 1. 85 15 1. 57 6 2 . 06 49 1 .9 6 6 2 . 01 43 1 .6 2 6 2. 30Pullover -m achine
operators _______________________ 322 2. 87 440 2. 33 182 3. 20 154 2. 67 8 6 2 . 39 50 2 . 0 2 30 1 .6 4 10 ■ 2. 41 91 2. 30 21 2. 78 70 2. 43 6 2. 84Side la ste rs , m achine --------------- 516 2 . 69 614 2 . 21 308 2. 93 205 2. 73 1 2 1 2 . 39 6 8 1. 96 46 1 .6 0 2 2 2. 52 137 2 . 1 2 25 2. 76 97 2. 03 8 2. 44Toe la ste rs , autom atic or
sem iautom atic --------------------------- 330 2 . 61 452 1. 92 171 3. 04 123 2. 56 119 2. 03 26 1. 27 8 6 1. 77 79 1. 74 7 2 . 21Bottom ing and m akin g:
Edge trim m ers ---------------------------- 353 2. 72 434 2. 27 194 2. 94 139 2. 78 79 2 . 49 33 2. 24 28 1. 87 18 2 . 39 98 2. 04 29 2. 84 91 2 . 06 7 2. 52Heel attachers, m achine --------- 139 2. 17 158 1. 78 46 2 . 19 25 2. 03 65 2 . 19 43 1. 53 6 1. 77 - - 41 1 . 9 0 8 1 . 86 25 1. 69 7 2. 33Sole attachers, cem ent
p roce ss --------------------------- --------- 341 2 . 39 369 2. 05 194 2 . 59 149 2 . 28 83 2 . 2 2 2 0 2 . 11 17 1. 57 10 2. 40 6 6 1 . 9 6 15 2. 45 76 1 . 9 0 11 2. 41W ood-h eel seat fitters,
m achine -------------------------------------- 6 6 2. 44 61 2. 05 39 2. 52 26 2. 27 _ . . _ . 8 2. 50 19 1 .9 3 _ _ 9 1 .7 6 6 1 . 8 8F in ishin g:
Bottom scou rers ------------------------- 105 2. 41 150 1. 87 23 2. 17 19 2. 04 46 2. 67 37 1. 76 10 2 . 21 38 2 .0 9 12 2 . 20 32 1 .7 5 7 2 . 81Edge setters -------------------------------- 230 2. 73 179 2 . 26 128 2. 76 55 2. 94 50 2. 94 2 2 2 . 19 - - 2 0 2. 30 51 2 . 0 1 15 3. 00 38 1 .7 8 6 2 . 91T re ers -------------------------------------------- 493 2 . 28 361 2. 05 372 2. 36 244 2 . 2 2 71 2 . 10 - - - - - - 6 8 1 . 82 30 2 . 01 18 2. 04 - -
M iscellaneous :F lo or boys ------------------------------------Inspectors (crow ners) ---------------
2 2 0194
1. 34 1. 69
259144
1. 32 1. 45
11991
1. 32 1.6 3
10329
1. 27 1. 37
7876
1. 36 1 .6 5
- - 2410
1. 19 1.41 10 2. 17
3526
1. 56 1. 55
812
1. 382. 05
5352
1. 36 1 .4 2
- -
Janitors ----------------------------------------- 215 1. 27 2 1 2 1. 30 91 1 .2 4 62 1 . 21 64 1. 31 17 1. 30 11 1. 17 _ - 55 1 .4 6 19 1. 25 48 1 . 2 2 7 1 .4 4M echanics, maintenance --------- 8 8 2. 38 187 2 . 0 0 27 2. 50 24 2. 74 30 2 . 39 26 1. 91 15 1. 76 “ 63 2 . 0 1 8 2. 33 47 1. 79 ” ■
Women
Cutting:Cutters, leather lining,
m achine -------------------------------------- 32 2. 15 166 1 . 62 11 2. 05 12 1. 31 77 1 . 59 14 2. 52 38 1. 51Cutters, vamp and whole
shoe, m achine -------------------------- 104 1. 83 377 1. 74 9 2. 36 55 1. 93 74 1 .6 9 30 1. 77 36 1. 40 - - 115 1 . 79 - - 94 1. 74 - -
See footnotes at end of table.
Digitized for FRASER http://fraser.stlouisfed.org/ Federal Reserve Bank of St. Louis

(Num ber and average straight-tim e hourly earnings 1 of w orkers in selected occupations, United States and selected regions, A pril 1962)
Table 22. Occupational Earnings: W om en’s Cement-Process (Conventional-Lasted) Shoes, by Size o f Community-----Continued
United States New England Middle Atlantic Southwest Great Lakes Middle W est PacificM etro- Nonm etro- M etro- N onm etro- M etro - N onm etro N onm etro M e tro N onm etro M e tro Nonm etro M etropolitan politan politan politan politan politan politan politan politan politan politan politan
Sex, departm ent, and occupation areas areas areas areas areas areas areas areas areas areas areas areasN um - A v e r- Num - A v e r- Num- A v e r - Num - A v e r - N um - A v e r N um A v e r Num A v e r Num A v e r Num A v e r Num A v e r Num A v er Num A ver
ber age ber age ber age ber age ber age ber age ber age ber age ber age ber age ber age ber ageof hourly of hourly of hourly of hourly of hourly of hourly of hourly of hourly of hourly of hourly of hourly of hourly
w ork- earn- w ork- earn- work- ea rn - w ork- earn - w ork- earn w ork earn w ork earn w ork earn w ork earn w ork earn w ork earn work earners ings ers ings ers ings ers ings ers ings ers ings ers ings ers ings ers ings ers ings ers ings ers ings
Women— Continued
Fitting:$ 1. 73 $ 1 .4 5 $ 1. 39 $ 1. 30 $ 1. 63 $ 1. 50 $ 1 . 6 8 $ 1. 40Fancy stitchers --------------------------- 1, 430 $ 1 . 6 8 2, 043 $ 1. 50 856 $ 1 .7 7 569 2 1 1 374 72 118 417 1 0 1 436 58 $ 1 . 80
P asters, backers, or fitters,upper, hand ------------------------------- 1, 189 1 .4 6 1, 292 1. 38 700 1 .4 5 408 1. 35 261 1. 50 207 1. 32 94 1. 34 50 1. 57 256 1 .4 3 6 6 1. 49 249 1.4 3 60 1. 47
Top stitchers ------------------------------- 776 1. 84 1, 099 1 . 62 510 1 .9 5 440 1 . 89 1 0 0 1 .6 5 1 2 0 1. 47 28 1 .2 8 35 1 . 49 205 1 .4 4 53 1. 78 205 1 .4 8 25 1 . 8 6Vam pers __________________________ 360 1 . 56 433 1. 52 141 1 .7 9 148 1. 77 180 1. 38 - - - - - - 1 0 0 1. 48 7 1. 56 27 1.4 6 - -
Bottoming and m akin g:Bottom fille rs ----------------------------- 42 1 .6 5 75 1. 65 16 1 . 8 8 - - 12 1. 39 19 1. 40 9 2. 54 - - 24 1 .5 5 - - 14 1. 53 - -
F in ishin g:R epairers -------------------------------------- 933 1 .4 5 1, 141 1. 34 655 1 .4 5 576 1. 31 105 1. 35 - - 40 1 . 29 27 1 . 80 152 1 .4 3 52 1. 42 182 1. 37 56 1. 54T re ers _____________________________ 206 1. 50 536 1. 43 45 1 .7 4 16 1 . 8 8 78 1. 29 36 1 . 2 2 58 1. 34 38 1 . 61 138 1 .4 8 15 2. 03 195 1. 42 - -
M iscellaneous :Floor g ir ls ----------------------------------- 290 1 .4 4 463 1. 34 179 1.47 180 1. 35 47 1. 37 25 1. 29 32 1 . 21 24 1. 34 105 1 .4 0 2 0 1. 53 73 ' 1. 33 - _Inspectors (crow ners) --------------- 327 1. 35 507 1. 40 136 1. 38 89 1. 37 8 8 1. 25 64 1. 38 44 1. 33 30 1. 43 141 1 .4 8 24 1. 29 1 2 0 1. 30 16 1. 56
1 Excludes prem ium pay for overtim e and for work on weekends, holidays, and late shifts.2 Includes data for regions in addition to those shown separately.
N O T E : D ashes indicate no data reported or data that do not m eet publication criteria .
0 00 0
Digitized for FRASER http://fraser.stlouisfed.org/ Federal Reserve Bank of St. Louis

(Number and average straight-tim e hourly ea rn in g s1 of w orkers in selected occupations, United States and New England, A pril 1962)
Table 23. Occupational Earnings: W om en ’s Cement-Process (Conventional-Lasted) Shoes,by Size o f Establishment and Size o f Community
Sex, departm ent, occupation, and com m unity size
United States 2 New England
Establishm ents with—
50-249workers
250 or m ore w orkers
50 -2 49w orkers
250 or m ore w orkers
Numberof
w orkers
Averagehourly
earnings
Numberof
workers
Averagehourly
earnings
Numberof
w orkers
Averagehourly
earnings
Numberof
w orkers
Averagehourly
earnings
Men
Cutting;C utters, cloth lining, m achine;
M etropolitan areas _________________________ 65 $ 2.14 1 0 0 $ 2 .4 8 37 $ 2.47 72 $ 2 . 6 6N onm etropolitan areas ____________________ 19 2.09 133 2.17 - _ 37 2.31
C utters, leather lining, machine;M etropolitan areas ____________________ __ 59 2.29 108 2.38 31 2.38 83 2.36Nonm etropolitan areas ____________________ 35 1.99 119 1 . 8 8 - - 35 2.56
C utters, vamp and whole shoe, machine;M etropolitan areas _____ _________________ 216 2.60 681 2.56 180 2.70 490 2.69Nonm etropolitan areas _______________ __ 83 2.35 907 2 . 2 0 62 2.52 382 2.51
Lasting:A sse m b le rs for pullover, machine;
M etropolitan areas _____ _____ __ ______ 103 2.59 260 2.44 47 2.82 151 2.69Nonm etropolitan areas ____ __ _____ __ 33 1 . 8 6 398 2.03 10 2 . 1 2 134 2.36
B ed-m achine operators;M etropolitan areas 107 2.99 300 2.58 67 3.27 185 2.80Nonm etropolitan areas ____________________ 54 2.52 570 2.35 2 2 2.75 239 2.64
H e e l-se a t la ste rs ;M etropolitan areas _________________________ 51 2.38 142 2.07 27 2.49 72 2.24Nonm etropolitan areas _ _ 23 2 . 0 2 1 9 8 1.89 8 2.34 64 2.19
P u llover-m ach in e operators:M etropolitan areas __ __ _____ __ __ 83 3.10 239 2.79 54 3.34 128 3.14Nonm etropolitan areas ________ _____ __ 54 2.25 386 2.34 23 2.49 131 2.71
Side la s te r s , m achine;M etropolitan areas 136 3.01 3 80 2.58 79 3.19 229 2.84Nonm etropolitan areas 6 8 2.18 546 2 . 2 2 - - 185 2.67
Toe la s te r s , autom atic or sem iautom atic;M etropolitan areas ________________ ______ 71 2.54 259 2.63 52 2.85 119 3.13Nonm etropolitan areas _ _____ _____ __ 50 1.97 402 1.91 - - 98 2.58
Bottom ing and making:Edge trim m e rs :
M etropolitan areas _________________________ 85 2.75 268 2.71 41 2 . 8 6 153 2.96Nonm etropolitan areas _ _________ __ __ 45 2.19 389 2.28 - - 127 2.78
H eel attachers, m achine:M etropolitan areas _____ _____ __________ 49 2.42 90 2.04 17 2.14 29 2 . 2 1N onm etropolitan areas ____ _____ __ __ 2 2 1.84 136 1.77 8 1.79 17 2.15
Sole attachers, cement p ro ce ss :M etropolitan areas _____________ __________ 8 6 2.58 255 2.33 52 2.48 142 2.63N onm etropolitan areas _ _____ _____ __ 33 1.83 336 2.07 16 1 . 8 8 133 2.33
Finishing:Bottom sco u re rs:
M etropolitan areas 38 2.80 67 2.19 18 2.23N onm etropolitan areas ____________________ 23 1.97 127 1 . 8 6 - - 13 1.95
Edge setters :M etropolitan areas _________ _____ ______ 63 3.15 167 2.57 30 3.08 98 2 . 6 6N onm etropolitan areas ____________ __ __ 24 2.06 155 2.30 - - 48 3.01
T r e e r s :M etropolitan areas _____ _________ __ __ 139 2.13 3 54 2.34 8 8 2 . 1 2 284 2.43Nonm etropolitan areas 30 1 . 6 6 331 2.09 223 2.26
See footnotes at end of table.
Digitized for FRASER http://fraser.stlouisfed.org/ Federal Reserve Bank of St. Louis

Table 23. Occupational Earnings: W om en’s Cement-Process (Conventional-Lasted) Shoes,by Size o f Establishment and Size o f Community— Continued
(Number and average straight-tim e hourly ea rn in g s1 of w orkers in selected occupations, United States and New England, A pril 1962)
United States 2 New England
Sex, departm ent, occupation, and community size
Establishm ents with—
50-2 49w orkers
250 or m ore w orkers
50 -2 49w orkers
250 or m ore w orkers
Numberof
w orkers
A veragehourly
earnings
Numberof
w orkers
A veragehourly
earnings
Numberof
w orkers
Averagehourly
earnings
Numberof
w orkers
Averagehourly
earnings
Men— Continued
M iscellaneous:F loor boys:
M etropolitan areas ------------------------- __ ----- 81 $ 1.32 139 $ 1.35 32 $ 1.32 87 $ 1.33N onm etropolitan areas ------------------ ---------- 27 1.27 232 1.32 - - 95 1.28
Inspectors (crow n ers):M etropolitan areas _________________________ 46 1.83 148 1.65 11 1.58 80 1.64N onm etropolitan areas ___________ _______ 11 1.38 133 1.45 - - 28 1.36
Janitors:M etropolitan areas _____ _________ _______ 62 1.32 153 1.25 26 1.23 65 1.25Nonm etropolitan areas ___________________ 23 1.18 189 1.31 8 1 . 2 0 54 1 . 2 1
M ech anics, maintenance:M etropolitan areas _____ _________ _______ 17 2 . 6 8 71 2.31 8 2.60 19 2.46Nonm etropolitan areas _____________________ 2 0 1.98 167 2 . 0 0 - “ 2 2 2.71
Women
Cutting:C utters, vam p and whole shoe, machine;
M etropolitan areas __ ------------- __ __ __ 17 1.80 87 1.83 6 2.49N onm etropolitan areas ------ ------------- ----- 55 1.44 322 1.79 55 1.93
Fitting;Fancy stitch ers:
M etropolitan areas _____ __ _____ __ __ 320 1.72 1 , 1 1 0 1.67 256 1.74 600 1.79Nonm etropolitan areas _ ____________ __ 239 1.51 1, 804 1.50 63 1.77 506 1.72
P a ste rs , back ers, or fitters,upper, hand:
M etropolitan areas _________ __ __ _______ 388 1.47 801 1.46 237 1.39 463 1.48Nonm etropolitan areas _____________________ 152 1.34 1, 140 1.38 - - 394 1.34
Top stitch ers:M etropolitan areas ____________________ __ 157 1.98 619 1.81 132 1.99 378 1.94N onm etropolitan areas _____________________ 130 1.67 969 1.61 54 1.99 3 8 6 1 . 8 8
V am p ers:M etropolitan areas _____ ____________ __ 60 1.82 300 1.51 49 1.81 92 1.78N onm etropolitan areas ___________ _____ 55 1.49 378 1.52 23 1.51 125 1.82
Finishing:R e p airers:
M etropolitan areas _____ _____ __________ 253 1.50 680 1.43 194 1.47 461 1.44Nonm etropolitan areas _ __ _____ __ — 1 1 6 1.34 1, 025 1.34 59 1.30 517 1.32
T r e e r s :M etropolitan areas __ _____ „ __ __ ___ 23 1.69 183 1.48 - - 37 1 . 6 8N onm etropolitan areas ________ __ -------- 52 1.34 484 1.44 16 1 . 8 8
M iscellaneous:Floor g ir ls :
M etropolitan areas _________________________ 59 1.43 231 1.44 38 1.44 141 1.47Nonm etropolitan areas _____________________ 47 1.29 416 1.34 21 1.28 159 1.35
Inspectors (crow n ers):M etropolitan areas ____________ _____ ___ 71 1.37 256 1.34 38 1.37 98 1.39Nonm etropolitan areas _____________________ 73 1.25 434 1.43 73 1.41
1 Excludes prem ium pay for overtim e and for work on weekends, holidays, and late shifts.2 Includes data for regions in addition to New England.
N O TE ; Dashes indicate no data reported or data that do not m eet publication criteria . 0 0O i
Digitized for FRASER http://fraser.stlouisfed.org/ Federal Reserve Bank of St. Louis

Table 24. Occupational Earnings: W om en’s Cement-Process (Conventional-Lasted) Shoes, Auburn—Lewiston, Maine
(Number and average straight-time hourly earnings 1 of production workers in selected occupations, April 1962)
00Os
Numberof
w orkers
Average hourly
earn ings1
2, 613 $ 1 . 6 61, 076 1. 831, 537 1. 55
11 2 . 2 0
16 2. 07
96 2 . 28
24 2. 3347 2 . 1612 1. 56
17 2. 4342 2. 25
25 2 . 10
2 0 2. 24
26 1 .9 746 1 .9 2
11 1 . 282 0 1. 30
7 1 . 21
164 1. 59
50 1. 518 8 1. 7717 1 . 6 8
70 1 .4 427 1. 3443 1. 50
31 1 .4 228 1. 31
Sex, department, and occupation
Number of w orkers receiving stra ight-tim e hourly earnings of—
Under$ 1.10
$ 1.10and
under$ 1.20
$ 1 . 2 0 $1 .30$ 1 ,40 $1,50 $1,60
$1 .30$ 1.4 0$1 .50$ 1.60
$1 .70$ 1 .8 0 $ 1 .9 0 $ 2 .0 0
| $1.70$1 .80$1.90$2 .00$2.10
$2.10$2.20$2.30$2.40|$2.50j$2.60f$2.70$.
$ 2 .20$2.30|$2.40
>2.80 $2.90 $3.00 $3.10 $3.20 $3.30
$ 2 .50|$2.60|$2.70|$2.80|$2.90$3.00$3 .10$3.20$3 .30$3.40
$3.40
$3.50
$3.50and
over
A ll production w orkers _________Men ---------------------------------------------Women ---------------------------------------
Selected occupations
Men
Cutting : 2 b/Cutters, cloth lining,
m achine ______________________Cutters, leather lining,
m achine ----------------------------------Cutters, vamp and whole
shoe, machine ______________Lasting : 2 b/
A ssem b lers for pullover,m achine ----------------------------------
B ed-m achine operators _____H e e l-se a t la sters -------------------P ullover-m achin e
operators -------------------------------Side la ste rs , m achine -----------
Bottoming and making : 2 b /Edge trim m ers — ................... —Sole attachers, cem ent
p rocess -----------------------------------Finishing : 2 b/
Edge setters ------------- --------------T re ers ---------------------------------------
Other:Floor boys 2 a / — ---------------------Inspectors (crow ners) 2 b / — Janitors 2 a/ -----------------------------
Women
Fitting : 2 b /Fancy stitchers ----------------------P asters , backers, or fitters,
upper, hand --------------------------Top stitchers --------------------------Vam pers -----------------------------------
F in ishin g:R epairers ----------------------------------
Tim e ------------------------------------Incentive -----------------------------
O th er : 2 a /F loor g irls -------------------------------Inspectors (crow ners) .............
21687
129
499151348
29463
231
23172
159
16245
117
1207248
1026339
Excludes premium pay for overtime and for work on weekends, holidays, and late shifts.Insufficient data to warrant presentation of separate averages by method of wage payment; (a) all or predominantly timeworkers, and (b) all or predominantly incentive workers.
Digitized for FRASER http://fraser.stlouisfed.org/ Federal Reserve Bank of St. Louis

(Number and average straight-tim e hourly earnings 1 of production w orkers in selected occupations, A pril 1962)
Table 25. Occupational Earnings: W om en’s Cement-Process (Conventional-Lasted) Shoes, Maine (Except Auburn—Lewiston)
Sex, departm ent, and occupationNum ber
ofw orkers
Average hourly
earnings 1
Number of w orkers receiving straight--tim e hourly earnings; of—
Under $ 1 . 10
$ 1 . 1 0and
under$ 1 . 2 0
$ 1 . 2 0
$1.30
$ T 3 o
$1 .40
$ 1.40
$1.50
$1.50
$1.60
$1.60
$1.70
$1.70
$1.80
$1.80
$1.90
$1.90
$ 2 . 0 0
$ 2 . 0 0
$ 2 . 1 0
$ 2 . 1 0
$ 2 . 2 0
$2 . 2 0
$2.30
$2 .30
$2 .40
$2.40
$2.50
$2.50
$2.60
$ 2 . 6 0
$2.70
$2.70
$2.80
$2.80
$ 2 . 9 0
$ 2 . 9 0
$3.00
$3.00
$3.10
$3.10
$3.20
$3720
$3.30
$3.30
$3.40
$3 .40
$3.50
$3.50
and
over
A ll production w orkers _ ______ 6 , 734 $ 1 . 60 7 1,595 952 771 466 469 318 287 308 223 192 167 193 175 138 106 1 0 0 59 41 32 35 24 15 5 10 46Men _________________________________ 2 ,6 2 7 1 .8 2 1 378 332 2 2 1 147 164 116 90 123 117 103 92 136 132 95 8 6 6 6 43 36 30 28 17 15 5 10 44W om en ________________ „ __ __ 4 , 107 1 .4 6 6 1,217 620 550 319 305 2 0 2 197 185 106 89 75 57 43 43 2 0 34 16 5 2 7 7 - - - 2
Selected occupations
MenCutting : 2 b /
Cutters, cloth lining, m ach in e__ 17 2 . 10 - - - - 3 - - 4 2 - 1 2 - 1 - - - - 1 1 1 _ 1 _ _C u tters, vamp and whole
shoe, machine _________ __ __ 184 2. 35 - - - 4 3 13 6 7 9 19 6 6 16 7 15 10 7 12 9 11 8 6 6 1 3L asting : 2 b /
A sse m b le rs for pullover,machine _________________________ 59 2 . 16 - - - 3 3 9 - 1 6 8 - 5 4 - 4 - 4 4 2 2 1 - - 2 _ 1
B ed-m ach ine operators ________ 1 2 2 2 .4 4 - - - - 2 - 8 1 - 4 9 8 10 8 28 14 3 7 3 - 7 4 1 _ 2 3H e e l-se a t la ste rs __ _____ __ 33 1. 96 - 2 4 1 1 2 3 - - 5 3 3 - - 4 - 1 2 _ _ _ 1 1 _ _ _P u llover-m ach in e o p e r a t o r s__ 60 2 .4 7 - - 1 1 2 1 4 1 - 3 2 4 4 10 4 3 4 2 2 _ _ 2 2 - 3 5Side la s te r s . machine 79 2 .4 6 - - - - - 2 2 1 6 2 6 7 5 7 1 7 5 9 9 6 1 _ _ 1 _ 2Toe la s te r s , autom atic or
sem iautom atic _________________ 39 2. 04 - - - 1 1 3 3 4 4 3 5 2 3 2 2 1 1 1 3 _ _ _ _ _Bottoming and m aking:2 b /
Edge trim m ers __________________ 64 2 .4 8 - - - - 3 - - 2 3 3 5 9 8 5 3 - 6 2 - - 2 2 3 _ 2 6H eel attachers, machine ______ 1 6 2. 17 - - - - - - - 2 3 1 1 2 _ 4 _ 2 - 1Sole attach ers, cem ent
p rocess __________________________ 70 1 .9 5 - 4 2 2 5 6 3 8 6 7 8 3 3 - 3 2 3 . _ _ 1 _ 2 1 1W ood -h eel seat fitte rs ,
machine 21 2. 38 - - - 2 - - _ 2 _ 2 _ _ 2 • 2 1 ‘ 2 2 4 _ _ _ _ _ _ 1 1Fin ishin g : 2 b /
Bottom scou rers ________________ 8 1. 91 - - - - - 1 1 - - 4 - 2TP.rl|TfP qpftprR 16 3. 04 3 2 2 2 3 £T re e rs _____________________________ 95 2 . 16 - _ _ - 1 2 5 7 8 9 5 8 13 23 4 3 3 _ 4 _ _ _ _ _ _
O ther : 2 a /TTlnm* TonyK 38 1 . 29 13 12 7 2 1 2 1Inspectors (crow ners) __________ 12 1 . 26 - 11 1Janitors ___________________________ 19 1 . 2 1 - 10 8 - 1M ech anics, m aintenance ______ 12 2 . 81 3 2 - 1 - 1 - - - 3 1 - - 1
W om en
Cutting : 2 b /C utters, cloth lining,
m achine -------------------------------------- 18 1 . 6 8 - 2 - 3 1 2 4 1 - 2 1 - - - i 1 - _ _ _ _ _ _ _ _ .C utters, vam p and whole
shoe, m achine _________________ 50 1. 92 - - 1 6 5 5 4 3 4 4 2 3 _ _ 3 4 4 _ _ _ 2 _ _ _ _ _
Fitting : 2 b /stitrbprR 288 1 . 62 29 37 28 29 40 15 35 18 10 11 10 8 4 4 4
P a ste rs , b ack ers, or fitte rs ,upper, hand _______________ __ 199 1. 34 1 93 25 21 11 16 18 5 5 1 1 - 1 - 1 _ _
Top stitchers ____________________ 186 1. 76 - - 10 16 10 17 33 25 16 17 14 18 5 1 1 3V am pers --------------- -------- __ __ 70 1 . 6 8 - 2 5 9 5 13 9 7 5 2 2 3 4 _ 2 2 _ _
Lasting:A sse m b le rs for pullover,
m achine 2 b / -------------------------------- 11 1.71 - - 2 1 1 2 1 - - 2 - 1 - - - - - 1Bottoming and making:
Sole attachers, cem entprocess 2 b / ____________________ >_ 2 2 1. 73 - - 1 2 5 1 - 2 5 2 - 4
Finishing: 2PrfapaT'm'PR cl/ 294 1 .2 9 45 64 162 18 5
Other:F lo or g irls 2 a / ___________________ 70 1. 31 - 18 15 24 5 6 2
44 1 .4 3 1 7 10 12 4 3 3 2 2T im e ___________________________ 23 l! 25 1 6 8 8Tn r/>nti vp 2 1 1. 64 1 2 4 4 3 3 2 2
Excludes prem ium pay for overtim e and for work on weekends, holidays, and late shifts.Insufficient data to warrant presentation of separate averages by method of wage payment; (a) all or predominantly tim ew orkers, and (b) a ll or predominantly incentive w orkers. W orkers w ere distributed as follow s: 1 at $ 3. 60 to $ 3. 70; 1 at $ 4 . 30 to $ 4 . 40; 1 at $ 4 . 50 to $ 4 . 60; 2 at $ 4 .7 0 to $ 4 . 80; and 1 at $ 4 . 90 to $ 5.
OJ-a
Digitized for FRASER http://fraser.stlouisfed.org/ Federal Reserve Bank of St. Louis

Table 26. Occupational Earnings: Women’s Cement-Process (Conventional-Lasted) Shoes, Boston, Mass.(Number and average straight-time hourly earnings 1 of production workers in selected occupations, April 1962)
CoCO
A veragehourly
Number of w orkers receiving straight--tim e hourly earnings of—
of $1.10 $1.20 $1.30 $1.40 $1.50 $1.60 $1.70 $1.80 $1.90 $2.00 $2.10 $2.20 $2.30 $2.40 $2.50 $2.60 $2.70 $2.80 $2 . 9 0 $3.00 $3.20 $3.40 $3.60 $3.80 $4.00 $4.20
w orkers ea rn in g s1 and
$1.20 $1.30 $1.40 $ 1 .5( $1.60 $1.70 $1.80 $1.90 $2.00 $2.10 $2.20 $2.30 $2.40 $2.50 $2.60 $2.70 $2.80 $2.90 $3.00 $3.20 $3.40 $3.60 $3.80 $4.00 $4.20 over
1 ,5 6 6 $ 1. 98 69 153 123 139 117 91 113 86 69 86 58 67 45 35 32 39 41 26 26 47 29 13 22 10 2 28757 2. 27 21 39 20 22 43 36 70 41 42 56 33 39 31 22 12 23 37 18 19 43 23 11 21 10 1 24809 1. 70 48 114 103 117 74 55 43 45 27 30 25 28 14 13 20 16 4 8 7 4 6 2 1 1 4
8 3. 10 2 1 2 1 1 1
59 2. 71 _ _ _ 2 5 2 _ 2 2 1 1 1 6 3 1 1 4 3 2 8 4 2 4 2 1 211 1. 73 _ _ _ 2 5 _ _ 1 1 - - - 1 148 2. 94 - - - - - 2 - 1 1 1 1 1 5 2 1 1 4 3 2 8 4 2 4 2 1 2
20 2. 72 1 1 2 1 1 1 2 3 1 2 1 3 1 _ _ _ _15 2. 61 - - - - - * 1 " 2 1 - 1 - 1 - 3 - 1 1 2 - 2 - " - -
15 3. 05 _ _ _ _ _ _ 1 _ _ 1 _ 2 _ _ 1 _ _ _ . 3 - 4 2 - 119 2. 93 1 1 1 - 3 4 - 2 1 3 2 1 "
12 2. 96 - - - - - - - - 1 - 1 - - 1 - 1 - 1 - 3 1 1 2 - - -
8 3. 42 . _ . _ _ _ _ _ _ 1 _ _ _ _ _ _ 1 _ _ 1 _ _ 3 1 - 17 2. 70 - - - - 1 1 - - - - 1 - 1 1 - - - - " - 1 - - - 1
13 2. 77 - - - - - - 1 - - - - 1 1 - 1 - 3 2 1 1 - 1 1 - - -
26 2. 12 - - - 1 4 2 1 2 1 4 1 1 - 1 4 1 - 1 1 1 - - - - - -
12 1. 36 _ 5 2 1 48 1. 41 1 3 1 3
41 1. 94 3 6 4 6 6 2 2 2 1 1 3 2 3
30 1. 65 . _ 7 6 3 3 2 3 1 1 1 2 110 1. 39 - - 6 2 1 120 1. 78 _ _ 1 4 2 2 2 3 1 1 1 2 117 2. 34 _ _ - - - - 2 1 1 5 2 - - - - 1 1 1 - 1 2 - - - - -12 2. 04 - - - - - - 1 1 6 - 1 2 1
40 1. 44 1 3 5 20 7 4
18 1 .4 2 _ 7 2 2 4 211 1. 52 1 8 1
Sex, department, and occupation
A ll production w orkers Men ____________________
Selected occupations
Men
Cutting:C u tters, cloth lining,
machine 2b /C u tters, vamp and whole
sh oe, m achine ___________T im e _____________________Incentive ________________
L astin g :2 b /A sse m b le r s for pullover,
machine ___________________B ed-m ach ine operators _________P u llover-m ach in e
operators ________________________Side la s te r s , machine ___________Toe la s te r s , autom atic
or sem iautom atic _______________Bottoming and m aking:2b /
Edge trim m ers ___________________Heel a ttach ers, machine -----------Sole attach ers, cem ent
Finishing:T re e rs 2b / _________________________
Other: 2a /
Janitors ____________________________
Fitting:Fancy stitchers 2b / -----------------P a ste r s , b a ck e rs, or fitte rs ,
upper, hand __________________Tim e _________________________Incentive ___________<________
Top stitchers 2b / ______________V am p ers 2b / ------------------------------
Finishing:R ep airers 2b / __________________
Other: 2a /F loor g irls _____________________Inspectors (crow ners) ------------
Excludes premium pay for overtime and for work on weekends, holidays, and late shifts.Insufficient data to warrant presentation of separate averages by method of wage payment; (a) all or predominantly timeworkers, and (b) all or predominantly incentive workers.
Digitized for FRASER http://fraser.stlouisfed.org/ Federal Reserve Bank of St. Louis

Table 27. Occupational Earnings: Women’s Cement-Process (Conventional-Lasted) Shoes, Haverhill, Mass.(Number and average straight-time hourly earnings 1 of production workers in selected occupations, April 1962)
Num berof
w orkers
AverageSex, departm ent, and occupation hourly
earnings1
1 1 .T 6and
under$1.20
$1.20
$1.30
A ll production w orkers ____________ 4 , 065 $ 2 . 06 39 389Men ______________ _________________ 1 ,7 9 8 2. 56 10 67W omen . _ _ .
Selected occupations Men
Cutting: 2 3b /C u tters, cloth lining,
2, 267 1. 66 29 322
machineC u tters, leather lining,
28 2. 52 - -
machine _________________________C u tters, vam p and whole
26 2. 51 - -
sh oe, machine _________________Lasting: 2b /
A sse m b le rs for pullover,
147 2. 82
machine 48 3. 09 _ _B ed-m ach ine operators 68 3. 36H e e l-se a t la ste rs ________________P u llover-m ach in e
22 2. 61 - -
operators 47 3. 57 - -Side la s te r s , m achine __________Toe la s te r s , autom atic or
87 3. 39 - -
sem iautom atic Bottoming and making: 2b /
45 3. 39 -
Edge trim m ers __________________Sole a tta c h e rs, cem ent
52 3. 32 - -
process ________Finishing: 2b /
53 2. 96 - "
Edge setters 40 3. 09 - -T re e rs ___________
O th er:2a /111 2. 75 " -
F loor boys ________________________ 26 1. 46 - 5Janitors ____
W om en
Fitting:
14 1. 29 4 3
Fancy stitchers 2b / ______________P a ste rs , b a ck e rs, or fitte rs ,
169 1. 82 - 6
upper, hand ____________________ 191 1. 49 1 88Tim e 59 1. 29 - 54Incentive 132 1. 58 1 34
Top stitchers 2b / 153 1. 96 1 _V am pers 2b /
Lasting:A sse m b le rs for pullover,
32 1. 91'
machine 2b / Finishing:
6 3. 29 -
R epairers 2a / , Other:
156 1. 51 - 1
F loor g ir ls 2a / _ 47 1. 62 _ 2Inspectors (crow ners) 14 1. 52 - 5
Tim e _____ 9 1. 38 3
Number of w orkers receiving stra ight-tim e hourly earnings of—
$ 1 .30|$1.40|$1. 50ffil.60|$ 1.70K 1.80|$1,90|$2.00|$2.10J$2.20|$2.30|$2.40|$2.50|$2.60J$2.70|$2.80|$2."90|$3.00|$3.20|$3.40|$3. 60|$3. 80|$4."0d |$4.20
$ 1 .4 0 $ 1 .5 0 $ 1 .6 0 $ 1 .7 0 $ 1 .8 0 $ 1 .9 0 $ 2 .0 0 $ 2 ,1 0 $ 2 .2 0 $ 2 .3 0 $ 2 .4 0 $ 2 .5 0 $ 2 .6 0 $ 2 ,7 0
33378
255
47638
438
37997
282
49
18537
148
17873
105
20487
117
1326864
$ 2 .8 0 $ 2 .9 0 $ 3 .0 0 $ 3 .2 0 $ 3 .4 0 $ 3 .6 0 $ 3 .8 0 $ 4 .0 0
154146
8
108105
3
$4.20
1 Excludes prem ium pay for overtim e and for work on weekends, holidays, and late shifts.2 Insufficient data to warrant presentation of separate averages by method of wage payment; (a) all or predominantly tim ew orkers, and (b) all or predominantly incentive workers3 W orkers were distributed as follow s: 2 at $ 4. 20 to $ 4. 30; 4 at $ 4. 30 to $ 4. 40; 1 at $ 4 . 40 to $ 4. 50; and 1 at $ 5. 10 to $ 5. 20. Co
'O
Digitized for FRASER http://fraser.stlouisfed.org/ Federal Reserve Bank of St. Louis

Table 28. Occupational Earnings: W om en’s Cement-Process (Conventional-Lasted) Shoes, Lawrence—Lowell, Mass.
(Number and average straight-time hourly earnings1 of production workers in selected occupations, April 1962)
Numberof
w orkers
Average hourly
earnings 1
$1 .10and
under
$1.20 $1.30
$1 .20 $1.30 $1.40
3, 743 $ 1.77 662 484 3531, 371 2.17 139 122 812, 372 1.54 523 362 272
28 2.72
11 2.03 - - 2120 2.79 - - -
29 2.7347 3.42 _ - -24 2.30 - - -
30 3.35 _ _ _52 3.15
17 3.08 - - -
29 2.93 _ _ _8 2.14 - - -
32 2.32 - - 115 3.13 _ _ _38 1.89 - - 217 1.25 7 7 _12 1.36 _ 4 319 1.18 15 3 _6 2.74
169 1.86 _ 2 7
164 1.36 83 19 994 2.02 - - 140 1.61 - 4 6
8 3.32 -
122 1.42 - 5 38
34 1.43 3 3 1147 1.33 5 6 18
Sex, department, and occupation
Number of w orkers receiving stra ight-tim e hourly earnings of—
1.60|$1.70|$1.8(»1.90($2.00ft2.10tt2.20|$2.30|$2.40|$2.5(R2.6(tt2.80rt3.00fe3.20rt3.40K3.60B3.80$1.40K1.5'
$1.50$1.6o|$1.70|$1.80|$1.90|$z.00fe2.10|$2.20 $2 .3 0 $ 2 .4 0 $ 2 .5 0 $ 2 .6 0 $ 2 .8 0 $ 3 .0 0 $ 3 .2 0
$ 4 .00|$4.2(jj$4.40
$3.40t$3.60t$3.80|$4.00|$4.20 $4 ,40$ 4 ,6 0
$4.66
and
over
A ll production w orkers ____________
Women _____________________________
Selected occupations Men
Cutting: 2 b /Cutters, cloth lining,
machine _________________________C utters, leather lining,
machine _________________________Cutters, vamp and whole
shoe, m achine _________________Lasting: 2 b /
A sse m b le rs for pullover,machine _________________________
B ed-m ach ine operators ________H e e l-se a t la sters _______________P u llover-m ach in e
operators _______________________Side la s te rs , machine __________Toe la s te rs , autom atic or
sem iautom atic _________________Bottoming and making:
Edge trim m ers 2 b / ______________Heel attachers, machine 2_______Sole attachers, cement
p r o c e s s 2 b / ______________ ____Finishing: 2 b /
Edge setters _____________________T re e rs _____________________________
Other; 2 a /F loor boys ________________________Inspectors (crow ners) ---------------Janitors ___________________________M echanics, maintenance ______
Women
Fitting: 2 b /Fancy stitchers ---------------------------P a sters , back ers, or fitte rs ,
upper, hand ____________________Top stitchers ____________________V am pers __________________________
Lasting:A sse m b le rs for pullover,
machine 2 b / ____________________Finishing:
R epairers 2 a / -------------------------------Other: 2 a /
Floor g ir ls -----------------------------------Inspectors (crow ners) ---------------
26254
208
20875
133
24075
165
1727597
2525
Excludes prem ium pay for overtim e and for work on weekends, holidays, and late shifts.Insufficient data to warrant presentation of separate averages by method of wage payment; (a) all or predominantly tim ew orkers, and (b) all or predominantly incentive w orkers. W orkers w ere distributed as fo llow s: 2 at $ 4 .8 0 to $ 4 .9 0 ; and 4 at $ 5 to $ 5 .1 0 .
Digitized for FRASER http://fraser.stlouisfed.org/ Federal Reserve Bank of St. Louis

Table 29. Occupational Earnings: W om en’s Cement-Process (Conventional-Lasted) Shoes, Lynn, Mass.
(Number and average straight-time hourly earnings 1 of production workers in selected occupations, April 1962)
Number AverageSex, departm ent, and occupation of
w orkershourly
earnings 1
$ 1 . 1 0and
under$ 1 . 2 0
$ 1 . 2 0
$1.30
f O i
$ 1 .4 (
A ll production w orkers 3, 153 $ 1.87 275 495 215Men _ __ _______ _ 1, 364 2.24 95 117 67Women . . . . . .
Selected occupations Men
Cutting: 2 b /Cutters, cloth lining,
1, 789 1.59 180 378 148
m achine ... ... .. Cutters, leather lining,
12 2.31 “ -
machine ._ . . . . Cutters, vamp and whole
16 2.91 - - -
shoe, m achine _________________Lasting: 2 b /
A sse m b le rs for pullover,
87 3.14
m achine ............... 31 2.90 _ . _B ed-m ach ine operators 13 2.46 - -H e e l-se a t la sters ________________P u llover-m ach in e
19 2.25 - -
operators 28 3.50Side la s te r s , m achine __________Toe la s te r s , autom atic or
23 2.75 “ “ -
sem iautom atic _________________Bottoming and m aking: 2 b /
50 2.92
Edge trim m ers 24 2.83 _ _ _Heel attachers, machine ____ _Sole attachers, cement
13 1.77 4 4
p ro ce ss __________________________W ood-h eel seat fitte rs ,
25 2.67 - - -
m achine _ _ . ..... .Finishing: 2 b /
10 2.77
Bottom scou re rs ________________ _Edge setters .
814
2.172.872.44
- - -
T re e rs .. O ther : 2 a /
43 - - -
F loor boys __ ._ . . 2 2 1.31 5 10 2Inspectors (crow ners) __________ 18 1.85 - - 1Janitors __ 14 1.24 5 5 4M echanics, maintenance ___ .
W omen
Fitting:
6 2.79
Fancy stitchers __________________ 137 1.75 1 . 3T im e _ 52 1.59 _ _Incentive ______________________
P a ste rs , backers, or fitte rs ,85 1.85 1 3
upper, hand _ ._ . _ 127 1.45 16 34 24T im e _____ _________ ___________ 60 1.27 15 25 17Incentive . . ......... 67 1 . 6 2 1 9 7
Top stitcher s 2 b / ________________ 50 2 . 0 1 4V a m p e r s 2 b / __
Finishing:21 2.09 - - 1
R epairers 2 a / _ .. ___ _Other: 2 a /
83 1.47 - 10 -
F loor g irls . .. 13 1.38 3 2 3Inspectors (c r o w n e r s )____ _____ 1 0 1.27 3 3 4
Number of w orkers receiving stra ight-tim e hourly earnings of—
$1,4C $1.50$1.60 !$1 .70 $ 1 .8 0 $ 1 .9 0 $ 2 .0 0 $ 2 .1 0 $ 2 .2 0 $ 2 .3 0 $ 2 .4 0 $ 2 .5 0 $ 2 .6 0 $ 2 .8 0 $ 3 -0 0 $ 3 -2 0 lfc3.401£;36fi $3 .80 $ 4 .0 0 $ 4 .2 0 $ 4 .4 0 $4,60
and
over
32036
284
16650
116148110
38
1010
Excludes premium pay for overtime and for work on weekends, holidays, and late shifts.Insufficient data to warrant presentation of separate averages by method of wage payment; (a) all or predominantly timeworkers, and (b) all or predominantly incentive workers.
Digitized for FRASER http://fraser.stlouisfed.org/ Federal Reserve Bank of St. Louis

Table 30. Occupational Earnings: W omen’s Cement-Process (Conventional-Lasted) Shoes, Worcester, Mass.
(Number and average straight-time hourly earnings1 of production workers in selected occupations, April 1962)
to
Sex, department, and occupationNumber Average
hourlyof $ 1 . 1 0and
$ 1 . 2 0
w orkers earnings 1 under$ 1 . 2 0 $1.30
1 ,9 7 6 $ 1.80 244 375642 2.37 26 44
1 ,3 3 4 1.52 218 331
11 2.77
50 2.62 - -
16 2 .5418 3.08
8 2.25 - -
19 3.1930 2.99 - -
2 2 3.57 - -
23 2 .74 -
28 2.19 - 2
1 0 1.33 3 37 1.63 - 17 1.18 5 1
76 1.89 1
129 1.44 15 5167 1 . 6 0 4 1 264 1.99 - 1
114 1.29 17 4728 1.64 - 1
32 1.45 3 52 1 1.39 5 51 6 1.28 5 5
Number of w orkers receiving straight-tim e hourly earnings of—
$1 .30$ 1 .40$1 .50$1.60 !$1 .70 $ 1 .8 0 $ 1 .9 0 $2.00 $2.To|$
$1.40|$1.50f$1.60tel.70j$1.80|$1.90l$2.00i$2.10$2.20fe
r2720f$2.30|$2.40j$2.50$2.60|$2.70|$2.80j$2.90
I2.30|$2.4ob2.50$2.60$2.70$2.80$2.90$3.00
$ 3 .0 0 $ 3 .2 0 $ 3 .4 0 $ 3 .6 0 $ 3 .8 0
$3.20$3.4o[$3.60|$3.8 0|$4. 0 0
$4.00
$4 .20
$4.20
and
over
A ll production w orkers . Men ___________________
Selected occupations
Men
Cutting: 2 b /'C utters, cloth lining,
machineC utters, vamp and whole
shoe, machine ____________Lasting: 2 b /
A sse m b le rs for pullover, m achine ____________________
B ed-m ach ine o p e r a t o r s ___H e e l-se a t l a s t e r s ___ __ ____P ullover-m achin e
operators __________________Side la s te rs , machine _____
Bottoming and making: 2 b /Edge trim m ers _____________Sole attachers, cement
p ro ce ss _____________________Finishing: 2 b /
T re e rs ________________________Other:
F lo or boys 2 a /Inspectors (crow ners) 2 b / Janitors 2 a / _________________
Fitting:Fancy stitchers 2 b / ___________P a ste rs , backers, or fitte rs ,
upper, hand ----------------------------Incentive ____________________
Top stitchers 2 b / _______________Finishing:
R epairers 2 a / __________________T re e rs 2 b / ______________________
Other:F lo or g ir ls 2 a /Inspectors (crow ners)
20925
184
1010
Excludes premium pay for overtime and for work on weekends, holidays, and late shifts.Insufficient data to warrant presentation of separate averages by method of wage payment; (a) all or predominantly timeworkers, and (b) all or predominantly incentive workers.
Digitized for FRASER http://fraser.stlouisfed.org/ Federal Reserve Bank of St. Louis

Table 31. Occupational Earnings: W om en’s Cement-Process (Conventional-Lasted) Shoes, Southeastern New Hampshire
(Number and average straight-time hourly earnings 1 of production workers in selected occupations, April 1962)
Sex, departm ent, and occupation
A ll production w orkers .Men ____________________W om en ________________
Selected occupations Men
Cutting:C u tters, cloth lining,
machine 2 b / .C u tters, leather lining,
m achine 2 b / .C u tters, vamp and whole
sh oe, m achine ___________Incentive ________________
L astin g :2 b /A sse m b le rs for pullover,
machine ___________________B ed-m achine operators _____H e e l-se a t la sters _____________P u llover-m achin e operators .Side la s te r s , m achine ______Toe la s te r s , autom atic or
sem iautom atic _______________Bottoming and m aking:2 b /
Edge trim m ers ________________H eel a ttach ers, m achine ____Sole attach ers, cem ent
p rocess ________________________Fin ishin g:2 b /
Edge setters ___________________T re e rs ___________________________
O ther:2 a /F lo or boysInspectors (crow ners) ___Janitors ____________________M ech anics, m aintenance _____
W om en
Fittin g :2 b /Fancy stitchers ________________P a ste rs , b a ck e rs , or fitte rs ,
upper, hand -----------------------------Top stitchers ___________________Vam pers _________________________
Lasting:A ssem b lers for pullover,
machine 2 b / ____________________Bottom ing and making:
Sole attachers, cementprocess 2 b / ____________________
F inishing:R epairers ________________________
T im e __________________________Incentive
Other:F lo or girls 2 a / _______________Inspectors (crow n ers) ______
T im e _______________________Incentive __________________
Num ber AverageNumbe r of worke rs receiving straight -tim e hourly earning 8 Of—
ofw orkers
hourlyearnings1
Under $ 1 . 10
$ 1 . 1 0and
under
$ 1 . 2 0 $1.30 $1.40 $1.50 $1.60 $1.70 $1.80 $1.90 $2 . 0 0 $2 . 1 0 $ 2 . 2 0 $2.30 $2740 $2750 $2763 $2770 $27513 $2.90 J T M $3.20 $3.40 $3 .60
$ 1 . 2 0 $1.30 $1.40 $ 1 . 5( $1.60 $1 .70 $1.80 $1.90 $ 2 . 0 0 $2 . 1 0 $ 2 . 2 0 $2 .30 $2.40 $2.50 $2.60 $2.70 $2.80 $2.90 $3.00 $3.20 $3.40 $3 .60 $3.80
9 ,3 6 9 $ 1 .7 6 3 1,949 9 6 6 777 650 576 475 415 357 366 372 319 300 303 253 216 172 159 124 123 205 135 78 423 ,7 1 8 2 . 11 - 442 233 172 127 170 129 124 107 148 2 2 2 194 181 2 0 1 175 151 133 132 116 108 184 130 72 365 ,6 5 1 1. 53 3 ^507 733 605 523 406 346 291 250 218 150 125 119 1 0 2 78 65 39 27 8 15 21 5 6 6
24 2 .6 4 _ _ _ _ . . 2 1 3 2 1 2 1 3 j 2 2 1 1
6 6 2 .4 6 - - - - - 1 2 2 3 4 6 5 1 8 5 7 4 5 2 4 2 2 - 2
281 2. 55 - - - 5 2 2 3 4 3 4 19 27 28 30 17 19 11 21 2 0 16 19 2 0 2 5276 2. 56 “ 5 2 1 3 4 3 4 17 27 26 30 17 19 11 21 2 0 16 19 2 0 2 5
1 0 1 2 .4 5 _ _ _ 2 3 _ 3 1 3 1 11 12 4 5 8 13 9 8 3 1 6 4 1 2141 2 .7 8 - - - - - - - 1 1 1 5 7 6 9 14 14 11 10 8 8 13 17 9 540 2 .4 7 - - - - - 1 1 - 1 1 2 8 4 4 4 - 3 2 2 _ 3 2 199 2 .8 3 - - - - - - - - 1 4 - 9 5 4 3 7 10 4 7 11 8 7 16
149 2 . 8 6 ■ " " _ - 1 " - 1 6 7 5 13 4 2 2 11 7 13 29 17 6 3
94 2.9 1 - - 1 - - - 1 - 3 1 2 2 5 8 6 4 9 10 3 10 6 14 3
83 2.91 - - - - _ 1 _ > _ 1 3 2 2 2 2 1 13 7 7 11 11 5 10 22 2 2. 07 “ - - - 3 3 1 2 2 1 3 - 2 - 3 1 - 1
8 6 2. 50 - - 2 1 - 6 1 - - 1 8 10 4 5 2 3 3 8 10 11 5 4 1 -
34 2 .7 5 - 3 _ 3 3 1 4 3 . 1 5 5 4 1 11 6 1 2. 36 - “ 3 - 2 7 10 5 5 19 16 13 12 17 9 8 6 10 4 5 2 6
53 1 . 28 _ 13 30 5 1 2 _ . . _ 1 138 1 . 60 - 3 2 13 _ 10 3 _ 1 _ _ 1 2 1 1 151 1 . 21 - 21 27 317 2 .4 4 ■ " “ “ - - 1 - 2 3 - 1 3 2 - - 1 - 4 - - -
268 1.81 - - 20 11 24 28 21 33 30 24 2 2 17 16 13 3 2 3 1
176 1 .2 9 - 114 9 13 12 9 5 6 3 1 _ 2 2209 2. 07 - 1 4 7 3 9 10 10 2 2 23 2 0 26 21 17 9 9 8 5 1 3 _ 1 _ _
71 1 .7 4 ■ 9 10 5 4 3 11 8 5 2 6 2 1 1 3 1 - - - - -
21 1. 98 - - - 2 - - 1 1 4 3 3 2 3 1 - - - - - 1 - - - -
11 2. 14 - - - - 1 1 - - - 1 3 - 3 - - - _ - , 2 _ _ _ _ _249 1 .4 0 _ 5 49 116 56 4 1 1 1 3 4 3 2 1 2 1206 1. 33 - 1 49 115 40 1
43 1. 72 - 4 - 1 16 3 1 1 1 3 4 3 2 1 2 - - 1
87 1. 34 _ 7 28 2 0 2 2 7 329 1 . 39 - 5 2 14 - 3 1 3 12 0 1.34 - 3 - 14 - 3
9 1. 50 2 2 ” " 1 3 1
$3.80
$4 .00
WTOand
* Excludes premium pay for overtime and for work on weekends, holidays, and late shifts.Insufficient data to warrant presentation of separate averages by method of wage payment; (a) all or predominantly timeworkers, and (b) all or predominantly incentive workers.
Digitized for FRASER http://fraser.stlouisfed.org/ Federal Reserve Bank of St. Louis

Table 32. Occupational Earnings: W om en’s Cement-Process (Conventional-Lasted) Shoes, St. Louis, Mo.—111.
(Number and average straight-time hourly earnings1 of production workers in selected occupations, April 1962)
Sex, department, and occupation
A ll production w o r k e r s ______________Men __________________________________
Selected occupations Men
Cutting: 1 2 3b /Cutters, leather lining,
machine _______________ __________Cutters, vamp and whole
shoe, hand ______ _________________Cutters, vamp and whole
shoe, m achine ___ ________________Lasting; 2 b /
A sse m b le rs for pullover,machine __________________________
B ed-m ach ine operators _________H e e l-se a t la sters ________________P u llover-m ach in e operators ' __Side la s te r s , m achine ___________
Bottoming and m aking;Edge trim m ers 2 b / _______________Heel attachers, machine 2 b / __Rough rounders 2 b / ______________Sole attachers, cement
p roce ss 2 b / ______________________W ood-h eel seat fitte rs ,
hand 2 a / __________________________Finishing :^”b /
Bottom scou re rs _________________Edge setters ______________________T re ers ______________________________
Other;F loor boys 2 a / ____________________Inspectors (crow ners) -----------------
T im e ____________________________Janitors 2 a./ _______________________M echanics, maintenance 2 a / __
W omen
Cutting: 2 b /Cutters, leather lining,
machine __________________________Fitting: 2 b /
Fancy stitchers ----------------------------P a sters , backers, or fitte rs ,
upper, hand _____________________Top stitchers _____________________Vam pers _______________ <-----------------
Finishing:Repairer s 2 a./ _____________________T re e rs 2 b / ________________
O th ers : 2 a /F loor g ir ls ________________________Inspectors (crow ners) -----------------
A veragehourly
Numbe r of worke rs re ceiving straight -tim e: hourly ea rning s of—
of $ 1 . 1 0 $ 1 . 2 0 $1.30 $1.40 $1.50 $TT5o $1.70 $1.80 $ 1 . 9 0 $2 . 0 0 flTTo $ 2 . 2 0 $2.30 $2.40 $2 .50 $2.60 $2 .70 $2.80 $2.90 $3.00 $3 .10 $3 .20 $3.30 $3 .40 $3 .50 $3.60
w orkers earnings 1 under and$ 1 . 2 0 $1.30 $1.40 $ 1.5 C$1.60 $1.70 $1.80 $1.90 $ 2 . 0 0 $2 . 1 0 $ 2 . 2 0 $2.30 $2.40 $2 .50 $2 .60 $2.70 $2.80 $2 .90 $3.00 $3.10 $3 .20 $3 .30 $3.40 $3 .50 $3 .60 over
2, 207 $ 1.78 365 238 177 123 188 90 138 123 84 99 77 75 63 51 63 36 28 54 24 27 21 10 19 6 ' 6 2 2821 2 . 2 0 47 37 42 30 47 18 30 42 24 51 48 42 48 33 48 27 27 51 24 27 21 9 18 6 3 21
1, 386 1.53 318 2 0 1 135 93 141 72 108 81 60 48 29 33 15 18 1 5 9 1 3 1 1 3 1
1 0 2.54 1 1 1 3 1 1 1 1
74 2.78 - - - - 1 - - - 4 1 - 2 3 6 6 7 9 6 7 8 3 3 3 2 - 3
17 3.05 - - - - 1 - - - 1 - - - 1 1 - - 1 1 - 1 3 - - 3 2 2
2 2 2.75 1 3 7 2 3 4 22 6 2.97 1 3 _ 2 1 _ 2 7 _ _ 1 2 _ _ 3 3 4
6 2 . 0 1 - - - 1 - 1 - 1 - 1 _ _ 1 _ _ 121 2.78 1 3 7 1 _ 4 2 1 _ _ _ _ _ 225 2.76 1 5 9 - 6 1 1 - - - - - 2
29 2.84 _ _ _ _ _ _ _ _ _ _ 3 _ _ 2 2 3 6 2 7 3 _ 1 _ _ _8 1 . 8 6 - - 1 _ 2 _ 1 _ _ 1 2 _ 1
13 2.14 - 1 1 - - 1 ~ 1 1 - 2 - - 3 1 1 - - - 1 - - - - - -
15 2.45 - - - - - 1 1 - - 1 - 2 1 1 2 2 2 1 - - - 1 - - -
6 2.13 - - - - - - 1 - 2 1 - - 1 - - - 1
12 2 . 2 0 1 _ _ 1 _ 1 _ 1 _ 4 _ 1 _ _ _ 1 _ 1 _ 1 _ _ _ . _15 3.00 3 1 _ 1 3 1 2 1 1 1 _ 130 2 . 0 1 - - - - " 1 7 6 1 5 4 1 3 - 1 1 -
8 1.38 3 3 1 11 2 2.05 - 2 - _ - _ 1 4 _ 1 _ 1 _ _ 1 1 1
7 1.82 - 1 _ _ - _ 1 3 _ 1 _ 119 1.25 6 4 9
8 2.33 1 1 2 2 1 1
14 2.52 1 2 1 1 1 1 1 1 2 1 1 1
1 0 1 1 . 6 8 10 7 4 8 12 16 1 2 7 6 4 7 6 1 1
6 6 1.49 2 2 5 3 6 5 3 12 2 1 4 1 . 1 . 153 1.78 1 3 4 4 6 7 4 7 5 2 3 1 3 1 _ 2 _
7 1.56 2 1 " 1 - 1 - - - - 2
52 1.42 3 5 24 7 2 1 9 115 2.03 ~ * - 1 2 - 1 - 1 2 4 2 1 - - 1 - - - - - - - - - -
2 0 1.53 2 1 2 2 6 2 4 1 .24 1.29 7 7 4 3 3
1 Excludes prem ium pay for overtim e and for work on weekends, holidays, and late shifts.2 Insufficient data to w arrant presentation of separate averages by method of wage payment; (a) all or predominantly tim ew orkers, and (b) all or predominantly incentive w orkers.3 W orkers w ere distributed as follow s: 2 at $ 3 .6 0 to $ 3 .7 0 ; 1 at $ 3 .7 0 to $ 3 .8 0 ; and 1 at $ 3 .9 0 to $ 4 .
Digitized for FRASER http://fraser.stlouisfed.org/ Federal Reserve Bank of St. Louis

Table 33. Occupational Earnings: W om en’s Cement-Process (Conventional-Lasted) Shoes, Missouri (Except St. Louis)
(Number and average straight-time hourly earnings 1 of production workers in selected occupations, April 1962)
Number of workers receiving stra ight-tim e hourly earnings of—
Sex, departm ent, and occupation ofw orkers
hourlyearnings1
$1.15and
under$ 1 . 2 0
$ 1 . 2 0
$1.25
$1.25
$1.30
$1.30
$1.35
$1.35
$1.40
$1.40
$1.45
$1.45
$1.50
$1.50
$1.55
$1.55
$1.60
$1.60
$1.65
$1.65
$1.70
$1.70
$1.75
$1.75
$1.80
$1.80
$1.90
$ 1 . 9 0
$2 . 0 0
$2 . 0 0
$2 . 1 0
$ 2 . 1 0
$ 2 . 2 0
$ 2 . 2 0
$ 2 .3d
$2.30
$2.40
$2.40
$2.50
$2.50
$2.60
$2.60
$2.70
$2.70
$2.80
$2.80
$2.90
$2.90
$3.00
$3.0(and
over
A ll production w orkers . _ 7, 828 $ 1. 51 1,839 547 584 505 483 368 383 364 303 301 274 175 237 315 2 0 1 2 5 6 177 153 1 01 58 55 48 24 2 2 23 32Men ------------------------------------------------- 2, 511 1. 67 345 90 153 132 114 103 1 2 0 1 0 1 114 97 1 0 2 73 82 149 114 157 126 75 71 43 46 36 18 7 17 26W omen -------------------------------------------- 5, 317 1. 43 1,494 457 431 37 3 369 265 263 263 189 204 172 1 0 2 155 166 87 99 51 78 30 15 9 12 6 15 6 6
Selected occupations
MenCutting: c hi
Cutters, cloth lining,machine -------------------------------------- 19 2 . 2 2 - _ _ _ _ 1 _ 2 _ _ _ _ _ _ _ 1 6 1 3 _ 2 2 _ _ _ 1
Cutters, leather lining,machine -------------------------------------- 56 1 . 59 10 2 3 1 6 _ 1 1 5 4 2 2 3 6 2 2 4 _ 2 _ _ _ _ _ _
C utters, vamp and wholeshoe, hand ______________________ 54 1. 92 3 _ 3 _ _ 1 3 1 2 _ 2 1 5 7 2 5 3 6 2 4 1 2 1 _
Cutters, vamp and wholeshoe, m achine --------------------------- 128 1. 84 4 _ 8 4 5 7 6 4 7 2 6 7 4 12 11 6 8 5 8 4 6 1 _ 3 _
L a stin g : 2 b/A sse m b le rs for pullover,
machine _________________________ 85 1. 91 6 2 3 1 1 - 3 3 2 3 3 4 6 5 7 6 6 6 8 4 1 3 _ 2 _ _B ed-m ach ine operators ------------ 131 2. 17 - - 1 2 - 5 _ 8 1 3 4 2 5 9 11 13 10 8 15 11 1 5 1 _ 7 9H e e l-se a t la sters ------------------------ 42 1. 63 3 4 4 5 2 _ 4 _ _ 2 3 _ 2 4 1 1 1 1 1 3 1 _ _ _ _P ullover-m achin e o p e r a t o r s__ 69 2. 44 2 1 1 1 - - 1 _ 1 _ 1 2 _ 5 2 3 2 3 9 1 6 8 1 2 7 3 10Side la s te rs , machine __________ 95 2. 05 3 1 2 2 5 1 1 2 3 2 1 2 5 7 8 8 7 6 8 3 4 7 _ _ 2 5Toe la s te rs , autom atic or
sem iautom atic --------------------------- 77 1. 75 10 3 2 2 1 4 2 4 4 4 3 1 2 7 4 7 5 4 _ 4 4 _ _ _Bottoming and making : 2 b /
Edge trim m ers ---------------------------- 90 2. 07 ,- - - 2 - - 2 2 4 3 _ 4 3 10 3 8 17 16 7 2 2 2 . 1 _ 1 1Heel attachers, m achine ______ 24 1. 70 4 _ . _ _ 3 _ 1 _ 2 3 4 3 _ _ _ _ 1 1 1 _ 1 _ _ _Rough rounders --------------------------- 30 1 . 62 2 1 _ _ 1 2 2 4 5 1 2 _ _ .3 6 ■ 1Shank tackers ------------------------------- 2 2 1 . 59 _ _ 2 _ 6 1 _ _ 1 2 1 _ 7 _ 2Sole attachers, cem ent
p ro ce ss ---------------------------------------- 75 1. 90 - 1 - - 1 2 6 3 3 4 2 12 2 9 7 6 _ 6 _ 2 3 3 3 _ _W ood-h eel seat fitte rs ,
machine -------------------------------------- 9 1. 76 _ _ _ _ 1 _ 2 2 _ _ _ _ _ _ _ 2 _ 2 _ _ _ _ _ _Fin ish in g : 2 hi
Bottom scou rers _________________ 32 1. 75 6 - - 2 1 - - 1 . - 3 _ 2 _ 3 5 _ 7 1 1 _ _ _ _ _ _ _Edge setters -------------------------------- 38 1. 78 2 1 2 4 1 _ _ 4 _ _ 1 2 3 3 2 2 7 _ 2 1 1 _ _ _ _ _T re ers -------------------------------------------- 17 2 . 0 9 _ - _ _ _ _ _ 3 2 _ 1 _ _ _ 1 2 _ 3 1 4 _ _ _ _ _
O th er:F loor boys ------------------------------------- 51 1. 37 4 7 8 7 5 10 3 _ 3 _ 1 _ 2 1 _ _ _ _ _ _ _ _ _ _ _ _
Tim e ----------------------------------------- 37 1. 34 4 7 8 5 5 2 _ _ 3 _ _ _ 2 1 _ _ _ _ _ _ _ _ _ _ _ _Incentive ---------------------------------- 14 1. 43 - _ - 2 _ 8 3 _ _ - 1
Inspectors (crow ners)' --------------- 48 1. 44 4 5 3 10 4 3 11 2 - - - 1 1 1 - - 1 - - 1 _ 1 _ _ _ _Tim e ----------------------------------------- 34 1. 35 4 5 3 8 4 2 4 1 _ _ - 1 1 1 - _ _ _ _ _ _ _ _ _ _ _Incentive -------------------------------- 14 1. 65 _ _ - 2 _ 1 7 1 1 _ _ 1 _ 1 _ _ _ _
.Tanitr>rs2 a/ 47 1 . 2 2 23 4 14 5 1M echanics, m aintenance 2 a / — 47 1 . 79 2 2 4 - 3 4 4 4 2 9 1 4 2 4 1 - 1 - - - - -
Women
Cutting: 2 hiCutters, cloth lining,
machine -------------------------------------- 14 1. 70 2 _ - 1 3 _ - _ _ _ 1 2 _ 1 _ 1 1 _ 2 _ _ _ _ _ _Cutters, leather lining,
m achine --------- ---------------------------- 36 1. 53 3 2 5 2 4 3 2 _ _ 4 2 _ 2 3 _ 1 3 _ _ _ _ _ _ _ _Cutters, vamp and whole
shoe, hand ---------------------------------- 8 1. 69 _ _ . _ 2 _ 1 _ _ _ _ 1 - 4Cutters, vamp and whole
shoe, m achine --------------------------- 90 1. 75 6 1 1 5 5 2 2 9 2 8 6 1 6 9 4 11 2 2 3 2 3
' '
See footnotes at end of table. CA
Digitized for FRASER http://fraser.stlouisfed.org/ Federal Reserve Bank of St. Louis

(Num ber and average straight-tim e hourly earnings 1 of production w orkers in selected occupations, A pril 1962)
Table 33. Occupational Earnings: W om en’s Cement-Process (Conventional-Lasted) Shoes, Missouri (Except St. Louis)— Continued Os
A verage hourly
earn ings1
Number of w orkers receiving straight -tim e hourly earnings of—
Sex, departm ent, and occupation ofw orkers
$1 .15and
under$ 1 . 2 0
$ 1 . 2 0
$1.25
$1.25
$1.30
$1.30
$1.35
$1.35
$1.40
$1.40
$1.45
$1.45
$1.50
$1.50
$1.55
$1.55
$1.60
$1.60
$1.65
$1.65
$1.70
$1.70
$1.75
$1.75
$1.80
$1.80
$1.90
$1.90
$2 . 0 0
$ 2 . 0 0
$2 . 1 0
$ 2 . 1 0
$ 2 . 2 0
$ 2 . 2 0
$2.30
$2.30
$2.40
$2.40
$2.50
$2.50
$2.60
$2.60
$2.70
$2.70
$2.80
$2.80
$2.90
$ 2 . 9 0
$3.00
$3.00and
Over
Selected occupations— Continued
Women— Continued
F ittin g : 2 3 b /Fancy stitchers ---------------------------- 419 $ 1. 40 1 21 30 29 47 32 27 17 2 2 17 8 15 3 7 18 8 4 4 6 2 2 - - - - -P asters , backers, or fitters,
upper, hand _____________________ 242 1. 44 71 23 14 11 11 13 6 19 17 9 5 13 - 9 10 6 - - 1 - - - - 4 - -Top stitchers ------------------ ----------- 204 1. 48 39 13 39 13 12 10 7 13 7 4 5 5 4 8 2 7 4 4 3 - - 5 - - - -V am pers --------------------------- „ ___ 25 1. 42 10 1 2 1 - 2 2 - 1 - - 3 1 - - - - 2
L a stin g : 2 b /A sse m b le rs for pullover,
m achine --------------------------------------- 8 2 . 0 2 1 - 1 1 - - - - - - - - - 1 - - - - - - 2 - 2 - -Bottom ing and m akin g : 2 b /
Bottom fille rs ------------------------------- 14 1. 53 - - 4 2 1 - 2 - - - 1 1 - 1 - 2Rough rounders ---------------------------- 15 1 . 61 2 - 1 - 4 - - - - - 2 - - 2 3 1Shank tackers -------------------------------- 12 1. 57 3 - - - 2 2 - 2 3
Fin ish in g:Bottom scou re rs 2 b / ------------------- 14 1 . 62 3 1 - - 2 - - - 3 - - - - 1 - 3 - - - 1 - - - - -R epairers --------------------------------------- 179 1. 37 48 14 18 13 14 14 12 10 6 13 2 7 2 4 1 - - 1 - - - - - - - -
T im e ----------- — -------- — ----- 46 1. 32 17 4 3 4 5 - - 1 2 10Incentive ----------------------------------- 133 1. 38 31 10 15 9 9 14 12 9 4 3 2 7 2 4 1 - - 1 - - - - - - - -
T re e rs 2 b / -------------------------------------- 193 1. 42 27 20 18 19 18 22 15 12 6 10 6 1 2 9 3 3 2
O th er:F loor g ir ls ------------------------------------- 73 1. 33 9 13 8 14 10 11 2 4
Tim e ---------------------------- — ___ 34 1 . 28 9 7 7 4 3 1 1 2Incentive ----------------------------------- 39 1. 37 - 6 1 10 7 10 1 4
Inspectors (crow ners) ---------------- 118 1. 38 24 19 12 11 6 10 8 6 1 4 4 3 5 - 4 - 1 - - - - - - - - -Tim e ---------------- ---------------------- 71 1 . 26 24 15 8 11 4 4 3 2 -Incentive ----------------------------------- 47 1. 56 4 4 2 6 5 4 1 4 4 3 5 4 1
1 Excludes prem ium pay for overtim e and for work on weekends, holidays, and late shifts.2 Insufficient data to warrant presentation of separate averages by method of wage payment; (a) all or predominantly tim ew orkers, and (b) all or predominantly incentive w orkers.3 W orkers w ere distributed as follow s : 2 at $ 3 to $ 3 .1 0 ; 2 at $ 3. 20 to $ 3 .3 0 ; 2 at $ 3. 40 to $ 3 .5 0 ; and 4 at $ 3. 50 and over.
Digitized for FRASER http://fraser.stlouisfed.org/ Federal Reserve Bank of St. Louis

Table 34. Occupational Earnings: W om en’s Cement-Process (Conventional-Lasted) Shoes, Los Angeles—Long Beach, Calif.
(Number and average straight-time hourly earnings 1 of production workers in selected occupations, April 1962)
Number of w orkers receiving stra ight-tim e hourly earnings of—
Sex, departm ent, and occupationNumber
ofw orkers
Average hourly
earnings1
$ 1 . 1 0and
under$ 1 . 2 0
$ 1 . 2 0
$1.30
$1.30
$1.40
$1.40
$1.50
$1.50
$1.60
$1.60
$1.70
$1.70
$1.80
$1.80
$1.90
$1.90
$2 . 0 0
$2 . 0 0
$ 2 . 1 0
$ 2 . 1 0
$ 2 . 2 0
$ 2 . 2 0
$2.30
$2.30
$2.40
$2.40
$2 .50
$2.50
$2 .60
$2.60
$2.70
$2.70
$2.80
$2.80
$2.90
$2.90
$3.00
$3.00
$3.10
$3.10
$3.20
$3.20
$3.30
$3.30
$3.40
$3.40
$3.50
$3.50
$3.60
$3.60and
over
A ll production w o r k e r s _____________ 1, 317 $ 1 .7 9 98 104 174 84 119 98 107 75 53 60 53 58 46 21 31 36 26 19 19 8 8 8 4 3 2 3Men _________________________________ 570 2 . 06 26 31 25 25 38 37 40 28 26 40 18 34 33 16 25 34 23 19 19 7 7 7 4 3 2 3W om en _____________ ______________ 747 1. 59 72 73 149 59 81 61 67 47 27 2 0 35 24 13 5 6 2 3 - - 1 1 1 - - - -
Selected occupations
Men
Cutting:C utters, vamp and whole
shoe, hand 2 a / --------------------------- 10 2. 30 - - _ _ _ _ 1 1 - 1 _ 2 1 1 _ 1 1 1Cutters, vam p and whole
shoe, m achine --------------------------- 34 2 . 49 _ _ - 1 _ 1 1 _ 4 _ 3 2 3 3 6 2 3 3 2 _ _ _ _ _Tim e ___________________________ 8 2 . 39 - - _ _ _ _ _ 1 _ 2 _ _ 1 - 1 1 _ 1 1 _ _ _ _ _ _ _Incentive ______________________ 26 2. 52 _ - - _ 1 _ 1 _ - 2 - 3 1 3 2 5 2 2 2 2 _ _ _ _ _ _
F ittin g :Fancy stitchers --------------------------- 51 1 . 8 8 - 1 1 2 3 11 1 2 2 2 4 1 4 4 1 - 2 _ 1
T im e ___________________________ 31 1 .7 3 _ 1 1 2 3 9 10 1 - _ - 3 - _ _ _ _ 1Incentive --------------------- --------- 2 0 2 . 12 - - - _ - 2 2 1 2 4 1 1 4 1 - 2
Top stitchers _____________________ 13 1 . 81 - 1 1 - - 3 1 2 1 2 - 1 1Incentive ______________________ 8 1 .9 5 _ _ _ _ _ 2 _ 2 1 1 _ 1 1
L astin g : 2 b/A sse m b le rs for pullover,
m achine -------------------------------------- 13 2. 33 - - - - - - 1 _ 2 2 1 - - 1 2 2 1 _ 1 _ _ _ _ _ _ _H e e l-se a t la sters ------------------------ 6 2. 30 1 1 2 - 1 _ 1P u llover-m achin e
operators _______ _____ ______ 6 2. 84 - - - - - - - 1 - - - - - - 1 1 - - - 1 - 1 - - _ 1Side la s te r s , machine --------------- 8 2. 44 - - - - 1 - 1 - - - - 1 1 - - - 1 1 1 - 1 _ _ _ _ _Toe la s te rs , autom atic or
sem iautom atic --------------------------- 7 2 . 21 - - _ 1 _ _ _ 2 1 _ - - - 1 - - _ 1 1 - - _ _ _ _ _Bottoming and m aking: 2 b /
Edge trim m ers ---------------------------- 7 2. 52 1 1 1 1 1 2Heel attachers, m achine --------- 7 2. 33 _ _ _ _ - 1 _ 1 _ _ _ 1 2 - - - 1 _ _ _ 1 _ _ _ _ _Shank tackers ------------------------------- 6 1.9 9 _ _ 1 _ _ _ 1 _ _ 2 1 _ _ _ _ 1Sole attachers, cem ent
p roce ss --------------------------- --------- 11 2. 41 _ _ _ 2 _ 1 _ _ 1 _ _ 1 _ - 1 2 _ 2 - _ _ _ 1 _ _Finishing: 2 b /
Edge setters -------------------------------- 6 2 .9 1 1 - - - - 1 - - - 1 - - 2 _ 1 _ _O th er:
Janitors 2 a / ---------------------------------- 7 1 .4 4 2 1 1 " 3
Women
Fittin g :Fancy stitchers --------------------------- 58 1 . 80 - 3 2 2 6 9 11 7 5 3 4 2 2 - 1 - - - - - 1 - _ - _ _
31 1 .6 3 3 z 2 5 6 7 2 1 1 2Incentive ---------------------------------- 27 L 9 9 _ 1 3 4 5 4 2 2 2 2 _ 1 _ _ _ _ _ 1 _ _ _ _ _
Top stitchers ------------------------------- 25 1 . 8 6 - - 1 - 4 6 2 2 2 2 - 4 1 - - - 1Incentive ---------------------------------- 17 2 . 01 - - - - 1 3 1 2 2 2 - 4 1 - - - 1
Finishing:R epairers 2 a / ------------------------------- 56 1. 54 3 1 10 5 12 10 13 2
O th er:Inspectors (crow ners) 2 a / _____ 16 1. 56 1 3 4 4 3 1
1 Excludes prem ium pay for overtim e and for work on weekends, holidays, and late shifts.2 Insufficient data to w arrant presentation of separate averages by method of wage payment; (a) a ll or predominantly tim ew orkers, and (b) all or predominantly incentive w orkers.
Digitized for FRASER http://fraser.stlouisfed.org/ Federal Reserve Bank of St. Louis

cs
(Number and average straight-tim e hourly earnings 1 of w orkers in selected occupations,United States and selected regions, A pril 1962)
Table 35. Occupational Earnings: W om en’s Cement-Process (Slip-Lasted) Shoes, All Establishments
United States 2 Middle Atlantic Middle W est
Departm ent, occupation, and sex Numberof
workers
A veragehourly
earnings
Numberof
workers
A veragehourly
earnings
Numberof
w orkers
Averagehourly
earnings
Cutting:C utters, vam p and whole shoe,
m achine ________________________________________ 376 $ 1 .8 3 155 $ 1 .8 3 43 $ 1. 72Men ____________________________________________ 297 1 . 8 8 131 1 . 8 8 29 1. 85W om en ________________________________ ______ 79 1 .6 3 - - - -
Fitting:Fancy stitchers ------------------------------------------------- 412 1 .4 4 188 1 .4 7 85 1 .4 6
Men ------------------- ------------------------------------------- 27 1. 57 17 1 .6 0 - -W om en ________________________________________ 385 1 .4 3 171 1 .4 5 85 1 .4 6
P a ste rs , back ers, or fitte rs , upper,hand (155 wom en, 8 men) __________________ 163 1. 34 63 1 .2 5 40 1. 37
P la tfo rm -c o v e r stitchers ____________________ 203 1 . 80 144 1 .6 9 35 1. 75Men ____________________________________________ 36 1. 59 32 1 .5 5 - -W om en ________________________________________ 167 1. 84 1 1 2 1 .7 3 35 1 .7 5
Sock-lining stitchers _________________________ 241 1 .7 8 1 6 2 1 .6 5 25 1 .6 7Men ____________________________________________ 24 1 . 6 8 18 1 .6 3 _ _W om en ________________________________________ 217 1. 79 144 1 .6 5 25 1. 67
Lasting:P la tfo rm -c o v er lasteri_ _______________________ 87 2. 04 57 2. 15 2 0 1. 67
Men --------------- --------------------------------------------------- 78 2. 04 57 2. 15 15 1 .6 4W om en _________________________ ____________ 9 2. 05 _ - _ _
Bottoming and making:Edge trim m ers (all m e n )___ __________________ 47 1. 73 15 1 .4 2 16 1 . 82Sole attachers, cem ent process ____________ 6 6 1 . 62 33 1. 63 13 1 . 61
Men ____________________________________________ 60 1 . 62 33 1 .6 3 1 2 1. 58W omen -------------- ------------------------------------------- 6 1 . 6 6 - - - -
Finishing:R epairers (101 women, 2 men) _____________ 103 1. 37 - - 10 1 .7 5
M iscellaneous:F lo or boys (or girls) __________________________ 172 1. 29 70 1. 29 13 1. 38
Men _______________________________ __________ 77 1. 31 41 1 .3 0 - -W om en ________________________________________ 95 1 . 28 - - 1 1 1. 39
Inspectors (crow ners) _________________________ 94 1. 30 - - 12 1 . 28Men _________________ _________ _____________ 18 1 . 26 - - - -W om en ________________________________________ 76 1 .3 2 _ _ 1 2 1 . 28
Janitors (all m e n )----------------------------------------------- 25 1 . 26 13 1 .2 9
1 Excludes prem ium pay for overtim e and for work on weekends, holidays, and late shifts.2 Includes data for regions in addition to those shown separately.
NOTE: Dashes indicate no data reported or data that do not meet publication criteria.
Digitized for FRASER http://fraser.stlouisfed.org/ Federal Reserve Bank of St. Louis

Table 36. Occupational Earnings: W om en’s McKay (Including Littleway) Shoes, A ll Establishments
(Number and average stra ight-tim e hourly earnings 1 of w orkers in selected occupations, United States and New England, A pril 1962)
United States 2 New England
D epartm ent, occupation, and sex Numberof
workers
Averagehourly
earnings
Numberof
w orkers
Averagehourly
earnings
Cutting:C u tters, vam p and whole shoe, machine ________________ 247 $2. 05 1 1 0 $2. 56
M en __________________________________________________________ 154 2. 43 104 2 . 59W om en ______________________________________________________ 93 1 .4 2 - -
Fitting:Fancy stitchers (259 w om en, 4 men) -------------------------------P a ste r s , b a ck e rs, or fitters, upper, hand
263 1. 53 1 2 0 1. 76
(153 w om en, 2 men) _______________________________________ 155 1. 31 103 1. 33V am p ers (64 w om en, 6 men) _______________________________ 70 1. 40 16 1. 67
Lasting:A sse m b le rs for pullcver, machine ____ ___________________ 62 1. 70 27 1. 92
M en __________________________________________________________ 35 1. 77 15 2 . 08W om en ______________________________________________________ 27 1 . 60 12 1. 71
H e e l-se a t la sters {2* m en, 5 women) ------------------------------ 29 1. 78 14 2. 15P u llover-m ach in e operators (all m e n )------------------------------- 19 2. 13 10 2 . 61Side la s te r s , m achine (37 m en, 14 women) --------------------
Bottoming and making:51 2 . 08 2 2 2 . 62
Edge trim m ers (60 m en, 8 women) ______________________ 6 8 2 . 08 33 2. 34Heel attachers, machine (23 m en, 12 women) --------------- 35 1 . 6 6 16 1 . 89Littlew ay stitchers ___________________________________________ 1 01 1. 77 50 1. 98
M en __________________________________________________________ 79 1. 84 45 2. 03W om en ____________ ________________________________________ 2 2 1. 53 - -
Finishing:Bottom scou re rs (all m e n )___________________________________ 13 2. 24 10 2. 44Edge setters (all m e n )_________ , _____________________________ 13 1. 96 10 2. 05R epairers (109 w om en, 4 men) ____________________________ 113 1. 32 62 1. 32
M iscellan eou s:Floor boys (or g irls) ________________________________________ 154 1 . 26 106 1 . 26
Men __________________________________________________________ 60 1. 25 53 1. 25W om en ______________________________________________________ 94 1 . 26 53 1 . 26
Inspectors (crow ners) ___________________________ !----------------- 93 1. 36 6 8 1. 35Men __________________________________________________________ 16 1. 51 11 1. 50W om en ________________________________ ;--------------------------------- 77 1. 33 57 1. 32
1 Excludes prem ium pay for overtim e and for work on w eekends, holidays, and late shifts.2 Includes data for regions in addition to New England.
NO TE: Dashes indicate no data reported or data that do not m eet publication c riteria .
VO
Digitized for FRASER http://fraser.stlouisfed.org/ Federal Reserve Bank of St. Louis

(Num ber and average stra ight-tim e hourly earnings 1 of w orkers in selected occupations, United States and selected regions, A pril 1962)
Table 37. Occupational Earnings: Misses’ and Children’s Cement-Process (Conventional-Lasted) Shoes, All Establishments C/io
United States 1 2 New England Middle Atlantic Border States Great Lakes Middle W est
Departm ent, occupation, and sex Numberof
w orkers
Averagehourly
earnings
Numberof
workers
Averagehourly
earnings
Numberof
workers
Averagehourly
earnings
Numberof
w orkers
Averagehourly
earnings
Numberof
w orkers
Averagehourly
earnings
Numberof
w orkers
A veragehourly
earnings
Cutting:C utters, vam p and whole shoe,
m a c h i n e ____ __ 342 $ 1 . 9 8 55 $ 2 . 45 73 $ 2 . 1 0 43 $ 1 .6 7 2 2 $ 1 . 9 0 103 $ 1 . 8 8Men — _____ ___ _________________ 252 2. 07 40 2. 67 73 2 . 10 - - - - 91 1 .8 7W om en __ _____ 90 1 .7 3 - - - - 29 1 .6 2 17 1 . 80 12 1 .9 3
Fitting:Fancy stitchers (534 women, 9 men) ______ 543 1 .4 6 105 1 .7 8 1 1 2 1. 39 77 1.41 44 1. 39 126 1 . 39P a ste rs , backers, or fitte rs , upper, hand
(304 women, 18 men) 322 1 .3 9 52 I. 67 59 1.31 - - 27 1. 33 8 6 1. 42Top stitchers (all women) ------------------------------- 42 1 .6 3 17 1 .9 5 - - - - - - - -V am pers (61 women, 9 men) ________________
Lasting:70 1 .71 21 2. 03 33 1 .7 4 " - ■ " "
A sse m b le rs for pullover, m achine _________ 154 1 .7 0 26 2 . 39 23 1. 53 25 1. 36 15 1. 56 41 1 .7 5M en _____ _____ ___ _______ __ __________ 93 1.81 17 2. 51 23 1. 53 13 1 .4 4 _ - 27 1. 87W om en ________________ _______ __ __ 61 1. 53 _ - - - - - - - 14 1. 52
B ed-m ach ine operators (a ll m e n )------------------ 152 1 .9 3 25 2 .7 3 32 2 . 26 - - 24 1. 57 - -H e e l-se a t la ste rs (55 m en, 11 women) ____ 6 6 1 . 8 8 11 2 . 39 16 1 .9 0 6 1 . 8 8 7 1.71 16 1.71P u llover-m achin e operators (a ll m e n )--------- 39 2. 05 6 3. 05 2 0 2 . 10 - - - - - -Side la s te r s , m achine (121 m en,
5 women) ________ ____________________ ______ 1 2 6 1 .8 9 24 2. 53 13 1 .7 0 10 1. 37 - - 35 1 . 80Bottoming and making:
Edge trim m ers (168 m en, 10 women) _____ 178 1 .8 7 2 2 2. 33 26 2 . 2 0 25 1 .7 4 28 1. 83 50 1 .7 6H eel attachers, m achine (38 m en,
4 women) _____________ _____ ___ ___ _____ 42 1 .8 0 11 1 . 9 0 13 1. 94 - - - - - -Rough rounders (31 m en, 4 women) ------------ 35 1 .7 2 7 2. 31 - - - - - - - -Sole attachers, cem ent p ro ce ss ----- ----------- 139 1 .77 26 2. 37 27 1 .8 5 2 0 1 .5 3 12 1 .4 8 28 1 . 61
Me n _______ ___ .. , 104 1 . 8 6 2 2 2 .4 1 21 1 . 8 8 2 0 1. 53 7 1 .4 8 18 1 .7 5W om en _____________ ___ _ _ __ 35 1 .4 9 - - - - - - - - - -
Finishing:Edge setters (32 m en, 11 women) __________ 43 1.6 7 - - - - - - - - 10 1. 97R epairers (195 women, 6 men) ______________ 2 0 1 1 .4 2 46 1. 56 31 1. 34 17 1 .4 6 23 1. 25 50 1. 51
M iscellaneous:F lo or boys (or girls) ----------------- -------------------- 213 1 .2 9 56 1 .2 9 - - 2 0 1 .2 5 31 1. 39 36 1. 30
Mfin 93 1 . 26 34 1. 31 - - - - - - 17 1. 33W om en ______________ — _______ __ 1 2 0 1.31 2 2 1 .2 7 - - 2 0 1. 25 - - 19 1 . 28
Inspectors (crow ners) _________________________ i 259 1. 37 41 1. 36 40 1 .4 5 29 1. 31 15 1 .4 0 74 1 .4 4Men __________ __ __ __ ___ ___ __ 58 1. 52 _ - - - - - - - 21 1 .6 3W om en ____________________ _________ ______
i2 0 1 1 .3 3 34 1. 31 33 1 .4 6 24 1 .2 9 53 1.3 7
1 Excludes prem ium pay for overtim e and for work on weekends, holidays, and late shifts.2 Includes data for regions in addition to those shown separately.
NOTE: Dashes indicate no data reported or data that do not meet publication criteria.
Digitized for FRASER http://fraser.stlouisfed.org/ Federal Reserve Bank of St. Louis

Table 38. Occupational Earnings: Misses’ and Children’s Goodyear-Welt Shoes, All Establishments
(Number and average stra ight-tim e hourly earnings 1 of w orkers in selected occupations, United States and selected regions, A pril 1962)
Departm ent, occupation, and sex
United States 2 Middle Atlantic Great Lakes
Numberof
w orkers
Averagehourly
earnings
Numberof
workers
Averagehourly
earnings
Numberof
w orkers
Averagehourly
earnings
Cutting:C u tters, cloth lining, machine
(33 m en, 8 women) __________________________ 41 $ 1 . 61 34 $1. 64C u tters, leather lining, machine
(21 m en, 3 women) __________________________ 24 1. 84 19 1. 85 _C u tters, vam p and whole shoe,
machine _______________________________________ 322 2. 54 96 2 . 10 43 $2. 38Men ___________________________________________ 295 2 . 59 8 6 2. 13 34 2. 44W om en 27 1. 96 10 1 . 89 9 2. 17
Fitting:Fancy stitchers (337 women, 17 men) 354 1. 58 105 1. 40 52 1. 75P a ste r s , b a ck e rs, or fitters, upper,
hand (25 3 w om en. 2 men) 255 1. 45 1 21 1. 27 14 1. 40Top stitchers (all w om en)_____________________ 109 1 . 49 75 1. 45 15 1. 84V am p ers (a ll w om en )__________________________ 141 1. 47 96 1. 46 17 1 . 82
Lasting:A sse m b le rs for pullover, machine _ _ 104 1. 84 27 1. 65 18 1. 74
Men ___________________________________________ 84 1. 91 23 1. 65 - _W om en _ 2 0 1. 55 _ _ 11 1. 54
B ed-m ach ine operators (74 m en,3 women) _______________________________________ 77 2. 17 25 1. 90 - _
H e e l-se a t la sters (58 m en, 4 women) 62 2 . 0 0 16 1. 79 11 1. 83P u llover-m ach in e operators (all m e n )_____ 55 1. 94 39 1 . 89 7 2. 38Side la s te r s , m achine (all m e n )_____________ 150 2. 42 30 1 . 82 17 2. 54Toe la s te r s , autom atic or
sem iautom atic (a ll m e n )____________________ 42 1. 97 26 1. 95 7 2. 38Bottoming and making:
Bottom fille rs __________________________________ 43 1 . 81 18 1. 34 6 1. 52Men ___________________________________________ 2 0 2 . 10 8 1. 35 _ _W om en _______________________________________ 23 1. 56 10 1. 33 _ _
Edge trim m ers (180 m en. 3 women) 183 2 . 59 53 2 . 10 26 2 . 49Goodyear stitchers (all men) ________________ 182 2 . 19 44 1. 90 28 2. 38H eel attachers, machine (all m e n )_________ 44 2. 27 2 0 1. 71 7 2. 25In seam ers ( 8 8 m en, 1 woman) 89 2. 64 27 1. 91 13 2. 43Rough rounders (a ll men) _____________________ 65 2. 23 19 1. 93 12 2. 36Sole le v e le r s , machine ______________________ 31 1 . 8 8 12 1 . 61 6 1 . 81
Men ___________________________________________ 23 2 . 0 0 9 1 . 6 8 - -W om en _______________________________________ 8 1. 54 - - - -
Finishing:Bottom scou re rs (32 m en. 2 women) 34 1 . 82 7 1 . 6 6 7 2. 03Edge setters (75 m en, 1 woman) ___________ 76 2 . 6 8 2 2 2. 38 12 2 . 59R epairers _______________________________________ 1 6 8 1. 57 81 1. 34 18 1 . 82
Men ___________________________________________ 31 1. 51 17 1. 44 - -W om en ___ _ 137 1. 58 64 1. 32 18 1 . 82
T re ers (52 w om en. 5 men) ____ _ 57 1. 55 - - 13 1. 98M iscellan eou s:
F loor boys (or g irls) ( 6 6 women,46 men) ________________________________________ 1 1 2 1. 41 7 1. 56 14 1. 47
Inspectors (crow ners) ________________________ 1 2 0 1. 58 34 1. 57 19' 1. 54Men ___________________________________________ 43 1. 57 15 1. 54 - -W om en ________________________________________ 77 1. 58 19 1 . 59 14 1. 42
M ech anics, maintenance (all m e n )__________ 17 1. 89 13 1 . 80
1 Excludes prem ium pay for overtim e and for work on w eekends, holidays, and late shifts.2 Includes data for regions in addition to those shown separately.
NO TE: D ashes indicate no data reported or data that do not m eet publication criteria .
Digitized for FRASER http://fraser.stlouisfed.org/ Federal Reserve Bank of St. Louis

Table 39. Occupational Earnings: Misses’ and Children’s Goodyear-Welt Shoes, Southeastern Pennsylvania
(Number and average straight-time hourly earnings 1 of production workers in selected occupations, April 1962)
Cnto
Sex, departm ent, and occupation
A ll production w orkers _____________Men ________________________________W om en _____________________________
Selected occupations Men
Cutting:C utters, cloth lining,
machine 1 2 a / ____________________C utters, leather lining,
machine 2 a / -------------------------------C utters, vamp and whole
shoe, m achine 2 b / _____________Lasting:
A sse m b le rs for pullover,m achine 2 b / ____________________
H e e l-se a t la sters 2 b / ___________P ullover-m achin e
operators _______________________Tim e ___________________________Incentive ______________________
Side la s te rs , m achine __________Incentive ----------------------------------
Toe la s te rs , autom atic orsem iautom atic 2 b / _____________
Bottoming and making:Edge trim m ers 2 b / ______________Goodyear stitchers 2 b / --------------Heel attachers, machine 2 a /In seam ers 2 b / ___________________Rough ro u n d ers2 b / -------------------
Finishing: 2 b /Edge setters --------------------------------R epairers --------------------------------------
Other: 2 a /Inspectors (crowners) ---------------M echanics, maintenance ---------
W om en
Fitting:Fancy stitchers ---------------------------
T im e ___________________________Incentive ----------------------------------
P a sters , backers, or fitte rs ,upper, hand -------------------------------
Incentive ----------------------------------Top stitchers -------------------------------
Tim e -----------------------------------------Incentive ----------------------------------
V am pers ---------------------------------------Tim e -----------------------------------------Incentive ----------------------------------
Finishing:R epairers --------------------------------------
Tim e -----------------------------------------Incentive ----------------------------------
Other: 2 a /F loor g irls -----------------------------------Inspectors (crowners) ---------------
1 Excludes prem ium pay for overtim e and for work on weekends, holidays, and late shifts.2 Insufficient data to warrant presentation of separate averages by method of wage payment; (a) all or predominantly tim ew orkers, and (b) all or predominantly incentive w orkers.
Digitized for FRASER http://fraser.stlouisfed.org/ Federal Reserve Bank of St. Louis

Table 40. Occupational Earnings: Misses’, Children’s, and Infants’ Stitchdown Shoes, All Establishments
(Number and average stra ight-tim e hourly ea rn in g s1 of w orkers in selected occupations, United States and selected regions, A pril 1962)
Departm ent, occupation, and sex
United States 2 Middle Atlantic Great Lakes
Numberof
w orkers
Averagehourly
earnings
Numberof
w orkers
Averagehourly
earnings
Numberof
w orkers
Averagehourly
earnings
Cutting:Cutters, cloth lining, machine _____________ 42 $ 1.51 26 $ 1.64
Men ___________________________________________ 24 1 . 6 6 17 1.75 - -W om en _______________________________ ______ 18 1.32 9 1.45 - -
C utters, vam p and whole shoe,machine ____________________________ __________ 364 1.79 149 2.05 52 $ 1.71
Men ____________________ — ____________________ 204 2.05 105 2 . 2 1 2 6 2 . 0 0W om en ------------------------------------------------------------ 1 6 0 1.44 44 1.64 26 1.42
Fitting:Fancy stitchers ------------------------------------------------ 427 1.43 96 1.69 48 1.30
Men ___________________________________________ 21 2.56 21 2.56 - -W om en ------------------------------------------------------------ 406 1.37 75 1.45 48 1.30
P a ste rs , back ers, or fitters, upper,hand (141 wom en, 2 men) --------------------------- 143 1.27 58 1.29 32 1.29
Top stitchers ------------------ -------------------------------- 181 1.49 73 1.84 9 1.32Men __ — _ — — — - --------------- - — 13 2.82 13 2.82 - _W o m e n _ _ -- ----------------------- ---- 1 6 8 1.39 6 0 1.62 9 1.32
V am pers — — __ ------------- -------- - 229 1.46 117 1.67 12 1.31M e n _ ____ ___ __ _______ _____ ______ 21 2.51 2 0 2.58 - -W o m e n ____ ________ __ _____ ______ 208 1.35 97 1.49 12 1.31
Lasting:A sse m b le rs for pullover, machine _________ 73 1.46 1 2 1.58 19 1.46
M e n _______________________________________ _ 43 1.49 8 1.56 - _W o m e n _________ _____ __ ________ ___ ______ __ 30 1.41 - - 15 1.39
H e e l-se a t la ste rs (23 men,1 woman) _ ___ __ __ _ __ _ _____ __ 24 1.65 9 1.80 - -
Side la s te r s , machine (22 men,1 woman) _ — ----------------------- — _________ 23 1.57 7 1.58 8 1.76
Thread la ste rs (a ll m e n )---- ----------- 128 2.47 79 2.73 - -Toe fo rm e rs ------------------------------------------------------ 28 1.37 18 1.45 - _
Men — ________________________ _____________ 17 1.44 14 1.44 - _Wnm f>n 11 1.27 - - - -
Bottoming and m aking:Edge trim m e rs (174 m en, 3 women) _______ 177 2.09 63 2.56 23 2 . 0 6Goodyear stitchers (264 men, 5 w o m e n )__ 269 1.89 109 2.14 33 1.72H eel attachers, machine (all m e n )__________ 71 1.78 33 2.04 - _Rough rounders (81 men, 2 women) ________ 83 1.78 41 1.96 7 1.77
Finishing:Edge setters (53 m en, 2 women) ___________ 55 2 . 0 1 32 2.29 - -R epairers ( 8 8 wom en, 2 men) ______________ 92 1.30 19 1.37 17 1.27
M iscellaneous:F loor boys (or girls) __ _____________________ 1 2 0 1 . 2 0 31 1.27 31 1 . 1 6
Men _____ _________ ________________________ 59 1 . 2 2 25 1.29 - _W om en ------------------------------------------------------------ 61 1.17 6 1.18 30 1 . 1 6
Inspectors (crow ners) ________________________ 106 1.28 16 1.52 14 1.24Men ________________________ _________________ 16 1.34 - - - -W om en _________ ____________________________ 90 1.27 10 1.53 14 1.24
Janitors (43 m en, 1 woman) _________________ 44 1.18 11 1 . 1 6 10 1 . 2 0M ech anics, maintenance (all m e n )_________ 38 1.71 6 1.98 10 1.72
1 Excludes prem ium pay for overtim e and for work on weekends, holidays, and late shifts.2 Includes data for regions in addition to those shown separately.
N O T E : D ashes indicate no data reported or data that do not m eet publication criteria .
Cn
Digitized for FRASER http://fraser.stlouisfed.org/ Federal Reserve Bank of St. Louis

Table 41. Occupational Earnings: Misses’, Children’s, and Infants’ Stitchdown Shoes, New York, N.Y.
(Number and average straight-time hourly earnings1 of production workers in selected occupations, April 1962)
Cn
Sex, departm ent, and occupation
A ll production w o r k e r s ____________M e n ________________________________W om en _____________________________
Selected occupations
MenCutting;
C utters, cloth lining,machine 2 a / ____________________
C utters, vamp and whole shoe,m achine 2b / ____________________
Fitting: 2 b /Fancy stitchers _________________Top stitchers ____________________V am pers __________________________
Lasting: 2 b /Thread la ste rs __________________
Bottoming and m aking: 2b /Edge trim m ers __________________Goodyear stitchers _____________Heel attachers, machine ______Rough rounders _________________
Finishing: 2 b /Edge setters _____________________
Other: 2a /F loor boys ________________________
W omen
Fitting: 2 a /P a ste rs , backers, or fitte rs ,
upper, hand ____________________
Numberof
w orkers
Average hourly
earnings 1
676 $ 1.99432 2.29244 1.45
7 1.77
32 2.67
15 2.7913 2.822 0 2.58
33 3.11
2 2 2.8132 2.49
9 2.479 2.25
8 3.10
9 1.31
9 1.47
Num ber of w orkers receiving stra ight-tim e hourly earnings of—$4 .10
andunder$ 1.20
$1.20|$1.30|$1.40
$1 .30$ 1 .4 0$1 .50
1222498
$1.5 0j 1. €> 0($ 1.7 0j$ 1.8 0|$ 1.9 0($ 2.0 0)$ 2.1 CM$ 2.2 0|$ 2.3 01$ 2.4 0t$ 2.5 01$ 2.60
$ 2 .2 0 $ 2 .3 0 $ 2 .4 0 $ 2 .5 0 $ 2 .6 0 $ 2 .7 0$ 1 .6 0 $ 1 .7 0$1 .80$ 1 .90 $2 .00$ 2 .10
$2.70l$2.8()j$2.96|$3.00
$2.80 $ 2 .9 0 $ 3 .0 0 $ 3 .10
W To
$3 .20
$3.20
$3.30
$ 3 3 0
$3.40
$3.40
$3 .50
$3 .50
$3 .60
$3.60
and
over
2626
1 Excludes prem ium pay for overtim e and for work on weekends, holidays, and late shifts.2 Insufficient data to w arrant presentation of separate averages by method of wage payment; (a) all or predominantly tim ew orkers, and (b) a ll or predominantly incentive w orkers.3 W orkers w ere distributed as fo llow s: 1 at $ 3 .6 0 to $ 3 .7 0 ; 5 at $ 3 .7 0 to $ 3 .8 0 ; 1 at $ 3 .8 0 to $ 3 .9 0 ; and 4 at $ 4 .1 0 and over.4 W orkers w ere distributed as fo llow s: 1 at $ 3 .6 0 to $ 3 .7 0 ; and 1 at $ 4 .6 0 to $ 4 .7 0 .
Digitized for FRASER http://fraser.stlouisfed.org/ Federal Reserve Bank of St. Louis

Table 42. Scheduled W eekly Hours
(Percent of production and office workers in footwear manufacturing establishments by scheduled weekly hoursof first-shift w orkers,1 United States and selected regions, April 1962)
W eekly hours United States 2
NewEngland
MiddleAtlantic
BorderStates Southwest Great
LakesMiddleW est Pacific
Production w orkers
A ll production w orkers __________________________ 100 100 100 100 100 100 100 100
Under 32 h o u r s_____________________________________ (3 ) _ _ 5 _ _ _ >32 h o u r s ----- ------------ -------------------------- ------------------------- 4 - (?) - 3 6 17 -35 or 36 h o u r s______________________________________ (3 ) (3 ) (3 ) - - 1 (3 ) -40 h o u r s_____________________________ _______________ 92 99 91 95 78 92 78 100Over 40 and under 45 h o u r s ____ _______________ 1 - 2 - - 1 - -45 h o u rs ............. .................... .............. — ------------------------ 2 - 3 - 18 (3) 4 -Over 45 hours ______________________________________ (3 ) " 3 “ "
O ffice w orkers
A ll office w orkers _________________________________ 100 100 100 100 100 100 100 100
32 h o u r s______________________________________________ (3 ) _ _ _ _ 1 (3) -
35 hours _______ _______________________________________ 4 6 8 - - - - -361 /4 hours __________________________________________ 1 1 3 - - - - -37V 2 h o u r s ------------- -------------------------------------------------- 2 3 4 14 - - - -39 h o u r s ---------------- ----------------------------------------------------- 1 - 4 - - - - -40 h o u r s______________________________________________ 91 90 79 86 76 99 99 100Over 40 hours _______________________________________ 1 (3 ) 1 24 (3 )
1 Data relate to the predominant work schedule for fu ll-tim e w orkers in each establishm ent.2 Includes data for regions in addition to those shown separately.3 L e ss than 0. 5 percent.
N O TE: Because of rounding, sums of individual item s m ay not equal 100.
Table 43. Shift Differential Practices
(Percent of production workers em ployed on second shifts 1 in footwear manufacturing establishm ents by amount of pay d ifferen tial, United States and selected regions, A pril 1962)
Shift differential United States 2
NewEngland
MiddleAtlantic
BorderStates Southwest Great
LakesMiddleW est Pacific
W orkers em ployed on second shift ___________ 1 .4 0. 5 2. 2 0. 1 0. 6 3. 7 0. 1Receiving shift differential .4 . 5 . 3 . 1 (?) .9 . 1 -
U niform cents per hour __________________ .4 . 5 . 3 - ? . 7 . 1 -5 cents ---------------------------------------------------- . 3 . 5 - - (3 ) . 7 . 1 -7 cents ___________________________________ . 1 - . 3 - - - - -
U niform percentage ______________________ (?) - - - - . 1 - -4 percent _ ______________________ ( !) - - - ■ . 1 - ■
8 h ou rs' pay for 7 V2 hours' work --------- (3 ) - - . 1 - - - -Receiving no shift differential _____________ 1 . 0 1. 9 .•5 2. 8
Data for third shifts omitted as le ss than 0. 05 percent w ere em ployed on such operations. Includes data for regions in addition to those shown separately.L e ss than 0. 05 percent. cn
Digitized for FRASER http://fraser.stlouisfed.org/ Federal Reserve Bank of St. Louis

Table 44. Paid Holidays cn0 's
(Percent of production and office workers in footwear manufacturing establishments with formal provisionsfor paid holidays, United States and selected regions, April 1962)
Num ber of paid holidays United States 1
NewEngland
MiddleAtlantic
BorderStates Southwest Great
LakesMiddleW est P acific
Production w orkers
A ll production w orkers ___________________________ 1 0 0 1 0 0 1 0 0 1 0 0 1 0 0 1 0 0 1 0 0 1 0 0
W orkers in establishm ents providingpaid holidays ______________________________________ 93 97 95 90 92 97 98 87
2 days _____________________________________________ 1 2 - 3 6 - - -3 days _____________________________________________ 2 3 3 - 14 (2) 1 -4 days _____________________________________________ 5 3 - 15 13 9 3 -5 days _____________________________________________ 10 11 2 0 - 9 2 2 -5 days plus 2 half days ------------------------------------ 1 - - - - 4 - -6 days _____________________________________________ 40 14 41 72 41 57 90 -6 days plus 1 half day -------------------------------------- 5 1 7 - - 2 0 2 -6 days plus 2 half days ________________________ 1 1 3 - - 2 - -7 days _____________________________________________ 16 38 6 - 10 3 - -7 days plus 1 half day _________________________ (!) - 2 - - - - -7 days plus 2 half days ________________________ (2) 1 - - - - - -8 days _____________________________________________ 8 18 5 - - 1 - 858 days plus 1 half day _________________________ 1 - 7 - - - - 39 days _____________________________________________ 1 4 " - " "
W orkers in establishm ents providingno paid holidays __________________________________ 7 3 5 10 8 3 2 13
Office w orkers
A ll office w orkers _________________________________ 1 0 0 1 0 0 1 0 0 1 0 0 1 0 0 1 0 0 1 0 0 1 0 0
W orkers in establishm ents providingpaid holidays ______________________________________ 97 99 1 0 0 99 92 94 99 83
2 days ___________ *______________ ________________ 1 1 _ 1 2 - - -3 days _____________________________________________ (2) - (2) - 9 (2) - -4 days ___________________________ __________ ___ 2 (2) - 7 16 - 2 -5 days _____________________________________________ 15 11 30 - 28 2 3 -5 days plus 2 half days ________________________ 1 - - - - 4 - -6 days ______________________________ 36 18 30 82 27 54 83 -6 days plus 1 half day _________________________ 7 1 4 - - 28 1 96 days plus 2 half days _______ ______________ 2 1 3 - - 2 - -7 days ________________________ __________________ 12 23 11 2 7 2 7 -7 days plus 1 half day _______________ _______ 1 - 1 - - 1 2 -7 days plus 2 half days ________________________ 1 2 - - - - - -8 days _____________________________________________ 8 16 7 7 2 1 - 718 days plus 1 half day _________________________ 2 - 10 - - - - 49 days ________________________ __ ______________ 7 18 - - - - - -9 days plus 2 half days __________________ ___ (2) 1 - - - - - -10 days ______________________ _____ _______ — 3 7 - - - - - -11 days plus 1 half day _______ ______________ (2) - 3 - " ~ "
W orkers in establishm ents providing -no paid holidays ______________ __ ______________ 3 1 1 8 6 1 17
1 Includes data for regions in addition to those shown separately.2 L e ss than 0. 5 percent.
NO TE: B ecause of rounding, sums of individual items m ay not equal totals.
Digitized for FRASER http://fraser.stlouisfed.org/ Federal Reserve Bank of St. Louis

Table 45. Paid Vacations
(Percent of production and office workers in footwear manufacturing establishments with formal provisionsfor paid vacations, United States and selected regions, April 1962)
Vacation policy United States 1
NewEngland
MiddleAtlantic
BorderStates Southwest G reat
LakesMiddleW est Pacific
Production w orkers
A ll production w orkers __________________________ 1 0 0 1 0 0 1 0 0 1 0 0 1 0 0 1 0 0 1 0 0 1 0 0
Method of payment
W orkers in establishm ents providingpaid vacations ____________________________________ 98 99 99 96 96 1 0 0 99 1 0 0
L e n g th -o f-tim e payment ______________________ 69 51 76 89 69 78 96 1 0 0Percentage payment __________________________ 29 47 23 7 27 2 2 3 -Other _____________________________________________ (2) 1 (2) - - - - -
W orkers in establishm ents providingno paid vacations ________________________________ 2 1 1 4 4 1
Amount of vacation pay 3
A fter 1 year of service
Under 1 week ______________________________________ 1 3 _ 5 . _ _ _1 week _______________________________________________ 95 95 99 91 92 92 99 1 0 0Over 1 and under 2 weeks _______________________ 1 (2) - - - 2 - -2 w eeks ______________________________________________ 1 1 - - 5 2 - -
A fter 3 years of service
Under 1 w eek ______________________________________ 1 2 _ 5 _ _ _ _1 week __ ________ ____ _________________ _ 92 94 90 85 91 90 93 97Over 1 and under 2 weeks _________________ —____ 3 1 6 - - 6 2 -2 weeks ______________________________________________ 3 2 3 6 6 4 3 3
A fter 5 years of service
Under 1 week ______________________________________ 1 1 _ _ _ _ _ _1 week _______________________________________________ 17 23 2 0 18 33 3 4 13Over 1 and under 2 weeks _______________________ 2 1 5 - - 1 2 -2 weeks ______________________________________________ 79 72 75 78 63 96 93 87Over 2 weeks _____________________________________ (2) 1 - - - - -
A fter 10 years of service
Under 1 week ______________________________________ 1 1 _ _ _ _ _1 week _______________________________________________ 17 2 2 2 0 16 33 3 4 13Over 1 and under 2 weeks _______________________ (2) 1 - - - - - -
2 w eeks ______________________________________________ 75 73 74 80 63 73 93 87Over 2 and under 3 weeks ________________________ 4 1 1 - - 23 2 -
3 weeks ______________________________________________ 1 1 4 - - - - -
A fter 15 years of s e r v ic e 4
Under 1 week ______________________________________ 1 1 _ _ _ _ _ _
1 week _______________________________________________ 16 2 2 18 16 33 3 4 13Over 1 and under 2 weeks ________________________ (2) 1 - - - - - -
2 weeks ______________________________________________ 54 70 75 65 28 30 17 87Over 2 and under 3 weeks _______________________ 1 (2) 1 - - - 2 -
3 weeks ______________________________________________ 26 4 5 15 35 6 6 76
See footnotes at end of table. Cn<1
Digitized for FRASER http://fraser.stlouisfed.org/ Federal Reserve Bank of St. Louis

Table 45. Paid Vacations— Continued C/iCO
(Percent of production and office workers in footwear manufacturing establishments with formal provisionsfor paid vacations, United States and selected regions, April 1962)
Vacation policy United States 1
NewEngland
MiddleAtlantic
BorderStates Southwest Great
LakesMiddleW est Pacific
Office w orkers
A ll office w orkers _________________________________ 1 0 0 1 0 0 1 0 0 1 0 0 1 0 0 1 0 0 1 0 0 1 0 0
Method of payment
W orkers in establishm ents providingpaid vacations ____________________________________ 99 99 99 1 0 0 98 1 0 0 99 1 0 0
L e n gth -of-tim e payment ______________________ 89 91 92 94 93 87 99 1 0 0P ercentage payment ___________________________ 11 8 6 6 5 13 - -Other _____ ________________________________________ (2) - (2) - - - - -
W orkers in establishm ents providingno paid vacations ________________________________ 1 1 1 2 1
Amount of vacation pay 3
A fter 1 year of service
Under 1 week _______________________________________ (Z) _ _ 13 _ _ _ _1 week _______________________________________________ 69 60 80 80 6 8 63 79 76Over 1 and under 2 weeks ________________________ 1 1 3 - - - - -2 weeks ______________________________________________ 29 38 16 7 29 37 21 24
After 3 years of service
Under 1 week _______________________________________ (2) _ _ 13 _ _ _ _1 week _______________________________________________ 57 51 6 8 74 65 40 67 41Over 1 and under 2 weeks ------------------------------------ 3 2 8 _ - 3 1 -2 weeks ______________________________________________ 38 46 23 13 33 54 31 59Over 2 weeks _______________________________________ 1 (2) - - - 4 - -
A fter 5 years of service
1 week ________________________________________________ 13 17 16 33 17 2 3 _Over 1 and under 2 weeks ________________________ (2) - 1 - - 1 1 -2 weeks _______________________________________________ 84 81 83 67 81 92 95 1 0 0Over 2 weeks _______________________________________ 1 1 - - - 4 - "
A fter 10 years of service
1 week _______________________________________________ 13 16 16 29 17 2 3 _2 weeks ______________________ _________________________ 81 80 83 71 81 77 95 1 0 0Over 2 and under 3 weeks ------------------------------------ 3 - - - - 16 1 -3 weeks _______________________________________________ 2 2 1 - - 4 - -
After 15 years of service 4
1 week ________________________________________________ 13 16 16 29 17 2 3 _2 weeks __________________________________ _____________ 59 78 81 49 56 23 24 1 0 0Over 2 and under 3 weeks _____________________ __ (2) - - - - - 1 -3 weeks _______________________________________________ 27 4 2 2 2 25 75 71
1 Includes data for regions in addition to those shown separately.2 L e ss than 0. 5 percent.3 Vacation payments such as percent of annual earnings w ere converted to an equivalent tim e b asis. Periods of service w ere arb itrarily
chosen and do not n ec essa rily reflect individual establishment provisions. For exam ple, the changes in proportions indicated at 5 years may include changes which occu rred after 4 years of service.
4 Vacation provisions w ere virtually the sam e after longer periods of service .
N O TE: Because of rounding, sums of individual item s may not equal totals.
Digitized for FRASER http://fraser.stlouisfed.org/ Federal Reserve Bank of St. Louis

Table 46. Health, Insurance, and Pension Plans
(Percent of production and office workers in footwear manufacturing establishments with specified health,insurance, and pension plans, United States and selected regions, April 1962)
Type of p lan 1 United States 2
NewEngland
MiddleAtlantic
BorderStates Southwest Great
LakesMiddle
W est Pacific
Production w orkers
A ll production w orkers ---------------------- — — — 1 0 0 1 0 0 1 0 0 1 0 0 1 0 0 1 0 0 1 0 0 1 0 0
W orkers in establishm ents providing:Life insurance __________________________________ 80 77 85 77 59 77 93 87A ccidental death and dism em berm ent
insurance ______________________________________ 2 6 37 27 21 11 16 18 19Sickness and accident insurance or
sick leave or both 3 _________________________ 65 63 74 59 57 65 84 _Sickness and accident insurance ------------ 65 63 74 59 52 65 84Sick leave (full pay, no waiting
period) _________ __ __ _____ __ ______ (4 ) - - - 1 2 -Sick leave (partial pay or waiting
period) _______ __ __ _____ — __ __ (4 ) - - - 5 - - -H ospitalization insurance ___________ ___ ____ 83 78 87 76 89 80 90 87Surgical insurance _____ __ -------------------------- 81 78 82 73 89 80 90 87M edical insurance __________ _________ ______ 59 64 40 64 6 8 52 90 61Catastrophe insurance ------------ __ __ __ — 6 1 23 3 4 1 3 _R etirem ent pension _ __ __ ------------------- — 42 27 31 18 35 75 75 71No health, insurance, or pension plan ____ 8 12 4 11 11 5 5 13
O ffice w orkers
A ll office w orkers __________ _____________________ 1 0 0 1 0 0 1 0 0 1 0 0 1 0 0 1 0 0 1 0 0 1 0 0
W orkers in establishm ents providing:Life insurance ___ ________________ ___ __ __ 82 79 8 6 67 65 82 95 83A ccidental death and dism em berm ent
insurance ______________________________________ 32 46 30 36 31 19 26 26Sickness and accident insurance or
sick leave or both 3 __ _____ __ — ~ __ 69 72 83 58 62 69 72 45Sickness and accident insurance ________ 59 61 76 33 39 58 72 _Sick leave (full pay, no waiting
period) ___________ __ __ _____ __ __ __ 24 35 25 36 3 21 _ 45Sick leave (partial pay or waiting
period) ___ ________________ __ _____ __ 1 - - - 2 0 - - -Hospitalization insurance _ _____ __ __ __ 85 79 92 6 2 91 90 87 83Surgical insurance ____________________________ 84 78 87 56 91 90 87 83M edical insurance ______ __ __ __ __ ______ 58 6 6 40 41 67 55 87 45Catastrophe insurance _______________________ 4 2 14 1 5 1 5 _Retirem ent pension _ __ __ __ _____________ 31 13 16 21 25 77 46 45No health, insurance, or pension plan ____ 5 8 1 12 9 2 3 17
1 Includes only those plans for which at least part of the cost is borne by the em ployer. Legally required plans such as w orkm en's com pensation and social security were excluded; however, those plans required by tem porary disability insurance laws were included if financed at least in part by the em ployer.
2 Includes data for regions in addition to those shown separately.3 Unduplicated total of w orkers receiving sick leave or sickness and accident insurance shown separately.4 L e ss than 0 .5 percent.
OnO
Digitized for FRASER http://fraser.stlouisfed.org/ Federal Reserve Bank of St. Louis

Table 47. Nonproduction Bonuses O nO
(Percent of production and office workers in footwear manufacturing establishments with specified types ofnonproduction bonuses, United States and selected regions, April 1962)
Type of bonus United States 1
NewEngland
MiddleAtlantic
BorderStates Southwest Great
LakesMiddle
W est Pacific
A ll production w orkers ______________________ __
Production w orkers
1 0 0 1 0 0 1 0 0 1 0 0 1 0 0 1 0 0 1 0 0 1 0 0
W orkers in establishm ents withnonproduction bonuses __________________________ 17 7 35 15 33 2 2 4 -
C hristm as or yearend _________________________ 13 6 33 7 23 9 1 -Profit sharing __________________________ ______ 3 1 - 8 10 11 3 -Other __________________________________ __ --------- 1 (2 ) 2 - - 3 - -
W orkers in establishm ents with nononproduction bonuses __________________________ 83 93 65 85 67 78 96 1 0 0
Office w orkers
A ll office w orkers ______ ________________ ______-___ _ 1 0 0 1 0 0 1 0 0 1 0 0 1 0 0 1 0 0 1 0 0 1 0 0
W orkers in establish m en ts withnonproduction bonuses -------------------------------- — 38 39 56 34 40 30 10 33
C hristm as or yearend _________________________ 33 36 55 29 40 16 1 33Profit sharing _______ _________ _________ __ 4 2 - 5 - 10 9 -Other ___ ___________________________________ __ 1 1 1 - - 3 - -
W orkers in establish m en ts with nononproduction bonuses ______ _____________ __ 62 61 44 6 6 60 70 90 67
1 Includes data for regions in addition to those shown separately.2 L e ss than 0.5 percent.
N O TE ; B ecause of rounding, sums of individual item s may not equal totals.
Digitized for FRASER http://fraser.stlouisfed.org/ Federal Reserve Bank of St. Louis

Appendix A: Scope and Method of Survey
Scope of Survey
The survey included establishments primarily engaged in the production of boots and shoes (except houseslippers and rubber footwear) designed primarily for street, work, play or sportswear (industry 3141 as defined in the 1957 edition of the Standard Industrial Classification Manual, prepared by the U .S. Bureau of the Budget). Separate auxiliary units such as central offices were excluded.
The establishments studied were selected from those employing 50 or more workers at the time of reference of the data used in compiling the universe lists.
The number of establishments and workers actually studied by the Bureau, as well as the number estimated to be within the scope of the survey during the payroll period studied, are shown in the table on the following page.
Industry Branches
The classification of establishments by industry branch was determined on the basis of the principal type of footwear manufactured. For example, if the value of an establishment’s product was 60 percent women’s McKay shoes and 40 percent women’s cement-process (conventional-lasted) shoes, all workers in that establishment were included in the women's McKay shoe branch.
Method of Study
Data were obtained by personal visits of Bureau field economists under the direction of the Bureau's Assistant Regional Directors for Wages and Industrial Relations. The survey was conducted on a sample basis. To obtain appropriate accuracy at minimum cost, a greater proportion of large than of small establishments was studied. In combining the data, however, all establishments were given their appropriate weight. All estimates are presented, therefore, as relating to all establishments in the industry group, excluding only those below the minimum size at the time of reference of the universe data.
Establishment Definition
An establishment, for purposes of this study, is defined as a single physical location where industrial operations are performed. An establishment is not necessarily identical with the company, which may consist of one or more establishments.
Employment
The estimates of the number of workers within the scope of the study are intended as a general guide to the size and composition of the labor force included in the survey. The advance planning necessary to make a wage survey requires the use of lists of establishments assembled considerably in advance of the payroll period studied.
Production Workers
The term "production w orkers," as used in this bulletin, includes working foremen and all nonsupervisory workers engaged in nonoffice functions. Administrative, executive, professional, and technical personnel, and force-account construction employees who were utilized as a separate work force on the firm's own properties, were excluded.
Office Workers
The term "office w orkers," as used in this bulletin, includes all nonsupervisory office workers and excludes administrative, executive, professional, and technical employees.
61
Digitized for FRASER http://fraser.stlouisfed.org/ Federal Reserve Bank of St. Louis

62
E stim ated num ber of estab lish m en ts and w ork ers within scope of su rvey and num ber studied, footw ear m anufacturing esta b lish m en ts, A p ril 1962
N um ber of estab lish m en ts 3
W o rk ers in e;;:,ablish m ents
Industry branch, region , 1 and area 2 3 4 5 6 W ithin scope
of studyStudied
Within scope of study Studied
T o t a l4Production
w ork ersO ffice
w ork ers T otal
A ll esta b lish m en ts:United States 5 --------------------------------------------------------------- 727 486 203, 231 182, 449 9, 328 151, 676
New E n g la n d ------------------------------------------------------------ 258 173 73 , 418 6 5 ,6 8 8 3, 726 55, 653M iddle Atlantic ____________________________________ 175 92 39, 511 3 5 ,9 5 8 1, 463 23, 409B order States --------------------------------------------------------- 30 2 2 8 , 410 7, 795 153 6 , 606S o u th w e st___________________________________________ 30 2 0 8 , 2 2 0 7, 509 258 6 , 207G reat Lakes ________________________________________ 106 76 3 2 ,4 8 0 2 8 ,5 8 6 1 , 9 0 6 2 7 ,3 6 2M iddle W e st ------------------------------------------------------------ 71 63 23, 642 21, 361 1, 042 2 0 ,9 9 7P acific _____________________________________________ 13 11 1, 941 1, 589 82 1, 723
M en ’ s G o o d y e a r-w elt d re ss sh oes:United States 5 _________________________________________ 124 81 41 , 304 36, 037 2, 823 3 0 ,0 0 0
New E n glan d 6 --------------------------------------------------------- 50 32 14, 984 13, 137 1, 041 1 0 ,6 8 7B rockton, M a s s . ______________________________ 2 1 15 5, 202 4, 529 367 4, 392
G reat Lakes 6 --------------------------------------------------------- 35 2 2 12, 046 1 0 ,0 1 3 1, 149 9, 702W iscon sin ______________________________________ 2 0 14 5, 406 4, 447 600 4, 591
M en ’ s G oo d y e a r-w elt w ork sh o es:United States 5 _________________________________________ 2 6 23 7, 8 8 6 7, 046 346 7, 037
New England ------------------------------------------------------------ 9 9 2 , 169 1 ,9 2 4 1 2 0 2 , 169G reat Lakes ________________________________________ 7 6 1, 903 1, 674 95 1, 732
M en ’ s c e m e n t-p r o c e ss sh o es:United States 5 __________________________________________ 1 2 10 3, 602 3, 269 146 3, 266
New E n g la n d ------------------------------------------------------------ 6 4 1, 827 1 , 6 2 6 1 0 1 1, 491W om en ’ s c e m e n t-p r o c e ss (con ven tion al-lasted )
sh o es:United States 5 --------------------------------------------------------------- 273 196 8 7 ,0 9 4 78 , 998 3, 674 6 8 , 0 6 2
New E n glan d 6 ______________________________________ 127 93 39, 913 36, 404 1 , 6 2 8 32, 104Auburn—L ew iston , M aine ___________________ 7 7 2, 865 2, 613 130 2, 865M aine (except Auburn—L e w isto n )---------------- 17 12 7, 280 6 , 734 307 5, 314B oston , M a s s . ________________________________ 9 8 1, 752 1, 566 73 1, 690H a v e rh ill, M a s s . --------------------------------------------- 17 13 4, 479 4, 065 194 3, 858L aw rence—L ow ell, M a s s . ----------------------------- 16 11 4, 084 3, 743 141 3, 146Lynn, M a s s . ------------------------------------------------------ 13 11 3, 490 3, 153 1 6 2 3, 326W o r c e ste r , M a s s . ------------------------------------------ 5 5 2, 155 1, 976 82 2, 155Southeastern New H am p sh ire ______________ 31 2 1 10, 317 9, 369 417 8 , 105
M iddle Atlantic ------------------------------------------------------ 54 31 14, 747 13, 027 835 9, 256B order States --------------------------------------------------------- 9 6 2, 711 2, 557 46 2, 007S o u th w e st___________________________________________ 7 6 2 , 559 2, 372 74 2, 443G reat L akes ------------------------------------------------------------ 28 2 0 11, 508 1 0 ,6 0 5 334 9, 334M iddle W e s t 6 ______________________________________ 33 26 11, 362 1 0 , 1 1 2 6 2 6 9, 0 9 0
St. L ou is , M o .—111.----------------------------------------- 6 6 2, 586 2, 207 243 2, 586M isso u ri (except St. L ou is) ------------------------ 26 19 8 , 635 7, 828 373 6 , 363
P acific ---------------------------------------------------------------------- 8 8 1, 452 1, 317 59 1, 452L os A n ge le s—Long B each, C a lif. -------------- 8 8 1, 452 1, 317 59 1, 452
W om en ’ s c e m e n t-p r o c e ss (s lip -la s te d ) sh oes:United States 5 --------------------------------------------------------------- 43 2 1 1 0 ,4 0 2 9, 407 243 5, 168
M iddle Atlantic ------------------------------------------------------ 2 0 8 5, 033 4, 674 114 2 , 261M iddle W est _______________________________________ 5 5 895 823 2 0 895
W om en ’ s M cK ay (including L ittlew ay) sh oes:United States 5 --------------------------------------------------------------- 30 18 6 , 879 6 , 2 6 8 278 4, 567
New E n g la n d ------------------------------------------------------------ 18 10 4, 109 3, 679 1 9 8 2, 754M is s e s ' and ch ild ren ’ s c e m e n t-p r o c e ss
(con ven tion al-lasted ) sh o es:United States 5 _________________________________________ 41 32 1 1 , 9 8 8 1 0 ,7 4 4 383 1 0 ,0 9 8
New England _______________________________________ 11 8 2, 343 2, 087 103 1, 843M iddle Atlantic ------------------------------------------------------ 9 5 2, 042 1, 865 6 6 1, 321B ord e r States --------------------------------------------------------- 4 4 1, 461 1, 155 23 1, 461G reat Lakes ------------------------------------------------------------ 4 4 1, 300 1, 209 31 1, 300M iddle W e st ------------------------------------------------------------ 8 7 3, 053 2, 765 1 2 2 2 , 680
M is s e s ’ and ch ild ren ’ s G o o d y e a r-w elt sh oes:United States 5 --------------------------------------------------------------- 36 26 9, 958 8 , 8 0 6 45 3 7, 773
M iddle Atlantic 6 --------------------------------------------------- 15 9 3, 071 2, 807 106 1 , 828Southeastern P en nsylvania -------------------------- 9 6 1, 693 1, 494 92 1, 142
G reat L akes ------------------------------------------------------------ 7 7 1, 412 1, 158 1 2 1 1, 412M is s e s ’ , ch ild ren ’ s , and in fants’
stitchdown sh oes:United States 5 --------------------------------------------------------------- 51 34 9 , 1 0 2 8 , 535 242 6 , 653
M iddle Atlantic 6 --------------------------------------------------- 23 14 3, 539 3, 231 84 2 , 161New Y o rk , N . Y ............................................................. 8 8 757 676 25 757
G reat Lakes _______________________________________ 8 6 1, 185 1, 105 34 1 ,0 9 9
1 The region s used in this study include: New England— Connecticut, M aine, M a ssa c h u se tts , New H am p sh ire , Rhode Island, and V erm o n t; M iddle A tlan tic— New J e r se y , New Y ork , and P en n sylvan ia ; B order States— D e law are, D is tr ic t of C olu m bia , Kentucky, M a r y land, V irg in ia , and W e st V irg in ia ; Southwest— A rk a n sa s, Lou isiana , O klahom a, and T e x a s ; G reat L a k e s— Illin o is , Indiana, M ichigan , M in n esota , Ohio, and W isc o n sin ; M iddle W e st— Iowa, K a n sa s, M isso u r i, N eb ra ska , North Dakota, and South D akota; and P a c ific — C a liforn ia , N evada, O regon , and W ashington.
2 The area s studied sep arately w ere : Auburrr-Lew iston, M ain e— the citie s of Auburn and L ew iston ; B oston , M a s s . — B oston,C am b rid ge, C h e lsea , and E v e re tt ; B rockton, M a s s . — Abington, Avon, B ra in tree , B ridgew ater, B rockton, M id d leboro, Rockland, Stoughton,W eym outh, and W hitm an, M a s s . ; H ave rh ill, M a s s . — the city of H a v e rh ill; L aw rence—L ow e ll, M a s s . -----Law ren ce, L ow ell, and M ethuen,M a s s . ; L os A n geles—Long B each, C a lif . — L os A n geles and O range C ou n ties; Lynn, M a s s . — B e v e r ly , Lynn, S alem , Stoneham , and W ak efie ld , M a s s . ; St. L o u is , M o .—111. — St. L ou is City and J e fferso n , St. C h a r le s , and St. L ou is C oun ties, M o. ; and M adison and St. C la ir C oun ties, 111.; Southeastern New H a m p sh ire— the area extending south fro m F arm ington and P itts fie ld and ea st fro m M an ch ester and N ashua; Southeastern P en n sylvan ia— B e r k s , Dauphin, L a n ca ste r , Lebanon, and Schuylkill C ou n ties; and W o r c e ste r , M a s s . — Hudson, M a rlb o ro , S pencer, W a re , W e b ste r , and W o r c e ste r .
3 Includes only estab lish m en ts with 50 or m o re w ork ers at the tim e of re fe ren c e of the unem ploym ent in suran ce listin g s .4 Includes ex ecu tive, p ro fe ssio n a l, and other w ork ers excluded fro m the sep arate production and o ffice w orker c a te g o r ie s .5 Includes data for region s in addition to those shown sep a ra te ly . A la sk a and H aw aii w ere not included in the study.6 Includes data for areas in addition to those shown sep a ra te ly .Digitized for FRASER
http://fraser.stlouisfed.org/ Federal Reserve Bank of St. Louis

63
Occupations Selected for Study
Occupational classification was based on a uniform set of job descriptions designed to take account of interestablishment and interarea variations in duties within the same job. (See appendix B for these job descriptions.) The occupations were chosen for their numerical importance, their usefulness in collective bargaining, or their representativeness of the entire job scale in the industry. Working supervisors, apprentices, learners, beginners, trainees, handicapped, p art-tim e, tem porary, and probationary workers were not reported in the data for selected occupations, but were included in the data for all production w orkers.
Wage Data
The wage information relates to average straight-tim e hourly earnings, excluding premium pay for overtime and for work on weekends, holidays, and late shifts. Incentive paym ents, such as those resulting from piecework or production bonus system s and cost-o f-liv in g bonuses, were included as part of the w orker’s regular pay; but nonproduction bonus paym ents, such as Christm as or yearend bonuses, were excluded. The hourly earnings of salaried workers were obtained by dividing straight-tim e salary by normal rather than actual h o u rs .9
Comparison with Other Statistics
The straight-tim e hourly earnings presented in this bulletin differ in concept fromthe gross average hourly earnings published in the Bureau's monthly hours and earningsseries . Unlike the latter, the averages presented here exclude premium pay for overtimeand for work on weekends, holidays, and late shifts, and were calculated from the weighteddata by summing individual hourly earnings and dividing by the number of such individuals. In the monthly se rie s , the sum of the man-hour totals reported by establishments in the industry were divided into the reported payroll totals. A lso , manufacturers of houseslippers were included in the monthly series , but excluded from this study.
Size of Community
Tabulations by size of community pertain to metropolitan and nonmetropolitan areas. The term "metropolitan area, " as used in this bulletin, refers to the Standard Metropolitan Statistical Areas as defined by the U. S. Bureau of the Budget.
Except in New England, a Standard Metropolitan Statistical Area is defined as a county or group of contiguous counties which contains at least 1 city of 50, 000 or more inhabitants. Contiguous counties to the one containing such a city are included in a Standard Metropolitan Statistical Area if, according to certain criteria, they are essentially m etro politan in character and are socially and economically integrated with the central city. In New England, where the city and town are administratively m ore important than the county, they are the units used in defining Standard Metropolitan Statistical A reas.
Establishment Practices and Supplementary Wage Provisions
Supplementary benefits and practices were treated statistically on the basis that if form al provisions for supplementary benefits and practices were applicable to half or more of the production workers in an establishment, the practices or benefits were considered applicable to all such w orkers. Sim ilarly, if fewer than half of the workers were covered, the practice or benefit was considered nonexistent in the establishment. Because of len gth-of-service and other eligibility requirements, the proportion of workers receiving the benefits may be sm aller than estimated. Because of rounding, sums of individual items may not equal totals.
9 Average hourly rates or earnings for each occupation or other group of w orkers, such as men, women, or production w orkers, were obtained by weighting each rate (or hourly earnings) by the number of workers receiving the rate.
Digitized for FRASER http://fraser.stlouisfed.org/ Federal Reserve Bank of St. Louis

6 4
Weekly H ours. Data refer to the predominant work schedule for fu ll-tim e production workers (or office workers) employed on the day shift, regardless of sex.
Shift P ractices. Data refer to the practices in establishments operating extra shifts during the payroll period studied.
Paid H olidays. Paid holiday provisions relate to full-day and half-day holidays p ro vided annually.
Paid Vacations. The summary of vacation plans is limited to form al arrangements, excluding informal plans whereby time off with pay is granted at the discretion of the em ployer or the supervisor. Payments not on a time basis were converted; for example, a payment of 2 percent of annual earnings was considered the equivalent of 1 w eek’s pay. The periods of service for which data are presented were selected as representative of the m ost common practices, but they do not necessarily reflect individual establishment provisions for progressions. For example, the changes in proportions indicated at 5 years of service may include changes which occurred after 4 years.
Health, Insurance, and Pension Plans. Data are presented for all health, insurance, and pension plans for which all or a part of the cost is borne by the em ployer, excluding only programs required by law, such as workmen's compensation and social security. Among the plans included are those underwritten by a com m ercial insurance company and those paid directly by the employer from his current operating funds or from a fund set aside for this purpose.
Death benefits are included as a form of life insurance. Sickness and accident insurance is limited to that type of insurance under which predetermined cash payments are made directly to the insured on a weekly or monthly basis during illness or accident disability. Information is presented for all such plans to which the employer contributes at least a part of the cost.
Tabulations of paid sick leave plans are limited to form al plans which provide full pay or a proportion of the w orker's pay during absence from work because of illness; in form al arrangements have been omitted. Separate tabulations are provided according to (1) plans which provide full pay and no waiting period, and (2) plans providing either partial pay or a waiting period.
Medical insurance refers to plans providing for complete or partial payment of doctors' fees. Such plans may be underwritten by a com m ercial insurance company or a nonprofit organization, or they may be self-insured.
Catastrophe insurance, som etim es referred to as extended m edical insurance, includes the plans designed to cover employees in case of sickness or injury involving an expense which goes beyond the normal coverage of hospitalization, m edical, and surgical plans.
Tabulations of retirement pensions are limited to plans which upon a w orker's r e tirement provide regular payments for the remainder of his life.
Nonproduction Bonuses. Nonproduction bonuses are defined for this study as bonuses that depend on factors other than the output of the individual worker or group of w orkers. Plans that defer payments beyond 1 year were excluded.
Digitized for FRASER http://fraser.stlouisfed.org/ Federal Reserve Bank of St. Louis

Appendix B: Occupational Descriptions
The primary purpose of preparing job descriptions for the Bureau's wage surveys is to assist its field staff in classifying into appropriate occupations workers who are employed under a variety of payroll titles and different work arrangements from establishment to establishment and from area to area. This permits the grouping of occupational wage rates representing comparable job content. Because of this emphasis on interestablishment and inter- area comparability of occupational content, the Bureau's job descriptions may differ significantly from those in use in individual establishments or those prepared for other purposes. In applying these job descriptions, the Bureau's field economists are instructed to exclude working supervisors, apprentices, learners, beginners, trainees, handicapped, part-time, temporary, and probationary workers.
ASSEMBLER FOR PULLOVER, MACHINE
Prepares the upper for lasting by assembling the counter and upper and operating a machine to tack the upper to the wooden last. Work involves: Placing counters on rack of pan containing cement, lowering rack into pan to apply cement to counters; inserting cemented counter between lining and upper at the heel; setting a piece of wax or tissue paper next to lining to facilitate removal of last after completion of operations; placing upper on last making certain that heel seam is in center of rear of last; setting last on a jack and pushing jack into machine which automatically drives tacks through the upper into the heel seat and heel seam.
BED-MACHINE OPERATOR
(Bed laster; bed-lasting-machine operator; heel and forepart laster)
Completes the operations of drawing the toe, or toe and heel, of the upper of a shoe tightly over the last. Work involves: Setting shoe on machine with sole up, and manipulating hand levers controlling a series of wipers (friction pullers) which draw the upper over edge of insole at toe or toe and heel; holding upper in place with the wipers; securing upper at the toe in one of the following ways: (1) McKay system— tacking upper, using automatically-fed hand tacking device, the tacks remaining in the finished shoe. (2) Welt system—passing a wire from an anchor tack, which he drives on one side of the shoe, around the drawn-in upper at the toe, to the opposite side where he winds it around another anchor tack, to hold upper in place until it is stitched to insole by a later operation; or may staple upper instead of using above methods. (3) Cement system—wiping toe in place and holding it with wiper; trimming off surplus toe box, lining and upper, by hand, close to insole; applying cement to insole between lining and upper at toe and folding over lasting allowance of upper and sticking it in insole. If the heel also is lasted in the process, an automatically-fed hand tacking device is used to drive tacks through the upper at the heel.
BOTTOM FILLER
(Cushion cementer; insole filler)
Fills depression in forepart of shoe with composition paste of ground cork and cement to form cushion for foot.
65Digitized for FRASER http://fraser.stlouisfed.org/ Federal Reserve Bank of St. Louis

66
BOTTOM SCOURER
(Bottom buffer; bottom sander)
Smooths and cleans outsoles of completely constructed shoes by holding against revolving abrasive-covered wheel of buffing machine.
CU TTER, LINING, MACHINE
Cuts parts of shoe lining from leather or fabricated m aterials, by means of aclicking machine. Work involves: Setting lining m aterial, usually in multiple p lies, oncutting table of machine; selecting proper die and setting it in place on m aterial; depressinglever to cause upper arm to drop automatically on the die with sufficient force to cut m a terial to the shape and size of die.
For wage study purposes, workers are classified by type of lining, as follows:
Cloth lining Leather lining
CU TTER, VAM P AND WHOLE SHOE, HAND
(Carver; cutter, outside, hand; cutter, sam pler; cutterout, upper; upper leather cutter)
Cuts vamps and uppers of shoes from skins or hides with a hand knife. Work involves m ost of the following: Selecting hides or skins of desired thickness and quality;noting location of defective spots in m aterial, and direction of grain of leather, setting pattern on m aterial in such a way as to obtain a maximum number of pieces, and in such relation to the grain of the leather that there will be a minimum of stretching of m aterial in processing shoe; drawing knife along edge of pattern, cutting part to desired shape; bundling cut pieces and marking size on top piece for identification.
CU TTER , VAM P AND WHOLE SHOE, MACHINE
Cuts parts of shoe uppers from hides, skins, or fabricated m aterials, by means of a clicking machine. Work involves: Setting leather or other shoe m aterial on cutting table of machine; selecting proper die and setting it in place on m aterial; depressing lever to cause upper arm to drop automatically on the die with sufficient force to cut m aterial to the size and shape of the die.
EDGE SETTER
(Edge burnisher; edge kitter)
Shapes and polishes the edge of the sole of the shoe Vy holding it against the hot iron of an edge-setting machine. Work involves* Bru-hbig a : iller solution over edge of sole as far back as the heel line, to fill any sm all holes and to soften the leather for the burnishing operation; selecting proper size iron burnishing block and setting stem of block into machine holder; heating iron to proper temperature; holding edge of sole against r e volving surface of heated iron, manipulating shoe until entire edge has been burnished; applying a coating of wax to edge of sole and repeating burnishing operation.
EDGE TRIMMER
(Edge-trim m ing-m achine operator; trim m er, apex; trim m er, margin)
T rim s, cuts to size , and smooths the edge of shoes by turning and manipulating the side surfaces of the soles against the revolving cutting tool of an edge-trim m ing machine.
Digitized for FRASER http://fraser.stlouisfed.org/ Federal Reserve Bank of St. Louis

67
FANCY STITCHER
(Applique stitcher; blind-row stitcher; etching stitcher; eyelet-row stitcher; stripper, stitching; trimming stitcher)
Operates a pow er-driven sewing machine to stitch decorative designs on shoe uppers, such as outlining eyelet row, stitching imitation foxings or fancy panel designs, running extra rows of stitching, and stitching piping and ornamental leather strips (applique). Work involves: Inserting m aterial under the presser foot and needle of machine; depressing leverto start machine; guiding m aterial by hand (usually along previously marked lines on m aterial) as stitching is perform ed.
FLOOR BOY
(Assem bly boy; floorman; router)
Keeps stock and distributes partially finished m aterials used in the manufacture of footwear to various departments to keep workers supplied with m aterial, using truck or carrying m aterial. May perform simple machine operations under direction of forem an, such as tempering soles and molding edges of soles.
GOODYEAR STITCHER
Operates a Goodyear stitching machine to attach the outsole to the welt of the shoe. Work involves: Setting the shoe, sole side up, on table rest of machine underneath needle,and guiding shoe with hand as needle sews around shank and forepart of shoe, the stitch extending from a channel that was cut for it in bottom of outsole, through outsole to upper surface of welt. The welt extends around the edge of the sole as far back as the breast of the heel.
HEEL ATTACH ER, MACHINE
(Leather or rubber heel attacher; heeling-machine operator; leather heeler)
Nails leather and rubber heels to shoes by machine. Work involves: Placing shoeon a metal mold and putting heel in position on shoe; swinging nail plate into place over the heel where nails are dropped automatically into another plate over the heel; manipulating foot lever to drive nails through heel and heel seat and clinch them to insole on inside of shoe.
H E EL-SEAT LASTER
Operates a heel-seat lasting machine which draws the heel section of shoe upper tightly over the last and automatically tacks the edges to the heel seat of the insole. Work involves: Setting shoe on machine and manipulating controls which cause the wiper platesto draw the upper and lining evenly over the heel seat and machine automatically drives tacks through upper and insole.
INSEAMER
(Goodyear-w elt-sew ing-m achine operator; welt sewer; eppler welter)
Operates a Goodyear stitching machine that sews a narrow strip of leather (welt) automatically fed from a roll on the machine to the lip of the insole of the shoe. Work involves: Guiding shoe, sole upward, under needle of machine and stitching through welt, upper, and lining, and insole lip against which upper and lining have been lasted.
Digitized for FRASER http://fraser.stlouisfed.org/ Federal Reserve Bank of St. Louis

68
INSPECTOR (CROWNER)
(Examiner)
Examines shoe parts, partly finished shoes in various stages of manufacture, or finished shoes before packing. Work involves inspecting for the following im perfections: Irregularity of leather surfaces; misplaced or incompletely driven tacks; unevenness and incorrect amount of stitching; inside misalignment; improper proportion of toe tip. May correct minor defects or imperfections and reject major defects for reprocessing in proper department.
JANITOR
Cleans and keeps in an orderly condition factory working areas and washroom s, or prem ises of an office, apartment house, or com m ercial or other establishment. Duties involve a combination of the following: Sweeping, mopping or scrubbing, and polishing floors;removing chips, trash, and other refuse; dusting equipment, furniture, or fixtures; polishing metal fixtures or trim m ings; providing supplies and minor maintenance services; cleaning lavatories, showers, and restroom s. W orkers who specialize in window washing are excluded.
JOINTER, MACHINE
(Joint cutter, machine; jointer; joint m aker, machine)
Trim s and shapes on a jointing machine the edge of the shank sole of shoes at the joint between shank and heel, starting where edge trim m er leaves off and continuing to the heel line. Holds shoe against knife of jointing machine; m oves shoe against knife to m aintain even pressure for a neat trimming.
LITTLEW AY STITCHER
Operates a lockstitch sewing machine to attach the outsole by stitching through the upper, lining, and insole of shoe, except at heel seat. Work involves: Setting the shoe,sole side up, on shoe rest of machine beneath needle and guiding shoe with hand as needle sews around the shank and forepart of shoe.
MECHANIC, MAINTENANCE
Repairs machinery or mechanical equipment of an establishment. Work involves m ost of the following: Examining machines and mechanical equipment to diagnose sourceof trouble; dismantling or partly dismantling machines and performing repairs that mainly involve the use of handtools in scraping and fitting parts; replacing broken or defective parts with items obtained from stock; ordering the production of a replacement part by a machine shop or sending of the machine to a machine shop for major repairs; preparing written specifications for major repairs or for the production of parts ordered from machine shop; reassem bling machines, and making all necessary adjustments for operation. In general, the work of a maintenance mechanic requires rounded training and experience usually a c quired through a form al apprenticeship or equivalent training and experience. Excluded from this classification are workers whose prim ary duties involve setting up or adjusting machines.
PASTER, BACKER, OR FITTER, UPPER, HAND
(Backer; backing paster; backing cementer; canvas backer, upper; cementer, upper to lining; fitter, upper to lining; paster, line and brush, hand; paster; plain paster; rein forcer; quarter and lining fitter; upper doubler)
Reinforces vam ps, tops, straps, and other parts of shoes, by pasting to each a piece of cu t-to -s ize canvas, thin leather, or other lining m aterial (doubler). Work involves one or more of the following: Pressing doubler against cem ent-covered roll and stickingdoubler to leather parts; using backing tape which is so prepared that it sticks when pressed on other m aterial with a hot iron. May paste reinforcing over only a portion of upper that is exposed to extra wear or strain.
Digitized for FRASER http://fraser.stlouisfed.org/ Federal Reserve Bank of St. Louis

69
PLATFO R M -C O VER LASTER (SLIP-LASTED SHOES)
(Wrapper laster)
Operates a machine to smooth platform cover or wrapper around the platform or platform and heel. Work involves: Setting upper (into which last had been inserted andplatform or platform and heel had been previously positioned) into machine; starting machine which wipes previously cemented cover or wrapper tightly around platform or platform and heel; removing work from machine and examining for maintenance of quality standards.
PLATFO R M -C O V ER STITCHER (SLIP-LASTED SHOES)
(Wrapper stitcher)
Operates a power-driven sewing machine to stitch platform covers and also heel covers on shoe uppers which are to be processed by the slip-lasted method. Work involves: Fitting the platform and heel cover (strip of leather or cloth) to the upper; placing work under needle, starting machine, steering work against guide for proper stitching; and r e moving completed work from machine.
PULLOVER-M ACH INE OPERATOR
(P u ller-o ver , machine)
Operates a machine in which the upper at the toe and along the sides of the front of the shoe is pulled over and tacked tem porarily to the last to give prelim inary shaping to the front part of the upper and to attach it to the insole and the last. Work involves: Setting shoe in holding jig of machine; depressing lever to rotate mechanism that closes top and side jaws on edge of upper; positioning upper on last by manipulating tip levers to align center of upper on center of last; depressing lever to rotate mechanism through second half of travel, and to drive tacks at toe and along the side of the shoe, which hold upper in position until stapled or tacked along entire edge.
REPAIRER
(Blem ish rem over)
Corrects imperfections in the finish of the completed shoe. Work involves most of the following: Removing stains, scratches, blem ishes, and loose threads; blending v a r ious shades of fluid, wax filler or crayon to affected part of shoe. May use hand spray gun with colored dope to cover blemished area.
ROUGH ROUNDER
(Forepart rounder; rough-rounding-machine operator; sole rounder)
Trim s the edge of outsole and welt of the shoe, by use of a rounding and channeling machine so that the edge will extend the desired distance from shoe upper. Work involves: Setting shoe in machine so that bottom of shoe is toward the cutting knife, and bottom of guide rests against upper of shoe; guiding shoe in vertical position along bottom of guide so that edge is trimm ed at right angles to the bottom of the shoe entirely around the p erimeter of the sole of the shoe. The machine may also cut a channel in bottom of outsole near edge, in which the thread is embedded when sole stitching is done.
SHANK TACKER
(Shanker; shank-piece placer; shank-piece tacker)
Tacks a fabric-covered metal shank piece to the shank section of a welt-type shoe to support the arch of the shoe.
Digitized for FRASER http://fraser.stlouisfed.org/ Federal Reserve Bank of St. Louis

70
SIDE LASTER, MACHINE
Operates a machine to last the sides and shanks of the upper. Work involves: Drawing out lining and upper with hand pincers, holding shoe so that pincers of machine grasp edges of upper and draw them evenly and closely about the last, and manipulating lever of machine to operate device which drives staples or tacks through the upper at the sides and shanks.
SOCK-LINING STITCHER (SLIP-LASTED SHOES)
Operates a pow er-driven sewing machine to stitch sock linings to uppers which will be slip -lasted . Work involves: Fitting the upper to the sock lining according to markings;lowering presser foot to hold m aterials, starting machine, feeding sock lining and upper under needle, steering m aterial against pin guides; and removing completed work from machine.
SOLE ATTACH ER, CEM ENT PROCESS
(Com po-conveyor operator; sole layer, machine; sole-laying machine operator; soler)
Operates a sole-laying machine to cement outsoles permanently to the uppers of shoes. Work involves: Setting toe part of shoe on which outsole has been positioned and heel part of last directly below corresponding jacks (lugs) of machine; pressing air pedal (which opens valve on pipe leading to air com pressor storage tank) to fill the air cushion and force the shoe against the jacks which hold the outsole firm ly in place while the cement dries. May also, prior to permanent attachment of outsole, brush a coat of solvent over the inner surface of the outsole from the heel seat to the toe and press outer sole on shoe, being certain that edges of sole project evenly over edges of shoe.
SOLE LEVELER, MACHINE
(Beater-out, leveling machine; inseam leveler; leveler)
Flattens the insoles or outsoles of shoes which have had a ridge raised around the sole by the stitching machines. Sets shoe on last of machine with sole uppermost; depresses treadle to start machine and guides the shoe on the form under the roller back and forth and from side to side.
THREAD LASTER (STITCHDOWN SHOES)
(Stitchdown-thread laster; Puritan laster)
Operates a stitchdown thread-lasting machine to last shoes by sewing shoe uppers to insoles. Work involves: Pulling shoe upper over last to which an insole has been tacked; setting last and upper into machine, starting machine which sews the upper to the insole, and guiding the shoe in such a manner that the feeder guide pulls the upper tightly around last.
TOE FORMER (STITCHDOWN SHOES)
Operates machine to smooth and shape the upper leather at toe of shoe to conform to the shape of the last. Work involves: Closing switch to start electrical heating unit;setting shoe on machine with bottom of sole flat on bottom plate of unit and with projecting edge of outsole at toe of shoe under the wiper plate and the heel against the back rest; depressing lever, causing wiper plates to move forward against toe of shoe and then slide down the toe, smoothing the leather. If machine is not equipped with heating element, shoe is heated in steam box before pressing.
This operation is usually performed after thread lasting. On some infants' shoes, however, this operation eliminates thread lasting; cement is applied to edges of upper, lining, and outsole, and machine simultaneously lasts and smooths out the toe.
Digitized for FRASER http://fraser.stlouisfed.org/ Federal Reserve Bank of St. Louis

71
TOE LASTER, AUTOMATIC OR SEMIAUTOMATIC
Operates an automatic or semiautomatic machine to draw the toe section of shoe upper tightly over the last. Work involves: Making adjustments on machine to govern actionof wipers, placing shoe in steamer to soften toe section; inserting shoe in machine and operating foot treadle to bring wipers against shoe upper and draw edges against the last; wrapping wire loop around tem porary anchor tacks on side of shoe to hold toe section in place or by means of cement, tacks, or staples fastens upper to innersole.
TOP STITCHER
Operates a sewing machine to stitch the lining to the upper part of a shoe and to trim off excess edges of lining. Work involves: Fitting lining to upper to obtain proper allowance for insertion of counter or receiving upper and lining already fitted or cemented together; setting parts into machine at heel seam; lowering guide down to the edge of top of upper, and guiding parts through machine by hand to complete stitching and trimming operation.
TREER
(Polisher, uppers; shoe treer)
Cleans and finishes shoes by removing spots and discolorations, and rubbing uppers with a hot iron to smooth out wrinkles. Work involves most of the following: Setting shoeon a treeing form , the shape of the last, and depressing lever expanding form so that shoe will fit tightly over it; brushing, cleaning, dressing, and finishing shoe according to the kind of leather or m aterial; applying color stain or bleach to blemished spots; smoothing out wrinkles in the uppers with a hot iron.
Does not include shoe d re sse rs , who may be called treers in some plants but p erform only a minor part of the work described above.
VAM PER
(Vamp closer; vamp stitcher; zigzag seamer)
By use of a pow er-driven sewing machine, sews together the forepart of the upper (tip and vamp) and the two quarters of a shoe. Work involves: Setting overlapped edges together under presser foot and needle of machine; depressing lever to start machine and guiding m aterial through stitching process; sewing top to entire lower part of upper when shoe has a cut separate from quarters, or has a whole vamp. Parts are som etim es first pasted together by another worker to insure more accurate stitching.
W O O D-H EEL SEAT F ITTER , HAND
Trim s the heel seat of a shoe by hand in preparation for attaching the wood heel. Work involves: Using a hand knife to trim the heel seat of the outside of the shoe to giveit a concave shape and molding the heel seat by pounding with a ham m er, then shaping it to conform with the base of the heel that is to be attached. This operation is usually p erformed on women's high quality shoes.
W OOD-H EEL SEAT FITTER, MACHINE
Operates a machine to cut out a piece around the outer margin of the heel seat, preparatory to heel attaching. Work involves: Setting gage on machine for size of heel to be fitted and adjusting pin stop for right or left shoe; pressing shoe against stationary horizontal knife in machine to cut through the heel seat between the upper and the sole until counter of shoe strikes a stop gage; operating machine which automatically cuts out a U-shaped piece from the heel seat so that the wood heel fits properly when attached. This machine operation is usually performed on women's popular- and m edium -priced shoes.
Digitized for FRASER http://fraser.stlouisfed.org/ Federal Reserve Bank of St. Louis

Digitized for FRASER http://fraser.stlouisfed.org/ Federal Reserve Bank of St. Louis

INDUSTRY WAGE STUDIES
The following reports cover part of the Bureau's program of industry wage surveys. These reports cover the period 1950 to date and may be obtained free upon request as long as a supply is available. However, those for which a price is shown are available only from the Superintendent of Documents, U. S. Government Printing Office, Washington 25, D. C. , or any of its regional sales offices.
I. Occupational Wage Studies
Manufacturing
Apparel:Men's Dress Shirts and Nightwear, 1950 -
Series 2, No. 80Men's and Boys' Dress Shirts and Nightwear, 1954 -
BLS Report 74*Men's and Boys' Shirts (Except Work Shirts) and Nightwear,
1956 - BLS Report 116Men's and Boys' Shirts (Except Work Shirts) and Nightwear,
1961 - BLS Bulletin 1323 (40 cents)Men's and Boys' Suits and Coats, 1958 - BLS Report 140 Women's and Misses' Coats and Suits, 1957 - BLS Report 122 Women's and Misses' Dresses, 1960 - BLS Report 193 Work Clothing, 1953 - BLS Report 51 Work Clothing, 1961 - BLS Bulletin 1321 (35 cents)
♦Work Shirts, 1955 and 1956 - BLS Report 115 ♦Work Shirts, 1957 - BLS Report 124
Chemicals and Petroleum:Fertilizer, 1949-50 - Series 2, No. 77
♦Fertilizer Manufacturing, 1955 and 1956 - BLS Report 111 ♦Fertilizer Manufacturing, 1957 - BLS Report 132
Industrial Chemicals, 1951 - Series 2, No. 87 Industrial Chemicals, 1955 - BLS Report 103 Paints and Varnishes, 1961 - BLS Bulletin 1318 (30 cents) Petroleum Production and Refining, 1951 - Series 2, No. 83 Petroleum Refining, 1959 - BLS Report 158 Synthetic Fibers, 1958 - BLS Report 143
Paper and Allied Products:Pulp, Paper, and Paperboard, 1952 - Series 2, No. 81Pulp, Paper, and Paperboard Mills, 1962 - BLS Bulletin 1341 (40 cents)Primary Metals, Fabricated Metal Products and Machinery: Basic Iron and Steel, 1951 - Series 2, No. 91
BLS Bulletin 1358 (30 cents)1957 - BLS Report 123 BLS Report 151
Series 2, No. 82 ■ BLS Report 180
1953- 54 - BLS Bulletin 1160 (40 cents)1954- 55 - BLS Report 93
Basic Iron and Steel, 1962 ■ Fabricated Structural Steel, Gray Iron Foundries, 1959 Nonferrous Foundries, 1951 ■ Nonferrous Foundries, 1960 ■ Machinery Industries, Machinery Industries,
1955-56 - BLS Report 1071957- 58 - BLS Report 1391958- 59 - BLS Report 1471959- 60 - BLS Report 1701961 - BLS Bulletin 1309 (30 cents)1962 - BLS Bulletin 1352 (40 cents)
Radio, Television, and Related Products, 1951 - Series 2, No. 84 Steel Foundries, 1951 - Series 2, No. 85
Machinery Manufacturing, Machinery Manufacturing, Machinery Manufacturing, Machinery Manufacturing, Machinery Manufacturing, Machinery Manufacturing,
Rubber and Plastics Products:Miscellaneous Plastics Products, 1960 - BLS Report 168Stone, Clay, and Glass:Pressed or Blown Glass and Glassware, 1960 - BLS Report 177 Structural Clay Products, 1954 - BLS Report 77 Structural Clay Products, 1960 - BLS Report 172
Food:Candy and Other Confectionery Products, 1960 -
BLS Report 195♦Canning and Freezing, 1955 and 1956 - BLS Report 117 ♦Canning and Freezing, 1957 - BLS Report 136 Distilled Liquors, 1952 - Series 2, No. 88 Flour and Other Grain Mill Products, 1961 -
BLS Bulletin 1337 (30 cents)Fluid Milk Industry, 1960 - BLS Report 174
♦Raw Sugar, 1955 and 1956 - BLS Report 117 ♦Raw Sugar, 1957 - BLS Report 136
Leather:Footwear, 1953 - BLS Report 46
♦Footwear, 1955 and 1956 - BLS Report 115 Footwear, 1957 - BLS Report 133 Leather Tanning and Finishing, 1954 - BLS Report 80 Leather Tanning and Finishing, 1959 - BLS Report 150
Lumber and Furniture:Household Furniture, 1954 - BLS Report 76 Lumber in the South, 1949 and 1950 - Series 2, No. 76 Southern Lumber Industry, 1953 - BLS Report 45
♦Southern Sawmills, 1955 and 1956 - BLS Report 113 ♦Southern Sawmills, 1957 - BLS Report 130 West Coast Sawmilling, 1952 - BLS Report 7 West Coast Sawmilling, 1959 - BLS Report 156 Wood Household Furniture, Except Upholstered, 1959 -
BLS Report 152♦Wooden Containers, 1955 and 1956 - BLS Report 115 ♦Wooden Containers, 1957 - BLS Report 126
T extiles:Cotton Textiles, 1954 - BLS Report 82Cotton Textiles, 1960 - BLS Report 184Cotton and Synthetic Textiles, 1952 - Series 2, No. 89Hosiery, 1952 - BLS Report 34Hosiery, 1962 - BLS Bulletin 1349 (45 cents)Miscellaneous Textiles, 1953 - BLS Report 56
♦Processed Waste, 1955 and 1956 - BLS Report 115 ♦Processed Waste, 1957 - BLS Report 124 ♦Seamless Hosiery, 1955 and 1956 - BLS Report 112 ♦Seamless Hosiery, 1957 - BLS Report 129 Synthetic Textiles, 1954 - BLS Report 87 Synthetic Textiles, 1960 - BLS Report 192 Textile Dyeing and Finishing, 1956 - BLS Report 110 Textile Dyeing and Finishing, 1961 - BLS Bulletin 1311 (35 cents) Woolen and Worsted Textiles, 1952 - Series 2, No. 90 Wool Textiles, 1957 - BLS Report 134
Tobacco:Cigar Manufacturing, 1955 - BLS Report 97
♦Cigar Manufacturing, 1956 - BLS Report 117 Cigar Manufacturing, 1961 - BLS Bulletin 1317 (30 cents) Cigarette Manufacturing, 1960 - BLS Report 167
♦Tobacco Stemming and Redrying, 1955 and 1956 - BLS Report 117
♦Tobacco Stemming and Redrying, 1957 - BLS Report 136
Transportation:Motor Vehicles and Parts, 1950 - BLS Bulletin 1015 (20 cents) Motor Vehicles and Motor Vehicle Parts, 1957 - BLS Report 128 Railroad Cars, 1952 - Series 2, No. 86
* Studies of the effects of the $1 minimum wage.
Digitized for FRASER http://fraser.stlouisfed.org/ Federal Reserve Bank of St. Louis

I. Occupational Wage Studies— Continued
Nonmanufacturing
Auto Dealers Repair Shops, 1958 - BLS Report 141 Banking Industry, 1960 - BLS Report 179Contract Cleaning Services 1961 - BLS Bulletin 1327 (25 cents) Crude Petroleum and Natural Gas Production, 1960 -
BLS Report 181Department and Women's Ready-to-Wear Stores, 1950 -
Series 2, No. 78Eating and Drinking Places, 1961 - BLS Bulletin 1329 (40 cents) Electric and Gas Utilities, 1950 - Series 2, No. 79
Electric and Gas Utilities, 1952 - BLS Report 12 Electric and Gas Utilities, 1957 - BLS Report 135 Hospitals, 1960 - BLS Bulletin 1294 (50 cents)Hotels, 1960 - BLS Report 173Hotels and Motels, 1961 - BLS Bulletin 1328 (30 cents) Life Insurance, 1961 - BLS Bulletin 1324 (30 cents)Power Laundries and Cleaning Services, 1961 -
BLS Bulletin 1333 (45 cents)Power Laundries and Dry Cleaners, 1960 - BLS Report 178
II. Other Inudstry Wage Studies
Communications Workers, Earnings in October 1956 - BLS Report 121Communications Workers, Earnings in October 1957 - BLS Report 138Communications Workers, Earnings in October 1958 - BLS Report 149Communications Workers, Earnings in October 1959 - BLS Report 171Communications, October 1960 - BLS Bulletin 1306 (20 cents)Communications, 1961 - BLS Bulletin 1343 (20 cents)Factory Workers' Earnings - Distributions by Straight-Time Hourly Earnings, 1954 - BLS Bulletin 1179 (25 cents) Factory Workers’ Earnings - 5 Industry Groups, 1956 - BLS Report 118Factory Workers' Earnings - Distribution by Straight-Time Hourly Earnings, 1958 - BLS Bulletin 1252 (40 cents) Factory Workers' Earnings - Selected Manufacturing Industries, 1959 - BLS Bulletin 1275 (35 cents)Wages in Nonmetropolitan Areas, South and North Central Regions, October 1960 - BLS Report 190
Retail Trade, Employee Earnings in June 1961:Building Materials, Hardware, and Farm Equipment Dealers - BLS Bulletin 1338-1 (25 cents) General Merchandise Stores - BLS Bulletin 1338-2 (40 cents)Food Stores - BLS Bulletin 1338-3 (35 cents)Automotive Dealers and Gasoline Service Stations - BLS Bulletin 1338-4 (40 cents)Apparel and Accessory Stores - BLS Bulletin 1338-5 (40 cents)Furniture, Home Furnishings, and Household Appliance Stores - BLS Bulletin 1338-6 (40 cents) Miscellaneous Retail Stores - BLS Bulletin 1338-7 (35 cents)
Regional Offices
U. S. Department of Labor Bureau of Labor Statistics 18 Oliver Street Boston 10, Mass.
U. S. Department of Labor Bureau of Labor Statistics 341 Ninth Avenue New York 1, N .Y .
U. S. Department of Labor Bureau of Labor Statistics 1371 Peachtree Street, NE. Atlanta 9, Ga.
U. S. Department of Labor Bureau of Labor Statistics 1365 Ontario Street Cleveland 14, Ohio
U. S. Department of Labor Bureau of Labor Statistics 105 West Adams Street Chicago 3, 111.
U. S. Department of Labor Bureau of Labor Statistics 630 Sansome Street San Francisco 11, Calif.
☆ U. S. GOVERNMENT PRINTING OFFICE: 1963 O - 682945Digitized for FRASER http://fraser.stlouisfed.org/ Federal Reserve Bank of St. Louis


![H20youryou[2] · 2020. 9. 1. · 65 pdf pdf xml xsd jpgis pdf ( ) pdf ( ) txt pdf jmp2.0 pdf xml xsd jpgis pdf ( ) pdf pdf ( ) pdf ( ) txt pdf pdf jmp2.0 jmp2.0 pdf xml xsd](https://img.pdfslide.net/doc/110x75/60af39aebf2201127e590ef7/h20youryou2-2020-9-1-65-pdf-pdf-xml-xsd-jpgis-pdf-pdf-txt-pdf-jmp20.jpg)


