Embed Size (px)
Citation preview
retired couple’s budgetFOR A M O D E R A T E L I V I N G S T A N D A R DAutumn 1 9 6 6 - B u l l e t i n N o .1570-4
U S. D E P AR T M E NT OF LABOR BUREAU OF LABOR STATISTICS
Digitized for FRASER http://fraser.stlouisfed.org/ Federal Reserve Bank of St. Louis
retired couple’s budgetFOR A M O D E R A T E L I V I N G S T A N D A R DAutumn 1 9 6 6 - B u I le t in No. 1 570 -4
U,S. DEPARTMENT OF LABOR Wil lard Wir tz , S e c re t a r y BUREAU OF LABOR S T A T I S T I C S A r t h u r M. Ross, C o m m i s s i o n e r
For sale by the Superintendent of Documents, U.S. Government Printing Office Washington, D.C. 20402 - Price 35 cents
Digitized for FRASER http://fraser.stlouisfed.org/ Federal Reserve Bank of St. Louis

Digitized for FRASER http://fraser.stlouisfed.org/ Federal Reserve Bank of St. Louis
ContentsPage
Introduction.................................................................................................... VCosts in urban a rea s ....................................................................................................................................... 1Intercity differences....................................................................................................................................... 2A moderate standard: Present and p a s t .................................................................• • • ........................nData sources and estimating methods......................*.............................................................................. . ig
Food . . . ................................................................................................................................................. 17Shelter c o s t s ............................................................................................................. igTransportation................................................................ 19Medical c a r e ........................................................................................................................................... 19Other goods and serv ices .............................................................................................................. . . 20Gifts and contributions................................................................................................................... *. . 20
Tables:
1. Annual costs of the retired couple’ s budget by major components urban United States,39 metropolitan areas, and nonmetropolitan areas by regions, autumn 1966................... 3
2. Indexes of comparative living costs based on the retired couple’ s budget,autumn 1966 ................................................................................................................................... 7
Appendix contents ........................................................................................................... .......................... 21
iii
Digitized for FRASER http://fraser.stlouisfed.org/ Federal Reserve Bank of St. Louis

Digitized for FRASER http://fraser.stlouisfed.org/ Federal Reserve Bank of St. Louis
Introduction
The Retired Couple’ s Budget described in this bulletin is a companion to the budget for a younger, 4-person family published in the City Worker’ s Family Budget for a , Moderate Living Standard, Autumn 1966, Bulletin No. 1570-1.
All benchmark estimates of living costs are based on specific family situations. The cost estimates of the Retired Couple’ s Budget are for an urban family of 2 persons—a husband age 65 or over and his wife—who are presumed to be self- supporting and living independently. The budget also specifies that both husband and wife are in reasonably good health for their age and able to take care of themselves, and that each is covered by hospital and medical insurance under the federal Medicare program. Two^thirds of these families are homeowners, living in houses which are mortgage-free. The couple has average inventories of clothing, housefurnishings, major durables, and other equipment. Even at a comparable standard of living, benchmark cost estimates for younger and larger families will be higher, and estimates for single persons will be lower, than those for the retired couple. In other words, there is no single answer to the question, “How much does it cost to live?” Family size, age, and type have a significant effect on spending patterns, manner of living, and family needs.
The other major consideration—in addition to family composition—in developing family budgets is the living standard for which cost estimates are made. “Standards of living” refer to the goals we set for ourselves as consumers of goods and services and as users of leisure time. The living standard represented by the current" Retired Couple’ s Budget is described as moderate. It provides for the maintenance of health and social well-being, and participation in community activities. This generalized concept of a moderate standard has been translated into a list of commodities and services which can be priced. (See appendix A.) Examination of the lists provides the clearest insight into what the moderate standard comprises.
The content of the new budget for a moderate standard is based on the manner of living and consumer choices in the decade of the 1960’ s. The list of goods and services included was derived in several ways. Nutritional and health standards, as determined by scientists and technicians, were used for the food-at-home and the shelter components. The selection among the various kinds of food and housing arrangements meeting the standards was based on actual choices made by families as revealed by surveys of con- s u m e r expenditures. The Medicare program shaped part of the standard for medical care. Where scientific standards have not been formulated or legislation enacted, analyses of the data reported in the Bureau’ s Survey of Consumer Expenditures in 1960-61 and related consumption studies were used to determine the specific items, and the quantities and qualities thereof, to be included in the budget. These analytical procedures result in basing some parts of the budget upon inferences about the collective judgment of consumers as to the kinds and amounts of consumption required, rather than upon scientific standards. In such analyses, some exercise of the budget-maker’ s own judgment is involved; however, in this budget, such judgment has been confined to selection of the basic data and determination of the procedures to be followed in deriving the items and quantities making up these parts of the budget. The specific decisions that were made with respect to each component of the new Retired Couple’ s Budget are documented in this bulletin.
The moderate living standard does not show how an “ average” retired couple actually spends its money, nor does it show how a couple should spend its money. Individual families may spend more on one item and less on others than the amounts indicated in the budget. Furthermore, some families can and do spend less than the total amount specified in this budget without feeling deprived and without impairing their health or their ability to contribute constructively to our society. In general, however, the representative list of goods
v
Digitized for FRASER http://fraser.stlouisfed.org/ Federal Reserve Bank of St. Louis
and services comprising the standard reflects the collective judgment of families as to what is necessary and desirable to meet the conventional and social as well as the physical needs of families of the budget type in the present decade.
The new Retired Couple’ s Budget is the third study for this family type which translates a generalized concept of a moderate standard of living into a list of commodities and services that can be priced. The original Budget for an Elderly Couple, developed by the Social Security Administration to parallel the original City Worker’ s Family Budget prepared by BLS, was priced in 13 large cities in 1946, 1947, and 1949. The quantities and qualities of goods and services included in that budget were based on the manner of living and standards prevailing in the early 1940’ s. The budget was repriced by BLS in 34 large cities in October 1950, but it was discontinued after that date because it was outmoded.
In 1960, the Bureau issued The Interim Budget for a Retired Couple. It was based on a new list of goods and services representing “modest-but- adequate” living in accordance with standards prevailing in the 1950’ s. Because the basic data used in the analysis related to the early 1950’ s, and because of the limited scope of this revision, it was considered “ interim,” pending a more complete review of the procedures and the availability of data from the Bureau’ s Survey of Consumer Expenditures in 1960-61. The interim budget was priced only once, in autumn 1959, in 20 large cities.
Both of the earlier budgets were for a family of the same size, age, and type as that in the new budget. Similarly, the living standard in all three studies provides for the maintenance of health and social well-being, and participation in community activities. For the most part, the procedures used to translate this generalized concept of the living standard into a list of goods and services were also the same, but the kinds and quantities of items comprising the standard differ, because the budgets reflect the conditions of living in three different decades. Changes in educational levels, cultural developments growing out of travel and migration, and growth in purchasing power affect
the level of living of American families and their ideas about what constitutes a moderate living standard.
Technological advances also influence the composition of the standard. New types of consumer goods and services are developed, mass production increases their availability, and mass communication and advertising media stimulate the demand for them. As real incomes rise, certain aspects of living, once considered attainable only by a few, come within the: reach of many and are accepted as part of the American way of life. For senior citizens in particular, a rising level of social concern for their welfare and the adequacy of their income and resources has been an additional factor in changing their own expectations and attitudes toward retirement. In a dynamic society, therefore, the relative position of a moderate living standard on a scale of all living standards may remain fixed, but the description of what constitutes that standard will be ever changing.
The present study differs from the earlier budgets in two major respects. These differences affect the level of the 1966 costs and comparative living cost indexes, particularly in relation to the costs and indexes of the 1959 interim budget.
1. For the first time, the budget has been priced in a sample of medium-sized and small cities. Thus, it is possible to estimate the average U.S. urban budget cost and to compare metropolitan and nonmetropolitan area costs. (See appendix B.)
2. Costs of maintaining an owned home (mortgage-free) have been included in the moderate standard. Shelter costs in the earlier budgets were limited to rental housing. Use of rental housing only was appropriate for large cities in terms of the 1940 modest standard of the original budget, but it was recognized as a limitation in the 1959 interim budget in terms of the standard of the 1950’ s. The addition of homeowner costs provide, for the first time, comparative budget costs for renter and owner families and intercity indexes of homeowner maintenance costs for equivalent housing.
vi
Digitized for FRASER http://fraser.stlouisfed.org/ Federal Reserve Bank of St. Louis

The effects of these and other changes on the moderate standard are discussed in detail in this bulletin.
A list of the Bureau’ s previous budgets and related references is provided in appendix C, including the Report of the Advisory Committee on Standard Budget Research, June 1963. The report summarizes the recommendations of a special committee of experts, representing users of standard budgets in State and local welfare administration, academic research, labor unions, and business organizations. The committee advised the Bureau on the direction that its research on standard budgets should take, and its recommendations formed guidelines for the Bureau in the development of the current budget.
The following bulletins in the current series report results of other phases of the standard budget research program:
Bulletin 1570-1 gives the autumn 1966 costs of the City Worker’ s Family Budget for a moderate standard of living.
Bulletin 1570-2 will describe the Revised Equi- valence Scale for estimating budget costs for families of different size, age, and type.
Bulletin 1570-3 will report the autumn 1966 Budget Pricing Procedures, Specifications, and Average Prices.
Subsequently, there will be bulletins on the spring 1967 costs for the moderate standard, and for a lower and a higher standard for the 4-person family and for the retired couple. The lower standard budget will represent a minimum of adequacy. Substantial downward adjustments will be made in the content and/or manner of living of the moderate standard, where this is possible without compromising the family’ s physical health or self- respect as members of their community.
In contrast with the moderate budgets, the lower standard budgets will not conform in certain respects to p r e v a i l i n g customs and buying practices—that is, to the collective judgments of families of these types concerning what is necessary for a satisfactory standard of living. The lower standard budgets are expected to be more appropriate than the moderate budgets for use in establishing goals for public assistance and income maintenance programs in the current decade.
The higher standard budget, while not connoting real affluence, will represent a more comfortable level and manner of living than the moderate standard, and a concept of economic success to which numerous American families aspire. The higher standard will be useful in measuring the ability of self-supporting families to pay for social and health services in unusual circumstances, and in general economic analysis.
In the future, estimates of the annual cost of the three standard budgets for the 4-person family and for the retired couple will be made as of the spring of the year and published periodically for the same metropolitan areas and regional classes of nonmetropolitan areas as those included in the present study. The budget quantities and weights will remain fixed, however, for longer periods of time. While living standards are constantly changing, and over time the accumulated change may be dramatic, year-to-year variations are often difficult to identify and the basic data to measure such differences as do occur are not available.
This bulletin was prepared by JeanC. Brackett under the supervision of Helen H. Lamale, Chief of the Division of Living Conditions Studies, and the general direction of Arnold E. Chase, Assistant Commissioner. Elizabeth Ruiz supervised the research for all budget components except food and medical care, for which Mary H. Hawes was responsible. Other staff members whose work contributed substantially to the project were Miriam A. Solomon, Roseann C. Cogan, Alice B. Curry, and M. Louise McCraw.
vii
Digitized for FRASER http://fraser.stlouisfed.org/ Federal Reserve Bank of St. Louis

Digitized for FRASER http://fraser.stlouisfed.org/ Federal Reserve Bank of St. Louis
Retired Couple’s Budget for a Moderate
Living Standard, Autumn 1966
Costs in Urban Areas
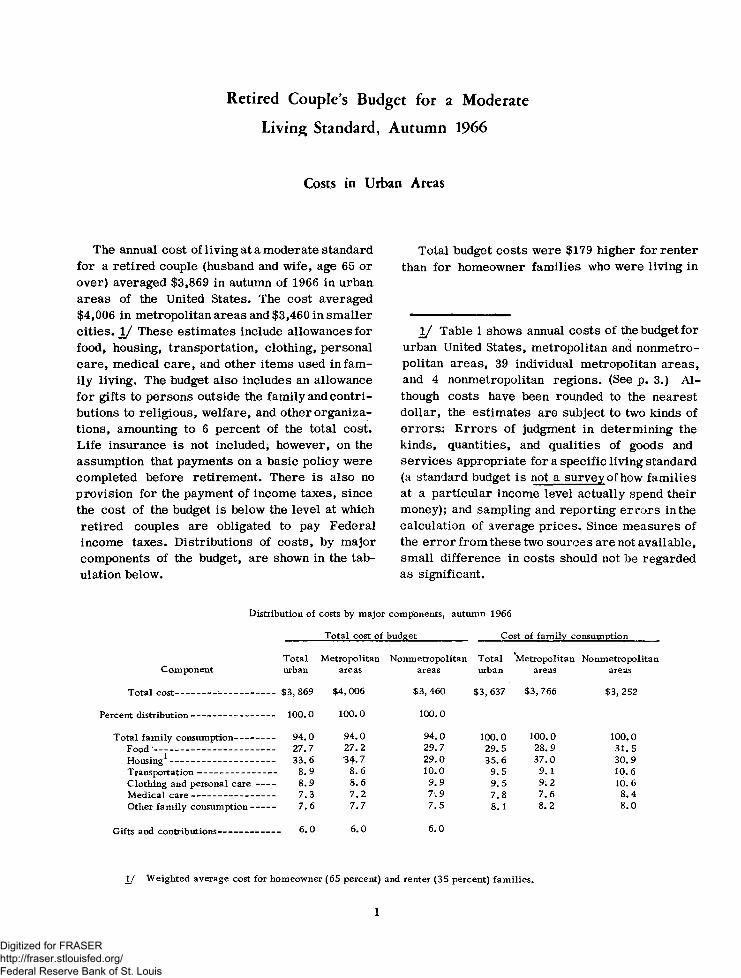
The annual cost of living at a moderate standard for a retired couple (husband and wife, age 65 or over) averaged $3,869 in autumn of 1966 in urban areas of the United States. The cost averaged $4,006 in metropolitan areas and $3,460 in smaller cities. JL/ These estimates include allowances for food, housing, transportation, clothing, personal care, medical care, and other items used in family living. The budget also includes an allowance for gifts to persons outside the family and contributions to religious, welfare, and other organizations, amounting to 6 percent of the total cost. Life insurance is not included, however, on the assumption that payments on a basic policy were completed before retirement. There is also no provision for the payment of income taxes, since the cost of the budget is below the level at which retired couples are obligated to pay Federal income taxes. Distributions of costs, by major components of the budget, are shown in the tabulation below.
Total budget costs were $179 higher for renter than for homeowner families who were living in
1 / Table 1 shows annual costs of the budget for urban United States, metropolitan and nonmetropolitan areas, 39 individual metropolitan areas, and 4 nonmetropolitan regions. (See p. 3.) Although costs have been rounded to the nearest dollar, the estimates are subject to two kinds of errors: Errors of judgment in determining the kinds, quantities, and qualities of goods and services appropriate for a specific living standard (a standard budget is not a survey of how families at a particular income level actually spend their money); and sampling and reporting er rors in the calculation of average prices. Since measures of the error from these two sources are not available, small difference in costs should not be regarded as significant.
Distribution of costs by major components, autumn 1966
Total cost of budget___________ Cost of family consumption
Total Metropolitan Nonmetropolitan Total Metropolitan NonmetropolitanComponent urban areas areas urban areas areas
Total cost------------- ------------ -------$3, 869 $4, 006 $3, 460 $3,637 $3,766 $3, 252
Percent distribution-------------------- ------- 100.0 100.0 100. 0
Total family consumption------ ------- 94.0 94.0 94.0 100.0 100.0 100.0Food'-------------------------------- ------- 27.7 27.2 29.7 29.5 28.9 31.5Housing1--------------------------- ------- 33.6 34.7 29.0 35.6 37.0 30.9Transportation------------------ ------- 8.9 8.6 10.0 9.5 9.1 10.6Clothing and personal care ------ 8.9 8.6 9.9 9.5 9.2 10. 6Medical care-------------------- ------- 7.3 7.2 7 .9 7.8 7 .6 8.4Other family consumption -------- 7 .6 7.7 7.5 8.1 8.2 8.0
Gifts and contributions----------- _____ 6.0 6.0 6.0
1J Weighted average cost for homeowner (65 percent) and renter (35 percent) families.
1
Digitized for FRASER http://fraser.stlouisfed.org/ Federal Reserve Bank of St. Louis

mortgage-free homes. 2/ Costs were highest for renter families in metropolitan areas and lowest for homeowner families in smaller cities, averaging $4,127 and $3,404 respectively. (See the following tabulation.) This difference reflects not only the variation in the costs and manner of living
2 / Since the majority of retired couples are homeowners, their costs constitute 65percent, and costs for renters 35 percent, of the weighted average cost of shelter for urban United States and each individual area.
associated with renting or owning a mortgage-free house but also the difference in transportation requirements and spending patterns for clothing, personal care, recreation, meals away from home, etc., between metropolitan areas and smaller cities. 3 /
3 / See appendix A for separate quantity lists for families residing in metropolitan and nonmetropolitan areas. These lists were developed for all budget components that were derived by analysis of the choices of goods and services made by consumers in successive, income groups.
Differences in total budget costs by type of area and tenure
TenureUrban
United StatesMetropolitan
areasNonmetropolitan
areasCost difference by type of area
Total budget c o s t --------------- $3,869 $4,006 $3,460 $546
Renter fam ilies---------------------------- 3,985 4,127 3,563 564
Homeowner fam ilies-------------------- 3,806 3,941 3,404 537 •
Cost difference by tenure---- 179 186 159 X£X
Intercity Differences
The new budget provides a wide variety of comparative living cost indexes, not only for total budget costs but for the major categories of consumer goods and services (table 2). For the first time in the Bureau’ s program of standard budget research, separate budget cost estimates and comparative indexes are provided for individual medium-sized metropolitan areas and for broad regional groupings of nonmetropolitan areas. The average costs for the items which make up the budget in each area are shown in table 1. Also, for the first time, comparative housing cost data for renter and owner families are included separately.
The intercity indexes reflect not only the differences among areas in price levels but also climatic or regional differences in the quantities and types of items required to provide the speci
fied standard of living, and differences in State and local taxes. They are comparative living cost indexes and not comparative price indexes.
Variations in Total Costs
The total annual cost of the budget in 1966 ranged from $3,246 in the small Southern cities to $4,434 in Honolulu. Indexes of relative costs for these areas were 84 and 115 respectively, with the U.S. urban average cost equal to 100. Hartford was the highest of the mainland cities, having a cost of $4,352 and an index rating of 112.
The budget exceeded the U.S. average cost by more than 5 percent in 5 of the 8 metropolitan areas in the Northeast (Hartford, New York- Northeastern, N.J., Boston, Buffalo, and Portland, Me.), and also in Milwaukee, Seattle, San Fran-
2
Digitized for FRASER http://fraser.stlouisfed.org/ Federal Reserve Bank of St. Louis
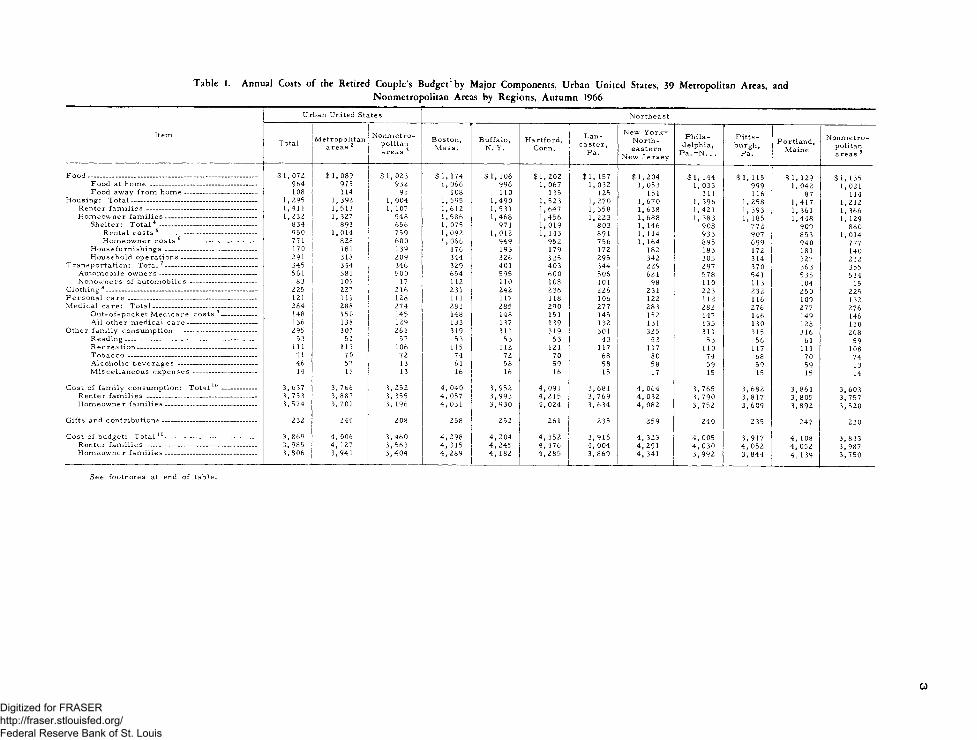
Table 1. Annual Costs o f the Retired Couple’s Budget by Major Components, Urban United States, 39 Metropolitan Areas, andNonmetropolitan Areas by Regions, Autumn 1966
Item
Urban United States Northeast
Total Metropolitan areas 2
Nonm etropolitan areas 3
Boston, M a ss .
Buffalo, N. Y.
Hartford,Conn.
Lancaster,
Pa.
New Y o rk - Northeastern
New Jersey
Philadelphia,
P a .-N . J.
P itts burgh,
Pa.Portland,
Maine
Nonmetropolitan areas 3
F ood ----------------------------------------------------------------------------- $ 1, 072 $ 1,089 $ 1,023 $ 1, 174 $ 1 ,1 06 $ 1,202 $ 1, 157 $ 1, 204 $ 1, 144 $ 1 ,1 1 5 $ 1, 129 $ 1,135Food at h o m e ------------------------------------------------- 964 975 932 1,066 996 1, 067 1, 032 1, 053 1,033 999 1,0 42 1,021Food away from h o m e--------------------------------- 108 114 91 108 110 135 125 151 111 116 87 1 14
Housing: T o ta l--------------------------------------------------------- 1 ,295 1,392 1, 004 1,595 1,4 90 1,523 1, 270 1 ,6 70 1, 396 1,258 1,417 1,212Renter fam ilies -------------------------------------------------- 1,411 1,513 1, 107 1 ,612 1, 531 1,647 1, 358 1, 638 1,421 1, 393 1, 361 1, 366Homeowner fa m ilie s ------------------------------------------ 1 ,232 1, 327 948 1,586 1,468 1,456 1,2 23 1 ,688 1,3 83 1, 185 1,448 1, 129Shelter: Total 4 -------------------------------------------- 834 893 656 1, 075 971 1, 019 803 1, 146 908 772 909 860
Rental costs 5 ------------------------------------------- 950 1,014 759 1,092 1 ,012 1, 143 891 1, 114 933 907 853 1, 014Homeowner costs 6 --------------------------------- 771 828 600 1,066 949 952 756 1, 164 895 699 940 777
Housefurnishings ------------------------------------------ 170 181 139 176 193 179 172 182 183 172 181 140Household operations---------------------------------- 291 318 209 344 326 325 295 342 305 314 327 212
Transportation: T o ta l7------------------------------------------ 345 344 346 329 401 403 344 229 297 370 363 355Automobile ow n ers-------------------------------------------- 561 581 500 654 595 600 506 621 578 541 535 514Nonowners of autom obiles ------------------------------ 83 105 17 112 n o 108 101 98 n o 113 104 15
Clothing 8--------------------------------------------------------------------- 225 227 216 231 242 236 226 231 223 232 250 225P erson al care ----------------------------------------------------------- 121 119 128 111 1 17 118 106 122 112 116 109 132M edical care: T o ta l----------------------------------------------- 284 288 274 281 285 290 277 283 282 276 277 276
O u t-of-pocket M edicare costs 9---------------- 148 150 145 148 148 151 145 152 147 146 149 146A ll other m edical c a r e -------------------------------- 136 138 129 133 137 139 132 131 135 130 128 130
Other fam ily consum ption------------------------------------- 295 307 261 319 311 319 301 325 311 315 316 268R eading------------------------------------------------------------ 53 52 57 53 53 53 43 53 53 56 61 59Rec reation------------------------------------------------------ 111 113 106 115 1 12 121 117 117 n o 117 111 108T o b a c c o -------------------- ------------------------------------- 71 70 72 74 72 70 68 80 74 68 70 74Alcoholic beverages ------------------------------------ 46 57 13 61 58 59 58 58 59 59 59 13M iscellaneous expenses ----------------------------- 14 15 13 16 16 16 15 17 15 15 15 14
Cost of fam ily consumption: T o ta l10---------------- 3, 637 3, 766 3 ,2 52 4, 040 3, 952 4, 091 3, 681 4 , 064 3, 765 3, 682 3 ,861 3, 603Renter fam ilies -------------------------------------------------- 3, 753 3, 887 3, 355 4, 057 3, 993 4 ,2 1 5 3, 769 4 , 032 3, 790 3 ,8 17 3, 805 3, 757Homeowner fa m ilie s ------------------------------------------ 3, 574 3, 701 3, 196 4, 031 3, 930 4 , 024 3, 634 4 , 082 3, 752 3, 609 3, 892 3, 520
Gifts and contributions------------------------------------------- 232 240 208 258 252 261 235 259 240 235 247 230
Cost of budget: T o ta l10------------------------------------------ 3, 869 4, 006 3, 460 4, 298 4, 204 4, 352 3 ,9 1 6 4, 323 4, 005 3, 917 4, 108 3, 833Renter fam ilies -------------------------------------------------- 3, 985 4, 127 3, 563 4, 315 4 , 245 4 ,4 7 6 4, 004 4 , 291 4, 030 4, 052 4, 052 3, 987Homeowner fa m ilie s ------------------------------------------ 3, 806 3,941 3 ,4 0 4 4, 289 4 , 182 4, 285 3 ,8 6 9 4 , 341 3 ,9 92 3 ,8 44 4, 139 3 ,7 50
See footnotes at end of table.
0)Digitized for FRASER http://fraser.stlouisfed.org/ Federal Reserve Bank of St. Louis
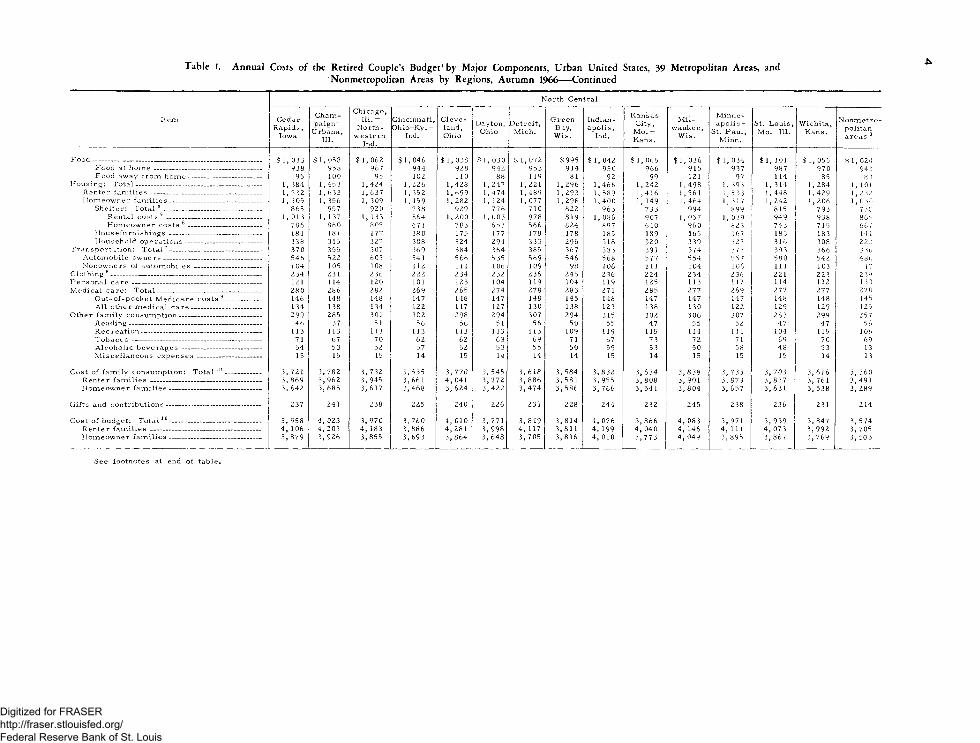
Table 1. Annual Costs o f the Retired Couple’s Budget1 by Major Components, Urban United States, 39 Metropolitan Areas, andNonmetropolitan Areas by Regions, Autumn 1966— Continued
A
North Central
Item Cedar Rapids,
Iowa
Cham - paign-
U rbana, 111.
Chicago, 111. —
Northwestern
Ind.
Cincinnati, Ohio—Ky. —
Ind.
C leveland,Ohio
Dayton,Ohio
Detroit,Mich.
GreenBay,W is.
Indianapolis ,
Ind.
KansasCity,
M o . -Kans.
M ilwaukee,
W is.
Minneapolis—
St. Paul, Minn.
St. Louis, M o.-111.
Wichita,Kans.
Nonm etropolitan areas 3
F o o d -________________________________________ ____ $ 1 ,0 3 3 $ 1,058 $ 1,062 $ 1, 046 $ 1 ,038 $ 1 ,0 30 $ 1 ,072 $995 $ 1 ,042 $ 1,065 $ 1,036 $ 1,034 $ 1, 101 $ 1,055 $ 1,024Food at home ----------------------------------------------- 938 958 967 944 928 942 953 914 950 966 915 937 987 970 94!Food away from h o m e--------------------------------- 95 100 95 102 110 88 119 81 92 99 121 97 114 85 8 3
Housing: T o ta l----------------------------------------------------—— 1, 384 1,453 1,424 1,226 1,428 1, 247 1, 221 1 ,2 96 1,466 1,242 1,498 1, 39 3 1, 314 1 ,2 84 1, 101Renter fam ilies -------------------------------------------------- 1, 532 1 ,633 1,637 1, 352 1 ,699 1,474 1,489 1,2 93 1, 589 1 ,416 1,561 1,533 1,448 1,429 1,2 32Homeowner fa m ilie s ------------------------------------------ 1, 305 1, 356 1, 309 1, 159 1 ,282 ], 124 1, 077 1,298 1,4 00 1, 149 1 ,4 64 1,317 1,242 1,206 1, 0 30
Shelter: Total 4 -------------------------------------------- 865 957 920 738 929 776 710 822 963 733 994 899 815 793 7 3 8Rental costs 5 ------------------------------------------- 1, 013 1, 137 1, 133 864 1,2 00 1,003 978 819 1, 086 907 1,057 1, 0 39 949 938 869Homeowner costs 6 --------------------------------- 786 860 805 67 1 783 65 3 566 824 897 640 960 823 743 715 667
H ou sefurn ishin gs---------------- --------— ------ ----- 181 181 177 180 175 177 178 178 185 189 165 167 183 183 14 1Household operations----------------------------------- 338 315 327 308 324 294 333 296 318 320 339 327 316 308 222
Transportation: T o ta l7----------------------- ------------------ 37 0 355 307 369 384 364 385 367 383 391 374 377 393 366 3 3bAutomobile ow n ers--------------------------------------------- 546 522 605 541 566 535 569 546 568 577 554 5 57 580 542 48bNonowners of autom obiles ------------------------------ 104 105 108 112 111 106 109 98 106 111 104 106 111 103 17
Clothing 8--------------------------------------------------------------------- 234 231 236 222 234 232 236 245 236 224 234 236 221 223 2 39Personal care ----------------------------------------------------------- 121 114 120 101 123 104 119 104 119 125 113 117 114 112 1 3 8M edical care: T o ta l----------------------------------------------- 280 286 282 269 265 274 278 283 271 285 277 269 277 277 27 0
O u t-of-pocket M edicare costs 9---------------- 146 148 148 147 148 147 148 145 148 147 147 147 148 148 145A ll other m edical c a r e ------------------------------ 134 138 134 122 1 17 127 130 138 123 138 130 122 129 129 125
Other fam ily consum ption-------------------------------------- 299 285 301 302 298 294 307 294 315 302 306 307 283 299 257R eading------------------------------------------------------------ 46 37 51 56 56 51 56 50 55 47 55 52 47 47 56R,ec reation------------------------------------------------------- 113 113 113 113 113 113 113 109 119 115 1 14 111 104 115 106Tobacco ----------------------------------------------------------- 71 67 70 62 62 63 69 71 67 73 72 71 69 70 69Alcoholic beverages ------------------------------------ 54 53 52 57 52 53 55 50 59 53 50 58 48 53 13M iscellaneous e x p e n se s ----------------------------- 15 15 15 14 15 14 14 14 15 14 15 15 15 14 13
Cost of fam ily consumption: T o ta l10---------------- 3, 721 3, 782 3, 732 3, 535 3, 770 3, 545 3, 618 3, 584 3, 832 3, 634 3, 838 3, 733 3, 703 3 ,6 16 3, 360Renter fam ilies -------------------------------------------------- 3, 869 3, 962 3, 945 3, 661 4 , 041 3, 772 3, 886 3 ,5 81 3, 955 3, 808 3, 901 3, 873 3, 837 3, 761 3 ,491Homeowner fa m ilie s ------------------------------------------ 3, 642 3, 685 3, 617 3, 468 3, 624 3, 422 3, 474 3, 586 3, 766 3, 541 3, 804 3, 657 3, 631 3, 538 3, 289
Gifts and contributions------------------------------------------- 237 241 238 225 240 226 231 228 244 232 245 238 236 231 214
Cost of budget: T o ta l10------------------------------------------ 3, 958 4 , 0 2 3 3, 970 3, 760 4, 010 3, 771 3, 849 3, 814 4, 076 3, 866 4, 083 3, 971 3, 939 3, 847 3, 574Renter fam ilies -------------------------------------------------- 4 , 106 4, 203 4, 183 3, 886 4, 281 3, 998 4 , 117 3 ,8 11 4, 199 4, 040 4, 146 4, 111 4, 073 3, 992 3, 705Homeowner fa m ilie s ------------------------------------------ 3, 879 3, 926 3 ,855 3, 693 3, 864 3, 648 3, 705 3, 816 4, 010 3 ,7 73 4, 049 3, 895 3, 867 3, 769 3, 503
See footnotes at end of table,
Digitized for FRASER http://fraser.stlouisfed.org/ Federal Reserve Bank of St. Louis
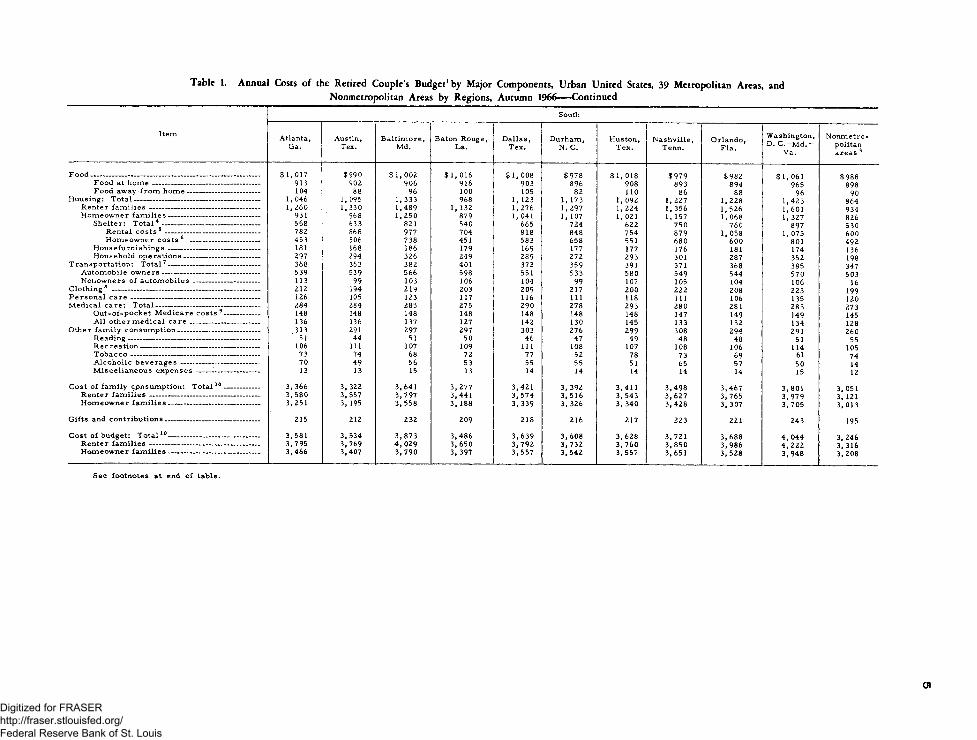
Tabic 1. Annual Costs o f the Retired Couple’s Budget1 by Major Components, Urban United States, 39 Metropolitan Areas, andNonmetropolitan Areas by Regions, Autumn 1966— Continued
Item
South
Atlanta,Ga.
Austin,Tex.
B altim ore,Md.
Baton Rouge, La.
D allas, T ex.
Durham, N. C.
Huston,Tex.
N ashville ,Tenn.
Orlando,Fla.
Washington, D. C . - M d . "
Va.
Nonmetropolitan areas 3
F ood___________________________________________________ $ 1,017 $990 $ 1 ,0 02 $ 1, 016 $ 1, 008 $978 $ 1 ,018 $979 $982 $ 1,061 $988Food at h o m e ----------- ----------------------------------- 913 902 906 916 903 896 908 893 894 965 898Food away from h o m e--------------------------------- 104 88 96 100 105 82 110 86 88 96 90
Housing: T o ta l------------------------------ ----------------------- 1 ,046 1,095 1,3 33 968 1, 123 1, 173 1, 092 1 ,2 27 1, 228 1 ,423 864Renter fam ilies --------------------------------- ---------------- 1 ,2 60 1 ,330 1,4 89 1, 132 1 ,2 76 1,297 1 ,2 24 1,3 56 1,526 1,601 934Homeowner fa m ilie s ------------------------------------------ 931 968 1 ,2 5 0 879 1, 041 1, 107 1 ,021 1, 157 1 ,068 1,327 826
Shelter: Total 4 -------------------------------------------- 568 633 821 540 665 724 622 750 760 897 530Rental costs 5 ------------------------------------------- 782 868 977 704 818 848 754 879 1, 058 1, 075 600Homeowner costs 6 -------------------------------- 453 506 738 451 583 658 551 680 600 801 492
H ou sefurn ishin gs------------------------------------------ 181 168 186 179 169 177 177 176 181 174 136Household operations---------------------------------- 297 294 326 249 289 272 293 301 287 352 198
Transportation: T o ta l7------------------------------------------ 368 363 382 401 372 359 391 371 368 385 347Automobile ow n ers-------------------------------------------- 539 539 566 598 551 533 580 549 544 570 503Nonowners of au to m o b iles------------------------------ 113 99 103 106 104 99 107 105 104 106 16
Clothing 8 ------------------------------------------------------------------- 212 194 219 203 209 217 200 222 208 223 199P erson al care ----------------------------------------------------------- 126 105 123 117 116 111 118 111 106 135 120M edical care: T o ta l----------------------------------------------- 284 284 285 275 290 278 293 280 281 283 273
O u t-of-pocket M edicare costs 9---------------- 148 148 148 148 148 148 148 147 149 149 145A ll other m edical c a r e -------------------------------- 136 136 137 127 142 130 145 133 132 134 128
Other fam ily consum ption------------------------------------- 313 291 297 297 303 276 299 308 294 291 260R eading------------------------------------------------------------ 51 44 51 50 46 47 49 48 48 51 55R ecreation ------------------------------------------------------ 106 111 107 109 111 108 107 108 106 114 105Tobacco ----------------------------------------------------------- 73 74 68 72 77 52 78 73 69 61 74A lcoholic beverages — ------------------------------ 70 49 56 53 55 55 51 65 57 50 14M iscellaneous e x p e n se s ------ 1--------------------- 13 13 15 13 14 14 14 14 14 15 12
Cost of fam ily cpnsumption: T o ta l10---------------- 3 ,3 66 3, 322 3 ,6 41 3 ,2 7 7 3,4 21 3, 392 3 ,4 11 3 ,4 9 8 3 ,4 67 3,801 3, 051Renter fa m il ie s -------------------------------------------------- 3 ,5 8 0 3,557 3 ,7 97 3,441 3, 574 3, 516 3, 543 3 ,6 2 7 3 ,7 6 5 3 ,9 7 9 3, 121Homeowner fa m ilie s ------------------------------------------ 3 ,251 3, 195 3, 558 3, 188 3, 339 3, 326 3, 340 3 ,4 2 8 3, 307 3 ,7 0 5 3, 013
Gifts and contributions------------------------------------------- 215 212 232 209 218 216 217 223 221 243 195
Cost of budget: T o ta l10- -------------------------------------- 3 ,581 3 ,5 34 3 ,8 7 3 3 ,4 8 6 3 ,6 3 9 3 ,6 0 8 3 ,6 2 8 3 ,721 3 ,6 8 8 4, 044 3, 246Renter fa m il ie s ----------------------------- ------------------ 3 ,7 95 3 ,7 69 4 , 029 3, 650 3 ,7 9 2 3 ,7 3 2 3 ,7 6 0 3 ,8 5 0 3 ,9 8 6 4 ,2 2 2 3, 316Homeowner fa m ilie s ------------------------------------------ 3, 466 3 ,407 3 ,7 9 0 3, 397 3 ,5 5 7 3 ,5 4 2 3, 557 3 ,6 51 3 ,5 2 8 3 ,9 4 8 3,2 08
See footnotes at end of table.
01Digitized for FRASER http://fraser.stlouisfed.org/ Federal Reserve Bank of St. Louis
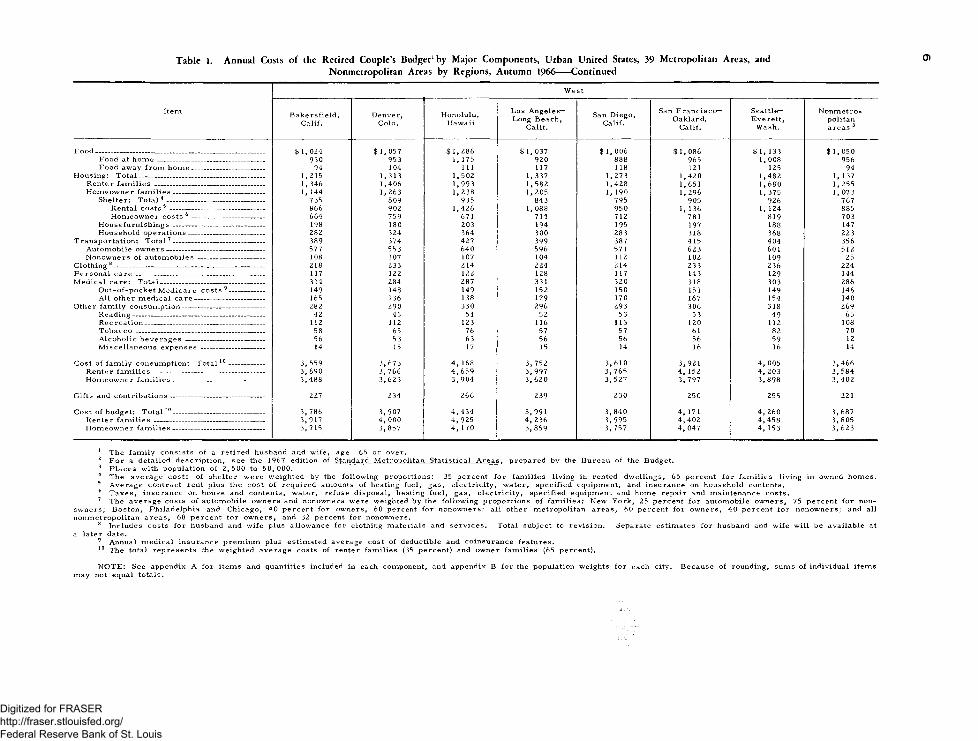
Table 1. Annual Costs o f the Retired Couple’s Budget1 by Major Components, Urban United States, 39 Metropolitan Areas, andNonmetropolitan Areas by Regions, Autumn 1966-----Continued
0)
W est
Item Bake rsfield, Calif.
Denver,Colo.
Honolulu,Hawaii
Los A n g e le s - Long Beach,
Calif.
San Diego, Calif.
San Francisco— Oakland,
Calif.
Seattle—Everett,
Wash.
Nonm etropolitan areas 3
F ood ----------------------------------------------------------------------------- $ 1,024 $ 1,057 $ 1 ,286 $ 1,037 $ 1 ,006 $ 1,086 $ 1, 133 $ 1 ,0 50Food at h o m e ------------------------------------------------- 930 953 1, 175 920 888 965 1,008 956Food away from h o m e--------------------------------- 94 104 111 117 118 121 125 94
Housing: T o ta l__________________________________ — 1,215 1,313 1,502 1,337 1,273 1 ,4 20 1,4 82 1, 137Renter fa m il ie s -------------------------------------------------- 1, 346 1 ,406 1,9 93 1,5 82 1,428 1,651 1 ,6 80 1, 255Homeowner fa m ilie s ------------------------------------------ 1, 144 1 ,263 1, 238 1,205 1, 190 1, 296 1, 375 1,07 3
Shelter: T o ta l4 --------------------------------------------- 735 809 935 843 795 905 926 767Rental costs 5 ------------------------------------------- 866 902 1,426 1 ,088 950 1, 136 1, 124 885Homeowner costs 6 ----- --------------------------- 664 759 671 711 712 781 819 703
Housefurnishings ------------------------------------------ 198 180 203 194 195 197 188 147Household operations----------------------------------- 282 324 364 300 283 318 368 223
Transportation: T o ta l7------------------------------------------ 389 374 427 399 387 415 404 356Automobile ow n ers-------------------------------------------- 577 553 640 596 571 623 601 512Nonowners of autom obiles ------------------------------ 108 107 107 104 112 102 109 25
Clothing 8--------------------------------------------------------------------- 218 233 214 224 214 233 236 224P ersonal c a r e ---------------------------------------------------------- 117 122 122 128 117 143 129 144M edical care: T o ta l----------------------------------------------- 314 284 287 331 320 318 303 286
O u t-of-pocket M edicare costs 9 ---------------- 149 148 149 152 150 151 149 146A ll other m edical c a r e -------------------------------- 165 136 138 179 170 167 154 140
Other fam ily consum ption------------------------------------- 282 290 330 296 293 306 318 269Reading----------------------------------------------------------- 42 45 51 52 53 53 49 65Recreation------------------------------------------------------ 112 112 123 116 113 120 112 108Tobacco ----------------------------------------------------------- 58 65 76 57 57 61 82 70Alcoholic beverages ------------------------------------ 56 53 63 56 56 56 59 12M iscellaneous expenses ----------------------------- 14 15 17 15 .14 16 16 14
Cost of fam ily consumption: T o ta l10---------------- 3, 559 3 ,6 73 4, 168 3, 752 3, 610 3, 921 4, 005 3 ,4 66Renter fam ilies -------------------------------------------------- 3, 690 3, 766 4 ,6 5 9 3 ,9 9 7 3, 765 4, 152 4 , 203 3, 584Homeowner fa m ilie s ------------------------------------------ 3 ,488 3 ,6 23 3 ,9 0 4 3, 620 3, 527 3 ,7 97 3, 898 3 ,4 0 2
Gifts and contributions------------------------------------------- 227 234 266 239 230 250 255 221
Cost of budget: T o ta l10------------------------------------------ 3, 786 3, 907 4 ,4 3 4 3,991 3 ,8 4 0 4, 171 4, 260 3, 687Renter fam ilies -------------------------------------------------- 3, 917 4, 000 4 , 925 4, 236 3 ,9 95 4 ,4 0 2 4 ,4 5 8 3, 805Homeowner fa m ilie s ------------------------------------------ 3, 715 3, 857 4 , 170 3, 859 3, 757 4, 047 4 , 153 3, 623
1 The fam ily consists of a retired husband and wife, age 65 or over.2 For a detailed description, see the 1967 edition of Standard Metropolitan Statistical A re a s , prepared by the Bureau of the Budget.3 P laces with population of 2 ,5 0 0 to 5 0 ,0 0 0 .4 The average costs of shelter were weighted by the following proportions: 35 percent for fam ilies living in rented dwellings, 65 percent for fam ilies living in owned hom es.5 Average contract rent plus the cost of required amounts of heating fuel, gas, electricity , water, specified equipment, and insurance on household contents.6 T axes, insurance on house and contents, water, refuse disposal, heating fuel, gas, electricity, specified equipment and home repair and maintenance costs.7 The average costs of automobile owners and nonowners were weighted by the following proportions of fam ilies : New York, 25 percent for automobile owners, 75 percent for non-
w ners; Boston, Philadelphia and Chicago, 40 percent for owners, 60 percent for nonowners; all other metropolitan areas, 60 percent for owners, 40 percent for nonowners; and all onmetropolitan a reas, 68 percent for ow ners, and 32 percent for nonowners.
8 Includes costs for husband and wife plus allowance for clothing m aterials and services . Total subject to revision. Separate estim ates for husband. and wife will be available at later date.
9 Annual m edical insurance prem ium plus estimated average cost of deductible and coinsurance features.10 The total represents the weighted average costs of renter fam ilies (35 percent) and owner fam ilies (65 percent).
N O TE: See appendix A for item s and quantities included in each component, and appendix may not equal totals.
B for the population weights for each city. Because of rounding, sums of individual item s
Digitized for FRASER http://fraser.stlouisfed.org/ Federal Reserve Bank of St. Louis
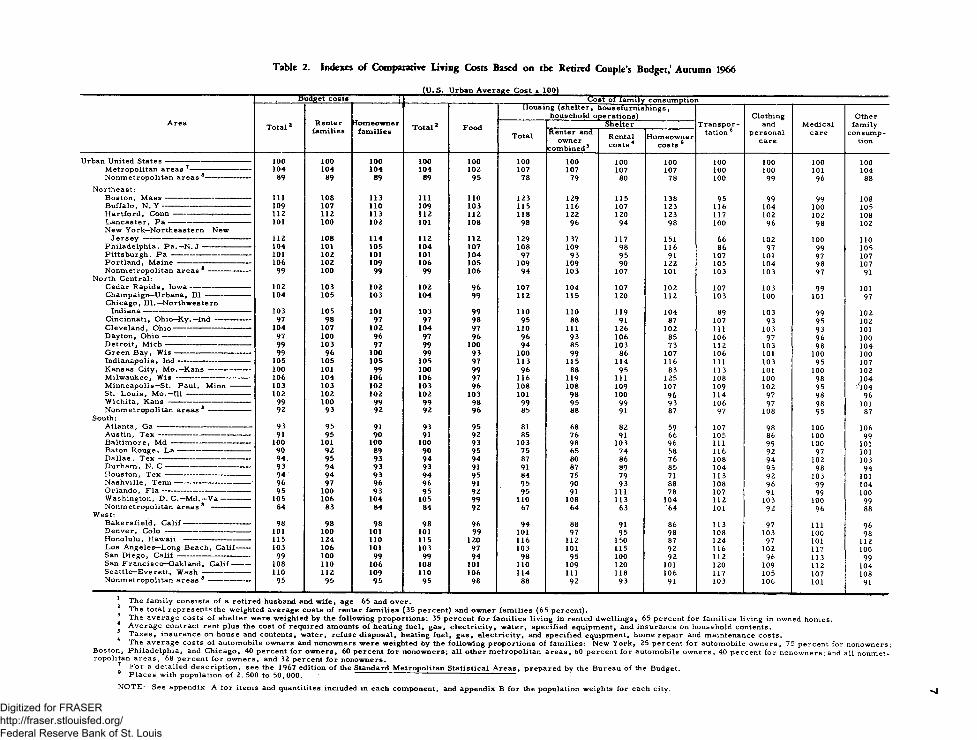
Tabic 2. Indexes o f Comparative Living Costs Based on the Retired Couple’s Budget,1 Autumn 1966
(U .S . Urban A verage Cost = 100)Budget costs _____________ L Cost of familY consumption
A rea T o ta l2 Renterfam ilies
Homeownerfam ilies T o ta l2 Food
Housing (sh elter, housefurnishings, household operations)
T ran sportation 6
Clothingand
personalcare
M edicalcare
Otherfamily
consumption
TotalShelter
Renter and owner
combined 3Rental costs 4
Homeowner costs 5
Urban United States —------------------------------------ 100 100 100 100 100 100 100 100 100 100 100 100 100M etropolitan areas 7---------------------------- 104 104 104 104 102 107 107 107 107 100 100 101 104Nonmetropolitan areas 8--------------------- 89 89 89 89 95 78 79 80 78 100 99 96 88
Northeast:Boston, M a s s --------------------------------------- 111 108 113 111 110 123 129 115 138 95 99 99 108Buffalo, N . Y ---------------------------------------- 109 107 110 109 103 115 116 107 123 116 104 100 105H artford, C o n n ----------------- ----------------- 112 112 113 112 112 118 122 120 123 117 102 102 108L an caster, P a -------------------------------------- 101 100 102 101 108 98 96 94 98 100 96 98 102New York—Northeastern New
Jersey ------------------------------------------------- 112 108 114 112 112 129 137 117 151 66 102 100 n oPhiladelphia, P a .—N. J ---------------------- 104 101 105 104 107 108 109 98 116 86 97 99 105Pittsburgh, P a ------------------------------------ 101 102 101 101 104 97 93 95 91 107 101 97 107Portland, M a in e --------------------------------- 106 102 109 106 105 109 109 90 122 105 104 98 107Nonmetropolitan areas 8 ------------------- 99 100 99 99 106 94 103 107 101 103 103 97 91
North Central:Cedar Rapids, Iow a---------------------------- 102 103 102 102 96 107 104 107 102 107 103 99 101Champaign—Urbana, 111--------------------- 104 105 103 104 99 112 115 120 112 103 100 101 97Chicago, 111.—Northwestern
Indiana------------------------------------------------- 103 105 101 103 99 110 110 119 104 89 103 99 102Cincinnati, Ohio—K y .—Ind ----- ----------- 97 98 97 97 98 95 88 91 87 107 93 95 102Cleveland, O hio------------------------------------ 104 107 102 104 97 110 111 126 102 111 103 93 101Dayton, O h io ---------------------------------------- 97 100 96 97 96 96 93 106 85 106 97 96 100D etroit, M ic h -------------- :------------------------ 99 103 97 99 100 94 85 103 73 112 103 98 104Green B ay, W i s ----------------------------------- 99 96 100 99 93 100 99 86 107 106 101 100 100Indianapolis, In d--------------------------------- 105 105 105 105 97 113 115 114 116 111 103 95 107Kansas City, M o .—K a n s ------------------- 100 101 99 100 99 96 88 95 83 113 101 100 102M ilwaukee, W i s --------------------------------- 106 104 106 106 97 116 119 111 125 108 100 98 104M inneapolis—St. P aul, Minn --------- 103 103 102 103 96 108 108 109 107 109 102 95 '104St. L ou is, M o .—I l l ----------------------------- 102 102 102 102 103 101 98 100 96 114 97 98 96W ichita, K a n s -------------------------------------- 99 100 99 99 98 99 95 99 93 106 97 98 101Nonmetropolitan areas 8 ------------------- 92 93 92 92 96 85 88 91 87 97 108 95 87
South:Atlanta, G a ------------------------------------------- 93 95 91 93 95 81 68 82 59 107 98 100 106Austin, T e x ------------------------------------------ 91 95 90 91 92 85 76 91 66 105 86 100 99B altim ore, M d ------------------------------------ 100 101 100 100 93 103 98 103 96 111 99 100 101Baton Rouge, L a --------------------------------- 90 92 89 90 95 75 65 74 58 116 92 97 101D allas , T e x ------------------------------------------ 94 95 93 94 94 87 80 86 76 108 94 102 103Durham , N. C --------------------------------------- 93 94 93 93 91 91 87 89 85 104 95 98 94Houston, T e x --------------------------------------- 94 94 93 94 95 84 75 79 71 113 92 103 101N ash ville , T e n n ----------------------------------- 96 97 96 96 91 95 90 93 88 108 96 99 104Orlando, F l a ---------------------------------------- 95 100 93 95 92 95 91 111 78 107 91 99 100Washington, D .C .—M d .—V a -------------- 105 106 104 105 99 110 108 113 104 112 103 100 99Nonmetropolitan areas 8 ------------------ 84 83 84 84 92 67 64 63 64 101 92 96 88
W est:B akersfield , C a lif ------------------------------- 98 98 98 98 96 94 88 91 86 113 97 111 96D enver, C o lo --------------------------------------- 101 100 101 101 99 101 97 95 98 108 103 100 98Honolulu, H a w a i i ------------------------------ 115 124 110 115 120 116 112 150 87 124 97 101 112Los Angeles—Long Beach, C alif------ 103 106 101 103 97 103 101 115 92 116 102 117 100San D iego, C a l i f --------------------------------- 99 100 99 99 94 98 95 100 92 112 96 113 99San Fran cisco—Oakland, C a lif --------- 108 110 106 108 101 110 109 120 101 120 109 112 104Seattle—E verett, W a s h ---------------------- 110 112 109 110 106 114 111 118 106 117 105 107 108Nonmetropolitan areas 8 ------------------- 95 95 95 95 98 88 92 93 91 103 106 101 91
1 The fam ily consists of a retired husband and w ife, age 65 and o ver.The total represents the weighted average costs of renter fam ilies (35 percent) and owner fam ilies (65 percent).
4 The average costs of shelter were weighted by the following proportions: 35 percent for fam ilies living in rented dw ellings, 65 percent for fam ilies living in owned hom es.5 Average contract rent plus the cost of required amounts of heating fuel, g a s , e lectricity , w ater, specified equipment, and insurance on household contents. ̂ T axe s, insurance on house and contents, w ater, refuse d isposal, heating fuel, g a s , e lectricity , and specified equipment, home repair and maintenance costs.
The average costs of automobile owners and nonowners w ere weighted by the following proportions of fam ilies: New York , 25 percent for automobile ow ners, 75 percent for nonowners; Boston, Philadelphia, and Chicago, 40 percent for ow ners, 60 percent for nonowners; a ll other m etropolitan area s, 60 percent for automobile ow ners, 40 percent for nonowners; and all nonmetropolitan a rea s, 68 percent for ow ners, and 32 percent for nonowners.
\ For a detailed description , see the 1967 edition of the Standard Metropolitan Statistical A re a s , prepared by the Bureau of the Budget.P laces with population of 2 ,5 0 0 to 5 0 ,0 0 0 . ' ‘
NOTE: See appendix A for items and quantitites included in each component, and appendix B for the population weights for each city.
Digitized for FRASER http://fraser.stlouisfed.org/ Federal Reserve Bank of St. Louis

cisco, and Honolulu. Costs below average by more than 5 percent were found in 6 of the 10 metropolitan areas in the South, in addition to the smaller Southern and North Central cities. In more than half (26) of the 43 areas, costs were within approximately $200 (5 percent) of the average. These areas included the three Pennsylvania cities (Philadelphia, Pittsburgh, and Lancaster); all of the cities in the North Central Region except Milwaukee; four of the Southern cities (Washington, D.C., Baltimore, Nashville, and Orlando); and Denver, Bakersfield, and Los Angeles in the West. Costs in the smaller cities in the Northeast and West were also within this range.
Wide variations in the combined costs for food, shelter, sand transportation are primarily responsible for the range in costs of the total budget. Indexes based on these three components differ from total budget cost i n d e x e s by 3 index points or less in 38 of the 43 areas. In three areas in the Northeast, however (Hartford, Boston, and the nonmetropolitan areas), indexes based on food, shelter, and transportation alone are higher by 4 or 5 points, compared to indexes based on total budget costs. On the other hand, costs of these three components understate the relative position of Houston and Atlanta, as costs for other components raise their rank by 4 and 6 percentage points respectively.
Food 4 /
The U.S. urban average annual cost of food for the retired couple was $1,072. Total annual food costs were highest in the New York area and Hartford, Connecticut, where they averaged about $1,200. In Durham, North Carolina and Nashville, . Tennessee these costs were roughly $980. The $220 difference reflects not only variation in prices, but also the regional preference patterns, used for cities within each region to calculate the cost of the nutritional standard for food at home. A special analysis of the food budget data will be made later, to determine what part of these costs differentials was due to price, and what part to regional preference patterns.
4 / See p. 17 for a detailed description of sources and methods used to derive budget quantities for food.
When the average U.S. cost of food at home ($964) equaled 100, there was a range of 19 percentage points between Hartford, the highest cost area in continental United States, and San Diego, the lowest cost area. Budget costs for food at home, using nutritionally comparable food plans, Were roughly $100 higher, on the average, in cities in the Northeast than in the North Central and Western regions. Costs in the last two regions were about $45 above the Southern costs. Differences in food-at-home costs within each region, which reflected price differences only, were nonetheless relatively large. In the Northeast they ranged from $996 in Buffalo to $1,067 in Hartford. The annual cost of food at home in Washington, D.C., where the U.S. preference pattern was used, was $965.
In contrast, costs for food away from home had a 64-percentage-point range between the New York area, with the highest costs, and Green Bay, Wisconsin, with the lowest costs. Average costs were lowest in the South and North Central regions, and highest in the Northeast. Costs for food away from home were above the U.S. average cost in the majority of both Northeastern and Western cities, and below the U.S. figure in the majority of North Central and Southern cities.
Housing 5/
Shelter costs for owners (65 percent) and renters (35 percent) combined, averaged $834 for urban United States, but varied from $1,146 in New York to $530 in the smaller cities in the South. Compared with the U.S. urban average ($950) equal to 100, shelter costs for renter families were 150 in Honolulu and 63 in the smaller Southern cities. The range in homeowner shelter costs was slightly wider, from 151 in New York to 58 in Baton Rouge.
The U.S. urban average outlay for maintaining a 5- or 6-room , mortgage-free owned home amounted to $771, or almost 20 percent less than the average costs ($950) for a 2 - or 3-room rental unit.
5/ For a detailed description, see p. 18.
Digitized for FRASER http://fraser.stlouisfed.org/ Federal Reserve Bank of St. Louis
Shelter costs for homeowner families include insurance, taxes, repair and replacement expenses, fuel, and utilities. In metropolitan areas in all parts of the country except the Northeast, these costs were about 25 percent below rental housing costs (including fuel, utilities, and insurance where these are not part of the contract rent). In the Northeast, however, owner costs were only 4 percent below renter costs, primarily as a result of relatively high fuel costs and property taxes. Shelter costs were higher for homeowner than for renter families in only three areas— Green Bay, Wis., the New York area, and Portland, Maine. In the smaller cities, owner costs averaged 20 percent below renter costs, with the ratio slightly wider in the Northeast and narrower in the South.
In addition to shelter, the budget allowance for the housing component covers household operation costs, and an amount for replacement of house- furnishings, assuming the family had average inventories of these items at the beginning of the year. Operation costs varied by $170, with Seattle on the high and smaller cities in the South on the low end of the distribution. The range in house- furnishings costs was only about a third as great, with a high of $203 in Honolulu and a low of $136 in the smaller Southern cities.
Transportation 6/
The pattern of automobile ownership specified for the budget reflects the greater availability of public transportation in some areas than in others. Thus in the New York area, only 25 percent of the retired couples were assumed to own automobiles. In Boston, Chicago, and Philadelphia, the comparable proportion was 40 percent; in all other metropolitan areas, 60 percent; and in nonmetropolitan areas, 68 percent. This variation in the weight - ing pattern, together with differences in prices, affects the intercity differentials for total transportation costs, making New York the lowest and Honolulu the highest cost city.
For automobiles owners alone, however, costs were about the same in New York and San Fran
cisco and were exceeded only by costs in Boston and Honolulu which averaged $654 and $640 respectively. Boston’ s costs were 17 percent and Honolulu’ s 14 percent above the U.S. urban average of $561. At the other end of the scale, costs in smaller cities in the North Central region were 13 percent below the U.S. average. In addition to price differences, this comparison reflects the fact that retired couples in smaller cities drive a lower average number of miles than in metropolitan areas.
For families who did not own automobiles, costs of public transportation (transit and taxi fares) were highest in Atlanta and lowest in Green Bay, Wis., among the metropolitan areas, but the range in cost amounted to only $15. Costs were substantially lower in the nonmetropolitan areas, however, where utilization rates were affected by the lack of public transportation.
Medical Care 7/
The medical care budget includes the couple’ s out-of-pocket expenses for hospital and medical care covered by Medicare, including the premium cost for medical insurance. It also includes the costs of other medical services and supplies not covered by Medicare. Total medical care costs were highest in the four California cities, and lowest in Cleveland and Cincinnati. Compared with the U.S. urban average cost ($284) equal to 100, costs were 117 in Los Angeles, and averaged downward by 24 percentage points to 93 in Cleveland.
Out-of-pocket costs under Medicare comprised 52 percent of the total medical care component at the U.S. urban level. With the U.S. urban average cost of $148 for all Medicare expenses equaling 100, there was a range of only 5 percentage points between the highest costs under Medicare in Los Angeles, and the lowest costs in small Southern cities. The largest part of these costs was the same in all cities, and was made up of the $72 premium for medical insurance, plus an estimated average charge of approximately $18 per couple for hospital services. Only the costs paid by the
6/ For a detailed description, see p. 19.
9
7 / For a detailed description, see p. 19.
Digitized for FRASER http://fraser.stlouisfed.org/ Federal Reserve Bank of St. Louis
enrollee under the medical insurance program varied from city to city, reflecting differences in * the costs of physician visits.
Budget costs for medical and dental services not covered by Medicare are in sharp contrast to the Medicare picture. There was a range of 45 percentage points between the high-and low-cost areas—Los Angeles and Cleveland respectively. Because the same standards were used in all cities, the intercity differences in these costs are due solely to price differences.
Clothing and Personal Care 8/
Clothing and personal care costs reflect both differentials in prices of commodities and services and variations in the kinds and quantities of clothing required by climate.
As might be expected, they were generally lowest in the South. However, within the region costs differed by 17 percentage points (almost $60), with Washington, D.C. the highest and Austin, Tex. the lowest cost city. The combined cost of clothing and personal care was highest in San Francisco, Seattle, and nonmetropolitan areas of the North Central and West, where higher prices together with larger allowances for personal care services in the smaller cities had a greater impact on costs than did the influence of climate on clothing quantities. The spread in costs among most cities was not great, however, since 33 of the 43 areas fall within 5 percent of the U.S. average cost, and 26 areas within 3 percent of the same average.
For other family consumption, the intercity cost differentials were wider than in clothing and personal care, but no regional pattern was apparent.
8/ For a detailed description, see p. 20.
Honolulu and New York had the highest costs, and the nonmetropolitan areas in the four regions had the lowest costs. Of the 43 areas, 29 were within 5 percent of the U.S. average cost.
Stable Differentials
Comparative cost indexes for 1950, 1959, and 1966 indicate considerable stability of intercity differentials. Among the 18 large cities included in all three studies, the city indexes varied by 12 percentage points in 1950, 23 points in 1959, and 19 points in 1966. Among all 34 large cities covered in 1950, the range was 16 percentage points; for the 20 large cities covered in 1959, 23 points; and for the 39 metropolitan areas and four regional groupings of nonmetropolitan areas covered in 1966, the range was 31 points. Inclusion of smaller areas and homeowner costs in 1966 contributed to the wider cost variation among cities, but not as much as might have been expected.
The 18 metropolitan areas covered in both the 1959 and the 1966 budgets were arrayed by total budget costs in 1959. Four of the six areas in the upper third of the distribution in 1959 remained in that bracket in 1966 (Boston, Seattle, Cleveland, and San Francisco). Chicago and Minneapolis fell to the middle third in 1966. Among the middle third in 1959, three were in the same group in 1966 (Los Angeles, Pittsburgh, and St. Louis); New York and Washington moved into the top third; and Detroit dropped to the lowest group. Of the six cities ranking lowest in 1959, Philadelphia moved into the middle bracket, but the other five (Kansas City, Cincinnati, Baltimore, Atlanta and Houston) remained in the lower third of the distribution. In sum, 12 of the 18 areas remained in the same third of the budget cost distribution in 1959 and 1966.
10
Digitized for FRASER http://fraser.stlouisfed.org/ Federal Reserve Bank of St. Louis
A Moderate Standard: Present and Past
Defining the Standard
“ Standards of living” refer to the goals we set for ourselves as consumers of goods and services and as users of leisure time and to our norms for conditions of living. “Levels of living” refer to the actual living conditions of families. “Manner of living” is the way or style of life (city or country, homeowner or renter, etc.)—in other words, how goods and services are consumed.
In a standard budget, the “goals of consumers” are translated into a list of goods and services which describe a specific standard that can be priced. To provide meaningful estimates of its costs, the budget standard must be related to a specific size and type of family, and specific assumptions must be made with respect to the family’ s manner of living. If these assumptions are reasonable and factually based, and if the list of goods and services has been determined by objective methods, then the standard budget provides an independently derived cost estimate for measuring income adequacy and evaluating the actual levels of living of families as revealed by consumer expenditure surveys and other consumption data.
The 1966 budget continues to represent, as did the original and interim budgets, a moderate standard of living for an urban retired couple, consisting of a husband and wife, age 65 or over. The concept of this standard was described in the original budget by the Social Security Administration as follows:
“ [The budget is j intended to include those goods and services that are necessary for a healthful, self-respecting mode of living that allows normal participation in the life of the community in accordance with current American standards. Social and conventional, as well as physiological, needs are taken into account. This level is definitely above the subsistence level in that it provides for more than physical needs or what would be necessary to carry families through a limited period of stringency. On the other hand, it is not
a luxury budget and it does not represent an American ‘ ideal’ way of living.” 9/
As noted in the Introduction, three kinds of data were used to arrive at the component parts of the budget: (1) Scientific or technical judgments concerning the requirements for physical health and social well-being; (2) provisions of the Medicare program; and (3) analytical studies of the data reported in the Bureau’ s surveys of consumer expenditures, to determine by objective procedures the choices of goods and services made by consumers in successive income groups. Since budgetary requirements vary with climate and other local conditons, the quantities and types of goods and services required to provide the moderate standard were adjusted to describe an equivalent standard of living from place to place. A description of these procedures is included in the last section of this bulletin.
The standard for the retired couple is equivalent to the standard for the younger, 4-person family described in the City Worker’ s Family Budget. In defining the modest standard forthat budget, the Technical Advisory Committee recognized that “ such a budget is not an absolute and unchanging thing. The prevailing judgment of the necessary will vary with the changing values of the community, with the advance of scientific knowledge of human needs, with the productive power of the community, and therefore with what people commonly enjoy and see others enjoy.” The same observation is relevant to the budget for a retired couple. 10/
Comparison with Earlier Budgets
The original budget for an elderly couple, developed by the Social Security Administration, was defined as “modest but adequate” in terms of standards prevailing in the years immediately
j j / Technical Reference 11, p.36, appendix C. 10/ Technical Reference 10, p.36, appendix C.
11
Digitized for FRASER http://fraser.stlouisfed.org/ Federal Reserve Bank of St. Louis
.preceding and following World War II. For goods and services other than food and shelter, the quantities and pricing lists were derived primarily from analyses of expenditures studies made in 1934-36 and 1941. The nutritional standard for food was based on the January 1946 low-cost food plan developed by the U.S. Department of Agriculture (USDA), but the selection of foods to meet these standards was made from the 1935-36 Study of Consumer Purchases. Specifications for healthful housing, formulated by the American Public Health Association in the mid-1940,s, were used as guides in defining the shelter standard, which was limited to rental housing. There was no provision for automobile ownership. This budget was priced in 13 large cities in March 1946, June 1947, and March 1949, and in 34 cities in autumn 1950. Pricing was discontinued, because the modest standard of the 1940*3 was no longer appropriate for measuring budget costs in the 1950’ s.
The modest standard of the interim budget for food, shelter, and medical care components was based on standards and purchasing practices of the mid-1950’ s. For other goods and services, the budget quantities and pricing lists were derived primarily from the Bureau’ s Survey of Consumer Expenditures in 1950. Food costs in this budget were based on an average of the USDA low- and moderate- cost plans to conform to the definition of a modest food standard adopted for both the original and interim budgets for the younger, 4- person family. As a result, however, the interim food budget for the retired couple represented a relatively higher point on the scale of consumption than did the original budget for this family type. Similarly, although the shelter component of the interim budget remained limited to rental housing, some provision was made for automobile ownership. Conceptually, this budget should have included the cost of maintaining a mortgage-free owned home, since then—as now—about two- thirds of retired couples were homeowners, and approximately 4 out of 5 of the homes were free of mortgage debt. Resources were not available, however, to estimate homeownership costs. The interim budget was priced only in autumn 1959, in 20 large cities.
The current budget is based on the standards of the 1960’ s. The nutritional standard for food
was based on the USDA moderate plan alone. The shelter standard reflects costs for both renter and homeowner families, and the provision for automobile ownership is consistent with this housing pattern. The pricing date is autumn 1966.
The differences among these three studies in the content of the moderate standard resulted from modification of the concept and methodological problems, as well as from real changes in the goals of consumers. Hence a comparison of the three budgets provides only a crude approximation of change in the living standard over the past two decades. The following comparison is limited to average costs in the 18 metropolitan areas included in all three studies and to costs for renter families only.
Changes in Total Costs
In the 18 cities priced in all three studies, the total cost of a moderate standard of living for a retired couple living in rental housing averaged about $1,790 in 1950. In 1959 the cost of the interim budget for the same 18 cities was $3,061, or 71 percent higher than in 1950. The cost of the current moderate standard in the same cities in 1966 averaged $4,126 for renter families. This level was 35 percent higher than in 1959 and 130 percent higher than in 1950. Gifts and contributions constituted 3 percent of total budget costs in 1950, 4.5 percent in 1959, and 6 percent in 1966.
A precise measure of the change attributable to revision in the standard or manner of living, as distinguished from that caused by increased prices, is almost impossible to achieve, because many of the commodities and services constituting the standard for an earlier period cannot be priced in current markets. However, the Consumer Price Index can be used to provide a very rough approximation of the effects of price change. The procedure followed was to update the costs of the earlier standards to 1966 by changes in the Consumer Price Index at the subgroup level for each of the 18 cities. Then, the differences between the costs of the 1966 standard in these cities and the updated
12
Digitized for FRASER http://fraser.stlouisfed.org/ Federal Reserve Bank of St. Louis
estimates of the 1951 and 1959 standards were deflated by the change in the CPI over the appropriate period to adjust for the higher price levels prevailing at the later date. The residual differences in costs between the new and the previous budgets in these 18 cities can be attributed to the upgrading of the standard. The average difference has been used hereafter in this report as a reasonable approximation of the change in the moderate standard for all urban U.S. retired couples.
The total increase of 35 percent in budget costs for renter families, from 1959 to 1966, can be identified as resulting from about a 15 percent rise in prices, leaving 20 percent to represent the upgrading of the standard. Compared with 1950, the new standard reflects a 60-percent rise in prices, plus changes in the standard amounting to 70 percent. Hence, over this 16-year period, the rise in the moderate standard (after adjustment for price changes) averages about 4.4 percent a year.
Over approximately the same period, 1950 to 1966, the increase in real after-tax income (also adjusted for price change) has been estimated at about 65 percent for families of the budget type, or approximately 4.1 percent a year. Average after-tax income for retired couples with head age 65 years or older, residing in urban areas, was $1,814 in 1950, and $3,534 in 1960-61, based on the BLS Surveys of Consumer Expenditures for these dates. 11/ Current Population Surveys by the Bureau of the Census for 1960-61 and 1966 indicate an increase of about 14 percent in mean incomes
11/ Median after-tax incomes—which are less affected by the extremes—were $1,657 and $2,825 for 1950 and 1960-61, as reported in the BLS surveys. The 1963 Social Security Survey of the Aged reported an average before-tax income in 1962 of $3,563 for retired couples who were receiving Social Security benefits, and a median income of $2,710. Beneficiary couples who did not work in 1962 had a median income of $2,410. See U.S. Department of Health, Education, and Welfare, Social Security Administration, The Aged Population of the United States, Research Report No. 19, 1967, pp. 238, 289, 291.
of all U.S. families of two persons or more, with the head 65 years of age or older. Applying this trend to the 1960-61 reported average results in an estimated income of $4,046 in 1966 for budget-type families. Thus, although the increase in the standard since 1950 has exceeded the improvement in real income, the level of the new budget is slightly below the current (1966) average money income of retired couples.
Upgrading the Food Standard
One of the major sources of upgrading in the 1966 standard was in the food component. The cost of the standard for food at home in the 1966 budget reflects a change in the specific Department of Agriculture (USD A) food plan selected to meet the nutritional standard, as well as changes in food preference patterns (variations in the choices of foods which provide the nutritional standard) which have occurred in the last decade.
The original (1950) budget costs were based on the USDA low-cost plan. In 1959 an average of the low- and moderate-cost plans was used, while the 1966 budget utilized only the moderate-cost plan. Although families can achieve nutritional adequacy from the low-cost food plan, it has been estimated that only about a fourth of those who spend amounts equivalent to the cost of this plan actually have nutritionally adequate diets. 12/ The foods included in this plan deviate considerably from family food patterns and require a considerable amount of home preparation and skill in cooking. Furthermore, the low-cost plan has been used widely as a basis for estimating minimum food cost requirements for public assistance programs. For these reasons it was decided that the moderate-cost plan was more appropriate for use in determining the cost of a moderate living standard.
Based on 1965 preference patterns and 1966 prices, the cost of the moderate plan for food at
12/ Based on nonfarm households using foods, valued at the cost of the plan, that provided recommended amounts of eight nutrients, as reported in the 1955 USDA Household Food Consumption Survey.
13
Digitized for FRASER http://fraser.stlouisfed.org/ Federal Reserve Bank of St. Louis
home for the retired couple is about 12 percent higher than an average of the low and moderate plans, and 26 percent above the low-cost plan alone. Since food at home represents 25 percent of the total cost of the 1966 budget, the use of the moderate plan—instead of an average of the low and moderate—accounts for about 3 ofthe2:t-per- cent increase in the overall standard between 1959 and 1966. Similarly, use of the moderate- rather than the low-cost plan accounts for 6.5 of the 70- percent increase in the overall standard since 1950.
Food-at-home costs in the original budget were based on 1935-36 U.S. preference patterns. The 1959 interim budget standard used 1955 regional preferences, and the 1966 budget reflects 1965 regional patterns. Among the 18 cities common to the interim and current budget studies, the change in preference patterns over the decade has resulted in relatively lower costs for food at home than would have obtained if the 1955 preference patterns had been continued in the new budget. However, the impact of the change was not the same in all cities. In Detroit, San Francisco, and Pittsburgh, for example, autumn 1966 moderate-plan food costs based on the 1965 preference patterns were 10 to 11 percent lower than autumn 1966 moderate-plan costs of the 1955 preference patterns in these cities. In Atlanta and Houston, however, they were only 3 and 5 percent lower, respectively.
Between 1955 and 1965, regional differences in food patterns lessened, and food buying habits in the South moved closer to the patterns in other parts of the country. As a result, the range in food costs among the 18 cities was reduced from 23 percentage points in the 1959 study to 16 points in the 1966 budget.
The new food standard also reflects an increase in the number of meals bought and eaten away from home by couples of this type. The 1966 allowance for metropolitan areas provides 46 restaurant meals, compared with 15 in the 1959 budget. The number of meals provided for guests at home (95) remained the same as in 1959.
Total food costs comprise 29 percent of the total cost of family consumption in the current budget,
while in the 1960-61 Survey of Consumer Expenditures food accounted for only 26 percent of comparable consumption expenditures. Generally, as income increases, expenditures for food decrease in relation to spending for other living expenses. Hence, the lower average ratio for food expenditures is evidence that the level of living actually achieved by the average retired couple is higher than that described by the moderate standard budget.
Effect of Changes in Shelter 13/
In the housing component of the new standard, rental costs were based on a narrower range of dwelling unit quality (i.e., the average of the middle third of the distribution of autumn 1966 contract rents for units that met the budget criteria of adequacy) than was used for the 1959 budget, in which costs were based on average rents for all units meeting the adequacy criteria. As a result of this procedural change, in two cities, Kansas City and St. Louis, the published costs for rental housing were lower in 1966 than the estimates published in 1959, even though fuel and utility costs over this period increased for the tenants who pay for them separately.
The narrower quality range used for the 1966 budget provides a more precise basis for measuring the cost of the moderate standard, but the 1966 estimates do understate somewhat the change in rental housing costs in comparison with 1959. This has relatively little effect on the overall cost level of the new budget, however, since only 35 percent of the retired couples were assumed to live in rental housing. The more significant change in the new standard is the previously discussed inclusion of homeowner costs for two- thirds of the families.
Increase in Auto Ownership 14/
Accompanying the change in the housing pattern is a revision in the proportions of families for
13/ For a detailed description, see p. 18. 14/ For a detailed description, see p. 19.
14
Digitized for FRASER http://fraser.stlouisfed.org/ Federal Reserve Bank of St. Louis
whom ownership of an automobile is specified. In the 1959 budget, New York, Philadelphia, and Boston were classified as low (14 percent) ownership cities. In the new budget, auto ownership was specified for 25 percent of the families in New York and 40 percent of those in the other two areas. For other localities in the 1959 budget, 22 percent of the families were assumed to own cars. This was raised in the newbudgetto40 percent of the families in Chicago and 60 percent of those in other metropolitan areas. Provision for occasional use of public transit systems declined sharply, but use of taxicabs increased slightly in the new standard, in comparison with the earlier one. These revisions were based on average patterns of ownership and use of public transportation by retired couples as reported in the 1960-61 Survey of Consumer Expenditures.
For the nonmetropolitan areas not previously included in the budget, automobile ownership was specified for 68 percent of the families. In many of the smaller cities public transportation is not readily available, and this is reflected in the quantities of transit and taxi rides provided for non- owners of automobiles in these places. Clearly, some retired couples must depend on walking, or on their auto-owning friends and relatives to satisfy some of their transportation needs. It is inevitable, however, that “equivalence” in living standards is conditioned by genuine differences in living patterns and the availability of goods and services in particular areas.
Effect of Medicare 15/
The advent of Medicare in 1966—providing federally supported hospital and medical insurance for persons 65 years of age and over—considerably changed the budget medical care standard from what it was in 1959. The interim budget assumed that only 45 percent of retired couples were covered by private hospital insurance plans, and made no allowance for any other medical insurance. For the 1966 budget it was assumed that all retired couples were covered by Medicare hospital and medical insurance.
15/ For a detailed description, see p. 19.
For the 18 cities common to the interim and current budget studies, the average 1959 cost of those medical services which are now under Medicare—physician and surgeon fees, hospital i n s u r a n c e , and some small miscellaneous expenses—was $231. Under Medicare, which has more liberal benefits than were provided by the 1959 private insurance, including posthospital extended care, home health benefits, and other services and supplies, the 1966 average budget cost in the 18 cities was $149, a drop of 49 percent from the estimated 1966 costs ($290) of the 1959 insurance—this in spite of rising medical prices. In other words, this part of the medical standard was upgraded at a substantially lower cost to the budget couples.
Other services and supplies in the 1966 medical care budget, which were not covered by Medicare, reflect further improvement in the medical standard. There were higher allowances in dental care for fillings, cleaning, and dentures; and the number of prescriptions more than doubled.
Other Changes
For all of the components derived by the quantity- or e x pe nd i t ur e - i nc o me elasticity technique, 16/ the new budget allowances reflect changes in living standards which accompany changes in real income. The demand for services rose sharply. In personal care, provision for all types of beauty shop services for women was higher. Simultaneously, the allowances for all personal care supplies, except for shampoos used at home, increased. Home services were also in demand. In the 1959 budget 5 out of 6 families were assumed to have home telephone service, which was used for local calls only. By 1966, all families were allowed home phones, and provision for some long-distance calls was added. More household help and laundry services were also provided in the new budget. The services of a dayworker were
16/ This technique is described on p. 20.
15
Digitized for FRASER http://fraser.stlouisfed.org/ Federal Reserve Bank of St. Louis
allowed at least once every other month, compared with less than three times a year in the interim budget.
The trend toward informality in manner of living, increased use of the automobile, and year- round control of temperatures in homes and public buildings, which affected the clothing choices of younger families, altered the patterns for older men and women as well. For example, quantities of topcoats and suits purchased by the retired man decreased, while slacks and sports coats in
creased. Older women also adopted more casual attire—more sweaters, jackets and casual shoes; fewer suits, lightweight coats, hats and gloves.
Movies attendance declined, and the replacement of radios and television sets leveled off, but the allowances for books and magazines increased in the new budget. Attendance at theaters, sports, and other recreational events also increased. Individual preferences play a large part in the way families spend their money, however, and the allowances provided for these items are not suggested as a spending plan for a retired couple.
Data Sources and Estimating MethodsThe theoretical basis for the procedures used
to develop the budget quantities and pricing lists for the retired couple is the same as for the budget for a younger family. It is summarized in the following quotation from the report on the original City Worker’ s Family Budget:
“ . . . In the actual experience of families there is a scale which ranks various consumption patterns in an ascending order from mere subsistence to plentitude in every respect.... This consumption scale is established by society. It can be discovered only through observation of the expressions of society’ s ratings of the various existing levels of living. These ratings of the various levels of living are expressed in the judgments of scientists, such as medical and public health authorities; and secondly, in the behavior of individual consumers. Scientific judgments are based primarily on the studies of the relation between family consumption and individual and community health. The expressions of consumer judgment appear in the choices made by consumers as economic barriers are progressively removed.”] ^
In 1963, the Bureau’ s Standard Budget Research Advisory Committee, in reviewing the procedures used in the original and interim budgets, affirmed
17/ Technical Reference 10, p. 36, in appendix C.
“the previous decision to use standards of adequacy based on the judgment of scientists and experts to the extent that such standards are available, supplemented by the analysis of statistical data on consumer practices.” 18/
Budget quantities and pricing specifications which describe the 1966 moderate standard were derived in a variety of ways. For food at home and shelter, which constitute 49 percent of the total costs of family consumption, allowances were based on scientific findings or expert technical judgments concerning requirements for physical health and social well-being. For transportation and supplemental medical care, accounting for 17 percent of family consumption, the prevailing practices of retired couples were used as a guide in developing budget allowances. Quantities for the remaining third of the consumption total were based on analytical studies of the Bureau’ s 1960-61 Survey of Consumer Expenditures. 19/ These studies determined by objective procedures the choices of goods and services made by consumers in successive income classes.
18/ Technical Reference 9, p. 36, in appendix C.
19/ For a description of this survey, see Handbook of Methods for Surveys and Studies (BLS Bulletin 1458, 1966), pp. 54-64.
16
Digitized for FRASER http://fraser.stlouisfed.org/ Federal Reserve Bank of St. Louis

The complete list of items and quantities per year is shown in appendix A. Pricing procedures and specifications for the majority of items in the budget are described in the forthcoming Bulletin 1570-3. A few items, which are purchased infrequently or represent an insignificant proportion of the total budget, were not priced. Values for these items were estimated as described in appendix A. Procedures for estimating food, shelter, and medical care costs are described in the text. Explanatory notes on the tables describe variations in the basic budget quantities as required for use in individual cities. The following is a general description of the major sources of data and methods of estimating quantities for the major components of the moderate budget.
Food
The Food and Nutrition Board of the National Research Council has established scientific standards for nutritionally adequate diets for various sex-age groups, which the U.S. Department of Agriculture used in developing food plans at different cost levels. 20/ The food-at-home component of the budget was based on the * moderate- cost* food plan, considered suitable for th average U.S. family. The plan contains 11 food categories which group foods according to similarity of nutritive values and uses in meals. The suggested quantities furnish the NRC’ s recom mended allowances for nutrients when average food selections within each group are used.
Regional consumption patterns for specific foods within each food group were obtained from the USD A 1965 Household Food Consumption Survey. Estimated budget costs reflect the food preferences of the income class containing the median income ($5,800) of the middle third of the USDA income distribution. The pattern for the
20/ Family Food Plans, 1964, CA 62-19, November 1964, Agricultural Research Service, United States Department of Agriculture. In this revision of the food plans the National Research Councils recommended dietary allowances, 1963 USDA nutritive values, and the USDA’ s most recent estimates of food consumption patterns were used.
region in which the city is located was used for each city except Washington, D.C. The U.S. pattern was used for Washington, since its population comes from all parts of the country and cannot be considered typically Southern.
The spring 1965 level of prices in each region was determined from the average prices paid for individual items by urban families in the $5,000- $5,999 income class in the USDA survey. These prices were weighted by factors which took into consideration the regional preference patterns for individual items within each major food group in the USDA plan. Individual city prices for pricing groups (groups of related items) were estimated from the preference-weighted regional survey averages, by applying the spring 1965 city-to- region ratios of prices collected by BLS for the same or comparable items. Spring 1965 city prices were adjusted to October 1966 by a special calculation of BLS item price changes. The 1966 city weighted average food group prices were applied to the USDA food plan quantities to obtain the final budget costs.
BLS prices used for updating the cost of food at home to 1966 price levels were those collected regularly for the Consumer Price Index from a representative sample of chain and independent food stores of various types (e.g., groceries and meat markets), stores at different levels of annual sales volume, and stores in different locationswithin a city. Average prices for each food were obtained by calculating independent and chain store averages separately, and then combining them with weights representing the relative volume of food sales by all food stores of each type in the city.
The USDA food plans provide for 21 meals per person per week to be eaten at home, or 2,184 meals annually for a couple. The budget for metropolitan areas provides 2,138 meals at home and the remainder—46 meals—in restaurants. In nonmetropolitan areas these quantities were 2,133 and51 respectively. In both areas an additional 95 meals at home are included for guests. The cost of food at home was calculated including an allowance of 10 percent, recommended by the U.S. Department of Agriculture to compensate for higher per person
17
Digitized for FRASER http://fraser.stlouisfed.org/ Federal Reserve Bank of St. Louis

food costs for small families. The average cost- per-guest meal was assumed to be the same as the average per-person cost for the couple’ s own meals at home. Dinner prices collected for the Consumer Price Index were used in calculating the cost of restaurant meals.
Shelter Costs
Standards for the shelter component of the budget were those established by the American Public Health Association and the U.S. Public Housing Administration. They relate to sleeping space requirements, essential household equipment (including plumbing), adequate utilities and heat, s t r u c t u r a l condition, and neighborhood location.
For renter families, the shelter standard called for an unfurnished two- or three-room dwelling in sound condition and with a complete private bath, a fully equipped kitchen, hot and cold running water, electricity, central or other installed heating, access to public transportation, grocery stores, and location in residential neighborhoods free from hazards or nuisances.
Rates for dwellings which met this standard were obtained from tenants during the regular rent surveys for the Consumer Price Index between August 1966 and January 1967. The cost of the rental shelter standard was calculated from the average rent in the middle third of the distribution of autumn 1966 rents. Since monthly contract rents in apartment structures usually include water, heat, light, cooking fuel, refrigerator, etc., the cost for these items was added to the contract rent for dwellings whose tenants paid separately for them. Insurance on household contents and against injury to persons on the property, comparable with the coverage provided for home- owner families, also was included in rental housing costs.
For homeowner families, the cost of maintaining the shelter standard was calculated for a five- or six-room , one- or one and one-half bath house that met the same dwelling unit and neighborhood specifications as described above for rental units. The average U.S. urban market value for such
dwellings was $14,480 in 1960-61. The market value was determined separately for each metropolitan area (and within areas for the city proper and the suburbs) and for each small city. It represents the average value in the middle third of the distribution of market values for dwellings in the BLS 1959-60 Comprehensive Housing Unit Survey which met the budget housing standard. The current (1966) market value for these homes is estimated to be about $15,560, based on change since 1960-61, in the Consumer Price Index for home purchase.
The house was assumed to be mortgage-free, since 85 percent of retired couples live in homes on which the mortgage has been paid up, according to the 1960-61 Survey of Consumer Expenditures. Therefore, homeowner shelter costs exclude allowances for mortgage interest and principal payments. However, appropriate taxes are included, reflecting varying assessment practices and rates in individual cities. The most economical comprehensive homeowner* s insurance policy was used to provide insurance up to 80 percent of the 1960-61 market value of the house, in addition to some coverage on its content and for injury to persons on the property. An allowance for repairs and replacement costs was also included, based on an analysis of the 1960-61 Consumer Expenditure Survey data for retired couples.
Fuel and utilities also are included in shelter costs. The housing specifications required central heating equipment in cities where the average January temperature is 40 degrees or colder, except in five cities where other installed heating equipment was accepted as more typical of the manner of living. Central or other installed heating equipment (base burner, pipeless furnace, or stove, with flue) was required for cities with warmer climates, except for Honolulu, and McAllen, Tex., where average January temperatures were 72 degrees and 61 degrees, respectively. A space heater was included for each of the second group of cities except Honolulu.
To adjust for climatic differences, fuel requirements for maintaining an indoor winter temperature of 70 degrees were estimated. The basis for these estimates was the amount of fuel used to
18
Digitized for FRASER http://fraser.stlouisfed.org/ Federal Reserve Bank of St. Louis

heat homes of approximately the budget specification, as reported in a 1962 trade association survey of 62 cities (supplemented by data from individual utility companies). These data were related to annual degree days in these cities, as recorded by the U.S. Weather Bureau. In the BLS analysis, the quantities of fuel were expressed in standard BTU’ s converted, for pricing purposes, to the predominant type of heating fuel used in each city. Estimates of electricity and other utilities for the appliances specified for the budget were o b t a i n e d from utility companies and associations.
Transportation
The standard for transportation is based on the average level of automobile ownership for retired couples, as recorded in the 1960-61 Survey of Consumer Expenditures. In four of the larger metropolitan areas, where public transportation is readily available, the weight for automobile ownership was adjusted to reflect the ownership patterns in these areas. Thus, ownership was specified for 25 percent of budget families in the New York area, and 40 percent of the families in Boston, Chicago, and Philadelphia. In all other metropolitan areas, the comparable weight is 60 percent. In nonmetropolitan areas, ownership was specified for 68 percent of the families. Allowances for occasional use of public transportation by automobile owners are higher in the four areas having mass transit systems than in other metropolitan areas and smaller cities.
The standard provides for the purchase of a used car every 8 years in metropolitan areas and every 6 years in nonmetropolitan areas, based on the customary purchases of families of the budget type. The average age of the car for which operating expenses were calculated is 7 years.
Medical Care
The medical allowance includes hospital and medical insurance as provided by the Federal Medicare program, initiated in July 1966. Under the hospital insurance, for each spell of hospitalization there is an initial $40 deductible amount
paid by the enrollee, and the insurance fully covers the remaining hospital costs for the first 60 days. Hospital insurance also includes 20 posthospital days in an extended care facility and 100 posthospital home health visits, at no cost to the enrollee. Finally, the hospital coverage includes outpatient hospital diagnostic benefits, for which the enrollee pays the first $20 and 20 percent of the balance of the cost for each diagnostic study.
Under the medical insurance program each enrollee pays a monthly premium amounting to $3 in 1966-67. In addition, the enrollee pays the initial $50 of costs plus 20 percent of all remaining costs for services and supplies (medical and surgical services of a physician, diagnostic tests, s e l e c t e d medical supplies, and home health benefits).
Since the budget is designed for a couple in reasonably good health and able to take care of themselves, it was assumed that no charges were incurred by the couple for the longer term provisions of Medicare. The estimated annual average out-of-pocket cost ($148) for all Medicare en- rollees was provided for budget use by the Office of Research and Statistics of the Social Security Administration, based on survey data for the first 12 months of the program. That portion of the estimated cost which covered the nonpremium charges under medical insurance ($58) was adjusted by BLS to reflect intercity differences in costs, primarily the differences in fees for physician visits—using data from a special BLS analysis.
Since Medicare does not cover the cost of routine dental care, eye examinations or eyeglasses for refractive error and correction, or most out-of-hospital prescription and nonprescription drugs, allowances for these items were added. Also added was a checkup visit to a physician for Medicare enrollees not using any Medicare services within 1 calendar year. Dental care quantities were derived from 1963-64 utilization data in the National Health Survey. Allowances for eye care and prescriptions and drugs were developed from the BLS 1960-61 Consumer Expenditure Survey data.
19
Digitized for FRASER http://fraser.stlouisfed.org/ Federal Reserve Bank of St. Louis

Average fees and prices for medical services and supplies were those collected for the Consumer Price Index, supplemented by prices obtained specifically for budget use.
Other Goods and Services
Food at home, shelter, transportation, and med- cal care, as specified for the budget, account for two-thirds of family consumption. The remaining third includes housefurnishings, household operation, clothing, personal care, reading, recreation, meals away from home, alcoholic beverages, and tobacco. For these components, budget allowances were developed by examining the quantities of, or expenditures for, various items purchased at successive income levels by retired couples in the Bureau’ s 1960-61 Survey of Consumer Expenditures. The purpose of the analysis was to determine the income level at which the rate of increase in quantities purchased, or expenditures, begins to decline in relation to the rate of change in income, i.e., the point of maximum elasticity. The average number and kinds of items purchased at these income levels are the quantities and qualities specified for the budget. Thus, they represent a composite of individual choices. This technique uses the consumer’ s collective judgment as to what is adequate and is based on the assumption that increasing elasticity indicates increasing urgency of demand, and decreasing elasticity indicates decreasing urgency. The point of maximum elasticity has been described as the point on the income scale where families stop buying “ more and more” and start buying either “better and better” or something else less essential to them. 21/
21/ This technique was developed for the original City Worker’ s Family Budget and is described in detail in Technical Reference 10, appendix C. It was also adopted by the Social Security Administration for the original Budget for an Elderly Couple (Technical Reference 11).
For a majority of the items in the housefurnishings, clothing, personal care, and recreation components, the quantities could be standardized for quality (by use of a constant price) across income classes; for the remainder of the components, only expenditure-income elasticities could be calculated. In the clothing, housefurnishings, and personal care components, the characteristic pattern, in which quantities at first increase relatively more rapidly than income and then increase at a relatively slower rate than income, was found. The inflection point, i.e ., the point of maximum elasticity, for the majority of subgroups of these components was in the (after tax) income class $3,000-$4,000.
For reading, meals away from home, and tobacco, the inflection point occurred most frequently in the next higher class, $4,000-$5,000. Quantities of alcoholic beverages were also derived from this income class, although elasticities for this component were ever increasing. Elasticities for recreation and household operations reached their maximum in income classes $5,000-$6,000, and $6,000-$7,500, respectively. To the extent that the inflection points for these different categories are spread across the income scale, the budget is a composite of average rates of spending at different income levels.
Gifts and Contributions
The allowance for this component was based on an upward adjustment of the ratio estimate used in the interim budget. The adjustment reflected both the change in the level of living and the increase in prices between 1959 and 1966.
It was used with some refinements in deriving quantities for The BLS Interim Budget for a Retired Couple in 1959 (Technical Reference 7). A mimeographed report providing a more detailed description of its use in the current budget will be available at a later date.
20
Digitized for FRASER http://fraser.stlouisfed.org/ Federal Reserve Bank of St. Louis

Appendix-----Contents
Appendix A. Annual quantities of items provided in the components of the Retired Couple’s Budget, autumn 1966 --------------------
Tables:A - 1. Food budget quantities--------------------------------------------------------------
A. Food at home -------------------------------------------------------------------B. Food away from home and guest meals ----------------------
A - 2. Housing budget quantities---------------------------------------------------------A. Shelter: Renter fam ilies-----------------------------------------------B. Shelter: Homeowner families --------------------------------------C. Housefurnishings -------------------------------------------------------------D. Household operations------------------------------------------------------
A - 3. Transportation budget quantities --------------------------------------------A. Automobile owners----------------------------------------------------------B. Nonowners of automobiles ---------------------------------------------
A -4 . Clothing budget quantities -------------------------------------------------------A. Husband------------ ------------------------------------------------------------------B. Wife -----------------------------------------------------------------------------------C. Clothing materials and services ----------------------------------
A - 5. Personal c a re ----------------------------------------------------------------------------A - 6. Medical c a r e ------------------------------------------------------------------------------A - 7. Other family consumption----------- -------------- -----------------------------
A. Reading m aterials-----------------------------------------------------------B. Recreation----------------------------------------------------------------------—C. Tobacco ----------------------------------------------------------------------------D. Alcoholic beverages---------------------------------------------------------E. Miscellaneous expenses -------------------------------------------------
A -8 . Gifts and contributions -------------------------------------------------------------
Page
21
22222223232324 24 26 26 26 27 272728 303031 31 31 31 31 31 31
Appendix B. Index of population weights used in the Retired Couple’s Budget ------------------ 33Appendix C. Technical references --------------------------------------------------------------------------------------------- 35
NOTE: The tables which follow list, for each component of the Retired Couple’ s Budget,the annual average quantities of items for which autumn 1966 prices were obtained or estimated to determine the annual costs of the budget. The quantities describe a moderate living standard for a family of two— a retired husband and wife, age 65 or over. The methods and sources used to derive the budget quantities are described in the text of this bulletin.
The codes in the tables identify the specifications used in pricing the commodities and services for the budget. For some budget items for which no code is shown, only an estimated cost in 1966 for all cities is indicated. These estimates were obtained by: (1) Updating the cost of the item, as reported in the 1960—61 Survey of Consumer Expenditures, to 1966 by change in the appropriate subgroup, group, or "a ll item s" Consumer Price Index; (2) updating the level of consumption, using data reported in trade journals, U .S. Department of Commerce’ s industry reports, and other sources; or (3) calculating the current cost of the item as a ratio of the cost of other items based on comparable ratios reported in the I960—61 CES. For further information on priced items see Bulletin 1570—3, Pricing Procedures, Specifications, and Average Prices, Autumn 1966 (to be published at a later date), which covers all priced items in the budget, other than food and shelter, for urban United States and five metropolitan areas (Chicago, Dallas, New York, San Francisco, and Washington, D . C . ) .
21
Digitized for FRASER http://fraser.stlouisfed.org/ Federal Reserve Bank of St. Louis
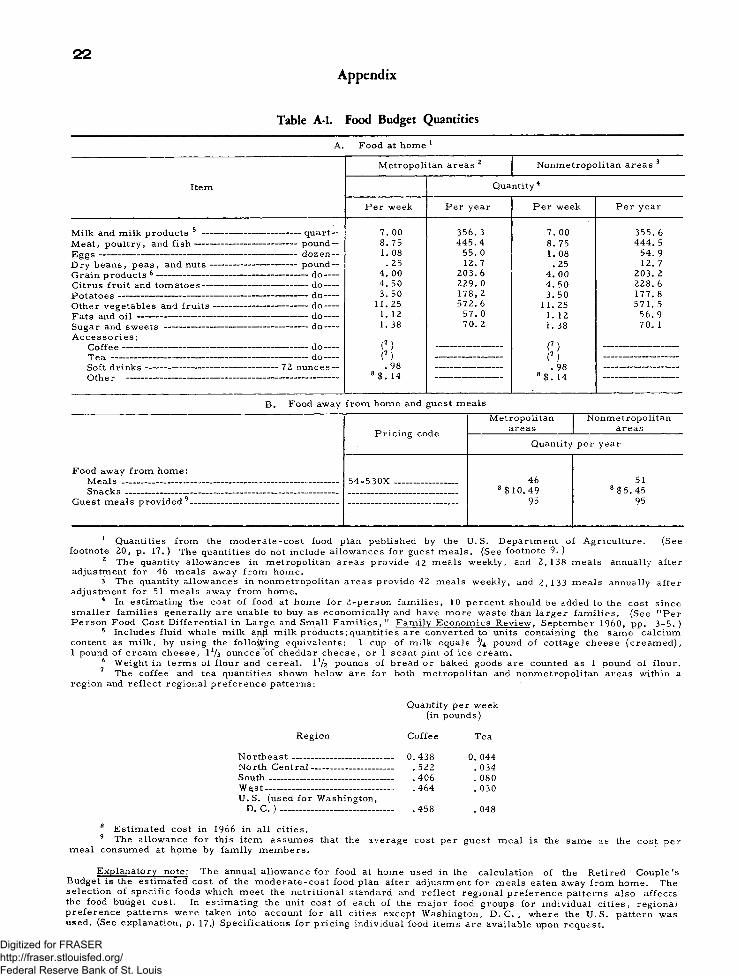
2 2Appendix
Table A-l. Food Budget Q uantitiesA. Food at home 1
Item
Milk and milk products 5 -------------------------Meat, poultry, and fish ---------------------------Eggs-----------------------------------------------------------Dry beans, peas, and nuts----------------------Grain products 6 ----------------------------------------Citrus fruit and tomatoes-------------------------Potatoes----------------------------------------------------Other vegetables and fruits---------------------Fats and o i l ----------------------------------------------Sugar and sweets -------------------------------------Accessories:
Coffee---------------------------------------------------Tea -------------------------------------------------------Soft drinks-------------------------------------------Other --------------------------------------------------
Metropolitan areas 2 Nonmetropolitan areas
Quantity 4
Per week P
-----quart--— pound —— dozen —— pound —------- do------------- do------------ do------------ do------------- do------------ do-----
7. 00 8.75 1. 08 . 25
4. 00 4. 50 3. 50
11. 25 1. 12 1. 38
er year Per week Per year
356. 3 445.4
55. 0 12. 7
203. 6 229. 0 178, 2 572. 6
57. 0 70. 2
7. 008. 75 1.08. 25
4. 00 4. 50 3. 50
11. 25 1. 12 1. 38
355. 6 444. 5
54. 9 12. 7
203. 2 228. 6 177. 8 571. 5
56.9 70. 1
---------do--------------do------72 ounces —
(7) (7) .98
$. 14
(I)(7). 98
$. 14
B. Food away from home and guest meals
Food away from home:Meal s - _ _ _ _ _ _ _
Pricing codeMetropolitan
areasNonmetropolitan
areasQuantity per year
468 $10. 49
95
518 $5. 45
95Snacks
Guest mealR prnvided 9
1 Quantities from the moderate-cost food plan published by the U. S. Department of Agriculture. (See footnote 20, p. 17.) The quantities do not include allowances for guest meals. (See footnote 9.)
2 The quantity allowances in metropolitan areas provide 42 meals weekly, and 2,138 meals annually after adjustment for 46 meals away from home.
3 The quantity allowances in nonmetropolitan areas provide 42 meals weekly, and 2,133 meals annually after adjustment for 51 meals away from home.
4 In estimating the cost of food at home for 2-person families, 10 percent should be added to the cost since smaller families generally are unable to buy as economically and have more waste than larger families., (See "Per Person Food Cost Differential in Large and Small Fam ilies," Family Economics Review. September I960, pp. 3-5. )
5 Includes fluid whole milk arid milk products; quantities are converted to units containing the same calcium content as milk, by using the following equivalents: 1 cup of milk equals 3/f pound of cottage cheese (creamed), 1 pound of cream cheese, IV3 ounces of cheddar cheese, or 1 scant pint of ice cream.
6 Weight in terms of flour and cereal. IV2 pounds of bread or baked goods are counted as 1 pound of flour.7 The coffee and tea quantities shown below are for both metropolitan and nonmetropolitan areas within a
region and reflect regional preference patterns:
Quantity per week (in pounds)
Region Coffee Tea
Northeast--------------------------------- 0.438 0. 044North Central— ..........-....... ....... . 522 . 034South--------------------------------------- .406 . 080Wqst-------- -------- -----------------------U.S. (used for Washington,
. 464 . 030
D. C. ) — -.............. - ................... .458 . 048
8 Estimated cost in 1966 in all cities.9 The allowance for this item assumes that the average cost per guest meal is the same as the cost per
meal consumed at home by family members.
Explanatory note: The annual allowance for food at home used in the calculation of the Retired Couple'sBudget is the estimated cost of the moderate-cost food plan after adjustment for meals eaten away from home. The selection of specific foods which meet the nutritional standard and reflect regional preference patterns also affects the food budget cost. In estimating the unit cost of each of the major food groups for individual cities, regional preference patterns were taken into account for all cities except Washington, D. C. , where the U.S. pattern was used. (See explanation, p. 17.) Specifications for pricing individual food items are available upon request.
Digitized for FRASER http://fraser.stlouisfed.org/ Federal Reserve Bank of St. Louis
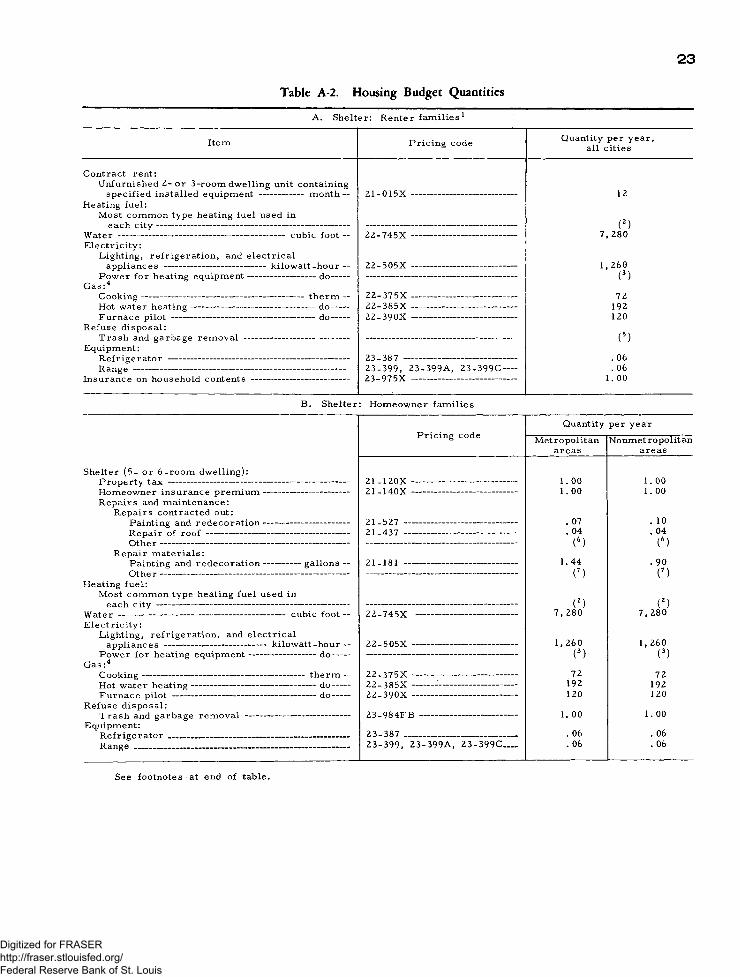
2 3
A. Shelter: R e n t e r families1
Table A-2. Housing Budget Quantities
Item Pricing code Quantity per year, all cities
Contract rent:Unfurnished 2 - or 3-room dwelling unit containing
specified installed equipment ---------------- month —Heating fuel:
Most common type heating fuel used ineach city---------------------------------------------------------------
Water ------------------------------------------------------ cubic foot —Electricity:
Lighting, refrigeration, and electricalappliances --------------------------------- kilowatt-hour ~
Power for heating equipment------------------------do-----Gas :4
Cooking------------------------------------------------------ therm —Hot water heating------------------------------------------ do-----Furnace pilot ------------------------------------------------do------
Refuse disposal:Trash and garbage removal —
Equipment:Refrigerator -------------------------Range -------------------------------------
Insurance on household contents
21-015X
22-745X
22-505X
22-375X22-385X22-390X
23-387 -------------------------------------23-399, 23-399A, 23-399C----23-975X --------------------------- ------
12
( 2 )7,280
1,260( 3 )
72192120
( 5 )
. 06
.06 1 . 0 0
B. Shelter: Homeowner families
Shelter (5- or 6-room dwelling):Property tax ------------------------ ------------ ----------------------Homeowner insurance premium----------------------------Repairs and maintenance:
Repairs contracted out:Painting and redecoration----------------------------Repair of roof -----------------------------------------------Other--------------------------------------------------------------
Repair materials:Painting and redecoration------------gallons —Othe r --------------------------------------------------------------
Heating fuel:Most common type heating fuel used in
each city ---------------------------------------------------------------Water ------------------------------------------------------ cubic foot —Electricity:
Lighting, refrigeration, and electricalappliances ------------■-------------------- kilowatt-hour —
Power for heating equipment------------------------- do---Gas :4
Cooking---------------------------------------------- therm —Hot water heating-------------------------------------------- do---Furnace pilot ------------------------------------------------do------
Refuse disposal:Trash and garbage removal -------------------- --------------
Equipment:Refrigerator-----------------------------------------------------------Range ______________________________________________
Pricing codeQuantity per year
Metropolitanareas
Nonmetropolitanareas
21-120X ----------------------------------21-140X ----------------------------------
1.001.00
1.00 1.00
21-527 ------------------------------------- . 07 . 1021-437 ------------------------------------- . 04 . 04
(6) (6)
21-181 ------------------------------------- 1.44 .90(7) n
(2) (2)22-745X --------------------------------- 7, 280 7,280
22-505X ---------------------------------- 1,260 1, 260(3) (3)
22-375X ---------------------------------- 72 7222 -385X ---------------------------------- 192 19222-390X ---------------------------------- 120 120
23-984FB -------------------------------- 1. 00 1.00
23-387 ________________________ . 06 . 0623-399, 23-399A, 23-399C___ .06 .06
See footnotes at end of table.
Digitized for FRASER http://fraser.stlouisfed.org/ Federal Reserve Bank of St. Louis
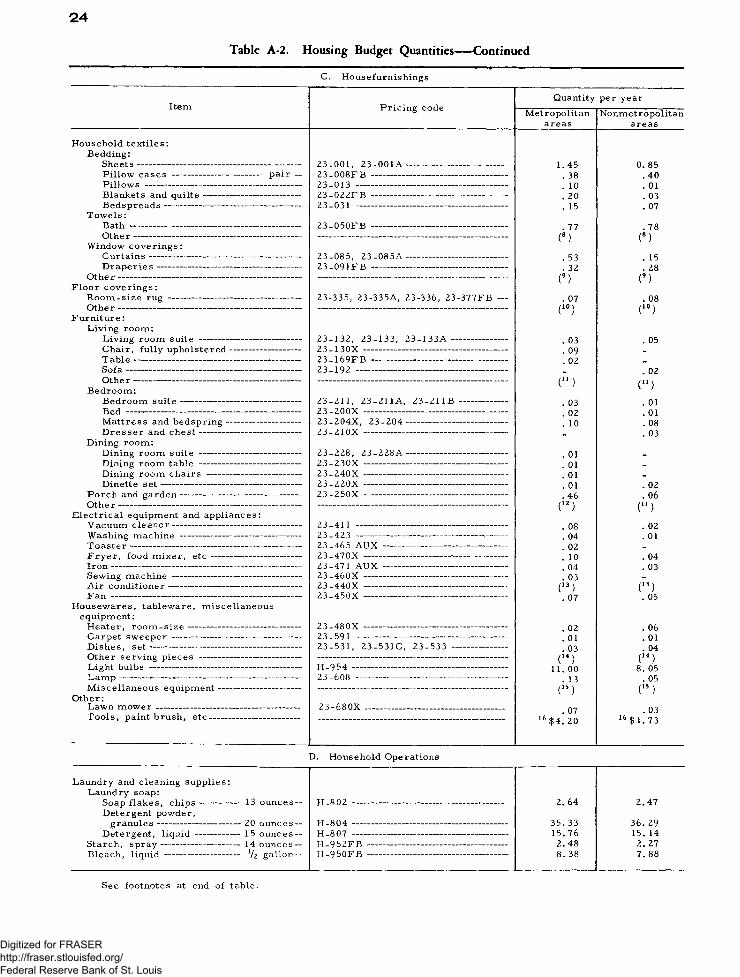
24Table A-2. H ousing Budget Quantities— Continued
C. Housefurnishings
Item Pricing codeQuantity per year
Metropolitan Nonmetropolitan areas areas
Household textiles: Bedding:
Sheets ---------------------Pillow cases ----------Pillows -------------------Blankets and quilts -Bedspreads-------------
Towels:Bath------------------------
pair —
Other -----------------Window coverings:
Curtains------------Draperies---------
Other----------------------Floor coverings:
Room-size rug ------------Other-----------------------------
Furniture:Living room:
Living room suite —Chair, fully upholstered-Table--------------------------------Sofa----------------------------------Other-------------------------------
Bedroom:Bedroom suite---------------Bed ---------------------------------Mattress and bedspring-Dresser and chest---------
Dining room:Dining room suite ---------Dining room table ---------Dining room chairs ------Dinette set---------------------
Porch and garden---------------Other-----------------------------------
Electrical equipment and appliances:Vacuum cleaner----------------------------------Washing machine --------------------------------Toaster------------------------------------------------Fryer, food mixer, etc ----------------------Iron------------------------------------------------------Sewing machine ----------------------------------Air conditioner-----------------------------------Fan ------------------------------------------------------
Housewares, tableware, miscellaneous equipment:
Heater, room -size-----------------------------Carpet sweeper ----------------------------------Dishes, set------------------------------------------Other serving pieces ------Light bulbs ----------------------Lamp--------------------------------Miscellaneous equipment -
Other:Lawn m ower--------------------Tools, paintbrush, etc —
23-001, 23-001A -----------------------------23-008FB ----------------------------------------23-013 ---------------------------------------------23-022FB ----------------------------------------23-031 ---------------------------------------------
23-050FB ----------------------------------------
23-085, 23-085A-----------------------------23-091FB ----------------------------------------
23-335, 23-335A, 23-336, 23-377FB
23-132, 23-133, 23 -1 33 A --------------23-130X -------------------------------------------23-169FB ----------------------------------------23-192 ---------------------------------------------
23-211, 23-211 A, 23-211B -----------23-200X ------------------------------------------23-204X, 23 -204-----------------------------23-21 OX ------------------------------------------
23-228, 23-228A-----------------------------23-230X ------------------------------------------23-240X ------------------------------------------23-220X ------------------------------------------23-250X ------------------------------------------
23-411 ---------------------------------------------23-423 ---------------------------------------------23-465 AUX ------------------------------------23-470X ---------------------------- --------------23-471 A U X ------------------------------------23-460X ------------------------------------------23-440X ------------------------------------------23-450X ------------------------------------------
23-480X ------------------------------------------23-591 ---------------------------------------------23-531, 23-531C, 23-533 --------------
H-954 ----------------------------------------------23-608 ---------------------------------------------
23 -680X ___________________________
1.45 0. 85. 38 .40. 10 . 01. 20 . 03. 15 . 07
. 77 . 78(8) (8)
. 53 . 15
. 32 . 28(9) (9)
. 07 . 08(i°) (10)
. 03 . 05
. 09 -
. 02 -
_ . 02(“ ) (“ ). 03 . 01. 02 . 01. 10 . 08- . 03
. 01 _
. 01 -
. 01 -
. 01 . 02
.46 . 06(12) (U )
. 08 . 02
. 04 . 01
. 02 -
. 10 . 04
. 04 . 03
. 03 _(l3) (13)
. 05. 07
. 02 . 06
. 01 . 01
. 03 . 04(14) (14)
8. 0511. 00. 13 . 05
(15) (15)
. 07 . 03$4. 20 16 $ 1. 73
Laundry and cleaning supplies: Laundry soap:
Soap flakes, chips----------Detergent powder,
granules ------------------------Detergent, liquid -----------
Starch, spray -----------------------Bleach, liquid ----------------------
D. Household Operations
13 ounces — H-802 -------------------------------------------------- 2. 64 2.47
20 ounces- H-804 --------------------------------------------------- 35. 33 36. 291 5 ounces — H-807 --------------------------------------------------- 15.76 15. 1414 ounces — H-952FB ---------------------------------------------- 2.48 2. 27l / z gallon — H-950FB ---------------------------------------------- 8. 38 7. 88
See footnotes at end of table.
Digitized for FRASER http://fraser.stlouisfed.org/ Federal Reserve Bank of St. Louis

Table A—2. H ousing Budget Q uantities---- C ontinuedD. Household Operations— Continued
Item Pricing codeQuantity per year
Metropolitan ____ areas
Nonmetropolitan ______areas_______
Laundry and cleaning supplies— ContinuedFloor wax ------------------------------ 27 ounces -Scouring powder------------------ 14 ounces -Scouring pads----------------------- box of 10 -Air deodorizer --------------------- 7 ounces .Other----------------------------------------------------------
Paper supplies:Paper napkins---------------------- box of 80 -Toilet tissu e------------------ 650 -sheet roll -Paper towels, shelf, wax paper, foil, etc-
Services and miscellaneous supplies:Launderettes-------------------------------- pound -Laundry sent out ------------------- 10 pounds -Household help----------------------------- days -Miscellaneous supplies----------------------------
Communications:Residential telephone service:
Basic charge----------------------------------------Long distance---------------------------------------
Postage------------------------------------------------------Stationery, greeting cards, e tc --------------
H-951FB . H-953FB .H-901 -----H-906 -—
H-764 . H-799
34-754 . 23-924 . 23-931 •
22-624 .
I6*j16 4
3. 50 3. 2215. 68 14.445. 04 4. 633. 38 3. 02(1?) (1?)
11. 03 10. 4169.46 64.47
(18) O148.83
19. 64 -6. 52 4. 09(19) (19)
12. 00 12. 00(2°)
$21. 13(2°)
16 $ 19. 60$15. 08 16 $ 13. 73
Allowances specified for fuel, utilities, and equipment do not apply when the cost of these items is included in the monthly rent.
2 Heating fuel requirements vary with the length and severity of the cold season, type of structure, and type of heating equipment. The variation caused by climate is measured in standard British thermal units (B .t.u . ) (convertible to equivalent quantities of fuel oil, gas, etc.) and the normal number of annual degree days in a given city, derived from annual data published by the U.S. Weather Bureau. (A degree day is a unit, based upon temperature difference and time, which measures the difference between the average temperature for the day and 65 F. when the mean temperature is less than 65° F. ; the number of degree days for any one day is equal to the number of Fahrenheit degrees difference between the average and 65° F. ) The average number of B .t.u .'s required in a given city may be computed as follows:
2- or 3-room unit— Million of B. t. u. 's = 0. 75 (-302. 817962 + 110. 285800 times the logarithm of the normal number of annual degree days)
6-room unit— Million of B .t.u . 's — -302. 817962 + 110.285800 times the logarithmof the normal number of annual degree days.
The quantity of any type of heating fuel used in a given city can be determined by converting the required number of B .t .u .'s into quantities of the type of fuel used. In the determination of the total amount of fuel required, both the average B .t.u . content and an assumed efficiency factor must be taken into consideration for each specified fuel.
3 The kw.-hrs. of electricity required to operate gas or oil heating equipment vary according to the amount of fuel used. The average required number of kw.-hrs. assumed here is 0.25 per therm of gas and 0.44 per gallon of fuel oil.
4 In cities where either electricity or oil was the predominant fuel used for cooking and/or hot water heating, it was substituted for gas. The annual allowances for electricity are as follows: Cooking, 1080 kw. -hrs. ; hot water heating, 3480 kw. -hrs. For oil, the annual requirement of hot water heating is 155 gallons.
5 Cost is included in the rent.6 In metropolitan areas, cost is 110.3 percent of cost of contracting for itemized repairs; in nonmetropolitan
areas, 100. 1 percent.7 In metropolitan areas, cost is 111.5 percent of cost of paint and redecorating materials; in nonmetropolitan
areas, 106. 5 percent.8 In metropolitan areas, cost is 53.2 percent of cost of bath towels; in nonmetropolitan areas, 59.0 percent.9 In metropolitan areas, cost is 35.7 percent of total cost of itemized textiles; in nonmetropolitan areas,
28. 9 percent.'l0 Cost is 432. 7 percent of cost of room-size rug in both metropolitan and nonmetropolitan areas.11 In metropolitan areas, cost is 6. 1 percent of cost of itemized living-room furniture; in nonmetropolitan
areas, 1.7 percent.12 In metropolitan areas, cost is 18.8 percent of total cost of itemized furniture.13 An annual allowance of 0. 03 air conditioners is limited to cities with an average July-Aug. temperature
of 8 5° and over, and a relative humidity of at least 85 percent; cities with an average July-Aug. temperature of 90° or over, regardless of relative humidity; and \Los Angeles, with average July-Aug. temperatures close to 85° and relative humidity nearly 85 percent, as reported by U.S. Weather Bureau.
14 In metropolitan areas, cost is 113. 8 percent of cost of sets of dishes; in nonmetropolitan areas 33. 0 percent.15 In metropolitan areas, cost is 10.0 percent of total cost of furniture, equipment and housewares; in non
metropolitan areas, 12.7 percent.16 Estimated cost for all cities.17 In metropolitan areas, cost is 26. 8 percent of cost of itemized laundry and cleaning supplies; in non
metropolitan areas, 26. 5 percent.18 Cost is 150.0 percent of cost of itemized paper products.19 In metropolitan areas, cost is 39. 1 percent of total cost of laundry, cleaning, and paper supplies; in
nonmetropolitan areas, 36.8 percent.20 In metropolitan areas, cost is 14.9 percent of cost of basic telephone service; in nonmetropolitan areas,
14.8 percent.Digitized for FRASER http://fraser.stlouisfed.org/ Federal Reserve Bank of St. Louis
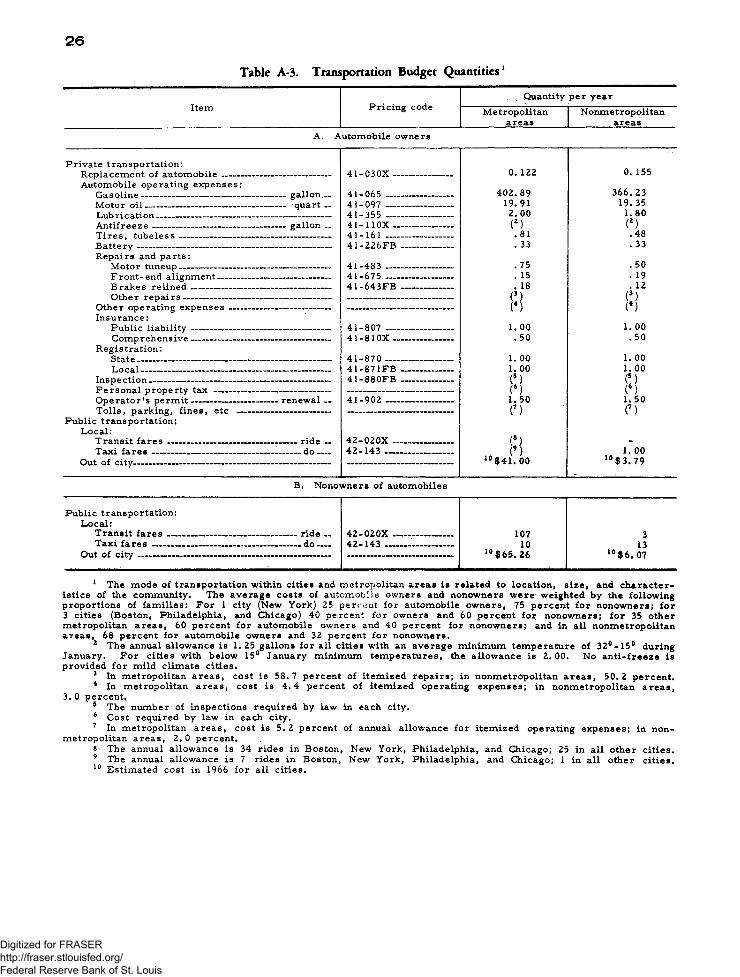
2 6
Tabic A-3. Transportation Budget Q uan tities1
Item Pricing codeQuantity per year
M etropolitanareas
Nonmetropolitanareas
A. Automobile owners
Private transportation:Replacement of au tom obile-------Automobile operating expenses:
G asoline---------------------------------M otor o i l --------------------------------Lubrication----------------------------A n tifreeze --------- --------------------T ires, tubeless --------------------B a ttery ----------------------------------Repairs and parts:
M otor tuneup---------------------Front-end alignm ent--------Brakes re lin e d -----------------Other rep a irs -------------------
Other operating ex p en ses----Insurance:
Public lia b ility -----------------Com prehensive-----------------
Registration:State----------------------------------L o ca l---------------------------------
Inspection------------------------------Personal property tax ---------O perator's p erm it-----------------T olls, parking, fines, etc —
Public transportation:Local:
Transit f a r e s ------------------------Taxi f a r e s -----------------------------
Out of city------------------------------------
41-030X -
g a l lo n - quart —
gallon —
41-065 __41-097 — 41-355 — 41-110X - 41-161 — 41-226FB
41-483 — 41-675 — 41-643FB
41-807 — 41-81 OX
41-870 — 41-871FB 41-880FB
renewal — 41-902
ride - 42-020X.d o ___ 42-143 ..
0 . 122 0. 155
402.8919.912.00(*) .81 . 33
366.23 19.35
1.80(2) .48 . 33
.75
. 15
. 18Pi.50 . 19 . 12s;i
1. 00 .50
1. 00. 50
1. 00 1. 00(’ )( 1 2 3 4 5 6 )1.50(7 8)
1 . 00 1 . 00 ( [ ) (6 ) 1.50(7)
0(9 10)10 $ 4 1. 001 . 00
10 $ 3. 79
B. Nonowners of automobiles
Public transportation: Local:
Transit fares —Taki f a r e s --------
Out of c i t y -------------
r i d e - 42-020X — .d o 42-143 -—
10710
10 $65. 26
313
10 $6. 07
1 The mode of transportation within cities and m etropolitan areas is related to location, s ize , and characteristics of the community. The average costs of automobile owners and nonowners were weighted by the following proportions of fam ilies: F or 1 city (New York) 25 percent for automobile owners, 75 percent for nonowners; for 3 cities (Boston, Philadelphia, and Chicago) 40 percent for owners and 60 percent for nonowners; for 35 other metropolitan areas, 60 percent for automobile owners and 40 percent for nonowners; and in all nonmetropolitan areas, 68 percent for automobile owners and 32 percent for nonowners.
2 The annual allowance is 1.25 gallons for all cities with an average minimum tem perature of 32°-15° during January. For cities with below 15° January minimum tem peratures, the allowance is 2 .00. No anti-freeze is provided for mild clim ate cities.
3 In metropolitan areas, cost is 58. 7 percent of item ized repairs; in nonmetropolitan areas, 50. 2 percent.4 In metropolitan areas, cost is 4 .4 percent of item ized operating expenses; in nonmetropolitan areas,
3. 0 percent,5 The number of inspections required by law in each city.6 Cost required by law in each city.7 In metropolitan areas, cost is 5 .2 percent of annual allowance for item ized operating expenses; in non
metropolitan areas, 2. 0 percent.8 The annual allowance is 34 rides in Boston, New York, Philadelphia, and Chicago; 25 in all other cities.9 The annual allowance is 7 rides in Boston, New York, Philadelphia, and Chicago; 1 in all other cities.10 Estimated cost in 1966 for all cities.
Digitized for FRASER http://fraser.stlouisfed.org/ Federal Reserve Bank of St. Louis
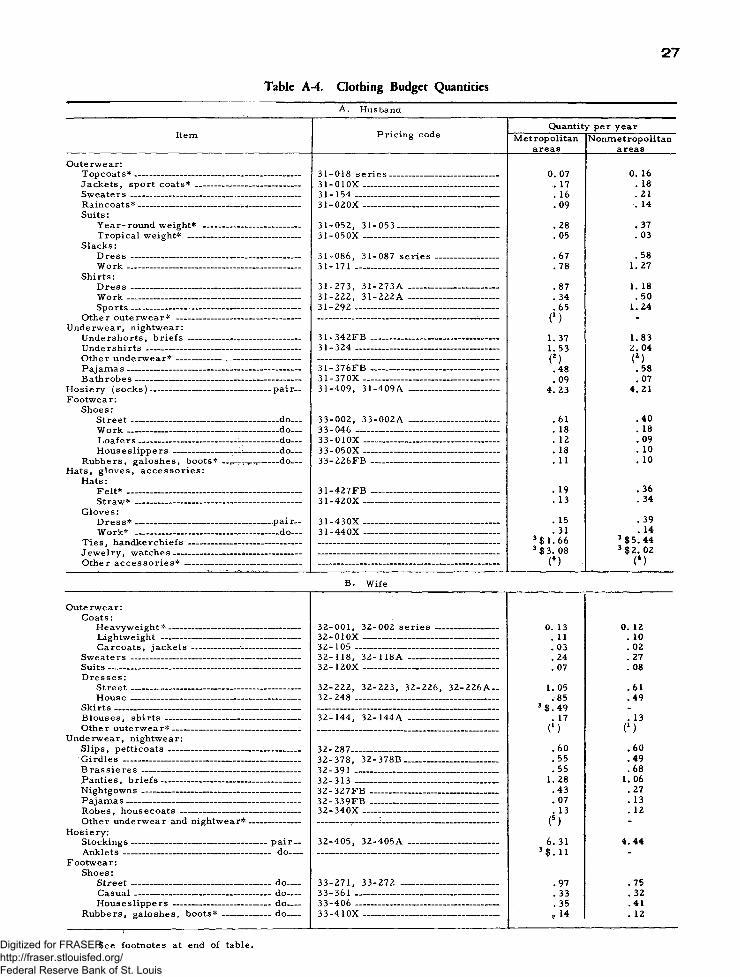
27
Item
Outerwear:Topcoats*------------------------------Jackets, sport coats*----------Sweaters------------------------------Raincoats*----------------------------Suits:
Year-round weight* -------Tropical weight* ------------
Slacks:D re ss-------------------------------Work--------------------------------
Shirts:Dress —-----------------------------Work--------------------------------Sports-------------------------------
Other outerwear* ----------------Underwear, nightwear:
Undershorts, b rie fs------------Undershirts--------------------------Other underwear*-------------- -Pajamas--------------------------------Bathrobes------------------------------
Hosiery (socks)-------------------------Footwear:
Shoes:Street -------------------------------Work--------------------------------Loafers----------------------------Houseslippers-----------------
Rubbers, galoshes, boots* Hats, gloves, accessories:
Hats:F elt* --------------------------------Straw*------------------------------
Gloves:D ress*------------------------------Work* ----------------------------- -
Ties, handkerchiefs------------Jewelry, watches-----------------Other accessories* -------------
Table A-4. Clothing Budget QuantitiesA. Husband
pair—
------------ do—------------ do—------------do—------------do—i-t-i - ftt-------------d O --------
.p a ir— —do—
Pricing code
31-018 series--------------31-010X ----------------------31-154 -------------------------31-020X ----------------------
31-052, 31-053-----------31-05OX ----------------------
31-086, 31-087 series 31-171 -------------------------
31-273, 31-273A _____31-222, 31-222A -------31-292 -------------------------
31-342FB31-324
31-376FB -----------31-37 OX-------------31-409, 31-409A
33-002, 33-002A33-046 ----------------33-010X -------------33-050X -------------33-226FB -------—
31-427FB 31-420X -
31-430X - 31 -44 OX -
Quantity per yearMetropolitan
areasNonmetropolitan
areas
0. 07 0. 16. 17 . 18. 16 . 21.09 . 14
. 28 . 37
. 05 . 03
. 67 . 58
. 78 1. 27
. 87 1. 18
. 34 . 50
.65 1. 24(l ) -
1. 37 1.831. 53 2. 04(2) (2).48 .58.09 . 07
4. 23 4.21
. 61 .40
. 18 . 18
. 12 .09
. 18 . 10
. 11 . 10
. 19 .36
. 13 . 34
. 15 . 39
. 31 . 143 $ 1.66 3 $ 5. 443 $3. 08 3 $2. 02
(4) (‘ )
B. Wife
Outerwear:Coats:
Heavyweight * ------------------------Lightweight ----------------------------Carcoats, jackets----------- —•—
Sweaters--------------------------------------Suits---------------------------------------------Dresses:
Street----------------------------— -----House--------------------------------------
Skirts-------------------------------------------Blouses, shirts--------------------------Other outerwear*----------------------—
Underwear, nightwear:Slips, petticoats--------- ----- -------- -Girdles ----------------------------------------Brassieres-------- --------------------------Panties, briefs----------------------------Nightgowns----------------------------------Pajamas---------------------------------------Robes, housecoats ----------------------Other underwear and nightwear*
Hosiery:Stockings--------------------------------------Anklets----------------------------------------
Footwear:Shoes:
Street --------------------------------------Casual-------------------------------------Houseslippers ------------------------
Rubbers, galoshes, boots*-------------------5------------------------
32-001, 32-002 series32-01 OX________________32-105 ---------------------------32-118, 32-118A ----------32 -120X -------- ----------------
32-222, 32-223, 32-226 32-248 ---------------------------
32-144, 32-144A
32-287-----------------32-378, 32-378B32-391 --------- -32-313 ---------------32-327FB ----------32-339FB ----------32-340X -------------
pair - do-
32-405, 32-405A
do.do-do.do-
33-271, 33-361 - 33-406 - 33-410X
33-272
0. 13 0. 12. 11 . 10.03 . 02. 24 . 27. 07 . 08
1. 05 .61.85 .49
$ .49 -
. 17 . 13(M (l )
.60 .60
.55 .49
.55 . 681. 28 1. 06.43 . 27. 07 . 13. 13 . 12
(5) -
6. 31 4.44‘ $.11 -
.97 .75
. 33 . 32
. 35 .41,. 14 . 12
See footnotes at end of tableDigitized for FRASER http://fraser.stlouisfed.org/ Federal Reserve Bank of St. Louis
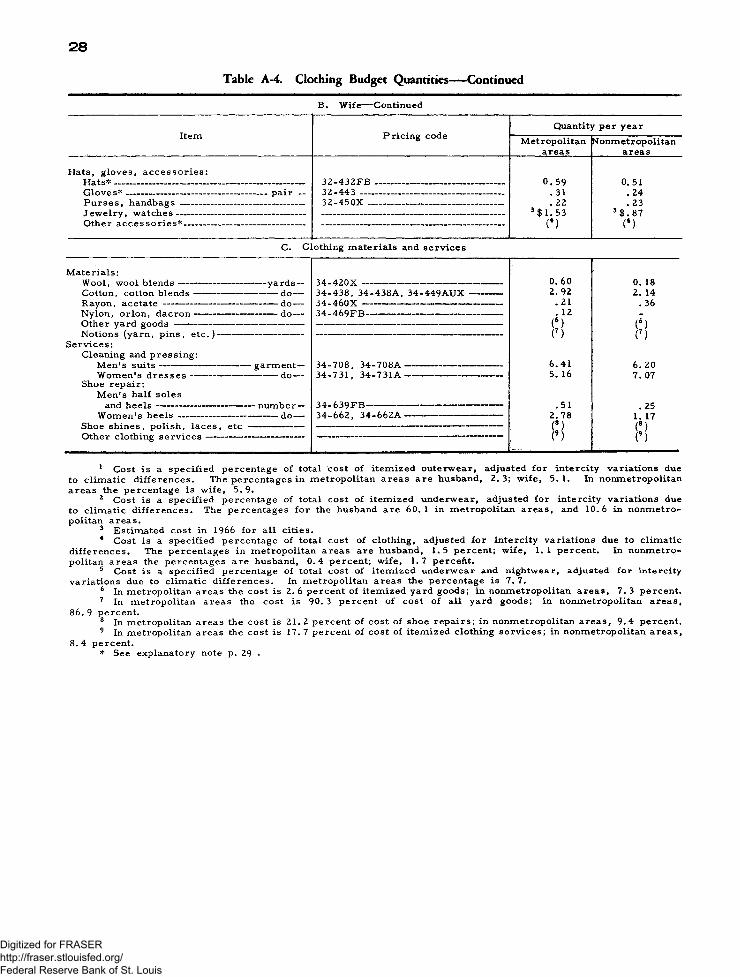
2 8
Table A-4. Clothing Budget Q uantities— ContinuedB. Wife— Continued
Item Pricing codeQuantity per year
Metropolitanareas
Nonmetropolitanareas
Hats, gloves, accessories:
Gloves*----------------------------------------------pair —Purses, handbags -----------------------------------------Jewelry watches
32-432F B ------------------------------------------32-443 -----------------------------------------------32 -450X ......................................................
0 .59 . 31 . 22
3 $ 1. 53 (*)
0.51 . 24 .23
3 $. 87(1 2 3 4 5)Other accessories* _ ___ __ -
C. Clothing materials and services
Materials:Wool, wool blends---------------------Cotton, cotton blends----------------Rayon, acetate --------------------------Nylon, orlon, dacron----------------Other yard goods----------------------Notions (yarn, pins, etc .)--------
Services:Cleaning and pressing:
Men's suits---------------------------Women's dresses-----------------
Shoe repair:Men's half soles
and heels----------------------------Women's heels ---------------------
Shoe shines, polish, laces, etc Other clothing services------------
-yards —-----do —---- do —---- do —
34 -4 2 0 X ---------------------------------34-438, 34-438A, 34-449AUX
34-469FB--------------------------------
garment— --------do —
34-708, 34-708A 34-731, 34-731A
number — -------do—
34-639FB------------34-662, 34-662A
0.60 0. 182.92 2. 14
. 21 .36
. 12(6) (6)C) (7)
6.41 6. 205. 16 7. 07
.51 . 252.78 1. 17(!) (8)(9 ) (9)
1 Cost is a specified percentage of total cost of itemized outerwear, adjusted for intercity variations due to climatic differences. The percentages in metropolitan areas are husband, 2.3 ; wife, 5 .1 . In nonmetropolitan areas the percentage is wife, 5. 9.
2 Cost is a specified percentage of total cost of itemized underwear, adjusted for intercity variations due to climatic differences. The percentages for the husband are 60.1 in metropolitan areas, and 10.6 in nonmetropolitan areas.
3 Estimated cost in 1966 for all cities.4 Cost is a specified percentage of total cost of clothing, adjusted for intercity variations due to climatic
differences. The percentages in metropolitan areas are husband, 1.5 percent; wife, 1.1 percent. In nonmetropolitan areas the percentages are husband, 0 .4 percent; wife, 1.7 percent.
5 Cost is a specified percentage of total cost of itemized underwear and nightwear, adjusted for intercity variations due to climatic differences. In metropolitan areas the percentage is 7 .7 .
6 In metropolitan areas the cost is 2. 6 percent of itemized yard goods; in nonmetropolitan areas, 7. 3 percent.7 In metropolitan areas the cost is 90. 3 percent of cost of all yard goods; in nonmetropolitan areas,
86. 9 percent.8 In metropolitan areas the cost is 21. 2 percent of cost of shoe repairs; in nonmetropolitan areas, 9 .4 percent.9 In metropolitan areas the cost is 17. 7 percent of cost of itemized clothing services; in nonmetropolitan areas,
8 .4 percent.* See explanatory note p. 29 •
Digitized for FRASER http://fraser.stlouisfed.org/ Federal Reserve Bank of St. Louis
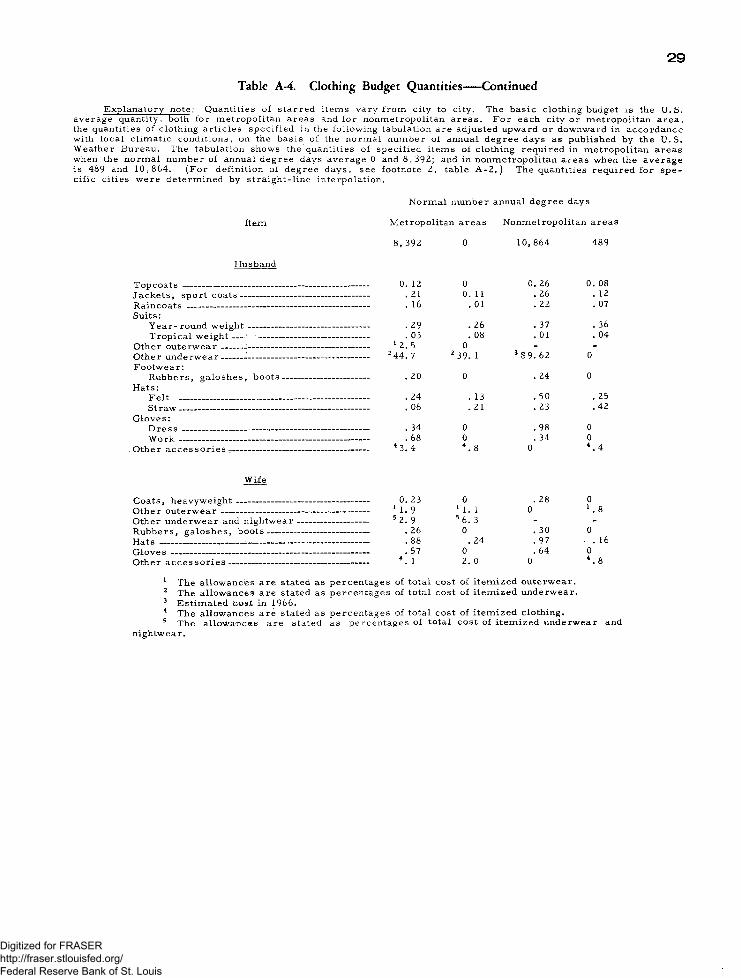
2 9
Explanatory note: Quantities of starred items vary from city to city. The basic clothing budget is the U.S.average quantity, both for metropolitan areas and for nonmetropolitan areas. For each city or metropolitan area, the quantities of clothing articles specified in the following tabulation are adjusted upward or downward in accordance with local climatic conditions, on the basis of the normal number of annual degree days as published by the U.S. Weather Bureau. The tabulation shows the quantities of specified items of clothing required in metropolitan areas when the normal number of annual degree days average 0 and 8,392; and in nonmetropolitan areas when the average is 489 and 10,864. (For definition of degree days, see footnote 2, table A -2 .) The quantities required for specific cities were determined by straight-line interpolation.
Table A-4. Clothing Budget Q uantities-----Continued
Item
Husband
Topcoats---- ------------------ ---------Jackets, sportcoats-------------Raincoats ------------------------------Suits:
Year-round weight ——-----Tropical weight — -----—-
Other outerwear------ j -----------Other underwear------ ■------------Footwear:
Rubbers, galoshes, boots Hats:
Felt _____________________Straw--------------------------------
Gloves:D re ss--------------------------------W ork---------------------------------
Other accessories-— ------------
Wife
Coats, heavyweight------------- -----Other outerwear------------ -----------Other underwear and nightwearRubbers, galoshes, boots---------Hats ------------------- --------~---------------G loves------------------ ---------------------Other accessories---------------------
Normal number annual degree days
Metropolitan areas Nonmetropolitan areas
8,392 0
0 . 12 0.21 0.11.16 .01
.29 .26
.03 .081 2 . 5 0
244.7 2 39. 1
. 20 0
.24 .13
.06 .21
. 34 0
. 68 0* 3.4 4 . 8
0. 23 01.9 1 lo 12. 9 5 6. 3
. 26 0
. 88 . 24
. 57 04. 1 2. 0
10,864 489
0. 26 0. 08. 26 . 12. 22 . 07
. 37 . 36
. 01 . 04
$9. 62 0
. 24 0
. 50 . 25
. 23 .42
.98 0
. 34 00 4.4
. 28 00 1.8
. 30 0
. 97 . 16
. 64 00 4. 8
1 The allowances are stated as percentages of total cost of itemized outerwear.2 The allowances are stated as percentages of total cost of itemized underwear.3 Estimated cost in 1966.4 The allowances are stated as percentages of total cost of itemized clothing.5 The allowances are stated as percentages of total cost of itemized underwear and
nightwear.
Digitized for FRASER http://fraser.stlouisfed.org/ Federal Reserve Bank of St. Louis
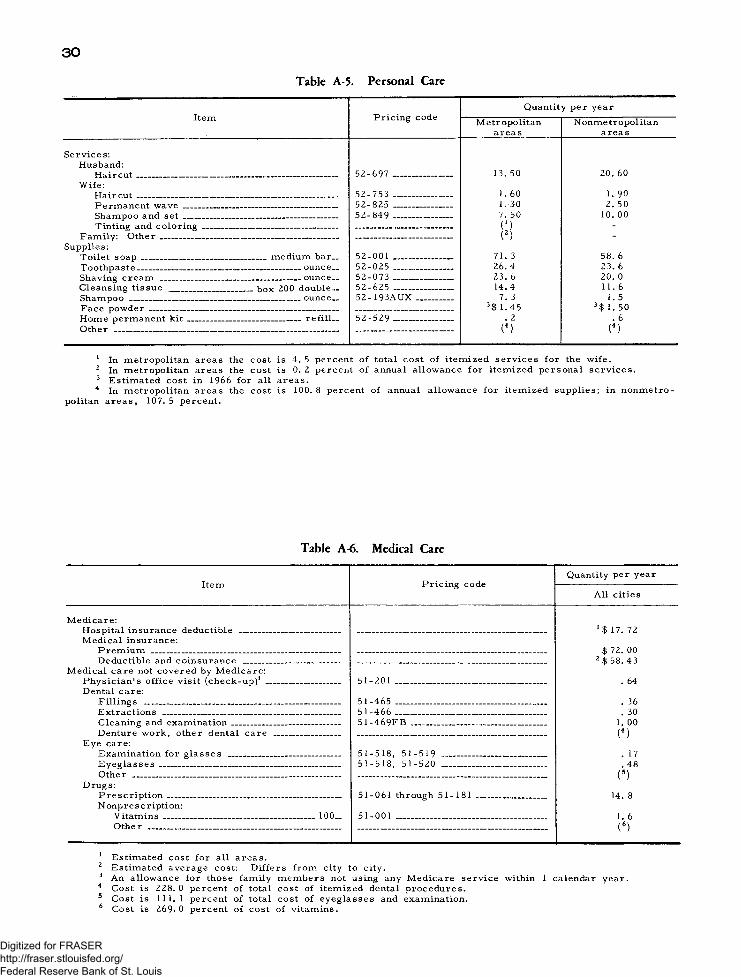
30Table A-5. Personal Care
Pricing codeQuantity per year
Metropolitanareas
Nonmetropolitanareas
Service s: Husband:
Haircut--------------------------------- ______________ 52-697 ____________ 13. 50 20. 60Wife:
Haircut--------------------------------- 52-753 ____________ 1. 60 1. 90Permanent wave______ ____ 52-825 ____________ 1. 30 2. 50Shampoo and s e t____________Tinting and coloring________
Family: Other_________________Supplies:
—52-849 ____________ 7. 50
(M(1 2)
10. 00
Toilet soap_____________________ medium bar__ 52-001 ____________ 71. 3 58. 6Toothpaste--------------------------------- ounce. 52-025 ____________ 26.4 23. 6Shaving cream -------------------------- 52-073 ____________ 23. 6 20. 0Cleansing tissue __ box 200 double — 52-625 ____________ 14.4 11. 6Shampoo _______________________Face powder___________________
52- 193AUX________ 7. 33$ 1.45
1. 53$ 1. 50
Home permanent k it___________ ____________ refill- 52-529 ____________ . 2 . 6Other (4) (4)
1 In metropolitan areas the cost is 4. 5 percent of total cost of itemized services for the wife.2 In metropolitan areas the cost is 0. 2 percent of annual allowance for itemized personal services.3 Estimated cost in 1966 for all areas.4 In metropolitan areas the cost is 100. 8 percent of annual allowance for itemized supplies; in nonmetro
politan areas, 107. 5 percent.
Table A-6. Medical Care
Item Pricing codeQuantity per year
All cities
Medicare:Hospital insnranrp Herlnrtihle *$ 17. 72Medical insurance:
Premium $ 72. 00Derhirtihle anH roinsnranre 2 $ 58. 43
Medical care not covered by Medicare:Physician's office visit (check-up)3 ________________ 51-201 ________________________________ . 64Dental care:
Fillings __________________________________________ 51-465 ________________________________ . 36Extractions ______________________________________ 51-466 __________ ______________________ . 30Cleaning and examination_______________________ 51-469FB _____________________________ 1. 00Denture work, other rlental rare. ........ . _ (4)
Eye care:F.Yamination for glasses 51-518, 51 — 51Q . 17Eyeglasses __ .................... . . .............. 51-518, 51-520 . 48Other (5)
Drugs:Prescription_____________________________________ 51-061 through 51-181 _______________ 14. 8Nonprescription:
Vitamins _ __ 100 51-001 1. 6Other ...... ........... (6)
1 Estimated cost for all areas.2 Estimated average cost: Differs from city to city.3 An allowance for those family members not using any Medicare service within 1 calendar year.4 Cost is 228. 0 percent of total cost of itemized dental procedures.5 Cost is 111. 1 percent of total cost of eyeglasses and examination.6 Cost is 269.0 percent of cost of vitamins.
Digitized for FRASER http://fraser.stlouisfed.org/ Federal Reserve Bank of St. Louis
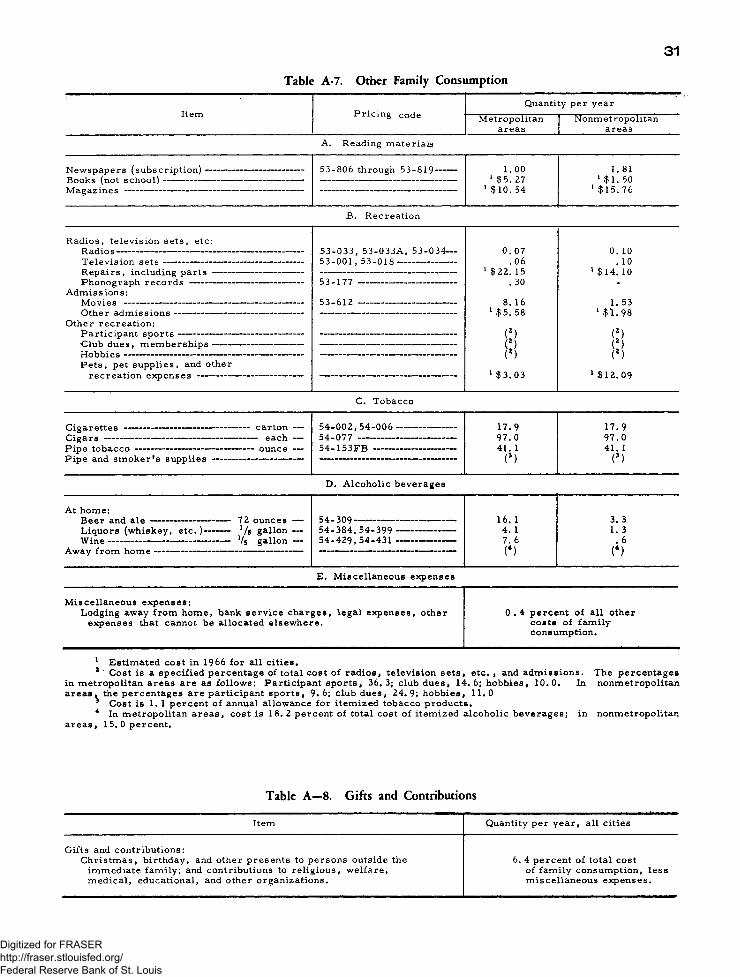
31Table A-7. O ther Family Consum ption
Item Pricing codeQuantity per year
Metropolitanareas
Nonmetropolitanareas
A. Reading materials
Newspapers (subscription)-------------------------------- 53-806 through 53-819------- 1.00 1.81Books (not school)----------------------------------------------Magazines ---------------------------------------------------------- —
1 $5. 27 1 $10. 54
1 $1. 50 1 $15. 76
B. Recreation
Radios, television sets, etc:Radios------------------------------------------------------------- 53-033, 53-033A, 53-034— 0.07 0. 10Television sets ---------------------------------------------- 53 -001 ,53-018------------------- .06 . 10Repairs, including parts ------------------------------ 1 $22. 15 1 $14. 10Phonograph records ------------------------------------- 53-177 -------------------------------- . 30 -
Admissions:53612 - 8. 16
1 $5. 581. 53
1$1.98Other admissions------------------------------------------Other recreation:
(/22 )Participant sports----------------------------------------- — (2)Club dues, memberships-------------- -------------- ( )Hobbi e s ——— —— — ————— — —— — — —— — — (2) (2)Pets, pet supplies, and other
recreation expenses ---------------------------------- — - — — — — — — 1 $3.03 1 $12.09
C. Tobacco
Cigarettes -----------------------------------------Cigars ------------------------------------------------Pipe tobacco --------------------------------------Pipe and sm oker's supplies -------------
carton - each
ounce
54-002,54-006 -------------- — - 17.9 17.954-077 -------------------------------- 97.0 97.054-153FB --------------------------- 41. 1 41. 1
(3) (3)
D. A lcoholic beverages
At home:Beer and a l e ---- ------------Liquors (whiskey, etc. )W in e-------------------------------
Away from h o m e ----------------
72 ounces — Vs gallon — 7s gallon —
54-309------------54-384,54-399 54-429,54-431
16. 1 4. 1 7. 6( 4 )
3. 3 1. 3
. 6(4 )
E. M iscellaneous expenses
M iscellaneous expenses:Lodging away from hom e, bank serv ice charges, legal expenses, other
expenses that cannot be allocated elsewhere.0 .4 percent of all other
costs of fam ily consumption.
1 Estimated cost in 1966 for all cities.2 ' Cost is a specified percentage of total cost of radios, television sets , etc. , and adm issions. The percentages
in metropolitan areas are as follow s: Participant sports, 36.3; club dues, 14.6; hobbies, 10.0. In nonmetropolitan areas, the percentages are participant sports, 9 .6 ; club dues, 24.9; hobbies, 11.0
3 Cost is 1. 1 percent of annual allowance for item ized tobacco products.4 In m etropolitan areas, cost is 18. 2 percent of total cost of item ized alcoholic beverages; in nonmetropolitan
areas, 15.0 percent.
Table A—8. Gifts and ContributionsItem Quantity per year, all cities
Gifts and contributions:Christm as, birthday, and other presents to persons outside the
immediate fam ily; and contributions to relig ious, w elfare, m edical, educational, and other organizations.
6. 4 percent of total costof fam ily consumption, less m iscellaneous expenses.
Digitized for FRASER http://fraser.stlouisfed.org/ Federal Reserve Bank of St. Louis

Digitized for FRASER http://fraser.stlouisfed.org/ Federal Reserve Bank of St. Louis
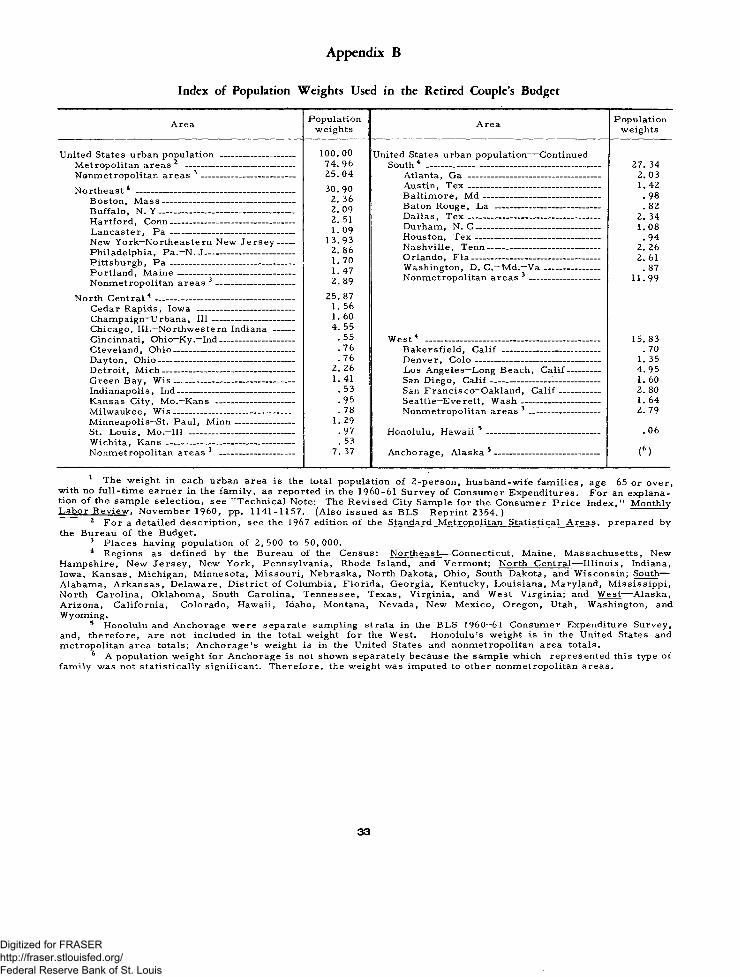
A p p e n d ix B
Index of Population Weights Used in the Retired Couple’s BudgetArea
United States urban population ------------------Metropolitan areas 1 2 -----------------------------Nonmetropolitan areas 3 ------------------------Northeast4 ---------------------------------------------
Boston, M ass-------------------------------------Buffalo, N. Y --------------------------------------Hartford, Conn----------------------------------Lancaster, P a ----------------------------------New York—Northeastern New JerseyPhiladelphia, Pa.—N. J-----------------------Pittsburgh, P a -------------------------------- —Portland, Maine--------------------------------Nonmetropolitan areas 3 -------------------
North Central4 ---------------------------------------Cedar Rapids, Iowa --------------------------Champaign—Urbana, 111---------------------Chicago, 111.—Northwestern Indiana -Cincinnati, Ohio—Ky.~Ind------------------Cleveland, Ohio---------------------------------Dayton, Ohio--------------------------------------Detroit, Mich-------------------------------------Green Bay, W is---------------------------------Indi anap oli s , Ind--------------------------------Kansas City, Mo.—Kans -------------------Milwaukee, W is---------------------------------Minneapolis—St. Paul, Minn-------------St. Louis, Mo.—Ill ----------------------------Wichita, Kans------------------------------------Nonmetropolitan areas 3 ------------------
Populationweights Area Population
weights
100.00 United States urban population— Continued74. 96 South 4 ---------------------------- ---------------------------- 27. 3425. 04 Atlanta, Ga ------------------------------------------- 2. 0330 90 Austin, T ex ------------------------------------------- 1.42
2 36 Baltimore, M d -------------------------------------- .982. 09 Baton Rouge, La ---------------------------------- . 822 51 Dallas, T ex ------------------------------------------- 2. 341 09 Durham, N. C ---------------------------------------- 1.08
13.93 Houston, T ex ----------------------------------------- .942. 86 Nashville, Tenn------------------------------------- 2. 261. 70 Orlando, Fla------------------------------------------ 2. 611. 47 Washington, D. C.— Md.—V a ------------------ . 872. 89 Nonmetropolitan areas 3 ----------------------- 11.99
25. 871. 561.604. 55
. 55 W est4 --------------------------------------------------------- 15. 83
.76 Bakersfield, Calif -------------------------------- . 70
. 76 Denver, Colo----------------------------------------- 1. 352. 26 Los Angeles—Long Beach, Calif----------- 4. 951. 41 San Diego, Calif------------------------------------ 1. 60
. 53 San Francisco—Oakland, Calif------------- 2. 80
.95 Seattle—Everett, Wash-------------------------- 1. 64
. 78 Nonmetropolitan areas 3 ----------------------- 2.791. 29
.97 Honolulu, Hawaii 5 ------------------------------------- .06
. 537. 37 Anchorage, Alaska 5---------------------------------- (6)
1 The weight in each urban area is the total population of 2-person, husband-wife families, age 65 or over,with no full-time earner in the family, as reported in the 1960-61 Survey of Consumer Expenditures. For an explanation of the sample selection, see "Technical Note: The Revised City Sample for the Consumer Price Index," MonthlyLabor Review, November I960, pp. 1141-1157. (Also issued as BLS Reprint 2354.)
2 For a detailed description, see the 1967 edition of the Standard Metropolitan Statistical Areas, prepared by the Bureau of the Budget.
3 Places having population of 2, 500 to 50, 000.4 Regions as defined by the Bureau of the Census: Northeast-—Connecticut, Maine, Massachusetts, New
Hampshire, New Jersey, New York, Pennsylvania, Rhode Island, and Vermont; North Central— Illinois, Indiana, Iowa, Kansas, Michigan, Minnesota, Missouri, Nfebraska, North Dakota, Ohio, South Dakota, and Wisconsin; South— Alabama, Arkansas, Delaware, District of Columbia, Florida, Georgia, Kentucky, Louisiana, Maryland, Mississippi, North Carolina, Oklahoma, South Carolina, Tennessee, Texas, Virginia, and West Virginia; and West— Alaska, Arizona, California, Colorado, Hawaii, Idaho, Montana, Nevada, New Mexico, Oregon, Utah, Washington, and Wyoming.
5 Honolulu and Anchorage were separate sampling strata in the BLS 1960—61 Consumer Expenditure Survey, and, therefore, are not included in the total weight for the West. Honolulu’s weight is in the United States and metropolitan area totals; Anchorage's weight is in the United States and nonmetropolitan area totals.
6 A population weight for Anchorage is not shown separately because the sample which represented this type of family was not statistically significant. Therefore, the weight was imputed to other nonmetropolitan areas.
3 3
Digitized for FRASER http://fraser.stlouisfed.org/ Federal Reserve Bank of St. Louis

Digitized for FRASER http://fraser.stlouisfed.org/ Federal Reserve Bank of St. Louis
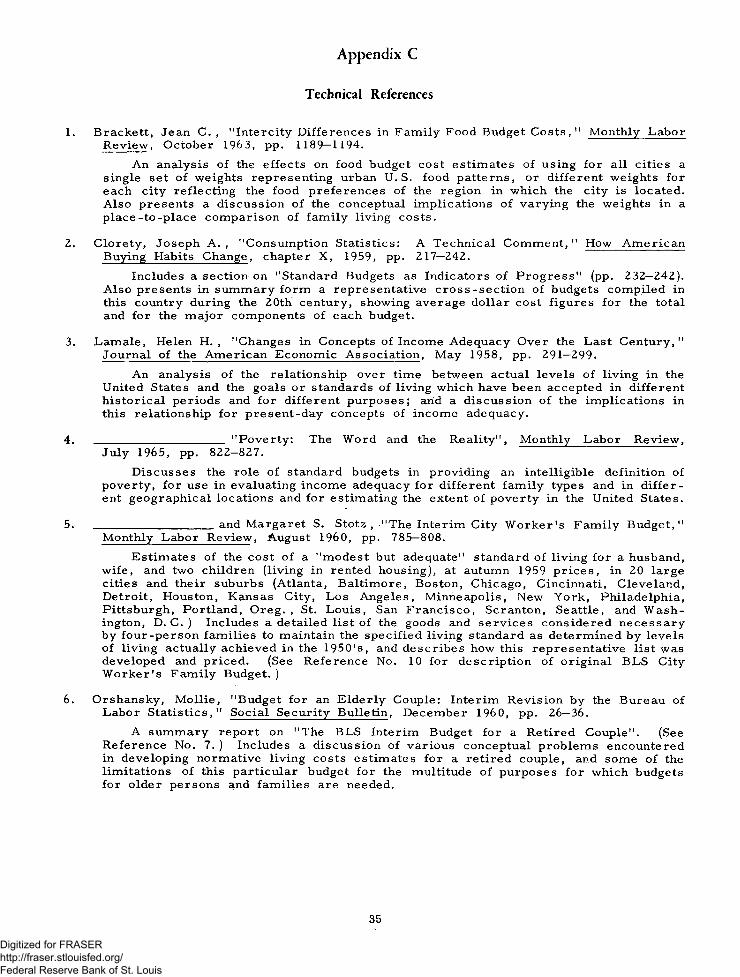
Appendix CTechnical References
1. Brackett, Jean C. , "Intercity Differences in Family Food Budget C o sts ," Monthly LaborReview, October 1963, pp. 1189—1194.
An analysis of the effects on food budget cost estimates of using for all cities a single set of weights representing urban U. S. food patterns, or different weights for each city reflecting the food preferences of the region in which the city is located. Also presents a discussion of the conceptual implications of varying the weights in a place-to-place comparison of family living costs.
2. Clorety, Joseph A ., "Consumption Statistics: A Technical Com m ent," How AmericanBuying Habits Change, chapter X , 1959, pp. 217—242.
Includes a section on "Standard Budgets as Indicators of Progress" (pp. 232—242). Also presents in summary form a representative cross-section of budgets compiled in this country during the 20th century, showing average dollar cost figures for the total and for the major components of each budget.
3. Lamale, Helen H. , "Changes in Concepts of Income Adequacy Over the Last Century,"Journal of the American Economic Association, May 1958, pp. 291—299.
An analysis of the relationship over time between actual levels of living in the United States and the goals or standards of living which have been accepted in different historical periods and for different purposes; arid a discussion of the implications in this relationship for present-day concepts of income adequacy.
4. _______________________ "Poverty: The Word and the Reality", Monthly Labor Review,July 1965, pp. 822-827.
Discusses the role of standard budgets in providing an intelligible definition of poverty, for use in evaluating income adequacy for different family types and in different geographical locations and for estimating the extent of poverty in the United States.
5. _____________________ and Margaret S. Stotz , "The Interim City Worker's Family Budget,"Monthly Labor Review, August I960, pp. 785—808.
Estimates of the cost of a "modest but adequate" standard of living for a husband, wife, and two children (living in rented housing), at autumn 1959 prices, in 20 large cities and their suburbs (Atlanta, Baltimore, Boston, Chicago, Cincinnati, Cleveland, Detroit, Houston, Kansas City, Los Angeles, Minneapolis, New York, Philadelphia, Pittsburgh, Portland, Oreg. , St. Louis, San Francisco, Scranton, Seattle, and Washington, D. C. ) Includes a detailed list of the goods and services considered necessary by four-person families to maintain the specified living standard as determined by levels of living actually achieved in the 1950’s, and describes how this representative list was developed and priced. (See Reference No. 10 for description of original BLS City Worker’s Family Budget.)
6 . Orshansky, Mollie, "Budget for an Elderly Couple: Interim Revision by the Bureau ofLabor Statistics," Social Security Bulletin, December I960, pp. 26—36.
A summary report on "The BLS Interim Budget for a Retired Couple". (See Reference No. 7. ) Includes a discussion of various conceptual problems encountered in developing normative living costs estimates for a retired couple, and some of the limitations of this particular budget for the multitude of purposes for which budgets for older persons and families are needed.
35
Digitized for FRASER http://fraser.stlouisfed.org/ Federal Reserve Bank of St. Louis

7. Stotz, Margaret S. , "The BLS Interim Budget for a Retired Couple,” Monthly LaborReview, November I960, pp. 1141—1157.
Estimates of the cost of a ’’modest but adequate” standard of living for a man age 65 or over and his wife (living in rented housing), at autumn 1959 prices, in 20 large cities and their suburbs (cities are the same as those listed in Reference No. 5). Includes a detailed list of the goods and services considered necessary for retired couples to maintain the specified living standard as determined by levels of living actually achieved in the 1950's; and describes how this representative list was developed and priced. (See Reference No. 11 for description of original Budget for an Elderly Couple. )
8. U. S. Department of Labor, Bureau of Labor Statistics, "Estimating Equivalent Incomes orBudget Costs by Family Type,” Monthly Labor Review, November I960, pp. 1197—1200.
Describes a scale for measuring the relative after-tax income required by families of differing composition to maintain the same level of material well-being, or for estimating comparable costs of goods and services for families of different age, size, and type. (Scale values cannot be used to estimate relative costs of components of family budgets— food, housing, taxes, insurance, etc.)
9 # Report of the Advisory Committee on Standard Budget Research,June 1963, 26 pp.
Members of the BLS Advisory Committee on Standard Budget Research:Professor Gwen Bymers, Department of Household Economics and Management,
Cornell University; Ithaca, N. Y.Dorothy M. Durand, Private consultant on the development and use of standard
budgets; Scarsdale, N. Y.Gertrude Lotwin, Home Economics Consultant, State of New Jersey Division of
Welfare; Trenton, N. J.Charles A. Pearce, Director, Division of Research and Statistics, Department
of Labor, State of New York; New York, N. Y.Lazare Teper, Director, Research Department, International Ladies' Garment
Workers' Union, AFL-CIO; New York, N. Y.Gertrude S. W eiss, Chairman, Consultant; Washington, D. C.C. Ashley Wright, Economist, Standard Oil Company (N.J. ) ; New York, N. Y.
Contains recommendations of this committee of experts on the needs for various types of budgets, general concepts of the standards of living to be described by the budgets, and technical and other problems associated with estimating and publishing budget costs. Includes a selected bibliography on the major uses of standard budgets.
10. _________________ ____________ Workers' Budgets in the United States: City Families and SinglePersons, 1946 and 1947, (BLS Bulletin 927, 1948) 55 pp.
Describes concepts, definitions, and techniques used in developing the original City Worker's Family Budget for a four-person family, detailed list of goods and services priced, and 1946—47 cost estimates for 34 cities. Also contains an historical survey of family budgets, and summary data on State budgets for single women workers.
11. U.S. Department of Health, Education, and Welfare, Social Security Administration,"A Budget for an Elderly Couple,” Social Security Bulletin, February 1948, pp. 4—12.
Contains estimates of the cost of a "modest but adequate” standard of living for a couple age 65 or older, at March 1946 and June 1947 prices, in eight large cities. (Concepts and techniques used to compile this budget were the same as those employed in developing the original BLS City Worker's Budget. See Reference No. 10.)
36
Digitized for FRASER http://fraser.stlouisfed.org/ Federal Reserve Bank of St. Louis


![H20youryou[2] · 2020. 9. 1. · 65 pdf pdf xml xsd jpgis pdf ( ) pdf ( ) txt pdf jmp2.0 pdf xml xsd jpgis pdf ( ) pdf pdf ( ) pdf ( ) txt pdf pdf jmp2.0 jmp2.0 pdf xml xsd](https://img.pdfslide.net/doc/110x75/60af39aebf2201127e590ef7/h20youryou2-2020-9-1-65-pdf-pdf-xml-xsd-jpgis-pdf-pdf-txt-pdf-jmp20.jpg)


