Embed Size (px)
Citation preview
ka.3; I Z H Z
Annual Earnings and Employment Patterns of Private Nonagricultural Employees, 1970U.S. Department of Labor Bureau of Labor Statistics 1975
Bulletin 1842
COLLECriOffl
lytob ^ ‘MQjftLonQgQLQfl.gomery Co,Public LibraryPublic LibraryDigitized for FRASER
http://fraser.stlouisfed.org/ Federal Reserve Bank of St. Louis
Annual Earnings and Employment Patterns of Private Nonagricultural Employees, 1970U.S. Department of Labor John T. Dunlop, SecretaryBureau of Labor Statistics Julius Shiskin, Commissioner 1975
Bulletin 1842
For sale by the Superintendent of Documents, U.S. Government Printing Office, Washington, D.C. 20402, GPO Bookstores, or BLS Regional Offices listed on inside back cover. Price $1.65
Make checks payable to Superintendent of Documents Stock Number 029-001-01395-7
Catalog Number L 2.3:1842Digitized for FRASER http://fraser.stlouisfed.org/ Federal Reserve Bank of St. Louis

Digitized for FRASER http://fraser.stlouisfed.org/ Federal Reserve Bank of St. Louis
Preface
This bulletin presents statistics on annual earnings and employment in the United States in 1970. The Bureau of Labor Statistics developed the data from a 1-percent random sample of the records of the Social Security Administration and the Railroad Retirement Board. The data provide a more accurate picture of annual earnings and employment patterns by industry than is available from any other source.
Previous BLS bulletins covering annual earnings and employment patterns were for the years 1964, 1965, and the 2-year period 1966-67. The Bureau has accelerated publication of the 1970 data to shorten the time lag between the reference year and date of publication, and to take advantage of speeded-up delivery of data by the Social Security Administration. The BLS also is storing 1968-69 data on tapes to be available for future processing and time series analysis.
This bulletin was prepared in the Bureau’s Division of General Compensation Structures by Franz A. Groemping, under the general direction of Alvin Bauman. Melvin D. Eggleston contributed the section on the Gini Index.
m
Digitized for FRASER http://fraser.stlouisfed.org/ Federal Reserve Bank of St. Louis

Digitized for FRASER http://fraser.stlouisfed.org/ Federal Reserve Bank of St. Louis
ContentsPage
Introduction.......................................................................................................................................................................... 1Annual earnings and employment p a tte rn s ....................................................................................................................... 3Technical note ................................................................................................................................................................... 14
Tables:
1. Median annual earnings of four-quarter workers, ranked by major industry division, 1970 .......................... 32. Percent changes in median earnings by major industry divisions, 1967-70 ................................................... 33. Black-white ratios of median annual earnings of four-quarter workers in their industry of
major earnings, 1970 44. Female-male earnings ratio of four-quarter workers, by race, 1970 .................................................................. 45. Cumulative distribution of earners and earnings at estimated mean levels, 1970 .............................................. 56. Gini indexes ............................................................................................ 87. Gini ratio variations for selected industries, 1970 ............................................................................................... 108. Workers having major proportion of earnings in each industry division and percent
change, 1967 and 1970 119. Changes in the number of workers employed in their industry of major earnings in selected
manufacturing industries, 1967-70 .................................................................................................................... 1110. Employment of women workers by industry division of major earnings, 1970 .............................................. 1111. Employment of black workers by industry division Of major earnings, 1970 ................................................... 1212. Percent distributions of workers by sex and race among the major industry divisions, 1970 ........................ 1213. Percent changes in employment of workers by race and sex, and industry divisions of
major earnings, 1967-70 ...................................................................................................................................... 1314. Percent distribution of employment of four-quarter workers by major region, 1967-70 ................................. 1315. Hypothetical worker’s employment and earnings by industry and quarters worked ...................................... 1516. Rough approximation of sampling variability of estimated number of persons ........................................... 1717. Rough, approximation to sampling variability of estimated percentages ........................................... 17
Charts: Lorenz Curves—
1. Earnings from major industry of employment for workers with earnings in any quarterof the year ............................................................................................................................................................... 6
2. Earnings from major industry of employment for workers with earnings in 4 quartersof the year ............................................................................................................................................................... 7
Detailed tables:
Earnings and employment patterns in 2-digit industry divisions
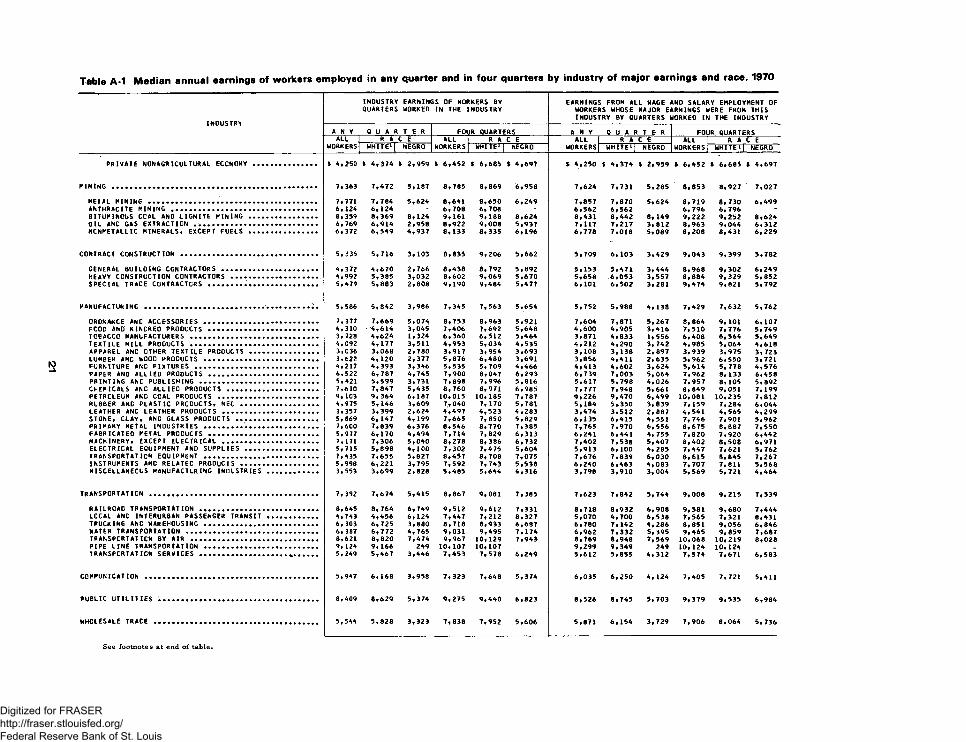
A-l. Median annual earnings of workers employed in any quarter and in four quarters by industryof major earnings and race, 1970 ................................................................................................................ 21
A-2. Average annual earnings of workers employed in any quarter and in four quarters by industryof major earnings and race, 1970 ................................................................................................................ 23
Digitized for FRASER http://fraser.stlouisfed.org/ Federal Reserve Bank of St. Louis
Contents—Continued
Page
Detailed tables— Continued
A-3. Median annual earnings from all wage and salary employment of workers employed in anyquarter and in four quarters by industry and region of major earnings, 1970 . ................................... 25
A-4. Average annual earnings from all wage and salary employment of workers employed in anyquarter and in four quarters by industry and region of major earnings, 1970 ........................................ 27
A-5. Distribution of workers by annual earnings from all wage and salary employment byindustry of major earnings, 1970 .............................................................................................................. 29
A-6. Distribution of workers by annual earnings in the industry of major earnings, 1970 ............................... 31A-7. Distribution of workers with four quarters of earnings in all wage and salary employment by
annual earnings in all wage and salary employment and by industry of major earnings, 1970 ............. 33A-8. Distribution of workers with four quarters of earnings in all wage and salary employment by
annual earnings in industry of major earnings, 1970 ................................................................................. 35A-9. Industry employment, 1970 .......................... ' ............................................................................................... 37A-10. Industry employment by race and sex, 1970 ............................................................................................... 39A-l 1. Quarters of work, 1970 ................................... . ............................................................................................ 41A-12. Workers employed in any quarter and in four quarters by race, sex, and industry
of major earnings, 1970 ................................... . ................................................................. . . . . . ............. 43A-13. Single and multi-industry employment of all workers by number of four quarters, major industry
employers, 1970 ............................................................................................................................................. 45A-14. Regional distribution of workers employed in any quarter and in four quarters by industry,
of major earnings, 1970 ......................................................................................................... ..................... 47
Earnings and employment patterns in 3-digit industry divisions
B-l. Median annual earnings of workers employed in any quarter and in four quarters byindustry of major earnings and race, 1970................................................................................................... 51
B-2. Average annual earnings of workers employed in any quarter and in four quarters byindustry of major earnings and race, 1970................................................................................................... 54
B-3. Median annual earnings from all wage and salary#employment of workers employed inany quarter and in four quarters by industry and region of major earnings, 1970 ................................. 57
B-4. Average annual earnings from all wage and salary employment of workers employed in anyquarter and in four quarters by industry and region of major earnings, 1970 ........................................ 60
B-5. Distribution of workers by annual earnings from all wage and salary employmentby industry of major earnings, 1970 ............................................................................................................ 63
B-6. Distribution of workers by annual earnings in industry of major earnings, 1970 ...................................... 66B-7. Distribution of workers with four quarters of earnings in all wage and salary employment by
annual earnings in all wage and salary employment and by industry of major earnings, 1970 ............. 69B-8. Distribution of workers with four quarters of earnings in all wage and salary employment
by annual earnings in industry of major earnings, 1970 ........................................................................... 72B-9. Industry employment, 1970 ............... •.......................................................................................................... 75B-10. Industry employment by race and sex, 1970 .............................................................................................. 78B-l 1. Quarters of work, 1970 .................................................................................................................................. 81B-l2. Workers employed in any quarter and in four quarters by race, sex, and industry of
major earnings, 1970 .................................................................................................................................... 84B-l3. Single and multi-industry employment of all workers by number of major industry employers, 1970 . . 87 B-l4. Regional distribution of workers employed in any quarter and in four quarters by
industry of major earnings, 1970 ..................................................................................................... .......... 90
Digitized for FRASER http://fraser.stlouisfed.org/ Federal Reserve Bank of St. Louis
In troduction
The Bureau initiated its program of annual earnings and employment data collection in the 1960’s to fill the gap in knowledge of annual wage and salary earnings from private nonagricultural employment. Hourly and weekly earnings data reported in fither studies1 cannot be converted to annual earnings estimates with any degree of precision because annual earnings are determined by the interaction of variables such as straight- time rates of pay, number of hours worked, and hours worked at premium rates. These, in turn, depend on other variables such as occupation, union status, industry, and area. Moreover, some* workers move into and out of the labor force during the year. In addition, a substantial portion work for more than one employer in the same industry or for one or more employers in different industries.
The first study in this series covered 1964,2 and was limited to wage and salary earnings subject to social security taxation only. The second study3 covered 1965 and the third,4 1966 and 1967. These last two studies included data on wage and salary earnings defined under either the Social Security Act or the Railroad Retirement Act.
The 1970 study has the same scope as the 1965 and 1966-67 studies, and contains the most recent data available.
The major statistical data in this bulletin have been divided into two sections. Tables A-l to A-14 provide information for all private nonagricultural industries and each major (2-digit) industry group (as defined in the Standard Industrial Classification Manual). Instead of being treated in their usual combined form, transportation, communication, and public utilities are handled as separate divisions, as are wholesale and retail trade. Data have been tabulated by quarter years of employment, as well as by industry, race, sex, and region.
Separate data also show earnings in the worker’s industry of greatest earnings combined with his earnings in other employment. Tables B-l to B-14 provide data for selected 3-digit industry groups, and for purposes of ready reference, also provide totals for each division and for all private nonagricultural industries as a whole. Workers are counted in each industry in which they had any ‘earnings. Consequently, employment data for 3-digit industries do not add to the total for individual 2-digit industry groups, and data at the 2- digit level do not add to the total at the division level. Nevertheless, data for all major earners at any level of industry classification (e.g. division) do, except for rounding, add to the total for the private nonagricultural economy.
The data are unique because, unlike annual earnings data from other sources, they permit an analysis of the distribution of wage and salary earnings and employment patterns of workers by industry and quarters of employment. If an inter-departmental effort to obtain data on the occupational group of individual workers in the social security sample is successful, data in this series will take on an added dimension and be even more useful. Attention is directed to explanations and definition of differences in these methods given in the technical notes.
For a description of the relationship of this series to other annual earnings and employment studies, see page 18).
Annual Earnings and Employment Patterns, Private Nonagricultural Employment, 1964 (BLS Report 330, 1969).
3 Annual Earnings and Employment Patterns o f Private Nonagricultural Employees, 1965 (BLS Bulletin 1675, 1970).
4 Annual Earnings and Employment Patterns o f Private Nonagricultural Employees, 1966-1967 (BLS Bulletin 1765, 1973).
Digitized for FRASER http://fraser.stlouisfed.org/ Federal Reserve Bank of St. Louis

Digitized for FRASER http://fraser.stlouisfed.org/ Federal Reserve Bank of St. Louis
Annual Earnings and Em ploym ent P atte rn s
Earnings
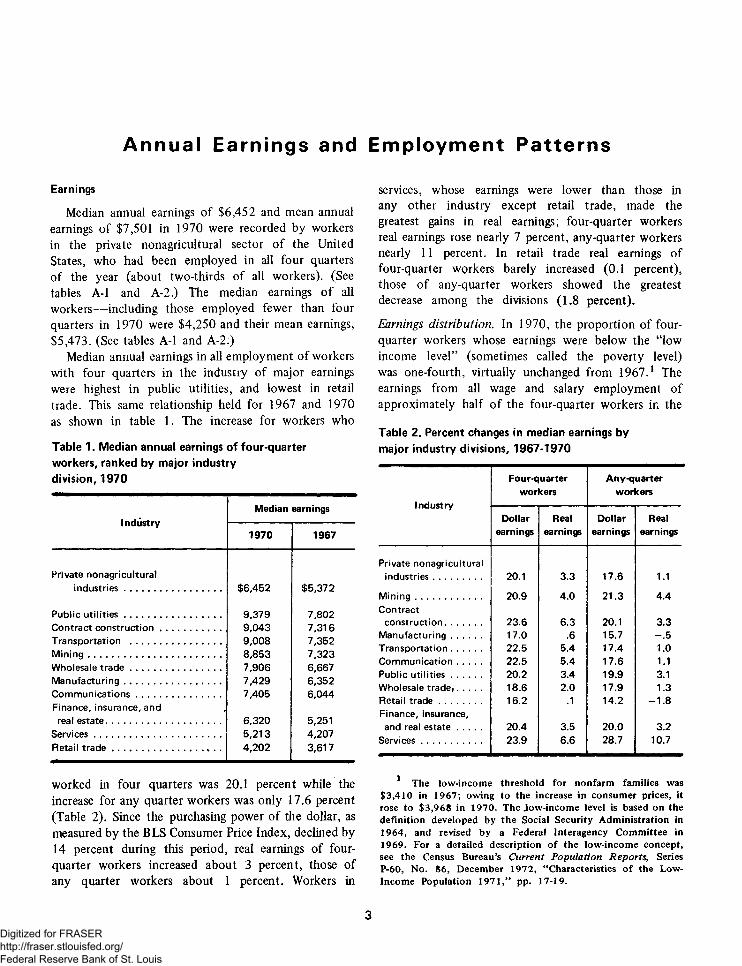
Median annual earnings of $6,452 and mean annual earnings of $7,501 in 1970 were recorded by workers in the private nonagricultural sector of the United States, who had been employed in all four quarters of the year (about two-thirds of all workers). (See tables A-l and A-2.) The median earnings of all workers— including those employed fewer than four quarters in 1970 were $4,250 and their mean earnings, $5,473. (See tables A-l and A-2.)
Median annual earnings in all employment of workers with four quarters in the industry of major earnings were highest in public utilities, and lowest in retail trade. This same relationship held for 1967 and 1970 as shown in table 1. The increase for workers who
Table 1. Median annual earnings of four-quarter workers, ranked by major industry division, 1970
IndustryMedian earnings
1970 1967
Private nonagriculturalindustries...................................... $6,452 $5,372
Public u tilities ...................................... 9,379 7,802Contract construction........................ 9,043 7,316Transportation .................................... 9,008 7,352M ining.................................................... 8,853 7,323Wholesale tra d e .................................... 7,906 6,667Manufacturing...................................... 7,429 6,352Communications................................. 7,405 6,044Finance, insurance, and
real estate............................................. 6,320 5,251Services.................................................. 5,213 4,207Retail tra d e ........................................... 4,202 3,617
worked in four quarters was 20.1 percent while the increase for any quarter workers was only 17.6 percent (Table 2). Since the purchasing power of the dollar, as measured by the BLS Consumer Price Index, declined by 14 percent during this period, real earnings of four- quarter workers increased about 3 percent, those of any quarter workers about 1 percent. Workers in
services, whose earnings were lower than those in any other industry except retail trade, made the greatest gains in real earnings; four-quarter workers real earnings rose nearly 7 percent, any-quarter workers nearly 11 percent. In retail trade real earnings of four-quarter workers barely increased (0.1 percent), those of any-quarter workers showed the greatest decrease among the divisions (1.8 percent).
Earnings distribution. In 1970, the proportion of four- quarter workers whose earnings were below the “low income level” (sometimes called the poverty level) was one-fourth, virtually unchanged from 1967.1 The earnings from all wage and salary employment of approximately half of the four-quarter workers in the
Table 2. Percent changes in median earnings by major industry divisions, 1967-1970
Industry
Four-quarterworkers
Any-quarterworkers
Dollarearnings
Realearnings
Dollarearnings
Realearnings
Private nonagricultural industries................... 20.1 3.3 17.6 1.1
M ining.......................... 20.9 4.0 21.3 4.4Contract
construction.............. 23.6 6.3 20.1 3.3Manufacturing............ 17.0 .6 15.7 - . 5Transportation............ 22.5 5.4 17.4 1.0Communication.......... 22.5 5.4 17.6 1.1Public u tilities ............ 20.2 3.4 19.9 3.1Wholesale trade,.......... 18.6 2.0 17.9 1.3Retail tra d e ................. 16.2 .1 14.2 -1 .8Finance, insurance, and real estate .......... 20.4 3.5 20.0 3.2
Services........................ 23.9 6.6 28.7 10.7
The low-income threshold for nonfarm families was $3,410 in 1967; owing to the increase in consumer prices, it rose to $3,968 in 1970. The Jow-income level is based on the definition developed by the Social Security Administration in 1964, and revised by a Federal Interagency Committee in 1969. For a detailed description of the low-income concept, see the Census Bureau’s Current Population Reports, Series P-60, No. 86, December 1972, “Characteristics of the Low- Income Population 1971,” pp. 17-19.
Digitized for FRASER http://fraser.stlouisfed.org/ Federal Reserve Bank of St. Louis
industry division having the lowest earnings level, retail trade, were at the poverty level in 1970, while only 5 percent of public utility workers, the division having the highest earnings, had earnings at or below that level. (See table A-7.)
The proportions of workers at selected levels of earnings in 1967 and 1970 and percentage point changes were:
Level o f earnings 1967
Under $3 ,600.......................... 28.3$3,600 and under
$ 7 ,2 0 0 ............................... 40.5$7,200 and over..................... 31.2
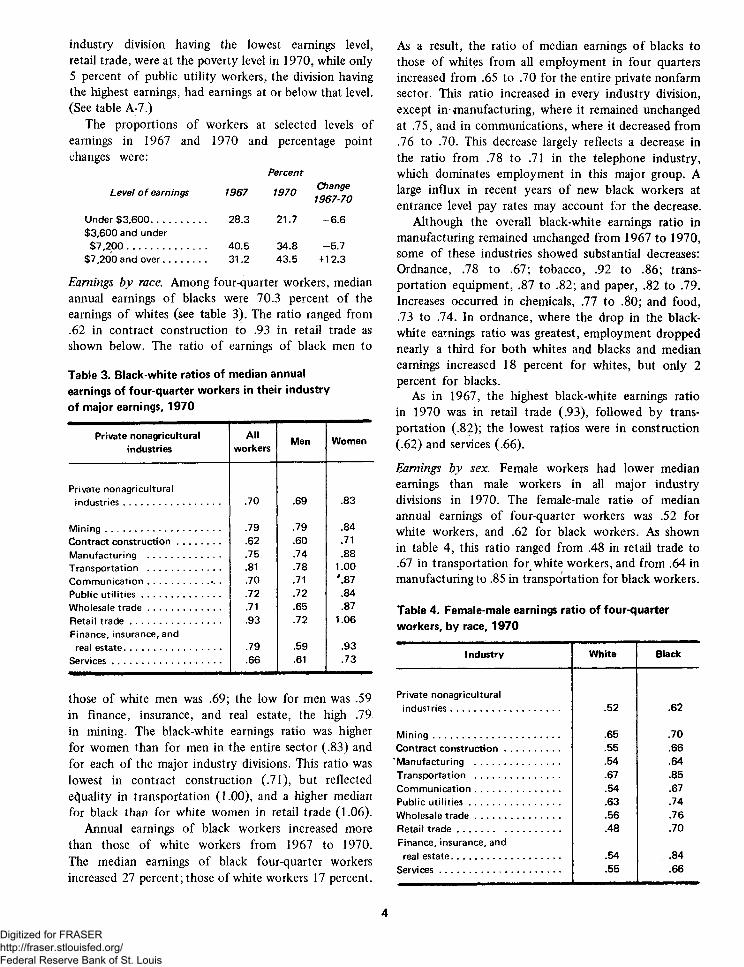
Earnings by race. Among four-quarter workers, median annual earnings of blacks were 70.3 percent of the earnings of whites (see table 3). The ratio ranged from .62 in contract construction to .93 in retail trade as shown below. The ratio of earnings of black men to
Table 3. Black-white ratios of median annual earnings of four-quarter workers in their industry of major earnings, 1970
Private nonagricultural industries
Allworkers
Men Women
Private nonagricultural industries...................................... .70 .69 .83
M ining............................................. .79 .79 .84Contract construction................. .62 .60 .71Manufacturing ............................. .75 .74 .88Transportation ............................. .81 .78 1.00Communication......................... .70 .71 *.87Public u tilities ............................... .72 .72 .84Wholesale tra d e ............................. .71 .65 .87Retail t ra d e .................................... .93 .72 1.06Finance, insurance, and
real estate...................................... .79 .59 .93Services........................................... .66 .61 .73
Percent
1970
21.7
Change1967-70
- 6.6
34.843.5
-5 .7+12.3
those of white men was .69; the low for men was .59 in finance, insurance, and real estate, the high .79 in mining. The black-white earnings ratio was higher for women than for men in the entire sector (.83) and for each of the major industry divisions. This ratio was lowest in contract construction (.71), but reflected equality in transportation (1.00), and a higher median for black than for white women in retail trade (1.06).
Annual earnings of black workers increased more than those of white workers from 1967 to 1970. The median earnings of black four-quarter workers increased 27 percent; those of white workers 17 percent.
As a result, the ratio of median earnings of blacks to those of whites from all employment in four quarters increased from .65 to .70 for the entire private nonfarm sector. This ratio increased in every industry division, except in-manufacturing, where it remained unchanged at .75, and in communications, where it decreased from .76 to .70. This decrease largely reflects a decrease in the ratio from .78 to .71 in the telephone industry, which dominates employment in this major group. A large influx in recent years of new black workers at entrance level pay rates may account for the decrease.
Although the overall black-white earnings ratio in manufacturing remained unchanged from 1967 to 1970, some of these industries showed substantial decreases: Ordnance, .78 to .67; tobacco, .92 to .86; transportation equipment, .87 to .82; and paper, .82 to .79. Increases occurred in chemicals, .77 to .80; and food, .73 to .74. In ordnance, where the drop in the black- white earnings ratio was greatest, employment dropped nearly a third for both whites and blacks and median earnings increased 18 percent for whites, but only 2 percent for blacks.
As in 1967, the highest black-white earnings ratio in 1970 was in retail trade (.93), followed by transportation (.82); the lowest ratios were in construction (.62) and services (.66).
Earnings by sex. Female workers had lower median earnings than male workers in all major industry divisions in 1970. The female-male rati© of median annual earnings of four-quarter workers was .52 for white workers, and .62 for black workers. As shown in table 4, this ratio ranged from .48 in retail trade to .67 in transportation for white workers, and from .64 in manufacturing to .85 in transportation for black workers.
Table 4. Female-male earnings ratio of four-quarter workers, by race, 1970
Industry White Black
Private nonagricultural industries........................................... .52 .62
M ining.................................................. .65 .70Contract construction...................... .55 .66Manufacturing ................................. .54 .64Transportation ................................. .67 .85Communication................................. .54 .67Public u tilities .................................... .63 .74Wholesale tra d e ................................. .56 .76Retail t ra d e ......................................... .48 .70Finance, insurance, and
real estate........................................... .54 . .84Services............................................... .55 .66
Digitized for FRASER http://fraser.stlouisfed.org/ Federal Reserve Bank of St. Louis
Median annual earnings in industries that employed a high percent of women were lower than in industries employing mostly men. The four industry divisions (services; retail trade; finance, insurance and real estate; and communications) with the highest percentages of women employees (49 to 61) had the lowest annual earnings. Conversely, in manufacturing, where women constituted only 32 percent of the workers, earnings were higher than in the private sector as a whole. Among major manufacturing industries, as shown in the following tabulation, the two with the highest percentages of women (apparel and textiles) had earnings much below the industry division level, while two others (electrical equipment and food) had earnings close to the division level.
Women as a percent o f all
workers
Median annual earnings o f all four-quarter
workers
All manufacturing. . 32 $7,345A ppare l.......................... 80 3,917Textiles............................Electrical
49 4,953
equipm ent................... 41 7,302Food ............................ 31 7,406
Earnings by region. Median earnings of four-quarter workers in 1970 in the major regions of the United States and their ratios to the overall median in 1970 and in 1967 were:
_ Percent o f U.S,Earnings earnings—
1970 1970 1967
United States.......... $6,452 100.0 100.0Northeast........................ 6,805 105.5 105.9South............................... 5,436 84.3 82.9North Central .............. 7,061 109.4 112.3West ............................... 6,867 106.4 112.2
The earnings rank order of the regions waschanged from 1967, but the difference among the regions decreased slightly.
Median annual earnings increased proportionately more in the South than in any other region from 1967 to 1970, although the dollar gains were smaller thaq in any other region except the West:
Dollar Percentincrease increase
United S tates..................... $1,080 20.1Northeast.......................... ___ 1,115 19.6South................................. ____ 984 22.1North Central................... 1,029 17.1West ................................. 841 14.0
The South led in percent gains in these industry divisions: Manufacturing, transportation, public utilities, wholesale and retail trade, and services.
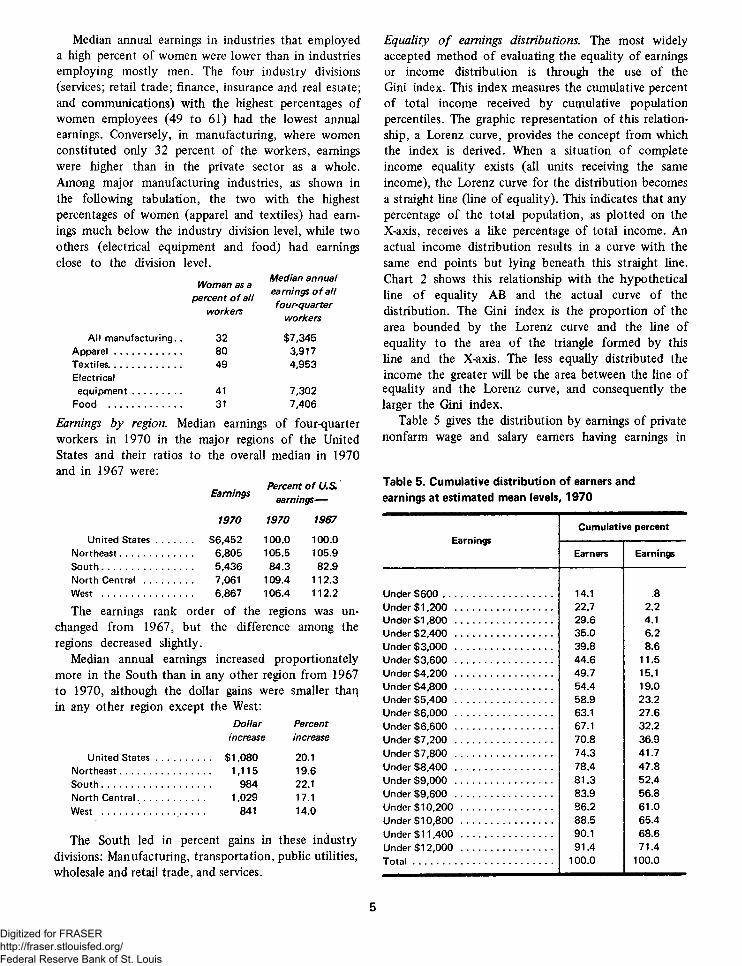
Equality o f earnings distributions. The most widely accepted method of evaluating the equality of earnings or income distribution is through the use of the Gini index. This index measures the cumulative percent of total income received by cumulative population percentiles. The graphic representation of this relationship, a Lorenz curve, provides the concept from which the index is derived. When a situation of complete income equality exists (all units receiving the same income), the Lorenz curve for the distribution becomes a straight line (line of equality). This indicates that any percentage of the total population, as plotted on the X-axis, receives a like percentage of total income. An actual income distribution results in a curve with the same end points but lying beneath this straight line. Chart 2 shows this relationship with the hypothetical line of equality AB and the actual curve of the distribution. The Gini index is the proportion of the area bounded by the Lorenz curve and the line of equality to the area of the triangle formed by this line and the X-axis. The less equally distributed the income the greater will be the area between the line of equality and the Lorenz curve, and consequently the larger the Gini index.
Table 5 gives the distribution by earnings of private nonfarm wage and salary earners having earnings in
Table 5. Cumulative distribution of earners and earnings at estimated mean levels, 1970
EarningsCumulative percent
Earners Earnings
Under $600 ........................................... 14.1 .8Under $1,200 ...................................... 22.7 2.2Under $1,800 ...................................... 29.6 4.1Under $2,400 ...................................... 35.0 6.2Under $3,000 ...................................... 39.8 8.6Under $3,600 ...................................... 44.6 11.5Under $4,200 .......................... ....... 49.7 15.1Under $4,800 ...................................... 54.4 19.0Under $5,400 ...................................... 58.9 23.2Under $6,000 ...................................... 63.1 27.6Under $6,600 ...................................... 67.1 32.2Under $7,200 ...................................... 70.8 36.9Under $7,800 ...................................... 74.3 41.7Under $8,400 ...................................... 78.4 47.8Under $9,000 ...................................... 81.3 52.4Under $9,600 ...................................... 83.9 56.8Under $10,200 .................................... 86.2 61.0Under $10,800 .................................... 88.5 65.4Under $11,400 .................................... 90.1 68.6Under $12,000 .................................... 91.4 71.4T o ta l ....................................................... 100.0 100.0
Digitized for FRASER http://fraser.stlouisfed.org/ Federal Reserve Bank of St. Louis
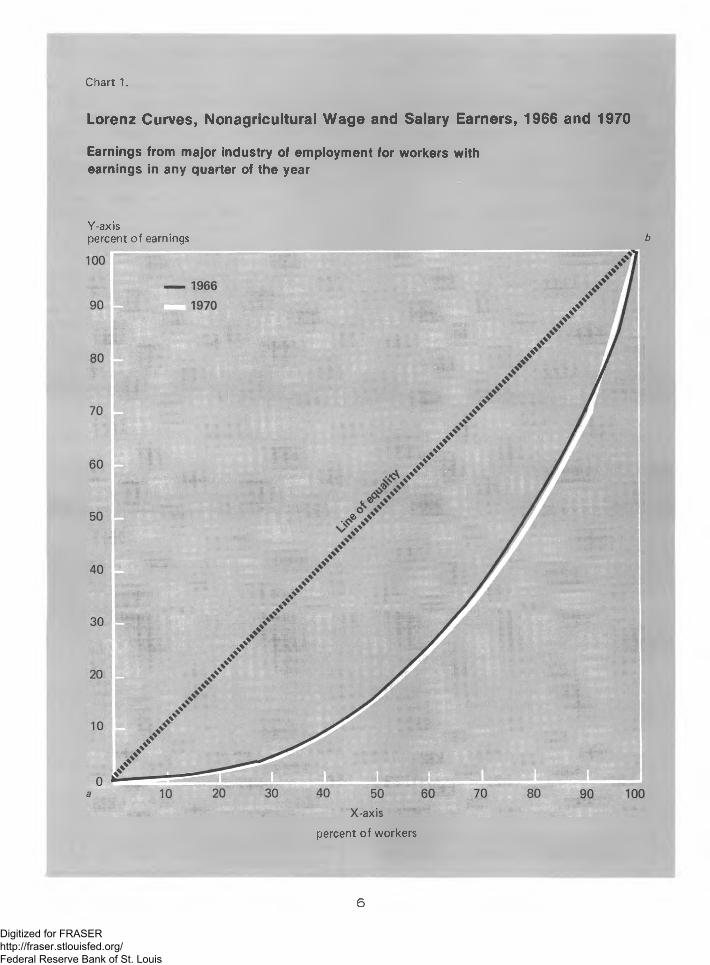
Chart 1.
Lorenz Curves, Nonagricultural Wage and Salary Earners, 1966 and 1970
Earnings from major industry of employment for workers with earnings in any quarter of the year
Y-axispercent of earnings b
percent of workers
Digitized for FRASER http://fraser.stlouisfed.org/ Federal Reserve Bank of St. Louis
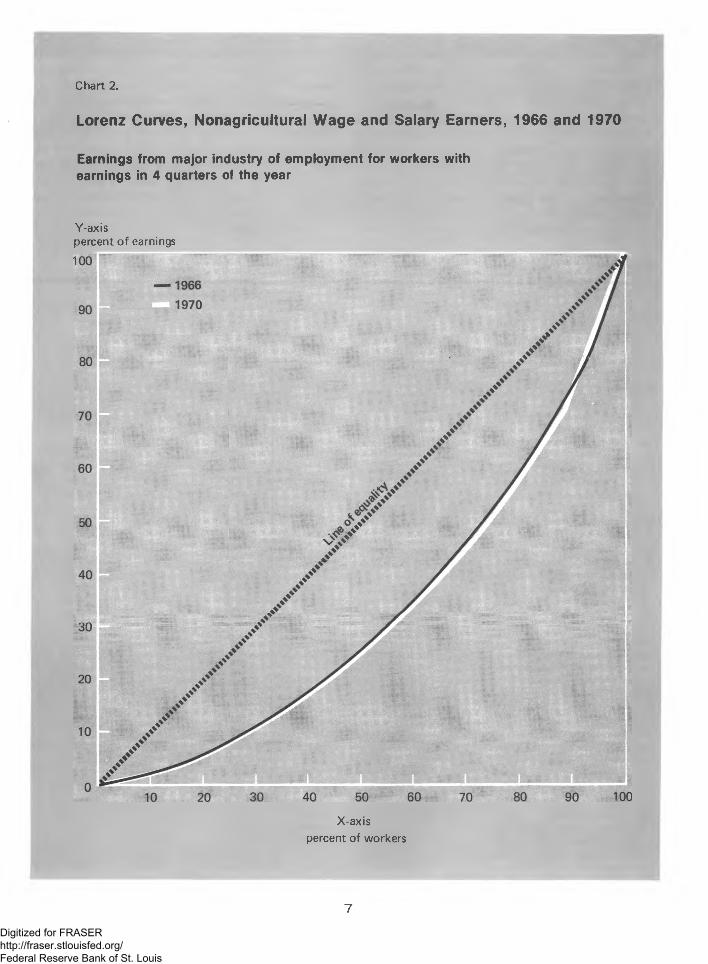
Chart 2.
Lorenz Curves, Nonagricultural Wage and Salary Earners, 1966 and 1970
Earnings from major industry of employment for workers with earnings in 4 quarters of the year
Y-axispercent of earnings
X-axispercent of workers
Digitized for FRASER http://fraser.stlouisfed.org/ Federal Reserve Bank of St. Louis
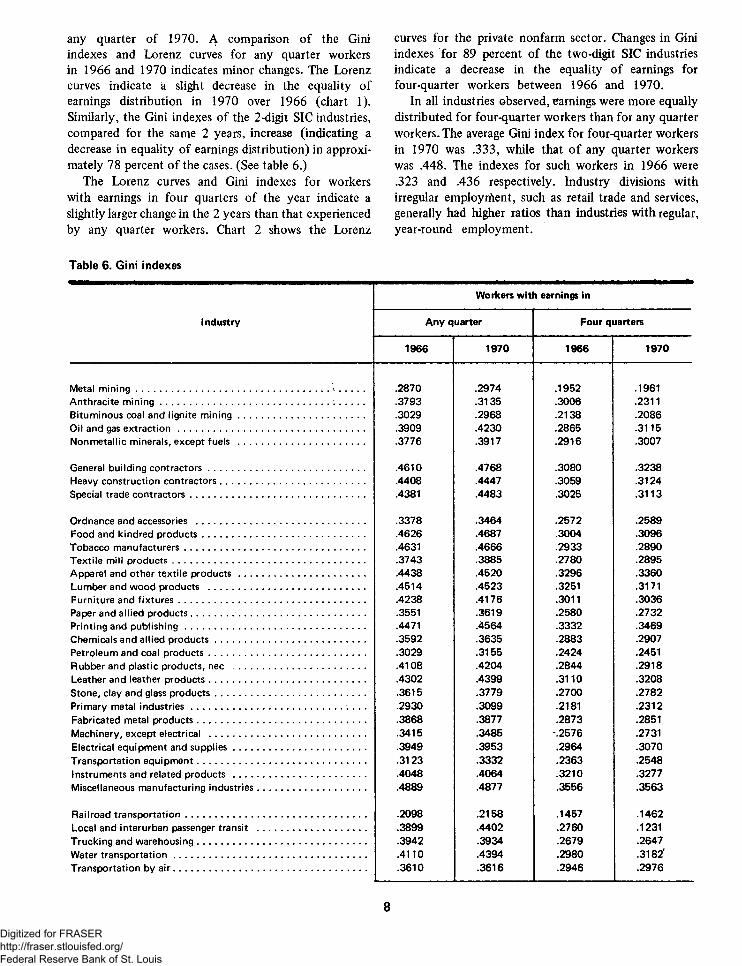
any quarter of 1970. A comparison of the Gini indexes and Lorenz curves for any quarter workers in 1966 and 1970 indicates minor changes. The Lorenz curves indicate a slight decrease in the equality of earnings distribution in 1970 over 1966 (chart 1). Similarly, the Gini indexes of the 2-digit SIC industries, compared for the same 2 years, increase (indicating a decrease in equality of earnings distribution) in approximately 78 percent of the cases. (See table 6.)
The Lorenz curves and Gini indexes for workers with earnings in four quarters of the year indicate a slightly larger change in the 2 years than that experienced by any quarter workers. Chart 2 shows the Lorenz
curves for the private nonfarm sector. Changes in Gini indexes for 89 percent of the two-digit SIC industries indicate a decrease in the equality of earnings for four-quarter workers between 1966 and 1970.
In all industries observed, earnings were more equally distributed for four-quarter workers than for any quarter workers. The average Gini index for four-quarter workers in 1970 was .333, while that of any quarter workers was .448. The indexes for such workers in 1966 were .323 and .436 respectively. Industry divisions with irregular employ rfient, such as retail trade and services, generally had higher ratios than industries with regular, year-round employment.
Table 6. Gini indexes
Workers with earnings in
Industry Any quarter Four quarters
1966 1970 1966 1970
Metal m in ing ............................................................................>............ .2870 .2974 .1952 .1961Anthracite m in ing .................................................................. ............. .3793 .3135 .3006 .2311Bituminous coal and lignite m in ing .................................................. .3029 .2968 .2138 .2086Oil and gas extraction .......................................................................... .3909 .4230 .2865 .3115Nonmetallic minerals, except fuels .................................................. .3776 .3917 .2916 .3007
General building contractors.............................................................. .4610 .4768 .3080 .3238Heavy construction contractors......................................................... .4408 .4447 .3059 .3124Special trade contractors..................................................................... .4381 .4483 .3025 .3113
Ordnance and accessories ................................................................... .3378 .3464 .2572 .2589Food and kindred products................................................................ .4626 .4687 .3004 .3096Tobacco manufacturers....................................................................... .4631 .4666 .2933 .2890Textile mill products............................................................................ .3743 .3885 .2780 .2895Apparel and other textile products.................................................. .4438 .4520 .3296 .3360Lumber and wood products .............................................................. .4514 .4523 .3251 .3171Furniture and fixtures.......................................................................... .4238 .4176 .3011 .3036Paper and allied products..................................................................... .3551 .3619 .2580 .2732Printing and publishing....................................................................... .4471 .4564 .3332 .3469Chemicals and allied products........................................................... .3592 .3635 .2883 .2907Petroleum and coal products.............................................................. .3029 .3155 .2424 .2451Rubber and plastic products, nec .................................................... .4108 .4204 .2844 .2918Leather and leather products.............................................................. .4302 .4399 .3110 .3208Stone, clay and glass products........................................................... .3615 .3779 .2700 .2782Primary metal industries........................................................... .. .2930 .3099 .2181 .2312Fabricated metal products................................................................... .3868 .3877 .2873 .2851Machinery, except electrical .............................................................. .3415 .3485 *.2576 .2731Electrical equipment and supplies.................................................... .3949 .3953 .2964 .3070Transportation equipment................................................................... .3123 .3332 .2363 .2548Instruments and related products .................................................... .4048 .4064 .3210 .3277Miscellaneous manufacturing industries........................................... .4889 .4877 .3556 .3563
Railroad transportation....................................................................... .2098 .2158 .1457 .1462Local and interurban passenger transit ........................................... .3899 .4402 .2760 .1231Trucking and warehousing................................................................... .3942 .3934 .2679 .2647Water transportation............................................................................ .4110 .4394 .2980 .3182'Transportation by a ir ............................................................................ .3610 .3616 .2946 .2976
Digitized for FRASER http://fraser.stlouisfed.org/ Federal Reserve Bank of St. Louis
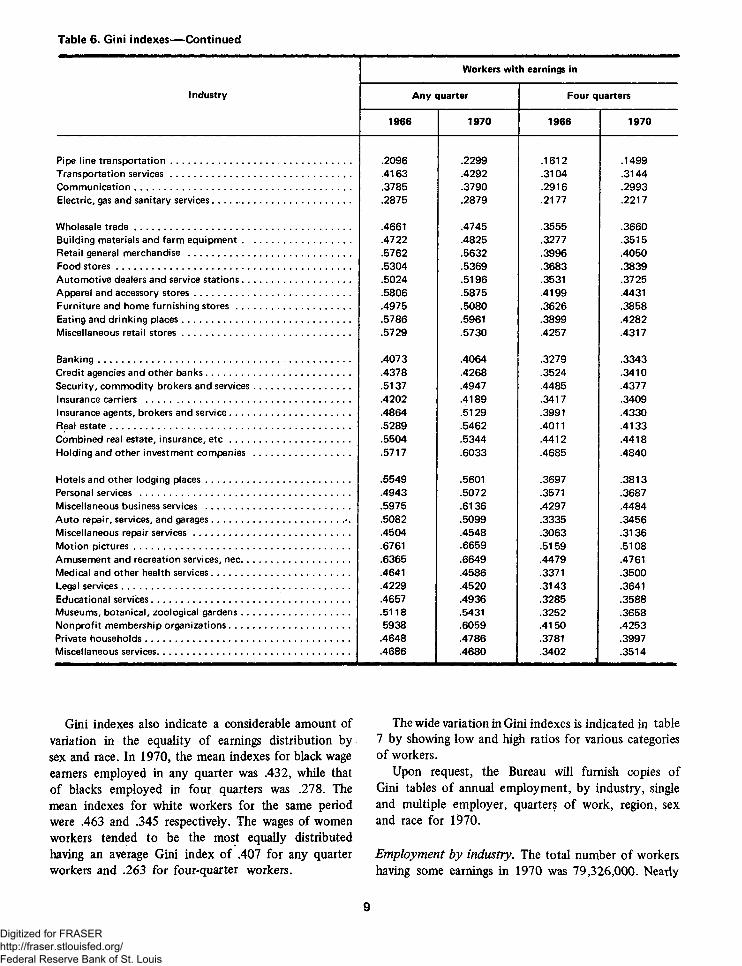
Table 6. Gini indexes— Continued
Workers with earnings in
Industry Any quarter Four quarters
1966 1970 1966 1970
Pipe line transportation........................................ .......................... .2096 .2299 .1612 .1499Transportation services....................................................................... .4163 .4292 .3104 .3144Communication..................................................................................... .3785 .3790 .2916 .2993Electric, gas and sanitary services...................................................... .2875 .2879 .2177 .2217
Wholesale tra d e ..................................................................................... .4661 .4745 .3555 .3660Building materials and farm equipm ent........................................... .4722 .4825 .3277 .3515Retail general merchandise ................................................................ .5762 .5632 .3996 .4050Food stores............................................................................................ .5304 .5369 .3683 .3839Automotive dealers and service stations........................................... .5024 .5196 .3531 .3725Apparel and accessory stores.............................................................. .5806 .5875 .4199 .4431Furniture and home furnishing stores ............................................. .4975 .5080 .3626 .3858Eating and drinking places.................................................................. .5786 .5961 .3899 .4282Miscellaneous retail stores.................................................................. .5729 .5730 .4257 .4317
Banking....................................................................... ............................ .4073 .4064 .3279 .3343Credit agencies and other banks......................................................... .4378 .4268 .3524 .3410Security, commodity brokers and services...................................... .5137 .4947 .4485 .4377Insurance carriers ................................................................................. .4202 .4189 .3417 .3409Insurance agents, brokers and service............................................... .4864 .5129 .3991 .4330Real estate............................................................................................... .5289 .5462 .4011 .4133Combined real estate, insurance, e t c ............................................... .5504 .5344 .4412 .4418Holding and other investment companies ...................................... .5717 .6033 .4685 .4840
Hotels and other lodging places......................................................... .5549 .5601 .3697 .3813Personal services ................................................................................... .4943 .5072 .3571 .3687Miscellaneous business services ......................................................... .5975 .6136 .4297 .4484Auto repair, services, and garages.................................................... *. .5082 .5099 .3335 .3456Miscellaneous repair services.............................................................. .4504 .4548 .3063 .3136Motion pictures..................................................................................... .6761 .6659 .5159 .5108Amusement and recreation services, nec........................................... .6365 .6649 .4479 .4761Medical and other health services...................................................... .4641 .4586 .3371 .3500Legal services.......................................................................................... .4229 .4520 .3143 .3641Educational services.............................................................................. .4657 .4936 .3285 .3588Museums, botanical, zoological gardens........................................... .5118 .5431 .3252 .3658Nonprofit membership organizations................................................ 5938 .6059 .4150 .4253Private households................................................................................. .4648 .4786 .3781 .3997Miscellaneous services............................................................................ .4686 .4680 .3402 .3514
Gini indexes also indicate a considerable amount of variation in the equality of earnings distribution by sex and race. In 1970, the mean indexes for black wage earners employed in any quarter was .432, while that of blacks employed in four quarters was .278. The mean indexes for white workers for the same period were .463 and .345 respectively. The wages of women workers tended to be the most equally distributed having an average Gini index of .407 for any quarter workers and .263 for four-quarter workers.
The wide variation in Gini indexes is indicated in table 7 by showing low and high ratios for various categories of workers.
Upon request, the Bureau will furnish copies of Gini tables of annual employment, by industry, single and multiple employer, quarters of work, region, sex and race for 1970.
Employment by industry. The total number of workers having some earnings in 1970 was 79,326,000. Nearly
Digitized for FRASER http://fraser.stlouisfed.org/ Federal Reserve Bank of St. Louis
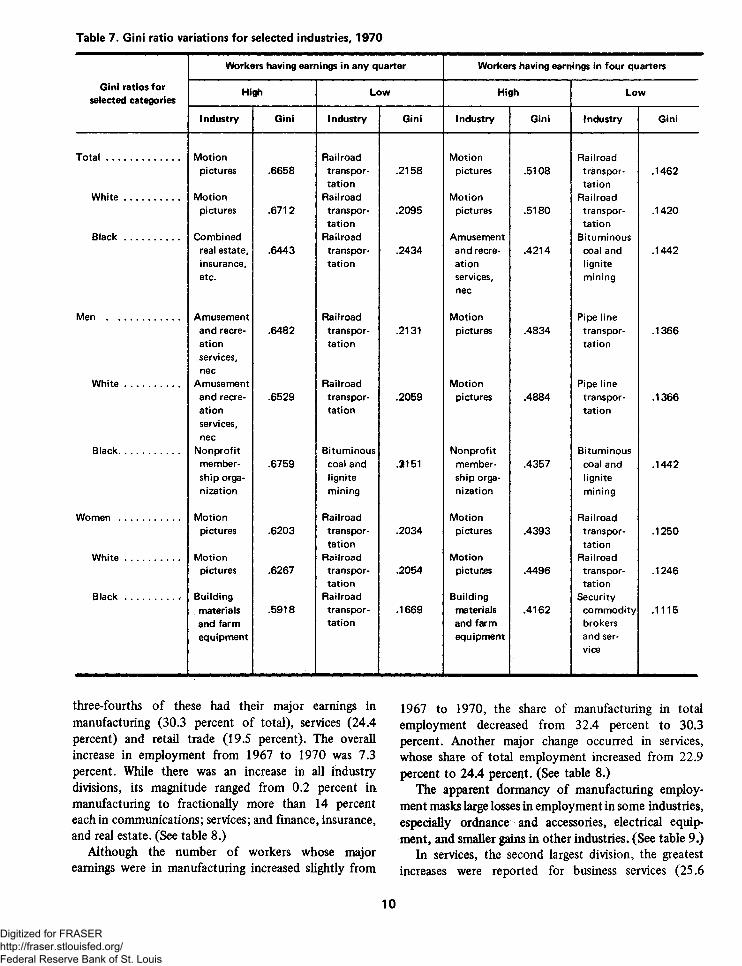
Table 7. Gini ratio variations for selected industries, 1970
Workers having earnings in any quarter Workers having earnings in four quarters
Gini ratios for High Low High Lowselected categories
1 ndustry Gini Industry Gini 1 ndustry Gini 1 ndustry Gini
T o ta l ............................. Motion Railroad Motion Railroadpictures .6658 transpor- .2158 pictures .5108 transpor .1462
tation tationW h ite ..................... Motion Railroad Motion Railroad
pictures .6712 transpor- .2095 pictures .5180 transpor .1420tation tation
B la c k ..................... Combined Railroad Amusement Bituminousreal estate, .6443 transpor- .2434 and recre .4214 coal and .1442insurance, tation ation ligniteetc. services, mining
nec
Men ............................. Amusement Railroad Motion Pipe lineand recre- .6482 transpor- .2131 pictures .4834 transpor .1366at ion tation tationservices,nec
W h ite ...................... Amusement Railroad Motion Pipe lineand recre .6529 transpor .2059 pictures .4884 transpor .1366ation tation tationservices,nec
Black........................ Nonprofit Bituminous Nonprofit Bituminousmember .6759 coal and .3151 member .4357 coal and .1442ship orga lignite ship orga lignitenization mining nization mining
Women ........................ Motion Railroad Motion Railroadpictures .6203 transpor .2034 pictures .4393 transpor .1250
tation tationW h ite ..................... Motion Railroad Motion Railroad
pictures .6267 transpor .2054 pictures .4496 transpor .1246tation tation
B la c k ................... .. Building Railroad Building Securitymaterials .5918 transpor .1669 materials .4162 commodity .1115and farm tation and farm brokersequipment equipment and ser
vice
three-fourths of these had their major earnings in manufacturing (30.3 percent of total), services (24.4 percent) and retail trade (19.5 percent). The overall increase in employment from 1967 to 1970 was 7.3 percent. While there was an increase in all industry divisions, its magnitude ranged from 0.2 percent in. manufacturing to fractionally more than 14 percent each in communications; services; and finance, insurance, and real estate. (See table 8.)
Although the number of workers whose major earnings were in manufacturing increased slightly from
1967 to 1970, the share of manufacturing in total employment decreased from 32.4 percent to 30.3 percent. Another major change occurred in services, whose share of total employment increased from 22.9 percent to 24.4 percent. (See table 8.)
The apparent dormancy of manufacturing employment masks large losses in employment in some industries, especially ordnance and accessories, electrical equipment, and smaller gains in other industries. (See table 9.)
In services, the second largest division, the greatest increases were reported for business services (25.6
Digitized for FRASER http://fraser.stlouisfed.org/ Federal Reserve Bank of St. Louis
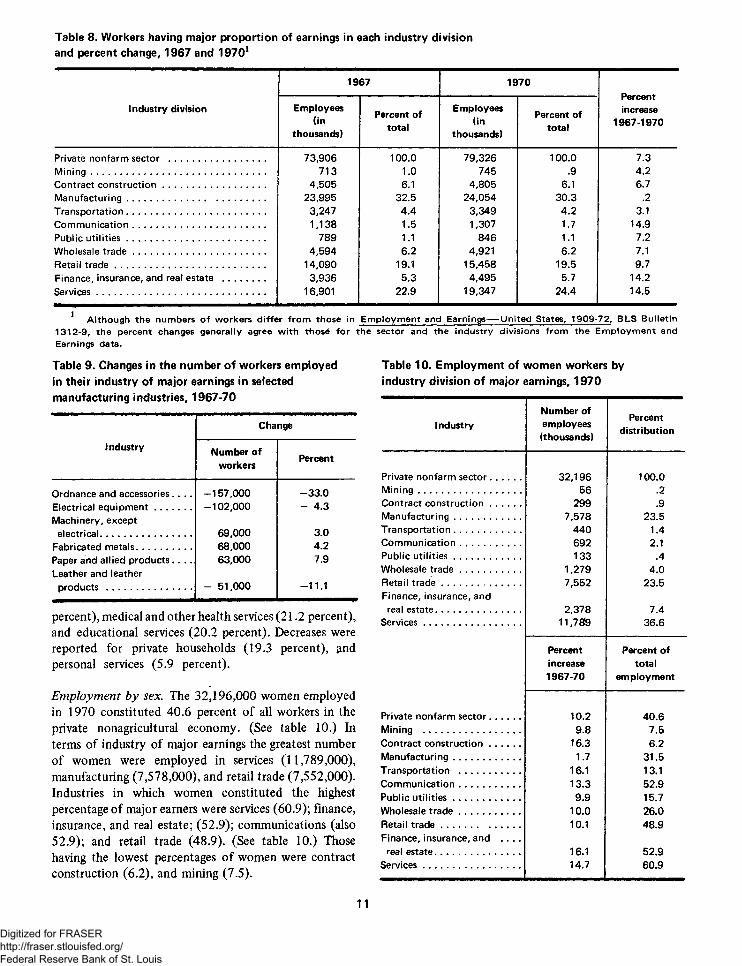
Table 8. Workers having major proportion of earnings in each industry division and percent change, 1967 and 19701
Industry division
1967 1970Percentincrease
1967-1970Employees
(inthousands)
Percent of total
Employees(in
thousands)
Percent of total
Private nonfarm sector ...................................... 73,906 100.0 79,326 100.0 7.3M ining................... ................................................. 713 1.0 745 .9 4.2Contract construction........................................ 4,505 6.1 4,805 6.1 6.7Manufacturing....................................................... 23,995 32.5 24,054 30.3 .2Transportation....................................................... 3,247 4.4 3,349 4.2 3.1Communication.................................................... 1,138 1.5 1,307 1.7 14.9Public u tilities ....................................................... 789 1.1 846 1.1 7.2Wholesale tra d e .................................................... 4,594 6.2 4,921 6.2 7.1Retail t ra d e ........................................ .................. 14,090 19.1 15,458 19.5 9.7Finance, insurance, and real estate ................. 3,936 5.3 4,495 5.7 14.2Services................................................................... 16,901 22.9 19,347 24.4 14.5
Although the numbers of workers differ from those in Employment and Earnings— United States, 1909-72, BLS Bulletin 1312-9, the percent changes generally agree with those for the sector and the industry divisions from the Employment and Earnings data.
Table 9. Changes in the number of workers employed in their industry of major earnings in selected manufacturing industries, 1967-70
Industry
Change
Number of workers
Percent
Ordnance and accessories. . . . -15 7 ,0 0 0 -3 3 .0Electrical equipm ent.............. -10 2 ,0 0 0 - 4.3Machinery, except
electrical.................................... 69,000 3.0Fabricated metals..................... 68,000 4.2Paper and allied products . . . . 63,000 7.9Leather and leather
products ................................. - 51,000 -11 .1
percent), medical and other health services (21.2 percent), and educational services (20.2 percent). Decreases were reported for private households (19.3 percent), and personal services (5.9 percent).
Employment by sex. The 32,196,000 women employed in 1970 constituted 40.6 percent of all workers in the private nonagricultural economy. (See table 10.) In terms of industry of major earnings the greatest number of women were employed in services (11,789,000), manufacturing (7,578,000), and retail trade (7,552,000). Industries in which women constituted the highest percentage of major earners were services (60.9); finance, insurance, and real estate; (52.9); communications (also 52.9); and retail trade (48.9). (See table 10.) Those having the lowest percentages of women were contract construction (6.2), and mining (7.5).
Table 10. Employment of women workers by industry division of major earnings, 1970
IndustryNumber of employees (thousands)
Percentdistribution
Private nonfarm sector............ 32,196 100.0M ining........................................ 56 .2Contract construction............ 299 .9Manufacturing.......................... 7,578 23.5Transportation.......................... 440 1.4Communication........................ 692 2.1Public u tilities .......................... 133 .4Wholesale tra d e ........................ 1,279 4.0Retail tra d e ............................... 7,552 23.5Finance, insurance, and
real estate................................. 2,378 7.4Services...................................... 11,78>9 36.6
Percent Percent ofincrease total1967-70 employment
Private nonfarm sector............ 10.2 40.6Mining ...................................... 9.8 7.5Contract construction............ 16.3 6.2Manufacturing.......................... 1.7 31.5Transportation ........................ 16.1 13.1Communication........................ 13.3 52.9Public u tilities .......................... 9.9 15.7Wholesale tra d e ........................ 10.0 26.0Retail tra d e ............................... 10.1 48.9Finance, insurance, and . . . .real estate................................. 16.1 52.9
Services...................................... 14.7 60.9
Digitized for FRASER http://fraser.stlouisfed.org/ Federal Reserve Bank of St. Louis
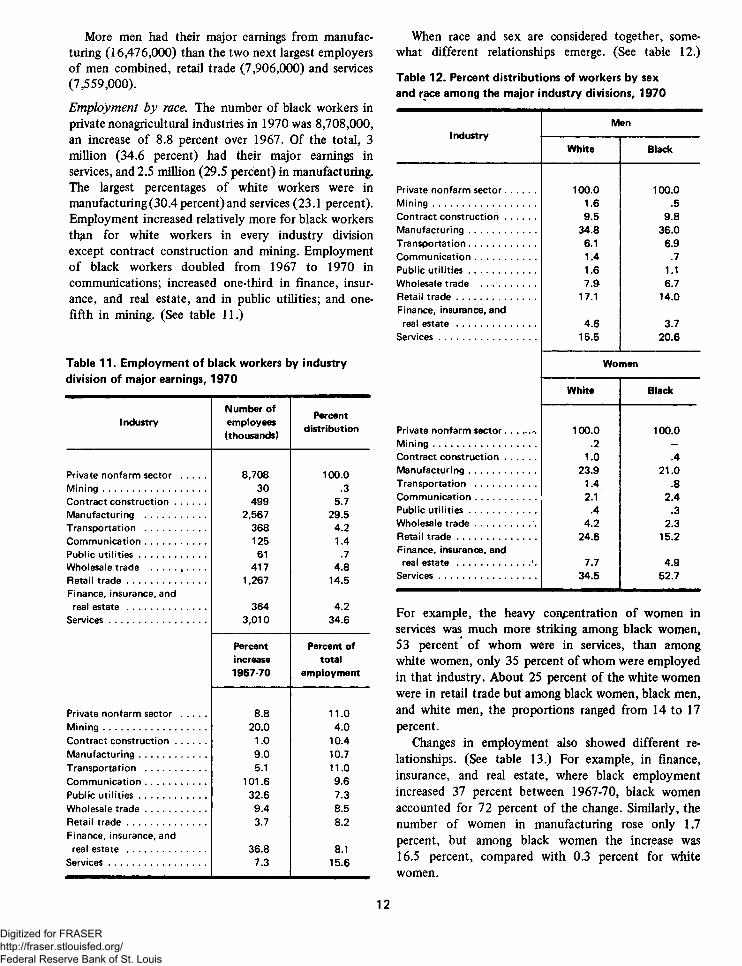
More men had their major earnings from manufacturing (16,476,000) than the two next largest employers of men combined, retail trade (7,906,000) and services (7,559,000).
Employment by race. The number of black workers in private nonagricultural industries in 1970 was 8,708,000, an increase of 8.8 percent over 1967. Of the total, 3 million (34.6 percent) had their major earnings in services, and 2.5 million (29.5 percent) in manufacturing. The largest percentages of white workers were in manufacturing(30.4 percent)and services (23.1 percent). Employment increased relatively more for black workers th^n for white workers in every industry division except contract construction and mining. Employment of black workers doubled from 1967 to 1970 in communications; increased one-third in finance, insurance, and real estate, and in public utilities; and one- fifth in mining. (See table 11.)
Table 11. Employment of black workers by industry division of major earnings, 1970
IndustryNumber of employees (thousands)
Percentdistribution
Private nonfarm sector .......... 8,708 100.0M ining........................................ 30 .3Contract construction............ 499 5.7Manufacturing ........................ 2,567 29.5Transportation ........................ 368 4.2Communication........................ 125 1.4Public u tilities .......................... 61 .7Wholesale trade ..................... 417 4.8Retail tra d e ............................... 1,267 14.5Finance, insurance, and
real estate ............................... 364 4.2Services...................................... 3,010 34.6
Percent Percent ofincrease total1967-70 employment
Private nonfarm sector .......... 8.8 11.0M ining........................................ 20.0 4.0Contract construction............ 1.0 10.4Manufacturing.......................... 9.0 10.7Transportation ........................ 5.1 11.0Communication........................ 101.6 9.6Public u tilities .......................... 32.6 7.3Wholesale tra d e ........................ 9.4 8.5Retail tra d e ............................... 3.7 8.2Finance, insurance, andreal estate ............................... 36.8 8.1
Services...................................... 7.3 15.6
When race and sex are considered together, somewhat different relationships emerge. (See table 12.)
Table 12. Percent distributions of workers by sex and race among the major industry divisions, 1970
IndustryMen
White Black
Private nonfarm sector............ 100.0 100.0M ining........................................ 1.6 .5Contract construction............ 9.5 9.8Manufacturing.......................... 34.8 36.0Transportation.......................... 6.1 6.9Communication........................ 1.4 .7Public u tilities .......................... 1.6 1.1Wholesale trade .............. 7.9 6.7Retail tra d e ............................... 17.1 14.0Finance, insurance, and
real e s ta te ............................... 4.6 3.7Services...................................... 15.5 20.6
Women
White Black
Private nonfarm sector........... . 100.0 100.0M ining ........................................ .2 -
Contract construction............ 1.0 .4Manufacturing.......................... 23.9 21.0Transportation ........................ 1.4 .8Communication........................ 2.1 2.4Public u tilities .......................... .4 .3Wholesale tra d e ..................... 4.2 2.3Retail t ra d e ............................... 24.6 15.2Finance, insurance, andreal estate .............................'. 7.7 4.9
Services...................................... 34.5 52.7
For example, the heavy conpentration of women in services was much more striking among black women, 53 percent of whom were in services, than among white women, only 35 percent of whom were employed in that industry. About 25 percent of the white women were in retail trade but among black women, black men, and white men, the proportions ranged from 14 to 17 percent.
Changes in employment also showed different relationships. (See table 13.) For example, in finance, insurance, and real estate, where black employment increased 37 percent between 1967-70, black women accounted for 72 percent of the change. Similarly, the number of women in manufacturing rose only 1.7 percent, but among black women the increase was 16.5 percent, compared with 0.3 percent for white women.
Digitized for FRASER http://fraser.stlouisfed.org/ Federal Reserve Bank of St. Louis
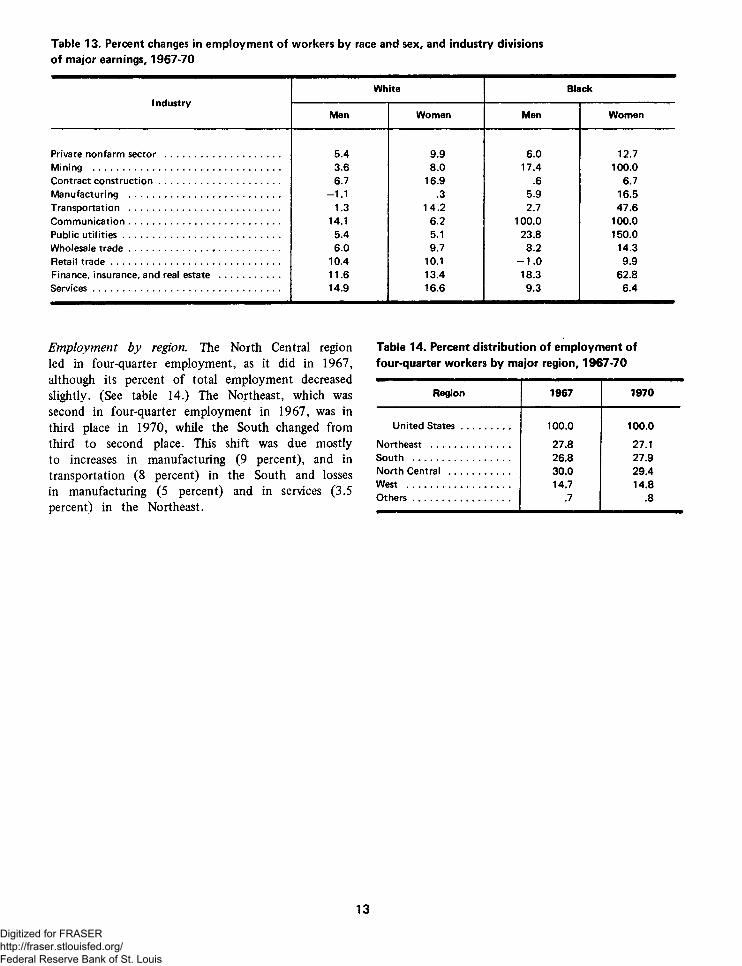
Table 13. Percent changes in employment of workers by race and sex, and industry divisions of major earnings, 1967-70
1 ndustryWhite Black
Men Women Men Women
Private nonfarm sector ............................................. 5.4 9.9 6.0 12.7Mining .......................................................................... 3.6 8.0 17.4 100.0Contract construction................................................ 6.7 16.9 .6 6.7Manufacturing ............................................................ -1 .1 .3 5.9 16.5Transportation ............................................................ 1.3 14.2 2.7 47.6Communication............................................................ 14.1 6.2 100.0 100.0Public u tilities .............................................................. 5.4 5.1 23.8 150.0Wholesale tra d e ............................................................ 6.0 9.7 8.2 14.3Retail t ra d e ................................................................... 10.4 10.1 - 1 . 0 9.9Finance, insurance, and real estate ........................ 11.6 13.4 18.3 62.8Services.......................................................................... 14.9 16.6 9.3 6.4
Employment by region. The North Central region led in four-quarter employment, as it did in 1967, although its percent of total employment decreased slightly. (See table 14.) The Northeast, which was second in four-quarter employment in 1967, was in third place in 1970, while the South changed from third to second place. This shift was due mostly to increases in manufacturing (9 percent), and in transportation (8 percent) in the South and losses in manufacturing (5 percent) and in services (3.5 percent) in the Northeast.
Table 14. Percent distribution of employment of four-quarter workers by major region, 1967-70
Region 1967 1970
United States................... 100.0 100.0
Northeast ............................... 27.8 27.1South ...................................... 26.8 27.9North Central ........................ 30.0 29.4West ......................................... 14.7 14.8O thers...................................... .7 .8
Digitized for FRASER http://fraser.stlouisfed.org/ Federal Reserve Bank of St. Louis
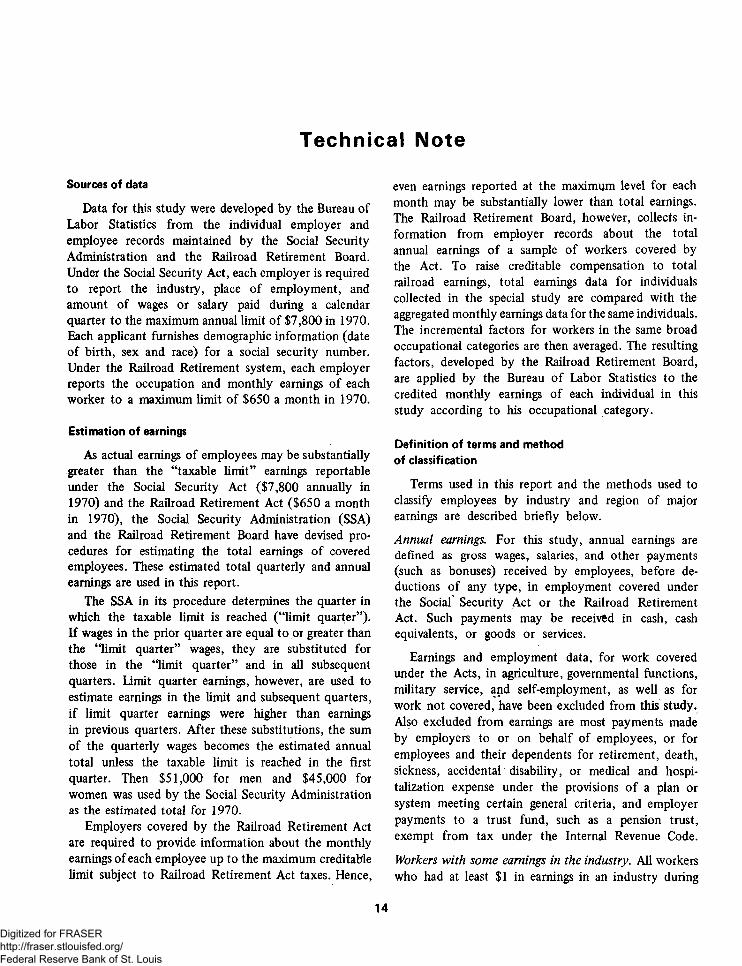
Technical Note
Sources of data
Data for this study were developed by the Bureau of Labor Statistics from the individual employer and employee records maintained by the Social Security Administration and the Railroad Retirement Board. Under the Social Security Act, each employer is required to report the industry, place of employment, and amount of wages or salary paid during a calendar quarter to the maximum annual limit of $7,800 in 1970. Each applicant furnishes demographic information (date of birth, sex and race) for a social security number. Under the Railroad Retirement system, each employer reports the occupation and monthly earnings of each worker to a maximum limit of $650 a month in 1970.
Estimation of earnings
As actual earnings of employees may be substantially greater than the “taxable limit” earnings reportable under the Social Security Act ($7,800 annually in 1970) and the Railroad Retirement Act ($650 a month in 1970), the Social Security Administration (SSA) and the Railroad Retirement Board have devised procedures for estimating the total earnings of covered employees. These estimated total quarterly and annual earnings are used in this report.
The SSA in its procedure determines the quarter in which the taxable limit is reached (“limit quarter”). If wages in the prior quarter are equal to or greater than the “limit quarter” wages, they are substituted for those in the “limit quarter” and in all subsequent quarters. lim it quarter earnings, however, are used to estimate earnings in the limit and subsequent quarters, if limit quarter earnings were higher than earnings in previous quarters. After these substitutions, the sum of the quarterly wages becomes the estimated annual total unless the taxable limit is reached in the first quarter. Then $51,000 for men and $45,000 for women was used by the Social Security Administration as the estimated total for 1970.
Employers covered by the Railroad Retirement Act are required to provide information about the monthly earnings of each employee up to the maximum creditable limit subject to Railroad Retirement Act taxes. Hence,
even earnings reported at the maximum level for each month may be substantially lower than total earnings. The Railroad Retirement Board, however, collects information from employer records about the total annual earnings of a sample of workers covered by the Act. To raise creditable compensation to total railroad earnings, total earnings data for individuals collected in the special study are compared with the aggregated monthly earnings data for the same individuals. The incremental factors for workers in the same broad occupational categories are then averaged. The resulting factors, developed by the Railroad Retirement Board, are applied by the Bureau of Labor Statistics to the credited monthly earnings of each individual in this study according to his occupational category.
Definition of terms and method of classification
Terms used in this report and the methods used to classify employees by industry and region of major earnings are described briefly below.
Annual earnings. For this study, annual earnings are defined as gross wages, salaries, and other payments (such as bonuses) received by employees, before deductions of any type, in employment covered under the Social Security Act or the Railroad Retirement Act. Such payments may be received in cash, cash equivalents, or goods or services.
Earnings and employment data, for work covered under the Acts, in agriculture, governmental functions, military service, and self-employment, as well as for work not covered, have been excluded from this study. Also excluded from earnings are most payments made by employers to or on behalf of employees, or for employees and their dependents for retirement, death, sickness, accidental disability, or medical and hospitalization expense under the provisions of a plan or system meeting certain general criteria, and employer payments to a trust fund, such as a pension trust, exempt from tax under the Internal Revenue Code.
Workers with some earnings in the industry. All workers who had at least $1 in earnings in an industry during
Digitized for FRASER http://fraser.stlouisfed.org/ Federal Reserve Bank of St. Louis
the year are counted in each industry in which they had any earnings. For example, a worker who had some earnings in each of five 3-digit industries, as defined in the Standard Industrial Gassification Manual, is counted in each of these industries as well as in each 2-digit industry and in each division of which the 3-digit industries are a part. Because a worker is counted in each 3-digit industry, each 2-digit industry, and in each division in which he had $1 in covered wage and salary earnings or more, the aggregate count of workers at each level (3-digit, 2-digit, or division) is greater than the total number at each broader industry level (2-digit, division, private nonagricultural economy).
Industry of major earnings
The industry of major earnings, in this study, is the industry in which a worker earned more of his annual wages and salary than in any other industry. As many workers have earnings in several industry divisions or at several levels of one industry group, determination of a worker’s industry of major earnings involves a plurality eatnings test which is applied separately to earnings at each industry level.
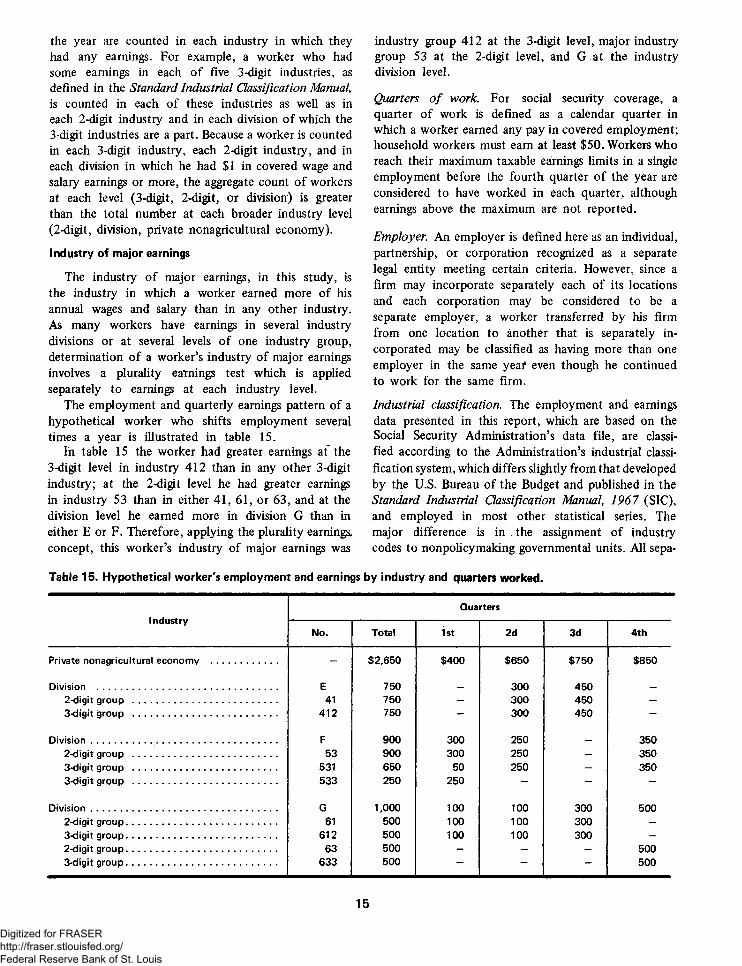
The employment and quarterly earnings pattern of a hypothetical worker who shifts employment several times a year is illustrated in table 15.
In table 15 the worker had greater earnings at the 3-digit level in industry 412 than in any other 3-digit industry; at the 2-digit level he had greater earnings in industry 53 than in either 41, 61, or 63, and at the division level he earned more in division G than in either E or F. Therefore, applying the plurality earnings, concept, this worker’s industry of major earnings was
industry group 412 at the 3-digit level, major industry group 53 at the 2-digit level, and G at the industry division level.
Quarters o f work. For social security coverage, a quarter of work is defined as a calendar quarter in which a worker earned any pay in covered employment; household workers must earn at least $50. Workers who reach their maximum taxable earnings limits in a single employment before the fourth quarter of the year are considered to have worked in each quarter, although earnings above the maximum are not reported.
Employer. An employer is defined here as an individual, partnership, or corporation recognized as a separate legal entity meeting certain criteria. However, since a firm may incorporate separately each of its locations and each corporation may be considered to be a separate employer, a worker transferred by his firm from one location to another that is separately incorporated may be classified as having more than one employer in the same yeaf even though he continued to work for the same firm.
Industrial classification. The employment and earnings data presented in this report, which are based on the Social Security Administration’s data file, are classified according to the Administration’s industrial classification system, which differs slightly from that developed by the U.S. Bureau of the Budget and published in the Standard Industrial Gassification Manual, 1967 (SIC), and employed in most other statistical series. The major difference is in the assignment of industry codes to nonpolicymaking governmental units. All sepa-
Table 15. Hypothetical worker's employment and earnings by industry and quarters worked.
IndustryQuarters
No. Total 1st 2d 3d 4th
Private nonagricultural economy .......................... - $2,650 $400 $650 $750 $850
Division ....................................................................... E 750 _ 300 450 _2-digit group ......................................................... 41 750 - 300 450 -3-digit group ......................................................... 412 750 — 300 450 —
Division......................................................................... F 900 300 250 — 3502-digit group ......................................................... 53 900 300 250 - 3503-digit group ......................................................... 531 650 50 250 - 3503-digit group ......................................................... 533 250 250 — — —
Division......................................................................... G 1,000 100 100 300 5002-digit group........................................................... 61 500 100 100 300 -3-digit group........................................................... 612 500 100 100 300 -2-digit group........................................................... 63 500 - - - 5003-digit group........................................................... 633 500 — — — 500
Digitized for FRASER http://fraser.stlouisfed.org/ Federal Reserve Bank of St. Louis
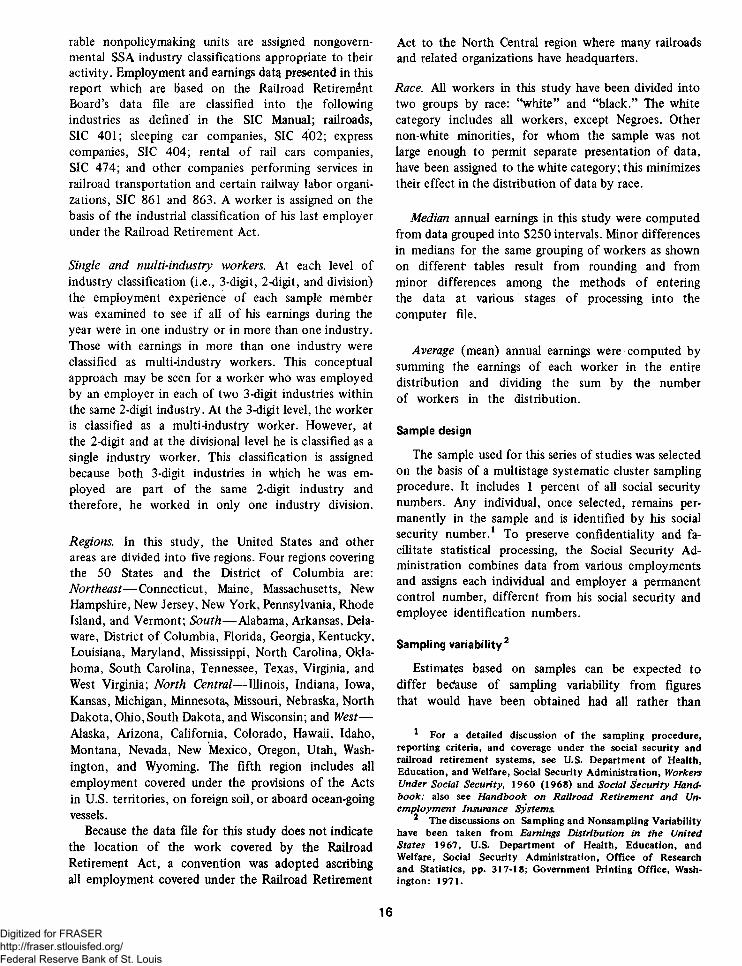
rable nonpolicymaking units are assigned nongovernmental SSA industry classifications appropriate to their activity. Employment and earnings dat^ presented in this report which are based on the Railroad Retirement Board’s data file are classified into the following industries as defined in the SIC Manual; railroads, SIC 401; sleeping car companies, SIC 402; express companies, SIC 404; rental of rail cars companies, SIC 474; and other companies performing services in railroad transportation and certain railway labor organizations, SIC 861 and 863. A worker is assigned on the basis of the industrial classification of his last employer under the Railroad Retirement Act.
Single and multi-industry workers. At each level of industry classification (i.e., 3-digit, 2-digit, and division) the employment experience of each sample member was examined to see if all of his earnings during the year were in one industry or in more than one industry. Those with earnings in more than one industry were classified as multi-industry workers. This conceptual approach may be seen for a worker who was employed by an employer in each of two 3-digit industries within the same 2-digit industry. At the 3-digit level, the worker is classified as a multi-industry worker. However, at the 2-digit and at the divisional level he is classified as a single industry worker. This classification is assigned because both 3-digit industries in which he was employed are part of the same 2-digit industry and therefore, he worked in only one industry division.
Regions. In this study, the United States and other areas are divided into five regions. Four regions covering the 50 States and the District of Columbia are: Northeast— Connecticut, Maine, Massachusetts, New Hampshire, New Jersey, New York, Pennsylvania, Rhode Island, and Vermont; South— Alabama, Arkansas, Delaware, District of Columbia, Florida, Georgia, Kentucky, Louisiana, Maryland, Mississippi, North Carolina, Oklahoma, South Carolina, Tennessee, Texas, Virginia, and West Virginia; North Central— Illinois, Indiana, Iowa, Kansas, Michigan, Minnesota, Missouri, Nebraska, North Dakota, Ohio, South Dakota, and Wisconsin; and West— Alaska, Arizona, California, Colorado, Hawaii, Idaho, Montana, Nevada, New Mexico, Oregon, Utah, Washington, and Wyoming. The fifth region includes all employment covered under the provisions of the Acts in U.S. territories, on foreign soil, or aboard ocean-going vessels.
Because the data file for this study does not indicate the location of the work covered by the Railroad Retirement Act, a convention was adopted ascribing all employment covered under the Railroad Retirement
Act to the North Central region where many railroads and related organizations have headquarters.
Race. All workers in this study have been divided into two groups by race: “white” and “black.” The white category includes all workers, except Negroes. Other non-white minorities, for whom the sample was not large enough to permit separate presentation of data, have been assigned to the white category; this minimizes their effect in the distribution of data by race.
Median annual earnings in this study were computed from data grouped into $250 intervals. Minor differences in medians for the same grouping of workers as shown on different tables result from rounding and from minor differences among the methods of entering the data at various stages of processing into the computer file.
Average (mean) annual earnings were computed by summing the earnings of each worker in the entire distribution and dividing the sum by the number of workers in the distribution.
Sample design
The sample used for this series of studies was selected on the basis of a multistage systematic cluster sampling procedure. It includes 1 percent of all social security numbers. Any individual, once selected, remains permanently in the sample and is identified by his social security number.1 To preserve confidentiality and facilitate statistical processing, the Social Security Administration combines data from various employments and assigns each individual and employer a permanent control number, different from his social security and employee identification numbers.
Sampling variability2
Estimates based on samples can be expected to differ because of sampling variability from figures that would have been obtained had all rather than
* For a detailed discussion of the sampling procedure, reporting criteria, and coverage under the social security and railroad retirement systems, see U.S. Department of Health, Education, and Welfare, Social Security Administration, Workers Under Social Security, 1960 (1968) and Social Security Hand- book; also see Handbook on Railroad Retirement and Unemployment Insurance Systems.
2 The discussions on Sampling and Nonsampling Variability have been taken from Earnings Distribution in the United States 1967, U.S. Department of Health, Education, and Welfare, Social Security Administration, Office of Research and Statistics, pp. 317-18; Government Printing Office, Washington: 1971.
Digitized for FRASER http://fraser.stlouisfed.org/ Federal Reserve Bank of St. Louis
specified samples of the records been used for the compilations. The standard error is a measure of sampling variability. The chances are about 68 out of 100 that the difference due to sampling variability between a sample estimate and the figure that would have been obtained from a compilation of all records is less than the standard error. The chances are 95 out of 100 that the difference is less than twice the standard error and about 99 out of 100 that it is less than 2H times the standard error. The standard error of an estimate depends on the sample design elements such as the method of sampling, the sample size, and on the estimation process.
No exact calculation of standard errors of estimates based on the stratified cluster continuous work history samples has been carried out. However, approximate standard errors of estimates utilizing the assumption of simple random sampling are likely to be reasonably close to those for the actual sample design used for many attribute statistics. While the actual method 6f selection (stratified cluster sampling) differs from simple random sampling, there is evidence that, for most statistics, the several factors affecting the sampling variability give a joint factor close to unity relative to the sampling variability of simple random sampling.
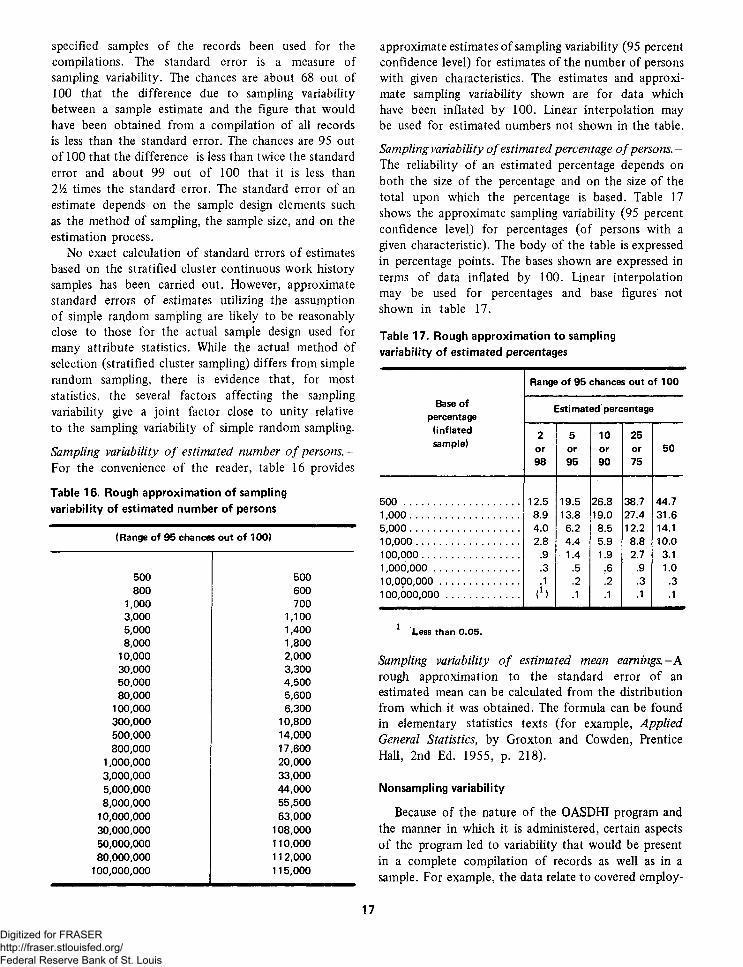
Sampling variability o f estimated number o f persons. - For the convenience of the reader, table 16 provides
Table 16. Rough approximation of sampling variability of estimated number of persons
(Range of 95 chances out of 100)
500 500800 600
1,000 7003,000 1,1005,000 1,4008,000 1,800
10,000 2,00030,000 3,30050,000 4,50080,000 5,600
100,000 6,300300,000 10,800500,000 14,000800,000 17,600
1,000,000 20,0003,000,000 33,0005,000,000 44,0008,000,000 55,500
10,000,000 63,00030,000,000 108,00050,000,000 110,00080,000,000 112,000
100,000,000 115,000
approximate estimates of sampling variability (95 percent confidence level) for estimates of the number of persons with given characteristics. The estimates and approximate sampling variability shown are for data which have been inflated by 100. Linear interpolation may be used for estimated numbers not shown in the table.
Sampling variability o f estimated percentage o f persons. - The reliability of an estimated percentage depends on both the size of the percentage and on the size of the total upon which the percentage is based. Table 17 shows the approximate sampling variability (95 percent confidence level) for percentages (of persons with a given characteristic). The body of the table is expressed in percentage points. The bases shown are expressed in terms of data inflated by 100. Linear interpolation may be used for percentages and base figures' not shown in table 17.
Table 17. Rough approximation to sampling variability of estimated percentages
Base of percentage
Range of 95 chances out of 100
Estimated percentage
(inflatedsample)
2or98
5or95
10or90
25or75
50
500 ............................................. 12.5 19.5 26.8 38.7 44.71 ,0 00 ........................................... 8.9 13.8 19.0 27.4 31.65 ,0 0 0 ........................................... 4.0 6.2 8.5 12.2 14.11 0 ,00 0 ........................................ 2.8 4.4 5.9 8.8 10.0100 ,000 ...................................... .9 1.4 1.9 2.7 3.11,000,000 ................................. .3 .5 .6 .9 1.010,000,000 . ; ........................... .1 .2 .2 .3 .3100,000,000 ............................. t1) .1 .1 .1 .1
Less than 0.05.
Sampling variability o f estimated mean earnings.-A rough approximation to the standard error of an estimated mean can be calculated from the distribution from which it was obtained. The formula can be found in elementary statistics texts (for example, Applied General Statistics, by Groxton and Cowden, Prentice Hall, 2nd Ed. 1955, p. 218).
Nonsampling variability
Because of the nature of the OASDHI program and the manner in which it is administered, certain aspects of the program led to variability that would be present in a complete compilation of records as well as in a sample. For example, the data relate to covered employ-
Digitized for FRASER http://fraser.stlouisfed.org/ Federal Reserve Bank of St. Louis
ment rather than people (minimized by use of precise definition), changes in earnings records may not be reflected promptly because of time-lag in posting and processing cutoff date, and errors in* classification and compilation. These problems are byproducts of the administrative processes .and the errors introduced are probably negligible.
In this context, the factors contributing to the nonsampling variability are: (1) the scope of covered employment; (2) duplication in the estimation of workers because of persons receiving wage credits from different employers on more than one account number; (3) the extent to which covered earnings are reported, taxed, and credited; and (4) the distribution of workers and aggregate wages above the maximum earnings base.
Relation to other studies. Data presented in this bulletin have been developed, as previously described, from information reported by employers about the earnings
of individuals up to an earnings limit and estimates of earnings higher than this limit. Although annual earnings and employment data are available in the Current Population Reports of the Bureau of the Census, they are based on a different concept of industry attachment (i.e., industry of longest job, rather than industry of major earnings, as used in the AEE system), and provide only for the industry division data, while AEE data cover industry divisions, major 2-digit SIC groups, and the most importand 3-digit groups. Moreover, other differences in methods or approach may result in important differences in sampling and nonsampling variances between this and other studies. For example, CPS data are based on household interviews, whereas the AEE data are based on employer tax returns. Furthermore, CPS data for recent years are not comparable with data for years prior to 1967 because of changes in methodology in the CPS. Therefore, caution must be exercised in using the data presented in this bulletin in conjunction with other annual earnings and employment patterns data.
Digitized for FRASER http://fraser.stlouisfed.org/ Federal Reserve Bank of St. Louis
Detailed Tables
Earnings and employment patterns in 2-digit industry divisions
Digitized for FRASER http://fraser.stlouisfed.org/ Federal Reserve Bank of St. Louis

Digitized for FRASER http://fraser.stlouisfed.org/ Federal Reserve Bank of St. Louis
INOUSTRY
INDUSTRYQUARTERS
EARNINGS OF WORKERS BY WORKED IN THE INDUSTRY
EARNINGS FROM ALL WAGE AND SALARY EMPLOYMENT OF WORKERS WHOSE MAJOR EARNINGS WERE FROM THIS INDUSTRY BY QUARTERS WORKEO IN THE INDUSTRY
A N Y Q U A R T E R FOtJR QUARTERS A N Y Q U A R T E R FOUR QUARTERSALL
WORKERSR A C E ALL
WORKERSR A C E ALL
WORKERSR A C E ALL
WORKERSR A C E
WHITE11 NEGRO WHITE * | NEGRO WHITE11 NEGRO WHITE1! NEGRO
PRIVATE NONAGRICULTURAL ECONOMY ..... $ A.250 * 4,374 % 2,959 S 6,452 « 6,685 % 4,697 S 4,250 * 4,374 * 2,959 % 6,452 $ 6,685 S 4,697
p i n i n g ........................................ 7,363 7,472 5,187 8,785 8,869 6,958 7,624 7,731 5,285 8,853 8,927 ’ 7,027
METAL m i n i n g ................ .............. 7,771 7,784 5,624 8,641 8,650 6,249 7,857 7,870 5,624 8,719 8,730 6,499a n t h r a c i t e m i n i n g ......................... 6,124 6,124 - 6,708 6,708 - 6,562 6,562 6,796 6,796 -BITUMINOUS COAL AND LIGNITE MINING ...... 8,359 8,369 8,124 9,161 9, 188 8,624 8,431 8,442 8, 149 9,222 9,252 8,624OIL ANC GAS EXTRACTION .................... 6,769 6,914 2,958 8,922 9,008 5,937 7,117 7,217 3,812 8,963 9,044 6,312NCNKETALLIC MINERALS. EXCEPT F U E L S ...... 6,372 6,549 4,937 8,133 8*335 6,196 6,778 7,018 5,089 8,208 8,431 6,229
CONTRACT CONSTRUCTION ....................... 5,335 5,716 3,103 8,835 9,206 5,662 5,709 6,103 3,429 9,043 9,399 5,782
GENERAL BUILDING CONTRACTORS ............. 4,372 4,670 2,766 8,438 8,792 5,892 5,153 5,471 3,444 8,968 9,302 6,249HEAVY CONSTRUCTION CONTRACTORS .......... 4,992 5,385 3,032 8,602 9,069 5,670 5,658 6,053 3,557 8,884 9,329 5,852SPECIAL TRACE CONTRACTORS ................ 5,479 5,883 2,808 9,190 9,484 5,477 6,101 6,502 3,281 9,474 9,821 5,792
MANUFACTURING ............................... 5,586 5,842 3,986 7,345 7,563 5,654 5,752 5,988 4, 138 7,429 7,632 5,762
ORDNANCE AND ACCESSORIES ................. 7,377 7,669 5,074 8,753 8,963 5,921 7,604 7,871 5,267 8,864 9, 101 6,107FCOC AND KINCRED PRODUCTS ................ 4,310 4,614 3,045 7,406 7,692 5,648 4,600 4,905 3,416 7,510 7,776 5,749TOBACCO MANUFACTURERS .................... 3,728 4,624 1,324 6,360 6,512 5,464 3,871 4,833 1,556 6,408 6,564 5,649t e x t i l e m i l l PRODUCTS ....... ............. 4,092 4,177 3,511 4,953 5,034 4,535 4,212 4,290 3,742 4,985 5,064 4,618APPAREL ANC OTHER TEXTILE PRODUCTS ...... 3,036 3,068 2,780 3,917 3,954 3,693 3,108 3,138 2,897 3,939 3,975 3.723LUMBER ANC WOOD PRODUCTS ................. 3,622 4, 120 2,377 5,876 6,480 3,691 3,856 4,411 2,635 5,962 6,550 3,721FURNITURE AND FIXTURES ................... 4,217 4,393 3,346 5,535 5,709 4,466 4,413 4,602 3,624 5,614 5,778 4,576PAPER AND ALLIED PRODUCTS ................ 6,522 6,787 4,745 7,900 8,047 6,293 6,739 7,003 5,064 7,962 8,133 6,458PRINTING ANC PUBLISHING .................. 5,421 5,599 3,731 7,898 7,996 5,816 5,617 5,798 4,026 7,957 8,105 5,892CHEMICALS ANC ALLIED PRODUCTS ........... 7,610 7,847 5,435 8,760 8,971 6,985 7,777 7,948 5,661 8,849 9,051 7,199PETRCLEUM AND COAL PRODUCTS .............. 9, 103 9,364 6,187 10,015 10,185 7,787 9,226 9*470 6,499 10,081 10,235 7,812RUBBER ANC PLASTIC PRODUCTS* NEC ........ 4,975 5,146 3,609 7,040 7, 170 5,781 5,184 5 *-350 3,839 7, 159 7,284 6,044LEATHER ANC LEATHER PROOUCTS ............ 3,357 3,399 2,624 4,497 4,523 4,283 3,474 3,512 2,887 4.541 4,565 4,299STONE. CLAY. AND GLASS PRODUCTS ......... 5,869 6, 147 4,199 7,665 7,850 5,829 6,135 6,415 4, 551 7,746 7,901 5,962PRIMARY METAL INDUSTRIES......... ....... 7,600 7,839 6,376 8,546 8,770 7,385 7,765 7,970 6,556 8,675 8,887 7,550FABRICATED METAL PRODUCTS ................ 5,977 6,170 4,494 7,714 7,829 6,313 6,241 6,441 4,755 7,820 7,920 6,442MACHINERY. EXCEPT ELECTRICAL ............ 7,171 7,306 5,040 8,278 8,386 6,732 7,402 7,538 5,407 8,402 8,508 6,971ELECTRICAL EQUIPMENT AND SUPPLIES ....... 5,715 5,898 4,100 7,302 7,475 5,604 5,913 6,100 4,285 7,447 7,621 5,762TRANSPORTATION EQUIPMENT ................. 7,435 7,655 5,827 8,457 8,708 7,075 7,676 7,839 6,030 8,615 8,845 7,267INSTRUMENTS ANC RELATEC PRODUCTS ........ 5,998 6,221 3,795 7,592 7,743 5,538 6,240 6,463 4,083 7,707 7,811 5,568MISCELLANEOUS MANUFACTURING INDUSTRIES .. 3,553 3,699 2,828 5,485 5,644 4,316 3,798 3,910 3,004 5,569 5,721 4,464
TRANSPORTATION ............................... 7,392 7,674 5,415 8,867 9,081 7,385 7,623 7,842 5,744 9,008 9,215 7,539
RAILRCAC TRANSPORTATION .................. 8,645 8,764 6,749 9,512 9,612 7,331 8,718 8,932 6,908 9,581 9,680 7,444LOCAL ANO INTERURBAN PASSENGER TRANSIT .. 4,743 4,456 6,124 7,447 7,212 8,327 5,070 4,700 6,538 7,565 7,321 8,431TRUCKING ANC WAREHOUSING ................. 6, 303 6,725 3,880 8,718 8,933 6,687 6,780 7,142 4,286 8,851 9,056 6,846WATER TRANSPORTATION ...................... 6, 387 6,772 4,765 9,031 9,495 7,174 6,962 7,332 5,395 9,465 9,859 7,687TRANSPORTATION BY AIR .................... 8,621 8,820 7,474 9,967 10,129 7,943 8,769 8,948 7,569 10,068 10,219 8,028PIPE LINE TRANSPORTATION ................. 9, 124 9, 166 249 10,107 10,107 9,299 9,349 249 10,124 10,124 _TRANSPORTATION SERVICES .................. 5,249 5,467 3,446 7,453 7,578 6,249 5,612 5,855 4,312 7,574 7,671 6,583
COMMUNICATION ................................ 5,947 6, 168 3,958 7,323 7,648 5,374 6,035 6,250 4, 124 7,405 7,721 5,411
PUBLIC UTILITIES ............................. 8,409 8,629 5,374 9,275 9,440 6,823 8,526 8,745 5,703 9,379 9,535 6,984
WHOLESALE TRACE .............................. 5,544 5,828 3,323 7,838 7,952 5,606 5,871 6,154 3,729 7,906 8,064 5,736
Digitized for FRASER http://fraser.stlouisfed.org/ Federal Reserve Bank of St. Louis
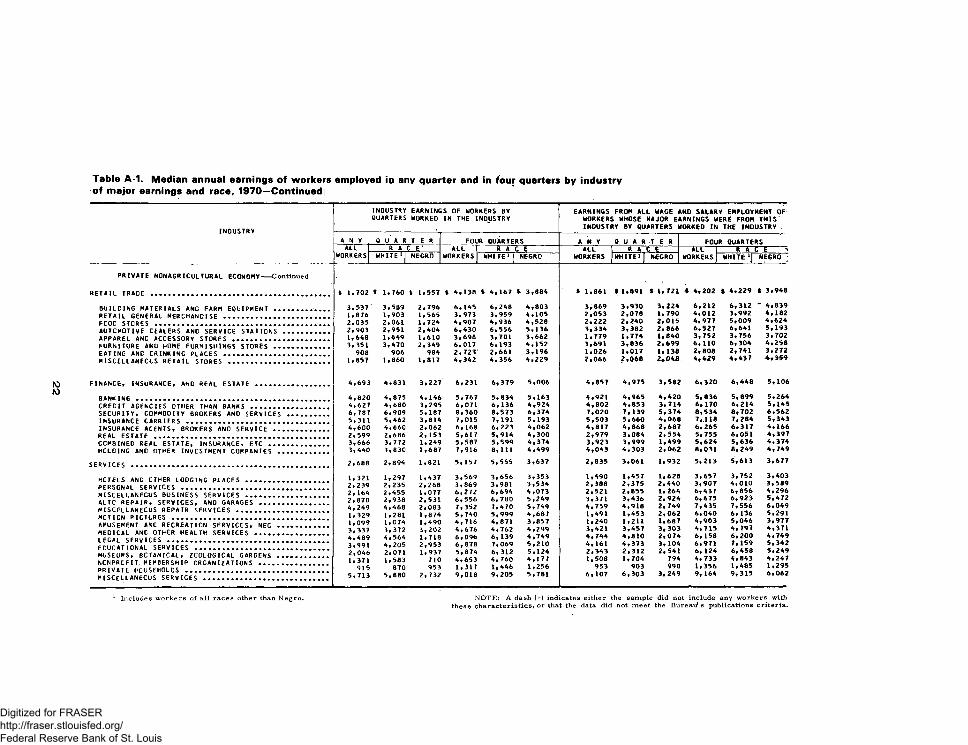
INOUSTRY
INDUSTRY EARNINGS OF WORKERS BY EARNINGS FROM ALL WAGE ANO SALARY EMPLOYMENT OFQUARTERS WORKED IN THE INDUSTRY WORKERS WHOSE MAJOR EARNINGS WERE FROM THIS
INOUSTRY BY QUARTERS WORKED IN THE INDUSTRY .
A N Y Q U A R T E R FOUR QUARTERS A N Y Q U A R T E R FOUR QUARTERSALL R A C E ' ALL R A C E ALL R A C E ALL ------- R A C E -------x
WORKERS W HITE1! NEGRO WORKERS WHITE1 | NEGRO WORKERS W HITE1 f NEGRO WORKERS WHITE *J NEGRO j
PRIVATE NONAGRICULTURAL ECONOMY--Continued
RETAIL TRADE ............................... .
BUILCING MATERIALS AND FARM EQUIPMENT ..RETAIL g e n e r a l m e r c h a n d i s e ..............FCOC STORES .............................. .AUTOMOTIVE CEALERS AND SERVICE STATIONSAPPAREL ANC ACCESSORY S T O R E S .......... .FURNITURE AND HOME FURNISHINGS STORES ..EATING AND DRINKING PLACES ............. .MISCELLANEOUS RETAIL STORES .......
FINANCE, INSURANCE, AND REAL ESTATE ......
B A N K I N G...................................CREDIT AGENCIES OTHER THAN BANKS .......SECURITY, COMMODITY BROKERS ANO SERVICESINSURANCE CARRIERS .......................INSURANCE AGENTS, BROKERS AND SERVICE ..REAL ESTATE ...............................COMBINED REAL ESTATE, INSURANCE, ETC ... HOLDING ANC OTHER INVESTMENT COMPANIES .
SERVICES .....................................
HOTELS AND OTHER LODGING PLACES .......PERSGNAL SERVICES .......................MISCELLANEOUS BUSINESS SERVICES .......AUTO REPAIR, SERVICES, AND GARAGES ....MISCELLANEOUS REPAIR SERVICES .........MOTION PICTURES .........................AMUSEMENT ANC RECREATION SERVICES, NECMEDICAL ANC OTHER HEALTH SERVICES .....LEGAL SERVICES ..........................ECUCATICNAL SERVICES ....................MUSEUMS, BOTANICAL, ZOOLOGICAL GARDENS NONPROFIT. MEMBERSHIP ORGANIZATIONS ....PRIVATE HOUSEHOLDS ......................MISCELLANEOUS SERVICES .................
S 1,702 * 1,760 % 1,557 $ 4,138 % 4,167 * 3,884 S 1,861 t 1,891 % 1,721 4 4,202 » 4,229 t 3,948
3,537 3,589 2,796 6,145 6,248 4,803 3,869 3,930 3,224 6,212 6,312 ~ 4,8391,876 1,903 1,565 3,973 3,959 4,105 2,053 2,078 1,790 4,012 3,992 4,1822,035 2,061 1,724 4,907 4,936 4,528 2,222 2,240 2,015 4,977 5,009 4,6242,903 2,951 2,404 6,430 6,556 5,136 3,334 3,382 2,866 6,527 6,641 5,1931,648 1,649 1,610 3,698 3,701 3,662 1,779 1,774 1,840 3,752 3,756 3,7023,351 3,470 2,349 6,017 6,193 4,152 3,691 3,836 2,699 6,110 6,304 4,258
908 906 984 2,723 2,661 3,196 1,026 1,017 1, 138 2,808 2,741 3,2721,857 1,860 1,817 4,342 4,356 4,229 2,066 2,068 2,048 4*429 4,437 4,359
4,693 4,831 3,227 6,231 6,379 5,006 4,857 4,975 3,582 6,320 6,448 5,106
4,820 4,875 4,146 5,767 5,834 5,163 4,921 4,965 4,420 5,836 5,899 5,2644,627 4,680 3,295 6,071 6,136 4,924 4,802 4,853 3,714 6,170 6,214 5,1456,787 6,909 5,187 8,360 8,573 6,374 7,020 7,139 5,374 8,534 8,702 6,5625,311 5,462 3,814 7,015 7, 191 5,193 5,503 5,660 4,068 7, .118 7,284 5,3434,600 4,660 2,062 6, 168 6,223 4,062 4,817 4,868 2,687 6,265 6,317 4,1662,599 2,686 2, 153 5,617 5,914 4,300 2,979 3,084 2,554 5,755 6,051 4,3973,666 3,772 1,249 5,587 5,599 4,374 3,923 3,999 1,499 5,624 5,636 4,3743,440 3,830 1,687 7,916 8,111 4,499 4,043 4,303 2,062 8,031 8,249 4,749
2,688 2,894 1,821 5, 157 5,555 3,637 2,835 3,061 1,932 5,213 5,613 3,677
1,321 1,297 1,437 3,569 3,656 3,353 1,490 1,457 1,628 3,657 3,752 3,4032,239 2,235 2,268 3,869 3,981 3,534 2,388 2,375 2,440 3,907 4,010 3,5892, 164 2,455 1,077 6,272 6,694 4,073 2,521 2,855 1,264 6,437 6,856 4,2962,870 2,938 2,531 6,556 6,780 5,249 3,371 3,436 2,924 6,675 6,923 5,4724,249 4,468 2,083 7,352 7,470 5,749 4,759 4,918 2,749 7,435 7,556 6,0491,329 1*281 1,874 5,740 5,999 4,687 1,491 1,453 2,062 6,040 6,136 5,2911,099 1,074 1,490 4,716 4,871 3,857 1,240 1,211 1,687 4,903 5,046 3,9773,337 3,372 3,202 4,676 4,762 4,299 3,421 3,457 3,303 4,715 4,797 4,3714,489 4,564 1,718 6,096 6,139 4,749 4,744 4,810 2,074 6, 158 6,200 4,7493,991 4,205 2,953 6,878 7,069 5,210 4,161 4,373 3, 104 6,971 7,159 5,3422,046 2,071 1,937 5,874 6,312 5,124 2,343 2,312 2,541 6, 124 6,458 5,2491,371 1,583 710 4,653 4, 760 4,177 1,508 1,704 794 4,733 4,843 4,247
915 870 953 1,317 1,446 1,256 953 903 990 1,356 1,485 1,2955,713 5,880 2,732 9,018 9,205 5,781 6,107 6,303 3,249 9, 164 9,315 6,062
Includes w ork ers of a l l races other than N egro . N O TE : A dash ( - ) indicates either the sam ple did not include any w orkers with these characteristics, or that the data did not meet* the B ureau 's publications crite ria .
Digitized for FRASER http://fraser.stlouisfed.org/ Federal Reserve Bank of St. Louis
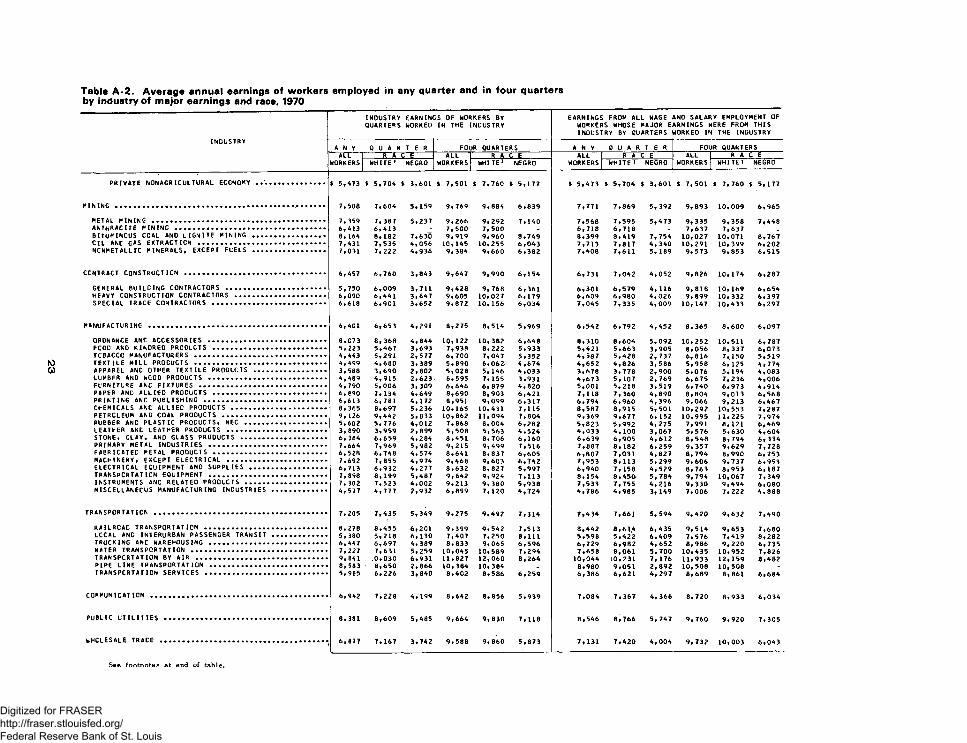
INOUSTRYQUARTERS
EARNINGS OF WORKERS BY WORKED IN THE INDUSTRY
EARNINGS FROM ALL WAGE AND SALARY EMPLOYMENT OF WORKERS WHOSE MAJOR EARNINGS WERE FROM THIS INDUSTRY BY QUARTERS WORKEO IN THE INDUSTRY
INDUSTRYA N Y Q U A R T E R FOUR QUARTERS A N Y Q U A R T E R FOUR QUARTERSALL
WORKERSR A C E ALL
WORKERSR A C E ALL
WORKERSR A C E ALL
WORKERSR A C E
WHITE1 NEGRO WHITE1 NEGRO WHITE 1 NEGRO WHITE1 NEGRO
PRIVATE NONAGRICULTURAL ECONOMY ................. $ 5,473 $ 5,704 $ 3,601 % 7,501 t 7,760 $ 5,177 $ 5,473 t 5,704 % 3,601 $ 7,501 t 7,760 t 5,177
MINING ............................................ ........ 7,508 7,604 5,159 9,769 9,884 6,839 7,771 7,869 5, 392 9,893 10,009 6,965
METAL MINING ........................................... 7,359 7,387 5,237 9,266 9,292 7,140 7,568 7,595 5,473 9,335 9,358 7,448ANTHRACITE m i n i n g ..................................... 6, A13 6,413 - 7,500 7*500 - 6,718 6,718 _ 7,637 7,637 _BITUMINOUS COAL AND LIGNITE MINING .................. 8, 164 8,182 7,630 9,919 9,960 8,749 8,399 8,419 7,754 10,027 10,071 8,767CIL ANC GAS EXTRACTION ................................ 7,431 7,535 4,056 LO,145 10,255 6,043 7,713 7,817 4, 340 10,291 10,399 6,202NCNMET ALL FC MINERALS, EXCEPT FUELS .................. 7,031 7,222 4,936 9,384 9,660 6,382 7,408 7,611 5, 189 9,573 9,853 6,515
CONTRACT CONSTRUCTION ................................... 6,457 6,760 3,843 9,647 9,990 6,154 6,731 7,042 4,052 9,826 10,174 6,287
GENERAL 8UILCING CONTRACTORS ........... ............. 5,750 6,009 3,711 9,428 9,768 6,361 6,301 6,579 4, 116 9, 818 10,169 6,654HEAVY CONSTRUCTION CONTRACTORS ...................... 6,090 6,441 3,647 9,605 10,027 6,179 6,609 6,980 4,026 9,899 10,332 6,397SPECIAL TRACE CONTRACTORS ............................ 6,618 6,901 3,652 9,872 10,156 6,034 7,045 7,335 4,009 10,147 10,433 6,297
MANUFACTURING ............................................ 6,401 6,653 4,291 8,275 8,514 5,969 6,542 6,792 4,452 8,365 8,600 6,097
ORDNANCE ANC ACCESSORIES .......................... . 8, C73 8, 368 4,844 LO,122 10,382 6,648 8,310 8,604 5,092 10,252 10,511 6,787FCCD AND KINORED PRODUCTS ............................ 5,223 5,467 3,693 7,938 8,222 5,933 5,421 5,663 3,905 8,056 8,337 6,073TOBACCO MANUFACTURERS ................................. 4,443 5,291 2,577 6,700 7,047 5,352 4,587 5,428 2, 737 6,816 7,150 5,519TEXTILE MILL PRODUCTS ................................. 4,499 4,680 3,389 5,890 6,062 4,674 4,652 4,826 3, 586 5,958 6, 125 4,774APPAREL AND OTHER TEXTILE PROCLCTS .................. 3,588 3,690 2,802 5,028 5, 146 4,033 3,678 3,778 2,900 5,076 5, 194 4,083LUMBER ANO WCOD PRODUCTS ............................. 4,489 4,915 2,623 6,595 7,155 3,931 4,673 5,107 2,769 6,675 7,236 4,006FURNITURE ANC FIXTURES .............................. . 4,790 5,006 3,309 6,646 6,879 4,820 5,001 5,218 3,519 6,740 6,973 4,914PAPER AND ALLIED PRODUCTS .................. .......... 6,890 7, 134 4,649 8,690 8,903 6,421 7,118 7,360 4,890 8,804 9,013 6,568PRINTING ANC PUBLISHING .............................. 6,613 6,781 4,172 8,951 9,099 6,317 6,794 6,960 4,396 9,066 9,213 6,467CHEMICALS ANC ALLIED PRODUCTS ........................ 8,365 8,697 5,236 10,165 10,431 7,115 8,587 8,915 5, 501 10,292 10,553 7,287PETROLEUM AND COAL PRODUCTS .......... ............... 9, 126 9,442 5,833 10,862 11,094 7,804 9,369 9,677 6, 152 10,995 11.225 7,974RUBBER ANC PLASTIC PRODUCTS, NEC .................... 5,602 5,776 4,012 7,868 8,004 6,282 5,823 5,992 4,275 7,991 8, 121 6,469LEATHER ANC LEATHER PRODUCTS ......................... 3, 890 3,959 2,899 5,508 5,563 4,524 4,033 4,100 3,067 5,576 5,630 4,604STONE, CLAY, AND GLASS PROOUCTS ..................... 6, 384 6,659 4,284 8,451 8,706 6,160 6,639 6,905 4,612 8,548 8,794 6,334PRIMARY METAL INDUSTRIES ............................. 7,664 7,969 5,982 9,215 9,499 7,516 7,887 8,182 6,259 9,357 9,629 7,728FABRICATED METAL PRODUCTS ...................... ..... 6,528 6,748 4,574 8,641 8,837 6,605 6,807 7,031 4,827 8,794 8,990 6,753MACHINERY, EXCEPT ELECTRICAL ......................... 7,692 7,855 4,974 9,468 9,603 6,742 7,953 8,113 5, 299 9,606 9,737 6,953ELECTRICAL EQUIPMENT AND SUPPLIES ................... 6,713 6,932 4,277 8,632 8,827 5,997 6,940 7, 158 4, 529 8,763 8,953 6, 187TRANSPORTATION EQUIPMENT ............................. 7,898 8, 199 5,487 9,642 9,924 7,113 8,154 8,450-' 5, 784 9,794 10,067 7,349INSTRUMENTS AND RELATED PRODUCTS .................... 7,302 7,523 4,002 9,213 9,380 5,938 7,533 7,755 4,216 9,330 9,494 6,080m i s c e l l a n e o u s m a n u f a c t u r i n g i n d u s t r i e s ............. 4,577 4,777 2,932 6,899 7, 120 4,724 4,786 4,985 3, 149 7,006 7,222 4,888
TRANSPORTATION ........................................... 7,205 7,435 5,349 9,275 9,492 7,314 7,434 7,661 5, 594 9,420 9,632 7,490
RAILROAC TRANSPORTATION .............................. 8,278 8,455 6,201 9,399 9,542 7,513 8,442 8,61.4 6, 435 9,514 9,653 7,680LCCAL AND INTERURBAN PASSENGER TRANSIT ............. 5,380 5,218 6,130 7,407 7,250 8,111 5,598 5,422 6,409 7,576 7,419 8,282TRUCKING ANC WAREHOUSING .......... ................. . 6,447 6,697 4,389 8,833 9,065 6,596 6*729 6,982 4, 652 8,986 9,220 6,735WATER TRANSPORTATION .................................. 7,227 7,631 5,259 10,045 10,589 7,294 7,658 8,061 5, 700 10,435 10,952 7,826TRANSPORTATION BY AIR ................................. 9,841 .0,030 6,931 11,827 12,060 6,264 10,044 10,231 7, 176 11.933 12,159 8,482PIPE LINE TRANSPORTATION ............................. 8,583 8,650 2,866 10,384 10,384 _ 8,980 9,051 2,892 10,508 10,508 -TRANSPORTATION SERVICES ............... ............... 5,985 6,226 3,840 8,402 8,586 6,259 6,386 6,621 4,297 8,689 8,861 6,684
c o m m u n i c a t i o n ............................................ 6,942 7,228 4,199 8,642 8,856 5,939 7,084 7,367 4, 366 8,720 8,933 6,034
p u b l i c u t i l i t i e s ......................................... 8,381 8,609 5,485 9,664 9,830 7,118 8,546 8 j 766 5, 747 9,760 9,920 7,305
w h o l e s a l e t r a c e .......................................... 6,877 7,167 3,742 9,588 9,860 5,873 7,131 7,420 4,004 9,732 10,003 6,043
Digitized for FRASER http://fraser.stlouisfed.org/ Federal Reserve Bank of St. Louis
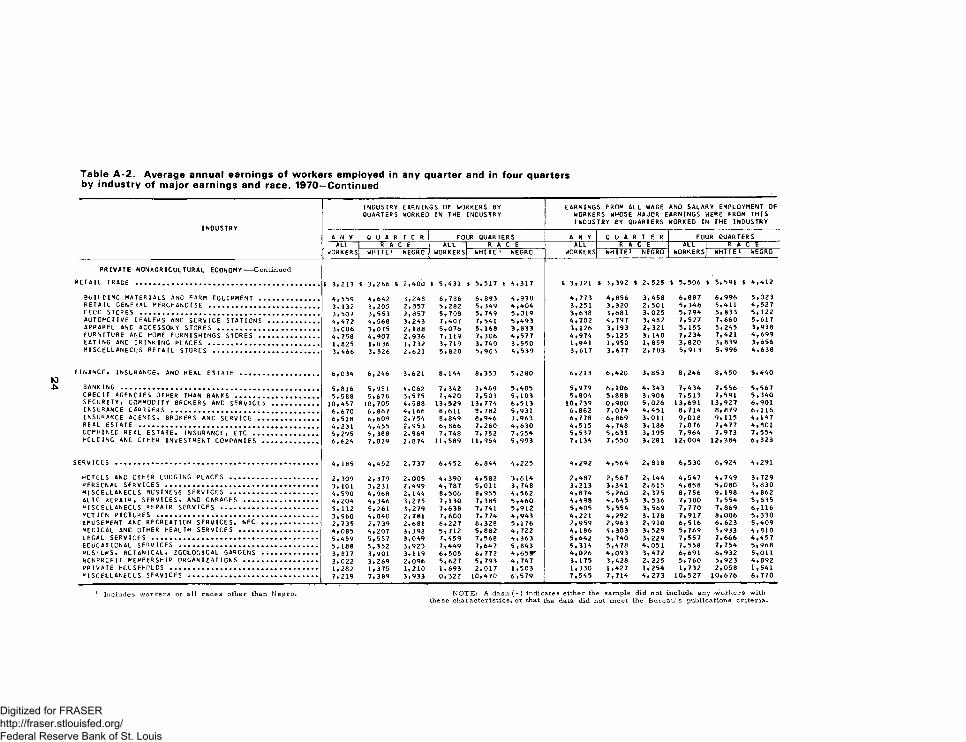
INOUSTRY
INDUSTRY EARNINGS OF WORKERS BY QUARTERS WORKED IN THE INDUSTRY
EARNINGS FROM ALL WAGE AND SALARY EMPLOYMENT OF WORKERS WHOSE MAJOR EARNINGS WERE FROM THIS INOUSTRY BY QUARTERS WORKED IN THE INDUSTRY
A N Y Q U A FI T E R FOUR QUARTERS A N Y Q U A Ft T E R FOUR QUARTERSALL
' WORKERSR A C E ALL
WORKERSR A X t ALL
WORKERSR A I T ALL
WORKERSk A Ufc
WHITE1 NEGRO WHITE i NEGRO WHITE1 NEGRO WHITE i NEGRO
PRIVATE NONAGRICULTURAL ECONOMY-- Continued
RETAIL TRACE ................................................... $ 3,213 $ 3,286 1i 2,400 $ 5,431 $ 5,517 1i 4,317 t 3,321 $ 3,392 ii 2,525 $ 5,506 * 5,591 !i 4,412
BUILCING MATERIALS ANC FARM EQLIPMENT .............. . A, 559 4,642 3,248 6,786 6, 893 4,938 4,773 4,856 3,458 6,887 6,996 5,023RETAIL GENERAL MERCHANDISE .............................. 3, 132 3,205 2,357 5,282 5, 349 4,404 3,251 3,320 2, 501 5, 348 5,411 4,527FCOC STORES ................................................. 3,507 3,553 2,857 5,708 5, 749 5,019 3,638 3,681 3,025 5,794 5, 833 5, 122AUTOMOTIVE DEALERS ANC SERVICE STATIONS .............. 4,472 4,568 3,243 7,407 7,541 5,493 4,702 4,797 3, 482 7,527 7,660 5,617APPAREL ANC ACCESSORY STORES ............................ 3, C06 3,075 2,188 5,076 5, 168 3,833 3, 126 3,193 2, 321 5, 155 5,245 3,938FURNITURE ANC HOME FURNISHINGS STORES ................ 4,758 4,907 2,936 7,119 7,306 4,577 4,974 5,125 3, 140 7,234 7,421 4,699EATING ANC CRINKING PLACES ............................... 1,825 1,836 1,732 3,719 3,740 3,550 1,941 1,950 1, 859 3,820 3,839 3,656MISCELLANEOUS RETAIL STORES ............................. 3,466 3,526 2,621 5,820 5,903 4,539 3,617 3,677 2, 783 5, 913 5,996 4,638
FINANCE, INSURANCE, AND REAL ESTATE ...................... 6,034 6,246 3,621 8, 144 8, 353 5,2 80 6,213 6,420 3,853 8,246 8,450 5,440
BANKING .................................................... 5,816 5,951 4,062 7,342 7,469 5,405 5,979 6,106 4,343 7,434 7, 556 5,567CRECIT AGENCIES OTHER THAN BANKS ....................... 5,588 5,678 3,575 7,420 7,503 5,103 5,804 5,888 3,906 7,513 7,591 5,340SECURITY, COMMODITY BROKERS AND SERVICES ............. 10,457 10,705 4,588 13,529 13,774 6,513 10,739 0,980 5,026 13,691 13,927 6,901INSURANCE CARRIERS ......................................... 6,670 6,867 4,166 8,611 8,782 5,931 6,882 7,074 4,451 8, 714 8,879 6,116INSURANCE AGENTS, BROKERS ANC SERVICE ................. 6,518 6,609 2,7 54 8,849 8,946 3,963 6,778 6,869 3,011 9,018 9,115 4, 147REAL ESTATE .................................................. 4,231 4,455 2,953 6,866 7,260 4,630 4,515 4,748 3, 186 7,076 7,477 4,801CCMBINEC REAL ESTATE, INSURANCE, ETC .................. 5,295 5,388 2,969 7,748 7,752 7,554 5,537 5,631 3, 195 7,964 7,973 7,554HOLDING ANC OTHER INVESTMENT COMPANIES ............... 6,624 7,029 2,8 74 11,589 11,964 5,993 7, 134 7,550 3,281 12,004 12,384 6,323
SERVICES ........................................................ 4, 185 4,452 2,737 6,452 6,844 4,225 4,292 4,564 2,818 6,530 6,924 4,291
HOTELS ANC OTHER LODGING PLACES ........................ 2,309 2,379 2,005 4,390 4,582 3,614 2,487 2,567 2, 144 4,547 4,749 3,729PERSONAL SERVICES .......................................... 3, 101 3,231 2,499 4,787 5,011 3,748 3,213 3,341 2,615 4, 858 5,080 3,830MISCELLANEOUS BUSINESS SERVICES ........................ 4,590 4,968 2,144 8,506 8,955 4,562 4,874 5,260 2,375 8,756 9, 198 4,862AUTO REPAIR, SERVICES, AND GARAGES .................... 4,204 4,346 3,275 7,130 7,385 5,460 4,498 4,645 3, 536 7,300 7,554 5,635MISCELLANEOUS REPAIR SERVICES ........................... 5, 112 5,261 3,279 7,638 7,741 5,912 5,405 5,554 3, 569 7,770 7,869 6,116MOTION PICTURES ............................................ 3,960 4,040 2,781 7,600 7, 774 4,943 4,221 4,292 3, 178 7,917 8,086 5,330AMUSEMENT ANC RECREATION SERVICES, NEC ............... 2,735 2,739 2,681 6,227 6,328 5,176 2,959 2,963 2,910 6, 516 6, 623 5,409MEDICAL ANC OTHER HEALTH SERVICES ...................... 4,085 4,207 3,398 5,712 5,882 4,722 4, 186 4,303 3, 529 5,769 5,933 4,810LEGAL SERVICES .............................................. 5,459 5,557 3,049 7,459 7,568 4,363 5,642 5,740 3,229 7,557 7,666 4,457EDUCATIONAL SERVICES ...................................... 5,188 5, 352 3,923 7,449 7,647 5,843 5,314 5,478 4,051 7, 558 7,754 5,968MUSEUMS, BOTANICAL, ZOOLOGICAL GARDENS ................ 3,817 3,901 3,119 6,505 6, 772 4,659* 4,026 4,093 3,472 6,691 6,932 5,011NONPROFIT MEMBERSHIP ORGANIZATIONS .................... 3, C22 3,269 2,096 5,627 5,793 4,747 3,175 3,428 2,225 5,760 5,923 4,892PRIVATE HOUSEHOLDS ......................................... 1,282 1,375 1,210 1,693 2,017 1,503 1,330 1,427 1,254 1,732 2,058 1,541MISCELLANEOUS SERVICES .................................... 7,219 7,389 3,933 0,322 10,470 6,5 79 7,545 7,714 4, 273 10,527 10,676 6, 770
Includes w orkers of a ll races other than N egro . N O TE : A dash ( - ) indicates either the sample did not include any -workers with these characteristics, or that the data did not m eet the bu reau 's publications crite ria .
Digitized for FRASER http://fraser.stlouisfed.org/ Federal Reserve Bank of St. Louis
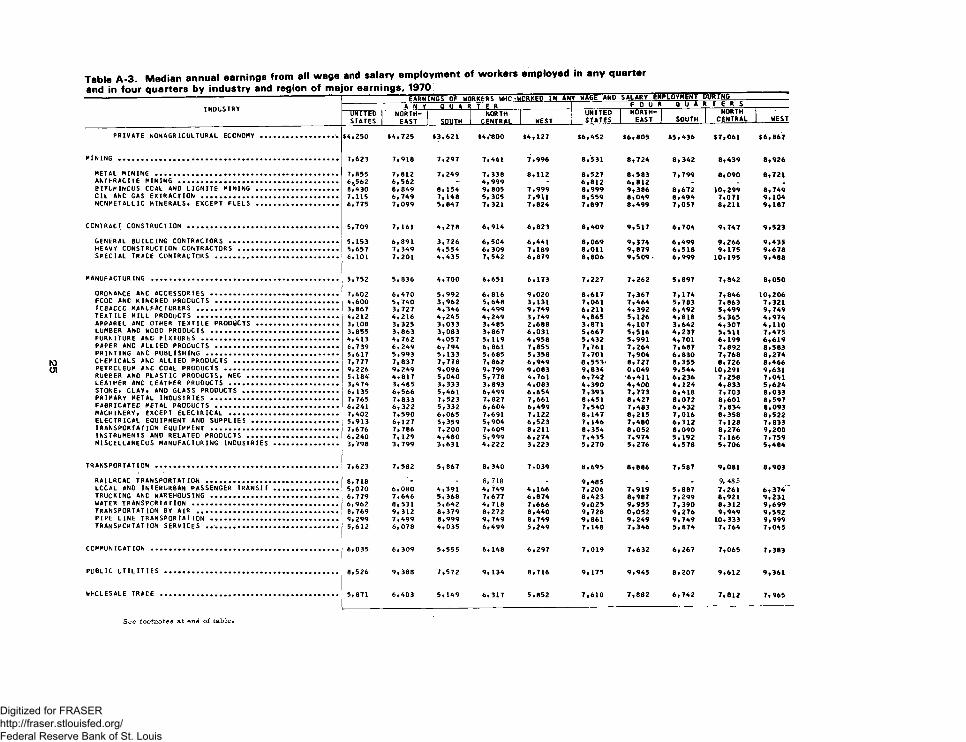
INDUSTRYEARNINGS OF WORKERS WHO ‘WORKED IN AN
A N Y Q U A R T E RY WAGE AND SALARY EM
F O U RIPLOYMENT I
Q U A PHIRINGI T E R S
UNITEDSTATES
NORTH- 1 EAST 1 SOUTH
NORTHCENTRAL WEST
UNITEDSTATES
NORTHEAST SOUTH
NORTHCENTRAL WEST
PRIVATE NONAGRICULTURAL ECONOMY ......... ........ ’. $4,250 $4,725 $3,621 $4 ,*800 $4,127 $6,452 $6,805 $5,436 $7,061 $6,867
MINING ....................................................... 7,623 7,918 7,297 7,461 7,996 8,531 8,724 8,342 8,439 8,926
METAL MINING ............................................. 7,855 7,812 7,249 7,338 8,112 8,527 8,583 7,799 8,090 8,721ANTHRACITE MINING ........................................ 6,,562 6,562 - 4,999 - 6,812 6,812 _ _ _BITUMINCUS COAL AND LIGNITE MINING .................... 8,430 8,849 8,154 9,805 7,999 8,999 9,386 8,672 10,299 8,749OIL ANC GAS EXTRACTION .................................. 7,115 6,749 7,148 5,305 7,911 8,559 8,049 8,494 7,071 9,104NCNMETALLIC MINERALS, EXCEPT FLELS .......*............ 6,775 7,099 5,847 7,321 7,824 7,897 8,499 7,057 8,211 9,187
CONTRACT CONSTRUCTION ................................... . 5,709 7, 161 4,278 6,914 6,823 8,409 9,517 6,704 9,747 9,523
GENERAL 8UILCING CONTRACTORS ........................... 5,153 6,891 3,726 6,504 6,441 8,069 9,374 6,499 9,266 9,435HEAVY CONSTRUCTION CONTRACTORS ......................... 5,657 7,349 4,554 6,309 7,189 8,011 9,879 6,518 9,175 9,678SPECIAL TRACE CONTRACTORS .............................. 6,101 7,201 4,435 7,542 6,879 8,806 9,509 • 6,999 10,195 9,488
m a n u f a c t u r i n g .,............................................ 5,752 5,836 4,700 6,651 6,173 7,227 7,262 5,897 7,842 8,050
ORONANCE ANC ACCESSORIES ................................ 7,602 6,470 5,992 6,816 9,020 8,617 7,367 7,174 7,846 10,206FCOD ANC KINCRED PRODUCTS .............................. 4,600 5,740 3,962 5,648 3,131 7,061 7,464 5,783 7,863 7,321TOBACCO MANUFACTURERS ................................... 3,867 3,727 4,346 4,499 9,749 6,211 4,392 6,492 5,499 9,749TEXTILE MILL PRODUCTS ................................... 4,212 4,216 4,245 4,249 3,749 4,865 5,126 4,818 5,365 4,974APPAREL ANC OTHER TEXTILE PRODUCTS .................... 3,108 3,325 3,033 3,485 2,688 3,871 4,107 3,642 4,307 4,110LUMBER ANC WCOD PRODUCTS ................................ 3,855 3,863 3,083 3,867 6,031 5,667 5,516 4,237 5,511 7,475FURNITURE ANC FIXTURES ................................. 4,413 4,762 4,057 5, 119 4,958 5,432 5,991 4,701 6,199 6,619PAPER AND ALLIED PRODUCTS ............................... 6,739 6,249 6,794 6,861 7,855 7,761 7,264 7,687 7,892 8,583PRINTING ANC PUBLISHING ................................. 5,617 5,993 5,133 5,685 5,358 7,701 7,904 6,830 7,768 8,274CHEMICALS ANC ALLIED PRODUCTS .......................... 7,777 7,837 7,778 7,662 6,949 8,553‘ 8,727 8,355 8,726 8,466PETRCLEUM ANC COAL PRODUCTS ................... ......... 9,226 9,249 9,096 9,799 9,083 9,834 0,049 9,544 10,291 9,631RUBBER AND PLASTIC PRODUCTS, NEC ...................... 5,184 4,817 5,040 5,778 4,761 6,742 6,411 6,236 7,258 7,041LEATHER ANC LEATHER PRODUCTS ........................... 3,474 3,485 3,333 3,893 4,063 4,390 4,400 4,124 4,833 5,624STONE, CLAY, AND GLASS PRODUCTS ........................ 6, 135 6,566 5,461 6,499 6,654 7,393 7,773 6,418 7,703 8,033PRIMARY METAL INDUSTRIES ................................ 7,765 7,833 7,523 7,827 7,661 8,451 8,427 8,072 8,601 8,597FABRICATED METAL PRODUCTS .............................. 6,241 6,322 5,332 6,604 6,499 7,540 7,463 6,432 7,834 8,093MACHINERY, EXCEPT ELECTRICAL ........................... 7,402 7,590 6,065 7,691 7,122 8,147 8,215 7,016 8,358 8,522ELECTRICAL EQUIPMENT AND SUPPLIES ..................... 5,913 6, 127 5,359 5,904 6,523 7,146 7,480 6,312 7,128 7,833TRANSPORTATION EQUIPMENT ................................ 7,676 7,786 7,200 7,609 8,211 8,354 8,052 8,090 8,276 9,200INSTRUMENTS AND RELATED PRODUCTS ...................... 6,240 7, 129 4,480 5,999 6,274 7,435 7,974 5,192 7, 166 7,759MISCELLANEOUS MANUFACTURING INDUSTRIES ................ 3,798 3,799 3,631 4,222 3,223 5,270 5,276 4,578 5,706 5,484
TRANSPORTATION ............................................. 7,623 7,582 5,867 8,340 7-039 8,695 8,886 7,587 9,081 8,903
RAILROAD TRANSPORTATION ................................. 8,718 _ 8, 718 9,485 _ _ 9, 485LCCAL AND INTERURBAN PASSENGER TRANSIT ................ 5,070 6,080 4,391 4,749 4,166 7,206 7,919 5,887 7,261 6,374TRUCKING ANC WAREHOUSING ................................ 6,779 7,646 5,368 7,677 6,874 6,423 8,987 7,299 8,921 9,231WATER TRANSPORTATION .................................... 6,962 8,531 5,642 4,718 7,666 9,025 9,955 7,390 8,312 9,699TRANSPORTATION BY AIR ................................... 8,769 9,312 8,379 8,272 8,440 9,728 0,052 9,276 9,949 9,592PIPE LINE TRANSPORTATION ............................. 9,299 7,499 8,999 9,749 8,749 9,861 9,249 9,749 10,333 9,999t r a n s p o r t a t i o n s e r v i c e s .............................. 5,612 6,078 4,035 6,499 5,249 7,148 7,346 5,874 7,764 7,045
COMMUNICATION ............................................... 6,035 6,309 5,555 6, 148 6,297 7,019 7,632 6,267 7,065 7,383
PUBLIC UTILITIES ........................................... 8,526 9,388 7,572 9, 134 8,716 9,175 9,945 8,207 9,612 9,361
WHOLESALE TRACE ............................................ 5,871 6,403 5,149 6,317 5,852 7,610 7,882 6,742 7,812 7.965
Digitized for FRASER http://fraser.stlouisfed.org/ Federal Reserve Bank of St. Louis
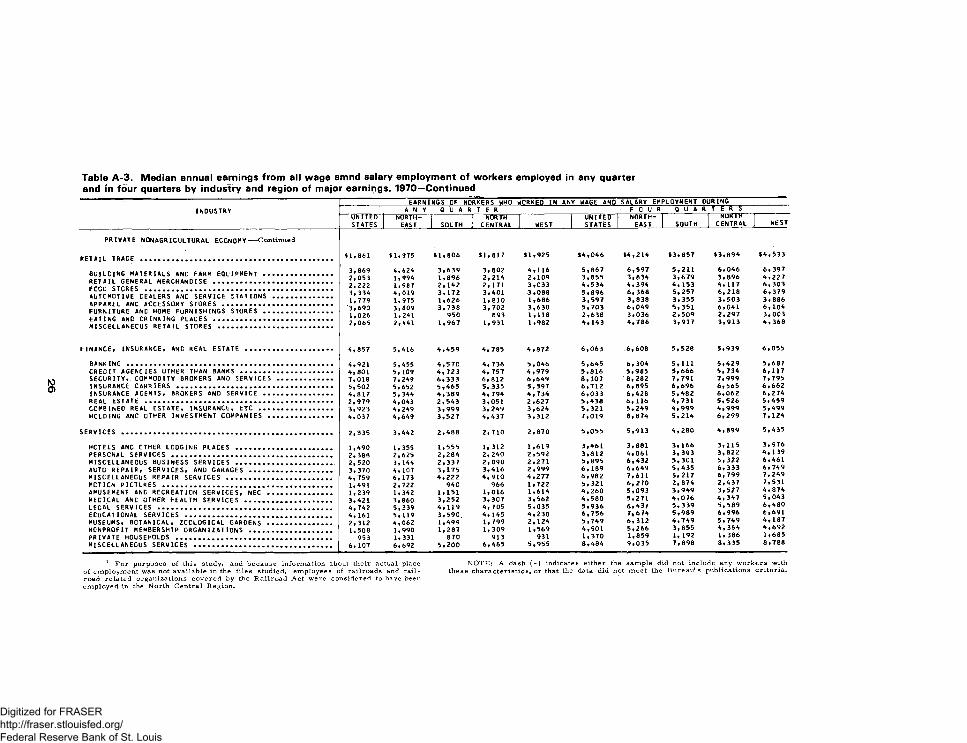
INDUSTRY
PRIVATE NONAGRICULTURAL ECONOMY
______________ EARNINGS OF WORKERS WHO WORKED IN ANY WAGE AND SALARY EMPLOYMENT DURINGA N Y Q U A R T E R : F O U R Q U A R T E R S
UNITED NORTH- I I NORTH I I UNITED l NORTH- I | NUKIHSTATES EAST l SOUTH l CENTRAL l WEST | STATES I EAST I SOUTH | CENTRAL
ontinued
WEST
RETAIL TRAQE ...............................,
BUILCING MATERIALS AND FARM EQUIPMENT .RETAIL GENERAL MERCHANDISE ..............FCCC STORES ..............................AUTOMOTIVE CEALERS AND SERVICE STATIONSAPPAREL ANC ACCESSORY STORES ......... .FURNITURE ANC HOME FURNISHINGS STORES .EATING ANC CRINKING PLACES .............MISCELLANEOUS RETAIL STORES ...........
FINANCE* INSURANCE* ANC REAL ESTATE ......
BANKING ...................................CREDIT AGENCIES OTHER THAN BANKS .......SECURITY*.COMMODITY BROKERS AND SERVICESINSURANCE CARRIERS .......................INSURANCE AGENTS, BROKERS ANO SERVICE ..REAL ESTATE ...............................COMBINED REAL ESTATE, INSURANCE, ETC ... HOLDING ANC OTHER INVESTMENT COMPANIES .
SERVICES ......................................
HOTELS AND CTHER LODGING PLACES ........ .PERSONAL SERVICES ........................ .MISCELLANEOUS BUSINESS SERVICES ........AUTO REPAIR, SERVICES, AND GARAGES .....MISCELLANEOUS REPAIR S E RV IC ES.......... .MOTION PICTURES .......................... .AMUSEMENT ANC RECREATION SERVICES, NEC .,MEDICAL ANC OTHER HEALTH SE RVICES.......LEGAL SERVICES .............................ECUCATIONAL SERVICES ......................MUSEUMS, BOTANICAL, ZOOLOGICAL GARDENS ..NONPROFIT MEMBERSHIP ORGANIZATIONS ......PRIVATE HOUSEHOLDS ....................... .MISCELLANEOUS SERVICES .................. .
$1,861 $1,975 $1,806 $1,817 $1,925 $4,046 $4,214 $3,857 $3,894 $4,533
3,869 4,624 3,639 3,802 4,116 5,867 6,597 5,211 6,046 6,3972,053 1,994 1,896 2,214 2,109 3,855 3,834 3,679 3,896 4,2272,222 1,987 2,142 2, 171 3,033 4,534 4,394 4,153 4, 117 6,3033,334 4,019 3,172 3,401 3,088 5,896 6,368 5,257 6,218 6,3791,779 1,975 1,626 1,810 1,686 3,597 3,838 3,355 3,503 3,886'3,690 3,809 3,738 3,702 3,630 5,703 6,049 5,351 6,041 6,1061,026 1,241 950 893 1,118 2,638 3,036 2,509 2,297 3,0032,065 2,441 1,967 1,931 1,982 4,143 4,786 3,917 3,913 4,368
4,857 5,416 4,459 4,785 4,872 6,063 6,608 5,528 5,939 6,055
4,921 5,455 4,570 4,736 5,046 5,645 6,304 5,111 5,429 5,6874,801 5, 109 4,723 4, 757 4,979 5,816 5,985 5,666 5,734 6,1177,018 7,249 6,333 6,812 6,649 8,107 8,282 7,791 7,999 7.7955,502 5,652 5,465 5,335 5,597 6,712 6,895 6,696 6,565 6,6624,817 5,344 4,389 4,794 4,734 6,033 6,428 5,482 6,062 6,2742,979 4,043 2,543 3,051 2,627 5,438 6,116 4,731 5,526 5,4593,923 4,249 3,999 3,249 3,624 5,321 5,249 4,999 4,999 5.4994,037 4,649 3,527 4,437 3,312 7,019 8,874 5,214 6,299 7,124
2,835 3,442 2,488 2,710 2,870 5,055 5,913 4,280 4,899 5,435
1,490 1,355 1,555 1,312 1,619 3,461 3,881 3, 166 3,115 3,9762, 388 2,625 2,284 2,240 2,592 3,812 4,061 3,393 3,822 4,1392,520 3,144 2,337 2,090 2,271 5,895 6,432 5,301 5,322 6,4613,370 4, 107 3,175 3,416 2,999 6,189 6,649 5,435 6,333 6,7494,759 6, 173 4,222 4,910 4,277 6,982 7,611 i, 217 6,799 7,2491,491 2,722 940 966 1,722 5.321 6,270 2,874 2,437 7,5311,239 1,342 1,151 1,016 1,614 4,260 5,093 3,949 3,527 4,8743,421 3,860 3,252 3,307 3,562 4,580 5,271 4,076 4,347 5,0434,742 5,339 4,119 4,705 5,035 5,936 6,437 5,339 5,589 6,4804, 161 5,119 3,590. 4, 145 4,230 6,756 7,674 5,989 6,996 6,6912,312 4,062 1,499 1,799 2,124 5,749 6,312 4,749 5,749 4,1871.508 1,990 1,287 1,309 1,569 4,501 5,266 3,855 4,364 4,692953 1,331 870 913 931 1,370 1,859 l, 192 1,386 1,685
6, 107 6,692 5,200 6,465 5,955 8,484 9,035 7,898 8,335 8,788
1 F o r purposes of this study, and because information about their actual place of employment was not availab le in the files studied, employees of ra ilroads and ra i l road re lated organizations covered by the R ailro ad Act were considered to have been em ployed in the North Centra] Region.
N O TE : A dash ( - ) indicates either the sample did not include any w orkers with these characteristics, or that the data did not m eet the B ureau 's publications crite ria .
Digitized for FRASER http://fraser.stlouisfed.org/ Federal Reserve Bank of St. Louis
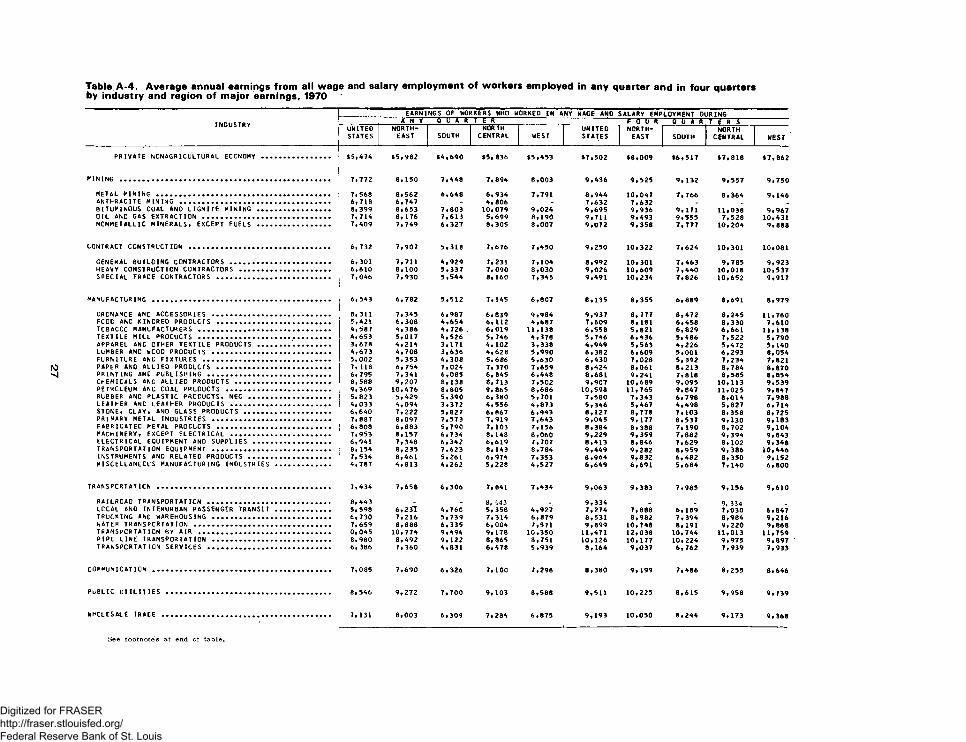
IO
EARNINGS OF WORKERS WHO WORKED IN ANY WAGE ANO SALARY EMPLOYMENT DURINGQ L A R — --------- --------------------------------F O U R Q U A R
UNITED NORTH NORTH UNITED NORTH NORTHSTATES EAST SOUTH CENTRAL WEST STATES EAST SOUTH CENTRAL WEST
PRIVATE NONAGRICULTURAL ECONOMY
MINING ................................ ,
m e t a l m i n i n g .......................ANTHRACITE MINING ................. ,BITUMINOUS COAL ANO LIGNITE MININGOIL ANC GAS EXTRACTION ............NCNMETALLIC MINERALS* EXCEPT FUELS
CONTRACT CONSTRUCTION ..........
GENERAL BUILDING CONTRACTORS . HEAVY CONSTRUCTION CONTRACTORS SPECIAL TRACE CONTRACTORS ....
MANUFACTURING ................................,
ORDNANCE ANC ACCESSORIES ...............FCOC AND KINDRED PRODUCTS ............TCBACCC MANUFACTURERS ................. .TEXTILE MILL PRODUCTS ................. .APPAREL ANC OTHER TEXTILE PROOUCTS ....LUMBER ANC WCOD PRODUCTS ..............FURNITURE ANC FIXTURES ................ .PAPER AND ALLIED PRODUCTS .............PRINTING ANC PUBLISHING ................CHEMICALS AND ALLIED PRODUCTS ........PETRCLEUM ANC COAL PRODUCTS ..........RUBBER AND PLASTIC PRODUCTS, NEC .....LEATHER ANC LEATHER PRODUCTS .........STONE, CLAY, AND GLASS PROD UC TS.......PRIMARY METAL INDUSTRIES ...............FABRICATED METAL PROCUCTS ............MACHINERY, EXCEPT ELECTRICAL ......... .ELECTRICAL EQUIPMENT AND SUPPLIES ....TRANSPORTATION EQUIPMENT ..............INSTRUMENTS AND RELATED PROD UC TS......MISCELLANECUS MANUFACTURING INDUSTRIES
TRANSPORTAT ICN ........................... .
RAILROAD TRANSPORTATION ...............,LOCAL AND INTERURBAN PASSENGER TRANSITTRUCKING ANC WAREHOUSING ...............WATER TRANSPORTATION ..................TRANSPORTATION BY AIR ................. .PIPE LINE TRANSPORTATION ..............TRANSPORTATION SERVICES ...............
COMMUNICATICN
PUBLIC UTILITIES
WHOLESALE TRACE
$5,474 $5,982 $4,690 $5,836 $5,453
7,772 8, 150 7,448 7,894 8,003
7,568 8.562 6,648 6,934 7,7916,718 6,747 - 4,806 . -8,399 8,653 7,803 10*079 9,0247,714 8,176 7,613 5,699 8,1907,409 7,749 6,327 8,305 8,007
6,732 7,907 5,318 7,676 7,450
6,301 7,711 4,929 7,231 7,1046,610 8,100 5,337 7,090 8,0307,046 7,930 5,544 8,160 7,345
6,543 6,782 5,512 7,145 6,807
8,311 7,345 6,987 6,839 9,9845,421 6,308 4,654 6,112 4,6874,587 4,386 4,726 6,019 11,1384,653 5,017 4,526 5,746 4,3783,678 4,214 3,171 4, 102 3,3384,673 4,708 3,636 4,628 5,9905,002 5,353 4,308 5,686 5,6307, 118 6,754 7,024 7, 370 7,6596,795 7,341 6,085 6, 845 6,4488,588 9,207 8,138 8,713 7,5029,369 10,476 8,805 9,865 8,6865,823 5,429 5,390 6,380 5,7014,033 4,094 3,372 4,556 4,8736,640 7,222 5,827 6,867 6,9437,887 8,097 7,573 7,919 7,6436,808 6,883 5,790 7,103 7,1567,953 8,157 6,734 8,148 8,0606,941 7,348 6,342 6,619 7,7078, 154 8,235 7,623 8, 143 8,7847,534 8,461 5,261 6,974 7,3534,787 4,813 4,262 5,228 4,527
7,434 7,658 6,306 7,841 7,434
8,443 _ _ 8, 443 _5,598 6,231 4,760 5, 358 4,9276,730 7,216 5,739 7,314 6,8797,659 8,888 6,335 6,004 7,5710,045 10,774 9,494 9, 178 10,3508,980 8,492 9,122 8, 865 8,7516, 386 7,360 4,831 6,478 5,939
7,085 7,690 6,326 7, 100 7,298
8, 546 9,272 7,700 9, 103 8,588
7, 131 8,003 6,309 7,284 6,875
$7,502 $8,009 $6,517 $7,818 $7,862
9,436 9,525 9, 132 9,557 9,750
8,944 10,047 7,766 8,364 9,1467,632 7,632 - - _9,695 9,936 9, 171 11,038 9,9679,711 9,493 9,555 7,528 10,4319,072 9,358 7,777 10,204 9,888
9,250 10,322 7,624 10,301 10,081
8,992 10,301 7,463 9,785 9,9239,026 10,609 7,440 10,018 10,5379,491 10,234 7,826 10,652 9,917
8,135 8,355 6,889 8,691 8,979
9,937 8, 777 8,472 8,245 11,7607,609 8,181 6,458 8,330 7,6106,558 5,821 6,829 6,661 11,i 385,746 6,436 5,486 7,522 5,7904,949 5,563 4,226 5,472 5,1406,382 6,609 5,001 6,293 8,0546,430 7,028 5,392 7,234 7,8218,424 8,061 8,213 8,764 8,8708,681 9,241 7,818 8,585 8,8549,907 10,689 9,095 10,113 9,53910,598 11,765 9,847 11,025 9,8477,580 7,343 6,798 8,014 7,9885,346 5,467 4,498 5,827 6,7148,127 8,778 7,103 8,358 8,7259,045 9,177 8,537 9,130 9,1838,384 8,388 7, 190 8,702 9,1049,229 9,359 7,882 9,394 9,8438,413 8,846 7,629 8, 102 9,3489,449 9,282 8,959 9,386 10,4468,964 9,832 6,482 8,350 9,1526,649 6,691 5,684 7, 140 6,800
9,063 9,383 7,985 9,156 9,610
9,3347,2748,5319,89911,47110,1268,164
7,8888,98210,74812,03810,1779,037
6,189 7,394 8, 191 10,744 10,224 6,762
9, 334 7,030 8,984 9,220 11,013 9,975 7,939
6,8479,2169,868
11,7599,8977,933
8,380 9, 199 7,486 8,255 8,646
9,511 10,225 8,615 9,958 9,739
9,193 10,050 8,244 9, 173 9,368
Digitized for FRASER http://fraser.stlouisfed.org/ Federal Reserve Bank of St. Louis
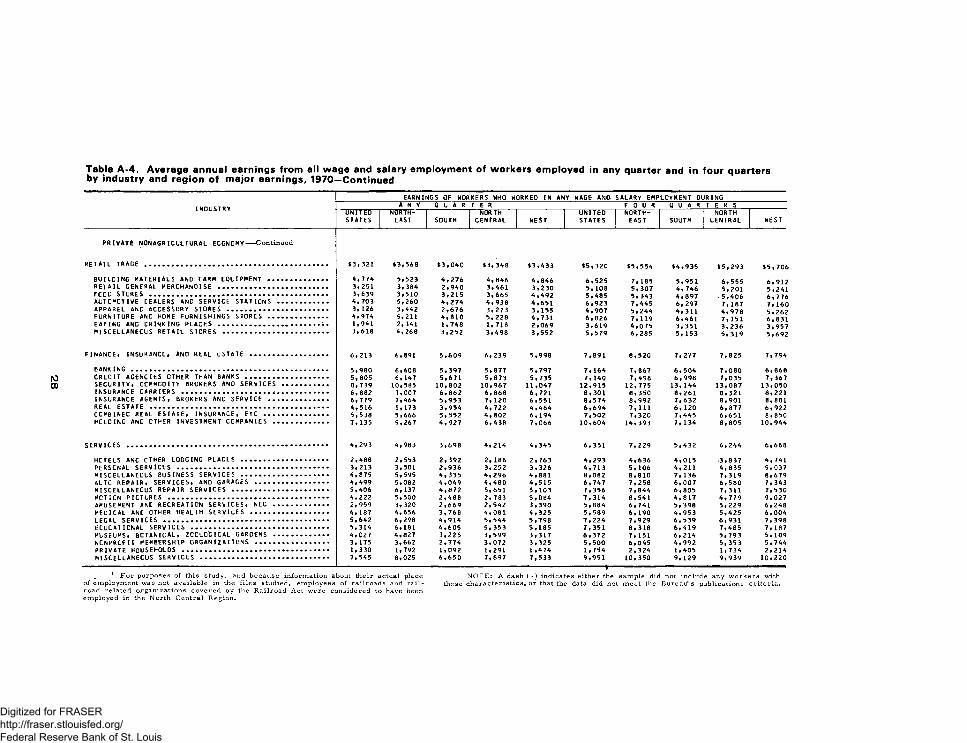
INDUSTRYEARNINGS OF WORKERS WHO WORKEO IN ANY WAGE ANO SALARY EMPLOYMENT DURING
A N Y Q U A R T E R F O U R Q U A R T E R SUNITEDSTATES
NORTHEAST SOUTH
NORTHCENTRAL WEST
UNITEDSTATES
NORTH- 1 EAST SOUTH
NORTHCENTRAL WEST
PRIVATE NONAGRICULTURAL ECONOMY--Continued
RETAIL TRADE .............................................. $3,321 $3,568 $3,040 $3,348 $3,433 $5,320 $5,554 $4,935 $5,293 $5,706
BUILCING MATERIALS AND FARM EQUIPMENT ............... A, 774 5,523 4,276 4, 846 4,846 6,525 7, 185 5,951 6,555 6,912r e t a i l g e n e r a l MERCHANDISE ........................... 3,251 3,384 2,940 3,461 3,230 5,108 5,307 4,746 5,201 5,241FCOC STORES ............................................ 3,639 3,510 3,215 3,665 4,492 5,485 5,343 4,897 - 5,406 6,776AUTOMOTIVE CEALERS AND SERVICE STATIONS ............ 4,703 5,260 4,274 4,938 4,651 6,923 7,445 6, 297 7,187 7,160APPAREL ANC ACCESSORY STORES ......................... 3, 126 3,442 2,676 3,273 3,155 4,907 5,244 4,311 4,978 5,262FURNITURE ANC HOME FURNISHINGS STORES ............... 4,974 5,211 4,810 5,228 4,731 6,826 7,119 6,461 7,151 6,831EATING ANC CRINKING PLACES ......................... . 1,941 2,341 1,748 1,718 2,069 3,619 4,075 3,351 3,236 3,957MISCELLANEOUS RETAIL STORES .......................... 3,618 4,268 3,252 3,498 3,552 5,579 6,285 5, 153 5,319 5,692
FINANCE, INSURANCE, AND REAL ESTATE ................... 6,213 6,891 5,609 6,239 5,998 7,891 8,520 7,277 7,825 7,794
BANKING ................................................. 5,980 6,608 5,397 5,877 5,797 7,164 7,867 6,504 7,080 6,868CREDIT AGENCIES OTHER THAN BANKS ..................... 5,805 6, 147 5,671 5,873 5,735 7,140 7,498 6,998 7,035 7,367SECURITY, COMMODITY BROKERS AND SERVICES ........... 0,739 10,585 10,802 10,967 11,047 12,915 12,775 13,144 13,087 13,050INSURANCE CARRIERS ............................ ....... 6,882 7,007 6,862 6,868 6,721 8,301 8,350 8,261 8,321 8,221INSURANCE AGENTS, BROKERS ANO SERVICE ............... 6,779 7,464 5,953 7, 120 6,551 8,574 8,992 7,632 8,901 8,881REAL ESTATE ............................................ 4,516 5,173 3,954 4,722 4,464 6,694 7, 111 6, 120 6,877 6,922c o m b i n e c r e a l e s t a t e , i n s u r a n c e , ETC ................ 5,538 5,666 5,552 4,802 6,194 7,502 7,320 7,445 6,651 8,850HOLDING ANC OTHER INVESTMENT COMPANIES .............. 7,135 9,267 4,927 6,438 7,066 10,604 14,393 7,134 8,805 10,944
SERVICES .................................................. 4,293 4,983 3,698 4,214 4,345 6,351 7,229 5,432 6,244 6,668
HOTELS ANC OTHER LODGING PLACES ...................... 2,488 2,553 2,392 2, 186 2,763 4,293 4,636 4,015 3,837 4,741PERSONAL SERVICES ...................................... 3,213 3,501 2,936 3,252 3,326 4,713 5,106 4,211 4,835 5,037MISCELLANEOUS BUSINESS SERVICES ...................... 4,875 5,595 4,335 4,296 4,881 8,082 8,810 7,136 7,319 8,679AUTO REPAIR, SERVICES, AND GARAGES .................. 4,499 5,082 4,049 4,480 4,515 6,747 7,258 6,007 6,580 7,343MISCELLANEOUS REPAIR SERVICES ........................ 5,406 6,137 4,872 5,651 5,103 7,356 7,844 6,805 7,311 7,530MOTION PICTURES ........................................ 4,222 5,500 2,488 2, 783 5,084 7,314 8,541 4,817 4,779 9,027AMUSEMENT ANC RECREATION SERVICES, NEC .............. 2,959 3,320 2,669 2,542 3,390 5,884 6,741 5,398 5,229 6,248MEDICAL ANC OTHER HEALTH SERVICES ................... 4,187 4,656 3,768 4,081 4,325 5,589 6,190 4,953 5,425 6,004LEGAL SERVICES ......................................... 5,642 6,298 4,914 5,544 5,798 7,224 7,929 6,5 39 6,931 7,398ECUCATICNAL SERVICES .................................. 5,314 6,181 4,605 5, 353 5,185 7,351 8,318 6,419 7,485 7,187MUSEUMS, BOTANICAL, ZOOLOGICAL GARDENS .............. 4,027 4,827 3,225 3,599 3,317 6,372 7,151 6,214 5,793 5,109NONPROFIT MEMBERSHIP ORGANIZATIONS .................. 3, 175 3,662 2,774 3,072 3,325 5,500 6,045 4,992 5,353 5,744PRIVATE HOUSEHOLDS .................................... 1,330 1,792 1,092 1,291 1,474 1,754 2,324 1,405 1,734 2,214m i s c e l l a n e o u s SERVICES ................................ 7,545 8,025 6,650 7,897 7,533 9,951 10,350 9,129 9,939 10,220
1 F o r purposes of this study, and because information about their actual place N O TE : A dash ( - ) indicates either the sample did not include any w orkers withof employment was not availab le in the files studied, employees of ra ilroads and ra i l - these characteristics, or that the data did not meet the Bureau1 s publications crite ria , road re lated organizations covered by the R ailroad Act were considered to have been employed in the North Central Region.
Digitized for FRASER http://fraser.stlouisfed.org/ Federal Reserve Bank of St. Louis
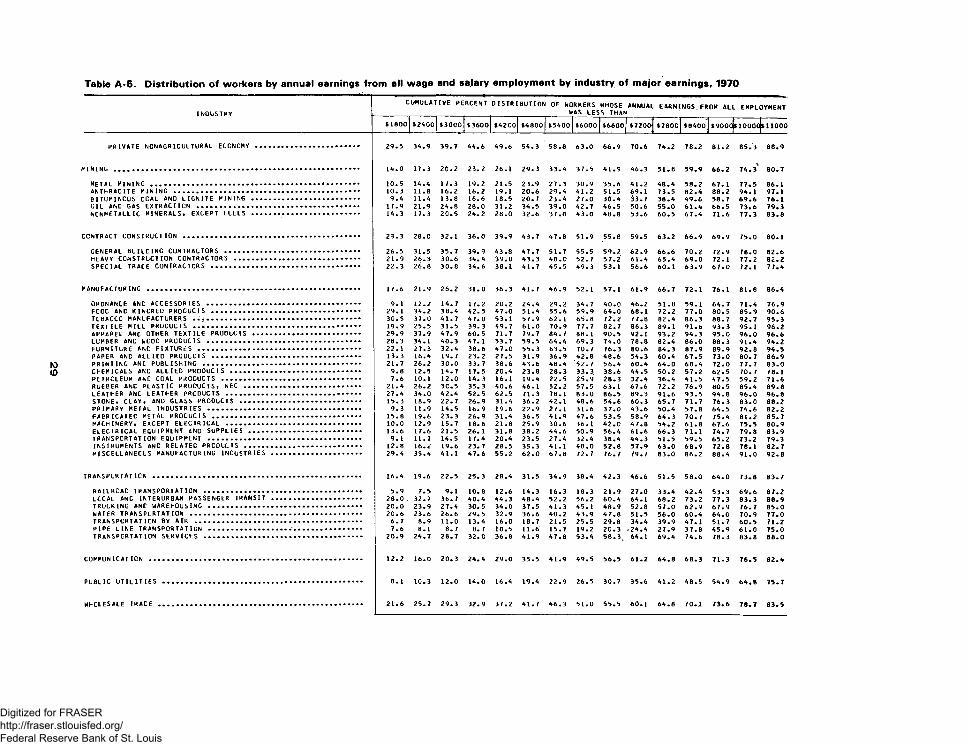
INDUSTRY
PRIVATE NCNAGRICULTURAL ECONOMY
MINING ....................................................
m e t a l m i n i n g .......................................... .a n t h r a c i t e m i n i n g .....................................BITUMINOUS COAL AND LIGNITE MINING ..................GIL ANC GAS EXTRACTION ................................NCNMETALL IC MINERALS# EXCEPT F U E L S .....*............
CONTRACT CONSTRUCTION ..........
GENERAL BUILDING CONTRACTORS . HEAVY CONSTRUCTION CONTRACTORS SPECIAL TRACE CONTRACTORS ....
MANUFACTURING ..............................
ORDNANCE ANC ACCESSORIES ...............FCOC ANC KINDRED PRODUCTS .............TOBACCO MANUFACTURERS ..?...............TEXTILE MILL PROCUCTS ..................APPAREL ANC OTHER TEXTILE PRODUCTS ....LUMBER AND WOOD PRODUCTS ...............FURNITURE ANC FIXTURES ................ .PAPER ANC ALLIED PRODUCTS .............PRINTING ANC PUBLISHING ................CHEMICALS ANC ALLIED PR O D U C T S ........ .PETROLEUM ANC COAL PRODUCTS .......... .RUBBER ANC PLASTIC PRODUCTS# NEC ......LEATHER ANC LEATHER PRODUCTS ......... .STONE# CLAY# AND GLASS PRODUCTS .......PRIMARY METAL INDUSTRIES .............. .FABRICATED METAL PRODUCTS ..............MACHINERY# EXCEPT ELECTRICAL ......... .ELECTRICAL EQUIPMENT AND SUPPLIES ....TRANSPORTATION EQUIPMENT ...............INSTRUMENTS ANC RELATED PR OD UC TS......MISCELLANEOUS MANUFACTURING INDUSTRIES
TRANSPORTATION ........................... .
RAILRCAC TRANSPORTATION ...............LOCAL ANC INTERURBAN PASSENGER TRANSITTRUCKING ANC WAREHOUSING ..............WATER TRANSPORTATION ..................TRANSPORTATION BY AIR .................PIPE LINE TRANSPORTATION ..............TRANSPORTATION SERVICES .............
COMMUNICATION
PUBLIC UTILITIES
CUMULATIVE PERCENT DISTRIBUTION OF WORKERS WHOSE ANNUAL EARNINGS FROM ALL EMPLOYMENT_______ ,______ ,______ ______ _______ WAS LESS THAN______
$1800 $2400 $3000 $3600 $4200 $4800 $5400 $6000 $6600 $7200 $7800 oo*■00* $9000 $10000 $11000
29.5 34.9 39.7 44.6 49.6 54.3 58.8 63.0 66.9 70.6 74.2 78.2 81.2 85.3 88.9
14.0 17.3 20.2 23.2 26.1 29.3 33.4 37.5 41.9 46.3 51.8 59.9 66.2a
74.3 80.7
10.5 14.4 17.3 19.2 21.5 23.9 27.3 30.9 35.6 41.2 48.4 58.2 67.1 77.5 86.110.3 11.8 16.2 16.2 19.1 20.6 29.4 41.2 51.5 69.1 73.5 82.4 88.2 94.1 97.19.4 11.4 13.8 16.6 18.5 20.7 23.4 27.0 30.4 33.7 38.4 49.6 58.7 69.6 76.1
17.9 21.9 24.8 28.0 31.2 34.5 39.0 42.7 46.5 50.6 55.0 61.4 66.5 73.6 79.314.3 17.3 20.5 24.2 28.0 32.6 37.8 43.0 48.8 53.6 60.5 67.4 71.6 77.3 83.8
23.3 28.0 32.1 36.0 39.9 43.7 47.8 51.9 55.8 59.5 63.2 66.9 69.9 75.0 80.1
26.5 31.5 35.7 39.9 43.8 47.7 51.7 55.5 59.2 62.9 66.6 70.2 72.9 78.0 82.621.9 26.3 30.6 34.4 39.0 43.3 48.0 52.7 57.2 61.4 65.4 69.0 72.1 77.2 82.222.3 26.8 30.8 34.6 38.1 41.7 45.5 49.3 53.1 56.6 60.1 63.9 67.0 72.1 77.4
17.6 21.9 26.2 31.0 36.3 41.7 46.9 52. 1 57.1 61.9 66.7 72.1 76.1 81.8 86.4
9.1 12.2 14.7 17.2 20.2 24.4 29.2 34.7 40.0 46.2 51.8 59. 1 64.7 71.4 76.929.1 34.2 38.4 42.5 47.0 51.4 55.6 59.9 64.0 68.1 72.2 77.0 80.5 85.9 90.630.5 37.0 41.7 47.0 53.1 57.9 62.1 65.8 72.2 77.8 82.4 86.3 88.7 92.7 95.319.9 25.5 31.5 39. 3 49.7 61.0 70.9 77.7 82.7 86.3 89.1 91.6 93.3 95.1 96.229.9 37.9 47.9 60.5 71.7 79.7 84.7 88.1 90.5 92.1 93.2 94.3 95.0 96.0 96.628.3 34.1 40.3 47. 1 53.7 59.5 64.4 69.3 74.0 78.8 82.4 86.0 88.3 91.4 94.222.1 27.3 32.4 38.6 47.0 55.3 63.5 70.7 76.3 80.6 84.3 87.9 89.9 92.8 94.513.3 16.4 19.7 23.2 27.5 31.9 36.9 42.8 48.6 54.3 60.4 67.5 73.0 80.7 86.921.7 26.2 30.0 33.7 38.6 43.6 48.4 52.7 56.4 60.4 64.0 68.4 72.0 77.7 83.09.8 12.5 14.7 17.5 20.4 23.8 28.3 33.3. 38.6 44.5 50.2 57.2 62.5 70.7 78.17.6 10.1 12.0 14. 3 16.1 19.4 22.5 25.9 28.3 32.4 36.4 41.5 47.5 59.2 71.6
21.4 26.2 3C.5 35.3 40.6 46.1 52.2 57.5 63.1 67.6 72.2 76.9 80.5 85.4 89.827.4 34.0 42.4 52.5 62.5 71.3 78.1 83.0 86.5 89.3 91.6 93.5 94.8 96.0 96.815.3 18.9 22.7 26.9 31.4 36.2 42.1 48.6 54.6 60.3 65.7 71.7 76.3 83.0 88.29.3 11.9 14.5 16.9 19.6 22.9 27.1 31.6 37.0 43.6 50.4 57.8 64.5 74.6 82.215.8 19.6 23.3 26.9 31.4 36.5 41.9 47.6 53.5 58.9 64.3 70.7 75.4 81.2 85.710.0 12.9 15.7 18.6 21.8 25.9 30.6 36.1 42.0 47.8 54.2 61.8 67.6 75.5 80.913.6 17.6 21.5 26. 1 31.8 38.2 44.6 50.9 56.4 61.6 66.3 71.1 74.7 79.8 83.99. 1 11.7 14.5 17.4 20.4 23.5 27.4 32.4 38.4 44.3 51.5 59.5 65.2 73.2 79.312.8 16.2 19.6 23.7 28.5 35.3 41.1 48.0 52.8 57.9 63.0 68.9 72.8 78.1 82.729.4 35.4 41.1 47.6 55.2 62.0 67.8 72.7 76.7 79.7 83.0 86.2 88.4 91.0 92.8
16.4 19.6 22.5 25.3 28.4 31.5 34.9 38.4 42.3 46.6 51.5 58.0 64.0 73.8 83.7
5.9 7.5 9.1 10.8 12.6 14.3 16.3 18.3 21.9 27.0 33.4 42.4 53.3 69.6 87.228.0 , 32.7 36.7 40.4 44.3 48.4 52.2 56.2 60.4 64.1 68.2 73.2 77.3 83.3 88.920.0 23.9 27.4 30.5 34.0 37.5 41.3 45. 1 48.9 52.8 57.0 62.9 67.9 76.7 85.020.6 23.6 26.6 29.5 32.9 36.6 40.2 43.9 47.8 51.5 56.0 60.4 64.0 70.9 77.06.7 8.9 11.0 13.4 16.0 18.7 21.5 25.5 29.8 34.4 39.9 47.1 51.7 60.5 71.27.6 8.1 8.7 8.7 10.5 11.6' 15.7 19.2 20.3 *24.4 27.9 37.8 45.9 61.0 75.0
20.9 24.7 28.7 32.0 36.8 41.9 47.8 53.4 58.3. 64.1 69.4 74.6 78.3 83.8 88.0
12.2 16.0 20.3 24.4 29.0 35.5 41.9 49.5 56.5 61.2 64.8 68.3 71.3 76.5 82.4
8.1 10.3 12.0 14.0 16.4 19.4 22.9 26.5 30.7 35.6 41.2 48.5 54.9 64.8 75.7
21.6 25.7 29.3 32.9 37.2 41.7 46.3 51.0 55.5 60.1 64.8 70.1 73.6 78.7 83.5WHOLESALE TRACE
Digitized for FRASER http://fraser.stlouisfed.org/ Federal Reserve Bank of St. Louis
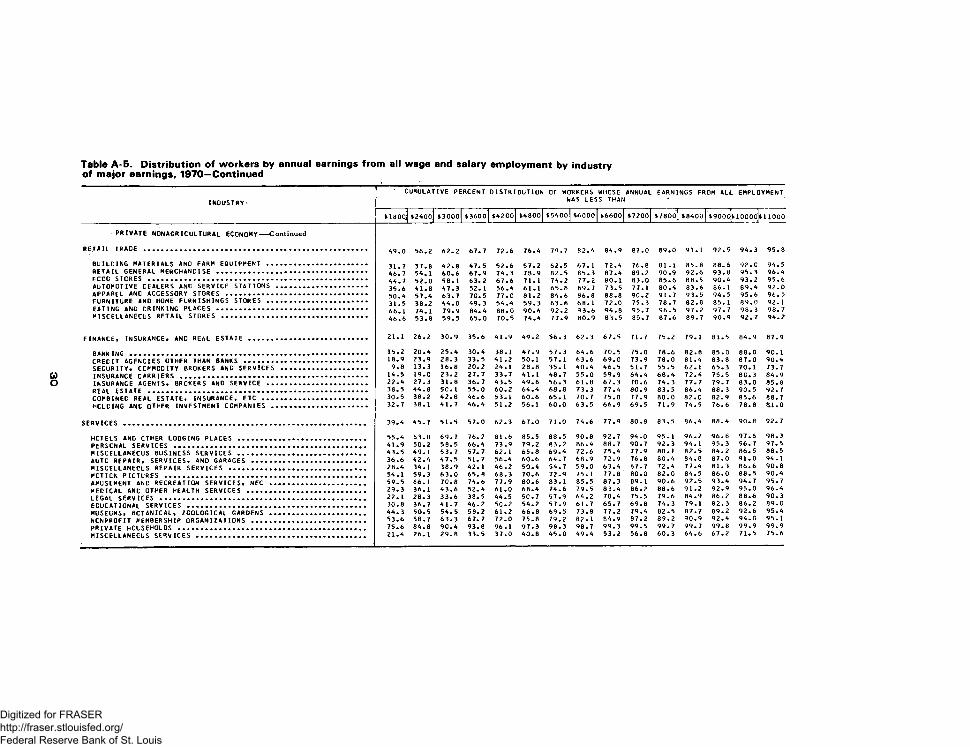
IN0USTRY-CUMULATIVE PERCENT DISTRIBUTION OF WORKERS WHOSE
WAS LESS THANANNUAL EARNINGS FROM ALL EMPLOYMENT
4 1 8 0 Q 4 2 4 0 o | $3 0 0 o |4 36001 $4 2 C o] $4 8 0 o |4 5 4 0 0 j 4 6 0 0 0 |4 6 6 0 o | 4 7 2 0 0 j 4 7 8 0 o] 4 8 4 0 0 j o o -8-
o o .iQ_
4 1 1 0 0 0
PRIVATE NONAGRICULTURAL ECONOMY— Continued
RETAIL TRADE ........................................................ 4 9 . 0 5 6 . 2 6 2 . 2 6 7 . 7 7 2 . 6 7 6 . 4 7 9 . 7 8 2 . 4 8 4 . 9 8 7 . 0 8 9 . 0 9 1 . 1 9 2 . 5 9 4 . 3 9 5 . 8
BUILDING MATERIALS ANO FARM EQUIPMENT ......................... 3 1 . 7 3 7 . 8 4 2 . 8 4 7 . 5 5 2 . 6 5 7 . 2 6 2 . 5 6 7 . 1 7 2 . 4 7 6 . 8 8 1 . 1 8 5 . 8 8 8 . 6 9 2 . 0 9 4 . 5RETAIL GENERAL MERCHANDISE ..................................... 4 6 . 7 5 4 . 1 6 0 . 6 6 7 . 9 7 4 . 3 7 8 . 9 8 2 . 5 8 5 . 3 8 7 . 4 8 9 . 2 9 0 . 9 9 2 . 6 9 3 . 8 9 5 . 3 9 6 . 4FCCD STORES ....................................................... 4 4 . 7 5 2 . 0 5 8 . 1 6 3 . 2 6 7 . 6 7 1 . 1 7 4 . 2 7 7 . 2 8 0 . 1 8 3 . 0 8 5 . 6 8 8 . 5 9 0 . 4 9 3 . 2 9 5 . 6AUTOMOTIVE DEALERS AND SERVICE STATIONS ...................... 3 5 . 6 4 1 . 8 4 7 . 3 5 2. 1 5 6 . 4 6 1 . 1 6 5 . 8 6 9 . 7 7 3 . 5 7 7 . 1 8 0 . 4 8 3 . 6 8 6 . 1 8 9 . 4 9 2 . 0a p p a r e l AND ACCESSORY STORES .......................... ........ 5 0 . 4 5 7 . 4 6 3 . 7 7 0 . 5 7 7 . 0 8 1 . 2 8 4 . 6 8 6 . 8 8 8 . 8 9 0 . 2 9 1 . 7 9 3 . 5 9 4 . 5 9 5 . 6 9 6 . 5FURNITURE AND HOME FURNISHINGS STORES ......................... 3 1 . 5 3 8 . 2 4 4 . 0 4 9 . 3 5 4 . 4 5 9 . 3 6 3 . 6 6 8 . 1 7 2 . 0 7 5 . 3 7 8 . 7 8 2 . 8 8 5 . 1 8 9 . 0 9 2 . 1EATING AND CRINKING PLACES ..................................... 6 6 . 1 7 4 . 1 7 9 . 9 8 4 . 4 8 8 . 0 9 0 . 4 9 2 . 2 9 3 . 6 9 4 . 8 9 5 . 7 9 6 . 5 9 7 . 2 9 7 . 7 9 8 . 3 9 8 . 7MISCELLANEOUS RETAIL STORES .................................... 4 6 . 6 5 3 . 8 5 9 . 5 6 5 . 0 7 0 . 5 7 4 . 4 7 7 . 9 8 0 . 9 8 3 . 5 8 5 . 7 8 7 . 6 8 9 . 7 9 0 . 9 9 2 . 7 9 4 . 2
FINANCE. INSURANCE. AND REAL ESTATE ............................. 2 1 . 1 2 6 . 2 3 0 . 9 3 5 . 6 4 1 . 9 4 9 . 2 5 6 . 3 6 2 . 3 6 7 . 5 7 1 . 7 7 5 . 2 7 9 . 1 8 1 . 5 8 4 . 9 8 7 . 9
BANKING ........................................................... 1 5 . 2 2 0 . 4 2 5 . 4 3 0 . 4 3 8 . 1 4 7 . 9 5 7 . 3 6 4 . 6 7 0 . 5 7 5 . 0 7 8 . 6 8 2 . 8 8 5 . 0 8 8 . 0 9 0 . 1CREDIT AGENCIES OTHER THAN BANKS ............................... 1 8 . 9 2 3 . 9 2 8 . 3 3 3 . 5 4 1 . 2 5 0 . 1 5 7 . 1 6 3 . 6 6 9 . 0 7 3 . 9 7 8 . 0 8 1 . 4 8 3 . 8 8 7 . 0 9 0 . 4SECURITY. COMMODITY BROKERS AND SERVICES ..................... 9 . 8 1 3 . 3 1 6 . 8 2 0 . 2 2 4 . 1 2 8 . 8 3 5 . 1 4 0 . 4 4 6 . 5 5 1 . 7 5 5 . 5 6 2 . 1 6 5 . 3 7 0 . 1 7 3 . 7INSURANCE CARRIERS ............................................... 1 4 . 5 1 9 . 0 2 3 . 2 2 7 . 7 3 3 . 7 4 1 . 1 4 8 . 7 5 5 . 0 5 9 . 9 6 4 . 4 6 8 . 4 7 2 . 4 7 5 . 5 8 0 . 3 8 4 . 9INSURANCE AGENTS. BROKERS AND SERVICE ......................... 2 2 . 4 2 7 . 3 3 1 . 8 3 6 . 7 4 3 . 5 4 9 . 6 5 6 . 3 6 1 . 8 6 7 . 3 7 0 . 6 7 4 . 3 77.7 7 9 . 7 8 3 . 0 8 5 . 8REAL ESTATE ................................. ..................... 3 8 . 5 4 4 . 8 5 0 . 1 5 5 . 0 6 0 . 2 6 4 . 4 6 8 . 8 7 3 . 3 7 7 . 4 8 0 . 9 8 3 . 5 8 6 . 4 8 8 . 3 9 0 . 5 9 2 . 7COMBINEC REAL ESTATE. INSURANCE, ETC .......................... 3 0 . 5 3 8 . 2 4 2 . 8 4 6 . 6 5 3 . 1 6 0 . 6 6 5 . 1 7 0 . 7 7 5 . 0 7 7 . 9 8 0 . 0 8 2 . 0 8 2 . 9 8 5 . 6 8 8 . 7HOLDING AND OTHER INVESTMENT COMPANIES ........................ 3 2 . 7 3 8 . 1 4 1 . 7 4 6 . 4 5 1 . 2 5 6 . 1 6 0 . 0 6 3 . 5 6 6 . 9 6 9 . 5 7 1 . 9 7 4 . 5 7 6 . 6 7 8 . 8 ai.o
SERVICES ............................................................ 3 9 . 4 4 5 . 7 5 1 . 5 5 7 . 0 6 2 . 3 6 7 . 0 7 1 . 0 7 4 . 6 7 7 . 9 8 0 . 8 8 3 . 5 8 6 . 4 8 8 . 4 9 0 . 8 9 2 . 7
HCTELS AND OTHER LODGING PLACES ................................ 5 5 . 4 6 3 . 0 6 9 . 7 7 6 . 2 8 1 . 6 8 5 . 5 8 8 . 5 9 0 . 8 9 2 . 7 9 4 . 0 9 5 . 1 9 6 . 2 9 6 . 8 9 7 . 6 9 8 . 3PERSONAL SERVICES ................................................ 4 1 . 9 5 0 . 2 5 8 . 5 6 6 . 4 7 3 . 9 7 9 . 2 8 3 . 2 8 6 . 4 8 8 . 7 9 0 . 7 9 2 . 3 9 4 . 1 9 5 . 3 9 6 . 7 9 7 . 5MISCELLANEOUS BUSINESS SERVICES .......................... ..... 4 3 . 5 4 9 . 1 5 3 . 7 5 7 . 7 6 2 . 1 6 5 . 8 6 9 . 4 7 2 . 6 7 5 . 4 7 7 . 9 8 0 , 1 8 2 . 5 8 4 . 2 8 6 . 5 8 8 . 5AUTO REPAIR. SERVICES. AND GARAGES .............,.............. 3 6 . 6 4 2 . 4 4 7 . 5 5 1 . 7 5 6 . 4 6 0 . 6 6 4 . 7 6 8 . 9 7 2 . 9 7 6 . 8 8 0 . 4 8 4 . 8 8 7 . 0 9 1 . 0 9 4 . 1MISCELLANEOUS REPAIR SERVICES ............... .................. 2 8 . 4 3 4 . 1 3 8 . 9 4 2 . 1 4 6 . 2 5 0 . 4 5 4 . 7 5 9 . 0 6 3 . 4 6 7 . 7 7 2 . 4 7 7 . 4 8 1 . 3 8 6 . 6 9 0 . 8MOTION PICTURES .................................................. 5 4 . 1 5 9 . 3 6 3 . 0 6 5 . 8 6 8 . 3 7 0 . 6 7 2 . 9 7 5 . 1 7 7 . 8 8 0 . 0 8 2 . 0 8 4 . 5 8 6 . 0 8 8 . 5 9 0 . 4AMUSEMENT AND RECREATION SERVICES. NEC ........................ 5 9 . 5 6 6 . 1 7 0 . 8 7 4 . 6 7 7 . 9 8 0 . 6 8 3 . 1 8 5 . 5 8 7 . 3 8 9 . 1 9 0 . 6 9 2 . 5 9 3 . 4 9 4 . 7 9 5 . 7MEDICAL AND OTHER HEALTH SERVICES ......................... . 2 9 . 3 3 6 . 1 4 3 . 6 5 2 . 4 6 1 . 0 6 8 . 4 7 4 . 6 7 9 . 5 8 3 . 4 8 6 . 2 8 8 . 6 9 1 . 2 9 2 . 9 9 5 . 0 9 6 . 4LEGAL SERVICES ................................................... 2 2 . 1 2 8 . 3 3 3 . 6 3 8 . 5 4 4 . 5 5 C . 7 5 7 . 9 6 4 . 2 7 0 . 4 7 5 . 5 7 9 . 6 8 4 . 9 8 6 . 2 8 8 . 6 9 0 . 3EDUCATIONAL SERVICES ............................................ 3 0 . 8 3 6 . 7 4 1 . 7 4 6 . 2 5 C . 2 5 4 . 2 5 7 . 9 6 1 . 7 6 5 . 7 6 9 . 8 7 4 . 3 7 9 . 1 8 2 . 3 8 6 . 2 8 9 . 0MUSEUMS. BOTANICAL. ZOOLOGICAL GARDENS ........................ 4 4 . 3 5 0 . 5 5 4 . 5 5 8 . 2 6 1 . 2 6 6 . 8 6 9 . 5 7 3 . 8 7 7 . 2 7 9 . 4 8 2 . 5 8 7 . 7 8 9 . 2 9 2 . 6 9 5 . 4NONPROFIT MEMBERSHIP ORGANIZATIONS ............................ 5 3 . 6 5 8 . 7 6 3 . 3 6 7 . 7 7 2 . 0 7 5 . 8 7 9 . 2 8 2 . 1 8 4 . 9 8 7 . 2 8 9 . 2 9 0 . 9 9 2 . 4 9 4 . 0 9 5 . 1PRIVATE HOUSEHOLDS ............................................... 7 5 . 6 8 4 . 8 9 0 . 4 9 3 . 8 9 6 . 1 9 7 . 3 9 8 . 3 9 8 . 7 9 9 . 3 9 9 . 5 9 9 . 7 9 9 . 7 9 9 . 8 99.9 99.9MISCELLANEOUS SERVICES .......................................... 2 1 . 4 2 6 . 1 2 9 . 8 3 3 . 5 3 7 . 0 4 0 . 8 4 5 . 0 4 9 . 4 5 3 . 2 5 6 . 8 6 0 . 3 6 4 . 6 6 7 . 2 7 1 . 5 7 5 . 6
Digitized for FRASER http://fraser.stlouisfed.org/ Federal Reserve Bank of St. Louis
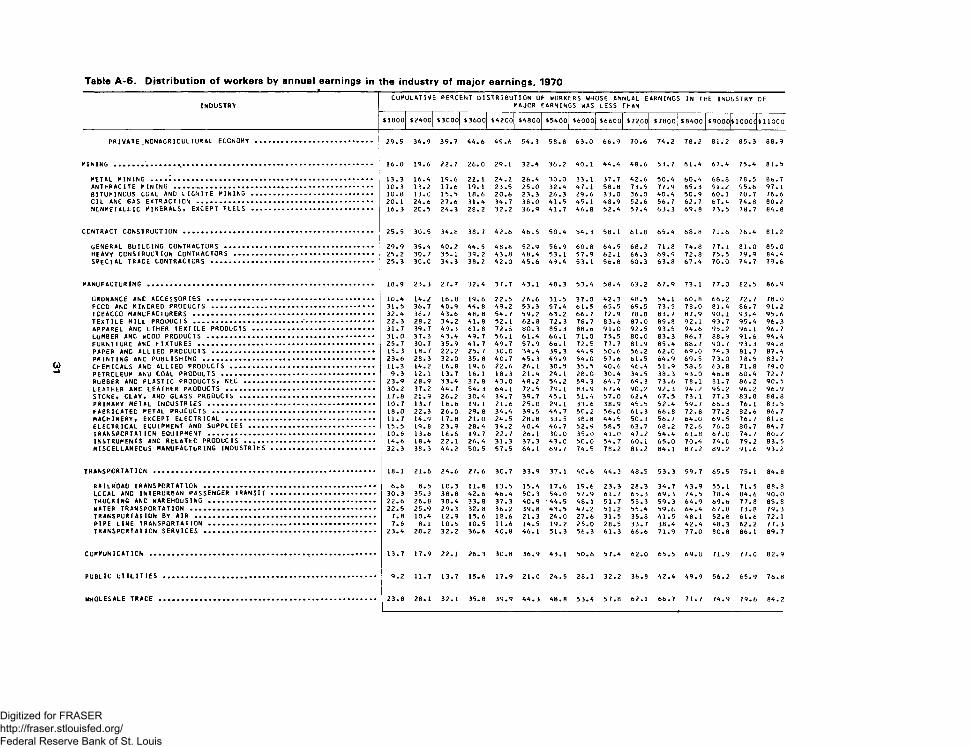
INDUSTRYCUMULATIVE PERCENT DISTRIBUTION OF WORKERS WHOSE ANNUAL EARNINGS IN THE INDUSTRY
MAJOR EARNINGS WAS LESS THANOF
$1800 $2400 $3000 $3600 $4200 $4800 $5400 $6000 $6600 $7200 $7800 $8400 $9000 $1C00C $ 1 1 0 0 0
PRIVATE .NONAGRICULTURAL ECONOMY ............................. 29.5 34.9 39.7 44.6 49.6 54.3 58.8 63.0 66.9 70.6 74.2 78.2 81.2 85.3 88.9
M I N I N G ....... ......................................................... 16.0 19.6 22.7 26.0 29.1 32.4 36.2 40. 1 44.4 48.6 53.7 61.4 67.4 75.4 81.5
METAL MINING ................................................. 13.3 16.4 19.6 2 2 . 1 24.2 26.4 30.0 33.1 37.7 42.6 50.4 60.4 6 8 . 8 78.5 86.7ANTHRACITE M I N I N G .................................................. 10.3 13.2 17.6 19. 1 23.5 25.0 32.4 47.1 58.8 73.5 77.9 85.3 91.2 95.6 97. 1BITUMINOUS COAL AND LIGNITE MINING .............................. 1 0 . 8 13.C 15.5 18.6 2 0 . 6 23.3 26.3 29.6 33.0 36.0 40.4 50.9 60. 1 70.7 76.6OIL ANC GAS EXTRACTION ............................................ 2 0 . 1 24.6 27.6 31.4 34.7 38.0 41.5 45.1 48.9 52.6 56.7 62.7 67.4 74.8 80.2NCNMETALLIC MINERALS♦ EXCEPT FUELS .............................. 16.3 20.5 24.3 28.2 32.2 36.9 41.7 46.8 52.4 57.4 63.3 69.8 73.5 78.7 84.8
CONTRACT CONSTRUCTION ............................................... 25.5 30.5 34.8 38. 7 42.6 46.5 50.4 54.3 58.1 61.8 65.4 6 8 . 8 71.6 76.4 81.2
GENERAL BUILCING CONTRACTORS .................................... 29.9 35.4 40.2 44. 5 48.8 52.9 56.9 60.8 64.5 6 8 . 2 71.8 74.8 77. 1 81.0 85.0h e a v y c o n s t r u c t i o n c o n t r a c t o r s ................................... 25.2 30.7 35.1 39.2 43.8 48.4 53.1 57.9 62.1 66.3 69.9 72.8 75.5 79.9 84.4SPECIAL TRACE CONTRACTORS ........................................ 25.3 30.0 34.3 38.2 42.0 45.6 49.4 53.1 56.8 60.3 63.8 67.4 70.0 74.7 79.6
m a n u f a c t u r i n g ........................................................ 18.9 23.3 27.7 32.4 37.7 43.1 48.3 53.4 58.4 63.2 67.9 73. 1 77.0 82.5 86.9
ORDNANCE ANC ACCESSORIES ......................................... 10.4 14.2 16.8 19.6 22.5 26.6 31.5 37.0 42.3 48.5 54.1 60.8 6 6 . 2 72.7 78.0FOOD ANC KINDRED PROCUCTS ........................................ 31.5 36.7 40.9 44.8 49.2 53.3 57.4 61.5 65.5 69.5 73.5 78.0 81.4 8 6 . 7 91.2TOBACCO MANUFACTURERS ............................................. 32.4 38.7 43.6 48. 8 54.7 59.2 63.2 66.7 72.9 78.8 83.7 87.9 90.1 93.4 95.6t e x t i l e m i l l p r o d u c t s ............... .......... •................. 22.3 28.2 34.2 41.8 52.1 62.8 72.3 78.7 83.6 87.0 89.8 92.1 93.7 95.4 96.3APPAREL ANC OTHER TEXTILE PRODUCTS .............................. 31.7 39.7 49.3 61.8 72.6 80.3 85.3 8 8 . 6 91.0 92.5 93.5 94.6 95.2 96. 1 96.7LUMBER ANC MOOD PRODUCTS ......................................... 31.0 37.3 43.4 49. 7 56.1 61.4 6 6 . 1 71.0 75.5 80.0 83.3 86.7 88.9 91.6 94.4FURNITURE AND FIXTURES ............................................ 25.7 30.7 35.9 41.7 49.7 57.9 6 6 . 1 72.5 77.7 81.9 85.4 88.7 90.7 93.3 94.8PAPER ANC ALLIEO PROCUCTS ........................................ 15.3 18.7 2 2 . 2 25.7 30.0 34.4 39.3 44.9 50.6 56.2 62.0 69.0 74.3 81.7 87.4PRINTING ANC PUBLISHING ........................................... 23.6 28.3 32.0 35.8 40.7 45.3 49.9 54.0 57.6 61.5 64.9 69.5 73.0 78.5 83.7CHEMICALS AND ALLIED PRODUCTS .................................... 11.3 14.2 16.8 19.6 2 2 . 6 26.1 30.5 35.5 40.6 46.4 51.9 58.5 63.8 71.8 79.0PETROLEUM AND COAL PRODUCTS ...................................... 9.3 1 2 . 1 13.7 16. 1 18.3 21.4 24.1 28.0 30.4 34.5 38.3 43.0 48.8 60.4 72.7RUBBER ANC PLASTIC PRODUCTS, NEC ................................ 23.9 28.9 33.4 37.8 43.0 48.2 54.2 59.3 64.7 69.3 73.6 78.1 81.7 8 6 . 2 90.5LEATHER ANC LEATHER PRODUCTS ..................................... 30.2 37.2 44.7 54. 3 64.1 72.5 79.1 83.9 87.4 90.2 92.3 94.2 95.2 96.2 96.9STONE, CLAY, AND GLASS PRODUCTS ................................. 17.8 21.9 26.2 30.4 34.7 39.7 45.1 51.4 57.0 62.4 67.5 73. 1 77.3 83.8 8 8 . 8PRIMARY METAL INDUSTRIES ......................................... 10.7 13.7 16.6 19. 1 2 1 . 6 25.0 29. 1 33.6 38.9 45.5 52.4 59.7 66.3 76. 1 83.5FABRICATED METAL PROCUCTS ........................................ 18.0 22.3 26.0 29. 8 34.4 39.5 44.7 50.2 56.0 61.3 6 6 . 8 72.8 77.2 82.6 86.7MACHINERY, EXCEPT ELECTRICAL ..................................... 11.7 14.9 17.8 2 1 . 0 24.5 28.8 33.5 38.8 44.5 50.3 56.7 64.0 69.5 76.7 81.6ELECTRICAL EQUIPMENT AND SUPPLIES ............................... 15.5 19.8 23.9 28.4 34.2 40.4 46.7 52.9 58.5 63.7 6 8 . 2 72.6 76.0 80.7 84.7TRANSPORTATION EQUIPMENT .......................................... 1 0 . 6 13.6 16.6 19.7 22.7 26.1 3G.0 35.0 41.0 47.2 54.4 61.8 67.0 74.7 80.2INSTRUMENTS AND RELATEC PRODUCTS ................................ 14.6 18.4 2 2 . 1 26.4 31.3 37.3 43.0 50.0 54.7 60.1 65.0 70.4 74.0 79.2 83.5MISCELLANEOUS MANUFACTURING INDUSTRIES .......................... 32.3 38.3 44.2 50. 5 57.5 64.1 69.7 74.5 78.2 81.2 84.1 87.2 89.2 91.6 93.2
TRANSPORTATION ....................................................... 18. 1 2 1 . 6 24.6 27.6 30.7 33.9 37.1 40.6 44.3 48.5 53.3 59.7 65.5 75.1 84.8
RAILROAD TRANSPORTATION ........................................... 6 . 6 8.5 1C.3 1 1 . 8 13.5 15.4 17.6 19.6 23.3 28.3 34.7 43.9 55.1 71.5 8 8 . 8LOCAL AND INTERURBAN PASSENGER TRANSIT .......................... 30.3 35.3 38.8 42.6 46.4 50.3 54.0 57.9 61.7 65.3 69.3 74.5 78.4 84.6 90.0TRUCKING ANC WAREHOUSING .......................................... 2 2 . 6 26.8 30.4 33.8 37.3 40.9 44.5 48. 1 51.7 55.3 59.3 64.9 69.6 77.8 85.8WATER TRANSPORTATION .............................................. 22.5 25.9 29.3 32. 8 36.2 39.8 43.5 47.2 51.2 55.4 59.6 64.4 67.8 73.8 79.3t r a n s p o r t a t i o n by ai r ............................................. 7.8 10.4 12.9 15.6 18.6 21.3 24.0 27.6 31.5 35.8 41.5 48. 1 52.8 61.6 72.1PIPE LINE TRANSPORTATION ......................................... 7.6 8 . 1 1 C.5 10.5 1 1 . 6 14.5 19.2 25.0 28.5 33.7 38.4 42.4 48.3 62.2 77.3TRANSPORTATION SERVICES ........................................... 23.4 28.2 32.2 36.6 40.8 46.1 51.3 56.3 61.3 6 6 . 6 71.9 77.0 80.8 8 6 . 1 89.7
c o m m u n i c a t i o n ........................................................ 13.7 17.9 2 2 . 1 26. 3 30.8 36.9 43.1 50.6 57.4 62.0 65.5 69.0 71.9 77.0 82.9
PUBLIC UTILITIES ..................................................... 9.2 11.7 13.7 15.6 17.9 2 1 . 0 24.5 28.1 32.2 36.8 42.4 49.9 56.2 65.9 76.8
WHOLESALE TRACE ...................................................... 23.8 28.1 32.1 35.8 39.9 44.3 48.8 53.4 57.8 62.1 66.7 71.7 74.9 79.6 84.2
Digitized for FRASER http://fraser.stlouisfed.org/ Federal Reserve Bank of St. Louis
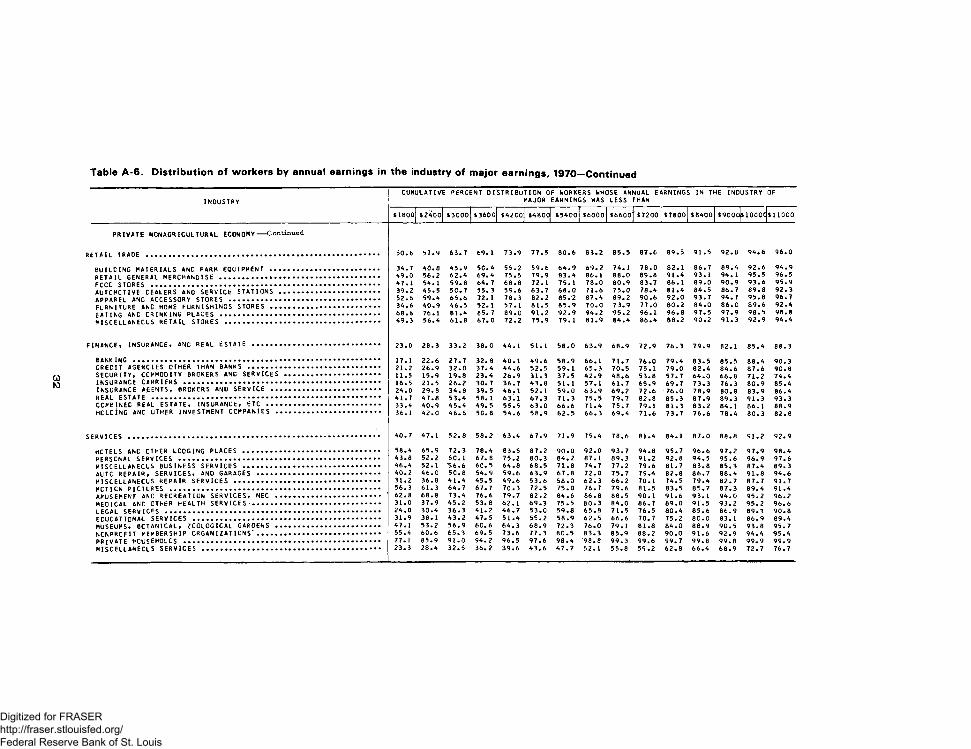
INDUSTRYCUMULATIVE PERCENT DISTRIBUTION OF WORKERS WHOSE ANNUAL EARNINGS IN THE INDUSTRY
MAJOR EARNINGS WAS LESS THANOF
$ 1800 $2400 $3000 $3600 $4200 $4800 $5400 $6000 $6600 $7200 $7800 $8400 $9000 $1000C $ 1 1 0 0 0
PRIVATE NONAGRICULTURAL ECONOMY--Continued
ETAIL TRADE .......................................................... 50.8 57.9 63.7 69. 1 73.9 77.5 80.6 83.2 85.5 87.6 89.5 91.5 92.8 94.6 96.0
BUILCING MATERIALS AND FARM EQUIPMENT ........................... 34.7 40.8 45.9 50.4 55.2 59.6 64.9 69.2 74.1 78.0 82.1 86.7 89.4 92.6 94.9RETAIL GENERAL MERCHANDISE ............*........................... 49.0 56.2 62.4 69.4 75.5 79.9 83.4 8 6 . 1 8 8 . 0 89.8 91.4 93.1 94. 1 95.5 96.5
47.1 54.1 59.8 64. 7 6 8 . 8 72.1 75.1 78.0 80.9 83.7 8 6 . 1 89.0 90.9 93.6 95.9AUTOMOTIVE CEALERS AND SERVICE STATIONS ......................... 39.2 45.5 5C.7 55. 3 59.6 63.7 6 8 . 0 71.6 75.0 78.4 81.4 84.5 86.7 89.8 92.3APPAREL ANC ACCESSORY STORES ...................................... 52.6 59.4 65.6 72. 1 78.3 82.2 85.2 87.4 89.2 90.6 92.0 93.7 94.7 95.8 96.7FURNITURE ANC HOME FURNISHINGS STORES ........................ 34.6 40.9 46.5 52.1 57.1 61.5 65.9 70.0 73.9 77.0 80.2 84.0 8 6 . 0 89.6 92.4EATING AND CRINKING PLACES ........................................ 6 8 . 6 76.1 81.4 85. 7 89.0 91.2 92.9 94.2 95.2 96.1 96.8 97.5 97.9 98.5 98.8MISCELLANEOUS RETAIL STORES ....................................... 49.3 56.4 61.8 67.0 72.2 75.9 79.1 81.9 84.4 86.4 8 8 . 2 90.2 91.3 92.9 94.4
FINANCE, INSURANCE* AND REAL ESTATE ................................ 23.0 28.3 33.2 38.0 44.1 51.1 58.0 63.9 68.9 72.9 76.3 79.9 82.1 85.4 88.3
17.1 2 2 . 6 27.7 32.8 40.1 49.6 58.9 6 6 . 1 71.7 76.0 79.4 83.5 85.5 88.4 90.3CREDIT AGENCIES OTHER THAN BANKS ................................. 2 1 . 2 26.9 32.0 37.4 44.6 52.5 59.1 65.3 70.5 75.1 79.0 82.4 84.6 87.6 90.8SECURITY, COMMODITY BROKERS ANC SERVICES ........................ 11.5 15.9 19.8 23.4 26.9 31.3 37.5 42.9 48.6 53.8 57.7 64.0 6 6 . 8 71.2 74.4
16.5 21.5 26.2 30.7 36.7 43.8 51.1 57.1 61.7 65.9 69.7 73.3 76.3 80.9 85.4INSURANCE AGENTS, BROKERS ANO SERVICE ........................... 24.0 29.8 34.8 39.5 46.1 52.1 59.0 63.9 69.2 72.6 76.0 78.9 80.8 83.9 86.4
41.7 47.8 53.4 58. 1 63.1 67.3 71.3 75.5 79.7 82.8 85.3 87.9 89.3 91.3 93.3CCMBINEC REAL ESTATE, INSURANCE, ETC ............................ 33.4 40.9 45.4 49.5 55.5 63.0 6 6 . 6 71.4 75.7 79.1 81.3 83.2 84.1 8 6 . 1 88.9HCLCiNG ANC OTHER INVESTMENT COMPANIES .......................... 36.1 42.0 46.6 50.8 54.6 58.9 62.5 66.3 69.4 71.6 73.7 76.6 78.4 80.3 82.8
40.7 47.1 52.8 58.2 63.4 67.9 71.9 75.4 78.6 81.4 84.1 87.0 8 8 . 8 91.2 92.9
HOTELS ANC OTHER LODGING PLACES •••«••»••••••••••••••••••••*•*• 58.4 65.9 72.3 78.4 83.5 87.2 90.0 92.0 93.7 94.8 95.7 96.6 97.2 97.9 98.4PERSONAL SERVICES •••••.•••••••••••••••••••••»•».... . 43.8 52.2 60. 1 67. 8 75.2 80.3 84.2 87. 1 89.3 91.2 92.8 94.5 95.6 96.9 97.6MISCELLANEOUS BUSINESS SERVICES ....................... ...... . 46.4 52.1 56.6 60. 5 64.8 68.5 71.8 74.7 77.2 79.6 81.7 83.8 85.3 87.4 89.3AUTO REPAIR, SERVICES, AND GARAGES 40.2 46.0 5C.8 54.9 59.6 63.9 67.8 72.0 75.7 79.4 82.8 86.7 88.4 91.8 94.6MISCELLANEOUS REPAIR SERVICES .................................... 31.2 36.8 41.4 45.5 49.6 53.6 58.0 62.3 6 6 . 2 70.1 74.5 79.4 82.7 87.7 91.7MOTION PICTURES •«•••••»•••«••••••••••••••••••»•••••••••••••••• 56.3 61.3 64.7 67.7 70.3 72.5 75.0 76.7 79.6 81.5 83.5 85.7 87.3 89.4 91.4AMUSEMENT AND RECREATION SERVICES, NEC ««•».••»».»••••••••••••• 62.8 6 8 . 8 73.4 76.6 79.7 82.2 84.6 8 6 . 8 88.5 90.1 91.6 93.1 94.0 95.2 96.2MEDICAL ANC OTHER HEALTH SERVICES ••»•«••••••••»••••••••••••••• • 31.0 37.9 45.2 53. 8 62.1 69.3 75.5 80.3 84.0 86.7 89.0 91.5 93.2 95.2 96.6LEGAL SERVICES •••••»«•*»••«••••••••••••»•••••••••••••••••••••• 24.0 30.4 36.3 41.2 46.7 53.0 59.8 65.8 71.5 76.5 80.4 85.6 86.9 89.3 90.8EDUCATIONAL SERVICES 31.9 38.1 43.2 47.5 51.4 55.2 58.9 62.5 6 6 . 6 70.7 75.2 80.0 83.1 86.9 89.4MUSEUMS, BOTANICAL, ZOOLOGICAL GARDENS ••••••••••••••••«••.»•«• 47.1 53.2 56.9 60.6 64.3 68.9 72.3 76.0 79.1 81.8 84.0 88.9 90.5 93.8 95.7NONPROFIT MEMBERSHIP ORGANIZATIONS'.............................. 55.4 60.6 65.3 69.5 73.6 77.3 80.5 83.3 85.9 8 8 . 2 90.0 91.6 92.9 94.4 95.4p r i v a t e h o u s e h o l d s •••»•••»•»•••»•»••«••••••«•••••••••••••••••• 77.1 85.9 91.0 94.2 96.5 97.6 98.4 '98.8 99.3 99.6 99.7 99.8 99.8 99.9 99.9MISCELLANECLS SERVICES * 23.3 28.4 32.5 36.2 39.6 43.6 47.7 52.1 55.8 59.2 62.8 66.4 68.9 72.7 76.7
Digitized for FRASER http://fraser.stlouisfed.org/ Federal Reserve Bank of St. Louis
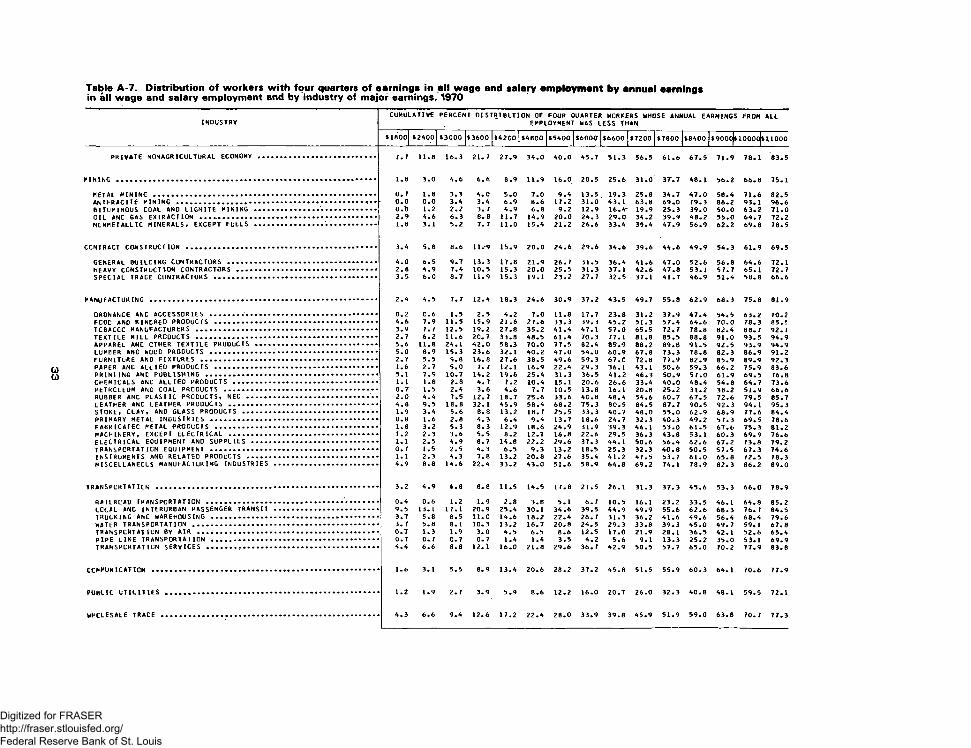
INDUSTRYCUMU LATIVE PERCENT DISTRIBUTION OF FOUR QUARTER WORKERS WHOSE ANNUAL EARNINGS FROM
EMPLOYMENT WAS LESS THANALL
$1800 $2400 $3000 $3600 $4200 $4800 $5400 $6ooa $6600 $7200 $7800 $8400 $9000 $ 1 0 0 0 0 $ 1 1 0 0 0
PRIVATE NONAGRICULTURAL ECONOMY ............................. 7.7 1 1 . 8 16.3 21.7 27.9 34.0 40.0 45.7 51.3 56.5 61.6 67.5 71.9> 78.1 83.5
1 . 8 3.0 4.6 6 . 6 8.9 11.9 16.0 20.5 25.6 31.0 3T.7 48.1 56.2! 6 6 . 8 75.1
METAL MINING ....................................................... 0.7 1 . 8 3.3 4.0 5.0 7.0 9.4 13.5 19.3 25.8 34.7 47.0 58.4 71.6• 82.5o.o 3 . 4 3 . 4 6.9 17.2 31.0 43.1 63.8 69 .0 79.3
BITUMINOUS COAL AND LIGNITE M I N I N G ................'•............. o .Ib 1 . 2 2 . 2 3.7 4.9 6 . 8 9.2 12.9 16.4- 19.9 25.3 39.0 50. C1 63.2! 71*0OIL ANC GAS EXTRACTION . . . ............... ......................... 2.9 4.6 6.3 8 . 8 11.7 14.9 2 0 . 0 24.3 29.0 34.2 39.9 48.2 55.C> 64.7' 72.2NCNMETALLIC MINERALS » EXCEPT FUELS .............................. 1 . 8 3.1 5.2 7.7 1 1 . 0 15.4 2 1 . 2 26.6 33.4 39.4 47.9 56.9 62.2! 69.8l 78.5
CONTRACT CONSTRUCTION .............................................. . 3. A 5.8 8 . 6 11.-9 15.9 2 0 . 0 24.6 29.6 34.6 39.6 44.6 49.9 54.3l 61.91 69.5
GENERAL BUILCING CONTRACTORS ..................................... 4.0 6.5 9.7 13.3 17.8 21.9 26.7 31.5 36.4 41.6 47.0 52.6 56.81 64.6» 72.1HEAVY CONSTRUCTION CONTRACTORS ................................... 2 . 8 4.9 7.4 10.5 15.3 2 0 . 0 25.5 31.3 37.1 42.6 47.8 53.1 57.7' 65.1 72.7SPECIAL TRACE CONTRACTORS ......................................... 3.5 6 . 0 8.7 11.9 15.3 19.1 23.2 27.7 32.5 37.1 41.7 46.9 51.4t 58.81 6 6 . 6
2.4 4.5 7.7 12.4 18.3 24.6 30.9 37.2 43.5 49.7 55.8 62.9 68.3l 75.81 81.9
ORDNANCE ANC ACCESSORIES ........ ................................. 0 . 2 C . 6 1.5 2.5 4.2 7.0 1 1 . 8 17.7 23.8 31.2 37.9 47.4 54.5 63.2! 70.2FCOC AND KINDRED PRODUCTS ......................................... 4.6 7.9 11.5 15.9 21.6 27.6 33.3 39.3 45.2 51.3 57.4 64.6 70.Cl 78.31 85.5TOBACCO MANUFACTURERS ............................................. 3.9 7.7 12.5 19.2 27.8 35.2 41.4 47.1 57.0 65.5 72.7 78.8 82.4 88.7 92.7
2.7 6.2 11.6 20.7 33.8 48.5 61.4 70.3 77.1 81.8 85.5 88.8 91.C1 93.5i 94.9APPAREL ANC OTHER TEXTILE PRODUCTS .............................. 5.6 11.8 24.1 42.0 58.3 70.0 77.5 82.4 85.9 88.2 89.8 91.5 92.5> 93.9( 94.9LUMBER ANC WOOD PRODUCTS .......................................... 5.0 8.9 15.3 23.6 32.1 40.2 47.0 54.0 60.9 67.8 73.3 78.8 82.3l 86.9l 91.2FURNITURE AND FIXTURES ............................................ 2.7 5.5 9.8 16.8 27.6 38.5 49.6 59.3 67.0 T2.8 77.9 82.9 85.9i 89.9i 92.3
1.6 2.7 5.0 7.7 12.1 16.9 22.4 29.3 36.1 43.1 50.6 59.3 66.2 75.9i 83.65.1 7.9 10.7 14.2 19.6 25.4 31.3 36.5 41.2 46.3 50.9 57.0 61.9> 69.5i 76.8
CHEMICALS ANC ALLIED PRODUCTS .................................... 1.1 1.8 2.8 4.7 7.2 10.4 15.1 20.6 26.6 33.4 40.0 48.4 54.81 64.7r 73.6PETROLEUM AND COAL PRODUCTS ...................................... 0.7 1.5 2.4 3.6 4.6 7.7 10.5 13.8 16.1 20.8 25.2 31.2 38.2! 51.9> 66.6RUBBER ANC PLASTIC PROOUCTS, NEC .............................. • 2.0 4.4 7.5 12.7 18.7 25.6 33.6 40.8 48.4 54.6 60.7 67.5 72.6. 79.5i 85.7
4.8 9.5 18.8 32. 1 45.9 58.4 68.2 75.3 80.5 84.5 87.7 90.5 92.3l 94.1 95.3STONE, CLAY, AND GLASS PROOUCTS .................................. 1.9 3.4 5.6 8.8 13.2 18.7 25.5 33.3 40.7 48.0 55.0 62.9 68.9i 77.6• 84.4PRIMARY METAL INDUSTRIES .......................................... 0.8 1.6 2.8 4. 3 6.4 9.4 13.7 18.6 24.7 32.3 40.3 49.2 57.3l 69.5> 78.6FABRICATED METAL PRODUCTS ........................................ 1.8 3.2 5.3 8.3 12.9 18.6 24.9 31.9 39.3 46.1 53.0 61.5 67.6. 75.3l 81.2MACHINERY, EXCEPT ELECTRICAL ..................................... 1.2 2.3 3.6 5.5 8.2 12.1 16.8 22.6 29.5 36.3 43.8 53.1 60.3t 69.9l 76.6ELECTRICAL EQUIPMENT AND SUPPLIES ............................... 1. 1 2.5 4.9 8.7 14.8 22.2 29.6 37.3 44.1 50.6 56.4 62.6 67.2 73.81 79.2TRANSPORTATION EQUIPMENT .......................................... 0.7 1.5 2.5 4. 3 6.5 9.3 13.2 18.5 25.3 32.3 40.8 50.5 57.5 67.3l 74.6INSTRUMENTS AND RELATED PRODUCTS ................................. 1.1 2.3 4.3 7.8 13.2 20.8 27.6 35.4 41.2 47.5 53.7 61.0 65.8l 72.5i 78.3MISCELLANEOUS MANUFACTURING INDUSTRIES .......................... 4,9 8.8 14.6 22.4 33.2 43.0 51.6 58.9 64.8 69.2 74.1 78.9 82.3l 86.2 89.0
3.2 4.9 6.8 8.8 11.5 14.5 17.8 21.5 26.1 31.3 37.3 45.6 53.3 66.01 78.9
RAILROAD TRANSPORTATION .................................. '........ 0.4 0.6 1.2 1.9 2.8 3.8 5.1 6.7 10.5 16.1 23.2 33.5 46.1 64.8l 85.2LOCAL ANC INTERUR8 AN PASSENGER TRANSIT .......................... 9.5 13.1 17.1 20.9 25.4 30.1 34.6 39.5 44.9 49.9 55.6 62.6 68.3 76.7 84.5t r u c k i n g a n c w a r e h o u s i n g .......................................... 3.7 5.8 8.5 11.0 14.6 18.2 22.4 26.7 31.3 36.2 41.6 49.6 56.4 68.4 79.6WATER TRANSPORTATION ......................... ..................... 3.7 5.8 8.1 10.3 13.2 16.7 20.8 24.5 29.3 33.8 39.3 45.0 49.7 59.1 67.8TRANSPORTATION BY AIR .............................................. 0.7 1.3 1.9 3.0 4.5 6.5 8.6 12.5 17.0 21.9 28.1 36.5 42.1 52.6. 65.4PIPE LINE TRANSPORTATION .......................................... 0.7 0.7 0.7 0.7 1.4 1.4 3.5 4.2 5.6 9.1 13.3 25.2 35.0l 53.1 69.9t r a n s p o r t a t i o n s e r v i c e s ........................................... 4.4 6.6 8.8 12. 1 16.0 21.8 29.6 36.7 42.9 50.5 57.7 65.0 70.2 77.9> 83.8
r ru M iik i i r i T t n b ________________________________ ____________ 1.6 3.1 5.5 8. 9 13 4 20 6 28 • 2 37.2 45 8 51 5 55 9 60 3
1.2 1.9 2.7 3.9 5.9 8.6 12.2 16.0 20.7 26.0 32.3 40.8 48.1 59.5 72.1
WHOLESALE TRACE ............... ....................................... 4.3 6.6 9.4 12.6 17.2 22.4 28.0 33.9 39.8 45.9 51.9 59.0 63.8 70.7 77.3
Digitized for FRASER http://fraser.stlouisfed.org/ Federal Reserve Bank of St. Louis
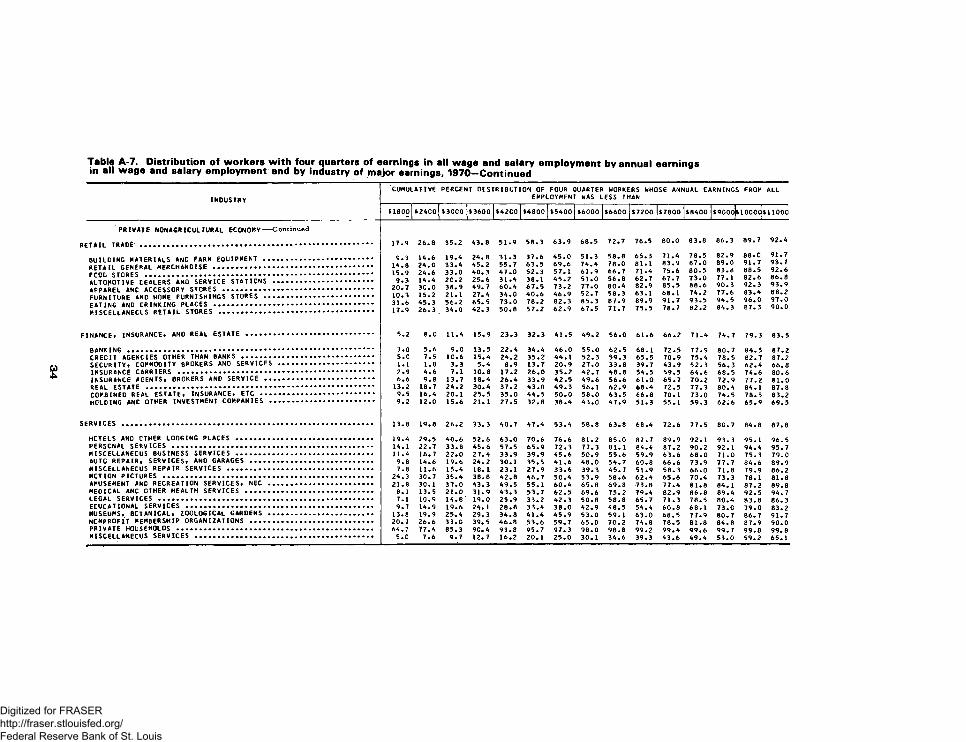
INDUSTRY
PRIVATE NONAGRICULTURAL e c o n o m y
RETAIL TRADE ..............................
BUILDING MATERIALS AND FARM EQUIPMENTRETAIL GENERAL MERCHANDISE ...........FCOD STORES .............................AUTOMOTIVE CEALERS AND SERVICE STATIONS .APPAREL ANC ACCESSORY STORES .............FURNITURE AND HOME FURNISHINGS STORES ...EATING ANO CRINKING PLACES ...............MISCELLANEOUS RETAIL STORES ..............
FINANCE* INSURANCE* AND REAL ESTATE .......
BANKING .....................................CREDIT AGENCIES OTHER THAN BANKS ........SECURITY* COMMODITY BROKERS AND SERVICESINSURANCE CARRIERS ........................INSURANCE AGENTS. BROKERS ANC SERVICE ...REAL ESTATE ................................COMBINED REAL ESTATE. INSURANCE. ETC .... HOLDING ANC OTHER INVESTMENT COMPANIES ..
SERVICES ......................................
HCTELS ANO CTHER LODGING PLACES .........PERSONAL SERVICES .........................MISCELLANEOUS BUSINESS SERVICES .........AUTO REPAIR, SERVICES, AND GARAGES ......MISCELLANEOUS REPAIR SERVICES ............MOTION PICTURES ............................AMUSEMENT AND RECREATION SERVICES, NEC ..MEDICAL ANC OTHER HEALTH SERVICES .......LEGAL SERVICES .............................EDUCATIONAL SERVICES ......................MUSEUMS* BOTANICAL, ZOOLOGICAL GARDENS ..NONPROFIT m e m b e r s h i p ORGANIZATIONS ......PRIVATE HOUSEHOLDS ........................MISCELLANEOUS SERVICES ....................
CUMULATIVE PERCENT DISTRIBUTION OF FOUR QUARTER WORKERS WHOSE ANNUAL EARNINGS FROM ALL EMPLOYMENT WAS LESS THAN
H 8 0 0 $2400 $3000 $3600 $4200 $4800 $5400 $6000 $6600 $7200 |$7800 $8400 $900ojlnooco| $11000
17.9 26.8 35.2 43.8 51.9 58.3 63.9 68.5 72.7 76.5 80.0 83.8 86.3 89.7 92.4
9.3 14.6 19.4 24.8 31.3 37.6 45.0 51.3 58.8 65.3 71.4 78.5 82.9 88.0 91.7
14.8 24.0 33.4 45.2 55.7 63.5 69.6 74.4 78.0 81.1 83.9 87.0 89.0 91.7 93.7
15.9 24.6 33.0 40. 3 47.0 52.3 57.1 61.9 66.7 71.4 75.6 80.5 83.8 88.5 92.6
9.3 14.4 20.2 25.6 31.4 38.1 45.2 51.0 56.8 62.7 67.7 73.0 77.1 82.6 86. 8
20.7 3C.0 38.9 49.7 60.4 67.5 73.2 77.0 80.4 82.9 85.5 88.6 90.3 92.3 93.9
10.3 15.2 21.1 27.4 34.0 40.6 46.9 52.7 58.3 63.1 68.1 74.2 77.6 83.4 88.231.6 45.3 56.2 65.5 73.0 78.2 82.3 85.3 87.9 89.9 91.7 93.5 94.5 96.0 97.017.9 26.3 34.0 42. 3 50.8 57.2 62.9 67.5 71.7 75.5 78.7 82.2 84.3 87.3 90.0
5.2 8.0 11.4 15.9 23.3 32.3 41.5 49.2 56.0 61.6 66.2 71.4 74.7 79.3 83.5
3.0 5.6 9.0 13.5 22.4 34.4 46.0 55.0 62.5 68.1 72.5 77.9 80.7 84.5 87.25.0 7.5 10.6 15.4 24.2 35.2 44.1 52.3 59.3 65.5 70.9 75.4 78.5 82.7 87.21.1 1.8 3.3 5.4 8.9 13.7 20.9 27.0 33.8 39.7 43.9 52.3 56.3 62.4 66.82.9 4.6 7.1 10.8 17.2 26.0 35.2 42.7 48.8 54.5 59.5 64.6 68.5 74.6 80.66.6 9.8 13.7 18.4 26.4 33.9 42.5 49.6 56.6 61.0 65.7 70.2 72.9 77.2 81.0
13.2 18.7 24.2 30.4 37.2 43.0 49.3 56.1 62.9 68.4 72.5 77.3 80.4 84. 1 87.89.5 16.4 20.1 25.5 35.0 44.5 50.0 58.0 63.5 66.8 70.1 73.0 74.5 78.5 83.29.2 12.0 15.6 21.1 27.5 32.8 38.4 43.0 47.9 51.3 55.1 59.3 62:6 65.9 69.5
13.8 19.8 26.2 33.3 40.7 47.4 53.4 58.8 63.8 68.4 72.6 77.5 80.7 84.8 87.8
19.4 29.5 40.6 52.6 63.0 70.6 76.6 81.2 85.0 87.7 89.9 92.1 93.3 95. 1 96.514.1 22.7 33.8 45.6 57.5 65.9 72.3 77.3 81. 1 84.4 87.2 90.2 92. 1 94.4 95.711.4 16.7 22.0 27.4 33.9 39.9 45.6 50.9 55.6 59.9 63.6 68.0 71.0 75.3 79.09.8 14.6 19.6 24.2 30.1 35.5 41.6 48.0 54.7 60.8 66.6 73.9 77.7 84.6 89.97.8 11.6 15.4 18. 1 23.1 27.9 33.6 39.3 45.7 51.9 58.3 66.0 71.8 79.9 86.2
24.3 30.7 35.4 38.8 42.8 46.7 50.4 53.9 58.6 62.4 65.6 70.4 73.3 78.1 81.821.8 30.1 37.0 43.3 49.5 55.1 60.4 65.8 69.8 73.8 77.4 81.8 84.1 87.2 89.88.1 13.5 21.0 31.9 43.3 53.7 62.5 69.6 75.2 79.4 82.9 86.8 89.4 92.5 94.77.1 10.9 14.8' 19.0 25.9 33.2 42.3 50.8 58.8 65.7 71.3 78.5 80.4 83.8 86.39.7 14.9 19.6 24. 1 28.8 33.4 38.0 42.9 48.5 54.4 60.8 68.1 73.0 79.0 83.2
13.8 19.9 25.4 29.3 34.8 41.4 45.9 53.0 59.1 63.0 68.5 77.9 80.7 86.7 91.720.7 26.6 33.0 39.5 46.8 53.6 59.7 65.0 70.2 74.8 78.5 81.8 84.8 87.9 90.064.7 77.4 85.3 90.4 93.8 95.7 97.3 98.0 98.8 99.2 99.4 99.6 99.7 99.8 99.85.0 7.6 9.7 12.7 16.2 20.1 25.0 30.1 34.6 39.3 43.6 49.4 53.0 59.2 65.1
Digitized for FRASER http://fraser.stlouisfed.org/ Federal Reserve Bank of St. Louis

35
INOUSTRY
CUMULATIVE PERCENT DISTRIBUTION OF INDUSTRY OF
FOUR QUARTER WORKERS WHOSE ANNUAL EARNINGS IN THEIR MAJOR EARNINGS WAS LESS THAN
(1800 (2400 (3000 (3600 (4200 (4800 (5400 (6000 (6600 (7200 (7800 (8400 (9000 (lOGOoj(11000
PRIVATE NONAGRICULTURAL ECONOMY ..................... ........ 7.7 11.8 16.3 21.7 27.9 34.0 40.0 45.7 51.3 56.5 61.6 67.5 71.9 78.1 83.5
M I N I N G .................. *....................................*............ 3.2 5.3 7.2 9.7 12.3 15.5 19.4 23.7 28.8 33.8 40.2 50.1 57.8 68.1 76.0
METAL MINING ............... ........................................... 2.5 3.7 5.3 6.5 7.9 9.7 12.6 16.2 21.8 27.6 37.2 49.9 60.5 72.9 83.3ANTHRACITE MINING ..................................................... 0.0 0.0 3.4 5.2 10.3 12.1 20.7 37.9 51.7 69.0 74.1 82.8 89.7 94.8 96.6BITUMINOUS COAL AND LIGNITE MINING ............................... 1.9 2.5 3.4 5.7 7.4 9.7 12.3 15.9 19.5 22.7 27.8 40.6 51.7 64.5 71.7OIL AND GAS EXTRACTION .............................................. 4.4 7.4 9.4 12.8 15.9 19.4 23.2 27.5 32.2 36.9 42.2 50.0 56.3 66.2 73.5NCNMETALLIC MINERALS* EXCEPT FUELS ............................... 3.3 6.6 9.6 12.2 15.6 20.3 25.6 31.2 37.8 44.1 51.3 59.9 64.6 71.6 79.7
CONTRACT CONSTRUCTION .................................................. 5.3 8.3 11.7 15.2 19.4 23.7 28.1 33.0 37.9 42.9 47.8 52.8 56.9 64.0 71.2
GENERAL BUILDING CONTRACTORS ....................................... 7.1 10.7 15.0 19.0 24.1 29.0 34.1 39.3 44.5 49.9 55.1 59.7 63.3 69.5 75.8HEAVY CONSTRUCTION CONTRACTORS .................................... 5.7 9.2 12.7 16.5 21.5 27.1 32.7 38.8 44.3 49.9 54.7 59.0 62.8 69.3 76.1SPECIAL TRACE CONTRACTORS .......................................... 6.0 9.0 12.5 16. 1 20.0 23.9 28.3 32.8 37.7 42.4 47.0 51.9 55.8 62.6 69.7
MANUFACTURING ............................................................ 3.4 5.9 9.3 14. 1 20.0 26.3 32.5 38.9 45.1 51.3 57.3 64.2 69.4 76.8 82.6
ORDNANCE a n c a c c e s s o r i e s ............................................ 0.9 2.1 3.2 4.9 6.9 9.8 14.5 20.5 26.7 34.1 40.9 49.6 56.5 64.8 71.5FOOD AND KINDRED PRODUCTS .......................................... 6.9 10.9 14.7 19. 1 24.6 30.3 36.0 41.8 47.6 53.4 59.3 66.3 71.4 79.5 86.6TCBACCC MANUFACTURERS ................................................ 5.2 9.9 15.1 21.6 30.0 36.9 43.0 48.5 58.1 67.1 74.6 81.3 84.7 89.7 93.2TEXTILE MILL PRODUCTS ................................................ 5.0 9.3 15.0 24.0 36.9 50.7 63.3 71.7 78.3 82.8 86.3 89.5 91.6 93.8 95.1APPAREL AND OTHER TEXTILE PRODUCTS ............................... 7.4 14.2 26.1 43. 8 59.7 71.0 78.3 83.1 86.6 88.8 90.2 91.8 92.8 94. 1 95.0LUMBER AND WOOD PRODUCTS ................................... ........ 7.6 12.7 19.1 27.2 35.6 43.0 49.4 56.6 63.2 69.6 74.7 79.7 83.1 87.3 91.5FURNITURE AND FIXTURES .............................................. 5.9 9.3 14.2 2C.9 31.2 42.2 53.0 61.9 69.0 74.6 79.5 84.2 86.9 90.6 92.7PAPER AND ALLIEO PRODUCTS .......................................... 3.2 5.0 7.6 1C.6 15.0 19.8 25.3 31.9 38.6 45.3 52.5 61.2 67.9 77.1 84.3p r i n t i n g a n c p u b l i s h i n g ................ ............................ 6.8 9.9 12.9 16.7 22.0 27.6 33.2 38.2 42.9 47.8 52.2 58.4 63.2 70.7 77.8CHEMICALS AND ALLIED PRODUCTS ..................................... 2.0 3.3 4.8 6.8 9.6 13.1 17.6 23.2 28.9 35.6 42.0 50.0 56.3 66.0 74.7PETROLEUM AND COAL PRODUCTS ........................................ 1.9 3.1 3.8 5.2 6.9 9.8 12.3 16.2 18.6 23.3 27.4 33.0 39.8 53.4 67.9RUBBER ANC PLASTIC PRODUCTS, NEC .................................. 4.3 7.5 11.2 16.0 22.0 28.4 36.4 43.2 50.7 56.9 62.8 69.2 74.2 80.6 86.6LEATHER ANC LEATHER PRODUCTS ....................................... 8.1 13.7 22.1 34.5 48.1 60.1 69.7 76.5 81.7 85.8 88.7 91.5 93.0 94.4 95.5STONE, CLAY, AND GLASS PRODUCTS ................................... 3.7 6.1 9.3 12.9 17.1 22.8 29.3 36.8 43.9 50.8 57.4 64.7 70.2 78.8 85.2PRIMARY METAL INDUSTRIES ............................................ 1.8 3.2 4.9 6.6 8.7 11.7 15.9 20.9 26.9 34.6 42.7 51.4 59.5 71.2 80.2FABRICATED METAL PRODUCTS ......................................... 3.4 5.8 8.2 11.5 16.4 22.2 28.4 35.1 42.5 49.2 56.2 64.2 69.9 77.1 82.4MACHINERY, EXCEPT ELECTRICAL ....................................... 2.4 3.9 5.6 8. 1 11.2 15.4 20.1 25.8 32.5 39.3 46.8 55.8 62.5 71.4 77.6ELECTRICAL EQUIPMENT AND SUPPLIES ................................ 2.5 4.7 7.5 11.3 17.6 24.8 32.3 39.9 46.7 53.2 58.9 64.5 68.9 75.0 80.2TRANSPORTATION EQUIPMENT ........................................... 1.6 2.9 4.5 6.6 9.0 12.2 16.1 21.6 28.4 35.7 44.3 53.2 59.6 69.0 75.8INSTRUMENTS ANO RELATED PRODUCTS .................................. 2.4 4.4 6.8 11.0 16.3 23.0 29.8 37.9 43.5 50.1 56.1 62.9 67.4 73.9 79.3MISCELLANEOUS MANUFACTURING INDUSTRIES .......................... 7.9 12.6 18.7 26.6 36.5 46.1 54.5 61.5 67.6 71.4 75.7 80.4 83.5 87.1 89.7
TRANSPORTATION ........................................................... 4.5 6.7 8.9 11.4 14.2 17.2 20.5 24.2 28.6 33.6 39.6 47.8 55.3 67.7 80.3
RAILROAD TRANSPORTATION ............................................. 0.8 1.5 2.3 2.9 3.8 5.0 6 .5 8.2 12.1 17.5 24.7 35.3 48. 1 67.1 87. 1LOCAL ANO IISTERURBAN PASSENGER T R A N S I T .......................... 11.5 16.0 19.6 23.7 28.0 32.7 37.0 41.8 46.8 51.6 57.2 64.4 69.9 78.4 85.9TRUCKING ANC WAREHOUSING ............................................ 5.8 8.7 11.8 14.9 18.6 22.5 26.5 30.7 35.1 39.5 44.7 52.3 58.6 69.8 80.7WATER TRANSPORTATION ................................................. 5.6 8. 1 10.9 13.8 17.2 20.5 24.9 28.7 33.5 38.9 44.0 50.3 54.9 63.2 71.0TRANSPORTATION BY AIR ............................................... 1.3 2.3 3.4 5.0 7.1 9.3 11.3 15.0 18.9 23.5 29.9 37.8 43.4 53.9 66.5PIPE LINE TRANSPORTATION ............................................ 0.7 0.7 2.8 2.8 2.8 4.9 7.7 11.2 15.4 20.3 25.9 30.8 37.8 54.5 72.7TRANSPORTATION SERVICES ............................................. 6.4 9.8 12.9 17.8 21.5 27.4 34.0 40.3 46.8 53.7 61.0 68.2 73.5 81.C 86.0
COMMUNICATION ............................................................. 2.7 4.8 7.5 1C.9 15.5 22.2 29.7 38.6 46.9 52.6 56.8 61.1 64.8 71.2 78.5
PUBLIC UTILITIES ................... .................................. . 1.9 2.8 4.1 5.5 7.4 10.3 14.1 17.9 22.4 27.4 33.7 42.3 49.6 60.8 73.3
WHOLESALE t r a c e ......................................................... 6.1 9.0 12.4 16.0 20.5 25.7 31.3 37.1 42.8 48.6 54.4 61. 1 65.5 72.0 78.3
Digitized for FRASER http://fraser.stlouisfed.org/ Federal Reserve Bank of St. Louis
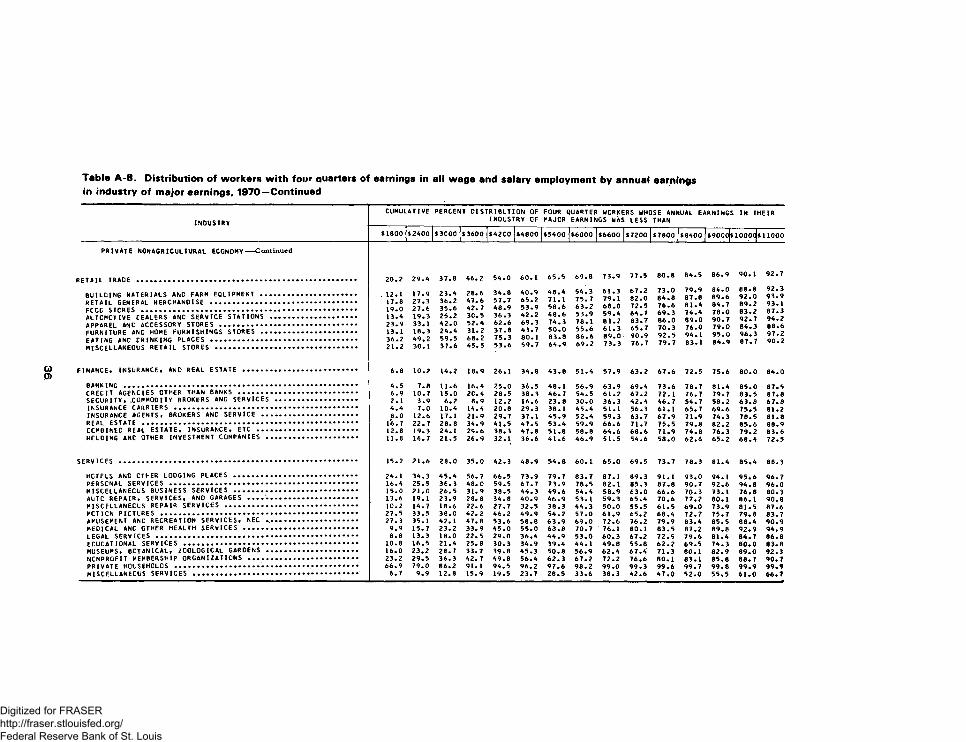
CUMULATIVE PERCENT DISTRIBUTION OF FOUR QUARTER WORKERS WHOSE ANNUAL EARNINGS IN THEIRINOUSTRY INOUSTRY OF MAJOR EARNINGS WAS LESS THAN
$1800 S2A00 $3000 $3600 $A2C0 $A800 |$5A00 | $6000 |$6600 |$7200 $7800 ]$8400|| $900o|$ ioooc|$ 1 1 0 0 0
PRIVATE NONAGRICULTURAL ECONOMY--Continued
RETAIL TRADE ....................................................... 2 0 . 2 29.A 37.8 A6.2 5A.0 60.1 65.5 69.8 73.9 77.5 80.8 84.5 86.9 90.1 92.7
BUILDING MATERIALS AND FARM EQUIPMENT ........................RETAIL GENERAL MERCHANDISE ....................................FCOC STORES ......................................................AUTOMOTIVE CEALERS ANC SERVICE STATIONS .....................APPAREL ANC ACCESSORY STORES ..................................FURNITURE AND HOME FURNISHINGS STORES ........................EATING ANC CRINKING PLACES ....................................MISCELLANEOUS RETAIL STORES ...................................
. 1 2 . 117.819.0 13.A23.913.136.22 1 . 2
17.927.3 27.619.333.118.3 A9.230.1
23.A36.2 35.625.2 A2.0 2A.A59.537.6
28.6 A7.6 A2.7 30.5 52. A 31.2 6 8 . 2 A5.5
3A.857.7 A8.936.3 62.637.875.3 53.6
AO.965.2 53.9 A2.269.3 A3.7 80.1 59.7
A8 .A71.158.6A8 . 67A.350.083.86A.9
54.375.763.253.978.155.68 6 . 669.2
61.379.1 6 8 . 0 59.A81.261.3 89.073.3
67.282.072.56A.783.765.7 90.976.7
73.0 84.876.669.38 6 . 070.3 92.579.7
79.9 87.8 81.A 74.A89.076.0 9A.183.1
84.089.6 8A.778.090.779.095.0 8A.9
8 8 . 892.089.283.292.784.396.387.7
92.3 93.993.187.394.2 8 8 . 697.290.2
FINANCE, INSURANCE, AND REAL ESTATE ............................ 6 . 8 1 0 . 2 IA.2 18.9 26.1 3A.8 A3 . 8 51.4 57.9 63.2 67.6 72.5 75.6 80.0 84.0
A.5 7.8 1 1 . 6 16.A 25.0 36.5 A8.1 56.9 63.9 69.A 73.6 78.7 81.4 85.0 87.5CREDIT AGENCIES OTHER THAN BANKS .............................. 6.9 10.7 15.0 20. A 28.5 38.3 A6.7 54.5 61.2 67.2 72.1 76.7 79.7 83.5 87.8SECURITY, .COMMODITY BROKERS AND SERVICES .................... 2 . 1 3.9 6 . 2 8.9 1 2 . 2 16.6 23.8 30.0 36.3 42.4 46.7 5A.7 58.2 63.8 67.8
A.A 7.0 1 0 .A 14.4 2 0 . 8 29.3 38.1 45.4 51.1 56.3 61.1 65.7 69.6 75.5 81.2INSURANCE AGENTS, BROKERS AND SERVICE ........................ 8 . 0 1 2 . 6 17.1 21.9 29.7 37.1 A5.9 52.4 59.3 63.7 67.9 71.9 74.3 78.5 81.8
l'6.7 22.7 28.8 3A.9 A l. 5 A7.5 53.A 59.9 6 6 . 6 71.7 75.5 79.8 82.2 85.6 88.9COMBINED REAL ESTATE, INSURANCE, ETC ......................... 1 2 . 8 19.3 2A.1 29.6 38.3 A7.8 51.8 58.8 6 A . 6 6 8 . 6 71.9 74 . 8 76.3 79.2 83.6HCLCING ANC OTHER INVESTMENT COMPANIES ....................... 1 1 . 8 16.7 21.5 26.9 32.1 36.6 A 1 . 6 46.9 51.5 5A.6 58.0 62.6 65.2 6 8 .A 72.5
15.2 2 1 . 6 28.0 35.0 A2.3 A8.9 5A.8 60.1 65.0 69.5 73.7 78.3 81.4 85.A 88.3
HOTELS ANC OTHER LODGING PLACES ................... ........... 2A . 1 3A.3 A5.A 56.7 66.5 73.9 79.7 83.7 87.1 89.3 91.1 93.0 94.1 95.6 96.7PERSONAL SERVICES ............................................... 16.A 25.5 36.3 A8.0 59.5 67.7 73.9 78.5 82.1 85.3 87.8 90.7 92.6 94.8 96.0MISCELLANEOUS BUSINESS SERVICES ............................... 15.0 2 1 . 0 26.5 31.9 38.5 AA.3 A9.6 54.4 58.9 63.0 6 6 . 6 70.3 73.1 76.8 80.3AUTO REPAIR, SERVICES, AND GARAGES ............................ 13.6 19.1 23.9 28. 8 3A.8 AO.9 A6.9 53.1 59.3 65.A 70.6 77.2 80.1 8 6 . 1 90.8MISCELLANEOUS REPAIR SERVICES ................................. 1 0 . 2 1A.7 18.6 2 2 . 6 27.7 32.5 38.3 AA.3 50.0 55.5 61.5 69.0 73.9 81.5 87.6
27.5 33.5 38.0 A?.2 A6.2 A9.9 5A.2 57.0 61.9 65.2 6 8 .A 72.7 75.7 79.8 83.7AMUSEMENT ANC RECREATION SERVICES, NEC ....................... 27.3 35.1 A2.1 A7.8 53.6 58.8 63.9 69.0 72.6 76.2 79.9 83.A 85.5 88.4 90.9MEDICAL ANC OTHER HEALTH SERVICES ............................ 9.9 15.7 23.2 33.9 A5.0 55.0 63.8 70.7 76.1 80.1 83.5 87.2 89.8 92.9 94.9LEGAL SERVICES .................................................. 8 . 8 13.3 18.0 22.5 29.0 36.A AA.9 53.0 60.3 67.2 72.5 79.6 81.4 84.7 8 6 . 8
1 0 . 8 16.5 2 1 .A 25.8 30.3 3A.9 39.4 AA. 1 A9.8 55.8 62.2 69.5 74.3 8 0 . 0 83.8MUSEUMS* BOTANICAL, ZOOLOGICAL GARDENS ....................... 16.0 23.2 28.7 33.7 39.8 A5.3 50.8 56.9 62.A 67.4 71.3 80.1 82.9 89.0 92.3NONPROFIT MEMBERSHIP ORGANIZATIONS ........................... 23.2 29.5 36.3 A2.7 A9.8 56.4 62.3 67.2 72.2 76.6 80.1 83.1 85.8 88.7 90.7PRIVATE HOUSEHOLDS ............................................. 66.9 79.0 8 6 . 2 91. 1 9A.5 96.2 97.6 98.2 99.0 99.3 99.6 99.7 99.8 99.9 99.9MISCELLANEOUS SERVICES ......................................... 6.7 9.9 1 2 . 8 15.9 19.5 23.7 28.5 33.6 38.3 A2.6 A7.0 52.0 55.5 61.0 66.7
Digitized for FRASER http://fraser.stlouisfed.org/ Federal Reserve Bank of St. Louis
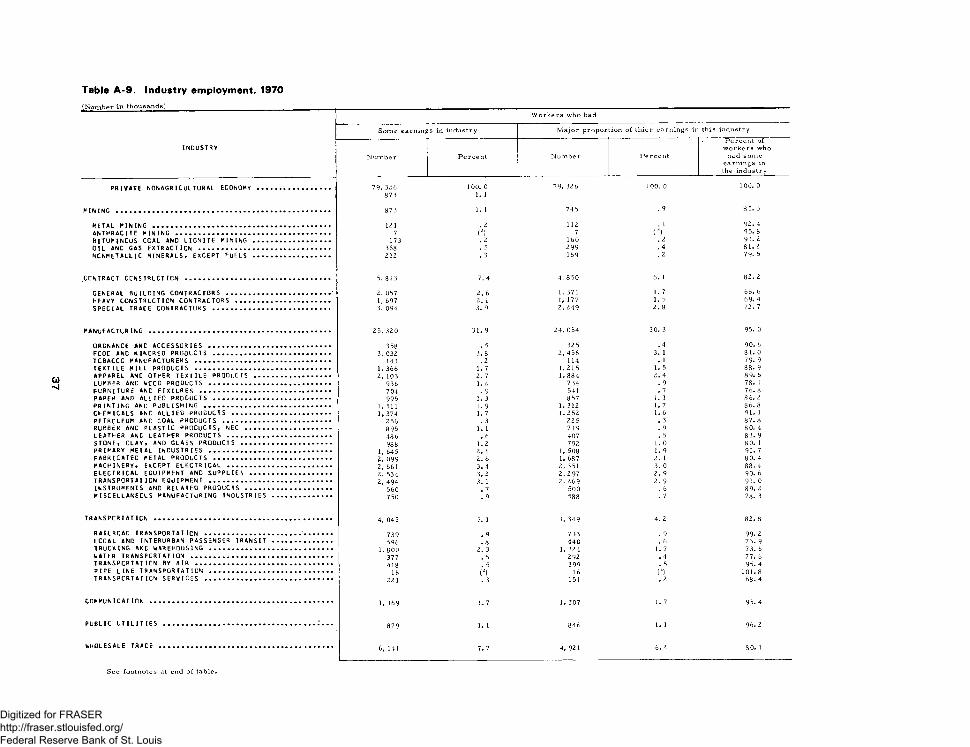
Table A -9 . Industry employment, 1970(Num ber in thousands)______.
INDUSTRY
PRIVATE NONAGRICULTURAL ECONOMY
MINING ................................ .
METAL MINING .......................ANTHRACITE MINING ................. ,BITUMINOUS CCAL AND LIGNITE MINING OIL ANC GAS EXTRACTION ...........n c n m e t a l l i c m i n e r a l s , e x c e p t f u e l s
CONTRACT CONSTRUCT ION ..........
GENERAL BUILDING CONTRACTORS . HEAVY CONSTRUCTION CONTRACTORS SPECIAL TRACE CONTRACTORS ....
m a n u f a c t u r i n g .............................
ORDNANCE ANC ACCESSORIES ..............FCOC ANC KINCRED PRODUCTS ............ .TCBACCC m a n u f a c t u r e r s ................. .TEXTILE MILL PRODUCTS ..................APPAREL ANC OTHER TEXTILE PRODUCTS ....LUMBER ANC WCCO PRODUCTS ...............FURNITURE ANC FIXTURES ................ .PAPER AND ALLIED PROCUCTS ............ .PRINTING ANC PUBLISHING ................CHEMICALS ANC ALLIED PROCUCTS ........PETROLEUM ANC COAL PRODUCTS .......... .RUBBER ANC PLASTIC PROCUCTS, NEC .... .LEATHER ANC LEATHER PRODUCTS ......... .STONE, CLAY, AND GLASS PRODUCTS .......PRIMARY METAL INDUSTRIES ..............FABRICATED METAL PRODUCTS ............MACHINERY, EXCEPT ELECTRICAL .........ELECTRICAL EQUIPMENT AND SUPPLIES ....TRANSPORTATION EQUIPMENT ..............INSTRUMENTS AND RELATED PRODUCTS .....MISCELLANECUS MANUFACTURING INDUSTRIES
TRANSPORTATION ...........................
RAILROAD TRANSPORTATION ...............LOCAL AND INTERURBAN PASSENGER TRANSITTRUCKING ANC WAREHOUSING ..............WATER TRANSPORTATION ..................TRANSPORT AT ICN BY AIR .................PIPE LINE TRANSPORTATION ..............TRANSPORTATION SERVICES ...............
COMMUNICATION
PUBLIC UTILITIES
WHOLESALE TRACE
See footnotes at end of table,
W orkers who had
Some earnings in industry M ajo r proportion of thier earnings in this industry
N umbe r Percent Numbe r Percent
Percent of workers wh<
had some earnings in the industry
79, 326 100. 0 79, 326 100. 0 100. 0873 I. 1
873 1. 1 745 . 9 85. 3
121 . 2 112 . 1 92. 47 ( 2) 7 ( 3) 95. 8
173 . 2 160 . 2 93.2368 . 5 299 . 4 81.2212 . 3 169 . 2 79- 5
5, 843 7.4 4, 850 6. 1 82. 2
2, 057 2. 6 1, 371 1. 7 66. 61, 697 2. 1 1, 177 1. 5 69. 43, 094 3. 9 2, 249 2. 8 72. 7
25, 320 31. 9 24,054 3 0. 3 95. 0
3 58 . 5 325 .4 90. 63, 032 3.8 2, 456 3. 1 81. 0
143 . 2 114 . 1 79. 91. 366 1. 7 1.215 1. 5 88. 92, 103 2. 7 1, 884 2.4 8 9- 6
936 1.2 734 . 9 78. 4704 . 9 541 . 7 76. 8995 1. 3 857 1. 1 8 6. 2
1, 511 1. 9 1. 312 1. 7 86. 81, 374 1. 7 1. 252 1. 6 91. 1
256 . 3 225 . 3 87. 8895 1. 1 719 . 9 8 0. 4486 . 6 407 . 5 83. 9988 1. 2 792 1. 0 8 0. 1
1, 645 2. 1 1, 508 I. 9 91. 72, 099 2. 6 1, 687 2. 1 80. 42, 661 3. 4 2, 351 3. 0 88. 42, 534 3. 2 2, 297 2. 9 90. 62, 494 3. 1 2, 269 2. 9 91. 0
560 . 7 500 . 6 8 9. 3750 . 9 588 . 7 78. 3
4, 04 5 5. 1 3, 349 4.2 82.8
739 . 9 733 . 9 99.2596 . 8 440 . 6 73. 9
1, 800 2. 3 1, 324 1. 7 73. 6377 . 5 292 . 4 77, 6418 . 5 399 . 5 95. 4
16 (2) 16 ( 2) 101. 8221 . 3 151 . 2 68. 4
1, 369 1.7 1. 307 1. 7 95. 4
879 1. 1 846 1. 1 96. 2
6, 141 7. 7 4, 921 6.2 8 0. 1
Digitized for FRASER http://fraser.stlouisfed.org/ Federal Reserve Bank of St. Louis
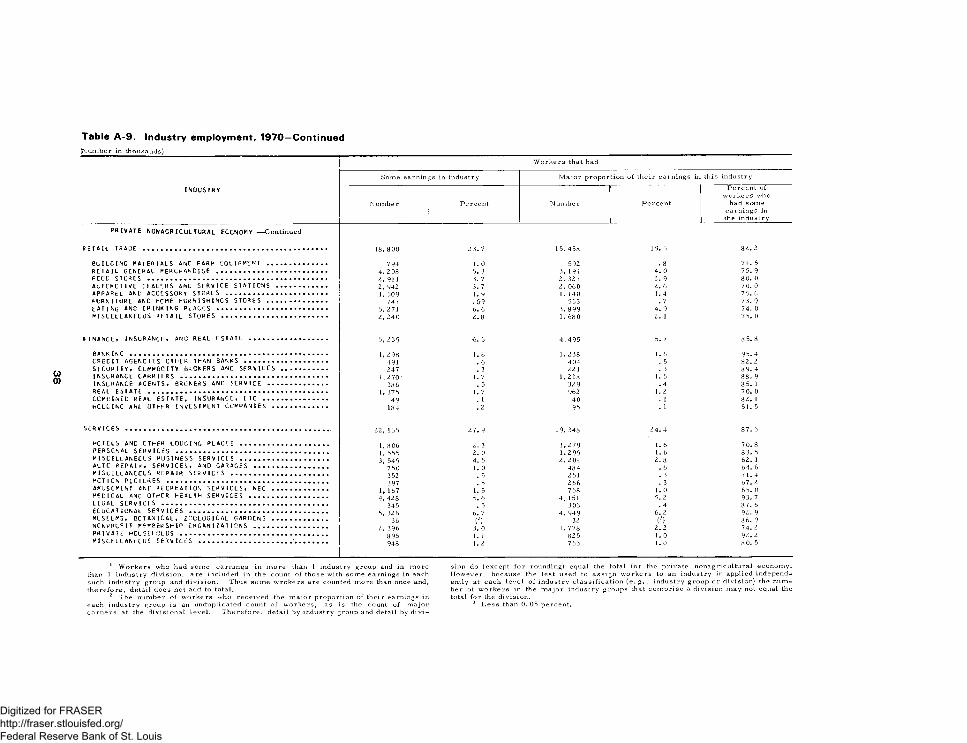
(Number in thousands)
INDUSTRY
Worker s that had
Some earnings in industry M a jo r proportion of their earnings in this industry
Numbe r Percent N umbe r Percent
Percent of workers who
had some earnings in the industry
PRIVATE NONAGRICULTURAL ECONOMY ---- Continued
r e t a i l t r a d e ................................................... 18, 800 23. 7 15, 458 19. 5 82. 2
BUILDING MATERIALS AND FARM EQUIPMENT ................ 7 94 1. 0 592 . 8 74. 5r e t a i l g e n e r a l m e r c h a n d i s e .............................. 4, 208 5. 3 3, 194 4. 0 7 5. 9FCCC STORES .................................................. 2, 911 3. 7 2, 327 2. 9 80. 0AUTOMOTIVE CEALERS AND SERVICE STATIONS .............. 2, 942 3. 7 2, 060 2. 6 7 0. 0APPAREL AND ACCESSORY STORES ............................ 1, 509 1. 9 1. 140 1. 4 75. 6FURNITURE ANC HOME FURNISHINGS STORES ................ 747 • •99 553 . 7 73. 9EATING AND CRINKING PLACES .............................. 5, 271 6. 6 3, 899 4. 9 74. 0MISCELLANEOUS RETAIL STORES ............................. 2, 240 2.8 1. 680 2. 1 75. 0
FINANCE. INSURANCE. AND REAL ESTATE ..................... 5, 239 •6. 6 4,495 5. 7 8 5. 8
BANKING ....................................................... 1, 2 98 1. 6 1. 238 1. 6 95. 4CREDIT AGENCIES OTHER THAN BANKS ....................... 491 . 6 404 . 5 82. 2SECURITY, CCMMOCITY BROKERS AND SERVICES ............. 247 . 3 221 . 3 89. 4INSURANCE CARRIERS ......................................... 1, 2 70 1. 7 1, 218 1. 5 88. 9INSURANCE AGENTS, BROKERS ANC SERVICE .............................. 386 . 5 32 9 . 4 85. 1REAL ESTATE .................................................. 1, 375 1. 7 962 1. 2 7 0. 0COMBINED REAL ESTATE, INSURANCE, ETC .................. 49 . 1 40 . 1 82. 1HOLDING ANC OTHER INVESTMENT COMPANIES ............... 184 .2 95 . 1 51. 5
SERVICES ........................................................ 22, 165 27. 9 19, 348 24. 4 87. 3
HCTELS ANC CTHER LODGING PLACES ........................ 1, 806 2. 3 1,279 1. 6 70. 8PERSONAL SERVICES .......................................... 1, 555 2. 0 1. 299 1. 6 83. 5MISCELLANEOUS BUSINESS SERVICES ........................ 3, 549 4. 5 2.2 04 2. 8 62. 1AUTC REPAIR, SERVICES, AND GARAGES .................... 750 1. 0 484 . 6 64. 6MISCELLANEOUS REPAIR SERVICES ........................... 352 . 5 251 . 3 7 1.4MOTION PICTURES ............................................. 397 . 5 266 . 3 67. 2AMUSEMENT ANC RECREATION SERVICES, NEC ............... 1, 167 1. 5 758 1. 0 65. 0MEDICAL ANC OTHER HEALTH SERVICES ...................... 4, 428 5. 6 4,151 5. 2 93. 7LEGAL SERVICES .............................................. 345 . 5 303 . 4 87. 6EDUCATIONAL SERVICES ...................................... 5, 326 6. 7 4, 949 6. 2 92. 9MUSEUMS, BOTANICAL, ZOOLOGICAL GARDENS ............... 36 (1 2) 32 (2) 86. 9NONPROFIT MEMBERSHIP ORGANIZATIONS .................... 2, 396 3. 0 1. 778 2. 2 74. 2PRIVATE HOUSEHOLDS ......................................... 895 1. 1 825 1. 0 9 2 . 2MISCELLANEOUS SERVICES ..........................■'......... 948 1. 2 763 1. 0 8 0. 5
1 W orkers who had some earnings in more than 1 industry group and in more than 1 industry division, are included in the count of those with some earnings in each such industry group and division. Thus some wrokers are counted more than once and, therefore, detail does not add to total.
2 The number of workers who received the major proportion of their earnings in each industry group is an unduplicated count of workers, as is the count of major earners at the divisional level. Therefore , detail by industry group and detail by d ivi
sion do (except for rounding) equal the total for the private nonagricultural economy. However, because the test used to ass ign workers to an industry in applied independently at each level of industry classification ( e . g . , industry group or division) the number of workers in the major industry groups that comprise a division may not equal the total for the division.
3 L e s s than 0. 05 percent.
Digitized for FRASER http://fraser.stlouisfed.org/ Federal Reserve Bank of St. Louis
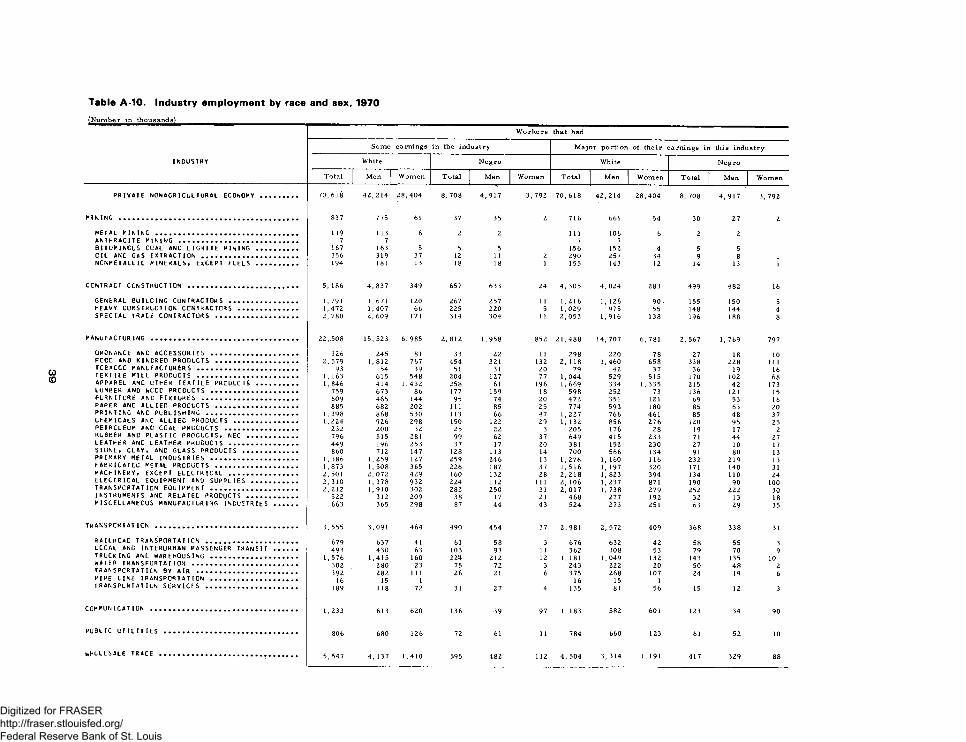
Workers that had
INDUSTRY
Some earnings in the industry M ajo r portion of their earnings in this industry
White Negro White Negro
Total Men Women T otal Men Women Total Men Women T otal Men Women
PRIVATE NONAGRICULTURAL ECONOMY .......... 70,618 42,214 28,404 B, 708 4,917 3, 792 70,618 42,214 28,404 8, 708 4, 917 3, 792
MINING ................................................. 837 775 61 37 35 2 716 661 54 30 27 2
METAL MINING ....................................... 1 19 113 6 2 2 1 11 106 6 2 2ANTHRACITE MINING ................................. 7 7 7 7BITUMINOUS COAL AND LIGNITE MINING ........... 167 163 5 5 5 1.56 152 4 5 5OIL AND GAS EXTRACTION ........................... 356 319 37 12 11 2 290 257 34 9 8NCNMET ALL IC MINERALS, ExCEPT FUELS ........... 194 181 13 18 18 1 155 143 12 14 13 1
CONTRACT CONSTRUCTION .............................. 5, 186 4, 837 349 657 633 24 4, 305 4, 024 283 499 482 16
GENERAL BUILCING CONTRACTORS ................... 1, 791 1,671 120 267 257 11 1,216 1, 126 90 • 155 150 5HEAVY CONSTRUCTION CONTRACTORS ................ 1,472 1,407 66 225 220 5 1,029 975 55 148 144 4SPECIAL TRACE CONTRACTORS ....................... 2, 780 2, 609 171 314 304 11 2, 053 1,916 138 196 188 8
MANUFACTURING ......................................... 22 ,.508 15,523 6, 985 2, 812 1,958 852 21,488 14,707 6, 781 2, 567 1, 769 797
ORCNANCE ANC ACCESSORIES ........................ 326 245 81 33 22 11 298 220 78 27 18 10FOOD AND KINCREO PRODUCTS ....................... 2, 579 1,812 767 454 321 132 2, 118 1,460 658 338 228 111TOBACCO MANUFACTURERS ............................ 93 54 39 51 31 20 79 42 37 36 19 16TEXTILE MILL PRODUCTS ............................ 1, 163 615 548 204 127 77 1,044 529 515 170 102 68APPAREL ANC OTHER TEXTILE PRODLCTS ........... 1,846 414 1,432 258 61 196 1,669 334 1, 335 215 42 173LUMBER AND WCCC PRODUCTS ........................ 759 673 86 177 159 18 598 252 73 136 121 15FURNITURE ANC FIXTURES .......................... 609 465 144 95 74 20 472 351 121 69 53 16PAPER ANC ALLIED PROCUCTS ....................... 885 682 202 111 85 25 7 74 593 180 85 63 20PRINTING ANC PUBLISHING ......................... 1, 398 868 530 113 66 47 1, 227 766 461 85 48 37CHEMICALS ANC ALL I EC PRODUCTS ................. 1,224 926 298 150 122 29 1, 132 856 276 120 95 25PETROLEUM AND COAL PROCUCTS .................... 232 200 32 25 22 3 205 176 28 19 17 2RUBBER ANC PLASTIC PROCUCTS, NEC .............. 796 515 281 99 62 37 649 415 233 71 44 27LEATHER ANC LEATHER PRODUCTS ................... 449 196 253 37 17 20 381 152 230 27 10 17STONE, CLAY, AND GLASS PRODUCTS ............... 860 712 147 128 113 14 700 566 134 91 80 13PRIMARY METAL INDUSTRIES ........................ 1, 386 1,259 127 259 246 13 1, 276 1, 160 116 232 219 13F A e R I C A T E C METAL PRODUCTS ....................... 1,873 1, 508 365 226 187 37 1,516 1, 197 320 171 140 31MACHINERY, EXCEPT ELECTRICAL ................... 2, 501 2, 072 429 160 132 28 2,218 1, 823 394 134 110 24ELECTRICAL EQUIPMENT AND SUPPLIES ............. 2, 310 1, 378 932 224 112 111 2, 106 1, 237 871 190 90 100TRANSPORTATION EQUIPMENT ........................ 2, 212 1,910 302 282 250 31 2,017 1, 738 279 252 222 30INSTRUMENTS ANC RELATED PRODUCTS .............. 522 312 209 38 17 21 468 277 192 32 13 18MISCELLANEOUS MANUFACTURING INDUSTRIES ...... 663 365 298 87 44 43 524 273 251 63 29 35
t r a n s p o r t a t i o n ....................................... 3, 555 3, 091 464 490 454 37 2,981 2, 572 409 368 338 31
RAILRCAC TRANSPORTATION ......................... 679 637 41 61 58 3 676 632 42 58 55 3LOCAL AND INTERURBAN PASSENGER TRANSIT ...... 493 430 63 103 93 1 1 362 308 53 79 70 9TRUCKING ANC WAREHOUSING ........................ 1, 576 1,415 160 224 212 12 1, 181 1,049 132 143 135 10WATER TRANSPORTATION ............................. 302 280 23 75 72 3 243 222 20 50 48 2TRANSPORTATION BY AIR ............................ 392 282 111 26 21 6 375 268 107 24 19 6PIPE LINE TRANSPORTATION ........................ 16 15 1 1 6 15 1TRANSPORTATION SERVICES ......................... 189 118 72 31 27 4 135 81 56 15 12 3
COMMUNICATION ......................................... 1, 233 613 620 136 39 97 1, 183 582 601 123 34 90
PUBLIC UTILITIES ..................................... 806 680 126 72 61 11 784 660 123 61 52 10
WHOLESALE TRACE ...................................... 5, 547 4, 137 1,410 595 482 112 4, 504 3, 314 1, 191 417 329 88
Digitized for FRASER http://fraser.stlouisfed.org/ Federal Reserve Bank of St. Louis
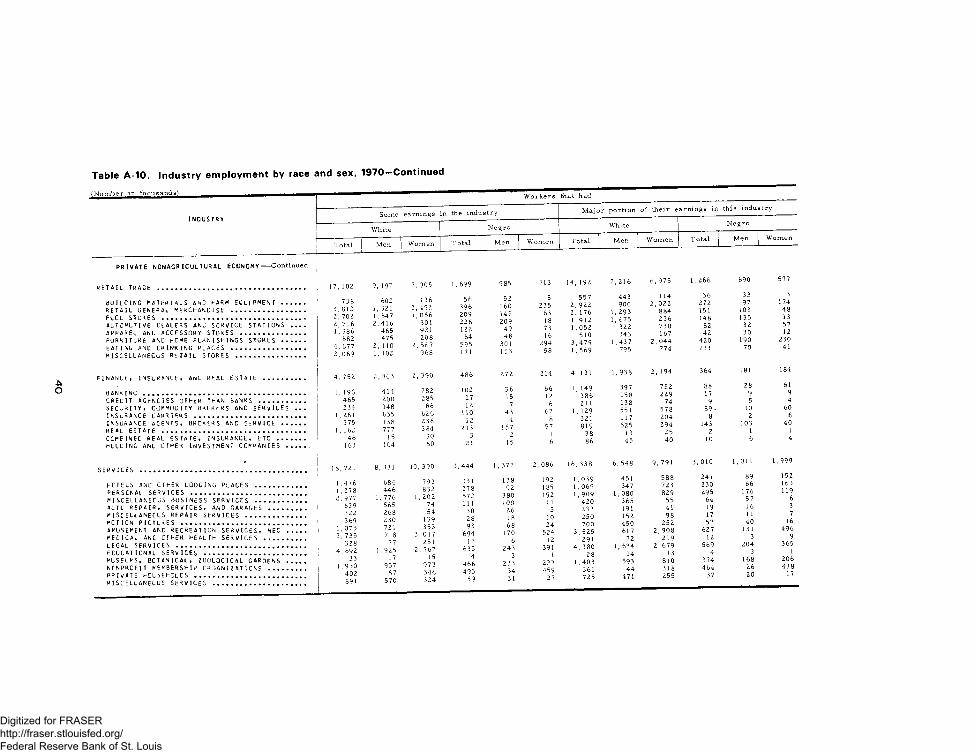
( N u m j ^ Worker s that had
INOUSTRYSome earnings in the industry M ajo r portion of their earnings in this industry
White Negro White Negro
Total Men Women Total | Men j Women T otal Men Women Total Men Women
PRIVATE NONAGRICULTURAL ECONOMY---- Continued
RETAIL TRACE 17, 102 9, 197 7, 905 1, 699
BUILCING m a t e r i a l s a n c f a r m EQUIPMENT ......RETAIL GENERAL MERCHANDISE ....................FCCL STORES ........................................AUTOMOTIVE CEALERS ANC SERVICE STATIONS ....APPAREL ANC ACCESSORY STORES ..................FURNITURE ANC HOME FURNISHINGS STORES ......EATING ANC CRINKING PLACES ....................MISCELLANEOUS RETAIL STORES ...................
738 602 136 563,812 1, 321 2,492 3962,702 1, 647 1,056 2092,716 2,416 301 2261, 386 465 921 122
682 475 208 644, 677 2, 110 2, 567 5952,069 1, 102 968 171
FINANCE, INSURANCE, An C REAL ESTATE 4,752 2, 363 2, 390 486
BANKING .............................................CRECIT AGENCIES OTHER THAN BANKS .............SECURITY, COMMOCITY BROKERS ANC SERVICES ...INSURANCE CARRIERS ...............................INSURANCE AGENTS, BROKERS ANC SERVICE ......REAL e s t a t e ........................................CCMEINEC REAL ESTATE, INSURANCE, ETC ........HCLLING ANC CTHER INVESTMENT COMPANIES .....
1, 196 414465 200234 148
1, 261 635375 138
1, 162 77746 15
163 104
782 10-2285 27
86 12626 110236 123 84 213
30 360 21
SERVICES 8,331 10,390 3,444
HOTELS ANC CTHER LODGING PLACES ......PERSONAL SERVICES .............. .........MISCELLANEOUS BUSINESS SERVICES ......AUTO REPAIR, SERVICES, AND GARAGES ...MISCELLANEOUS REPAIR SERVICES .........MCTICN PICTURES ...........................AMUSEMENT ANC RECREATION SERVICES, NEC MECICAL ANC CTHER HEALTH SERVICES ....LEGAL SERVICES ............................ECUCATICNAL SERVICES .....................MUSEUMS, BOTANICAL, ZOOLOCICAL GARDENS NONPROFIT MEMBERSHIP ORGANIZATIONS ...PRIVATE HOUSEHOLDS .......................MISCELLANEOUS SERVICES ..................
1,4761,2782, 977
639 322 369
1,0733, 735
3284, 692
331,930
402 891
684 793446 832
1,776 1,202565 74268 54230 139721 353718 3,01777 251
1,925 2,76717 15
957 97357 346
570 324
331 278 572 111
30 28 93
694 17
635 4
466493
59
985
521601452094948
301113
272
36157
434
1572
15
1, 377
13892
380100261868
1706
2433
2333431
713 14,192
5 557235 2 , 9 2 2
63 2, 17618 1 , 9 1 2
73 1,05216 510
294 3,47958 1, 569
214 4,13 1
66 1, 14912 3866 211
67 1, 1298 321
57 8191 386 86
2, 086 16,338
192 1,039185 1,069192 1,90.911 4205 233
10 25024 700
524 3, 52512 291
391 4, 3801 28
233 1,403459 361
27 725
7, 216 6, 975
443 1 14900 2, 022
1, 293 8841, 675 236
322 730343 167
1,437 2, 044795 774
1,938 2, 194
397 752158 229138 74551 578117 204525 294
13 2545 40
6, 548 9, 791
451 588347 723
1,080 829365 55191 41152 98450 252617 2, 908
72 2191,634 2, 679
14 13593 81044 318
471 255
1, 266
36 272 151 148 82 42
420 1 11
364
179
898
1432
10
3, 010
241230295
64191757
62712
5694
374464
37
690
3397
1031353230
19070
181
2895
302
10316
1 , 011
89 66
176 57 16 11 40
131 3
2043
1682620
577
317448135712
2304!
184
6194
606
4014
1, 999
152163119
637
16496
93651206438
17
Digitized for FRASER http://fraser.stlouisfed.org/ Federal Reserve Bank of St. Louis
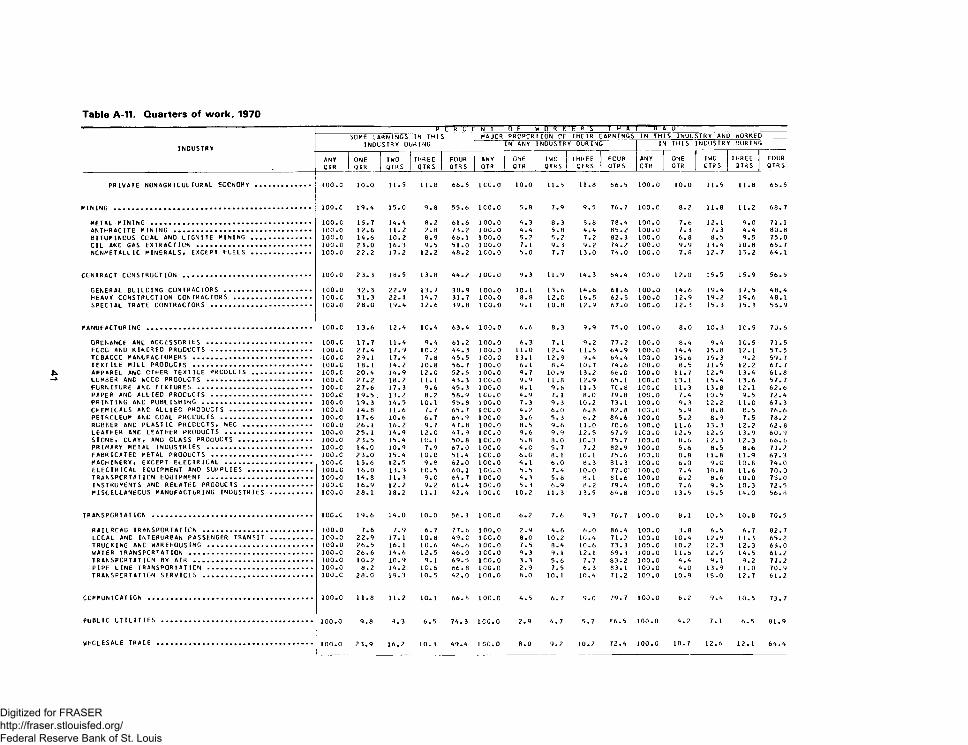
INDUSTRY
PRIVATE NONAGRICULTURAL ECCNCMY
PINING ....................................
PETAL MINING ..........................ANTHRACITE PINING ...................BITUPINCUS CCAL AND LIGNITE PININGCIL ANC GAS EXTRACTION .............NCNPETALLIC MINERALS, EXCEPT FUELS
c c n t r a c t c o n s t r u c t i o n ........ ..
GENERAL BUILDING CONTRACTORS . HEAVY CONSTRUCTION CONTRACTORS SPECIAL TRACE CONTRACTORS ....
MANUFACTURING .............................
ORCNANCE ANC ACCESSORIES ...............FCCC AND KINCRED PRODUCTS ............ .TCBACCC MANUFACTURERS .................TEXTILE MILL PROOUCTS ................. .APPAREL ANC OTHER TEXTILE PRODUCTS ....LUMBER ANC WCCC PRODUCTS ...............FURNITURE ANC FIXTURES ................ .PAPER AND ALLIED PRODUCTS .............PRINTING ANC PUBLISHING ................CHEMICALS ANC ALL I EC PRODUCTS ........ .PETROLEUM ANC COAL PRCCUCTS .......... .RUBBER ANC PLASTIC PRCCUCTS, N E C ......LEATHER ANC LEATHER PRODUCTS ......... .STONE, CLAY, AND GLASS PROCUCTS .......PRIMARY METAL INDUSTRIES ...............FABRICATEC PETAL PRODUCTS ............ .MACHINERY, EXCEPT ELECTRICAL ......... .ELECTRICAL EQUIPMENT AND SUPPLIES ....TRANSPORTATION EQUIPMENT ..............INSTRUMENTS ANC RELATEC PRODUCTS .....MISCELLANEOUS MANUFACTURING INDUSTRIES
TRANSPORTATION .............................. .
RAILRCAO TRANSPORTATION ................LOCAL ANC INTERURBAN PASSENGER TRANSITTRUCKING anc w a r e h o u s i n g ..............WATER TRANSPORTATION ....................TRANSPORTATION BY AIR ...................PIPE LINE TRANSPORTATION ...............TRANSPORTATION SERVICES ................
CCPPUMCAT ICN
PUBLIC UTILITIES
H U E N T o T — w fl ft K r r § T M l- - - - H A uSOME EARNINGS IN THIS
INDUSTRY DURINGMAJOR PROPORTION OF THEIR EARNINGS IN THIS INDUSTRY AND WORKED
IN ANY INDUSTRY OURING IN THIS !INDUSTRY OURING
ANYGTR
—ONEQTR
TWOQTRS
THREEQTRS
FOURQTRS
ANYQTR
ONEQTR
TWOQTRS
THREE QTRS J FOUR
QTRSANYQTR
ONEQTR
TWOQTRS
THREEQTRS
FOURQTRS
100.0 10.0 11.5 11.8 66.5 ICO.O 10.0 11.5 11.8 66.5 100.0 10.0 11.5 11.8 66.5
100.c 19.A 15.0 9.8 55.6 1C0.0 5.8 7.9 9.5 76.7 100.C 8.2 11.8 11.2 68.7
100.c 15.7 14.4 8.2 61.6 100.0 4.3 8.3 3.8 78.4 100.0 7.6 12.1 9.0 71.1100.0 12.6 11.2 2.8 73.2 100.0 4.4 5.8 4.4 85.2 100.0 7.3 7.3 4.4 80.8100.0 14.6 10.2 8.9 66. 1 1C0.0 5.2 5.2 7.2 82.3 100.0 6.8 8.5 9.5 75.0IOC .0 23.0 16.3 9.5 51.0 1C0.0 7. L 9. 3 9.2 74.2 100.0 9.9 13.4 10.8 65.7100.0 22.2 17.2 12.2 48.2 1C0.0 5.0 7.7 13.0 74.0 100.0 7.8 12.7 15.2 64. 1
100.0 23.3 18.5 13. 8 44.2 100.0 9.3 11.9 14.3 64.4 100.0 12.0 15.5 15.9 56.5
100.0 32.3 22.9 13. 7 30.9 100.0 10.1 13.6 14.6 61.6 100.0 14.6 19.4 1 7.5 48.4100.c 31.3 22. 1 14.7 31.7 100.0 8.8 12.0 16.5 62.5 100.0 12.9 19.2 19.6 48.1100.0 28.0 19.4 12.6 39.8 1C0.0 9. 1 10.8 12.9 67.0 100.0 12.3 15.3 15.3 56.9
100.c 13.6 12.4 IC.4 63.4 100.0 6.6 8.3 9.9 75.0 100.0 8.0 10.3 1G . 9 70.6
100.c 17.7 11.4 9.4 61.2 100.0 6.3 7.1 9.2 77.2 100.0 8.4 9.4 1C.5 71.5100.c 27.4 17.9 10.2 44.3 100.0 11.0 12.4 11.5 64.9 100.0 14.4 15.8 12.1 57.5100.C 29.1 17.4 7.8 45.5 1C0.C 13.1 12.9 9.4 64.4 100.0 15.6 15.3 9.2 59.7100. c 18. 1 14.2 10. 8 56.7 100.0 6.1 8.4 10.7 74.6 100.0 8.5 11.5 12.2 67. 7100. c 20.4 14.9 12.C 52.5 100.0 9.7 10.9 13.2 66.0 100.0 11.7 12.9 13.4 61.8100.c 27.2 18.2 11. 1 43.3 1C0.0 9.9 11.8 12.9 65. 1 100.0 13. 1 15.4 13.6 57.7100.c 27.6 17.3 9.6 45. 3 100.0 8.1 9.6 11.3 70.8 100.c 11.3 13.8 12.1 62.6100.0 19.5 . 13.2 8.2 58.9 1C0.C 4.9 7. 1 8.0 79.8 100.0 7.4 10.5 9.5 72.4100.0 19.3 14.5 10. 1 55.8 100.0 7.3 9.3 10.2 73.1 100.0 9.3 12.2 11.0 67.3100.0 14.8 11.6 7.7 65.7 1CC.0 4.2 6.0 6.8 82.8 100.c 5.9 8.8 e.5 76.6100.c 17.6 10.6 6.7 64.9 100.0 3.6 5.3 6.2 84.6 ICO.O 5.2 8.9 7.5 78.2100.0 26.1 16.2 9.7 47.8 100.0 8.5 9.6 11.0 7C.6 100.0 11.6 13.3 12.2 62.8100.0 25. 1 14.9 12.C 47.9 1CC.0 9.6 9.9 12.5 67.9 ICO.O 12.5 12.5 13.9 60.9100.0 23.5 15.4 10. 1 50.8 1CC.0 5.8 8.0 10.3 75.7 100.0 8.6 12.3 12.3 66.6100.c 14.0 10.9 7.9 67.0 100.0 4 . C 5.7 7.2 82.9 100.0 5.6 8.5 8.6 77.2100.c 23.0 15.4 1C.C 51.4 1CC.0 6.0 8.1 10.1 75.6 100.0 8.8 11.8 11.9 67.3100.C 15.6 12.5 9.8 62.0 ICO.O 4. 1 6.0 8.3 81.3 1C0.C 6.0 9.0 10.8 74.0100.c 16.0 13.3 10.5 60. 1 1CC.0 5.5 7.4 10.0 77.0' 100.0 7.4 10.8 11.6 70.0100.0 14.8 11.3 9.0 64.7 100.0 4.3 5.8 8.1 81.6 100.0 6.2 8.6 10.0 75.0100.c 16.9 12.2 9.2 61.4 ICO.O 5.3 6.9 8.2 79.4 100.0 7.6 9.5 10.3 72.5100.0 28.1 18.2 11. 1 42.4 100.0 10.2 11.3 13.5 64.8 100.0 13.5 15.5 14.0 56.8
1C0.C 19.6 14.0 10.0 56.3 100.0 6.2 7.6 9.3 76.7 100.0 8. 1 10.5 10.8 70.5
100.0 7.6 7.9 6.7 77.6 100.0 2.9 4.6 6.0 86.4 100.0 3.8 6.5 6.7 82.7100.0 22.9 17. 1 10.8 49.C ICO.O 8.0 10.2 10.4 71.2 100.0 10.4 12.9 11.3 65.2100.0 26.5 16. 1 10.6 46.6 ICO.O 7.5 8.4 10.6 73.3 100.0 10.2 12.3 12.3 65.0100.c 26.6 14.6 12.5 46.0 ICO.O 9.3 9.1 12. 1 69.3 100.0 11.6 12.5 14.5 61.2100.c 10.2 10.9 9. 1 69.5 ICO.O 3.3 5.6 7.7 83.2 100.0 4.4 9.1 9.2 77.2100.0 8.2 14.2 1C.6 66.8 100.0 2.9 7.5 6.3 83.1 100.0 4.0 13.9 1 1.0 70.9100.c 28.0 19.3 10.5 42.0 100.0 8.0 10. 1 10.4 71.2 100.0 10.9 15.0 12.7 61.2
100.0 11.8 11.2 10. 1 66.8 100.0 4.5 6. 7 9.0 79.7 100.0 6.2 9.4 10.5 73.7
100.0 9.8 9.3 6.5 74.3 ICO.O 2.9 4.7 5.7 86.5 100.0 4.2 7.1 6.5 81.9
100.0 23.9 16.2 10. 3 49.4 ICO.O 8.0 9.2 10.2 72.4 100.0 10.7 12.6 12.1 64.4
Digitized for FRASER http://fraser.stlouisfed.org/ Federal Reserve Bank of St. Louis
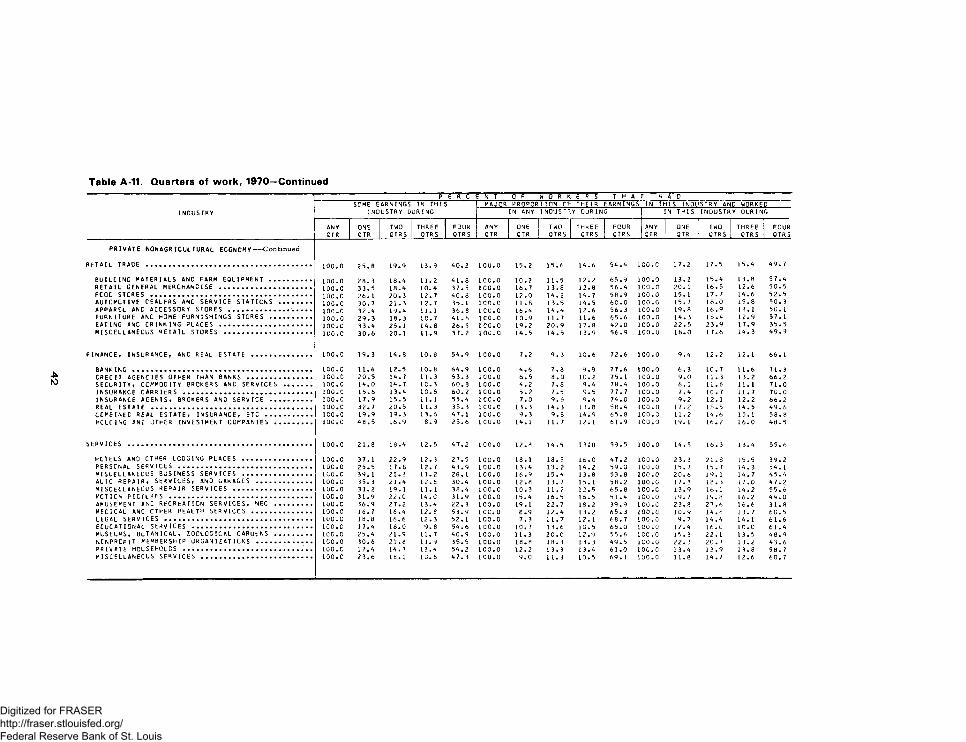
P E R C 1E N T 0 F W O R K E R S T H A r h A DSOME EARNINGS IN THIS MAJOR PROPORTION OF THEIR !EARNINGS IN THIS INOUSTRY AND WORKED
INDUSTRY INDUSTRY DURING IN ANY INDUSTRY OUR 1NG IN THIS INDUSTRY OURING
ANY ONE TWO THREE FOUR ANY ONE TWO THREE FOUR ANY ONE TWO THREE FOURGTR QTR QTRS QTRS QTRS QTR QTR I QTRS GTRS QTRS QTR QTR QTRS QTRS QTRS
PRIVATE NONAGRICULTURAL ECONOMY-- Continued
r e t a i l TRADE .............................................. 100.0 25.8 19.9 13.9 AO.2 100.0 15.2 15.6 1A . 6 5 A . A 100.c 17.2 17.5 15.A A 9 .7
BUILCING MATERIALS ANC FARM EQUIPMENT ........... 100.0 28.3 18.A 11.2 A 1.8 1CC.0 10.2 11.5 12.2 65.9 100.0 13.2 15.A 13.8 57.ARETAIL GENERAL MERCHANDISE ......................... 100.C 33.5 18.A 10. A 37.5 1C0.0 16.7 13.8 12.8 56.A 100.c 20. 1 16.5 12.6 50.5FCOC STORES .............. .............................. 100.0 26.1 20.3 12.7 AO.8 1C0.0 12.0 l A . 2 1A.7 58.9 100.0 15.1 17.7 1A . 6 52.5AUTOMOTIVE CEALERS ANC SERVICE STATIONS ......... 100.C 30.7 21.3 12.7 35.1 ICO.O 11.8 13.5 l A . 5 60.0 100.0 15.7 18.0 15.8 50.3APPAREL ANC ACCESSORY STORES .................. 100.0 32.A 19.A 11. 1 36.8 ICC.O 16.A l A . A 12.6 56.3 ICO.O 19.8 16.9 13.1 50. 1FURNITURE ANC HOME FURNISHINGS STORES ........... 100.0 29.3 18.3 1C. 7 A l . 6 ICO.O 10.9 11.7 11.6 65.6 100.0 1A. 3 15.A 12.9 57.1EATING ANC CRINKING PLACES ......................... 100.c 33.A 25.1 l A. 8 26.5 ICO.O 19.2 20.9 17.8 A2.0 100.0 22.5 23.9 17.9 35.5MISCELLANEOUS RETAIL STORES ........................ 100.c 30.6 20.1 11.9 37.2 100.0 l A . 5 1A . 5 13.9 56.9 100.0 18.0 17.6 1A . 3 A 9.9
FINANCE, INSURANCE, ANC REAL ESTATE ................ 100.0 19.3 1 A. 8 10.8 5A.9 100.0 7.2 9.3 10.6 72.6 100.0 9. A 12.2 12. 1 66.1
BANKING .................................................. ICO.C 11.6 12.5 10.8 6A.9 100.0 A.6 7.8 9.9 77.6 100.0 6.3 1C.7 11.6 71.3CRECIT AGENCIES OTHER THAN BANKS .................. 10C.C 20.5 1A.7 11.3 53.3 ICO.O 6.5 8.0 10.2 75. 1 100.0 9.0 11.3 13.2 66.2SECURITY, COMMODITY BROKERS ANC SERVICES ........ 100.c l A . 0 1A . 7 1C.3 60.8 100.0 A.2 7.8 9. A 78. A 100.0 6.1 11.6 11.1 71.0INSURANCE CARRIERS .................................... 100.c 15.6 13.A 10.6 60.2 100.0 5.2 7.5 9.5 77.7 100.0 7. A 10.7 11.7 70.0INSURANCE AGENTS, BROKERS AND SERVICE ........... 100.c 17.9 15.5 1 l. 1 55.A ICC.O 7.0 9.5 9. A 7 A . 0 100.0 9.2 12.1 12.2 66.2REAL ESTATE ............................................ 100.0 3 2.7 20.5 11.3 35.3 ICO.O 13.3 l A . 3 13.8 58. A ICO.O 17.2 18.5 1A . 5 A9.6CCMBINEC REAL ESTATE, INSURANCE, ETC ............. ICO.C 19.9 19.3 13. 6 A 7 .1 ICO.O 9.3 9.8 1A . 9 65.8 100.0 11.2 1A . 6 15.1 58.8HCLCING ANC OTHER INVESTMENT COMPANIES .......... 100.0 A 8.5 16.9 8.9 25.6 ICO.O IA. 1 11.7 12. 1 61.9 100.0 19. 1 16.2 16.0 A8.5
SERVICES ................................................... 100.0 21.8 18.A 12.5 A7.2 100.0 12.8 1A . 5 13.'0 59.5 100.0 1A . 5 16.3 13.A 55.6
HOTELS AND CTHER LODGING PLACES ................... 10C.C 37.1 22.9 12.3 27.5 100.0 18.1 18.5 16.0 A7.2 100.0 23. 3 21.8 15.5 39.2PERSONAL SERVICES ..................................... 100.0 25.5 17.8 12.7 A3.9 100.0 13.A 13.2 1A . 2 59.0 100.0 15.7 15.7 1A . 3 5 A . 1MISCELLANEOUS BUSINESS SERVICES ................... ICO.C 39. 1 21.3 11.2 28.1 100.0 16.9 15. A 13.8 53.8 100.0 20.6 19. 1 1 A. 7 A5. AALTC REPAIR, SERVICES, AND GARAGES ............... 100.c 35.3 21.A 12.6 30.A 100.0 12.8 13.7 15.1 58.2 100.0 17.3 18.3 17.0 A 7.2MISCELLANEOUS REPAIR SERVICES ...................... 10C.0 31.2 19.1 11. 1 38. A 100.0 10.3 11.2 12.5 65.8 100.c 13.9 16.1 1A.2 55.6MOTION PICTURES ....................................... 10C.C 31.9 22.0 1A . C 31.9 100.0 15.A 16.5 16.5 51 .A 100.0 19.7 19.8 16.2 A A , 0AMUSEMENT ANC RECREATION SERVICES, NEC .......... 100.C 36.9 27.2 13. A 22.3 100.0 19.1 22.7 18.2 39.9 ICO.C 23.8 27.6 16.6 31.8MEDICAL ANC CTHER HEALTH SERVICES ................ 100.c 16.7 16.A 12.8 53.9 ICC.O 8.9 12. A 13.2 65.3 100.0 10.9 1 A . 8 13. 7 60.5LEGAL SERVICES ......................................... 10C.C 18.8 16.6 12.3 52.1 100.0 7.3 11.7 12.1 68.7 100.0 9.7 1A .A 1A. 1 61.6ECUCATIONAL SERVICES ................................. 100.c 1 7.A 18.0 9.8 5A.6 100.0 10.7 13.6 10.5 65.0 100.0 12. A 16.0 10.0 61. AMUSEUMS, BOTANICAL, ZOCLOGICAL GARDENS .......... 100.c 25.A 21.9 11.7 AO.9 100.0 11.3 20.0 12.9 55.6 ICO.O 15.3 22.1 13.5 A 8.9NONPROFIT MEMBERSHIP ORGANIZATIONS ............... ICO.C 30.6 21.8 11.9 35.5 100.0 18.8 18.3 13.3 A9.5 100.0 22.3 20.7 13.2 A3.6p r i v a t e h c l s e h c l c s ................................. 100.c 17.A 1A. 7 13.A 5A.2 ICO.O 12.2 13.3 13.A 61.0 100.c 13.A 13.9 13.8 58. 7MISCELLANEOUS SERVICES ............................... 100.c 23.6 18.1 10.8 A7. 3 ICO.O 9.0 11.3 10.5 69.1 100.0 11.8 1A . 7 12.6 60. 7
Digitized for FRASER http://fraser.stlouisfed.org/ Federal Reserve Bank of St. Louis
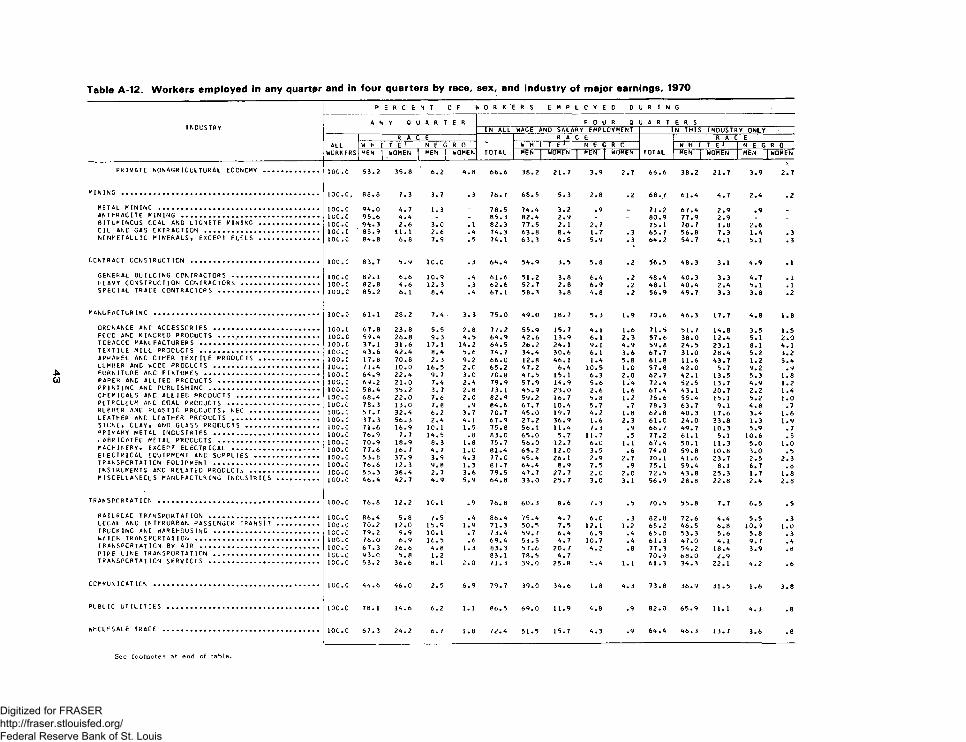
I N D U S T R Y
PRIVATE NCNAGRICULTURAL ECONOMY
MINING .....................................
METAL MINING .........................ANTHRACITE MINING ...................BITUMINCUS CCAL AND LIGNITE MININGCIL ANC GAS EXTRACTION .............NCNMETALLIC MINERALS, EXCEPT FUELS
CONTRACT CONSTRUCTION ............
GENERAL BUILDING CONTRACTORS . HEAVY CONSTRUCTION CONTRACTORS SPECIAL TRACE CONTRACTORS ....
MANUFACTURING ...........................................................
ORDNANCE ANC ACCESSORIES ............................FCCC ANC KINDRED PRODUCTS .........................TCeACCC MANUFACTURERS .................' . ...............TEXTILE MILL PROCUCTS ...................................APPAREL ANC OTHER TEXTILE PRODUCTS . . .LUMBER ANC WCCC PROCUCTS ............................FURNITURE ANC FIXTURES ................................PAPER AND ALLIED PROCUCTS .........................PRINTING ANC PUBLISHING ..............................CHEMICALS ANC ALL I EC PRODUCTS ................PETROLEUM ANC COAL PRODUCTS .....................RUEBER ANC PLASTIC PRODUCTS, NEC ...........LEATHER ANC LEATHER PRODUCTS ...................STONE, CLAY, AND GLASS PROCUCTS ............PRIMARY METAL INDUSTRIES ............................r A B R ICATEC METAL PROCUCTS .........................MACHINERY, EXCEPT ELECTRICAL .................. .ELECTRICAL EQUIPMENT AND SUPPLIES . . . .TRANSPORTATION EQUIPMENT ............................INSTRUMENTS ANC RELATED PRODUCTS ..........MISCELLANEOUS MANUFACTURING INDUSTRIES
TRANSPORTATION ...............................
RAILROAD TRANSPORTATION .................LCCAL ANC INTERURBAN PASSENGER TRANSIT TRUCKING ANC WAREHOUSING ...............w a t e r t r a n s p o r t a t i o n . . . . . . . . . . . . . . . . . . . . . . . . . . . .TRANSPORTATION b y a i r ...................PIPE LINE TRANSPORTATION ...............TRANSPORTATION SERVICES .................
CCMMUN ICAT ION
P U B L I C U T I L I T I E S
W H O L E S A L E T R A C E
P E R C E N T 0 F 1* 0 R K ‘tE R S E M P L C Y E D 0 1U R I N G
A N Y Q U A R T E R F 0 U R Q 1U A R T E R SIN ALL WAGE AND SALARY EMPLOYMENT IN THIS INDUSTRY ONLY
R A C E R A C E R A C • EALL W H I T E 1 N E G R n W H IH T T 1 N E G R C W H I T E l N E G R 0
WORKERS MEN | WOMEN 1 MEM 1 WOMEN TOTAL MEN j WOMEN | MEN | WOMEN TOTAL MEN | WOMEN MEN |WOMEN
100.C 53.2 35.8 6.2 4.8 66.6 38.2 21.7 3.9 2.7 66.6 38.2 21.7 3.9 2.7
100.C, 88.8 7.3 3.7 .3 76.7 68.5 5.3 2.8 .2 68.7 61.4 4.7 2.4 .2
100.C 94.0 4.7 1.3 - 78.5 74.4 3.2 .9 _ 71.2 67.4 2.9 .9 .10C.C 95.6 4.4 - - 85.3 82.4 2.9 - - 80.9 77.9 2.9 - _100.C 94.3 2.6 3.0 .1 82.3 77.5 2. 1 2.7 75.1 70.7 1.8 2.610C.C 85.9 11.1 2.6 .4 74. 3 63.8 8.4 1.7 .3 65.7 56.8 7.3 1.4 .3IOC .C 84.8 6.8 7.9 .5 74.1 63.3 4.5 5.9 .3 64.2 54.7 4.1 5.1 .3
10C.C 83. 7 5.9 1C.C .3 64.4 54.9 3.5 5.8 .2 56.5 48.3 3.1 4.9 .1
IOC .c 82.1 6.6 1C.9 .4 61.6 51.2 3.8 6.4 .2 48.4 40.3 3.3 4.7 . 1100.c 82.8 4.6 12.3 .3 62.6 52.7 2.8 6.9 .2 48.1 40.4 2.4 5.1 .1100.c 85.2 6. 1 8.4 .4 67. 1 58.3 3.8 4.8 .2 56.9 49.7 3.3 3.8 .2
100.0 61.1 28.2 7.4 3. 3 75.0 49.0 18.7 5.3 1.9 70.6 46.3 17.7 4.8 1.8
100.c 67.8 23.8 5.5 2.8 77.2 55.9 15.7 4.1 1.6 71.5 51.7 14.8 3.5 1.510C.C 59.4 26.8 9.3 4.5 64.9 42.6 13.9 6. 1 2.3 57.6 38.0 12.4 5.1 2.0100.c 3 7. 1 31.6 17.1 14.2 64.5 26.2 24.1 9. 1 4.9 59.8 24.5 23.1 8.1 4.1ICO.C 43.6 42.4 8.4 5.6 74.7 34.4 30.6 6. 1 3.6 67.7 31.0 28.4 5.2 3.2100. c l 7.8 70.8 2.3 9.2 66.0 12.8 46.1 1.4 5.8 61.8 11.6 43.7 1.2 5.4100.c 71.4 10.0 16.5 2.0 65.2 47.2 6.4 10.5 1.0 57.8 42.0 5.7 9.2 .9100.c 64.9 22.4 9.7 3.0 70.8 47.5 15.1 6.3 2.0 62.7 42. 1 13.5 5.3 1.810C.C 69.2 21.0 7.4 2.4 79.9 57.9 14.9 5.6 1.4 72.4 52.5 13.7 4.9 1.2100. c 58.4 35.2 3.7 2.8 73.1 45.9 23.0 2.6 1.6 67.4 43. 1 20.7 2.2 1.410C.C 68.4 22.0 7.6 2.0 82.9 59.2 16.7 5.8 1.2 76.6 55.4 15.1 5.2 1.010C.C 78.3 13.0 7.8 .9 84.6 67.7 10.4 5.7 .7 78.3 63.7 9. 1 4.8 .7100.c 57.7 32.4 6.2 3.7 70.7 45.0 19.7 4.2 1.8 62.8 40.3 17.6 3.4 1.6100.c 37. 3 56.3 2.4 4.1 67.9 27.2 36.9 1.6 2.3 61.0 24.0 33.8 1.3 1.9100.c 71.6 16.9 10.1 1.5 75.8 56.1 11.4 7.3 . 9 66.7 49.7 10.3 5.9 . 7100.c 76.9 7 . 7 14.5 .8 83.0 65.0 5.7 11.7 . 5 77.2 61.1 5.1 10.6 . 5100.c 70.9 18.9 8.3 1.8 75.7 56.0 12.7 6.0 1.1 67.4 50. 1 11.3 5 . 0 1 . 0100.c 77.6 16.7 4.7 1 . 0 81.4 65.2 12.0 3.5 .6 74.0 59.8 10.8 3.0 . 5100.c 53.8 37.9 3.9 4.3 77.0 45.4 26.1 2.9 2.7 70.1 41.6 23.7 2.5 2.3100.c 76.6 12.3 9.8 1 . 3 81.7 64.4 8.9 7.5 . 9 75.1 59.4 8.1 6.7 .8ICO.C 55.3 38.4 2.7 3.6 79.5 47.7 27.7 2.0 2.0 72.5 43.8 25.3 1.7 1.8100.c 46.4 42.7 4.9 5.9 64.8 33.0 25.7 3.0 3.1 56.9 28.8 22.8 2.4 2.8
100.c 76.8 12.2 10. 1 . 9 76.8 60.3 8.6 7.3 .5 70.5 55.8 7 . 7 6.5 .5
10C.C 86.4 5.8 7.5' . 4 86.4 75.4 4.7 6.0 . 3 82.8 72.6 4 . 4 5 . 5 . 3100.c 70.2 12.0 15.9 1.9 71.3 50.5 7.5 12. 1 1.2 65.2 46.5 6.8 10.9 1 . 010C.C 79.2 9 . 9 10. 1 . 7 73.4 59.7 6.4 6.9 . 4 65.0 53.3 5.6 5.8 . 31.0C.C 76.0 6.9 1 6 . 5 .6 69.4 53.5 4.7 10.7 . 4 61.3 47.0 4.1 9.7 . 4100.c 67.3 26.6 4.8 1.3 83.3 57.6 20. 7 4.2 .8 77.3 54.2 18.4 3.9 .8ICO.C 93.0 5.8 1.2 83. 1 78.5 4. 7 70.9 68.0 2.91 0 0 . c 53.2 36.6 8 . 1 2.0 71.3 39.0 25.8 5 . 4 1.1 61.3 34.3 22.1 4.2 .6
ICO.C 44.6 46.0 2.5 6.9 79. 7 39.C 34.6 1.8 4.3 73.8 36.9 31.5 1.6 3.8
1 0 0 . c 78.1 14.6 6.2 1.1 86.5 69.0 11.9 4.8 . 9 82.0 65.9 11.1 4.3 .8
1 0 0 . c 67.3 24.2 6.7 1.8 72.4 5 1 . 5 15.7 4.3 . 9 64.4 46.3 13.7 3.6 .8
See footnotes at end of table.
Digitized for FRASER http://fraser.stlouisfed.org/ Federal Reserve Bank of St. Louis
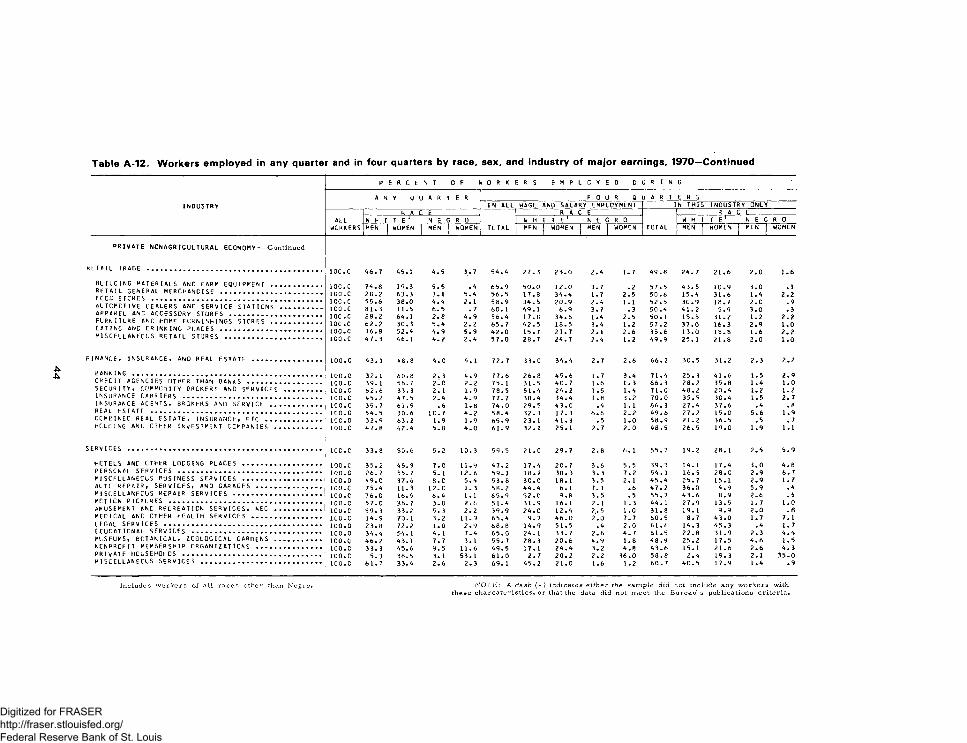
A
INDUSTRY
PRIVATE NONAGRICULTURAL ECONOMY---- Continued
RETAIL TRADE ..............................................................
Bl I LCING MATERIALS AND FARM EQUIPMENT .RETAIL g e n e r a l MERCHANDISE ..........................FCCC STORES ............................................................AUTOMOTIVE DEALERS AND SERVICE STATIONSAPPAREL AND ACCESSORY STORES .....................FLRMTLRE AND HOME FURNISHINGS STORES .EATING AND DRINKING PLACES ..........................MISCELLANEOUS RETAIL STORES .......................
FINANCE* INSURANCE, AND REAL ESTATE ............
BANKING ........................................................................CRECIT AGENCIES OTHER THAN BANKS ..............SECURITY, COMMODITY BROKERS AND SERVICESINSURANCE CARRIERS ...............................................INSURANCE AGENTS, BROKERS AND SERVICE . .REAL ESTATE ...............................................................CCMEINEC REAL ESTATE, INSURANCE, ETC . . . HCLCINC ANC OTHER INVESTMENT COMPANIES .
SERVICES ......................................................................
HOTELS ANC OTHER LODGING PLACES ............PERSONAL SERVICES ............................................MISCELLANEOUS BUSINESS SERVICES ............ALTO REPAIR, SERVICES, AND GARAGES . . .MISCELLANEOUS REPAIR SERVICES .................MOTION PICTURES .................................................AMUSEMENT ANC RECREATION SERVICES, NEC MEDICAL ANC OTHER HEALTH SERVICES . . . .LEGAL SERVICES ...................................................ECUCATIONAL SERVICES .....................................MUSEUMS, BCTAMCAU, ZCOUOGICAL GARDENS NONPROFIT MEMBERSHIP ORGANIZATIONS . . .PRIVATE HOUSEHOLDS ..........................................MISCELLANEOUS SERVICES .................................
p E R C E N T 0 F \» 0 R K 1E R S E M P L C Y E D D U R I N G
A N Y Q U A R T E R 1 F 0 U R Q U A R T E R SIN ALL WAGE AND SALARY’ EMPLOYMENT IN THIS INDUSTRY ONLY
R A C F R A c E R A C EALL W H I T E ‘ N E G R 0 W H I T E 1 N E G R 0 W H I T E 1 N E G R 0
WORKERS MEN WOMEN | MEN J WOMEN TOTAL MFN | WOMEN 1 MEN [ WOMEN TOTAL1
MEN | WOMEN | MEN | WOMEN
10C.C 46.7 45.1 4.5 3. 7 54.4 27.3 23.0 2.4 1.7 49.8 24.7 21.6 2. 0 1.6
IOC.C 74.8 19.3 5.5 .4 65.9 50.0 12.0 3.7 .2 57.5 43.5 10.9 3.0 . !100. C 28.2 63.3 3. 1 5.4 56.5 17.8 34.4 1.7 2.5 50.6 15.4 31.6 1.4 2.21CC.C 55.6 38.0 4.4 2. 1 58.9 34.5 20.9 2.4 1.1 52.5 3C.9 18.7 2.0 .9ICO.C 81.3 11.5 6.5 .7 60. 1 49.1 6. 9 3.7 .3 50.4 41.2 5.9 3.0 .3100. C 28.2 64.1 2.8 4. 9 56.4 17.8 34.6 1.4 2.5 50.1 15.5 31.2 1.2 2.2100.c 62.2 30.3 5.4 2.2 65.7 42.5 18.5 3.4 1.2 57.2 37.0 16.3 2.9 1.0100.0 36.8 52.4 4.9 5.9 42.0 15.7 21.7 2.1 2.6 35.6 13.0 18.8 1.6 2.2100. c 47. 3 46.1 4.2 2,4 57.0 28.7 24.7 2.4 1.2 49.9 25. 1 21.8 2.0 1.0
100. c 43.1 48.8 4 . C 4. 1 72.7 33.0 34.4 2.7 2.6 66.2 30.5 31.2 2.3 2.2
100.0 32. 1 60.8 2. 3 4.9 77.6 26.8 45.6 1.7 3.4 71.4 25. 3 41.6 1.5 2. 9100.c 39.1 56.7 2 . C 2.2 75.1 31.5 40.7 1.6 1.3 66.3 28.2 35.8 1.4 1.0ICO.C 62.6 33.3 2. 1 1.9 78.5 51.4 24.2 1.5 1.4 71.0 48.2 20.4 1.2 1.2100.c 45.2 47.5 2.4 4. 9 77.7 38.4 34.4 1.8 3.2 70.0 35.5 30.4 1.5 2. 7IOC.C 35.7 61.9 .6 1.8 74.0 29.5 43.0 .4 l.l 66.3 27.4 37.6 .4 .8100. c 54.5 30.6 1C. 7 4. 2 58.4 32. 3 17.3 6.6 2. 2 49.6 27.2 15.0 5.6 1.9ICO.C 32.9 63.2 1.9 1.9 65.9 23.1 41.3 .5 1.0 58.9 21.2 36.5 .5 . 71 0 0 . c 47.8 42.4 5.8 4. 0 61.9 32. 1 25. 1 2.7 2.0 48.5 26.5 19.0 1.9 1.1
IOC.C 33.8 50.6 5.2 10.3 59.5 21 .C 29.7 2.8 6. 1 55.7 19.2 28.1 2.5 5. 9
100.c 35.2 45.9 7.0 11.9 47.2 17.4 20.7 3.6 5.5 39.3 14. 1 17.4 3.0 4. 8100.0 26.7 55.7 5. 1 12.6 59. 1 18.2 30.3 3.3 7.2 54.1 16.5 28.0 2.9 6. 7100.0 49.0 37.6 8. C 5.4 53.8 30.0 18.1 3.5 2.1 45.4 25.7 15.1 2.9 1.7ICO.C 75.4 11.3 12 . C 1.3 58.2 44.4 6.1 7.1 .6 47.2 36.0 4. 9 5.9 .4100. c 76.0 16.5 6.4 1.1 65.9 52.0 9.8 3.5 .5 55.7 43.6 8.9 2.6 .5100. c 57.0 36.7 3.8 2.6 51.4 31.9 16. 1 2.1 1.3 44.1 27.9 13.5 1.7 1.0100.c 59.3 33.2 5.3 2.2 39.9 24.0 12.4 2.. 5 1.0 31.8 19. 1 9.9 2.0 .8100. c 14.9 70. 1 3.2 11.9 65.4 9. 7 46.0 2.0 7.7 60.5 8.7 43.0 1.7 7. 1100. c 23.8 72.2 1.0 2. 9 68.8 14.9 51.5 .4 2.0 61.6 14.3 45.3 .4 1.7100.0 34.4 54. 1 4.1 7.4 65.0 24.1 33.7 2.6 4.7 61.5 22.8 31.9 2.3 4. 4100.0 46.2 43.1 7.7 3. 1 55.7 28.3 20.6 4. 9 1.8 48.9 25.2 17.5 4. 6 1.5100.c 33.3 45.6 9.5 11.6 49.5 17.1 24.4 3.2 4.8 43.6 15. 1 21.6 2.6 4. 3100. c 5.3 38.5 3. 1 53.1 61.0 2. 7 20.2 2.2 36.0 58.8 2.4 19.3 2. 1 35.0ICO.C 61.7 33.4 2.6 2.3 69. 1 45.2 21.0 1.6 1.2 60.7 40.5 17.9 1.4 .9
Includes workers of al l races other than Negro. N O T E : A dash ( - ) indicates e i th e r the sa m p l e did not include any workers with these charcateristics, or that the data did not meet the Bureau' s publ ications cr iteria.
Digitized for FRASER http://fraser.stlouisfed.org/ Federal Reserve Bank of St. Louis
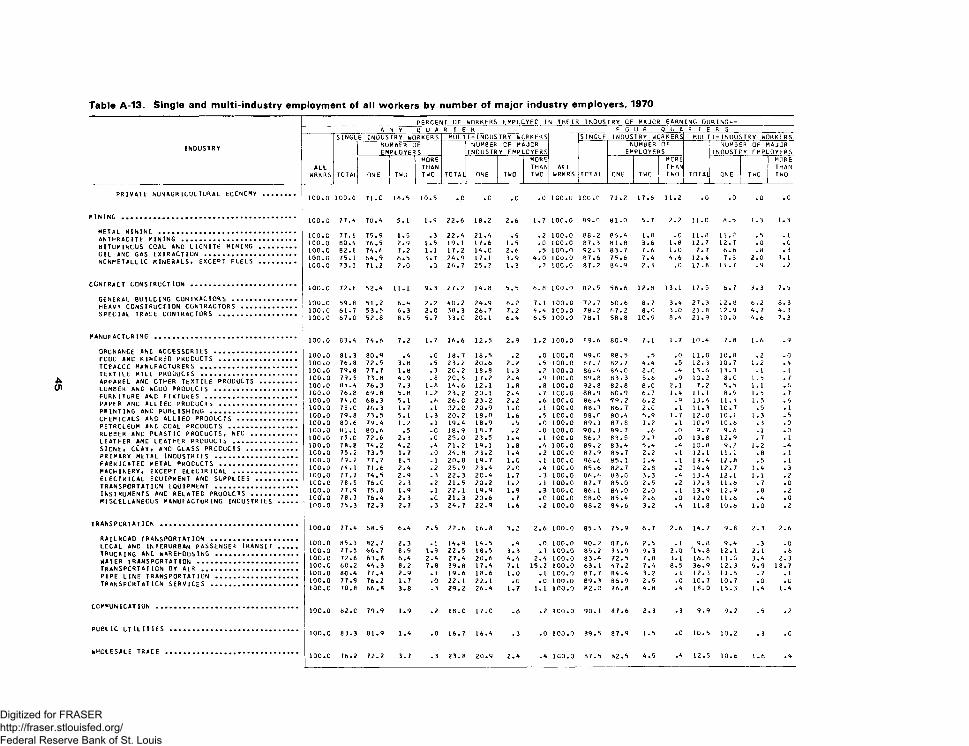
INDUSTRY
PRIVATE NONAGRICULTURAL ECCNCMY
PINING ....................................
METAL MINING .........................ANTHRACITE PINING ...................8 1 TUP INCUS CCAL AND LIGNITE PININGGIL ANC GAS EXTRACTION .............NCNPET ALL IC MINERALS, EXCEPT FLELS
CONTRACT CONSTRUCTION ............
GENERAL BUILDING CONTRACTORS . HEAVY CONSTRUCTION CONTRACTORS SPECIAL TRACE CONTRACTORS ....
MANUFACTURING ..............................
ORDNANCE ANC ACCESSORIES ...............FCOC ANC KINCRED PRODUCTS .............TCEACCC MANUFACTURERS ..................TEXTILE MILL PRODUCTS ..................APPAREL ANC OTHER TEXTILE PRODUCTS ....LUMBER ANC WOOD PRODUCTS ..............FURNITURE AND FIXTURES .................PAPER ANC ALLIED PRODUCTS ............ .PRINTING ANC PUBLISHING ................CHEMICALS AND ALLIED PRODUCTS ........ .PETRCLEUM ANC COAL PRODUCTS .......... .RUBBER ANC PLASTIC PRODUCTS, NEC .... .LEATHER ANC LEATHER PRODUCTS ......... .STONE, CLAY, AND GLASS PRODUCTS .......PRIMARY METAL INDUSTRIES ...............FABRICATED PETAL PRODUCTS ............ .MACHINERY, EXCEPT ELECTRICAL ......... .ELECTRICAL EQUIPMENT AND SUPPLIES ....TRANSPORTATION EQUIPMENT ..............INSTRUMENTS ANC RELATED PRODUCTS .....MISCELLANEOUS MANUFACTURING INDUSTRIES
t r a n s p o r t a t i o n ..............................
RAILROAD TRANSPORTATION ................LOCAL AND INTERURBAn PASSENGER TRANSITTRUCKING ANC WAREHOUSING ...............WATER TRANSPORTATION ....................TRANSPORTATION BY AIR ...................PIPE LINE TRANSPORTATION ...............TRANSPORTATION SERVICES ................
CCPPUNICAT ION
PUBLIC UTILITIES
PERCENT OF WORKERS EMPLOYED IN THEIR INDUSTRY OF MAJOR EARNING DURING—A N Y Q U A R T E R F 0 U R Q U A R T E R S
ALLWRKRS
SINGLE INDUSTRY WORKERS MULTI-INDUSTRY WORKERS
ALLWRKRS
SINGLE INDUSTRY WORKERS MULTI-INDUSTRY WORKERS
TOTAL
NUMBER OF EMPLOYERS
NUMBER OF MAJOR INDUSTRY EMPLOYERS
TOTAL
NUMBER OF EMPLOYERS
TOTAL
NUMBERINDUSTRY
OF MAJOR EMPLOYERS
ONE TWO
MORETHANTWO TOTAL ONE TWO
MORETHANTWO CNE TWC 1
j MCRE THAN
1 TWO| ONE j TWO
MORETHANTWO
100.0 100.0 71.0 18.5 10.5 • c .0 .0 .0 ICO.O i c c . o 71.2 17.6 11.2 .0 .0 .0 .0
100.G 77.4 70.4 5.1 1.9 22.6 18.2 2.6 1.7 100.0 89.0 81.0 5.7 2.2 11.0 8.5 1.3 1.3
100.C 77.6 75.9 1.5 .3 22.4 21.4 .9 .2 100.0 88.2 86.4 1.8 .0 11.8 11.2 . 5 . 1100.0 80.9 76.5 2.9 1.5 19. 1 17.6 1.5 .0 ICO.O 87.3 81.8 3.6 1.8 12.7 12.7 .0 .0100.0 82.8 74.6 7.2 1.1 17.2 14.0 2.6 .5 100.0 92.3 83.7 7.6 1.0 7.7 6.6 .8 . 3100.0 75. 1 64.9 6.5 3.7 24.9 17.1 3.9 4.0 100.0 87.6 75.6 7.4 4.6 12.4 7.3 2.0 3.1100.0 73.3 71 .2 2.0 .0 26.7 25.2 1.3 . ? 100.0 87.2 84.9 2.3 .0 12.8 11.7 .9 .2
100.c 72.8 52.4 11.1 9.3 27.2 14.8 5.5 6.8 ICO.O 82.5 56.6 12.8 13.1 17.5 6. 7 3.3 7.5
100.0 59.8 51.2 6.4 2.2 40.2 24.9 8.2 7.1 100.0 72.7 60.6 8.7 3.4 27.3 12.8 6.2 8.3loo. e 61.7 53.5 6.3 2.0 38.3 26.7 7.2 4.4 ICO.O 78.2 67.2 8.0 3.0 21.8 12.9 4.7 4.3100.0 67.0 52.8 8.5 5.7 33.C 20.1 6.4 6.5 100.0 78.1 58.8 10.9 8.4 21.9 10.0 4.6 7.3
100.0 83.4 74.6 7.2 1.7 16.6 12.5 2.9 1.2 100.0 89.6 80.9 7.1 1.7 10.4 7.8 1.6 .9
100.0 81.3 80.9 .4 .0 18.7 18.5 .2 .0 ICO.O 89.0 88.5 .5 .0 11.0 10.8 .2 .0100.0 76.8 72.5 3.8 .5 23.2 20.6 2.2 .5 100.0 87.7 82.7 4.4 .5 12.3 10.7 1.2 .4100.0 79.8 77.7 1.8 .3 20.2 18.8 1.3 . 2 100.0 86.4 84.0 2.0 .4 13.6 13.3 . 1 . 11C0.0 79.5 73.8 4.9 .8 20. 5 17.2 2.4 .9 100.0 89.8 83.3 5.6 .9 10.2 8.0 1.5 . 7100.0 85.4 76.3 7.3 1.8 14.6 12.1 1.8 .8 100.0 92.8 82.8 8.C 2.1 7.2 5.5 1.1 .6100.0 76.8 69.8 5.8 1.2 23.2 20.1 2.4 .7 ICO.O 88.9 80.9 6.7 1.4 11.1 8.9 1.5 .7100.0 74.C 68.3 5.1 .6 26.C 23.2 2.2 .6 100.0 86.4 •79.2 6.2 .9 13.6 11.5 1.5 .6100.0 78.C 76.3 1.7 .1 22.C 20.9 1.0 .1 100.0 88.7 86.7 2.C .1 11.3 1G.7 .5 . 1100.0 79.8 73.5 5.1 1.3 20.2 18.0 1.6 .5 ICO.O 88.0 80.4 5.9 1.7 12.0 10.1 1.3 .5100.0 80.6 79.4 1.2 . 1 19.4 18.9 .5 .0 100.0 89.1 87.8 1.2 . 1 10.9 10.6 .3 .0100.0 81.1 80.6 .5 .0 18.9 18.7 .2 .0 100.0 90.3 89.7 .6 .0 9.7 9.6 . 1 .0100.0 75.C 72.6 2.3 .0 25.0 23.5 1.4 . 1 100.0 86.2 83.5 2.7 .0 13.8 12.9 .7 . 1100.0 78.8 74.2 4.2 .4 21.2 19.1 1.8 .4 100.0 89.2 83.4 5.4 .4 10.8 9.2 1.2 .4100.0 75.2 73.5 1.7 .0 24.8 23.2 1.4 .2 100.0 87.9 85.7 2.2 .1 12.1 1 1. 1 .8 . 1100.0 79.2 77.7 1.5 .1 20.8 19.7 1 . 0 . 1 100.0 86.6 85. 1 1.4 .1 13.4 12.8 .5 .1100.0 74.1 71.6 2.4 .2 25.9 23.4 2.0 .4 100.0 85.6 82.7 2.8 .2 14.4 12.7 1.4 .3100.0 77.7 74.5 2.9 .3 22.3 20.4 1.7 .3 100.0 86.6 83.0 3.3 .4 13.4 12.1 1.1 .21C0.0 78.5 76.0 2.3 .2 21.5 20.2 1.2 .1 100.c 87.7 85.0 2.5 .2 12.3 11.6 .7 .0100.0 77.9 75.8 1.9 .1 22.1 19.9 1.9 .3 100.C 86.1 84.0 2.0 . 1 13.9 12.9 .8 .2100.0 78.7 76.4 2.3 . 0 21.3 20.6 . 7 .0 100.0 88.0 85.4 2.6 .0 12.0 11.6 .4 .0100.0 75.3 72.3 2.7 . 3 24.7 22.9 1.6 .2 100.0 88.2 84.6 3.2 .4 11.8 10.6 1.0 .2
100.0 77.4 68.5 6.4 2.5 22.6 16.8 3.2 2.6 100.0 85.3 75.9 6.7 2.6 14.7 9.8 2.3 2.6
100.0 85.1 82.7 2.3 .1 14.9 14.5 .4 .0 100.0 90.2 87.6 2.5 . 1 9.8 9.4 .3 .0100.0 77.5 66.7 8.9 1.9 22.5 18.5 3.3 .7 100.0 85.2 73.9 9.3 2.0 '14.8 12.1 2.1 .6100.0 72.6 63.8 6.4 2.4 27.4 20.6 4.4 2.4 100.0 83.4 72.5 7.8 3.1 16.6 1 1 .0 3.4 2.3100.c 60.2 44.3 8.2 7.8 39.8 17.4 7. 1 15.2 100.0 63. 1 47.2 7.4 8.5 36.9 12.3 5.9 18.7100.0 80.4 77.4 2.9 . 1 19.6 18.6 1 . 0 . 1 100.0 87.7 84.4 3.2 . 1 12.3 11.6 .7 . 1100.0 77.9 76.2 1.7 .0 22. 1 22.1 .0 .0 100.0 89.3 86.9 2.5 .0 10.7 10.7 .0 .0100.0 70.8 66.8 3.8 .3 29.2 26.4 1.7 1.1 100.0 82.0 76.8 4.8 .4 18.0 15.3 1.4 1.4
100.0 82.C 79.9 1.9 .2 18.0 17.0 .8 .2 ICO.O 90. 1 87.6 2.3 .3 9.9 9.2 .5 .2
100.0 83.3 81.9 1.4 .0 16.7 16.4 .3 . 0 100.0 89.5 87.9 1.5 .0 10.5 10.2 .3 .c
100.0 76.2 72.2 3.7 .3 23.8 20.9 2.4 .4 ICO.O 87.5 82.5 4.5 .4 12.5 10.6 1.6 .4
Digitized for FRASER http://fraser.stlouisfed.org/ Federal Reserve Bank of St. Louis
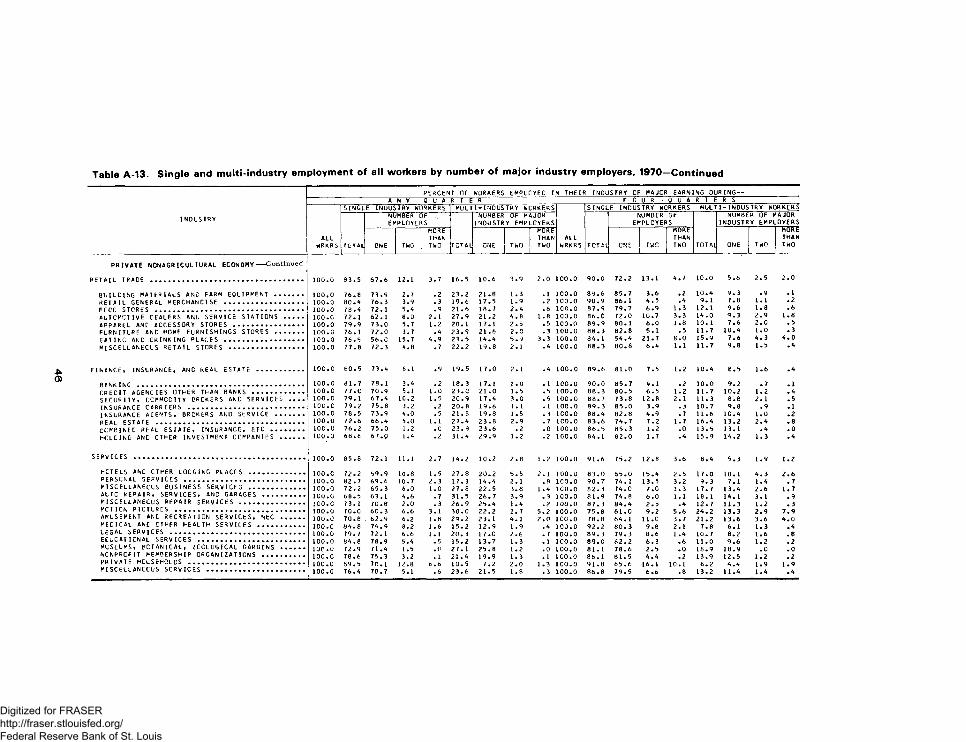
P E R C E N T O F W O R K E R S E M P L O Y E D I N T H E I R I N D U S T R Y O F M A J O R E A R N I N G D U R I N G —
I N D U S T R Y
A N Y Q U A R T E R F C U R ■ Q U A R T E ! R S
A L L V I R K R $
S I N G L E I N D U S T R Y W O R K E R S M U L T I - I N D U S T R Y W C R K E R S
A L LW R K R S
S I N G L E I N D U S T R Y W C R K E R S M U L T I - I N D U S T R Y W O R K E R S
I 0 • A L
N U M B E R O F E M P L O Y E R S
T O T A L
N U M B E R O F M A J O R I N D U S T R Y E M P L O Y E R S
T O T A L
N U M B E R O F E M P L O Y E R S
T O T A L
N U M B E R O F M A J O R I N D U S T R Y E M P L O Y E R S
O N E T W O
' " m o r e -T H A NT W O O N E T W O
1
M O R ET H A NT W O
1O N E l T W O
J _ _ _ _ _ _
M O R ET H A NT W O O N E T W O
M O R ET H A NT W O
P R I V A T E N O N A G R I C U L T U R A L E C O N O M Y - - - C o n t i n u e d
R E T A I L T R A D E . . . . . . . . . . . . . . . . . . . . . . . . . . . . . . . . . . . . . . . . . . . . . . . . . . . . . . . . . 1 0 0 . 0 8 3 . 5 6 7 . 6 1 2 . 1 3 . 7 1 6 . 5 1 0 . 6 3 . 9 2 . 0 1 0 0 . 0 9 0 . 0 7 2 . 2 1 3 . 1 4 . 7 1 0 . 0 5 . 6 2 . 5 2 . 0
B L I L C I N G M A T E R I A L S A N D F A R M E Q U I P M E N T . . . . . . . . . . . 1 0 0 . 0 7 6 . 8 7 3 . 9 2 . 7 . 2 2 3 . 2 2 1 . 8 1 . 3 . 1 1 0 0 . 0 8 9 . 6 8 5 . 7 3 . 6 . 2 1 0 . 4 9 . 3 . 9 . 1R E T A I L G E N E R A L M E R C H A N D I S E . . . . . . . . . . . . . . . . . . . . . . . . . . . . . 1 0 0 . 0 8 0 . 4 7 6 . 3 3 . 9 . 3 1 9 . 6 1 7 . 5 1 . 9 . 2 1 0 0 . 0 9 0 . 9 8 6 . 1 4 . 5 . 4 9 . 1 7 . 8 1 . 1 . 2F C C D S T O R E S . . . . . . . . . . . . . . . . . . . . . . . . . . . . . . . . . . . . . . . . . . . . . . . . . . . . . . . . 1 0 0 . 0 7 8 . 4 7 2 . 1 5 . 4 . 9 2 1 . 6 1 8 . 7 2 . 4 . 6 1 0 0 . 0 8 7 . 9 7 9 . 7 6 . 9 1 . 3 1 2 . 1 9 . 6 1 . 8 . 6A U T O M O T I V E D E A L E R S A N D S E R V I C E S T A T I O N S . . . . . . . 1 C 0 . C 7 2 . 1 6 2 . 1 8 . 0 2 . 1 2 7 . 9 2 1 . 2 4 . 8 l . B 1 0 0 . 0 8 6 . 0 7 2 . 0 1 0 . 7 3 . 3 1 4 . 0 9 . 3 2 . 9 1 . 8A P P A R E L A N D A C C E S S O R Y S T O R E S . . . . . . . . . . . . . . . . . . . . . . . . . . 1 0 0 . 0 7 9 . 9 7 3 . 0 5 . 7 1 . 2 2 0 . 1 1 7 . 1 2 . 5 . 5 1 0 0 . 0 8 9 . 9 8 0 . 1 8 . 0 1 . 8 1 0 . 1 7 . 6 2 . 0 . 5F U R N I T U R E A N D H O M E F U R N I S H I N G S S T O R E S . . . . . . . . . . 1 0 0 . 0 7 6 . 1 7 2 . 0 3 . 7 . 4 2 3 . 9 2 1 . 6 2 . 0 . 3 1 0 0 . 0 8 8 . 3 8 2 . 8 5 . 1 . 5 1 1 . 7 1 0 . 4 1.0 • 3E A T I N G A N D D R I N K I N G P L A C E S . . . . . . . . . . . . . . . . . . . . . . . . . . . . . . 1 0 0 . 0 7 6 . 5 5 6 . C 1 5 . 7 4 . 9 2 3 . 5 1 4 . 4 5 . 9 3 . 3 1 0 0 . 0 8 4 . 1 5 4 . 4 2 1 . 7 8 . 0 1 5 . 9 7 . 6 4 . 3 4 . 0M I S C E L L A N E O U S R E T A I L S T O R E S . . . . . . . . . . . . . . . . . . . . . . . . . . . . 1 0 0 . 0 7 7 . 8 7 2 . 3 A . 8 . 7 2 2 . 2 1 9 . 8 2 . 1 . 4 1 0 0 . 0 8 8 . 3 8 0 . 8 6 . 4 1 . 1 1 1 . 7 9 . 8 1 . 5 . 4
F I N A N C E , I N S U R A N C E , A N D R E A L E S T A T E . . . . . . . . . . . . . . . . . 1 0 C . 0 8 0 . 5 7 3 . 4 6 . 1 . 9 1 9 . 5 1 7 * 0 2 . 1 . 4 1 0 0 . 0 8 9 . 6 8 1 . 0 7 . 5 1 . 2 1 0 . 4 8 . 5 1 . 6 . 4
B A N K I N G • • • • • « • » • • • • • • • • • • • • • • • • • . • • « • • • • • • • • 1 0 0 . 0 8 1 . 7 7 8 . 1 3 . 4 . 2 1 8 . 3 1 7 . 1 1 . 0 . 1 1 0 0 . 0 9 0 . 0 8 5 . 7 4 . 1 . 2 1 0 . 0 9 . 2 . 7 . 1C R E C I T A G E N C I E S O T H E R T H A N R A N K S . . . . . . . . . . . . . . . . . . . 1 0 0 . 0 7 7 . C 7 0 . 9 5 . 1 1.0 2 3 . C 2 1 . 0 1 . 5 . 5 1 0 0 . 0 8 8 . 3 8 0 . 5 6 . 5 1 . 2 1 1 . 7 1 0 . 2 1 . 2 . 4S E C U R I T Y , C O M M O D I T Y B R O K E R S A N D S E R V I C E S . . . . 1 0 0 . 0 7 9 . 1 6 7 . 4 1 0 . 2 1 . 5 2 0 . 9 1 7 . 4 3 . 0 . 5 1 0 0 . 0 8 8 . 7 7 3 . 8 1 2 . 8 2 . 1 1 1 . 3 8 . 8 2 . 1 . 5I N S U R A N C E C A R R I E R S . . . . . . . . . . . . . . . . . . . . . . . . . . . . . . . . . . . . . . . . . . . 1 0 0 . 0 7 9 . 2 7 5 . 8 3 . 2 . 2 2 0 . 8 1 9 . 6 1 . 1 . 1 1 0 0 . 0 8 9 . 3 8 5 . 0 3 . 9 . 3 1 0 . 7 9 . 8 . 9 . 1I N S U R A N C E A G E N T S , B R O K E R S A N D S E R V I C E . . . . . . . . . . . 1 0 0 . 0 7 8 . 5 7 3 . 9 4 . 0 . 5 2 1 . 5 1 9 . 8 1 . 5 . 3 1 C 0 . 0 8 8 . 4 8 2 . 8 4 . 9 . 7 1 1 . 6 1 0 . 4 1 . 0 . 2R E A L E S T A T E . . . . . . . . . . . . . . . . . . . . . . . . . . . . . . . . . . . . . . . . . . . . . . . . . . . . . . . 1 0 0 . 0 7 2 . 6 6 6 . 4 5 . 0 1 . 1 2 7 . 4 2 3 . 8 2 . 9 . 7 1 0 0 . 0 8 3 . 6 7 4 . 7 7 . 2 1 . 7 1 6 . 4 1 3 . 2 2 . 4 . 8C O M B I N E C R E A L E S T A T E , I N S U R A N C E , E T C . . . . . . . . . . . . 1 0 0 . 0 7 6 . 2 7 5 . 0 1 . 2 . 0 2 3 . 8 2 3 . 6 . 2 . 0 1 0 0 . 0 8 6 . 5 8 5 . 3 1 . 2 . 0 1 3 . 5 1 3 . 1 . 4 . 0H O L D I N G A N D O T H E R I N V E S T M E N T C O M P A N I E S . . . . . . . . . 1 0 0 . 0 6 8 . 6 6 7 . 0 1 . 4 . 2 3 1 . 4 ' 2 9 . 9 1 . 2 . 2 1 0 0 . 0 8 4 . 1 8 2 . 0 1 . 7 . 4 1 5 . 9 1 4 . 2 1 . 3 . 4
S E R V I C E S . . . . . . . . . . . . . . . . . . . . . . . . . . . . . . . . . . . . . . . . . . . . . . . . . . . . . . . . . . . . . . . . 1 0 0 . 0 8 5 . 8 7 2 . 1 1 1 . 1 2 . 7 1 4 . 2 1 0 . 2 . 2 . 8 1 . 2 1 0 0 . 0 9 1 . 6 7 5 . 2 1 2 . 8 3 . 6 8 . 4 5 . 3 1 . 9 1 . 2H O T E L S A N C O T H E R L O D G I N G P L A C E S . . . . . . . . . . . . . . . . . . . . . 1 0 0 . c 7 2 . 2 5 9 . 9 1 0 . 8 1 . 5 2 7 . 8 2 0 . 2 5 . 5 2 . 1 1 0 0 . 0 8 3 . 0 6 5 . 0 1 5 . 4 2 . 5 1 7 . 0 1 0 . 1 4 . 3 2 . 6P E R S O N A L S E R V I C E S . . . . . . . . . . . . . . . . . . . . . . . . . . . . . . . . . . . . . . . . . . . . . 1 0 0 . 0 8 2 . 7 6 9 . 6 1 0 . 7 2 . 3 1 7 . 3 1 4 . 4 2 . 1 .8 1 C 0 . 0 9 0 . 7 7 4 . 1 1 3 . 5 3 . 2 9 . 3 7 . 1 1 . 4 . 7M I S C E L L A N E O U S B U S I N E S S S E R V I C E S . . . . . . . . . . . . . . . . . . . . . 1 0 0 . 0 7 2 . 2 6 5 . 3 6 . 0 1.0 2 7 . 8 2 2 . 5 3 . 8 1 . 4 ico.o 8 2 . 3 7 4 . 0 7 . 0 1 . 3 1 7 . 7 1 3 . 4 2 . 6 1 . 7A U T O R E P A I R , S E R V I C E S , A N D G A R A G E S . . . . . . . . . . . . . . . . 1 0 0 . 0 6 8 . 5 6 3 . 1 4 . 6 . 7 3 1 . 5 2 6 . 7 3 . 9 . 9 1 0 0 . 0 8 1 . 9 7 4 . 8 6 . 0 1 . 1 1 8 . 1 1 4 . 1 3 . 1 . 9M I S C E L L A N E O U S R E P A I R S E R V I C E S . . . . . . . . . . . . . . . . . . . . . . . . 1 C 0 . C 7 3 . 1 7 0 . 8 2 . 0 . 3 2 6 . 9 2 5 . 4 1 . 4 . 2 1 0 0 . 0 8 7 . 3 8 4 . 4 2 . 5 . 4 1 2 . 7 1 1 . 3 1 . 2 . 3M C T I C N P I C T U R E S . . . . . . . . . . . . . . . . . . . . . . . . . . . . . . . . . . . . . . . . . . . . . . . . . 1 0 0 . 0 7 0 . 0 6 0 . 3 6 . 6 3 . 1 3 0 . 0 2 2 . 2 2 . 7 5 . 2 1 0 0 . 0 7 5 . 8 6 1 . 0 9 . 2 5 . 6 2 4 . 2 1 3 . 3 2 . 9 7 . 9A M U S E M E N T A N C R E C R E A T I O N S E R V I C E S , N E C . . . . . . . . . 1 0 0 . 0 7 0 . 8 . 6 2 . 9 6 . 2 1 . 8 2 9 . 2 2 3 . 1 4 . 1 2 . 0 I C O . O 7 8 . 8 6 4 . 1 1 1 . 0 3 . 7 2 1 . 2 1 3 . 6 3 . 6 4 . 0M E D I C A L A N C O T H E R H E A L T H S E R V I C E S . . . . . . . . . . . . . . . . . 100. c 8 4 . 8 7 4 . 9 8 . 2 1 . 6 1 5 . 2 1 2 . 9 1 . 9 . 4 1 0 0 . 0 9 2 . 2 8 0 . 3 9 . 8 2 . 1 7 . 8 6 . 1 1 . 3 . 4L E G A L S E R V I C E S . . . . . . . . . . . . . . . . . . . . . . . . . . . . . . . . . . . . . . . . . . . . . . . . . . 1 0 0 . 0 7 9 . 7 7 2 . 1 6 . 6 1 . 1 2 0 . 3 1 7 . 0 2 . 6 . 7 1 0 0 . 0 8 9 . 3 7 9 . 3 8 . 6 1 . 4 1 0 . 7 8 . 2 1 . 6 . 8e d u c a t i o n a l S E R V I C E S . . . . . . . . . . . . . . . . . . . . . . . . . . . . . . . . . . . . . . . . 1 0 0 . 0 8 4 . 8 7 8 . 9 5 . 4 .5 1 5 . 2 1 3 . 7 1 . 3 . 1 I C O . O 8 9 . 0 8 2 . 2 6 . 3 . 6 1 1 . 0 9 . 6 1 . 2 . 2M U S E U M S , e C T A N I C A L , Z O O L O G I C A L G A R D E N S . . . . . . . . . 1 0 0 . 0 7 2 . 9 7 1 . 4 1 . 5 . 0 2 7 . 1 2 5 . 8 1 . 2 . 0 1 0 0 . 0 8 1 . 1 7 8 . 6 2 . 5 . 0 1 8 . 9 1 8 . 9 . 0 . 0N O N P R O F I T M E M B E R S H I P O R G A N I Z A T I O N S . . . . . . . . . . . . . . . . 1 0 0 . c 7 8 . 6 7 5 . 3 3 . 2 . 1 2 1 . 4 1 9 . 9 1 . 3 . 1 I C O . O 8 6 . 1 8 1 . 5 4 . 4 . 2 1 3 . 9 1 2 . 5 1 . 2 . 2P R I V A T E H O U S E H O L D S . . . . . . . . . . . . . . . . . . . . . . . . . . 1 0 0 . 0 8 9 . 5 7 0 . 1 1 2 . 8 fc.6 1 0 . 5 7 . 2 2 . 0 1 . 3 I C O . O 9 1 . 8 6 5 . 6 1 6 . 1 1 0 . 1 8 . 2 4 . 4 1 . 9 1 . 9M I S C E L L A N E O U S S E R V I C E S . . . . . . . . . . . . . . . . . . . . . . . . . . . . . . . . . . . . . 1 0 0 . 0 7 6 . 4 7 0 . 7 5 . 1 . 6 2 3 . 6 2 1 . 5 1 . 8 . 3 1 0 0 . 0 R 6 . 8 7 9 . 5 6 . 6 . 8 1 3 . 2 1 1 . 4 1 . 4 . 4
Digitized for FRASER http://fraser.stlouisfed.org/ Federal Reserve Bank of St. Louis
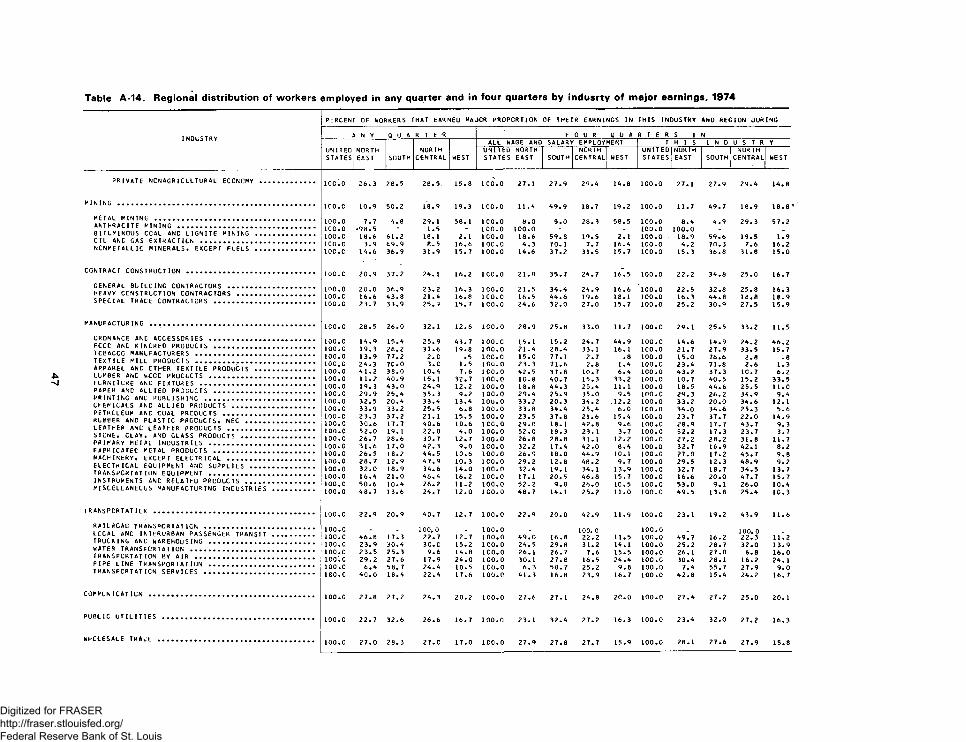
INDUSTRY
PRIVATE NCNAGRICULTURAL ECONOMY
MINING .....................................
METAL MINING ...........................ANTHRACITE MINING ................... .BITUMINOUS COAL AND LIGNITE MININGOIL ANC GAS EXTRACTION ..............n c n m e t a l l i c m i n e r a l s , EXCEPT FUELS
CONTRACT CONSTRUCTION ............
GENERAL BUILCING CONTRACTORS . HEAVY CONSTRUCTION CONTRACTORS SPECIAL TRACE CONTRACTORS ....
MANUFACTURING ..........................................................
ORDNANCE ANC ACCESSORIES ............................FCCC AND KINCRED PRODUCTS .............. ..TOBACCO MANUFACTURERS ...................................TEXTILE MILL PRODUCTS ...................................APPAREL ANC OTHER TEXTILE PRODUCTS . . .LUMBER ANC WCCC PRODUCTS ............................FURNITURE ANC FIXTURES .................................PAPER ANC ALLIED PRODUCTS .........................PRINTING ANC PUBLISHING ..............................CHEMICALS AND ALLIED PRODUCTS ................PETROLEUM ANC COAL PRODUCTS .....................RUBBER AND PLASTIC PRODUCTS, NEC ..........LEATHER ANC LEATHER PRODUCTS ...................STONE, CLAY, AND GLASS PRODUCTS ............PRIMARY METAL INDUSTRIES ............................FABRICATED METAL PRODUCTS ..........................MACHINERY, EXCEPT ELECTRICAL ....................ELECTRICAL EQUIPMENT AND SUPPLIES . . . . .TRANSPORTATION EQUIPMENT ............................INSTRUMENTS ANC RELATED PRODUCTS ...........MISCELLANEOUS MANUFACTURING INDUSTRIES
t r a n s p o r t a t i o n ........................... .
RAILROAD TRANSPORTATION ................LCCAL ANC INTERURBAN PASSENGER TRANSITTRUCKING ANC WAREHOUSING ............... .WATER TRANSPORTATION .................... .TRANSPORTATION BY AIR ................... .PIPE LINE TRANSPORTATION ............... .TRANSPORTATION SERVICES ................. .
COMMUN ICAT ION
PUBLIC UTILITIES
PERCENT OF WORKERS THAT EARNED MAJOR PROPORTION OF THEIR EARNINGS IN THIS INDUSTRY AND REGION DURING
N Y Q U A R T E R F O U R Q U A R T E R S I NALL WAGE AND SALARY EMPLOYMENT T H I s I N D U S T R Y
UNITEDSTATES
NORTHEAST SOUTH
NORTHCENTRAL WEST
UNITEDSTATES
NORTHEAST SOUTH
NCRTHCENTRAL WEST
UNITEDSTATES
NORTHEAST SOUTH
NORTH 1c e n t r a l I _____ _ 1
WEST
i o c '.o 26.3 28.5 28.5. 15.8 1CO.O 27.1 27.9 29.A 1A.8 100.0 27.1 27.9 29.A 1A.8
IOO. C i o .q 50.2 18.9 19.3 100.0 11.A A9.9 18.7 19.2 100.0 11.7 A9.7 18.9 18. 8 ’
10C.0 7.7 A.8 29. 1 58. 1 ICO.O 8.0 5.0 28.3 58.5 100.0 8. A A.9 29.3 57.2100.0 •*9 8.5 - 1.5 - 100.0 100.0 - - - 100.0 100.0 - _ _100.C 18.6 61.2 18.1 2.1 ICO.O 18.6 59.8 19.5 2.1 100.0 ■ 18.9 59.6 19.5 1.91CO.C 3.9 69.9 8.5 16.6 100.0 A . 3 70. 1 7.7 16.A 100.0 A.2 70.3 7.6 16.210C.C 1 A . 6 36.9 31.9 15.7 100.0 1A.6 37.2 31.5 15.7 100.0 15.3 36.8 31.8 15.0
100.C 20.9 37.2 2A . 1 16.2 ICO.O 21.8 35.7 2A.7 16.5 100.0 22.2 3A.8 25.0 16.7
100.0 20.0 36.9 23.2 16.3 ICO.O 21.5 3A.A 2A.9 16.6 100.0 22.5 32.8 25.8 16.3100.c 16.6 A3.8 21. A 16.8 ICO.O 16.5 A A . 6 19.6 18.1 100.0 16.3 AA.8 18.8 18.9100.c 23.7 33.9 25.9 15.7 ICO.O 2A.6 32.0 27.0 15.7 100.0 25.2 30.9 27.5 15.9
1C0.C 28.5 26.0 32. 1 12.6 ICO.O 28.9 25.8 33.0 11.7 100.0 29.1 25.5 33.2 11.5
100.c l A . 9 15.A 25.9 A3.7 100. c 15.1 15.2 2A.7 AA.9 100.0 l A . 6 1A . 9 2A.2 A6.2100. c 19.3 28.2 31.6 19.8 100.0 21.A 28.A 33. 1 16.1 ICO.O 21.7 27.9 33.5 15.7100.0 13.9 77.2 2.0 .5 ICO.O 15.0 77.1 2.7 .8 100.0 15.0 76.6 2.8 .8100.0 2A.3 7C.0 3 . C 1.5 ICO.O 23.3 71.6 2.8 1. A 100.0 23.A 71.8 2.6 1.3100.0 A 1.2 38.0 10. A 7.6 ICO.O A2.5 37.8 10.7 6. A ICO.O A3.2 37.3 10.7 6.2100.0 11.2 AO.9 15. 1 32.7 100.0 10.8 A O . 7 15.3 33.2 100.0 10.7 AO.5 15.2 33.5100.0 19. 3 A 3.0 2A.9 12.2 100.0 18.8 A A . 3 25.A 11.1 100.0 18.5 A A . 6 25.5 11.0100.G 29.9 25. A 35.3 9.2 100.0 29.A 25.9 35.0 9.5 100.0 29.3 26.2 3A.9 9.A100.0 32.5 20.A 33.A 13.A 100.0 33.2 20. 3 3A.2 ,12.2 100.0 33.2 20.0 3A.6 12.1100. c 33.9 33.2 25.5 6.8 100.0 33.8 3A.A 25.A 6.0 ICO.O 3A.0 3A.6 25.3 5.6100.c 23.3 37.2 21.1 15.5 100.0 23.5 37.8 21.6 15.A 100.0 23.7 37.7 22.0 1A . 9100. c 30.6 17.7 AO.6 10.6 1CC.0 29.0 18.1 A2.8 9.6 100.0 28.9 17.7 A3.7 9.3100.0 52.0 19. 1 22.0 A . 0 100.0 52.0 18.3 23. 1 3.7 100.0 52.2 17.3 23.7 3.7100.c 26.7 28.6 30.7 12.7 100.o 26.8 28.8 31.1 12.2 100.0 27.2 28.2 31.8 11.7100.0 31.6 17.0 A2.3 9.0 100.0 32.2 17.A A2.0 8.A 100.0 32.7 16.9 A2.1 8.2100.0 26.5 18.2 A A . 5 10.6 100.0 26.9 18.0 AA.9 10.1 100.0 27.0 17.2 A5.7 9.8100.0 28.7 12.9 A7.9 10.3 ICO.O 29.2 12.8 A8.2 9.7 100.0 29.5 12.3 A8.9 9.2100.c 32.0 18.9 3 A. 6 1A . 0 100.0 32.A 19. 1 3A.1 13.9 ICO.O 32.7 18.7 3A.5 13.7100.0 16.A 21.0 A6.A 16.2 1CC.0 17.1 20.5 A6.8 15.7 100.0 16.6 20.0 A7.7 15.7100.c 50.6 10. A 26.2 11.2 100.0 52.2 9.8 26.0 10.5 100.0 53.0 9.1 26.0 10.A100.c A8.7 13.6 2A. 7 12.0 ICO.O A8.7 1A. 1 25.2 11.0 100.0 A9.5 13.8 25.A 10.3
100.c 22.9 20.9 AO.7 12.7 ICO.O 22.9 20.0 A2.9 11.9 100.0 23.1 19.2 A3.9 11.6
100.c 100.0 A6.8 17.3
100, 0 22.7 12.7
100.0100.0 A9.0 16.8
100. 0 22.2 11.5
100.0 100.0 A9.7 16.2
100. 0 22.3 11.2
100.c 23.9 30.A 3C.C 15.2 100.0 2A.5 29.8 31.2 1A. 1 100.0 25.2 28.7 32.0 13.9100.c 23.5 25.3 9.6 l A . 8 ICO.O 26.1 26.7 7.6 15.5 100.0 26.1 27.0 6.8 16.0100.c 29.2 27.6 17.9 2A.0 100.0 30.1 27.8 16.5 2A.A 100.c 30.A 28.1 16.2 2A.I100.c 6. A 58. 7 2A.A 10.5 ICO.O 6.3 58.7 . 25.2 9.8 100.0 7.A 55.7 27.9 9.0100.c AO.O 18.A 22. A 17.6 100.0 A 1.3 16.8 23.9 16.7 100.0 A2.8 15.A 2A.2 16.7
100.c 27.8 27.2 2A. 3 20.2 100.0 27.6 27. 1 2A.8 2C.0 100.0 27. A 27.2 25.0 20.1
100.c 22.7 32.6 26.6 16.7 100.0 23.1 32.A 27.2 16.3 100.0 23.A 32.0 27.2 16.3
100.c 27.0 28.3 27.C 17.0 ICO.O 27.9 27.8 27.7 15.9 100.0 28.1 27.6 27.9 15.8
Digitized for FRASER http://fraser.stlouisfed.org/ Federal Reserve Bank of St. Louis
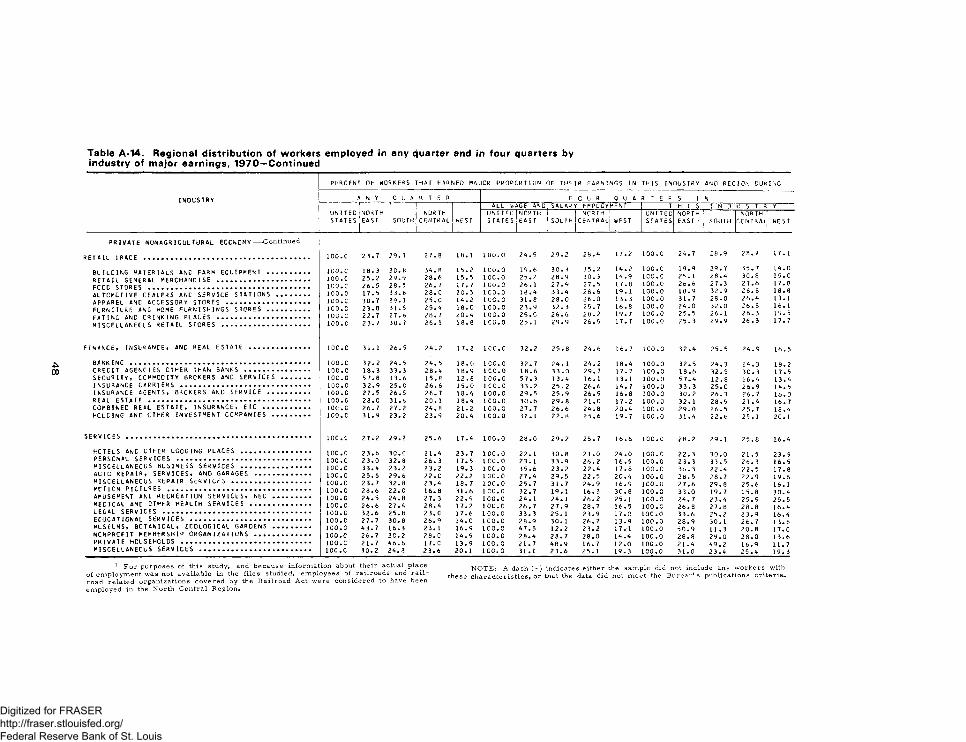
I N D U S T R Y
P E R C E N T O H W O R K E R S T H A T E A R N E D M A J O R P R O P O R T I O N O F T H E I R E A R N I N G S I N T H I S 1[ N O U S T R Y A N D R E G I O N D U R I N G
A N Y Q U A R T E R F C U R Q U A R T E R S I N
U N I T E DS T A T E S
N O R T H' E A S T j S O U T H
N O R T HC E N T R A L W E S T
A L L W A G E A N D S A L A R Y E M P L O Y M E N T T H I S I N D U S T R YU N I T E DS T A T E S
N O R T H j E A s r S O U T H J N O R T H
C E N T R A L W E S TU N I T E DS T A T E S
N O R T H E A S T - S O U T H
N O R T HC E N T R A L W E S T
P R I V A T E N O N A G R I C U L T U k A L E C O N O M Y - - - C o n t i n u e d
r e t a i l t r a d e . . . . . . . . . . . . . . . . . . . . . . . . . . . . . . . . . . . . . . . . . . . . . . . . . . . . . . . . . . . . . . 1 0 0 . C 2 3 . 7 2 9 . 7 2 7 . 8 1 8 . 1 ' 1 0 0 . 0 2 4 . 5 2 9 . 2 2 8 . 4 1 7 . 2 1 0 0 . 0 2 4 . 7 2 8 . 9 2 8 . 7 1 7 . 1
B L I L C I N G M A T E R I A L S A N C F A R M E Q U I P M E N T . . . . . . . . . . . . . . . . 1 0 0 . 0 1 8 . 3 3 0 . 8 3 4 . f i 1 5 . 2 I C O . O 1 9 . 6 3 0 . i 3 5 . 2 1 4 . 2 1 0 0 . 0 1 9 . 9 2 9 . 7 3 5 . 7 1 4 . 0R E T A I L G E N E R A L M E R C H A N D I S E . . . . . . . . . . . . . . . . . . . . . . . . . . . . . . . . . . . 1 0 0 . c 2 5 . 2 2 9 . 9 2 8 . 6 1 5 . 5 1 C C . 0 2 5 . 2 2 8 . 9 3 0 . 3 1 4 . 9 1 0 0 . 0 2 5 . 1 2 8 . 4 3 0 . 8 1 5 . 0F C C C S T O R E S . . . . . . . . . . . . . . . . . . . * . . . . . . . . . . . . . . . . . . . . . . . . . . . . . . . . . . . . . . . 1 0 0 . c 2 6 . 5 2 8 . 5 2 6 . 7 1 7 . 7 1 C O . C 2 6 . 1 2 7 . 9 2 7 . 5 1 7 . 8 1 0 0 . 0 2 6 . 6 2 7 . 3 2 7 . 6 1 7 . 8A U T O M O T I V E D E A L E R S A N C S E R V I C E S T A T I O N S . . . . . . . . . . . . 1 0 0 . 0 1 7 . 5 3 3 . 6 2 8 . C 2 0 . 3 1 C C . 0 1 8 . 4 3 3 . 4 2 8 . 6 1 9 . 1 1 0 0 . 0 1 8 . 9 3 2 . 9 2 8 . 8 1 8 . 8A P P A R E L A N C A C C E S S O R Y S T O R E S . . . . . . . . . . . . . . . . . . . . . . . . . . . . . . . 1 0 0 . c 3 0 . 7 2 9 . 1 2 5 . C 1 4 . 2 1 C C . 0 3 1 . 8 2 8 . 0 2 6 . 0 1 3 . 3 1 0 0 . 0 3 1 . 7 2 8 . 0 2 6 . 4 1 3 . 1F U R N I T U R E A N C H O M E F U R N I S H I N G S S T O R E S . . . . . . . . . . . . . . . . 1 C 0 . C 2 3 . 8 3 1 . 5 2 5 . 4 1 8 . 0 1 0 0 . 0 2 3 . 9 3 2 . 3 2 5 . 7 1 6 . 8 1 0 0 . 0 2 4 . 0 3 2 . 0 2 6 . 5 1 6 . 1E A T I N G A N C D R I N K I N G P L A C E S . . . . . . . . . . . . . . . . . . . . . . . . . . . . . . . . . . . 1 0 0 . c 2 2 . 7 2 7 . 6 2 8 . 7 2 0 . 4 1 0 0 . 0 2 5 . 0 2 6 . 6 2 8 . 2 1 9 . 7 1 0 0 . 0 2 5 . 5 2 6 . 1 2 8 . 3 1 9 . 5M I S C E L L A N E O U S R E T A I L S T O R E S . . . . . . . . . . . . . . . . . . . . . . . . . . . . . . . . . 1 0 0 . c 2 3 . 7 3 0 . 7 2 6 . 1 1 8 . 8 I C O . O 2 5 . 1 2 9 . 9 2 6 . 5 1 7 . 7 1 0 0 . 0 2 5 . 3 2 9 . 9 2 6 . 3 1 7 . 7
F I N A N C E , I N S U R A N C E , A N D R E A L E S T A T E . . . . . . . . . . . . . . . . . . . . . . . 1 0 C . C 3 1 . 1 2 6 . 5 2 4 . 2 1 7 . 2 1 0 0 . 0 3 2 . 2 2 5 . 8 2 4 . 6 1 6 . 7 1 0 0 . 0 3 2 . 4 2 5 . 5 2 4 . 9 1 6 . 5B A N K I N G . . . . . . . . . . . . . . . . . . . . . . . . . . . . . . . . . . . . . . . . . . . . . . . . . . . . . . . . . . . . . . . . . . . 1 0 0 . c 3 2 . 2 2 4 . 5 2 4 . 5 1 8 . 0 I C O . O 3 2 . 7 2 4 . 1 2 4 . 2 1 8 . 4 1 0 0 . 0 3 2 . 5 2 4 . 3 2 4 . 3 1 8 . 2C R E C I T A G E N C I E S O T H E R T H A N B A N K S . . . . . . . . . . . . . . . . . . . . . . . . 1 0 0 . c 1 8 . 3 3 3 . 3 2 8 . 4 1 8 . 9 I C O . O 1 8 . 6 3 3 . 0 2 9 . 7 1 7 . 7 1 0 0 . 0 1 8 . 6 3 2 . 5 3 0 . 3 1 7 . 5S E C U R I T Y , C O M M O D I T Y B R O K E R S A N C S E R V I C E S . . . . . . . . . . 1 0 C . 0 5 7 . 8 1 3 . 6 1 5 . 8 1 2 . 8 I C O . O 5 7 . 3 1 3 . 4 1 6 . 1 1 3 . 1 1 0 0 . 0 5 7 . 4 1 2 . 8 1 6 . 4 1 3 . 4I N S U R A N C E C A R R I E R S . . . . . . . . . . . . . . . . . . . . . . . . . . . . . . . . . . . . . . . . . . . . . . . . 1 0 0 . c 3 2 . 9 2 5 . 0 2 6 . 6 1 5 . 0 I C O . O 3 3 . 2 2 5 . 2 2 6 . 6 1 4 . 7 1 0 0 . 0 3 3 . 3 2 5 . 0 2 6 . 9 1 4 . 5I N S U R A N C E A G E N T S , B R O K E R S A N D S E R V I C E . . . . . . . . . . . . . . . . 1 0 0 . 0 2 7 . 5 2 6 . 5 2 6 . 7 1 8 . 4 1 0 0 . 0 2 9 . 5 2 5 . 9 2 6 . 9 1 6 . 8 1 0 0 . 0 3 0 . 2 2 6 . 3 2 6 . 7 1 6 . 0
R E A L E S T A T E . . . . . . . . . . . . . . . . . . . . . . . . . . . . . . . . . . . . . . . . . . . . . . . . . . . . . . . . . . . . 1 0 0 . G 2 8 . 0 3 1 . 6 2 0 . 1 1 8 . 4 1 0 C . 0 3 0 . 6 2 9 . 8 2 1 . 0 1 7 . 2 1 0 0 . 0 3 2 . 1 2 8 . 5 2 1 . 4 1 6 . 7C O M B I N E C R E A L E S T A T E , I N S U R A N C E , E T C . . . . . . . . . . . . . . . . . 1 0 C . C 2 6 . 7 2 7 . 2 2 4 . 8 2 1 . 2 1 0 0 . 0 2 7 . 7 2 6 . 6 2 4 . 8 2 0 . 4 1 0 0 . 0 2 9 . 0 2 6 . 5 2 5 . 7 1 8 . 4H O L D I N G A N C O T H E R I N V E S T M E N T C O M P A N I E S . . . . . . . . . . . . . . 1 0 0 . c 3 1 . 9 2 3 . 2 2 3 . 9 2 0 . 4 1 C C . 0 3 1 . 1 2 2 . 8 2 5 . 6 1 9 . 7 I C O . O 3 1 . 4 2 2 . 6 2 5 . 1 2 0 . 1
S E R V I C E S . . . . . . . . . . . . . . . . . . . . . . . . . . . . . . . . . . . . . . . . . . . . . . . . . . . . . . . . . . . . . . . . . . . . 1 0 C . C 2 7 . 2 2 9 . 2 2 5 . 6 1 7 . 4 1 0 0 . 0 2 8 . 0 2 9 . 2 2 5 . 7 1 6 . 6 1 0 0 . c 2 8 . 2 2 9 . 1 2 5 . 8 1 6 . 4H O T E L S A N D O T H E R L O D G I N G P L A C E S . . . . . . . . . . . . . . . . . . . . . . . . . . 1 0 0 . c 2 3 . 6 3 0 . 0 2 1 . 4 2 3 . 7 1 0 0 . 0 2 2 . 1 3 0 . 8 2 1 . 0 2 4 . 0 1 0 0 . 0 2 2 . 3 3 0 . 0 2 1 . 5 2 3 . 9P E R S O N A L S E R V I C E S . . . . . . . . . . . . . . . . . . . . . . . . . . . . . . . . . . . . . . . . . . . . . . . . . . 1 0 0 . c 2 3 . 0 3 2 . 8 2 6 . 3 1 7 . 5 I C O . O 2 3 . 1 3 3 . 9 2 6 . 2 1 6 . 5 1 0 0 . 0 2 3 . 3 3 3 . 5 2 6 . 3 1 6 . 5M I S C E L L A N E O U S B U S I N E S S S E R V I C E S . . . . . . . . . . . . . . . . . . . . . . . . . . 1 0 0 . 0 3 3 . A 2 3 . 2 2 3 . 2 1 9 . 3 I C O . O 3 5 . 6 2 3 . 2 2 2 . 4 1 7 . 8 1 0 0 . c 3 6 . 3 2 2 . 4 2 2 . 5 1 7 . 8A U T O R E P A I R , S E R V I C E S , A N O G A R A G E S . . . . . . . . . . . . . . . . . . . . . 1 0 C . 0 2 5 . 6 2 9 . 6 2 2 . C 2 2 . 2 1 0 0 . 0 2 7 . 4 2 9 . 5 2 2 . 5 2 0 . 4 1 0 0 . 0 2 8 . 5 2 8 . 7 2 2 . 9 1 9 . 6M I S C E L L A N E O U S R E P A I R S E R V I C E S . . . . . . . . . . . . . . . . . . . . . . . . . . . . . 1 0 C . C 2 3 . 7 3 2 . 8 2 3 . 4 1 8 . 7 1 0 C . 0 2 5 . 7 3 1 . 7 2 4 . 9 1 6 . 9 1 0 0 . 0 2 7 . 6 2 9 . 8 2 5 . 6 1 6 . 1M O T I O N P I C T U R E S . . . . . . . . . . . . . . . . . . . . . . . . . . . . . . . . . . . . . . . . . . . . . . . . . . . . . . 1 0 0 . c 2 8 . 6 2 2 . 0 1 6 . 8 3 1 . 6 I C O . O 3 2 . 7 1 9 . 1 1 6 . 3 3 0 . 8 1 0 0 . 0 3 3 . 0 1 9 . 7 1 5 . 8 3 0 . 4A M U S E M E N T A N C R E C R E A T I O N S E R V I C E S , N E C . . . . . . . . . . . . . . 1 0 0 . 0 2 4 . 5 2 4 . 8 2 7 . 3 2 2 . 9 1 0 0 . 0 2 4 . 1 2 4 . 1 2 6 . 2 2 5 . 1 I C O . O 2 4 . 7 2 3 . 4 2 5 . 9 2 5 . 5M E D I C A L A N C C T H F R H E A L T H S E R V I C E S . . . . . . . . . . . . . . . . . . . . . . . 1 0 C . C 2 6 . 6 2 7 . 4 2 8 . 4 1 7 . 2 1 0 0 . 0 2 6 . 7 2 7 . 9 2 8 . 7 1 6 . 5 1 0 0 . 0 2 6 . 8 2 7 . 8 2 8 . 8 1 6 . 4L E G A L S E R V I C E S . . . . . . . . . . . . . . . . . . . . . . . . . . . . . . . . . . . . . . . . . . . . . . . . . . . . . . . 1 0 0 . c 3 2 . 6 2 5 . 8 2 3 . 0 1 7 . 6 1 0 0 . 0 3 3 . 3 2 5 . 1 2 3 . 9 1 7 . 0 1 0 0 . 0 3 3 . 6 2 5 . 2 2 3 . 9 1 6 . 4E D U C A T I O N A L S E R V I C E S . . . . . . . . . . . . . . . . . . . . . . . . . . . . . . . . . . . . . . . . . . . . . 1 0 0 . c 2 7 . 7 3 0 . 8 2 6 . 9 1 4 . 0 I C O . O 2 8 . 9 3 0 . 1 2 6 . 7 1 3 . 9 1 0 0 . 0 2 8 . 9 3 0 . 1 2 6 . 7 1 3 . 8M U S E U M S , B O T A N I C A L , Z O O L O G I C A L G A R D E N S . . . . . . . . . . . . . . 1 0 0 . 0 4 3 . 7 1 6 . 3 2 3 . 1 1 6 . 9 I C O . O 4 7 . 5 1 2 . 2 2 3 . 2 1 7 . 1 1 0 0 . 0 5 0 . 9 1 1 . 3 2 0 . 8 1 7 . CN O N P R O F I T M E M B E R S H I P O R G A N I Z A T I O N S . . . . . . . . . . . . . . . . . . . . . 1 0 0 . c 2 6 . 7 3 C . 2 2 8 . 0 1 4 . 5 I C O . O 2 8 . 4 2 8 . 7 2 8 . 0 1 4 . 4 1 0 0 . 0 2 8 . 8 2 9 . 0 2 8 . 0 1 3 . 6P R I V A T E H O U S E H O L D S . . . . . . . . . . . . . . . . . . . . . . . . . . . . . . . . . . . . . . . . . . . . . . . . 1 0 0 . c 2 1 . 7 4 6 . 6 1 7 . C 1 3 . 9 I C O . O 2 1 . 7 4 8 . 9 1 6 . 7 1 2 . 0 1 0 0 . 0 2 1 . 4 4 9 . 2 1 6 . 9 1 1 . 7M I S C E L L A N E O U S S E R V I C E S . . . . . . . . . . . . . . . . . . . . . . . . . . . . . . . . . . . . . . . . . . 1 0 0 . 0 3 0 . 2 2 4 . 8 Z 3 . 6 2 0 . 1 I C O . O 3 1 . 1 2 3 . 6 2 5 . 1 1 9 . 3 1 0 0 . 0 3 1 . 0 2 3 . 4 2 5 . 4 1 9 . 3
1 For purposes of this study, and because information about their actual place N OT E : A dash ( - ) indicates either the sample did not include any workers withof employment was not avai lable in the fi les studied, employees of rai l roads and ra i l - these characteri stics, or tftat the data did not meet the Bureau' s publ ications criteria, road related organizations covered by the Rai l road Act were considered to have been employed in the North Central Region.
Digitized for FRASER http://fraser.stlouisfed.org/ Federal Reserve Bank of St. Louis
Detailed Tables
Earnings and employment patterns in 3-digit industry divisions
Digitized for FRASER http://fraser.stlouisfed.org/ Federal Reserve Bank of St. Louis

Digitized for FRASER http://fraser.stlouisfed.org/ Federal Reserve Bank of St. Louis
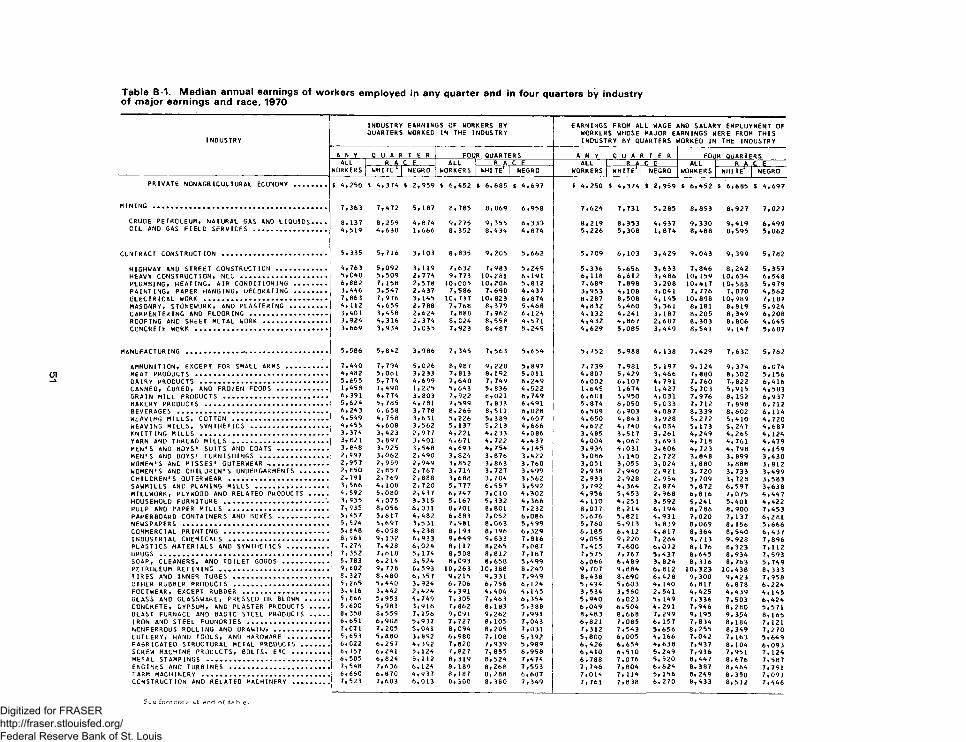
INDUSTRY
INDUSTRYQUARTERS
EARNINGS OF WORKERS BY WORKED IN THE INDUSTRY
EARNINGS FROM ALL WAGE AND SALARY EMPLOYMENT OF WORKERS WHOSE MAJOR EARNINGS WERE FROM THIS INDUSTRY BY QUARTERS WORKED IN THE INDUSTRY
A N Y Q U A R T E R FOUR QUARTERS A N Y Q U A R T E R FOUR QUARTERSALL
WORKERSR A C E ALL
WORKERSR A. C E ALL
WORKERSR A C E ALL |_ R A C. F
WHITE 1 | NEGRO WHI TE1 | NEGRO WHITE1 | NEGRO WORKERS [ WHITE1 | NEGRO
PRIVATE NONAGRICULTURAL ECONOMY ......... $ 4,250 t 4,374 $ 2,959 $ 6,452 $ 6,685 ( 4,697 $ 4,250 $ 4,374 $ 2,959 $ 6,452 $ 6,685 $ 4,697
MINING ................................................ 7,363 7,472 5,187 8,785 8,869 6,958 7,624 7,731 5,285 8,853 8,927 7,027
CRUDE PETROLEUM, NATURAL GAS ANO LIQUIDS.... 8, 137 8,259 4,874 9,275 9,355 6,333 8,219 8,353 4,937 9,330 9,419 6,499OIL AND GAS FIELD SERVICES .................... 4,519 4,638 1,666 8,352 8,434 4,874 5,226 5,308 1, 874 8, 488 8,595 5,062
CONTRACT CONSTRUCTION ............................. 5,335 5,716 3, 103 8,835 9,206 5,662 5,709 6,103 3,429 9,043 9,399 5,782
HIGHWAY AND STREET CONSTRUCTION .............. 4,763 5,092 3,119 7,632 7,983 5,249 5,336 5,656 3, 633 7,846 8,242 5,357HEAVY CONSTRUCTION, NEC ........................ 5, C40 5,509 2,774 9,773 10,281 6,191 6,118 6,612 3,486 10,159 10,634 6,548PLUMBING, HEATING, AIR CONDITIONING ......... 6,682 7,158 2,578 10,005 10,206 5,812 7,689 7,898 3,208 10,417 10,583 5,979PAINTING, PAPER HANGING, DECORATING ......... 3,446 3,547 2,437 7,586 7,690 4,437 3,953 4, 108 3,041 7, 776 7,870 4,562ELECTRICAL WORK .................................. 7,863 7,976 3, 145 10,737 10,823 6,874 8,287 8,508 4, 145 10,898 10,989 7, 187MASONRY, STONEWORK, AND PLASTERING .......... 4, 112 4,659 2, 788 7,768 8,379 5,468 4,832 5,460 3, 361 8, 181 8,819 5,924CARPENTERING AND FLOORING ..................... 3,401 3,458 2,624 7,888 7,962 6,124 4, 132 4,241 3,187 8,205 8,349 6,208ROOFING AND SHEET METAL WORK ................. 3,924 4,316 2, 374 8, C24 8,558 4,571 4,432 4,867 2,687 8, 303 8, 806 4,649CONCRETE WORK .................................... 3,669 3,934 3,035 7,923 8,487 5,249 4,629 5,085 3,449 8, 541 9, 147 5,687
m a n u f a c t u r i n g .............. -....................... 5,586 5,842 3,986 7,345 7,563 5,654 5,752 5,988 4, 138 7,429 7,632 5,762
AMMUNITION, EXCEPT FOR SMALL ARMS ........... 7,440 7, 794 5,026 8,987 9,220 5,897 7,739 7,981 5, 197 9, 124 9, 374 6,074MEAT PRODUCTS .................................... 4,482 5,061 3,233 7,813 8, 192 5,011 4,807 5,429 3,466 7,880 8,302 5,156DAIRY PRODUCTS ................................... 5,655 5,774 4,699 7,640 7,749 6,249 6,002 6,107 4,791 7, 760 7,822 6,416CANNED, CURED, AND FROZEN FOODS .............. 1,458 1,490 1,225 5,643 5, 836 4,522 1,645 1,674 1,427 5, 703 5,915 4,583GRAIN MILL PRODUCTS ............................. 6, 391 6,774 3,803 7,922 8,021 6,749 6,601 6,950 4,031 7,976 8, 152 6,937BAKERY PRODUCTS .................................. 5,624 5,785 4,781 7,599 7, 833 6,491 5,874 6,050 5,033 7,712 7,898 6,712BEVERAGES ......................................... 6,243 6,658 3, 778 8,265 8,511 6,028 6,509 6,903 4,087 8, 339 8,602 6,114WEAVING MILLS, COTTON .......................... 4,549 4,758 3,631 5,226 5,389 4,607 4,650 4,843 3,928 5,272 5,410 4,720WEAVING MILLS, SYNTHETICS ..................... 4,455 4,608 3,562 5, 137 5,213 4,666 4,622 4,740 4,034 5, 173 5,247 4,687KNITTING MILLS ................................... 3,374 3,423 2,977 4,221 4,233 4,086 3,485 3,517 3, 261 4, 249 4, 265 4,124YARN AND THREAD MILLS .......................... 3,821 3,897 3,401 4,671 4, 722 4,437 4,004 4,062 3, 693 4, 718 4, 761 4,479MEN * S AND BOYS’ SUITS AND COATS .............. 3,848 3,925 3,548 4,693 4,754 4,145 3,934 4,031 3, 606 4, 723 4, 798 4,159M E N ’S AND BOYS’ FURNISHINGS ................... 2,997 3,062 2,490 3,824 3,876 3,422 3,086 3,140 2.722 3, 848 3,899 3,430WOMEN'S AND MIS S E S ’ OUTERWEAR ................. 2,957 2,959 2,949 3,852 3, 863 3,760 3,051 3,055 3,024 3, 880 3, 888 3,812W OMEN’S AND CHILDREN’S UNDERGARMENTS ........ 2,850 2,857 2,767 3,714 3,727 3,499 2,938 2,940 2,921 3, 720 3, 733 3,499CHILDREN'S OUTERWEAR ........................... 2,791 2,769 2,888 3,688 3, 704 3,562 2,933 2,928 2,954 3,709 3,728 3,583SAWMILLS AND PLANING MILLS .................... 3, 566 4, 108 2,720 5, 777 6, 557 3,592 3,792 4,364 2, 874 5, 872 6,597 3,638MILLWORK, PLYWOOD AND RELATED PRODUCTS ..... 4,592 5,080 2,437 6,747 7,010 4,302 4,956 5,453 2,968 6,816 7,075 4,447HOUSEHOLD FURNITURE ........................... 3, 935 4,075 3,315 5,167 5,332 4,366 4, 110 4,251 3, 592 5,241 5,401 4,422PULP AND PAPER MILLS ........................... 7,935 8,056 6,031 8,701 8,801 7,232 8,077 8,214 6, 194 8,786 8,900 7,453PAPERBOARD CONTAINERS AND BOXES .............. 5,457 5,617 4,482 6,883 7,052 6,086 5,676 5,821 4,931 7,020 7, 137 6,281NEWSPAPERS ........................................ 5, 524 5,697 3,531 7,981 8,063 5,499 5,760 5,913 3, 839 8,069 8, 156 5,666COMMERCIAL PRINTING ............................. 5,848 6,058 4,238 8,193 8, 396 6,329 6,185 6,412 4,817 8, 364 8,540 6,437INDUSTRIAL CHEMICALS ........................... 8,961 9,132 6,933 9,649 9, 833 7,816 9,055 9,220 7, 284 9,713 9,928 7,896PLASTICS MATERIALS AND SYNTHETICS ........... 7,274 7,428 6,024 8,117 8,265 7,087 7,415 7,600 6,072 8, 176 8,323 7,112DRUGS ............................................... 7,352 7,618 5, 174 8,508 8,812 7,187 7,575 7,767 5,437 8,645 8,934 7,593SOAP, CLEANERS, AND TOILET GOODS ............. 5,783 6,214 3, 524 8,093 8,658 5,499 6,066 6,489 3, 824 8, 316 8,763 5,749PETROLEUM REFINING .............................. 9,602 9, 778 6,593 10,263 10,388 8,249 9,707 9,884 6,812 10,323 10,438 8,333TIRES AND INNER TUBES .......................... 8,327 8,480 6,357 9,215 9,331 7,949 8,438 8,690 6,428 9, 300 9,423 7,958OTHER RUBBER PRODUCTS .......................... 5,265 5,440 3,924 6,706 6, 756 6,124 5,434 5,603 4, 140 6,817 6,878 6,224FOOTWEAR, EXCEPT RUBBER ........................ 3,416 3,442 2,424 4,391 4,404 4,145 3,534 3,560 2, 541 4,425 4,439 4,145GLASS AND GLASSWARE, PRESSED OR BLOWN ...... 5,866 5,953 4,749 7,305 7,463 6,354 5,940 6,023 5, 149 7,336 7,503 6,424CONCRETE, GYPSUM, AND PLASTER PRODUCTS ..... 5,600 5,981 3,916 7,862 8,183 5,388 6,049 6,504 4, 291 7,946 8,280 5,571BLAST FURNACE AND BASIC STEEL PRODUCTS ..... 8, 358 8,559 7, 156 9,C9l 9,262 7,991 8,483 8,668 7, 299 9, 195 9, 354 8,165IRON AND STEEL FOUNDRIES ...................... 6,651 6,908 5,937 7,727 8, 105 7,043 6,821 7,085 6, 157 7,834 8,184 7,121NCNFERROUS ROLLING ANO DRAWING ............... 7, C7 1 7,205 5,041 8, C94 8,205 7,031 7,312 7,543 5.656 8,255 8,349 7,270CUTLERY, HAND TOOLS, AND HARDWARE ........... 5,653 5,880 3,892 6,980 7, 108 5,392 5,800 6,005 4, 166 7,042 7, 163 5,649FABRICATED STRUCTURAL METAL PRODUCTS ....... 6,022 6,257 4,392 7,820 7,939 5,989 6,426 6,654 4, 638 7,937 8, 104 6,093SCREW MACHINE PROCUCTS, BOLTS, ETC .......... 6, 157 6,241 5,124 7,827 7, 855 6,958 6,410 6,510 5, 249 7,916 7,951 7,124METAL STAMPINGS .................................. 6,505 6,824 5,112 8,319 8,524 7,474 6,788 7,076 5,520 8,447 8,676 7,587ENGINES ANO TURBINES ............................ 7,548 7,636 6, 124 8,189 8,268 7,553 7,746 7,804 6, 624 8,387 8, 464 7, 791FARM MACHINERY ................................... 6,660 6,870 4,937 8,187 8, 288 6,687 7,014 7, 114 5, 156 8, 249 8, 358 7,093CONSTRUCTION AND RELATED MACHINERY .......... 7,523 7,683 6,013 8,300 8, 380 7,349 7,761 7,838 6,270 8,433 8,512 7,446
Digitized for FRASER http://fraser.stlouisfed.org/ Federal Reserve Bank of St. Louis
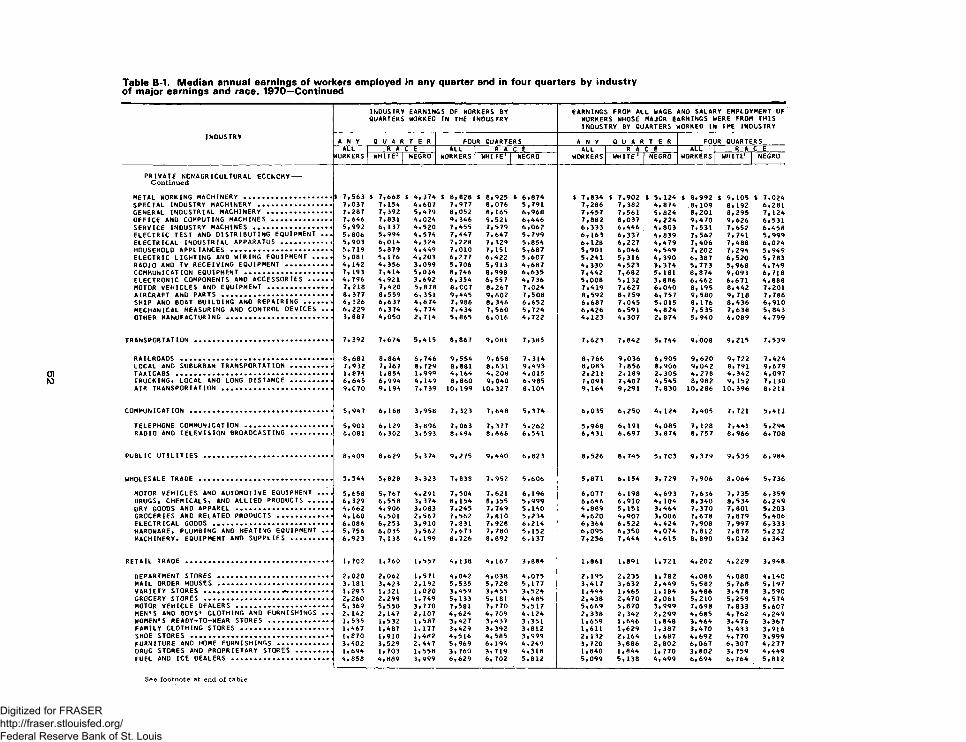
INDUSTRYQUARTERS
EARNINGS OF WORKERS BY WORKED IN THE INDUSTRY
EARNINGS FROM ALL WAGE. AND SALARY EMPLOYMENT OF WORKERS WHOSE MAJOR EARNINGS WERE FROM THIS INDUSTRY BY QUARTERS WORKED IN THE INDUSTRY
INDUSTRY A N Y Q U A R T E R FOUR QUARTERS A N Y Q U A R T E R FOUR QUARTERSALL--- ------n r r e ----- ALL R A C E ALL R A C E ALL R A C E
WORKERS WHITE1 | NEGRO WORKERS WHITE1 | NEGRO WORKERS WHITE1 1 NEGRO WORKERS WHITE1 | NEGRO
PRIVATE NCNAGRICULTURAL ECONOMY— -Continued
METAL WORKING MACHINERY ...................... S 7,563 $ 7,668 $ 4,374 $ 8,828 $ 8,925 S 6,874 % 7,834 $ 7,902 $ 5,124 % 8,992 * 9,105 % 7,024s p e c i a l INDUSTRY MACHINERY .................. 7, C37 7,154 4,607 7,977 8,076 5,791 7,286 7,382 4,874 8, 109 8,192 6,281GENERAL INDUSTRIAL MACHINERY ................ 7.287 7, 392 5,479 8,052 8, 165 6,966 7,457 7,561 5,824 8,201 8,295 7,124OFFICE AND COMPUTING MACHINES ............... 7,646 7,831 4,024 9,346 9,521 6,446 7,882 8,037 4, 224 9,470 9,626 6,531SERVICE INDUSTRY MACHINES ................... 5,9 92 6,137 4,520 7,455 7,579 6,062 6,333 6,446 4,803 7,531 7,652 6,458ELECTRIC TEST AND DISTRIBUTING EQUIPMENT ... 5,806 5,994 4,574 7,447 7,647 5,799 6,163 6,337 4, 839 7,562 7,741 5,999ELECTRICAL INDUSTRIAL APPARATUS....... . 5,903 6,014 4,324 7,228 7,329 5,854 6, 128 6,227 4,479 7,406 7,488 6,024HOUSEHOLD APPLIANCES ......................... 5,719 5,879 4,449 7,010 7, 151 5,687 5,901 6,046 4, 549 7,202 7, 294 5,949ELECTRIC LIGHTING AND WIRING EQUIPMENT ..... 5,081 5,176 4,203 6,277 6,422 5,607 5,241 5,316 4,390 6,387 6,520 5,783RA0I0 AND TV RECEIVING EQUIPMENT ............ 4, 142 4,356 3,099 5,706 5,913 4,687 4,330 4,523 3, 374 5,773 5,968 4,749COMMUNICATION EQUIPMENT ...................... 7, 193 7,414 5,034 8,746 8,998 6,635 7,442 7,682 5, 181 8,874 9,093 6,718ELECTRONIC COMPONENTS AND ACCESSORIES ...... 4, 796 4,921 3,692 6,354 6,557 4,736 5,008 5,132 3, 886 6,462 6,671 4,888MOTOR VEHICLES AND EQUIPMENT ................AIRCRAFT AND PARTS ...........................
7,218 8, 377
7,4208,559
5,8786,351
1 8,C07 9,445
8,2679,602
7,0247,508
7,4198,592
7,6278,759
6,040 6, 757
8, 195 9,580
8,442 9, 718
7,2017,786
SHIP AND BOAT BUILDING AND REPAIRING ....... 6,326 6,637 4,6 74 7,986 8, 346 6,652 6,687 7,045 5,015 8, 176 8,436 6,910MECHANICAL MEASURING AND CONTROL DEVICES ... OTHER MANUFACTURING ..........................
6,2293,887
6,3744,050
4,7742,714
7,4345,865
7,5606,016
5,7244,722
6,4264,123
6,5914,307
4,824 2, 874
7,5355,940
7,6386,089
5,8434,799
TRANSPORTATION .................................. 7, 392 7,674 5,415 8,867 9,081 7,385 7,623 7,842 5, 744 9,008 9,215 7,539
RAILROADS ...................................... 8,681 8,864 6,746 9,554 9,658 7,314 8,766 9,036 6,905 9,620 9,722 7,424LOCAL AND SUBURBAN TRANSPORTATION .......... 7,932 7,767 8,729 8,881 8,631 9,493 8,083 7,856 8,906 9,042 8,791 9,679TAXICABS ....................................... 1,874 1,854 1,999 4,164 4,208 4,015 2,211 2, 189 2,305 4,278 4,342 4,097TRUCKING, LOCAL AND LONG DISTANCE ........... 6,645 6,994 4,149 8,860 9,040 6,985 7,091 7,407 4, 545 8,982 9, 152 7,130AIR TRANSPORTATION ........................... 9,070 9, 194 7,739 10,199 10.327 8,104 9,164 9,291 7,830 10,286 10,396 8,211
COMMUNICATION ................................... 5,947 6,168 3,958 7,323 7,648 5,374 6,035 6,250 4, 124 7,405 7, 721 5,411
TELEPHONE COMMUNICATION........ ............. 5,901 6, 129 3,896 7,063 7,377 5,262 5.968 6,191 4,085 7, 128 7,441 5,294RADIO AND TELEVISION BROADCASTING .......... 6,081 6,302 3,593. 8,494 8,666 6,541 6,431 6,697 3,874 8,757 8,966 6,708
PUBLIC UTILITIES ................................ 8,409 8,629 5,374 9,275 9,440 6,823 8,526 8,745 5, 703 9,379 9,535 6,984
WHOLESALE TRADE ................................. 5,544 5,828 3,323 7,838 7,952 5,606 5,871 6, 154 3, 729 7,906 8,064 5,736
MOTOR VEHICLES AND AUTOMOTIVE EQUIPMENT .... 5,658 5,767 4,291 7,504 7,621 6,196 6,077 6,198 4, 693 7,636 7,735 6,359DRUGS, CHEMICALS, AND ALLIED PRODUCTS ...... 6, 329 6,558 3, 374 8,154 8, 355 5,999 6,646 6,910 4, 104 8,340 8,534 6,249DRY GOODS AND APPAREL ........................ 4,662 4,906 3,083 7,245 7,749 5,140 4,889 5,151 3,464 7,370 7,801 5,203GROCERIES AND RELATED PRODUCTS .............. 4, 160 4,501 2,567 7,562 7,810 5,234 4,620 4,907 3,006 7,678 7,879 5,406ELECTRICAL GOODS .............................. 6,086 6,253 3,910 7,831 7,928 6,214 6,364 6,522 4,424 7,908 7,997 6,333HARDWARE, PLUMBING AND HEATING EQUIPMENT ... 5,756 6,035 3,562 7,673 7,780 5,152 6,095 6,350 4,074 7,812 7,878 5,232MACHINERY, EQUIPMENT AND SUPPLIES .......... 6,923 7,138 4,199 8,726 8,892 6,137 7,256 7,444 4,615 8,890 9,032 6,343
RETAIL TRADE .................................... 1,702 1,760 1,557 4, 138 4, 167 3,884 1,861 1,891 1,721 4,202 4,229 3,948
d e p a r t m e n t STORES ............................MAIL ORDER HOUSES ............................
2,020 3, 181
2,0623,423
1,5712,192
4,0425,535
4,0385,728
4,0755,177
2,1953,417
2,2353,632
1,782 2,449
4,0865,582
4,080 5, 768
4,1405,197
VARIETY STORES .................. — ...........GROCERY STORES ................................
1,2932,260
1.3212,299
1,0201,749
3,459 5, 133
3,455 5, 181
3,5244,485
1,4442,438
1,4652,470
1, 184 2,061
3,4865,210
3,4785,259
3,5904,574
MOTOR VEHICLE DEALERS ........................ 5, 369 5,550 3,770 7,581 7,770 5,517 5,669 5,870 3,999 7,698 7,833 5,607MEN'S AND BOYS' CLOTHING AND FURNISHINGS .., 2, 142 2,147 2,107 4,624 4, 709 4,124 2,338 2,342 2,299 4,685 4,762 4,249WOMEN'S READY-TO-WEAR STORES ................ 1,535 1,532 1,587 3,427 3,437 3,351 1,659 1,646 1,848 3,464 3,476 3,367FAMILY CLOTHING STORES ......................JSHOE STORES .................................. -
1,4671,870
1,4871,910
1,1771,482
3,4294,516
3,392 4, 585
3,8123,999
1,611 2,132
1,6292,164
1,3871,687
3,4704,692
3,4334,770
3,9163,999
FURNITURE AND HOME FURNISHINGS ............. 3,402 3,529 2,447 5,969 6,194 4,249 3,720 3,886 2,802 6,067 6,307 4,277DRUG STORES AND PROPRIETARY STORES .........FUEL AND ICE DEALERS .........................
1,6944,858
1,7034,889
1,5583,999
3,7606,629
3.719 6, 702
4,3185,812
1,8405,099
1,844 5, 138
1, 770 4,499
3,8026,694
3,7596,764
4,4495,812
Digitized for FRASER http://fraser.stlouisfed.org/ Federal Reserve Bank of St. Louis
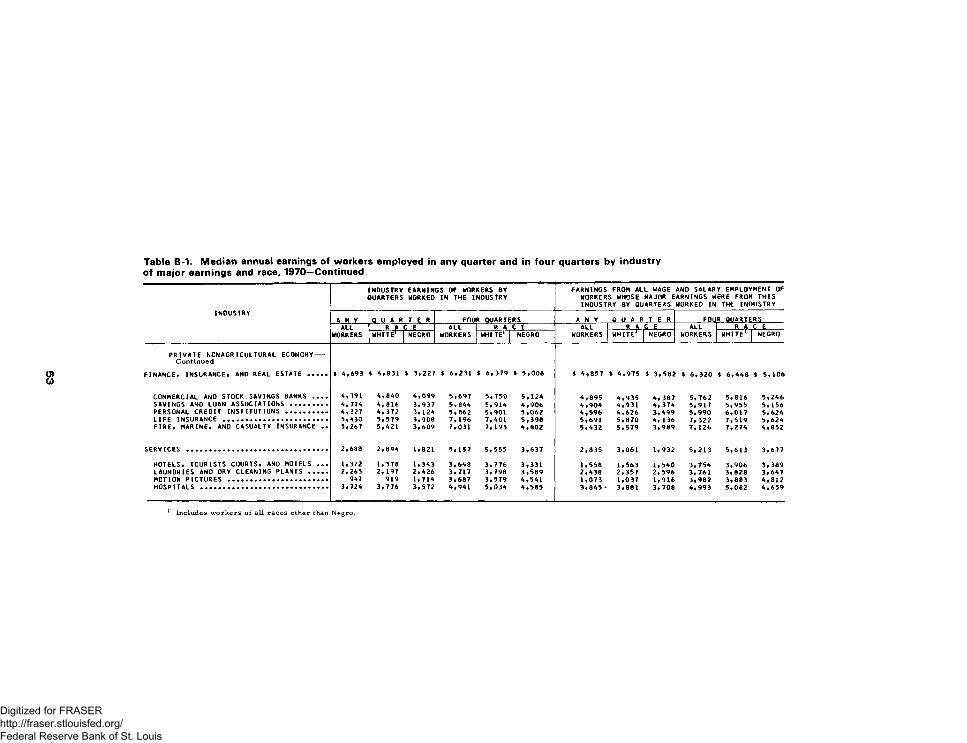
INDUSTRY
INDUSTRYQUARTERS
EARNINGS OF WORKERS BY WORKED IN THE INDUSTRY
EARNINGS FROM ALL WAGE AND SALARY EMPLOYMENT OF WORKERS WHOSE MAJOR EARNINGS WERE FROM THIS INDUSTRY BY QUARTERS WORKED IN THE INDUSTRY
A N Y Q U A R T E R FOUR QUARTERS A N Y Q U A R T E R FOUR QUARTERSALL
WORKERSR A C: E
W(ALL R A (: E ALL
WORKERSR A iSL_E______ ALL
WORKERSR A 1EL_E_______
WHITE1 | NEGRO 3RKERS WHITE1 | NEGRO WHITE1 NEGRO WHITE1 1 NEGRO
PRIVATE NCNAGRICULTURAL ECONOMY--Continued
FINANCE* INSURANCE. AND REAL ESTATE ..... % A,693 $ A,831 :1 3,227 * 6,231 * 6,379 $ 5,006 $ 4,857 $ 4,975 $ 3,582 S 6,320 $ 6,448 S 5,106
COMMERCIAL AND STOCK SAVINGS BANKS .... A, 791 A, 8A0 A,099 5,697 5,750 5,124 4,895 4,935 4, 387 5,762 5,816 5,246SAVINGS AND LOAN ASSOCIATIONS ......... 4,774 A,816 3,937 5.8AA 5,914 4,906 4,904 4,931 4, 374 5,917 5,955 5,156PERSONAL CREDIT INSTITUTIONS .......... A, 327 A,372 3, 12A 5,862 5,901 5,062 4,596 4,626 3, 499 5,990 6,017 5,624LIFE INSURANCE .......................... 5, A30 5,579 3,908 7, 196 7,401 5,398 5,691 5,870 4, 136 7,322 7,519 5,624FIRE. MARINE, AND CASUALTY INSURANCE .. 5,267 5.A21 3,609 7,031 7, 193 4,802 5,432 5.579 3,989 7,126 7,274 4,852
SERVICES ................................... 2,688 2,89A 1,821 5,157 5,555 3,637 2,835 3,061 1,932 5,213 5,613 3,677
HOTELS, TOURISTS COURTS, AND MOTELS ... 1,372 1,378 1,3A3 3,6A8 3,776 3,331 1,558 1,563 1,540 3,754 3,906 3,389LAUNDRIES AND DRY CLEANING PLANTS .... 2,265 2, 197 2.A26 3,717 3, 798 3,589 2,438 2,357 2,596 3, 761 3,828 3,647MOTION PICTURES ......................... 9A7 919 1,71A 3,687 3,579 4,541 1,073 1,037 1,916 3,982 3,883 4,812HOSPITALS ................................ 3,72A 3,776 3,572 A , 941 5,034 4,585 3,845 - 3,881 3,708 4,993 5,082 4,659
Digitized for FRASER http://fraser.stlouisfed.org/ Federal Reserve Bank of St. Louis
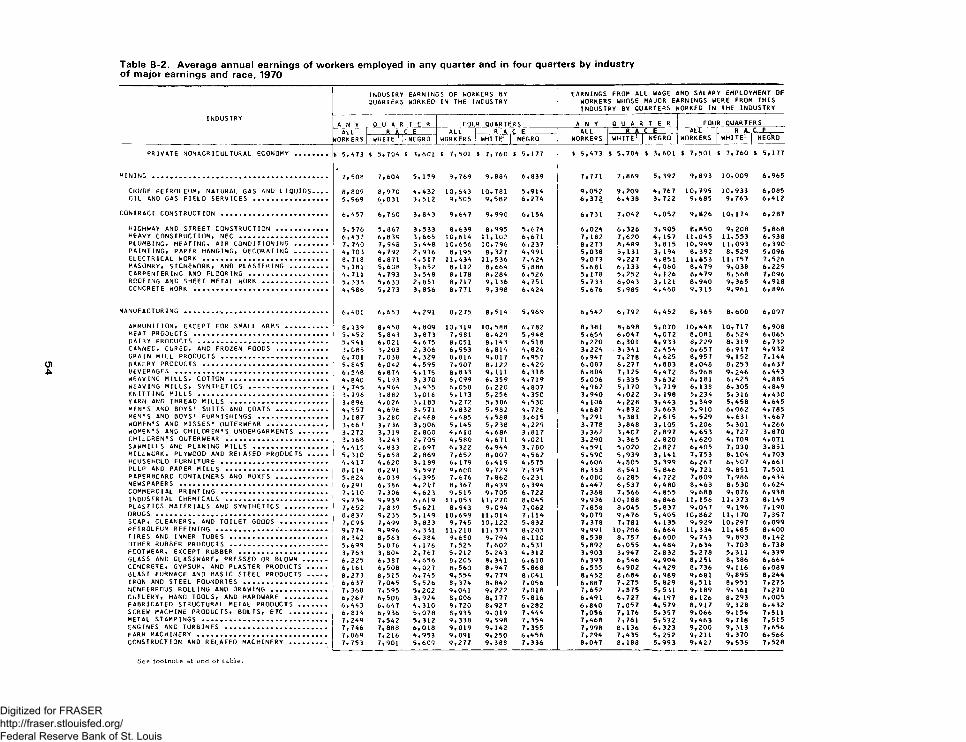
INDUSTRY
INDUSTRYQUARTERS
EARNINGS OF WORKERS BY WORKEO IN THE INDUSTRY
EARNINGS FROM ALL WAGE AND SALARY EMPLOYMENT OF WORKERS WHOSE MAJOR EARNINGS WERE FROM THIS INDUSTRY BY QUARTERS WORKED IN THE INDUSTRY
A N Y Q U A R T E R FOUR QUARTERS A N Y Q U A R T E R FOUR QUARTERSALL
WORKERSR A C E ALL
WORKERSR A C E ALL
WORKERSR. A_“L E _____ ALL
WORKERSR A C.~-E. ___
WHITE 1 |.NEGRO WHITE1 NEGRO WHITE1 | NEGRO WHITE1 | NEGRO
PRIVATE NONAGRICULTURAL ECONOMY ........ $ 5, A 7 3 t 5,70A $ 3,601 $ 7,501 $ 7,760 $ 5,177 % 5,A73 % 5,70A $ 3,601 % 7,501 $ 7,760 i 5,177
MINING ............... ............................ 7,508 7,60 A 5, 159 9,769 9,88A 6,839 7,771 7,869 5,392 9,893 10,009 6,965
CRUOE PETROLEUM, NATURAL GAS AND LIQUIDS.... 8,809 8,970 A, A32 10,6A3 10,781 5,91A 9,052 9,209 A, 767 10,795 10,933 6,085OIL AND GAS FIELD SERVICES .................. 5,969 6,031 3,512 9,505 9,582 6,27A 6,372 6, A38 3, 722 9,685 9,763 6, A 12
CONTRACT CONSTRUCTION .......................... 6 , A57 6,760 3,8A3 9,6A7 9, 990 6,15A 6,731 7,0A2 A,052 9,826 10,17A 6,287
HIGHWAY AND STREET CONSTRUCTION ............ 5,576 5,867 3,533 8,639 8,995 5,67A 6,02A 6,326 3,905 8,850 9,208 5,668HEAVY CONSTRUCTION, NEC ...................... 6, A 37 6,839 3,665 10,61A 11,102 6,671 7, 182 7,620 A, 157 11,0A5 11,553 6,938PLUMBING, HEATING, AIR CONDITIONING ........ 7, 7A0 7, 9A8 3, AA8 10,656 10,796 6,237 8,273 8.A89 3. 815 10,9A9 11,093 6,390PAINTING, PAPER HANGING, DECORATING ........ A, 703 A, 792 2,936 8,195 8,327 A,991 5,038 5,131 3, 19A 8,392 8,529 5,096ELECTRICAL WORK ............................... 8,718 8,871 A,517 11,A3A 11,536 7,A2A 9,073 9,227 A,851 11,653 11,757 7,526MASONRY, STONEWORK, AND PLASTERING ......... 5, 181 5,608 3,652 8,112 8, 66A 5,886 5,681 6,133 A,060 8, A79 9,038 6,229CARPENTERING AND FLOORING ................... A, 711 A,793 3,5A8 8,178 8, 28A 6,526 5,178 5,252 A, 126 8, A79 8,568 7,096ROOFING AND SHEET METAL WORK ................ 5,338 5,633 2,851 8,717 9,136 A,751 5,733 6 , OA 3 3, 121 8,9A0 9,365 A,918CONCRETE WORK ................................. A,986 5,273 3,856 8,771 9, 398 6,A2A 5,676 5,985 A, A60 9,315 9,961 6,896
MANUFACTURING ................................... 6, AO 1 6,653 A,291 8,275 8,51A 5,969 6,5A 2 6,792 A, A52 8, 365 8,600 6,097
AMMUNITION, EXCEPT FOR SMALL ARMS .......... 8, 139 8, A58 A,809 10,319 10,588 6,782 8,381 8,698 5,070 10,AA8 10,717 6,908MEAT PRODUCTS ................................. 5, A52 5,8 A3 3,873 7,981 8, A29 5 ,9A8 5,6 5A 6,0A7 A,072 8,081 8,52A 6,065DAIRY PRODUCTS ................................ 5,9 A1 6,021 A, 675 8,051 8, lA3 6,518 6,220 6,301 A,933 8,229 8, 319 6,732CANNED, CURED, AND FROZEN FOODS ............ 3,085 3,203 2,306 6,553 6, 8 1A A,826 3 » 22A 3,3A1 2, A5A 6,657 6,917 A,932GRAIN MILL PRODUCTS .......................... 6,701 7,038 A, 3 29 8,816 9,017 6,957 6,9A7 7,278 A, 625 8,957 9, 152 7, l AAb a k e r y PROCUCTS ............................... 5.8A5 6,0A2 A, 595 7,907 8, 122 6, A29 6,087 6,277 A,883 8,0A8 8,253 6,637BEVERAGES ...................................... 6,5 A8 6,87A A, 175 8.833 9,111 6,318 6,80A 7,125 A, A72 8,968 9,2A6 6, AA3WEAVING MILLS, COTTON ........................ A , 8 AO 5, 193 3, 370 6, 099 6, 359 A, 719 5,006 5,335 3,632 6, 181 6, A25 A,885WEAVING MILLS, SYNTHETICS ................... A, 7A5 A , 9 6A 3, A35 6,058 6, 220 A,807 A,962 5, 170 3, 719 6,138 6,305 A.8A9k n i t t i n g MILLS ................................ 3, 796 3,882 3,016 5. 173 5,256 A,350 3,9A0 A,022 3, 198 5,23A 5, 316 A, A30YARN AND THREAD MILLS ........................ 3,896 A,026 3,183 5,272 5,386 A,530 A, 106 4,228 3, AA3 5,3A9 5, A58 A, 6A5MFN'S AND BOYS* SUITS AND COATS ............. A, 557 A,696 3,571 5,832 5, 982 A,726 A,687 A,832 3,663 5,910 6,062 A,785MEN'S AND BOYS' FURNISHINGS ................. 3, 187 3,280 2, A88 A, A85 A,588 3,615 3,291 3,381 2,615 A,529 A, 631 3,667WOMEN'S AND MISSES' OUTERWEAR ............... 3,667 3,736 3,006 5, 1A5 5,238 A,229 3,778 3,8A8 3, 105 5,206 5,301 A,266WOMAN'S AND CHILDREN'S UNDERGARMENTS ....... 3,272 3,319 2,800 A,610 A, 686 3,817 3,362 3, AO 7 2,897 A,653 A, 727 3,870CHILDREN'S OUTERWEAR ......................... 3, 168 3, 2 A3 2,705 A,580 A, 671 A,021 3,290 3,365 2, 820 A, 620 A, 709 A,071SAWMILLS ANC PLANING MILLS .................. A , A 15 A,833 2,697 6,322 6, 9AA 3,780 A,591 5,020 2,827 6, A05 7,030 3,851MILLWORK, PLYWOOD AND RELATED PRODUCTS ..... 5,310 5,658 2,869 7,652 8,007 A,562 5,590 5,939 3, 1A 1 7,753 8, 10A A,703HOUSEHOLD FURNITURE .......................... A , A 1 7 A , 62C 3,189 6, 179 6, A 19 A,575 A,606 A,805 3, 399 6, 267 6, 507 A,661PULP ANO PAPER MILLS ......................... 8, 1 1A 8,291 5,597 9,600 9,729 7,395 8,363 8,5A 1 5, 8A6 9, 721 9,851 7,501PAPERBOARD CONTAINERS AND BOXES ............ 5,8 2 A 6,039 A, 395 7,676 7,862 6,231 6,080 6,285 A, 722 7,809 7,986 6, A3 ANEWSPAPERS ..................................... 6, 291 6, 386 A, 2 17 8,367 8, A39 6,39A 6 , AA7 6,537 A, A80 8, A63 8, 530 6,62ACOMMERCIAL PRINTING .......................... 7, 110 7,306 A,623 9,515 9,705 6,722 7,368 7,566 A, 855 9, 688 9,876 6,938INDUSTRIAL CHEMICALS ......................... 9,7 3 A 9,989 6,619 11,053 11,270 8, OA5 9,936 10,188 6, 8A6 11,156 11.373 8, 1A9PLASTICS MATERIALS AND SYNTHETICS .......... 7,652 7,839 5,621 8,9 A3 9,09A 7,062 7,858 8,0A5 5,837 9,0A7 9, 196 7,190DRUGS .......................................... 8,837 9,235 5, IA9 10,699 11,01A 7,11A 9,079 9, A76 5, A05 10,862 11, 1 70 7,357SOAP, CLEANERS, AND TOILET GOODS ........... 7, C95 7, A99 3,833 9,7A5 10, 122 5,832 7,378 7,781 A, 135 9,929 10,297 6,099PETROLEUM REFINING ............... ............ 9,77A 9,996 6, 331 11,218 11,373 8,203 9,991 10,206 6, 66A 11,33A 11,A85 8, AOOTIRES AND INNER TUBES ........................ 8, 3A2 8,563 6,38A 9,650 9, 79A 8,110 8,538 8,757 6, 600 9, 7A3 9, 893 8,1A2OTHER RUBBER PRODUCTS ........................ 5,699 5,876 A, 176 7,525 7,602 6,531 5,092 6,055 A, A8A 7, 63A 7, 703 6,738FOOTWEAR, EXCEPT RUBBER ...................... 3,763 3,80A 2,767 5,212 5, 2A3 A,312 3,903 3.9A7 2,832 5,278 5,311 A,339GLASS AND GLASSWARE, PRESSED OR BLOWN ...... 6, 225 6,387 A,656 8,205 8,3A1 6,610 6,393 6,5A6 A, 90A 8, 251 8,386 6,66ACONCRETE, GYPSUM, AND PLASTER PRODUCTS ..... 6, 161 6,508 A,027 8,560 8,9A7 5,868 6,555 6,902 A, A29 8, 736 9, 116 6,089BLAST FURNACE AND BASIC STEEL PRODUCTS ..... 8,273 8,515 6, 7A5 9, 55A 9,779 8,0A1 8, A52 8,68A 6,989 9,681 9,895 8,2AAIRON AND STEEL FOUNDRIES ..................... 6,637 7,0A5 5,526 8,3 7A 8, 8A2 7,056 6,887 7,275 5,829 8,511 8,951 7,275NCNFERROUS ROLLING AND DRAWING .............. 7, 368 7,595 5,202 9 » OA1 9,222 7,018 7,652 7,875 5, 531 9, 189 9, 361 7,270CUTLERY, HAND TOOLS, AND HARDWARE .......... 6,267 6,508 3,92A 8,006 8, 177 5,816 6 , A9 1 6,727 A, 197 8,126 8,293 6,005FABRICATED STRUCTURAL METAL PRODUCTS ....... 6, A A3 6,6 A 7 A, 310 8,720 8,927 6,282 6,8A0 7,057 A, 579 8,917 9, 128 6, A32SCREW MACHINE PRODUCTS, BOLTS, ETC ......... 6 , 8 1A 6,936 5,078 8,935 9,019 7,AAA 7,056 7, 176 5,357 9,066 9, 15A 7,511METAL STAMPINGS ............................... 7, 2A9 7,5A2 5,312 9,338 9, 598 7,35A 7, A68 7,761 5,532 9, A63 9,718 7,515ENGINES ANC TURBINES ......................... 7, 7A6 7,888 6,018 9,019 9, 1A2 7,355 7,998 8,136 6,323 9,200 9, 313 7,656FARM MACHINERY ................................ 7,069 7,216 A,953 9,091 9,250 6 ,A56 7,29A 7, A35 5, 252 9, 211 9, 370 6,566CONSTRUCTION AND RELATED MACHINERY ......... 7,753 7,901 5,609 9,277 9, 388 7,336 8,0A7 8,188 5,993 9, A 2.7 9,535 7,528
Digitized for FRASER http://fraser.stlouisfed.org/ Federal Reserve Bank of St. Louis
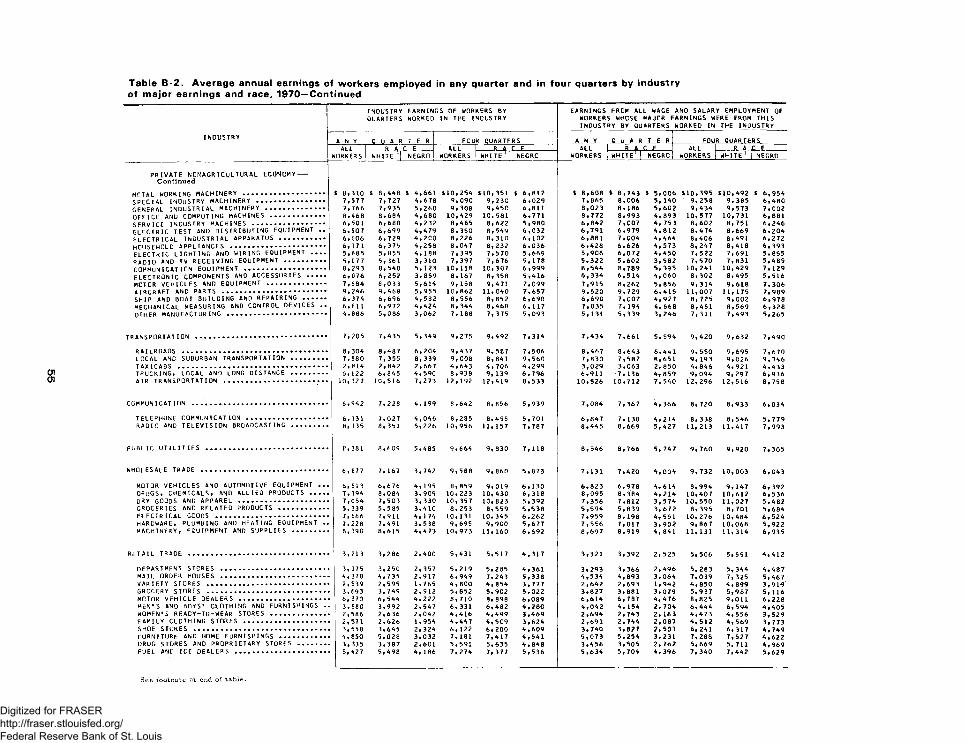
OlOl
INDUSTRY
INDUSTRY EARNINGS OF WORKERS BY QUARTERS WORKED IN THE INDUSTRY
EARNINGS FROM ALL WAGE AND SALARY EMPLOYMENT OF WORKERS WHOSE MAJOR EARNINGS WERE FROM THIS INDUSTRY BY QUARTERS WORKED IN THE INDUSTRY
A N Y Q U A R T E R FOUR QUARTERS A N Y Q U A R T E R FOUR QUARTERSALL
WORKERSft A f F Al I I R A f. F ALL 1 R A C E ALL
WORKERSR A C F
WHITE | NEGRO WORKERS | WHITE1| NEGRG WORKERS | WHITE1 | NEGRO WHITE1 I NEGRO
private ncnagriCultural economy—Continued
METAL WORKING MACHINERY .................... $ 8,310 $ 8,448 $ 4,661 410,254 410,351 4 6,812 $ 8,608 $ 8,743 $ 5,006 $10,395 $10,492 $ 6,954SPECIAL INDUSTRY MACHINERY ................. 7,577 7,727 4,678 9,090 9,230 6,029 7,865 8,006 5, 140 9,258 9,385 6,480GENERAL INDUSTRIAL MACHINERY ............... 7,766 7,935 5,260 9,308 9,450 6,811 8,023 8,186 5,602 9,434 9,573 7,002OFFICE AND COMPUTING MACHINES ............. 8,468 8,684 4,680 10,429 10,581 6,771 8,772 8,993 4,893 10,577 10,731 6,881SERVICE INDUSTRY MACHINES .................. 6,501 6,680 4,232 8,465 8,622 5,980 6,842 7,007 4, 753 8,602 8,751 6,246ELECTRIC TEST AND DISTRIBUTING EQUIPMENT .. 6,507 6,699 4,479 8,350 8,549 6,032 6,791 6,979 4,812 8,474 8,669 6,204ELECTRICAL INDUSTRIAL APPARATUS ........... 6,606 6,729 4,200 8,226 8,310 6,102 6,881 7,004 4,464 8,406 8,491 6,272
6, 171 6, 375 4,258 8 , C47 8,232 6,036 6,428 6,626 4,573 8,247 8,418 6,393ELECTRIC LIGHTING AND WIRING EQUIPMENT .... 5,685 5,855 4,188 7,395 7,570 5,669 5,906 6,072 4,450 7,522 7,691 5,855RADIO AND TV RECEIVING EQUIPMENT .......... 5, C77 5,361 3,310 7,397 7,676 5,178 5,322 5,602 3,582 7,570 7,831 5,489COMMUNICATION EQUIPMENT .................... 8,293 8,540 5, 123 10,118 10,307 6,999 8,544 8,789 5,395 10,241 10,429 7,129ELECTRONIC COMPONENTS AND ACCESSORIES .... 6,076 6,252 3,859 8,167 8,358 5,416 6,334 6,514 4,060 8,302 8,495 5,516MOTOR VEHICLES AND EQUIPMENT .............. 7,684 8,033 5,614 9, 158 9,471 7,099 7,915 8,262 5,856 9,314 9,618 7,306AIRCRAFT AND PARTS .......................... 9,246 9,468 5,955 10,862 11,040 7,657 9,520 9,729 6,415 11,007 11,175 7,989SHIP ANO BOAT BUILDING AND REPAIRING ...... 6, 374 6,696 4,582 8,556 8,852 6,690 6,690 7,007 4,927 8, 725 9,002 6,978MECHANICAL MEASURING AND CONTROL OEVICES .. 6,611 6,972 4,424 8,344 8,468 6,117 7,035 7, 194 4, 668 8,451 8,569 6,328
4,886 5,086 3,062 7, 188 7, 375 5,093 5,131 5,339 3, 246 7,311 7,493 5,265
7,205 7,435 5,349 9,275 9,492 7,314 7,434 7,661 5, 594 9,420 9,632 7,490
RAILROADS .................................... 8, 304 8,487 6,204 9,437 9,587 7,506 8,467 8,643 6,441 9,550 9,695 7,670LOCAL AND SUBURBAN TRANSPORTATION ......... 7,580 7, 355 8,3 39 9,008 8,841 9,560 7,830 7,587 8,651 9, 193 9,026 9,746TAXICABS ..................................... 2,814 2,842 2,667 4,643 4,706 4,299 3,029 3,063 2,850 4,846 4,921 4,433TRUCKING, LOCAL AND LONG DISTANCE ......... 6,622 6,845 4,59C 8,938 9, 139 6,796 6,911 7,136 4, 859 9,094 9,297 6,936AIR TRANSPORTATION ...................... . 10,327 10,516 7,273 12,192 12,419 8,533 10,526 10,712 7, 540 12,296 12,516 8,758
COMMUNICATION .................................. 6,942 7,228 4, 199 8,642 8,856 5,939 7,084 7,367 4, 366 8,720 8,933 6,034
TELEPHONE COMMUNICATION .................... 6,731 7,027 4,046 8,285 8,495 5,701 6,847 7,138 4,214 8, 338 8,546 5,779RADIO AND TELEVISION BROADCASTING ......... 8, 135 8, 351 5,226 10,956 11,157 7,787 8,445 8,669 5,427 11,213 11,417 7,993
PUBLIC UTILITIES .............................. 8,381 8,609 5,485 9,664 9,830 7,118 8,546 8,766 5, 747 9,760 9,920 7,305
WHOLESALE TRADE ............................... 6,877 7, 167 3,742 9,588 9, 860 5,873 7,131 7,420 4,004 9,732 10,003 6,043
MOTOR VEHICLES AND AUTOMOTIVE EQUIPMENT ... 6,513 6,676 4,195 8,859 9,019 6,130 6,823 6,978 4,614 8,994 9, 147 6,392DRUGS, CHEMICALS, ANO ALLIED PRODUCTS .... 7,794 8,084 3,909 10,223 10,430 6,318 8,095 8,384 4,214 10,407 10,612 6,536DRY GOODS AND APPAREL ...................... 7,054 7,503 3,330 10,357 10,823 5,392 7,356 7,812 3,574 10,550 11,027 5,482GROCERIES AND RELATED PRODUCTS ............ 5,339 5,585 3,410 8,253 8,559 5,538 5,594 5,839 3, 672 8,395 8,701 5,684ELECTRICAL GOODS ............................ 7,666 7,911 4, 174 10,131 10,345 6,262 7,959 8,198 4, 551 10,276 10,484 6,524HARDWARE, PLUMBING AND HEATING EQUIPMENT .. 7,228 7,491 3,538 9,695 9,900 5,677 7,556 7,817 3,902 9,867 10,068 5,922MACHINERY, EQUIPMENT AND SUPPLIES ......... 8,390 8,615 4,473 10,973 11,160 6,692 8,697 8,919 4,841 11,131 11,314 6,935
RETAIL TRADE ................................... 3,213 3,286 2,400 5,431 5,517 4,317 3,321 3,392 2,525 5,506 5,591 4,412
DEPARTMENT STORES ........................... 3, 175 3,250 2,357 5,219 5,285 4,361 3,293 3,366 2,496 5,283 5, 344 4,487MAIL ORDER HOUSES ........................... 4,378 4,735 2,917 6,949 7,243 5,338 4,534 4,893 3,064 7,039 7, 325 5,467VARIETY STORES .............................. 2,539 2,595 1,765 4,800 4,854 3,777 2,642 2,693 1,942 4, 850 4,899 3,91*GROCERY STORES .............................. 3,693 3,749 2,912 5,852 5,902 5,022 3,827 3,881 3,079 5,937 5,987 5,116MOTOR VEHICLE DEALERS ...................... 6, 370 6,544 4,222 8,710 8,898 6,089 6,614 6,787 4,476 8,825 9,011 6,228MEN’S AND BOYS’ CLOTHING AND FURNISHINGS .. 3,880 3,992 2,547 6,331 6,482 4,280 4,042 4, 154 2, 704 6,444 6,594 4,405WOMEN'S REACY-TO-WEAR STORES ............. . 2,586 2,636 2,042 4,416 4,499 3,469 2,694 2,743 2, 163 4,473 4,556 3,529FAMILY CLOTHING STORES ........... ......... 2,571 2,626 1,954 4,447 4,509 3,624 2,691 2,744 2,087 4, 512 4,569 3,773SHOE STORES .................................. 3,558 3,645 2,324 6,122 6,200 4,609 3,740 3,827 2,503 6,241 6,317 4,749f u r n i t u r e a n d h o m e f u r n i s h i n g s ............ 4,850 5,028 3,032 7, 181 7,417 4,541 5,073 5,254 3,231 7,288 7,527 4,622DRUG STORES AND PROPRIETARY STORES ........ 3,335 3, 387 2,601 5,591 5,635 4,848 3,456 3,505 2, 762 5,669 5,711 4,969FUEL AND ICE D E A L E R S........ ............... 5,427 5,498 4, 186 7,274 7,377 5,536 5,634 5,704 4,396 7,340 7,442 5,629
Digitized for FRASER http://fraser.stlouisfed.org/ Federal Reserve Bank of St. Louis
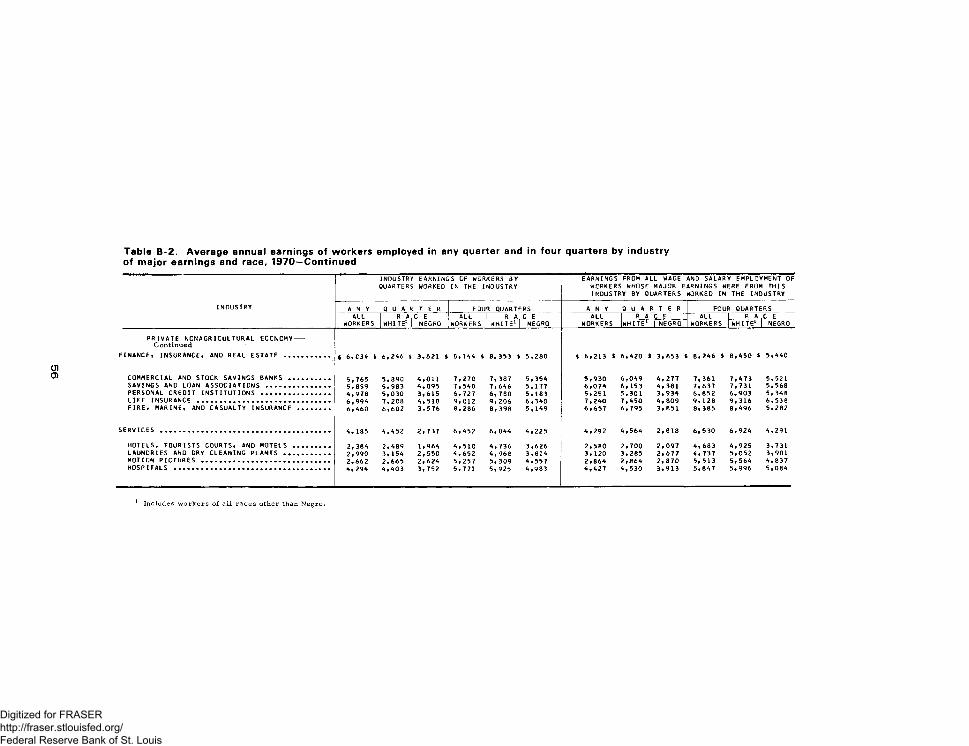
INDUSTRYQUARTERS
EARNINGS OF WORKERS 8Y WORKED IN THE INDUSTRY
EARNINGS FROM ALL WAGE AND SALARY EMPLOYMENT OF WORKERS WHOSE MAJOR EARNINGS WERE FROM THIS INDUSTRY BY QUARTERS WORKED IN THE INDUSTRY
INDUSTRY A N Y Q U A R T E R FOUR QUARTERS A N Y Q U A R T E R FOUR QUARTERSALL R A iC E ALL R A C E ALL 1 R A C E ALL 1 R A iC E
WORKERS WHITE1 | NEGRO WORKERS WHITE1| NEGRO WORKERS (w h i t e 1 | NEGRO WORKERS | WHITE1 | NEGRO
PRIVATE NCNAGRICULTURAL ECONOMY--Continued
FINANCE, INSURANCE, AND REAL ESTATE ........... « 6,C34 I 6,246 S 3,621 » 8,144 $ 8,353 i 5,280 t 6,213 S 6,420 S 3,853 % 8,246 % 8,450 % 5,440
COMMERCIAL AND STOCK SAVINGS BANKS .......... 5,765 5,890 4,011 7,270 7, 387 5,354 5,930 6,049 4,277 7, 361 7,473 5,521SAVINGS AND LOAN ASSOCIATIONS ................ 5,899 5,983 4,095 7,540 7,646 5,177 6,074 6, 153 4,381 7,637 7,731 5,568PERSONAL CREDIT INSTITUTIONS ................. 4,978 5,030 3,615 6,727 6,780 5,183 5,251 5,301 3,934 6,852 6,903 5,348LIFE INSURANCE ................................. 6,994 7,208 4,518 9,012 9,206 6,340 7,240 7,450 4,809 9, 128 9,316 6,538FIRE, MARINE, AND CASUALTY INSURANCE ........ 6,460 6,602 3,576 8,286 8, 398 5,149 6,657 6,795 3,851 8,385 8,496 5,282
SERVICES .......................................... 4, 185 4,452 2,737 6,452 6, 844 4,225 4,292 4,564 2,818 6,530 6,924 4,291
HOTELS, TOURISTS COURTS, AND MOTELS ......... 2,384 2,489 1,964 4,510 4, 736 3,626 2,580 2,700 2,097 4,683 4,925 3,731LAUNDRIES AND DRY CLEANING PLANTS ........... 2,990 3, 154 2,550 4,652 4,968 3,814 3,120 3,285 2,677 4,737 5,052 3,901MOTION PICTURES ................................ 2,662 2,665 2,624 5,257 5, 309 4,557 2,864 2,864 2,870 5,513 5,564 4,837HOSPITALS ....................................... 4,294 4,403 3,752 5,771 5,925 4,983 4,427 4,530 3,913 5,847 5,996 5,084
Digitized for FRASER http://fraser.stlouisfed.org/ Federal Reserve Bank of St. Louis
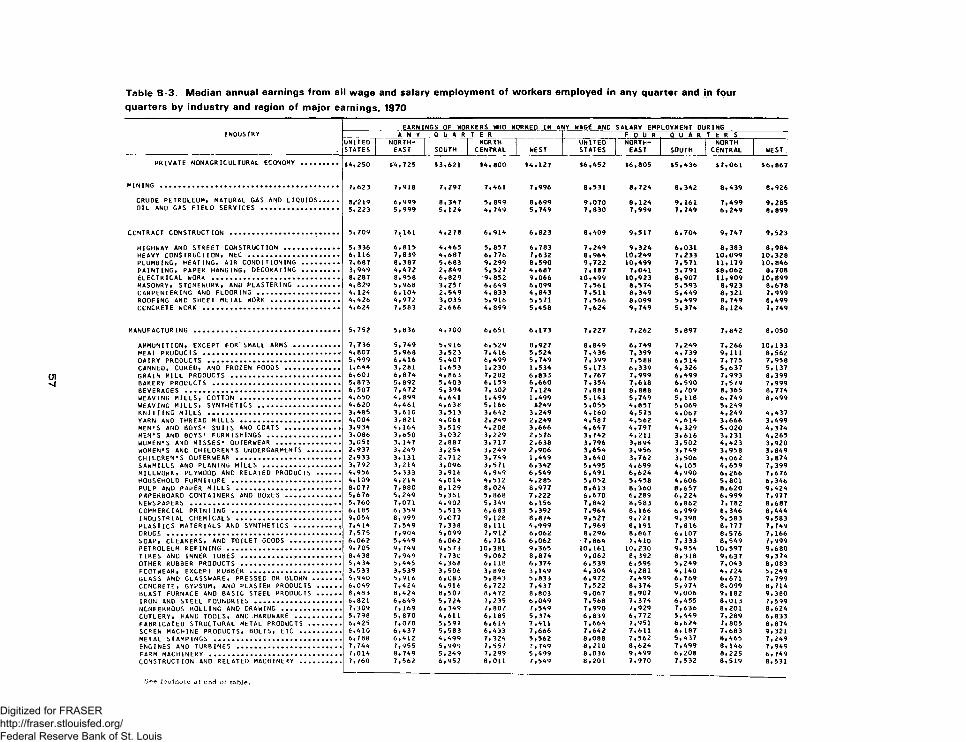
INDUSTRYEARNINGS OF WORKERS WHO WORKED IN ANY WAGE ANO SALARY EMPLOYMENT DURING
A N Y Q U A R T E R F O U R Q U A R T E R SUNITEDSTATES
NORTHEAST SOUTH
NORTHCENTRAL WEST
UNITEDSTATES
NORTHEAST SOUTH
NORTHCENTRAL WEST
PRIVATE NONAGRICULTURAL ECONOMY ......... $4,250 $4,725 $3,621 $4,800 $4,127 $6,452 $6,805 $5,436 $7,061 $6,867
MINING ............................................ 7,623 7,918 7,297 7,461 7,996 8,531 8,724 8,342 8,439 8,926
CRUDE PETROLEUM, NATURAL GAS AND LIQUIDS.... 8/219 6,999 8,347 5, 899 8,699 9,070 8,124 9, 161 7,499 9,285OIL AND GAS FIELD SERVICES ................... 5, 223 5,999 5,124 4,749 5,749 7,830 7,999 7,749 6,249 8,899
CONTRACT CONSTRUCTION .................... ...... 5,709 7,161 4,278 6,914 6,823 8,409 9,517 6,704 9,747 9,523
HIGHWAY ANO STREET CONSTRUCTION ............. 5, 336 6,815 4,465 5, 857 6,783 7,249 9,324 6,031 8,383 8,984HEAVY CONSTRUCTION, NEC ....................... 6, 116 7,839 4,687 6,776 7,632 8,964 10,249 7,233 10,099 10,328PLUMBING, HEATING, AIR CONDITIONING ......... 7,687 8,387 5,683 9,299 8,590 9,722 10,499 7,571 11,179 10,846PAINTING, PAPER HANGING, DECORATING ......... 3,949 4,472 2,849 5,527 4,687 7,187 7,041 5,791 $8,062 8,708ELECTRICAL WORK ................................ 8,287 8,958 6,829 9, 852 9,066 10,499 10,923 8,907 11,909 10,899MASONRY, STONEWORK, AND PLASTERING .......... 4,829 5,968 3,257 6,649 6,099 7,561 8,574 5,593 8,923 8,678CARPENTERING AND FLOORING .................... 4, 124 6,104 2,549 4, 833 4,843 7,511 8,349 5,449 8,321 7,999ROOFING ANC SHEET METAL WORK ................. 4,426 4,972 3,035 5,916 5,571 7,566 8,099 5,499 8,749 8,499CONCRETE WCRK .................................. 4,624 7,583 2,666 4,899 5,458 7,624 9,749 5,374 8, 124 7,749
MANUFACTURING .................................... 5,752 5,836 4,700 6,651 6,173 7,227 7,262 5,897 7,842 8,050
AMMUNITION, EXCEPT FOR'SMALL ARMS ........... 7,736 5,749 5,916 6,529 8,927 8,849 6,749 7,249 7,266 10,133MEAT PRODUCTS .................................. 4,807 5,968 3,523 7,416 5,524 7,436 7, 399 4,739 9,111 8,562DAIRY PRODUCTS ................................. 5,999 6,416 5,407 6,499 5,749 7,399 7,588 6,514 7,775 7,958CANNED, CURED, AND FROZEN FOODS ............. 1,644 3,281 1,653 1,230 1 ,534 5,173 6,339 4, 326 5,637 5, 137GRAIN MILL PRODUCTS ........................... 6,601 6,874 4,863 7,282 6,833 7,767 7,999 6,499 7,993 8,399BAKERY PRODUCTS ................................ 5,873 5,892 5,403 6, 159 6,660 7,354 7,618 6,590 7,579 7,999BEVERAGES ....................................... 6,507 7,472 5,394 7, 302 7,124 7,881 8,888 6,709 8,365 8,774WEAVING MILLS, COTTON ......................... 4,650 4,899 4,641 1,499 1,499 5,143 5,749 5,118 6,749 8,499WEAVING MILLS, SYNTHETICS .................... 4,620 4,461 4,638 5, 166 $249 5,055 4,857 5,069 5,249KNITTING m i l l s ................................. 3,485 3,610 3,513 3,642 3,249 4,160 4,573 4,067 4,249 4,437YARN AND THREAD MILLS ......................... 4,004 3,821 4,061 2,249 2,249 4,587 4,562 4,614 3,666 3,499MEN'S AND BOYS' SUITS AND COATS ............. 3,934 4, 164 3,519 4,208 3,666 4,647 4,797 4, 329 5,020 4,374MEN'S AND BOYS' FURNISHINGS .................. 3,086 3,650 3,032 3,229 2,576 3,742 4,211 3,616 3,731 4,265WOMEN'S AND MISSES' OUTERWEAR ................ 3,051 3, 147 2,887 3, 717 2,638 3,796 3,894 3,502 4,423 3,920WOMEN'S ANC CHILDREN'S UNDERGARMENTS ........ 2,937 3,249 3,254 3,249 2,906 3,654 3,956 3,749 3,958 3,849CHILDREN'S OUTERWEAR .......................... 2,933 3, 131 2,712 3,749 1 ,449 3,640 3,762 3,506 4,062 3,874SAWMILLS AND PLANING MILLS ................... 3,792 3,214 3,096 3,571 6,342 5,495 4,699 4, 105 4,659 7, 399MILLWORK, PLYWOOD AND RELATED PRODUCTS ...... 4,956 5, 333 3,916 4,949 6,549 6,491 6,624 4,990 6,266 7,676HOUSEHOLD FURNITURE ........................... 4,109 4,214 4,014 4,512 4,285 5,052 5,458 4,606 5,801 6,346PULP AND PApER MILLS .......................... 8,077 7,880 8,129 8,024 8,977 8,613 8,360 8,657 8,620 9,424PAPERBOARD CONTAINERS AND BOXES ............. 5,676 5,249 5,361 5,868 7,222 6,670 6,289 6,224 6,999 7,977NEWSPAPERS ..................................... 5,760 7,071 4,902 5,349 6,156 7,842 8,583 6,862 7,782 8,687COMMERCIAL PRINTING ........................... 6,185 6,359 5,513 6,683 5,392 7,964 8, 166 6,999 8,346 8,444INDUSTRIAL CHEMICALS .......................... 9,054 8,999 9,077 9, 128 8,874 9,527 9,721 9, 398 9, 583 9,583PLASTICS MATERIALS AND SYNTHETICS .......... • 7,414 7,549 7,338 8, 111 4,999 7,969 8, 191 7,816 8,777 7,749DRUGS ........................................... 7,575 7,904 5,099 7,912 6,062 8,296 8,867 6,107 8,576 7, 166SOAP, CLEANERS, AND TOILET GOODS ............ 6,062 5,449 6,062 6, 716 6,062 7,864 7,410 7, 333 8,549 7,999PETROLEUM REFINING .......................... 9,705 9,749 9,573 10,381 9,365 10,161 10,230 9,954 10,597 9,680TIRES ANO INNER TUBES ............ ............ 8,438 7,949 7,730 9,062 8,874 9,062 8,392 8,318 9,637 9,374OTHER RUBBER PRODUCTS ......................... 5,434 5,445 4,368 6,118 6,374 6,539 6,595 5,249 7,043 8,083FOOTWEAR, EXCEPT RUBBER ...................... 3,533 3,539 3,506 3,896 3,149 4,304 4,281 4, 140 4,724 5,249GLASS AND GLASSWARE, PRESSED OR BLOWN ....... 5,940 5,916 6,083 5,843 5,833 6,972 7,499 6,769 6,671 7,799CONCRETE, GYPSUM, AND PLASTER PRODUCTS ...... 6,049 7,424 4,916 6,722 7,437 7,522 8,374 5,974 8,099 8,714BLAST FURNACE AND BASIC STEEL PRODUCTS ...... 8,483 8,424 8,507 8,472 8,803 9,067 8,907 9,006 9, 182 9,380IRON AND STEEL FOUNDRIES ..................... 6,821 6,649 5,724 7,235 6,049 7,568 7,374 6,455 8,013 7,599NCNFERROUS ROLLING AND DRAWING ............... 7,309 7, 169 6,349 7, 807 7,549 7,990 7,929 7,636 8,201 8,624CUTLERY, HAND TOOLS, AND HARDWARE ........... 5,798 5,870 4,611 6, 185 5,374 6,839 6,772 5,449 7,289 6,833FABRICATED STRUCTURAL METAL PRODUCTS ........ 6,425 7,078 5,597 6,614 7,411 7,664 7,951 6,624 7,805 8,874SCREW MACHINE PRODUCTS, BOLTS, ETC .......... 6,410 6,437 5,583 6,433 7,666 7,642 7,611 6, 187 7,683 9,321METAL STAMPINGS ................................ 6,788 6,412 4,499 7, 324 5,562 8,088 7,562 5,437 8,465 7,249ENGINES AND TURBINES .......................... 7,744 7,955 5,999 7,557 7,749 8,210 8,624 7,499 8, 146 7,949FARM MACHINERY ................................. 7,014 8,749 5,249 7, 299 5,499 8,036 9,499 6,208 8,225 6,749CONSTRUCTION AND RELATED MACHINERY .......... 7,760 7,562 6,952 8,011 7,549 8,201 7,970 7,532 8,519 8,531
Digitized for FRASER http://fraser.stlouisfed.org/ Federal Reserve Bank of St. Louis
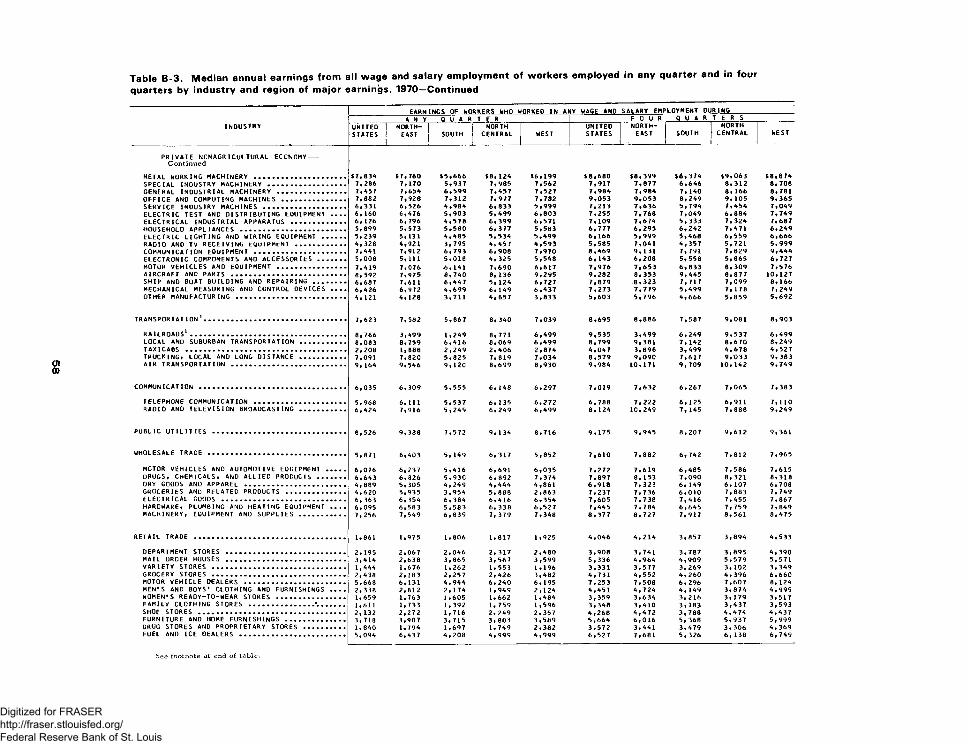
EARNINGS OF WORKERS WHO WORKED IN ANY WAGE AND SALARY EMPLOYMENT DURING
INDUSTRYA N Y Q U A R T E R F O U R Q U A R T E R S
UNITEDSTATES
NORTHEAST SOUTH
NORTHCENTRAL WEST
UNITEDSTATES
NORTHEAST SOUTH
NORTHCENTRAL WEST
PRIVATE NCNAGRICULTURAL ECCNCMY--Continued
METAL WORKING MACHINERY ....................... $7,834 $7,760 $5,666 $8,124 $6,199 $8,680 $8,399 $6,374 $9,063 $8,874SPECIAL INOUSTRY MACHINERY ................... 7,286 7,170 5,937 7,985 7,562 7,917 7,877 6,646 8,312 8,706GENERAL INDUSTRIAL MACHINERY ................. 7,457 7,654 6,599 7,457 7,527 7,984 7,984 7,140 8, 166 8,781OFFICE AND COMPUTING MACHINES ................ 7,882 7,928 7,312 7,977 7,782 9,053 9,053 8,249 9,105 9,365SERVICE INOUSTRY MACHINES .................... 6,331 6,526 4,984 6,833 5,999 7,213 7,636 5,794 7,454 7,049ELECTRIC TEST AND DISTRIBUTING EQUIPMENT .... 6, 160 6,476 5,903 5,499 6,803 7,255 7,768 7,049 6,884 7,749ELECTRICAL INDUSTRIAL APPARATUS ............. 6,126 6,796 4,578 6,399 6,571 7,109 7,674 5,333 7,324 7,687HOUSEHOLD APPLIANCES .......................... 5,899 5,573 5,580 6,377 5,583 6,777 6,295 6,242 7,471 6,249ELECTRIC LIGHTING AND WIRING EQUIPMENT ...... 5,239 5, 131 4,485 5,534 5,499 6,166 5,999 5,468 6,559 6,666RADIO AND TV RECEIVING EQUIPMENT ............ 4,328 4,921 3,795 4*457 4,593 5,585 7,041 4,357 5,721 5,999COMMUNICATION EQUIPMENT ....................... 7,441 7,912 6,793 6,908 7,970 8,469 9, 131 7,791 7,829 9,444ELECTRONIC COMPONENTS AND ACCESSORIES ....... 5,008 5,111 5,018 4, 325 5,548 6,143 6,208 5,558 5,865 6,727MOTOR VEHICLES AND EQUIPMENT ................. 7,419 7,076 A , 141 7,690 6,617 7,976 7,653 6,833 8,309 7,576AIRCRAFT AND PARTS ............................ 8,592 7,975 8,740 8, 136 9,295 9,282 8,353 9,445 8,877 10,127SHIP AND BOAT BUILDING AND REPAIRING ........ 6,687 7,611 6,447 5, 124 6,727 7,879 8,323 7,717 7,099 8,166MECHANICAL MEASURING AND CONTROL DEVICES .... 6,426 6,972 4,699 6, 149 6,437 7,273 7,779 5,499 7, 178 7,249OTHER MANUFACTURING ........................... 4, 121 4,128 3,711 4,657 3,833 5,603 5,796 4,666 5,859 5,692
TRANSPORTATION1................................... 7,623 7,582 5,867 8, 340 7,039 8,695 8,886 7,587 9,081 8,903
RAILROADS1....................... ............... 8,766 3,499 1,249 8,771 6,499 9,535 3,499 6,249 9,537 6,499LOCAL AND SUBURBAN TRANSPORTATION ........... 8,083 8,759 6,416 8,069 6,499 8,799 9,381 7, 142 8,670 8,249TAXICABS ........................................ 2,208 1,888 2,249 2,406 2,874 4,047 3,896 3,499 4,678 4,527TRUCKING* LOCAL AND LONG DISTANCE ........... 7,091 7,820 5,825 7,819 7*034 8,579 9,090 7,617 9,033 9,383AIR TRANSPORTATION ............................ 9, 164 9,546 9,120 8,699 8,930 9,984 10,171 9,709 10,142 9,749
COMMUNICATION .................................... 6,035 6,309 5,555 6, 148 6,297 7,019 7,632 6,267 7,065 7,383
TELEPHONE COMMUNICATION ....................... 5,968 6,111 5,537 6, 135 6,272 6,788 7,222 6, 125 6,911 7,110RADIO AND TELEVISION BROADCASTING ........... 6,424 7,916 5,249 6,249 6,499 8,124 10,249 7, 145 7,888 9,249
PUBLIC UTILITIES ................................. 8,526 9,388 7,572 9,134 8,716 9,175 9,945 8,207 9,612 9,361
WHOLESALE TRACE .................................. 5,871 6,403 5, 149 6,317 5,852 7,610 7,882 6,742 7,812 7,965
MOTOR VEHICLES AND AUTOMOTIVE EQUIPMENT ..... 6,076 6,237 5,416 6,691 6,035 7,272 7,619 6,485 7,586 7,615DRUGS, CHEMICALS, AND ALLIED PRODUCTS ....... 6,643 6,826 5,930 6,892 7,374 7,897 8,153 7,090 8, 321 8,318DRY GOODS AND APPAREL ......................... 4,889 5,305 4,249 4,444 4,861 6,918 7,323 6, 149 6, 107 6,708GROCERIES AND RELATED PRODUCTS ............... 4,620 5,935 3,954 5, 888 2,863 7,237 7,736 6,010 7,883 7,749ELECTRICAL GOODS ............................... 6, 363 6,354 6,384 6,416 6,354 7,605 7,738 7,416 7,455 7,867HARDWARE, PLUMBING AND HEATING EQUIPMENT .... 6,095 6,583 5,583 6,338 6,527 7,445 7,784 6,645 7,759 7,849MACHINERY, EQUIPMENT AND SUPPLIES ........... 7,256 7,549 6,839 7, 379 7,348 8,377 8,727 7,917 8,561 8,475
RETAIL TRADE ..................................... 1,861 1,975 1,806 1,817 1,925 4,046 4,214 3,857 3,894 4,533
DEPARTMENT STORES .............................. 2,195 2,067 2,046 2,317 2,480 3,908 3,741 3,787 3,895 4,390MAIL ORDER HOUSES .............................. 3,414 2,638 3,865 3,567 3,599 5,336 4,964 4,909 5,579 5,571VARIETY STORES ................................. 1,444 1,676 1,262 1,553 1,196 3,331 3,577 3,269 3, 102 3,349GROCERY STORES ................................. 2,438 2,183 2,257 2,426 3,482 4,731 4,552 4,260 4,396 6,660MOTOR VEHICLE DEALERS ......................... 5,668 6,131 4,944 6,240 6,195 7,253 7,508 6,296 7,607 8,124MEN'S ANO BOYS' CLOTHING AND FURNISHINGS .... 2,338 2,812 2,174 1,949 2,124 4,451 4,724 4, 149 3,874 4,999WOMEN'S READY-TO-WEAR STORES ................. 1,659 1,763 1,605 1,662 1,484 3,359 3,634 3,216 3, 179 3,517FAMILY CLOTHING STORES ............... ........ 1,611 1,733 1,392 1, 759 1,596 3,348 3,410 3,183 3,437 3,593SHOE STORES .................................... 2,132 2,272 1,716 2,249 2,357 4,268 4,472 3,788 4,474 4,437FURNITURE AND HOME FURNISHINGS ............... 3,718 3,907 3,715 3,803 3,589 5,664 6,016 5,368 5,937 5,999DRUG STORES AND PROPRIETARY STORES .......... 1,840 1,794 1,697 1,749 2,382 3,572 3,441 3,479 3,306 4,369FUEL AND ICE DEALERS .......................... 5,094 6,437 4,208 4,999 4,999 6,527 7,681 5,326 6, 138 6,749
Digitized for FRASER http://fraser.stlouisfed.org/ Federal Reserve Bank of St. Louis
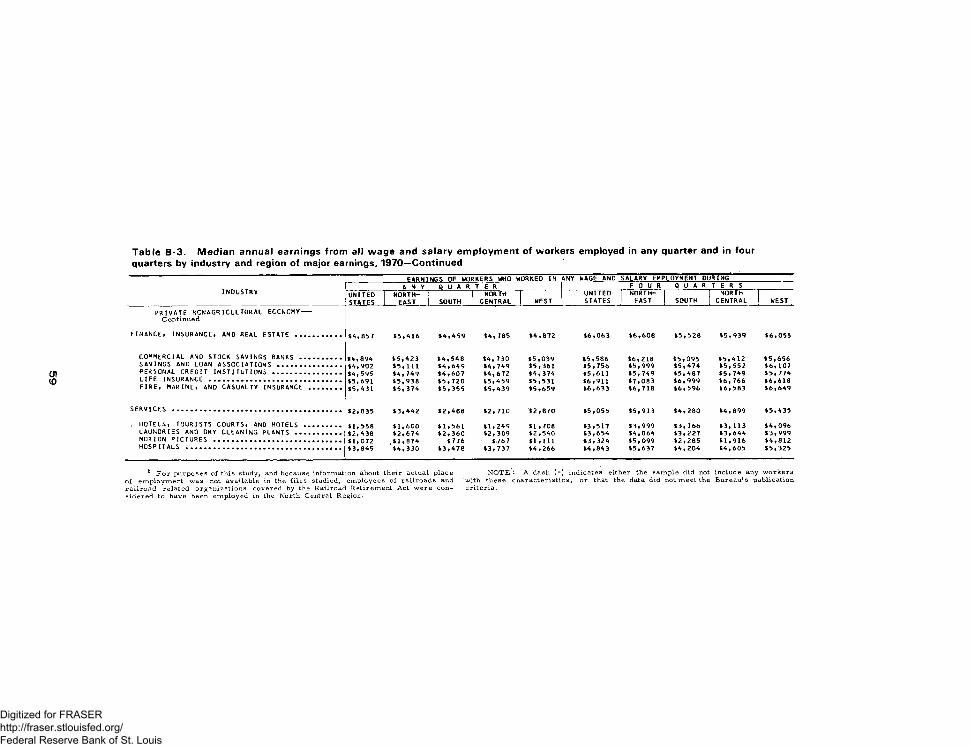
INDUSTRY
EARNINGS OF WORKERS WHO WORKED IN ANY WAGE AND SALARY EMPLOYMENT DURINGA N Y Q U A R T E R F O U R Q U A R T E R S
UNITEDSTATES
NORTHEAST SOUTH
NORTHCENTRAL WEST
UNITEDSTATES
NORTHEAST s o u t h
NORTHCENTRAL WEST
PRIVATE NCNAGR ICULTURAL ECCNCMY--Continued
FINANCE, INSURANCE, AND REAL ESTATE ........... $4,857 $5,416 $4,459 $4,785 $4,872 $6,063 $6,608 $5,528 $5,939 $6,055
COMMERCIAL AND STOCK SAVINGS BANKS .......... $4,894 $5,423 $4,548 $4,730 $5,039 $5,586 $6,218 $5,095 $5,412 $5,656SAVINGS AND LOAN ASSOCIATIONS ................ *4,902 $5,111 $4,649 $4,749 $5,361 $5,756 $5,999 $5,474 $5,552 $6,107PERSONAL CREDIT INSTITUTIONS ................. $4,595 $4,749 $4,607 $4,672 $4,374 $5,611 $5,749 $5,487 $5,749 $5,774LIFE INSURANCE ................................. *5,691 $5,938 $5,720 $5,459 $5,531 $6,911 $7,083 $6,999 $6,766 $6,618FIRE, MARINE, AND CASUALTY INSURANCE ........ $5,431 $5,374 $5,355 $5,439 $5,659 $6,633 $6,718 $6,596 $6,583 $6,649
SERVICES .......................................... $2,835 $3,442 $2,488 $2,710 $2,870 $5,055 $5,913 $4,280 $4,899 $5,435
, HOTELS, TOURISTS COURTS, AND MOTELS ......... $1,558 $1,600 $1,561 $1,249 $1,708 $3,517 $3,999 $3,166 $3,113 $4,096LAUNORIES AND DRY CLEANING PLANTS ........... *2,438 $2,674 $2,360 $2,309 $2,540 $3,654 $4,064 $3,227 $3,644 $3,999MOTION PICTURES ................................ *1,072 ,$1,874 $776 - $767 $1,111 $3,324 $5,099 $2,285 $1,916 $4,812HOSPITALS ................................... . $3,845 $4,330 $3,478 $3,737 $4,266 $4,843 $5,637 $4,204 $4,605 $5,325
1 F o r purposes of this study, and because information about their actual place N O TE : A dash ( “ ) indicates either the sam ple did not include any w orkersof employment was not availab le in the files studied, employees of ra ilro ad s and ‘with these characteristics, or that the data did not meet the B ureau 's publication ra ilro ad re lated organizations covered by the R ailroad Retirement Act w ere con- crite ria , sidered to have been employed in the North Central Region.
Digitized for FRASER http://fraser.stlouisfed.org/ Federal Reserve Bank of St. Louis
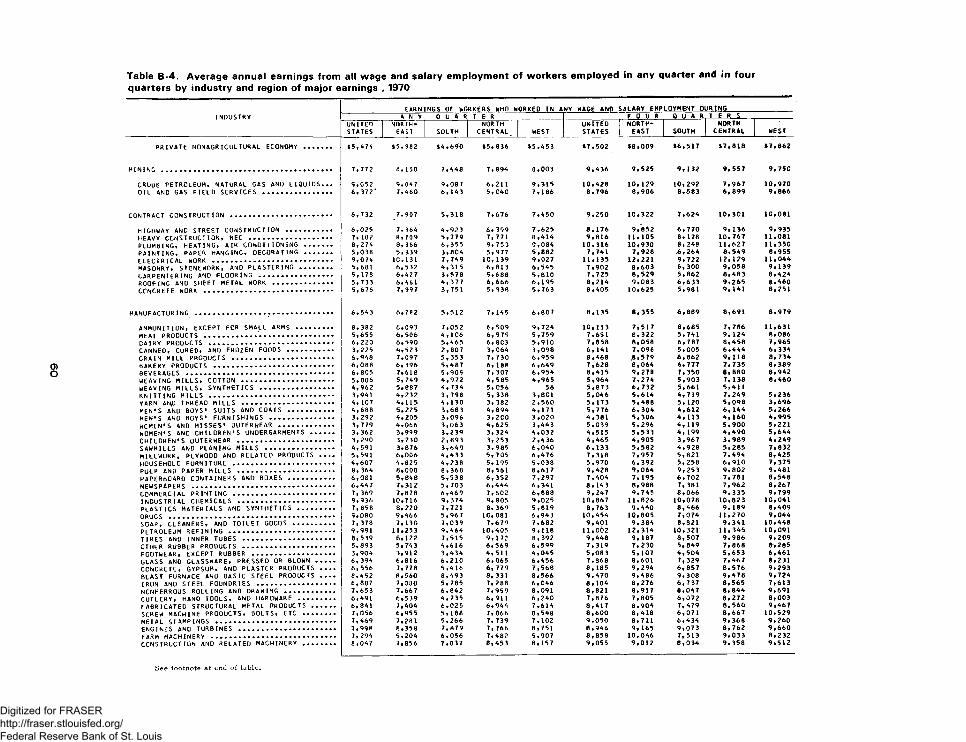
INDUSTRYEARNINGS OF WORKERS WHO WORKED IN ANY WAGE AND SALARY EMPLOYMENT DURING
A N Y Q U A R T E R F O U R Q U A R T E R SUNITEDSTATES
NORTHEAST SCLTH
NORTHCENTRAL^ WEST
UNITEDSTATES
NORTHEAST SOUTH
NORTHCENTRAL WEST
PRIVATE NONAGRICULTURAL ECONOMY ....... $5,474 $5,982 $4,690 $5,836 $5,453 $7,502 $8,009 $6,517 $7,818 $7,862
MINING .......................................... 7,772 8, 150 7,448 7,894 8,003 9,436 9,525 9, 132 9,557 9, 75C
c r u d e p e t r o l e u m , n a t u r a l g a s a n d l i q u i d s ... 9,052 9,047 9,087 6,211 9,315 10,428 10,129 10,292 7,967 10,970OIL AND GAS FIELD SERVICES ................. 6,377* 7,460 6, 143 5,040 7,186 8,796 8,906 8,583 6,899 9,866
CONTRACT CONSTRUCTION ......................... 6,732 7,907 5,318 7,676 7,450 9,250 10,322 7,624 10,301 10,081
HIGHWAY AND STREET CONSTRUCTION ........... 6,025 7, 364 4,923 6, 399 7,625 8,176 9,852 6,770 9,136 9,935HEAVY CONSTRUCTION, NEC .................... 7, 182 8,709 5,779 7, 771 8,414 9,816 11.105 8, 178 10,767 11,081PLUMBING, HEATING, AIK CUNUllIuNING ....... 8,274 S, 866 6,355 9, 753 9,084 10,316 10,930 8,248 11,627 11,350PAINTING, PAPER HANG ING, DECORAT ING ....... 5,038 5, 339 3,804 5,977 5,882 7,741 7,928 .6,264 8,549 8,955ELECTRICAL WORK ............................. 9,074 10,131 7,749 10,139 9,027 11,135 12,221 9,722 12,129 11,044MASONRY, STONEWORK, AND PLASTERING ........ 5,681 6,532 4,315 6,813 6,545 7,902 8,603 6,300 9,058 9,139CARPENTERING AND FLOORING .................. 5,178 6,427 3,578 5,688 5,810 7,725 8,529 5,862 8,483 8,424ROOFING AND SHEET METAL WORK ............... 5,733 6,461 4,377 6,666 6,195 8,214 9,083 6,633 9,265 8,460CONCRETE W O R K ................................ 5,676 7,997 3,751 5,938 5,763 8,405 10,625 5,981 9, 141 8,251
MANUFACTURING ................. ................ 6,543 6,782 5,512 7, 145 6,807 8,135 8, 355 6,889 8,691 8,979
AMMUNITION, EXCEPT FOR SMALL ARMS ......... 8,382 6,093 7,052 6,509 9,724 10,113 7,517 8,685 7,786 11,631MEAT PRODUCTS .............'.................. 5,655 6,506 4,106 6,979 5,759 7,651 8,322 5,741 9, 124 8,086DAIRY PRODUCTS ............................... 6, 220 6,590 5,465 6, 8C3 5,910 7,858 8,058 6,787 8,458 7,965CANNED, CURED, AND FROZEN FOODS ........... 3,225 4,523 2,807 3,064 3,098 6,141 7,096 5,005 6,444 6,334GRAIN MILL PRODUCTS ......................... 6,948 7,097 5,353 7, 730 6,959 8,466 jB, 579 6,862 9,118 8, 734BAKERY PRODUCTS .............................. 6,088 6,396 5,487 6,188 6,649 7,628 8,064 6,777 7,735 8,389
6,805 7,618 5,909 7, 307 6,954 8,415 9,278 7, 350 8,880 8,942WEAVING MILLS, COTTON ....................... 5,006 5,749 4,972 4,585 4,965 5,964 7,274 5,903 7,138 8,460WEAVING MILLS, SYNTHETICS .................. 4,962 5,887 4,734 5,056 56 5,873 6,732 5,661 5,411KNITTING MILLS ............................... 3,941 4,232 3,798 5, 338 3,801 5,046 5,614 4,719 7,249 5,236YARN ANJD THREAD MILLS ....................... 4, 107 4,115 4,130 3, 382 2,560 5,173 5,488 5, 120 5,098 3,696MEN'S AND BOYS' SUITS AND COATS ........... 4,688 5,225 3,683 4, 894 4,171 5,776 6,304 4,612 6, 144 5,266MEN'S ANO BOYS' FURNISHINGS .............. 3,292 4,205 3,096 3,2C0 3,020 4,381 5,306 4,113 4,160 4,995WOMEN'S AND MISSES' OUTERWEAR .............. 3,779 4,066 3,063 4,625 3,443 5,039 5,296 4,119 5,900 5,221WOMEN'S AND CHILDREN'S UNDERGARMENTS ...... 3, 362 3,999 3,239 3,324 4,032 4,515 5,533 4, 199 4,490 5,644CHILDREN'S OUTERWEAR ........................ 3,290 3,730 2,893 3,253 2,436 4,465 4,905 3,967 3,989 4,249SAWMILLS AND PLANING MILLS ................. 4,591 3,876 3,649 3,985 6,040 6,133 5,582 4,928 5,285 7,832MILLWORK, PLYWOOD AND RELATED PRODUCTS .... 5,591 6,006 4,433 5, 705 6,476 7,318 7,957 5,821 7,494 8,425h o u s e h o l d f u r n i t u r e ......................... 4,607 4,825 4,238 5, 195 5,038 5,970 6,392 5,258 6,910 7,375PULP AND PAPER MILLS ........................ 8,364 8,008 8,368 8,561 8,617 9,428 9,064 9,253 9,802 9,481PAPERBOARD CONTAINERS AND BOXES ........... 6,081 5,848 5,538 6,352 7,297 7,404 7, 195 6,702 7,781 8,548n e w s p a p e r s ................................... 6,447 7,312 5,703 6,444 6,341 8,14 3 8,988 7, 381 7,962 8,267COMMERCIAL PRINTING ......................... 7, 369 7,878 6,469 7,602 6,888 9,247 9,745 8,066 9,335 9,799INDUSTRIAL CHEMICALS ........................ 9,936 10,716 9,374 9, 805 9,025 10,867 11,826 10,078 10,823 10,041PLASTICS MATERIALS ANO SYNTHETICS ......... 7,858 8,220 7,721 8, 369 5,819 8,763 9,440 8,466 9, 189 8,409
9,080 9,466 5,967 1C,081 6,943 10,454 10,805 7,074 11,270 9,044SOAP, CLEANERS, AND TOILET GOODS .......... 7, 378 7,130 7,039 7,679 7,682 9,401 9,384 8,821 9,341 10,448PETROLEUM REFINING ........................... 9,991 11,253 9,464 10,405 9,118 11,002 12,314 10,321 11,345 10,091TIRES AND INNER TUBES ....................... 8,539 8,122 7,515 9,172 8,392 9,448 9, 187 8,507 9,986 9,209OTHER RUBBER PRODUCTS ....................... 5,893 5,743 4,616 6,569 6,599 7,319 7,230 5, 849 7,868 8>285FGOTWEAR, EXCEPT RUBBER .................... 3,904 3,912 3,434 4,511 4,045 5,083 5,107 4,504 5,653 6,461GLASS AND GLASSWARE, PRESSED OR BLOWN .... 6,394 6,816 6,210 6,065 6,456 7,868 8,601 7,329 7,467 8,231CONCRETE, GYPSUM, AND PLASTER PRODUCTS .... 6,556 7,778 5,416 6, 779 7,568 8,185 9,294 6,857 8,576 9,293BLAST FURNACE AND BASIC STEEL PRODUCTS .... 8,452 8,560 8,493 8, 331 8,566 9,470 9,486 9,308 9,478 9,724IRON AND STEEL FOUNDRIES ................... 6,887 7,080 5,785 7,288 6,046 8,104 8,276 6,737 8,565 7,613NCNFERROUS ROLLING AND DRAWING ............ 7,653 7,667 6,842 7,959 8,091 8,821 8,917 8,047 8,844 9,691CUTLERY, HAND TOOLS, AND HARDWARE ......... 6,491 6,539 4,735 6, 911 6,240 7,876 7,805 6,072 8,272 8,003FABRICATED STRUCTURAL METAL PRODUCTS ...... 6,841 7,404 6,025 6,944 7,614 8,417 8,904 7,479 8,560 9,467SCREW MACHINE PRODUCTS, BOLTS, ETC ........ 7,056 6,955 5,188 7,066 8,548 8,600 8,418 6,071 8,667 10,529METAL STAMPINGS .............................. 7,469 7,281 5,266 7, 739 7,102 9,050 8,711 6,434 9, 368 9,260ENGINES AND TURBINES ........................ 7,998 8,358 7,879 7,766 8,751 8,946 9, 165 9,073 8, 762 9,660FARM MACHINERY ............................... 7, 294 9,204 6,056 7,482 5,907 8,858 10,046 7,513 9,033 8,232CONSTRUCTION AND RELATED MACHINERY ........ 8,047 7,856 7,037 8,453 8,157 9,055 9,012 8,034 9,358 9,512
Digitized for FRASER http://fraser.stlouisfed.org/ Federal Reserve Bank of St. Louis
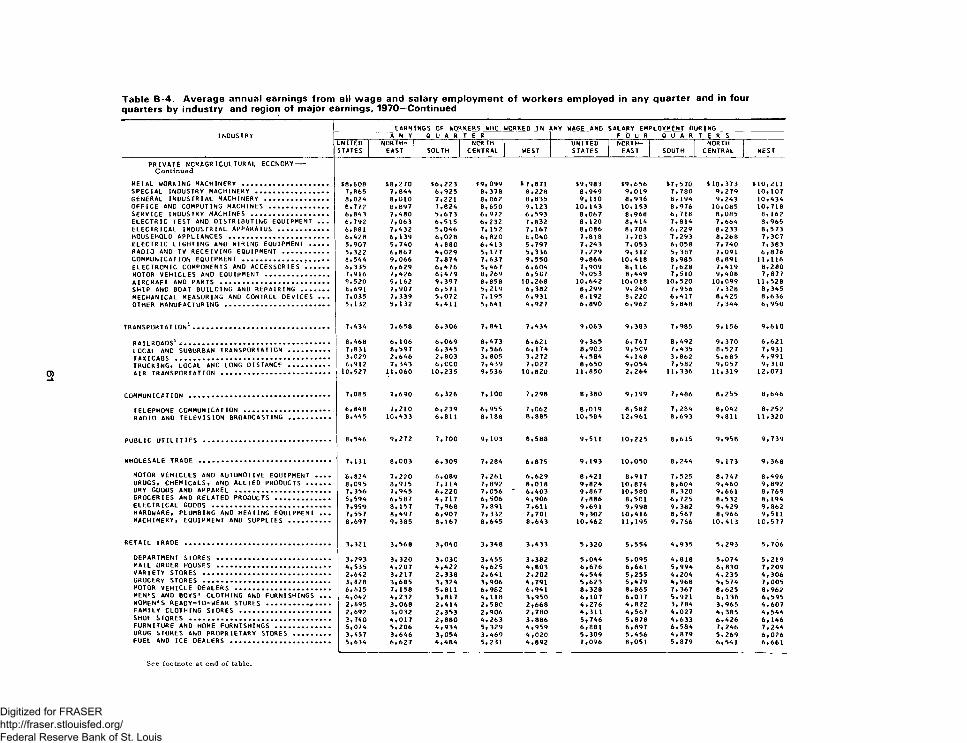
EARNINGS OF WORKERS WHO WORKED IN ANY WAGE AND SALARY EMPLOYMENT DURINGINDUSTRY A N Y Q U A R T E R F O U R Q U A R T E R S
UNITEDSTATES
NORTHEAST SOUTH
NCR TH CENTRAL WEST
UNITEDSTATES
NORTHEAST SOUTH
NORTHCENTRAL WEST
p r i v a t e n c n a g r ic u l t u r a l e c o n o m y —Continued
METAL WORKING MACHINERY ..................... $8,608 $8,270 $6,223 $9,099 $ 7,871 $9,983 $9,656 $7,570 $10,373 $10,211SPECIAL INDUSTRY MACHINERY .................. 7, B65 7,844 6,925 8,378 8,228 8,949 9,019 7,780 9,279 10,107GENERAL INDUSTRIAL MACHINERY ................ 8*024 8,010 7,221 8,062 8,835 9,110 8,936 8,194 9,243 10,434OFFICE AND COMPUTING MACHINES .............. 8,772 8,897 7,824 8,650 9,123 10,143 10,153 8,976 10,085 10,718SERVICE INDUSTRY MACHINES ................... 6,843 7.480 5,673 6,972 6,593 8,067 8,968 6,718 8,085 8, 162ELECTRIC TEST AND DISTRIBUTING EQUIPMENT ... 6,792 7*063 6,515 6,232 7,832 8,120 8,414 7,814 7,664 8,965ELECTRICAL INDUSTRIAL APPARATUS ............ 6,881 7,432 5,046 7, 152 7,167 8,086 8,708 6,229 8.233 8,573HOUSEHOLD APPLIANCES ......................... 6,428 6, 139 6,028 6,820 6,040 7,818 7,703 7,293 8,268 7,3C7ELECTRIC LIGHTING AND WIRING EQUIPMENT ..... 5,907 5,740 4,880 6,413 5,797 7,243 7,053 6,058 7,740 7,383RADIO AND TV RECEIVING EQUIPMENT ........... 5,322 6,867 4,029 5, 177 5,336 7,229 9,312 5, 387 7,091 6,876COMMUNICATION EQUIPMENT ..................... 8,544 9,066 7,874 7,637 9,550 9,866 10,418 8,985 8,891 11,116ELECTRONIC COMPONENTS AND ACCESSORIES ...... 6,335 6,629 6,476 5,467 6,604 7,909 8,116 7,628 7,419 8,280MOTOR VEHICLES AND EQUIPMENT ................ 7,916 7,426 6 j 479 8,269 6,507 9,053 8,449 7,510 9,408 7,877AIRCRAFT AND PARTS ........................... 9,520 9,162 9,397 8,858 10,268 10,642 10,018 10,520 10,099 11,528SHIP AND BOAT BUILDING AND REPAIRING ....... 6,691 7,907 6,571 5,219 6,382 8,299 9,240 7.956 7,328 8,345MECHANICAL MEASURING AND CONTROL DEVICES ... 7,035 7, 339 5,072 7, 195 6,931 8,192 8,220 6,417 8,425 8,636OTHER MANUFACTURING .......................... 5,132 5,132 4,411 5,641 4,927 6,890 6,962 5,848 7,344 6,950
TRANSPORTATION1.................................. 7,434 7,658 6,306 7,841 7,434 9,063 9,383 7,985 9, 156 9,610
RAILROADS1 ...................................... 8,468 6, 106 6,069 8,473 6,621 9,365 6,767 8,492 9, 370 6,621LOCAL AND SUBURBAN TRANSPORTATION .......... 7,831 8,597 6,345 7,566 6,174 8,903 9,5C9 7,435 8,527 7,931
3,029 2,646 2,803 3, 805 3,272 4,584 4,148 3,862 5,685 4,991TRUCKING* LOCAL ANO LONG DISTANCE .......... 6,912 7,343 6, CCO 7,439 7,027 8,650 9,054 7,582 9,057 9,310AIR TRANSPORTATION ........................... 10,527 11,060 10,235 9,536 10,820 11,850 2,264 11,336 11,319 12,071
COMMUNICATION ................................... 7,085 7,690 6,326 7,100 7,298 8,380 9,199 7,486 8,255 8,646
TELEPHONE COMMUNICATION ..................... 6,848 7,210 6,239 6,955 7,062 8,019 8,582 7, 284 8,042 8,252RADIO AND TELEVISION BROADCASTING .......... 8,445 10,433 6,811 8,188 8,885 10,584 12,961 8,693 9,811 11,320
PUBLIC UTILITIES ................................ 8,546 9,272 7,700 9, 103 8,588 9,511 10,225 8,615 9,958 9,739
WHOLESALE TRADE ................................. 7,131 8,003 6,309 7,284 6,875 9,193 10,050 8,244 9, 173 9,368
MOTOR VEHICLES AND AUTOMOTIVE EQUIPMENT .... 6,824 7,220 6,089 7,261 6,629 8,421 8,917 7,525 8,747 8.496ORUGS, CHEMICALS, AND ALLIED PRODUCTS ...... 8,095 8,915 7,114 7,892 8,018 9,824 10,874 8,604 9,460 9,892DRY GOODS AND APPAREL ....................... 7,356 7,945 6,220 7,056 ' 6,403 9,867 10,580 8,320 9,661 8,769GROCERIES AND RELATED PRODUCTS ............. 5,594 6,587 4,717 6,506 4,906 7,886 8,501 6,725 8,532 8, 194ELECTRICAL GOODS ............................. 7,959 8, 157 7,968 7,891 7,611 9,691 9,998 9,382 9,429 9,862HAROWARE, PLUMBING AND HEATING EQUIPMENT ... 7,557 8,497 6,907 7,332 7,701 9,302 10,416 8,567 8,966 9,511MACHINERY, EQUIPMENT AND SUPPLIES .......... 8,697 9,385 8,167 8,645 8,643 10,462 11,195 9,766 10,413 10,577
RETAIL TRADE .................................... 3,321 3,568 3,040 3,348 3,433 5,320 5,554 4,935 5,293 5,706
DEPARTMENT STORES .......................... 3,293 3,320 3,03C 3,455 3,382 5,044 5,095 4,818 5,074 5,219MAIL ORDER HOUSES ............................ 4,535 4,207 4,422 4,625 4,803 6,676 6,661 5,994 6,830 7,209VARIETY STORES ................................ 2,642 3,217 2,338 2,641 2,202 4,544 5,255 4,204 4,235 4,306GROCERY STORES ................................ 3,828 3,685 3,324 3,906 4,791 5,623 5,479 4,968 5,574 7,005MOTOR VEHICLE DEALERS ....................... 6,615 7, 158 5,811 6,982 6,941 8,328 8,665 7,367 8,625 8,962MEN'S AND BOYS' CLOTHING ANO FURNISHINGS ... 4,042 4,232 3,817 4,118 3,950 6,107 6,077 5,921 6,138 6,595WOMEN'S READY-TO-WEAR STORES .......... . 2,695 3,068 2,414 2,580 2,668 4,276 4,822 3,784 3,965 4,607FAMILY CLOTHING STORES ...................... 2,692 3,032 2,353 2,906 2,780 4,311 4,567 4,027 4,385 4,544SHOE STORES ................................... 3,740 4,017 2,880 4,263 3,886 5,746 5,878 4,633 6,426 6,146FURNITURE AND HOME FURNISHINGS ............. 5,074 5,206 4,934 5, 329 4,959 6,881 6,897 6,584 7,246 7,244DRUG STORES ANO PROPRIETARY STORES ......... 3,457 3,646 3,054 3,469 4,020 5,309 5,456 4,879 5,269 6,026FUEL AND ICE DEALERS ......................... 5,634 6,627 4,464 5,231 4,892 7,096 8,051 5,879 6,541 6,661
See footnote at end of table.
Digitized for FRASER http://fraser.stlouisfed.org/ Federal Reserve Bank of St. Louis
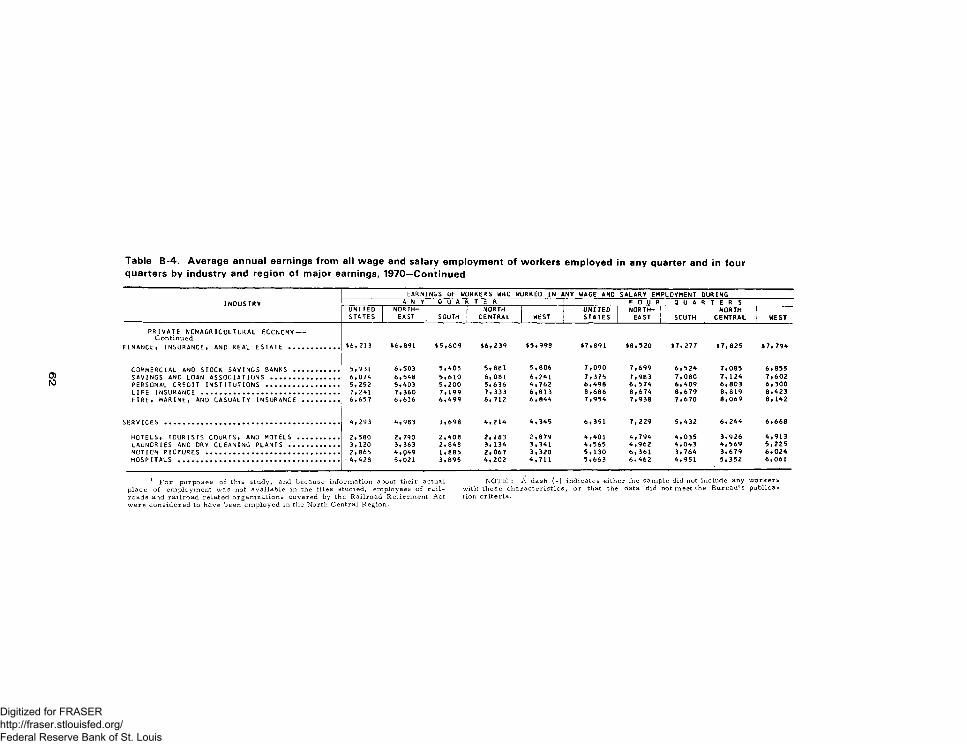
EARNINGS OF WORKERS WHO WORKED IN ANY WAGE ANO SALARY EMPLOYMENT DURINGINDUSTRY A N Y Q U A fI T E R F O U R Q U A R T E R S
UNITEDSTATES
NORTHEAST SOUTH
NORTHCENTRAL WEST
UNITEDSTATES
NORTHEAST SOUTH
NORTHCENTRAL WEST
PRIVATE NCNAGRICULTURAL ECONOMY--Continued
FINANCE, INSURANCE, AND REAL ESTATE ............ $6,213 $6,891 $5,609 $6,239 $5,998 $7,891 $8,520 $7,277 $7,825 $7,794
COMMERCIAL AND STOCK SAVINGS BANKS ........... 5,931 6,503 5,405 5,881 5,806 7,090 7,699 6,524 7,085 6,855SAVINGS AND LOAN ASSOCIATIONS ................. 6 , < m 6,548 5,610 6,081 6,241 7,375 7,983 7,080 7, 124 7,602PERSONAL CREDIT INSTITUTIONS .................. 5,252 5,403 5,200 5,636 4,762 6,498 6,574 6,409 6,803 6,300LIFE INSURANCE .................................. 7,241 7,360 7,199 7,333 6,813 8,686 8,674 8,679 8,819 8,423FIRE, MARINE, AND CASUALTY INSURANCE ......... 6,657 6,616 6,499 6, 712 6,844 7,954 7,938 7,670 8,069 8,142
SERVICES ............................................ 4,293 4,983 3,698 4,214 4,345 6,351 7,229 5,432 6,244 6,668
HOTELS, TOURISTS COURTS, AND MOTELS .......... 2,580 2,790 2,408 2, 183 2,879 4,401 4,794 4,035 3,926 4,913LAUNDRIES AND DRY CLEANING PLANTS ............ 3,120 3,363 2,848 3, 134 3,341 4,565 4,962 4,043 4,569 5,225MOTION PICTURES ................................. 2,865 4,949 1,885 2,067 3,320 5,130 6,361 3,764 3,679 6,024HOSPITALS ........................................ • 4,428 5,021 3,895 4,202 4,711 5,663 6.462 4,951 5,352 6,061
1 F o r purposes of this study, and because information about their actual N O TE : A dash ( - ) indicates either the sam ple did not include any w orkersplace of employment was not ava ilab le in the files studied, employees of ra i l - with these characteristic s, or that the data did not meet the B ureau 's publica-roads and ra ilro ad re lated organizations covered by the Railroad Retirement Act tion c rite ria ,w ere considered to have been em ployed in the North Central Region.
Digitized for FRASER http://fraser.stlouisfed.org/ Federal Reserve Bank of St. Louis
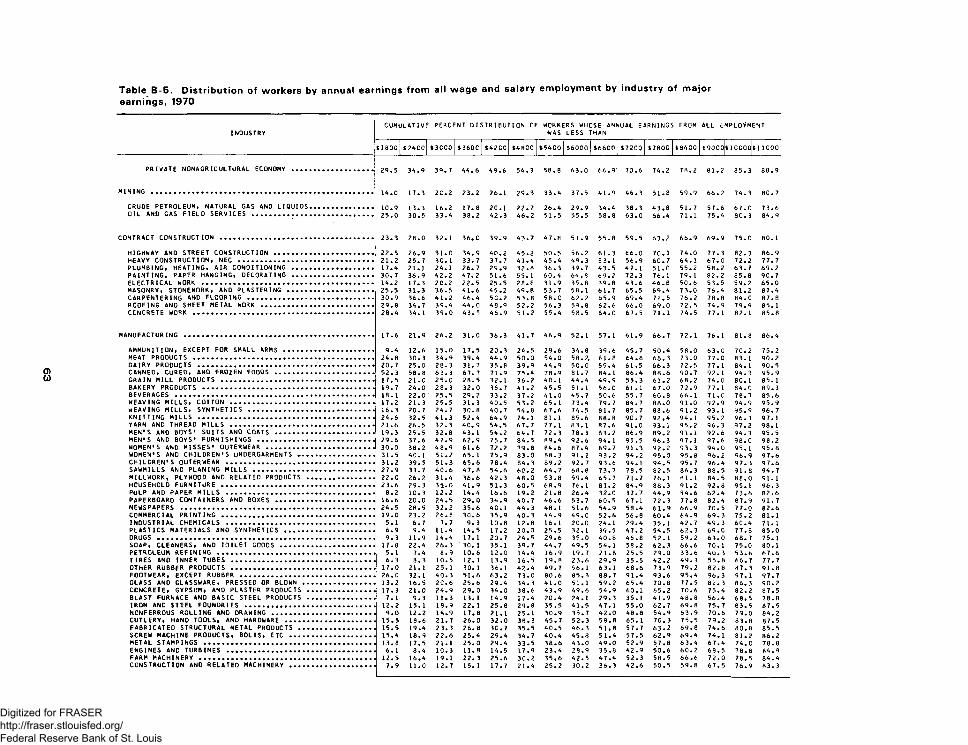
INDUSTRYCUMULATIVE PERCENT DISTRIBUTION CF WORKERS WHOSE ANNUAL EARNINGS FROM
-WAS LESS THANALL EMPLOYMENT
$1800 $2400 $3000 $3600 $4200 $4800 $5400 $6000|$6600 $7200 $7800 $8400 $900a$10C00 $11000
PRIVATE NONAGRICULTURAL ECONOMY ... .... •• - - - 29.5 34.9 39.7 44.6 49.6 54.3 58.8 63.0 66.9 70.6 74.2 78.2 81.2 85.3 88.9
M I N I N G ..................................... 14.0 17.3 2C.2 23.2 26.1 29.3 33.4 37.5 41.9 46.3 51.8 59.9 66.2 74.3 80.7
CRUDE PETROLEUM, NATURAL GAS AND LIQUIDS... . . .... . . . 10.9 13.3 16.2 17. 8 20.1 22.7 26.4 29.9 34.4 38.3 43.8 51.7 57.6 67.0 73.6OIL AND GAS FIELD SERVICES ............ . ... •• ... ... ** ** 25.0 30.5 33.4 38.2 42.3 46.2 51.5 55.5 58.8 63.0 66.4 71.1 75.4 80.3 84.9
CONTRACT CONSTRUCTION.................... 23.3 28.0 32.1 36.0 39.9 43.7 47.8 51.9 55.8 59.5 63.2 66.9 69.9 75.0 80. 1
HIGHWAY AND STREET CONSTRUCTION ....... . . .. . . •... . . . 22.5 26.9 31.0 34.9 40.2 45.2 50.5 56.2 61.3 66.0 70.1 74.0 77.3 82.3 86.9HEAVY CONSTRUCTION, NEC ................ .... . . ... . . . 21.2 25.7 3C. 1 33.7 37.7 41.4 45.4 49.3 53.1 56.9 60.7 64. 1 67.0 72.2 77.7PLUMBING, HEATING, AIR CONDITIONING ... . . . • . . ... . . 17.4 21.1 24.1 26. 7 29.9 32.8 36.3 39.7 43.5 47.1 51.0 55.2 58.2 63.7 69.2PAINTING, PAPER HANGING, DECORATING ... . . .. .... .. • . 30.7 36.9 42.2 47.2 51.6 55.1 60.4 64.8 69.2 72.3 76.1 79.1 82.2 85.8 90. 7e l e c t r i c a l WORK ......................... 14.2 17.3 20.2 22.5 25.5 28.8 31.9 35.8 39.8 43.6 46.8 50.6 53.5 59.2 65.0MASONRY, STONEWORK, AND PLASTERING .... . . .. .... .. . .. . 25.5 31.3 36.5 41.6 45.2 49.8 53.7 58.1 61.7 65.5 69.4 73.0 76.4 81.2 87.4CARPENTERING AND FLOORING ............. . ... . •.. . . 30.9 36.6 41.2 46.4 50.2 53.8 58.0 62.2 65.9 69.4 72.5 76.2 78.8 84.0 87.8ROOFING AND SHEET METAL WORK .......... . ... .... .. . . 29.8 34.7 39.4 44. 0 48.9 52.2 56.3 59.8 62.6 66.0 69.0 72.5 74.9 79.9 85. 1CONCRETE WORK ................... ....... 28.4 34. 1 39.0 43. 5 46.9 51.2 55.4 58.5 64.0 67.5 71.1 74.5 77.1 82.1 85.8
MANUFACTURING ........................... . 17.6 21.9 26.2 31.0 36.3 41.7 46.9 52. 1 57.1 61.9 66.7 72.1 76.1 81.8 86.4
AMMUNITION, EXCEPT FOR SMALL ARMS .... . ... .. ... ...... . . 9.4 12.6 15.0 17.5 20.3 24.5 29.6 34.8 39.6 45.7 50.4 58.0 63.0 70.2 75.2MEAT PRODUCTS ........................... 24.8 30.3 34.9 39.4 44.9 50.0 54.0 58.2, 61.8 64.8 68.3 73.0 77.0 83.1 90.2DAIRY PRODUCTS .......................... 20.7 25.0 28.3 31.7 35.8 39.9 44.9 50.0 55.4 61.5 66.3 72.5 77. 1 84. 1 90.5c a n n e d , c u r e d , a n d f r o z e n f o o d s ....... . . .. . .. . . . . .. . 52.3 58.8 63.3 67. 7 71.9 75.4 78.9 81.7 84.1 86.4 88.6 90.7 92.1 94.3 95.9GRAIN MILL PRODUCTS .................... 17.5 21.C 25.0 28.5 32.1 36.2 40.1 44.4 49.9 55.3 61.2 68.2 74.0 80. 1 85.1BAKERY PRODUCTS ......................... 19.7 24.0 28.3 32.0 36.7 41.2 45.5 51.1 56.0 61.1 67.0 72.9 77.1 84.C 89.3BEVERAGES ................................ 18.1 22.0 25.5 29. 2 33.2 37.2 . 41.0 45.7 50.6 55.7 60.8 66.1 71.0 78.7 85.6WEAVING MILLS, COTTON .................. 17.2 21.3 25.5 31.3 40.5 53.2 65.1 73.4 79.7 84.7 88.0 91.0 92.9 94.9 95.9WEAVING MILLS, SYNTHETICS ............. . ... . .. • •.. .. .. . 16.3 20.7 24.7 30. 8 40.7 54.8 67.6 74.5 81.7 85.7 88.6 91.2 93. 1 95.9 96.7KNITTING MILLS .......................... 24.6 32.5 41.3 52.4 64.9 74.1 81.1 85.6 88.8 90.7 92.4 94.1 95.2 96.3 97.1YARN AND THREAD MILLS .................. 21.6 26.5 32.3 40. 9 54.5 67.7 77.1 H 3.1 R7.6 91.0 93.1 95.2 96.3 97.2 98. 1MEN'S AND BOYS' SUITS AND COATS ....... .... . .. . ... . . .. . 19.3 25.5 32.8 43. 1 54.2 64.7 72.3 78.3 83.2 86.9 89.2 91.1 92.6 94.3 95.5MEN'S AND BOYS' FURNISHINGS ........... .... . .. .. .. .. .. . 29.6 37.6 47.9 62.9 75.7 84.5 89.4 92.6 94. 1 95.5 96.3 97.1 97.6 98.0 98.2WOMEN'S AND MISSES' OUTERWEAR ......... .... . .. . ... .. .. . 30.0 38.2 48.9 61.6 72.2 79.8 84.6 87.4 89.7 91.3 92.2 93.3 94.0 95.1 95.8WOMEN'S AND CHILDREN'S UNDERGARMENTS .... . .. . .. . ... . . .. . 31.5 40 . 1 51.2 65. 1 75.9 83.0 88.3 91.2 93.2 94.2 95.0 95.8 96.2 96.9 97.6CHILDREN'S OUTERWEAR ................... 31.2 39.5 51.3 65.6 78.4 84.3 89.2 92. 7 93.6 94.1 94.5 95.7 96.4 97.3 97.6SAWMILLS AND PLANING MILLS ............ ..... . .. . .... . . 27.9 33.7 4C.6 47.8 54.6 60.2 64.7 68.8 73.7 78.5 82.5 86.3 88.5 91.8 94.7MILLWORK, PLYWOOD AND RELATED PRODUCTS . ... . .. . ... . . .. . 22.0 26.2 31.4 36.6 42.3 48.0 53.8 59.4 65.7 71.7 76.1 81.1 84.5 88.0 91.1HOUSEHOLD FURNITURE .................... .. . .. . .. . ... . . . 23.6 29.3 35.0 41.9 51.3 60.5 68.9 76.1 81.2 84.9 88.3 91.2 92.8 95. 1 96.3PULP AND PAPER MILLS ................... 8.2 10.3 12.2 14.4 16.6 19.2 21.8 26.4 32.0 37.7 44.9 54.6 62.4 73.6 82.6PAPERBOARD CONTAINERS ANO BOXES ............ . .... .. . . . 16.6 20.0 24.5 29.0 34.9 40.7 46.6 53.7 60.5 67.1 72.3 77.8 82.4 87.9 91.7NEWSPAPERS ............................ . 24.5 28.5 32.2 35.6 40.1 44.3 48.1 51.6 54.9 58.4 61.9 70.5 7 7.0 82.6COMMERCIAL PRINTING .................... . . . .. . .. .. .. ... . . 19.0 23.2 26.8 30.6 35.9 40.3 44.9 49.0 52.6 56.8 60.4 64.9 69.3 75.2 81.1INDtlSTRIAl THEMTCAl S -__ _________ ..... 5.1 6.7 7.7 9. 3 10.8 12.8 16.1 20.0 24.1 29.4 35.1 42.7 49.3 60.4 71.1PLASTICS MATERIALS AND SYNTHETICS .... ..... , .... .. .. . 6.9 9.4 11.4 14. 5 17.2 20.0 25.5 32.1 39.5 47.2 54.5 62.3 69.0 77.8 85.0DRUGS .................................... 9.3 11.9 14.4 17. 1 20.7 24.5 29.6 35.0 40.8 46.8 52.1 59.2 63.0 68.7 75.1SOAP, CLEANERS, AND TOILET GOODS ..... .. ... . . .. . . .. . 17.8 22.4 26.3 '30. 1 35.1 39.7 44.7 49.5 54.1 58.2 62.3 66.6 70. 1 75.0 80.1PFTROLFUM REFINING ..........____ . . . . . 5.1 7.4 8.9 10.6 12.0 14.4 16.9 19.7 21.8 25.5 29.0 33.6 40 • 3 53.6 67.6TIRES AND INNER TUBES ................... . ... . .. . ... .. . 6.3 8.3 10.5 12. 1 13.9 16.5 19.8 23.6 29.9 35.5 42.2 49.3 55.8 66.7 77.7OTHER RUBBER PRODUCTS .................... . .. . .. .. .. .. ... 17.0 21.1 25.1 30. 1 36.1 42.4 49.7 56.1 63. 1 68.6 73.9 79.2 82.8 87. 3 91.8FOOTWEAR, EXCEPT RUBBER .................... . .. . ... . • ... 26.0 32.1 40.3 51.6 63.2 73.0 80.6 85.3 88.7 91.4 93.6 95.4 96.3 97. 1 97.7GLASS AND GLASSWARE, PRESSED OR BLOWN ..... . .. .. .. . . ... 13.2 16.5 2C.6 25.6 29.4 34.3 41.0 51.1 59.2 65.4 70.8 77.5 81.3 86.3 90.2CONCRETE, GYPSUM, AND PLASTER PRODUCTS . . .. . .. . ... .. ... 17.3 21.0 24.9 29.0 34.0 38.6 43.9 49.6 54.9 60.1 65.2 70.6 75.4 82.2 87.5BLAST FURNACE ANO BASIC STEEL PRODUCTS . . .. . .. . ... .. ... 7.1 9.3 11.3 13. 1 14.9 17.4 20.4 24.1 29.3 35.1 41.9 48.8 56.4 68.5 78.8IRON AND STEEL FOUNDRIES .............. .. . .. . ... . . .. . 12.2 15.1 18.9 22. 1 25.8 29.8 35.5 41.5 47.1 55.0 62.7 69.8 75.7 83.5 87.5NONFERROUS ROLLING AND OR AW IN G............ . .... .. . • •.. 9.0 12.2 14.9 17.8 21.1 25.1 30.9 35.7 42.0 48.8 54.9 63.9 70.6 79.0i 84.2CUTLERY, HAND TOOLS, AND HARDWARE ......... . .. .. .. . . .. . 15.5 18.6 21.7 26.0 32.0 38.3 45.7 52.3 58.8 65.1 70.3 75.5 79.2 83.8i 87.5FABRICATED STRUCTURAL METAL PRODUCTS .,.. . .... .. .. , 15.5 19.4 23.3 26. 8 30.7 35.5 40.5 46.3 51.8 57.7 63.2 69.8 74.6 80.8 85.5SCREW MACHINE PROOUCTS, BOLTS, ETC ........ . .. .. .. .. .. . 15.4 18.9 22.6 25.4 29.4 34.7 40.4 45.8 51.4 57.5 62.9 69.4 74.1 81.2 86.2MFTAI CTAMPIMG^....... ........ ........ 13.8 17.5 21.1 25. 0 29 • 4 33.5 38.6 43.0 49.0 52.9 57.8 63.4 67.4 74.0 78.8ENGINES AND TURBINES .............. . 6.1 8.4 10.3 11.8 14.5 17.9 23.4 28.9 35.8 42.9 50.6 60.2 68.5 7 8.8 84.9FARM MAGHINFRV ............................................ 12.5 16.4 19.1 22. 3 25.6 30.2 35.6 42.5 47.4 52.3 58.5 66.6 72.0 78.5 84.4CONSTRUCTION AND RELATED MACHINERY ........ •• ......... .. 7.9 11.0 12.7 15. 1 17.7 21.4 25.2 30.2 36.3 42.6 50.5 59.8 67.5 76.9• 83.3
Digitized for FRASER http://fraser.stlouisfed.org/ Federal Reserve Bank of St. Louis
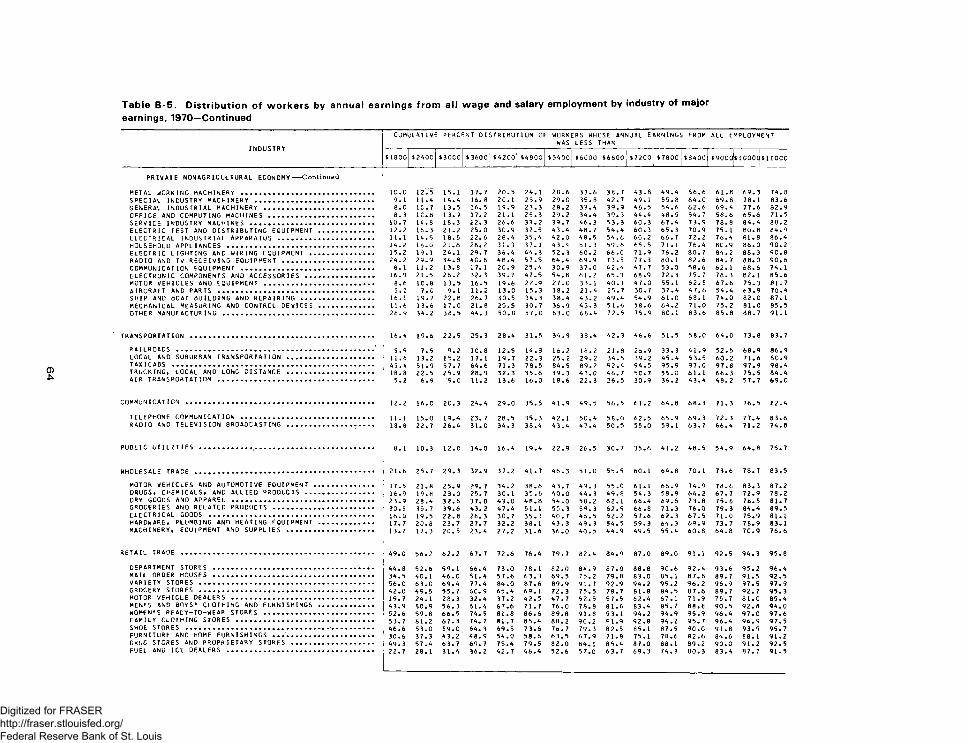
INDUSTRY
CUMULATIVE PERCENT DISTRIBUTION OF WORKERS WHOSE ANNUAL EARNINGS FROMWAS LESS THAN
ALL EMPLOYMENT
$1800 $2400 $3000 $3600 $4200 $4800 $5400 $6000 $6600 $7200 $7800 $8400 $9000 $10000 $11000
PRIVATE NONAGRICULTURAL ECONOMY---- Continued
METAL WORKING MACHINERY.......... , ...................................................... 10.0 12.5 15.1 17. 7 20.5 24.1 28 .6 33.6 38.7 43.8 49 .4 56.6 61.8 69.3 74.8SPECIAL INCUSTRY MACHINERY ............................................................ 9. 1 11.4 14.4 16. 8 20.1 23 .9 29.0 35.8 42.7 49.1 55.8 64 .0 69 .8 78.1 83.6GENERAL INDUSTRIAL MACHINERY ....................................................... 8.0 1C.7 13.5 16. 5 19.9 23.3 28.2 33.4 39.9 46.5 54.6 62 .6 69 .4 77.6i 82.9OFFICE AND COMPUTING MACHINES ..................................................... 8.3 1C.8 13.9 17.2 21.1 25 .3 29.2 34.4 39.3 44.4 48.5 54.7 58.6 65.6 71.5SERVICE INDUSTRY MACHINES ....................................................... 10.7 14.8 18.3 22. 3 26.6 33.2 39.7 46.3 53.3 60.3 67 .4 73.9 78.8 84.4 88.2ELECTRIC TEST AND DISTRIBUTING EQUIPMENT ............................ 12.2 16.3 21.2 25.0 30.9 37.5 43 .4 48.7 54.4 60.3 65 .3 70 .9 75.1 80.8 84.9ELECTRICAL INDUSTRIAL APPARATUS ................................................ 11.1 14.5 18.5 22.6 28.4 35.4 42 .0 48 .5 54.6 60.2 66 .7 72.2 76 .4 81.8 86.4HOUSEHOLD APPLIANCES ......................................................................... 14.2 i e . o 21.6 26. 2 31.3 37. 1 43.4 51.3 59.6 65.5 71.1 76 .4 80.9 86.0i 90.2ELECTRIC LIGHTING AND WIRING EQUIPMENT ................................ 15.2 19.1 24.1 29. 7 36.4 44 .3 52.3 60.2 66.0 71.9 76.2 80.7 84.2 88. 3 90 .8RADIO AND TV RECEIVING EQUIPMENT .............................................. 24.2 29.9 34.8 40.6 48 .4 57.5 64 .4 69 .9 73.5 77.3 80.1 82.6 84 .7 88.0 90 .6COMMUNICATION EQUIPMENT .................................................................. 8.1 11.2 13.8 17. 1 20 .9 25 .4 30.9 37.0 42 .4 47.7 53.0 58.6 62. 1 68.6 74.1ELECTRONIC COMPONENTS AND ACCESSORIES .................................. 16.9 21.5 26.2 32. 3 39.7 47 .5 54 .8 61 .2 65.3 68.9 72.3 75.7 78.3 82. 1 85 .6MOTOR VEHICLES AND EQUIPMENT ....................................................... 8.6 10.8 13.5 16.5 19.6 22.9 27.0 33.1 40.1 47.0 55.1 62.5 67 .6 75.3 81 .7AIRCRAFT AND PARTS .............................................................................. 5.1 7.0 9.1 11. 2 13.0 15.3 18.2 21.4 25.7 30.7 37.4 47 .6 54.4 63.9i 70.4SHIP AND BOAT BUILDING AND REPAIRING .................................... 16.1 19.7 22.8 26.7 30.5 34.3 38.4 43 .2 49.4 54.9 61 .0 68.1 74 .0 82.01 87. 1MECHANICAL MEASURING AND CONTROL DEVICES ............................ 11.6 13.6 17.0 21.8 25.5 30.7 36.9 45 .3 51 .6 58.6 64 .2 71.0 75.2 81.0l 85.5OTHER MANUFACTURING ............................................................................ 28.9 34.2 38.5 44. 3 50.8 57 .0 63 .0 68.4 72.5 75.9 80.1 83 .6 85.8 88.7 91.1
TRANSPORTATION ............................................................................................ 16.4 19.6 22 .5 25. 3 28 .4 31.5 34.9 38.4 42 .3 46.6 51.5 58.0 64 .0 73.8 83.7
RAILROADS ................................................................................................... ' 5.9 7.5 9.2 10. 8 12.5 14.3 16.2 18.2 21.8 26.9 33.3 41 .9 52.5 68.9» 86 .9LOCAL AND SUBURBAN TRANSPORTATION ........................................... 11.6 13.2 15.2 17. 1 19.7 22.3 25.2 29.2 34.5 39.2 45 .4 53.5 60.2 71.6i 80.9TAXICABS ..................................................................................................... 45.4 51.9 57.7 64.6 71.3 78.5 84.5 89.2 92 .4 94.5 95.9 97 .0 97 .8 97.9i 98 .4TRUCKING, LOCAL AND LONG DISTANCE ........................................... 18.8 22.5 25 .9 28. 9 32.3 35.6 39.3 43 .0 46 .7 50.7 55.0 61.1 66 .3 75.5 84.4AIR TRANSPORTATION .............................................................................. 5.2 6.9 •9.0 11.2 13.6 16.0 18.6 22.3 26.5 30.9 36.2 43.4 48 .2 57.7 69 .0
COMMUNICATION ............................................................ ................................. 12.2 16 .C 2C.3 24.4 29.0 35.5 41 .9 49.5 56.5 61.2 64 .8 68 .3 71.3 76.5 82.4
TELEPHONE COMMUNICATION .................................................................. 11. I 15.0 19.4 23. 7 28.5 35.3 42. 1 50.4 58.0 62.5 65.9 69 .3 72.3 77.4 83.6RADIO AND TELEVISION BROADCASTING ................................ .. 18.8 22.7 26 .4 31.0 34.3 38 .4 43 .4 47.4 50.5 55.0 59.1 63.7 66.4 71.2 74.8
PUBLIC U T I L I T I E S .......................... ............................................................ 8.1 10.3 12.0 14.0 16.4 19.4 22 .9 26.5 30.7 35.6 41.2 48.5 54.9 64.8 75.7
21.6 25.7 29.3 32. 9 37.2 41 .7 46 .3 51.0 55.5 60.1 64.8 70.1 73.6 78.7 83.5
MOTOR VEHICLES AND AUTOMOTIVE EQUIPMENT .............................. 17.5 21.8 25 .9 29. 7 34.2 38.6 43 .7 49 .3 55.0 61.1 66.9 74.9 78 .6 83.3 87.2DRUGS, CHEMICALS, AND ALLIED PRODUCTS .................................. 16.9 19.8 23.0 25. 7 30.1 35.6 40 .0 44 .3 49.8 54.3 58.9 64.2 67.7 72.9 78.2DRY GOODS AND APPAREL ....................................................................... 23.9 28.4 32.6 37. 8 43 .0 48 .8 54.0 58.2 62.1 66.4 69.6 73.8 75.8 78.5 81.7GROCERIES AND RELATED PRODUCTS .................................................. | 30.5 35.7 39.6 43. 2 47.4 51.1 55.3 59.3 62 .9 66.8 71.3 76.0 79 .3 84.4 89.5ELECTRICAL GOODS .................................................................................. 16.0 19.5 22 .8 26. 3 30.7 35.3 40 .7 46 .5 52.2 57.6 62 .3 67.5 71 .0 75.9 81.1HARDWARE, PLUMBING AND HEATING EQUIPMENT ............................ 17.7 20.8 23 .7 27. 7 32.2 38. 1 43 .3 49. 3 54.5 59.3 64 .3 69 .9 73 .7 78.9 83.1MACHINERY, EQUIPMENT AND SUPPLIES ............................................ 13.7 17.3 20 .5 23.4 27.2 31.6 36.0 40.5 44.9 49.5 55 .4 60.8 64 .8 70 .9 76 .6
RETAIL TRADE ................................................................................................ 49.0 56.2 62 .2 67. 7 72.6 76.4 79.7 82.4 84.9 87.0 89.0 91.1 92 .5 94.3 95 .8
DEPARTMENT STORES ................................................................................ 44.8 52.6 59.1 66.4 73.0 78.1 82 .0 84.9 87.0 88.8 90.6 92.4 93 .6 95.2 96 .4MAIL ORDER HOUSES ................................................................................ 34.5 40.1 46 .0 51.4 57.6 63.3 69 .5 75.2 79.8 83.0 85.1 87 .8 89.7 91.5 92 .5VARIETY STORES ....................................................................................... 56.0 63.0 69 .4 77.4 84.0 87.6 89 .9 91 .7 92 .9 94.2 95 .2 96 .2 96 .9 97.5 97 .9GROCERY STORES ....................................................................................... 42.0 49.5 55 .7 6C. 9 65.4 69. 1. 72 .3 75.5 78.7 81.8 84.5 87.6 89 .7 92.7 95 .3MOTOR VEHICLE DEALERS ....................................................................... 19.7 24.1 28.3 32.4 37.2 42 .5 47 .7 52.5 57.5 62.4 67.1 71.9 75.7 81.0 85.4MEN'S AND BOYS' CLOTHING AND FURNISHINGS ............................ 43.9 50.9 56.3 61.4 67.6 71.7 76 .0 78.8 81.6 83.4 85.7 88.8 90 .5 92 .8 94 .0WOMEN'S REACY-TO-WEAR STORES ....................................................... 52.6 59.8 66 .5 74. 5 81.8 86 .6 89 .8 91.8 93.1 94.2 94.9 95.9 96 .4 97 .0 97 .6FAMILY CLOTHING STORES ..................................................................... 53.7 61.2 67.3 74.7 81.7 85.4 88 .2 90.2 91 .9 92 .8 94.2 95 .7 96 .4 96 .9 97 .5SHOE STORES .............................................................................................. 46.6 53.0 59.0 64. 3 69.5 73 .6 76.7 79.3 82.5 85.1 87.5 90 .0 91 .8 93 .9 95 .7FURNITURE AND HOME FURNISHINGS . . . ' ............................................ 30.6 37.3 43 .2 48 .9 54.0 58.6 63.5 67 .9 71.8 75.1 78.6 82.6 84 .6 88.1 91.2DRUG STORES AND PROPRIETARY STORES ......................................... 49.3 57.4 63 .7 69. 7 75.4 79.5 82 .0 84.1 85.4 87.0 88.1 89.2 90 .0 91.2 92 .5FUEL AND ICE DEALERS ......................................................................... 22.7 28.1 31.4 36. 2 42 .7 46 .4 52.6 57.0 63 .7 69.3 74.3 80.3 83 .4 87 .7 91.5
Digitized for FRASER http://fraser.stlouisfed.org/ Federal Reserve Bank of St. Louis
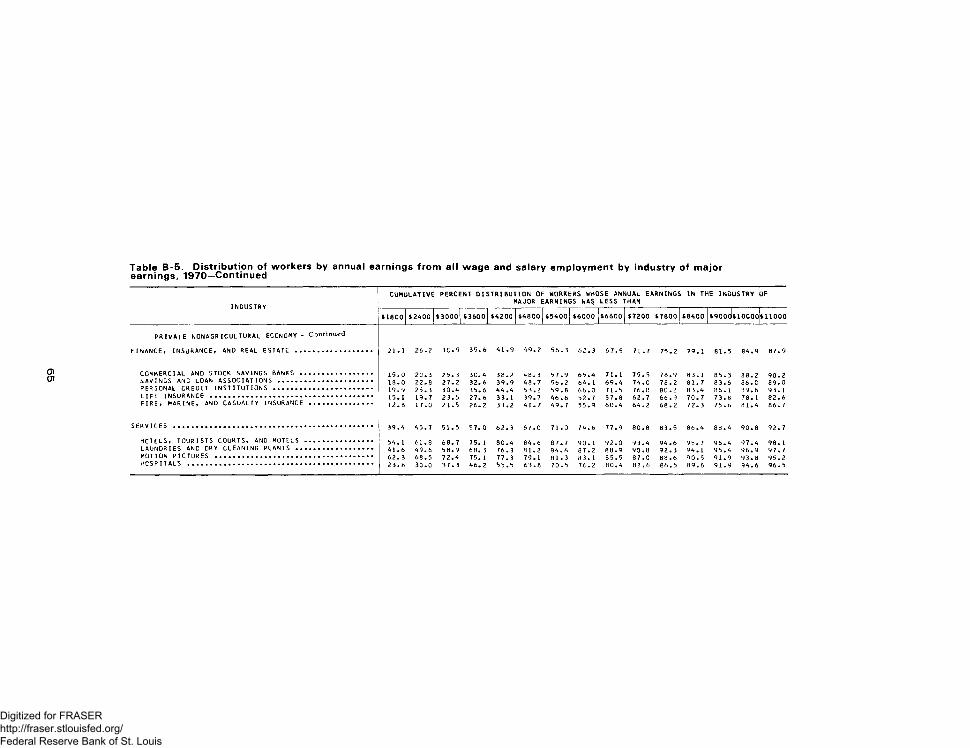
INDUSTRY
CUMULATIVE PERCENT DISTRIBUTION OF WORKERS WHOSE ANNUAL EARNINGS IN THE INDUSTRY i MAJOR EARNINGS WAS LESS THAN
DF
$ 1800 $2AOO $3000 $3600|1A200 $A8C0 $5A00 $6000 $6600 $7200 $7800 $8A00
oooO' $10000 $11000
PRIVATE NONAGRICULTURAL ECONOMY--Continued
FINANCE, INSURANCE, AND REAL ESTATE ................... 21.1 26.2 3C.9 35.6 A1.9 A9.2 56.3 62.3 67.5 71.7 75.2 79.1 81.5 8A.9 87.9
COMMERCIAL AND STOCK SAVINGS BANKS .................. 15.0 20.3 25.3 30. A 38.2 A8.3 57.9 65.A 71.1 75.5 78.9 83.1 85.3 88.2 90.2SAVINGS AND LOAN ASSOCIATIONS ........................ 18.0 22.8 27.2 32. 6 39.9 A 8.7 56.2 6A . 1 69.A 7 A . 0 78.2 81.7 83.6 86.C 89.0PERSONAL CREDIT INSTITUTIONS ......................... 19.9 25.3 30.A 35.6 AA.A 53.2 59. B 66.0 71.5 76.0 80.2 83.A 86. 1 89.6 93. 1LIFE INSURANCE ........................................ 15.1 19.7 23.5 27.6 33.1 39.7 A6.6 52.7 57.8 62.7 66.9 70.7 73.8 78. 1 82.6FIRE, MARINE, AND CASUALTY INSURANCE ................ 12.8 17.0 21.5 26.2 33.2 A l. 7 A9.7 55.9 60. A 6A.2 68.2 72.3 75.6 81.A 86.7
SERVICES .................................................. 39.A A5.7 51.5 57. 0 62.3 67.0 71.0 7 A . 6 77.9 80.8 83.5 86.A 88. A 90.8 92.7
HOTELS, TOURISTS COURTS, AND MOTELS ................. 5A. 1 61.8 68.7 75. 1 80.A 8 A . 6 87.7 90. 1 92.0 93.A 9A.6 95.7 96. A 97.A 98.1LAUNDRIES AND DRY CLEANING PLANTS ................... A 1.6 A9.6 58.9 68. 3 76.3 81.2 8A.6 87.2 88.9 90 .8 92.3 9A . 1 95.A 96.9 97.7MOTION PICTURES ....................................... 62.3 68.5 72.A 75. 1 77.3 79.1 81.3 83. 1 85.5 87.0 88.6 90.5 91.9 93.8 95.2HOSPITALS .............................................. 23.8 30.0 37.3 A6.2 55.5 63.8 70.5 76.2 80. A 83.6 86.5 89.6 91.9 9 A . 6 96.5
Digitized for FRASER http://fraser.stlouisfed.org/ Federal Reserve Bank of St. Louis
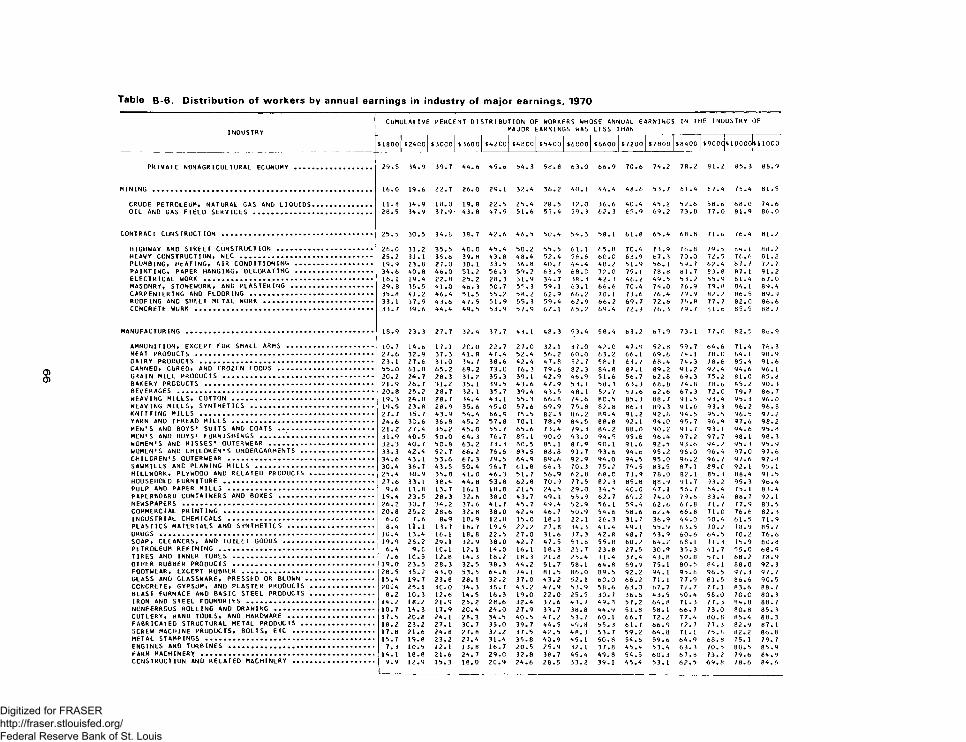
INDUSTRYCUMULATIVE PERCENT DISTRIBUTION OF WORKFRS WHOSE ANNUAL EARNINGS IN THE INDUSTRY
MAJOR EARNINGS WAS LESS THANOF
$1800 $2400 $3000 $3600 $42C0 $4800 $5400 $6000 $6600 $7200 $7800 $8400 $9000 $ 1 0 0 0 0 $ 1 1 0 0 0
PRIVATE NONAGRICULTURAl ECONOMY ................... 29.5 34.9 39.7 44.6 49.6 54.3 58.8 63.0 66.9 70.6 74.2 78.2 81.2 85.3 88.9
MINING ....................................................... 16.0 19.6 22.7 26.0 29.1 32.4 36.2 40. 1 44.4 48.6 53.7 61.4 67.4 75.4 81.5
CRUDE PETROLEUM, NATURAL GAS AND LIQUIDS............... II. 8 14.9 18.0 19. 8 22.5 25.4 28.5 32.0 36.6 4C.4 45.2 52.6 58.6 6 8 . 0 74.6OIL AND GAS FIELD SERVICES ............................. 28.5 34.9 37.9 43.8 47.9 51.6 55.4 59.3 62.3 65.9 69.2 73.8 77.0 81.9 8 6 . 0
CONTRACT CONSTRUCTION ..................................... 25.5 30.5 34.8 38. 7 42.6 46.5 50.4 54.3 58. 1 61.8 65.4 6 8 . 8 71.6 76.4 81.2
HIGHWAY AND STREET CONSTRUCTION ........................ 26.0 31.2 35.5 40.0 45.4 50.2 55.5 61.1 65.8 70.4 73.9 76.8 79.5 64. 1 6 6 . 2HEAVY CONSTRUCTION, NEC ................................. 25.2 31.1 35.6 39. 8 43.8 48.4 52.4 56.6 60.0 63.9 67.3 70.0 72.5 7 6 . 6 81.2PLUMBING, HEATING, AIR CONDITIONING ................... 19.9 23.8 27.0 30. 1 33.5 36.8 40.7 44.4 48.2 51.9 56.1 59.7 62.4 6 7.7 72.7PAINTING, PAPER HANGING, DECORATING ................... 34.6 40.8 46.0 51.2 56.3 59.2 63.9 6 8 .C 72.0 75.1 78.8 81.7 83.8 87. 1 91.2ELECTRICAL WORK .......................................... 16. 1 19.4 2 2 . 8 25.2 28.3 31.9 34.7 38.3 42.3 46.2 49.5 53.2 55.9 61.4 67.0MASONRY, STONEWORK, AND PLASTERING .................... 29.8 35.5 41.0 46. 3 50.7 5*.3 59.1 63.1 6 6 . 6 70.4 74.0 76.9 79.8 84. 1 89.4CARPENTERING AND FLOORING .............................. 35.8 41.2 46.4 51.5 55.2 58.2 62.9 6 6 . 2 70.1 73.6 76.4 79.9 82.2 86.5 89.9ROOFING AND SHEET METAL WORK ........................... 33.1 37.9 43.6 47. 5 51 .9 55.3 59.4 62.9 6 6 . 2 69.7 72.6 75.8 77.7 82.C 8 6 . 6CONCRETE WORK ............................................. 33.7 39.6 44.4 49. 5 53.9 57.9 62.1 65.2 69.4 72.3 76.3 79.7 81.6 85.5 88.7
MANUFACTURING ............................................... 18.9 23.3 27.7 32.4 37.7 43.1 48.3 53.4 58.4 63.2 67.9 73. 1 7 7.0 82.5 86.9
AMMUNITION, EXCEPT FOR SMALL A R M S ........ ............. 10.7 14.6 17.1 2C.0 22.7 27.0 32.1 37.0 42.0 47.9 52.8 59.7 64.6 71.4 76.3MEAT PRODUCTS ............................................ 27.6 32.9 37.3 41.8 47.4 52.4 56.2 60.0 63.2 6 6 . 1 69.6 74. 1 78.0 84. 1 90.9DAIRY PRODUCTS ........................................... 23.1 27.6 31.0 34. 7 38.6 42.4 47.8 52.7 58.1 63.7 68.4 74.3 78.6 85.4 91.6CANNED, CURED, AND FROZEN FOODS ........................ 55.0 61.0 65.2 69. 2 73.0 76.3 79.6 82.3 84.8 87.1 89.2 91.2 92.4 94.6 96.1GRAIN MILL PRODUCTS ..................................... 2 0 . 2 24.7 28.3 31.2 35.3 39.1 42.9 46.9 51.6 56.7 62.8 69.3 75.2 81.0 85.8BAKERY PROCUCTS .......................................... 21.9 26.7 31.2 35. 1 39.5 43.6 47.9 53.1 58.3 63.3 6 8 . 8 74.8 78.6 85.2 90.3BEVERAGES ................................................. 2 0 . 8 25.2 28.7 32. 1 35.7 39.4 43.5 48.1 52.7 57.6 62.6 67.3 72.C 79. 7 86.7WEAVING MILLS, COTTON ................................... 19.3 24.0 28.7 34.4 43.1 55.3 6 6 . 8 74.6 80.5 85.3 88.7 91.5 93.4 95.3 96.0WEAVING MILLS, SYNTHETICS .............................. 19.5 23.8 28.9 35.6 45.0 57.6 69.9 75.8 B2 . 8 86.3 89.3 9 1.6 93.3 96.2 96.8KNITTING MILLS ........................................... 27.7 35.7 43.9 54.4 66.9 75.5 82.3 8 6 . 2 89.4 91.2 92.8 94.5 95.5 96.5 97.2YARN AND THREAD MILLS ................................... 24.6 3C.6 36.8 45.2 57.8 70.1 78.9 84.5 8 8 . 8 92.1 94.0 95.7 96.9 97.6 98.2MEN'S AND BOYS' SUITS AND COATS .................. ..... 2 1 . 2 27.4 35.2 45.0 55.7 65.6 73.4 79.3 84.2 8 8 . 0 90.2 91.7 93.1 94.6 95.8MEN'S AND BOYS' FURNISHINGS ............................ 31.9 40.5 50.0 64. 3 76.7 85.1 90.0 93.0 94.5 95.8 96.4 97.2 97.7 98. 1 98.3WOMEN'S AND MISSES’ OUTERWEAR .......................... 32.3 40.7 5C.8 63.2 73.3 80.5 85.1 87.9 90.1 91.6 92.5 93.6 94.2 95.3 95.9WOMEN'S ANC CHILDREN'S UNDERGARMENTS .................. 33.3 42.4 52.7 6 6 . 2 76.6 83.5 8 8 . 8 91.7 93.6 94.6 95.2 96.0 96.4 97.0 97.6CHILDREN'S OUTERWEAR .................................... 34.6 43.1 53.6 67. 3 79.5 84.9 89.6 92.9 94.0 94,5 95.0 96.2 96.7 97.6 97.8SAWMILLS AND PLANING MILLS ............................. 30.4 36.7 43.5 50.4 56.7 61.8 66.3 70.3 75.2 79.5 83.5 87.1 89.0 92. 1 95. 1MILLWORK, PLYWOOD AND RELATED PRODUCTS ................ 25,4 30.9 35.8 41.0 46.3 51.7 56.9 62.8 6 8 . 0 73.9 78.0 82.1 85.3 88.4 91.5HOUSEHOLD FURNITURE ..................................... 27.6 33.1 38.4 44. 8 53.8 62.8 70.9 77.5 82.3 85.8 88.9 91.7 93.2 95.3 96.4PULP AND PAPER MILLS .................................... 9.6 1 1 . 8 13.7 16. 1 18.8 21.5 24.5 29.0 34.5 40.0 47.1 56.7 64.4 75.1 83.4PAPERBOARD CONTAINERS AND BOXES ........................ 19.4 23.5 28.3 32.6 38.0 43.7 49. 1 55.9 62.7 69.2 74.0 79.6 83.4 8 8 . 7 92.1NEWSPAPERS ................................................ 26.2 30.7 34.2 37.6 41.7 45.7 49.4 52.9 56.1 59.4 62.6 67.8 71.7 77.9 83.5COMMERCIAL PRINTING ..................................... 2 0 . 8 25.2 28.6 32.8 38.0 42.4 46.7 50.9 54.6 58.6 62.4 6 6 . 8 71.0 76.6 82.3INDUSTRIAL CHEMICALS .................................... 6 . 0 7.6 8» 9 10. 9 1 2 . 8 15.0 18.1 2 2 . 1 26.3 31.7 36.9 44.0 50.4 61.5 71.9PLASTICS MATERIALS AND SYNTHETICS ..................... 8.4 ii.i 13.7 16. 7 19.5 2 2 . 2 27.8 34.3 41.4 49.1 55.9 63.5 70.2 78.9 85.7DRUGS ..................................................... 10.4 13.4 16.1 18. 8 22.5 27.0 31.6 37.3 42.8 48.7 53.9 60.6 64.5 70.2 76.6SOAP, CLEANERS, AND TOILET GOODS ...................... 19.9 25.2 29.1 32.9 38.0 42.7 47.5 51.8 55.8 60.2 64.2 6 8 . 1 71.3 75.9 80.8PETROLEUM REFINING ...................................... 6.4 9 . C 1C.1 1 2 . 1 14.0 16.1 18.3 21.7 23.8 27.5 30.9 35.3 41.7 55.0 68.9TIRES AND INNER TUBES ................................... 7.6 1 C.5 1 2 . 8 14. 3 16.2 18.3 2 1 . 8 25.4 31.4 37.4 43.8 50.8 57.1 6 8 . 2 78.9OTHER RUBBER PRODUCTS ................................... 19.0 23.5 28.3 32.5 38.3 44.2 51.7 58.1 64.8 69.9 75.1 80.5 84.1 8 8 . 0 92.3FOOTWEAR, EXCEPT RUBBER ................................. 28.5 35.2 43.0 53. 5 64.8 74.1 81.5 8 6 . 0 89.5 92.2 94.1 95.8 96.5 97. 3 97. 7GLASS AND GLASSWARE, PRESSED OR BLOWN ................. 15.4 19.7 23.8 28. 1 32.2 37.0 43.2 52. 1 60.0 6 6 . 2 71.1 77.9 81.5 8 6 . 6 90.5CONCRETE, GYPSUM, AND PLASTER PRODUCTS ................ 20.4 25.1 3C.0 34. 3 38.7 43.2 47.9 53.9 58.6 63.0 67.7 72.7 77.1 83.6 88.7BLAST FURNACE AND BASIC STEEL PRODUCTS ................ 8 . 2 10.3 1 2 . 6 14.5 16.3 19.0 2 2 . 0 25.5 30.7 36.6 43.5 50.4 58.0 70.C 80.3IRON AND STEEL FOUNDRIES ........................... . 14.2 18.2 21.9 25.2 28.6 32.4 37.6 43.7 49.3 57.2 64.8 71.3 77.3 84.8 88.7NCNFERROUS ROLLING AND DRAWING ......................... 10.7 14.3 17.9 2C.4 24.0 27.9 33.7 38.8 44.9 51.8 58.1 66.7 73.0 80.8 85.3CUTLERY, HAND TOOLS, AND HARDWARE ..................... 17.5 2 0 . 8 24.1 28. 3 34.5 40.5 47.2 53.7 60.1 66.7 72.2 77.4 80.8 85.4 88.3FABRICATED STRUCTURAL METAL PROOUCTS .................. 18.2 23.2 27.1 3C. 7 35.0 39.7 44.5 49.8 55.3 6 i.r 66.9 72.7 77.3 82.9 87.1SCREW MACHINE PRODUCTS, BOLTS, ETC .................... 17.8 2 1 . 6 24.8 27. 8 32.2 37.5 42.5 48.3 53.7 59.2 64.8 71.1 75.8 82.2 8 6 . 8METAL STAMPINGS .......................................... 15.7 19.fi 23.2 27.4 31.4 35.8 40.9 45.1 50.8 54.6 59.6 64.9 6 8 . 8 75. 1 79. 7ENGINES ANO TURBINES .................................... 7. 3 10.5 1 2 . 1 13.8 16.7 20.5 25.9 32.1 37.8 45.4 53.4 63. 3 70.5 80.5 85.9FARM MACHINERY ........................................... 14.1 18.8 2 1 . 6 24. 7 29.C 32.8 38.7 45.4 49.8 54.5 60.3 67.8 73.2 79.6 64.9CONSTRUCTION AND RELATED MACHINERY .................... 9.9 12.9 15.3 18.0 2C.9 24.6 28.5 33.2 39.1 45.4 53.1 62.5 00 78.6 84.6
Digitized for FRASER http://fraser.stlouisfed.org/ Federal Reserve Bank of St. Louis
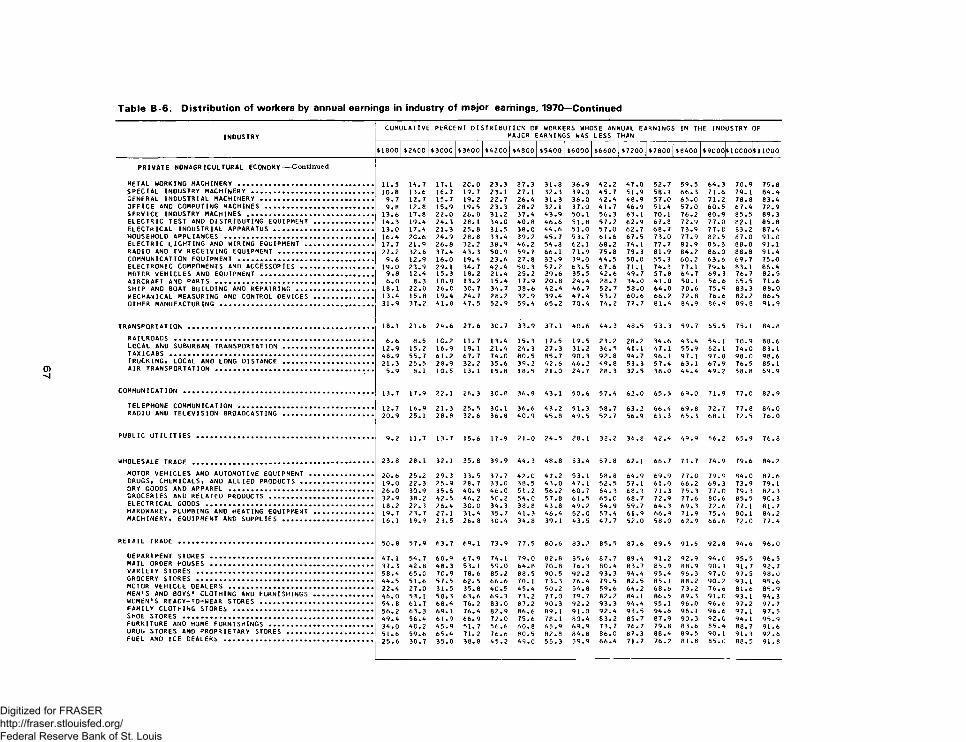
INDUSTRYCUMULATIVE PERCENT DISTRIBUTION OF WORKERS WHOSE ANNUAL EARNINGS IN THE INDUSTRY
MAJOR EARNINGS WAS LESS THANOF
$1800 $2A00 $3000 $3600 $A2C0 $A800 $5A00 $6000 $6600 $7200 $7800 $ 8A00 $9000 $ 1 0 0 0 0 $ 1 1 0 0 0
PRIVATE NONAGRICULTURAL ECONOMY--Continued
METAL WORKING MACHINERY ...................... 11.5 1A.7 17.1 2C.0 23.3 27.3 31.8 36.9 A2.2 A7.0 52.7 59.5 6A.3 70.9 75.8SPECIAL INDUSTRY MACHINERY ................. . . . . ... . .. . 1 0 . 8 13.6 16.7 19.7 23.1 27.1 32.3 39.0 A5.7 51.9 58.3 66.3 71.6 79.1 8A.AGENERAL INDUSTRIAL MACHINERY ............... . . . . ... . .. . 9.7 12.7 15.7 19.2 22.7 26.A 31.3 36.0 A2.A A8.9 57.0 65.0 71.2 78.8 83.AOFFICE AND COMPUTING MACHINES ............. . . .... . . .. . 9.8 1 2 . 8 15.9 19.5 23.3 28.2 32.1 37.0 A 1 .7 A6.9 51.A 57.0 60.5 67.A 72.9SERVICE INOUSTRY MACHINES .................. . . . . ... . .. . 13.6 17.8 2 2 . 0 26.8 31.2 37.A A3.9 50.1 56.3 63.1 70.1 76.2 80.9 85.5 89.3ELECTRIC TEST AND DISTRIBUTING EQUIPMENT .. . . .... . . .. . 1A . 3 19.A 2 A . 3 28. 1 3A.0 AO . 8 A6 . 6 51.8 57.2 62.9 67.8 72.9 77.0 82.1 85.8ELECTRICAL INDUSTRIAL APPARATUS ........... . . . . ... . .. . 13.0 17.A 21.3 25.8 31.5 38.0 AA . 6 51.0 57.0 62.7 68.7 73.9 77.8 83.2 87.AHOUSEHOLD APPLIANCES ........................ 16.A 2 C . 6 2 A.9 28. 8 33.A 39.2 A5.7 53.7 61.6 67.5 73.0 77.9 82.5 87.0 91.0ELECTRIC LIGHTING AND WIRING EQUIPMENT .... . . . . .. . . .. . 17.7 21.9 26.8 32.2 38.9 A6.2 5A.8 62. 1 6 8 . 2 7A.1 77.7 81.9 85.3 8 8 . 8 91.1RADIO AND TV RECEIVING EQUIPMENT .......... . . .... . . .. . 27.2 32.6 37.A A3. 3 50.9 59.7 6 6 . 1 71.9 75.8 79.3 81.9 8A.2 8 6 . 0 8 8 . 8 91.ACOMMUNICATION EQUIPMENT .................... . . . . .. . . .. . 9.6 12.9 16.0 19. A 23.6 27.8 32.9 39.0 AA.5 50.0 55.3 60.2 63.6 69. 7 75.0e l e c t r o n i c c o m p o n e n t s an d a c c e s s o r i e s .... . . . . ... . .. . 19.0 23.9 29.1 3A. 7 A2.A 50.3 57.2 63.5 67.6 71.1 7A.3 77.1 79.6 83.1 8 6 .AMOTOR VEHICLES AND EQUIPMENT ............... . . __ . . .. , 9.8 1 2 .A 15.3 18.2 2 1 .A 25.2 29.6 35.5 A2.6 A9.7 57.8 6 A . 7 69. 3: 76.7 82.5AIRCRAFT AND PARTS .......................... 6 . 0 8.3 1 0 . 8 13.2 15.A 17.9 2 0 . 8 2A.A 28.7 3A.0 A 1 . 0 50.1 56.6i 65.5 71.6SHIP AND BOAT BUILDING ANO REPAIRING ...... . . .... . . .. . 18.1 2 2 . 0 26.0 30. 7 3A.7 38.6 A2.A A6.7 52.7 58.0 6A.0 70.6 75.9' 83.3 8 8 . 0MECHANICAL MEASURING AND CONTROL DEVICES .. . . . . ... . .. . 13.A 15.8 19.A 2A. 7 28.2 32.9 39.A A 7 . A 53.7 60.6 6 6 . 2 72.8 76.6i 82.2 86.5OTHER MANUFACTURING ......................... 31.9 37.2 A 1. 8 A7.5 52.9 59.A 65.2 70.A 7A.2 77.7 81.A 8 A . 9 86.9' 89.8 91.9
TRANSPORTATION ................................. 18.1 2 1 . 6 2A.6 27.6 30.7 33.9 37.1 AO . 6 AA. 3 A 8 .5 53.3 59.7 65.5 75.1 8 A . 8
RAILROADS .................................... 6 . 6 8.5 1 C . 2 11. 7 13.A 15.3 17.5 19.5 23.2 28.2 3A . 6 A3.A 5A. 1 70.9 8 8 . 6LOCAL AND SUBURBAN TRANSPORTATION ......... . .•.. .. ... • • 12.9 15.2 16.9 19. 1 2 1 .A 2A.3 27.3 31.2 36.5 A l . 1 A7.1 55.9 62.1 7A.0 83.1
A8.9 55.7 61.2 67. 7 7A.0 80.5 85.7 90.3 92.8 9A.7 96.1 97.1 .97.8 98.0 98.6TRUCKING, LOCAL AND LONG DISTANCE ......... . ... . ... . .. . 21.3 25.5 28.9 32.2 35.6 39.2 A2.6 A6.2 A9.8 53.3 57.A 63. 1 67.9' 76.5 85.1AIR TRANSPORTATION .......................... 5.9 8 . 1 10.5 13. 1 15.8 18.5 2 1 . 0 2A.7 28.3 32.5 38.0 AA. A A9.2 58.8 69.9
COMMUNICATION .................................. 13.7 17.9 2 2 . 1 26. 3 30.8 36.9 A3.1 50.6 57.A 62.0 65.5 69.0 71.91 77.0 82.9
TELEPHONE COMMUNICATION .................,.. . .... ... . .. . 12.7 16.9 21.3 25. 5 30.1 36.6 A3.2 51.3 58.7 63.2 6 6 .A 69.8 72.7 77.8 8A.0RADIO AND TELEVISION BROADCASTING ......... * **.. ..... ** 20.9 25.1 28.8 32. 6 36.8 AO.9 A5.8 A9.5 52.7 56.9 61.3 65.3 6 8 . 1 72.5* 76.0
PUBLIC UTILITIES .............................. 9.2 11.7 13.7 15.6 17.9 2 1 . 0 2A.5 28.1 3 2.2 36.8 A2.A A9.9 56.2 65.91 76.8
WHOLESALE TRADE ................................ 23.8 28.1 32.1 35. 8 39.9 A A. 3 A8 . 8 53.A 57.8 62.1 66.7 71.7 7A.9 79.6 8A.2
MOTOR VEHICLES AND AUTOMOTIVE EQUIPMENT ... . . . . ... . .. . 2 0 . 6 25.2 29.3 33. 5 37.7 A2.0 A7.2 53. 1 58.8 6A.9 69.9 77.0 79.91 8A.0' 87.6DRUGS, CHEMICALS, AND ALLIED PRODUCTS .... . . . . ... . .. . 19.0 22.3 25.9 28.7 33.0 38.5 A 3.0 A 7.1 52.5 57.1 61.0 6 6 . 2 69.3 73.9 79. 1DRY GOODS AND APPAREL ...................... 26.0 30.9 35.6 AC.9 A6.0 51.2 56.2 60.7 6A.3 68.3 71.3 75.3 77.Ci 79.3 82.3GROCERIES ANO RELATED PRODUCTS ............ . . .... . . .• • 32.9 38.2 A2.5 A6.2 50.2 5A.0 57.8 61.5 65.0 68.7 72.9 77.6 80.6i 85.5 90.3ELECTRICAL GOODS ............................ 18.2 22.3 26.A 30.0 3A.3 38.8 A3 . 8 A9.2 5 A . 9 59.7 6A.3 69.3 72.6 77. 1 81.7HARDWARE, PLUMBING ANO HEATING EQUIPMENT .. . . . . ... . .. . 19.7 23.7 27.1 31. A 35.7 A l. 3 A6 .A 52.0 57.A 61.9 66.9 71.9 75.A 80. 1 8A.2MACHINERY, EQUIPMENT AND SUPPLIES ......... *• ... * * 16.1 19.9 23.5 26. 8 30.A 3A.8 39.1 A3.5 A7.7 52.0 58.0 62.9 6 6 . 6 - 72.0i 77. A
RETAIL TRADE ................................... 50.8 57.9 63.7 69. 1 73.9 77.5 80.6 83.2 85.5 87.6 89.5 91.5 92.8 9A.6. 96.0
DEPARTMENT STORES ........................... A7 . 1 5A.7 60.9 67. 9 7A.1 79.0 82.8 85.6 87.7 89.A 91.2 92.9 9A.0i 95.5 96.5MAIL ORDER HOUSES ........................... 37.3 A2.8 A8.3 53. 1 59.0 6A . 8 70.8 76.3 80.A 83.7 85.9 88.9 90.3i 91.7 92.7VARIETY STORES .............................. 58.A 65.C 7C.9 78. 6 85.2 88.5 90.5 92.2 93.3 9A.A 95.A 96.3 97.C' 97.5. 98.0GROCERY STORES .............................. AA.5 51.6 57.5 62.5 6 6 . 6 70.1 73.3 76.A 79.5 82.5 85.1 8 8 . 2 90.2 93. 1 95.6MOTOR VEHICLE OEALERS ...................... 2 2 .A 27.0 31.5 35.8 AO.5 A5.A 50.2 5 A . 8 59.6 6A.2 6 8 . 6 73.2 76.6i 81.6. 85.9MEN'S AND BOYS' CLOTHING AND FURNISHINGS .. . ... . .. . . A6.0 53.1 58.3 63.6 69.3 73.2 77.0 79.7 82.2 8A . 1 86.5 89.3 91.0 93.1 9 A . 3WOMEN'S READY-TO-WEAR STORES .............. • ••.... .. .. • 5A.8 61.7 6 8 .A 76. 2 83.0 87.2 90.3 92.2 93.3 9A.A 95.1 96.0 96.6i 97.2 97.7FAMILY CLOTHING STORES ..................... • ••. . ... . .• • 56.2 63.3 69.1 76. A 82.9 8 6 . 6 89.1 91.0 92. A 93.5 9A.6 96. 1 96.6 97. 1 97.5SHOE STORES A9. A 56.A 61.9 66.9 72.0 75.6 78.1 80.A 83.2 85.7 87.9 90.3 92.0i 9A. 1 95.9FURNITURE AND HOME FURNISHINGS ............ . ... . ... . . 3A.0 AC.2 A5.9 51. 7 56.6 60.8 65.9 69.9 73.7 76.7 79.8 83.6 85. A 88.7 91.6DRUG STORES AND PROPRIETARY STORES ........ • ••. . . ... .• • 51.6 59.6 65.A 71.2 76.6 80.5 82.8 8 A . 8 8 6 . 0 87.3 8 8 .A 89.5 90.1 91.3 92.6FUEL AND ICE DEALERS 25.6 30.7 35.0 38. 8 A 5.2 A 9.0 55.3 59.9 6 6 .A 71.7 76.2 81.8 85.C' 88.5 91.8
Digitized for FRASER http://fraser.stlouisfed.org/ Federal Reserve Bank of St. Louis
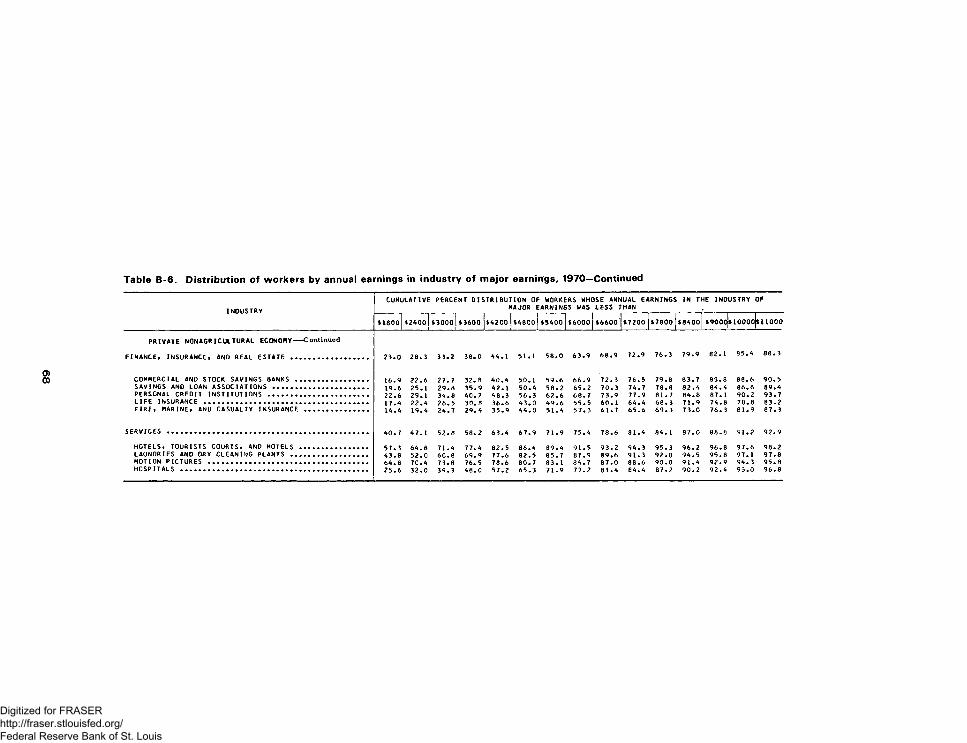
INDUSTRYCUMULATIVE PERCENT DISTRIBUTION OF WORKERS WHOSE ANNUAL EARNINGS IN THE INDUSTRY
MAJOR EARNINGS WAS LESS THANOF
$1800 $2400 $3000 $3600 $4200 $4800 $5400 $6000 $6600 $7200 $7800 $8400 $9000
oooo
$ 1 1 0 0 0
PRIVATE NONAGRICULTURAL ECONOMY--Continued
FINANCE, INSURANCE» AND REAL ESTATE ................... 23.0 28.3 33.2 38.0 44.1 51.1 58.0 63.9 68.9 72.9 76.3 79.9 82. 1 85.4 88.3
COMMERCIAL AND STOCK SAVINGS BANKS .................. 16.9 2 2 . 6 27.7 32. 8 40.4 50.1 59.6 66.9 72.3 76.5 79.8 83.7 85.8 8 8 . 6 90.5SAVINGS AND LOAN ASSOCIATIONS ........................ 19.6 25.1 29.8 35.9 42.1 50.4 58.2 65.2 70.3 74.7 78.8 82.4 84.4 8 6 . 6 89.4PERSONAL CREDIT INSTITUTIONS ......................... 2 2 . 6 29.1 34.8 40.2 48.3 56.3 62.6 68.7 73.9 77.9 81.7 84.8 87. 1 90.2 93.7LIFE INSURANCE ......................................... 17.A 22.4 26.5 30. 8 36.6 43.0 49.6 55.5 60.1 64.4 68.3 71.9 74.8 78.8 83.2FIRE* MARINE* AND CASUALTY INSURANCE ................ 14.4 19.4 24.7 29. 4 35.9 44.0 51.4 57.3 61.7 65.6 69.3 73.0 76.3 81.9 87. 3
SERVICES .................................................. 40.7 47.1 52.8 58. 2 63.4 67.9 71.9 75.4 78.6 81.4 84.1 87.0 88.8 91.2 92.9
HOTELS* TOURISTS COURTS, AND MOTELS ................. 57.3 64.8 71.4 77.4 82.5 86.4 89.4 91.5 93.2 94.3 95.3 96.2 96.8 97.6 98.2LAUNDRIES AND DRY CLEANING PLANTS ................... 43.8 52.0 60.8 69.9 77.6 82.5 85.7 87.9 89.6 91.3 92.8 94.5 95.8 97.1 97.8MOTION PICTURES ........................................ 64.8 7C.4 73.8 76.5 78.6 80.7 83.1 84.7 87.0 8 8 . 6 90.0 91.4 92.9 94.3 95.8HOSPITALS ............................................... 25.6 32.0 39.3 48. 0 57.2 65.3 71.9 77.2 81.4 84.4 87.2 90.2 92.4 95.0 96.8
Digitized for FRASER http://fraser.stlouisfed.org/ Federal Reserve Bank of St. Louis
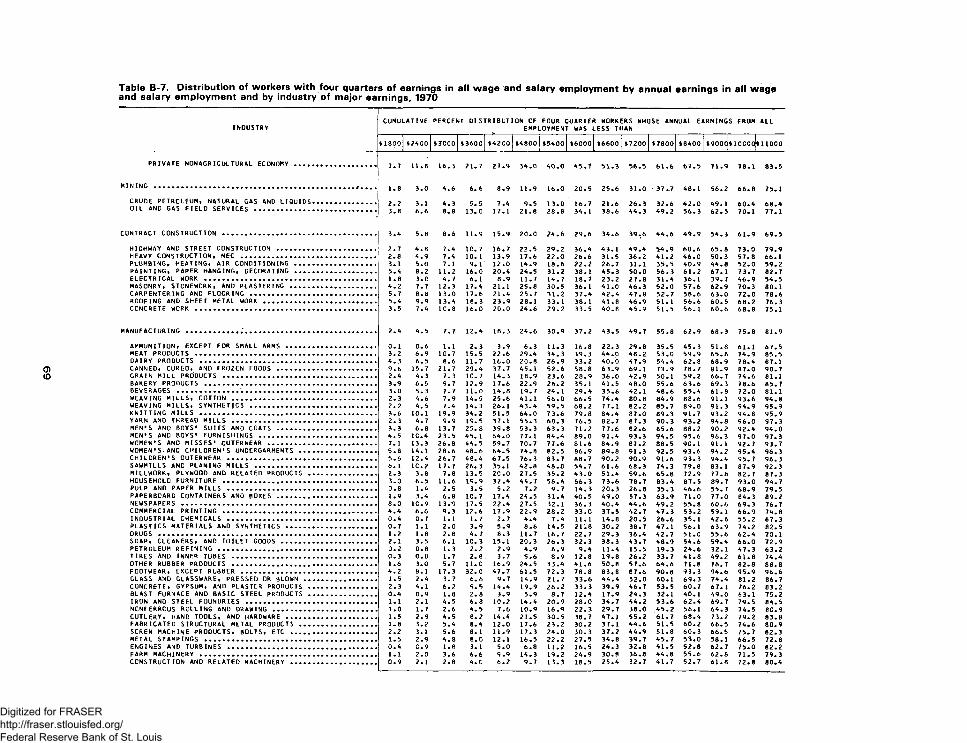
INDUSTRYCUMULATIVE PERCENT DISTRIBUTION OF FOUR QUARTER WORKERS WHOSE ANNUAL EARNINGS FROM
EMPLOYMENT WAS LESS THANALL
$18(30 12A00 $?CC0 $3600 $A2 CO $A800 S5A00 $6000 $6600 $7200 $7800 $8A00 $900C $1CC0C $ 1 1 0 0 0
PRIVATE NONAGRICULTURAL ECONOMY .................... 7.7 1 1 . 8 16.3 21.7 27.9 3A.0 o o A5.7 51.3 56.5 61.6 67.5 71.9 78.1 83.5
MINING ................................................... i . e 3.0 A . 6 6 . 6 8.9 11.9 16.0 20.5 25.6 31.0 37.7 A8.1 56.2 6 6 . 8 75.1
CRUDE PETROLEUM, NATURAL GAS AND LIQUIDS................ 2 . 2 3.1 A.3 5.5 7.A 9.5 13.0 16.7 2 1 . 6 26.3 32.6 A2.0 A9. 1 60.A 6 8 .AOIL AND GAS FIELD SERVICES .............................. 3.8 6 . 6 8 . 8 13.0 17.1 2 1 . 8 28.8 3A • 1 38.6 AA . 3 A9.2 56.3 62.5 70.1 77.1
CONTRACT CONSTRUCTION ...................................... 3.A 5.8 8 . 6 11.9 15.9 2 0 . 0 2A.6 29.6 3A.6 39,6 AA . 6 A9.9 5A.3 61.9 69.5
HIGHWAY AND STREET CONSTRUCTION ......................... 2.7 A . 8 7.A 1C. 7 16.7 22.5 29.2 36.A A3 • 1 A9.A 5A.9 60.6 65.8 73.0 79.9HEAVY CONSTRUCTION, NEC ................................. 2 . 8 A.9 7.A 1 0 . 1 13.9 17.6 2 2 . 0 26.6 31.5 36.2 A 1 . 2 A6.0 50.3 57.8 6 6 . 1PLUMBING, HEATING, AIR CONDITIONING .................... 3.1 5.0 7.1 9. 1 1 2 . 0 1A.9 18.6 2 2 . 2 26.7 31.1 35.5 AO.9 AA . 8 52.0 59.2PAINTING, PAPER HANGING, DECORATING .................... 5.A 8 . 2 1 1 . 2 16.0 2 0 .A 2A.5 31.2 38.1 A5.3 50.0 56.3 61.2 67. 1 73.7 82.7ELECTRICAL WORK ........................................... 1 . 8 3.C A.7 6 . 1 8.9 11.7 l A . 7 18.7 23.2 27.8 31.A 36.1 39.7 A6.9 5A.5MASONRY, STONEWORK, ANO PLASTERING ..................... A.2 7.7 12.3 17.A 2 1 . 1 25.8 30.5 36.1 A 1 . 0 A6.3 52.0 57.6 62.9 70.3 80. 1CARPENTERING AND FLOORING ............................... 5.7 8 . 8 13.0 17.6 2 1 .A 25.7 31.2 37.A A2.A A7.8 52.7 58.6 63.0 72.0 78.6ROOFING AND SHEET METAL WORK ............................ 5.A 9.9 13.A 18.3 23.9 28.1 33.1 38.1 Al . 8 A6.9 51.1 56.6 60.5 6 8 . 2 76.3
3.5 7.A 1C. 8 16.0 2 0 . 0 2A.6 29.2 33.5 AO . 8 A5.9 51.5 56.1 60.6 6 8 . 8 75.1
MANUFACTURING ..............'................................. 2 .A A.5 7.7 1 2 .A 18.3 2A.6 30.9 37.2 A3.5 A9.7 55.8 62.9 68.3 75.8 81.9
AMMUNITION, EXCEPT FOR SMALL ARMS ...................... 0 . 1 0 . 6 1 . 1 2.3 3.9 6.3 11.3 16.8 22.3 29.8 35.5 A5.3 51.8 61.1 67.5MEAT PROOUCTS ............................................. 3.2 6.9 10.7 15.5 2 2 . 6 29.A 3A.3 39.3 AA .0 A8.2 53.0 59.9 65.8 7A.9 85.5DAIRY PRODUCTS ............................................ A.3 6.5 8 . 6 11.7 16.0 2 0 . 8 26.9 33.2 AO.O A7.9 5A.A 62.8 68.9 78.A 87. 1CANNED, CURED, AND FROZEN FOODS ........................ 9.6 15.7 21.7 29. A 37.7 A5.1 52.6 58.8 63.9 69.1 73.9 78.7 81.9 87.0 90.7GRAIN MILL PRODUCTS ........ ............................. 2 .A A.3 7.3 1C.7 1A . 3 18.9 23.6 28.9 36.0 A2.9 50.1 59.2 66.7 7A.6 81.1BAKERY PRODUCTS .......................................... 3.9 6.5 9.7 12.9 17.6 22.9 28.2 35.1 A 1 .5 A8.0 55.6 63.6 69.3 78.6 85.7
3.0 5.3 7.7 1 1 . 0 1A.8 19.7 2A.I 29.A 35.6 A2.1 A8 . 6 55.A 61.8 72.0 81.1WEAVING MILLS, COTTON ................................... 2.3 A . 6 7.9 1A.5 25.6 A 1 . 1 56.0 66.5 7A.A 80.8 8A.9 8 8 . 6 91.1 93.6 9A.8WEAVING MILLS, SYNTHETICS ................................ 2 . 2 A.5 7.A 1A.3 26.1 A3.A 59.5 6 8 . 2 77.1 82.2 85.7 89.0 91.3 9A.9 95.9KNITTING MILLS ............ ................................ 3.6 1 0 . 1 19.9 3A.2 51.5 6A.0 73.6 79.8 8A.A 87.0 89.3 91.7 93.2 9A.8 95.9YARN AND THREAD MILLS .................................... 2.3 A.7 9.9 19.5 37.1 55.3 68.3 76.5 82.7 87.3 90.3 93.2 9A.8 96.0 97.3MEN'S AND BOYS* SUITS AND COATS ......................... 3.3 6 . 8 13.7 25. 8 39.8 53.3 63.3 71.2 77.6 82.6 85.6 8 8 . 2 90.2 92.A 9A.0MEN'S AND BOYS' FURNISHINGS ............................. A.5 1C.A 23.5 A5. 1 6A . 0 77.1 8A.A 89.0 91.A 93.3 9A.5 95.6 96.3 97.0 97.3WOMEN'S AND MISSES' OUTERWEAR ........................... 7. 1 13.3 2 6 . 8 AA. 5 59.7 70.7 77.6 81.6 8A.9 87.2 88.5 90.1 91.1 92.7 93.7WOMEN'S.AND CHILDREN'S UNDERGARMENTS ................... 5.8 1 A • 1 28.6 A8. 6 6A.5 7A.8 82.5 86.9 89.8 91.3 92.5 93.6 9A.2 95.A 96.3CHILDREN'S OUTERWEAR ..................................... 5.6 1 2 .A 26.7 A8. A 67.5 76.3 83.7 88.7 90.2 90.9 91.6 93.3 9A.A 95.7 96.3SAWMILLS AND PLANING MILLS .............................. 6 . 1 1C.2 17.7 26.3 35.1 A2.8 A8 . 8 5A.7 61.6 68.3 7A.3 79.8 83.1 87.9 92.3MILLWORK, PLYWOOD ANO RELATED PROOUCTS ................. 2.3 3.8 7.8 13.5 2 0 . 0 27.5 35.2 A3.0 51.A 59.6 65.8 72.9 77.8 82.7 87.3HOUSEHOLD FURNITURE ...................................... 3.0 6.5 1 1 . 6 19.9 32.A AA.7 56.A 66.3 73.6 78.7 83.A 87.5 89.7 93.0 9A.7PULP AND PAPER MILLS ..................................... 0 . 8 1 • A 2.5 3.5 5.2 7.2 9.7 1A.3 20.3 26.8 35.3 A6 . 6 55.7 68.9 79.5PAPERBOARD CONTAINERS AND BOXES ......................... 1.9 3.A 6 . 8 10.7 17.A 2A.5 31.A AO. 5 A9.0 57.3 63.9 71.0 77.0 8A.3 89.2
8 . 0 1C.9 13.'9 17.5 2 2 .A 27.5 32.1 36.3 AO.A AA . 6 A9.2 55.8 60.6 69.3 76.7COMMERCIAL PRINTING ..................... ....... ........ A.A 6 . 6 9.3 1 2 . 6 17.9 22.9 28.2 33.0 37.5 A2.7 A7.3 53.2 59. 1 66.9 7A.8INDUSTRIAL CHEMICALS ..................................... 0 . A 0.7 1 . 1 1.7 2.7 A.A 7.A 1 1 . 1 1A.8 20.5 26.6 35.1 A2.6 55.2 67.3PLASTICS MATERIALS AND SYNTHETICS ...................... 0.7 1 . 1 2 . 0 3.9 5.9 8 . 6 1A . 5 2 1 . 8 30.2 38.7 A7.1 56.1 63.9 7A.2 82.5
1 . 2 1 . 8 2 . 8 A. 7 8.3 11.7 16.7 22.7 29.3 36.A A2.7 51.0 55.6 62.A 70.1SOAP, CLEANERS, AND TOILET GOODS ........................ 2 . 1 3.5 6 . 1 1C. 3 15.1 20.3 26.3 32.3 38.3 A3.7 A8.9 5A.6 59.A 6 6 . 0 72.9PETROLEUM REFINING ....................................... 0 . 2 0 . 8 1.3 2 . 2 2.9 A.9 6.9 9.A 1 1 .A 15.5 19.3 2A.6 32.1 A7.3 63.2TIRES AND INNER TUBES .................................... 0.3 0 . 8 1.7 2 . 8 3.7 5.6 8.9 1 2 . 8 19.8 26.2 33.7 Al . 8 A9.2 61.8 7A.AOTHER RUBBER PRODUCTS .................................... 1 . 6 3.0 5.7 1 1 . 0 16.9 2A.5 33.A A 1. 6 50.8 57.6 6A . 6 71.8 76.7 82.8 8 8 . 8FOOTWEAR, EXCEPT RUBBER .................................. A.2 8 . 1 17.3 32.0 A7.7 61.5 72.3 78.8 83.8 87.6 90.8 93.3 9A.6 95.9 96.6GLASS AND GLASSWARE, PRESSED OR BLOWN .................. 1.5 2 .A 3.7 6 . 6 9.7 1A.9 21.7 33.6 AA. A 52.8 60.1 69.3 7A.A 81.2 86.7CONCRETE, GYPSUM, AND PLASTER PRODUCTS ................. 2.3 A . 1 6 . 2 9. 5 1A.A 19.9 26.2 33.3 39.9 A6.7 53.5 60.7 67.1 76.2 83.2BLAST FURNACE AND BASIC STEEL PRODUCTS ................. O.A 0.9 1 . 8 2 . 8 3.9 5.9 8.7 1 2 .A 17.9 2A.3 32.1 AO. 1 A9.0 63.1 75.2IRON AND STEEL FOUNDRIES ................................ 1 . 1 2 . 1 A.5 6 . 8 1 0 . 2 IA.A 20.9 28.0 3A.7 AA . 2 53.6 62.A 69.7 79.5 8A.5NCNFERROUS ROLLING ANO DRAWING .......................... 1 . 0 1.7 2 . 6 A.5 7.6 10.9 16.9 22.3 29.7 38.0 A5.2 56.1 6A.3 7A.5 80.9CUTLERY, HAND TOOLS, AND HARDWARE ...................... 1.5 2.9 A.5 8 . 2 IA.A 21.5 30.5 38.7 A7.1 55.2 61.7 6 8 .A 73.2 79.2 83.8FABRICATED STRUCTURAL METAL PRODUCTS ................... 1 . 8 3.2 5.A 8. A 1 2 . 0 17.6 23.2 30.2 37.1 AA . 6 51.5 60.2 66.5 7A.6 80.9SCREW MACHINE PRODUCTS, BOLTS, ETC ..................... 2 . 2 3.1 5.6 8. 1 11.9 17.3 2A.0 30.3 37.2 AA .9 51.8 60.3 66.5 75.7 82.3METAL STAMPINGS ........................................... 1.5 2.9 A . 8 8 . 0 1 2 . 1 16.5 2 2 . 2 27.5 3A.8 39.7 A5.7 53.0 58.1 66.5 72.8ENGINES AND TURBINES ..................................... O.A C.9 1 . 8 3. 1 5.0 6 . 8 1 1 . 2 16.5 2A.3 32.8 A 1 .5 52.8 62.7 75.0 82.2FARM MACHINERY ............................................ 1 . 1 2 . 0 3.6 6 . 6 9.9 1A.3 19.2 2A.9 30.8 36.8 AA . 8 55.6 62.8 71.5 79.3CONSTRUCTION AND RELATED MACHINERY ..................... 0.9 2 . 1 2 . 8 A. C 6 . 2 9.7 13.3 18.5 25.A 32.7 A l. 7 52.7 61.8 72.8 80.A
Digitized for FRASER http://fraser.stlouisfed.org/ Federal Reserve Bank of St. Louis
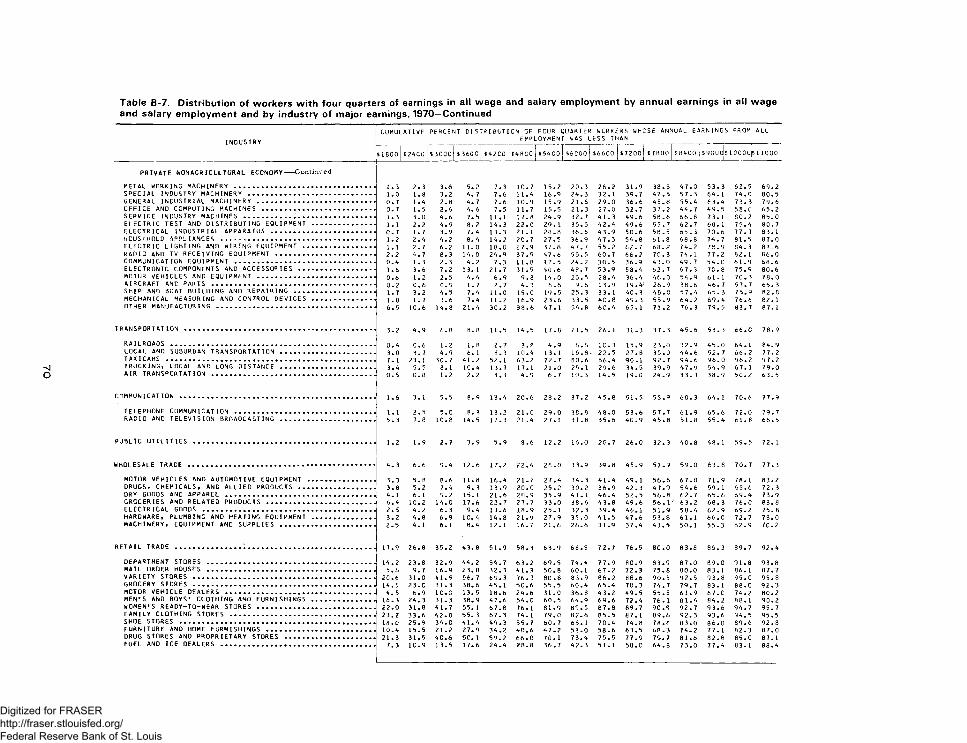
INDUSTRYCUMULATIVE PERCENT DISTRIBUTION OF FOUR QUARTER WORKERS WHOSE ANNUAL EARNINGS FROM
EMPLOYMENT WAS LESS THANALL
$1800 $ 24C0 $ 3CC0 $3600 $42C0 S48C0 $54 CO S6C00 $6600 $7200 $7800 $8400 $9000 o o o o $11000
PRIVATE NONAGRICULTURAL ECONOMY-----Continued
METAL WORKING MACHINERY ....................................................................... 1.3 2.3 3.6 5.2 7.3 10.7 15.2 20.3 26.2 31.9 38.3 47 .0 53.3. 62.5 69.2SPECIAL INDUSTRY MACHINERY ................................................................ 1.0 1.8 3.2 4.7 7.6 11.4 16.9 24.3 32.1 39.7 47.5 57 .3 64.1 7 4 . C 80.5GENERAL INDUSTRIAL MACHINERY ........................................................... 0.7 1.4 2.8 4. 7 7.6 10.9 15.9 21.6 29.0 36.6 45.8 5 5.4 63.4 73.3> 79.6OFFICE AND COMPUTING MACHINES ......................................................... 0.7 1.5 2.6 4. 6 7.5 11.7 15.5 21.3 27.0 32.7 37.2 44 .7 49.5• 5 8 . C 65.2SERVICE INDUSTRY MACHINES ....................... .......................................... 1.3 3.0 4.6 7. 5 11.1 17.8 24.9 32.7 41.3 49.6 58.6 66.8 7 3.1 80.2 85.0ELECTRIC TEST AND DISTRIBUTING EQUIPMENT ................................ 1.1 2.2 4.9 8.2 14.3 22 .0 29.1 35.5 42 .4 49.6 55.7 62 .7 68. 1 75.4 80.7ELECTRICAL INDUSTRIAL APPARATUS .................................................. .. 0 .7 1.7 3.9 7. 4 13.3 21.1 28.8 36.6 43 .9 50.6 58.5 65 .3 70.6 77.3 83. 1HOUSEHOLD APPLIANCES . ....................................................................... 1.2 2.4 4.2 8.4 14.2 2C.7 27.5 36.9 47 .3 54.8 61 .8 68 .8 74.7 81.5 87.0ELECTRIC LIGHTING AND WIRING EQUIPMENT .................................... 1.1 2.7 6.2 11.0 18 .C 27.9 37.8 47. 7 55.2 62.7 68.2 74.2 78.9' 84.3 87.6RADIO AND TV RECEIVING EQUIPMENT ................................................ 2.2 4.7 8.3 14. 0 24.9 37.9 47 .6 55.5 60.7 66.2 70.3 74.1 77.2 82. 1 86.0COMMUNICATION EQUIPMENT ...................................................................... 0.4 1.3 2.3 4. 2 7.3 11.8 17.5 24.2 30.5 36.9 43 .0 49.7 54.0> 61.9 68.6ELECTRONIC COMPONENTS AND ACCESSORIES ...................................... 1.6 3.6 7.2 13. 1 21.7 31.5 40 .6 48 .7 53.9 58.4 62 .7 67.3 70.8, 75.9 80.6MOTOR VEHICLES AND EQUIPMENT ........................................................... 0.6 1.2 2.5 4.4 6.9 9 .8 14.0 20.5 28.4 36.4 46.0 54.9 61.1 7C.3i 78.0AIRCRAFT AND PARTS .................................................................................. 0.2 C.6 C . 9 1.7 2.7 4.3 6.6 9.6 13.9 19.4 1 26.9 38.6 46.7’ 57.7' 65.3SHIP AND BOAT BUILDING AND REPAIRING ......................................... 1.7 3.2 4.5 7.4 11.0 15.0 19.5 25.3 33.1 40.3 48 .0 57.4 65. 3l 75.5i 82.8MECHANICAL MEASURING AND CONTROL DEVICES ................................ 1.0 1.7 3.6 7.4 11.2 16.9 23.6 33.5 40.8 49.3 55.9 64.2 69.4i 76.6i 82.1OTHER MANUFACTURING ................................................................................ 6.5 1C.6 14.8 21.4 30.2 38.6 47.1 54.8 60.4 65.1 71.2 76.3 79.5 83.7' 87. 1
TRANSPORTATION ................................................................................................ 3.2 4.9 6.8 8.8 11.5 14.5 17.8 21.5 26.1 31.3 37.3 45 .6 53.3l 6 6 . C! 78.9
RAILROADS ....................................................................................................... 0 .4 C.6 1.2 1. 8 2.7 3.8 4 .9 6.6 10.3 15.9 23.0 32.9 4 5 . Cl 64.1 84.9LOCAL AND SUBURBAN TRANSPORTATION ................................................ 3.0 3.7 4.9 6. 1 8.3 10.4 13.1 16.8 - 22.5 27.8 35.0 44 .6 52.7’ 66.2' 77.2TAXICABS ......................................................................................................... 7. I 23.1 30. 7 41.2 52.1 63.2 72.7 80.6 86 .4 90.1 92.7 94 .6 9 6 . CI 96.2! 97.2TRUCKING, LOCAL AND LONG DISTANCE ................................................ 3.4 5.5 8.1 1C. 4 13.7 17.1 21.0 25.1 29.6 34.5 39.9 47 .9 54.5i 67. 1 79.0AIR TRANSPORTATION .................................................................................. 0 .5 0.8 1.2 2.2 3.3 4.9 6.7 10.3 14.5 19.0 24.9 33. 3 38.5> 5C.2' 63.5
COMMUNICATION .................................................................................................. 1.6 3.1 5.5 8. 9 13.4 20.6 28.2 37.2 45 .8 51.5 55.9 60 .3 64. 1 70.6i 77.9
TELEPHONE COMMUNICATION ...................................................................... I . I 2.5 5.0 8. 3 13.2 21.0 29.0 38.8 48 .0 53.6 57.7 61 .9 65.6. 7 2 . Cl 79.7RADIO AND TELEVISION BROADCASTING ................................................ 5.3 7.8 1C.8 14. 5 17.3 21.4 27. 1 31.8 35.6 40 .9 45 .8 51.8 55.4- 61.81 66.5
PUBLIC UTIL IT IE S ........................................................................................... 1.2 1.9 2.7 3.9 5.9 8.6 12.2 16.0 20.7 26.0 32.3 o CD 48.1 59.5■ 72. 1
WHOLESALE TRADE .............................................................................................. 4 .3 6.6 9.4 12.6 17.2 22.4 28.0 33.9 39.8 45.9 51. . 9 59.0 63.81 70.7’ 77.3
MOTOR VEHICLES AND AUTOMOTIVE EQUIPMENT .................................. 3.3 5.8 8.6 11.8 16.4 21.2 27.4 34.3 41.4 49.1 56.6 67 .0 71.5i 78. 1 83.2ORUGS, CHEMICALS, AND ALLIED PRODUCTS ...................................... 3.8 5.2 7.4 9. 3 13.9 20 .0 25.2 30.2 36.9 42.3 47 .9 54.6 59.1 65.6i 72.3DRY GOODS ANO APPAREL ..................... ..................................................... 4.1 6.1 9.2 15. 1 21.6 28.9 35.9 41.1 46.4 52.5 56.8 62 .7 65.6. 69.4 73.9GROCERIES AND RELATED PRODUCTS ...................................................... 6.4 10.2 14.0 17.6 22.7 27.7 33.0 38.6 43.8 49.6 56.1 •' 63.2 68.3; 7 6 .Gi 83.8ELECTRICAL GOODS ...................................................................................... 2 .5 4.2 6.3 9.4 13.6 18.9 25.1 32.3 39 .4 46.1 51 .9 58.4 62.9> 69.2 75.8HARDWARE, PLUMBING AND HEATING EQUIPMENT ................................ 3.2 4.8 6.9 IC.4 14.8 21.9 27.9 35.0 41 .5 47.6 53.8 61.1 66.0i 72.7 78.0MACHINERY, EQUIPMENT AND SUPPLIES ................................................ 2.5 4.1 6.1 8.4 12.1 16.7 21.6 26.6 31.9 37.4 43 .5 50. 1 55.3 62.9 7C.2
RETAIL TRADE .................................; ................................................................. 17. <5 26.8 35.2 43.8 51.9 58.3 63 .9 68.5 72.7 76.5 80 .0 83.8 86.3 89. 7 92.4
DEPARTMENT STORES .................................................................................... 14.2 23.8 32.9 44. 2 54.7 63.2 69.5 74.4 77 .9 80.9 83.9 87.0 89.0 91.8 93.fiMAIL ORDER HOUSES .................................................................................... 5.6 9.7 16.9 23. 8 32.3 41 .3 50.8 60.1 67 .2 72.3 75.8 80 .0 83. 1 86. 1 87.7VARIETY STORES ........................................................................................... 20.6 31.0 41 .9 56. 7 69.3 76.3 80.8 83.9 86.2 88.6 90.5 92 .5 93.8i 9 5 . Ci 95.8GROCERY STORES ........................................................................................... 14.5 2 3 .C 31.3 38.6 45.1 50.6 55.5 60 .4 65 .4 70.3 74.7 79.7 83. 1 88.0 92 .3MOTOR VEHICLE DEALERS ........................................................................... 4.5 6.9 1C.0 13.5 18.6 24 .6 31.0 36.8 43 .2 49.5 55.5 61 .9 6 7 . C1 74.2 80.2MEN'S AND BOYS' CLOTHING AND FURNISHINGS ................................ 16.3 24.3 31.3 38.9 47.6 54.0 60.5 64.9 69.6 72.4 76.1 81 .4 84.2 88.1 90.2WOMEN'S READY-TO-WEAR STORES ........................................................... 22.0 31.8 41.7 55. 1 67.8 76.1 81 .9 85.5 87.8 89.7 90.9 92.7 93.6 94.7 95.7FAMILY CLOTHING STORES ......................................................................... 23.2 33.6 42.8 55. 3 67.3 74.1 79.0 82.6 85.5 87. 1 89 .6 92 .3 93.6> 94.5 95.5SHOE STORES .................................................................................................. 18.0 25.9 34.0 41.4 49.3 55.7 60 .7 65. 1 70.4 74.8 78.8 83.0 86.0 89.6. 92.8FURNITURE AND HOME FURNISHINGS ....................................................... 10.4 15.5 21.2 27.9 34.2 40 .6 47 .2 53.0 58.6 63.5 68.3 74.2 77.1 82.3 87.0DRUG STORES AND PROPRIETARY STORES ............................................. 21.3 31.5 4C.6 5C. 1 59.2 66 .0 70.1 73.4 75.5 77.9 79.7 81.6 82.8 8 5 . C 87.1FUEL AND ICE DEALERS ............................................................................. 7.3 1C.9 13.5 17.6 24.4 28.8 36.7 42.3 51.1 58.0 64.8 73.0 77.4 83. 1 88.4
Digitized for FRASER http://fraser.stlouisfed.org/ Federal Reserve Bank of St. Louis
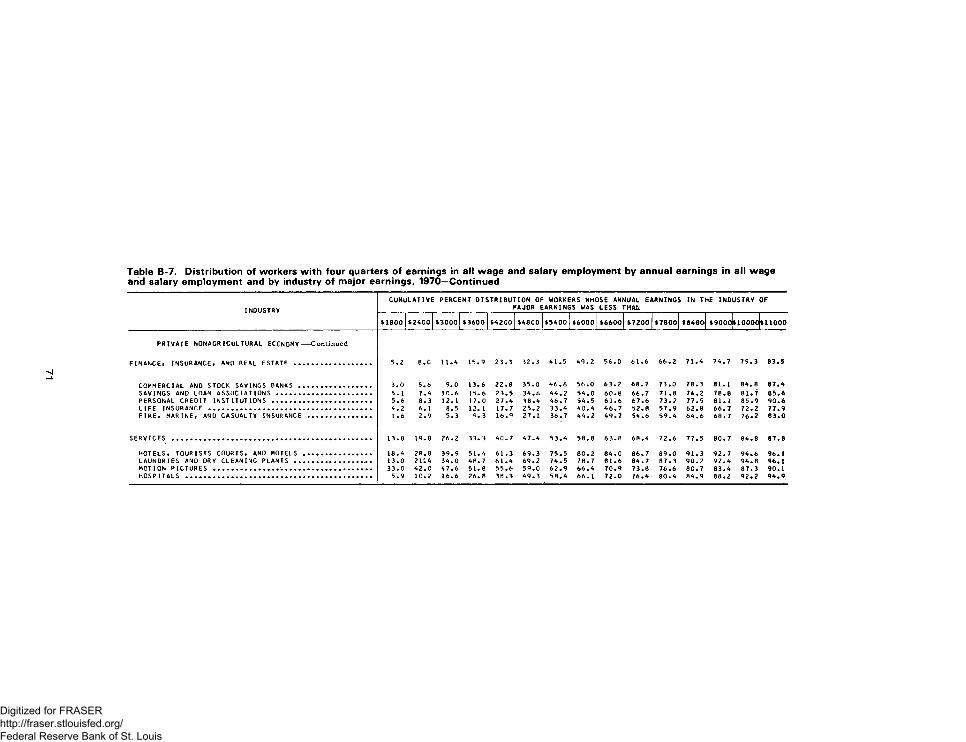
INDUSTRYCUMULATIVE PERCENT DISTRIBUTION OF WORKERS WHOSE ANNUAL. EARNINGS IN THE INDUSTRY
MAJOR EARNINGS WAS LESS THAiiOF
$1800 $2AOO $3000 $3600 $A2C0 $A8C0 $5400|$6000 $6600 $7200 $7800 $8460 $9000 $10000 $11000
PRIVATE NONAGRICUITURAL ECONOMY---- Continued
FINANCE* INSURANCE. AND REAL ESTATE ....................................... 5.2 8.0 1 1 .A 15.9 23.3 32.3 A1.5 A9.2 56 .0 61 .6 66 .2 71 .4 74.7 79.3 83.5
COMMERCIAL AND STOCK SAVINGS BANKS .................................... 3.0 5.6 9.0 13.6 22.8 35.0 A6.8 56 .0 63 .2 68 .7 73.0 78.3 81.1 8A.8 87.4SAVINGS AND LOAN ASSOCIATIONS ............................................... 5. 1 7 . A 10.6 15. 6 23.5 3A.6 A A . 2 54.0 60.8 66.7 71.8 76.2 78.8 81.7 85 .6PERSONAL CREDIT INSTITUTIONS .................................................. 5 .6 8.3 12.1 17.0 2 7 . A 3 8 .A A6.7 5A.5 61 .6 67.6 73.2 77.5 81.1 85 .9 90.6LIFE INSURANCE ................................................................................. A . 2 6.1 8.5 12. 1 17.7 25.2 3 3 . A AO.A 46 .7 52.8 57 .9 62.8 66 .7 72.2 77.9FIRE* MARINE, AND CASUALTY INSURANCE ................................ 1.6 2.9 5.3 9. 3 16.9 27.1 36.7 AA.2 49.7 54.6 59.4 64 .6 68 .7 76.2 83.0
SERVICES .................................................................................................... 13.8 19.8 26.2 33. 3 A C .7 A 7 . A 53 .4 58.8 63.8 68.4 72.6 77.5 80 .7 8A.8 87.8
HOTELS, TOURISTS COURTS, AND MOTELS .................................. 18. A 28.8 39.9 51. A 61.3 - 69.3 75.5 80 .2 84.0 86.7 89 .0 91.3 92 .7 94.6 96.1LAUNDRIES AND DRY CLEANING PLANTS .................................. 13.0 21'. A 3A.0 A8.7 6 1 . A 69.2 74.5 78.7 81.6 84.7 87.3 90 .2 9 2 . A 94.8 96.1MOTION PICTURES ................................ .............................................. 33.0 A2.0 A 7.6 51. 8 55.6 59.0 62 .9 66 .4 70.9 73.8 76.6 80.7 8 3 .A 87.3 90.1HOSPITALS .............................. .............................................................. 5 .9 10.2 16.6 26. 8 38.3 A9.3 58 .4 66.1 72.0 76.4 80 .4 84.9 88 .2 92.2 94 .9
Digitized for FRASER http://fraser.stlouisfed.org/ Federal Reserve Bank of St. Louis
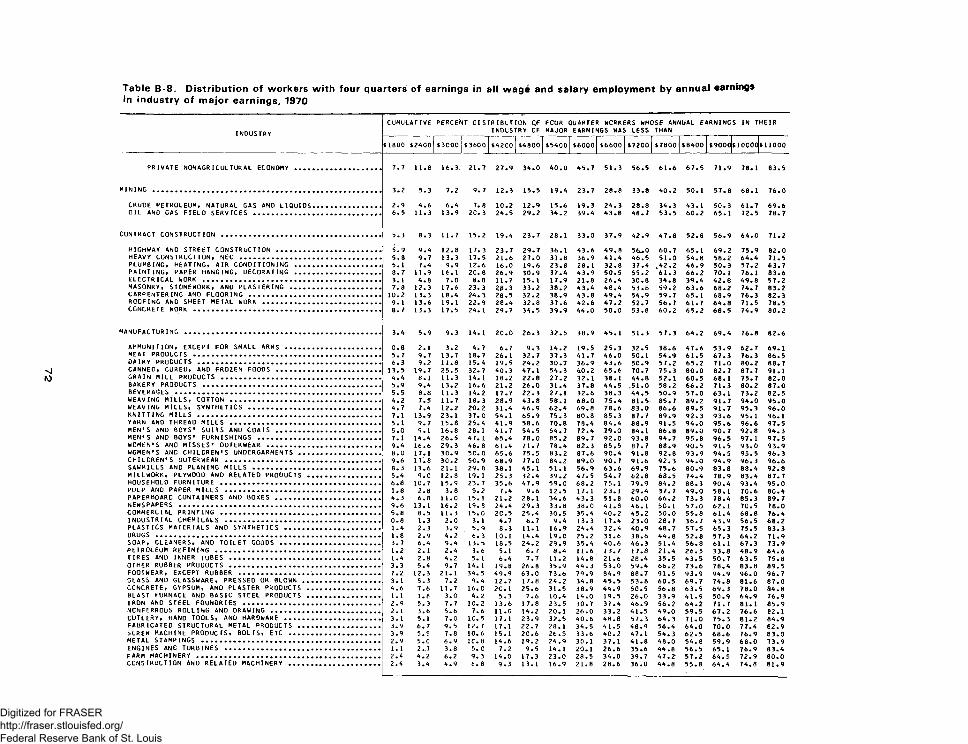
I N D U S T R YC U M U L A T I V E P E R C E N T D I S T R I B U T I O N Q F
I N D U S T R Y C FF O U R Q U A R T E R W O R K E R S W H O S E A N N U A L E A R N I N G S I N T H E I R M A J O R E A R N I N G S W A S L E S S T H A N
$ 1 8 0 0 $ 2 4 0 0 $ 3 0 0 0 j $ 3 6 0 0 $ 4 2 0 0 $ 4 8 0 0 $ 5 4 0 0 $ 6 0 0 0 $ 6 6 0 0 $ 7 2 0 0 $ 7 8 0 0 $ 8 4 0 0 $ 9 0 0 0 $ 1 0 0 0 0 $ 1 1 0 0 0
P R I V A T E N O N A G R I C U L T U R A L E C O N O M Y . . . . . . . . . . . . . . . . . . . . . . . . . . . . . . . . 7 . 7 1 1 . 8 1 6 . 3 . 2 1 . 7 2 7 . 9 3 4 . 0 4 0 . 0 4 5 . 7 5 1 . 3 5 6 . 5 6 1 . 6 6 7 . 5 7 1 . 9 7 8 . 1 8 3 . 5
m i n i n g . . . . . . . . . . . . . . . . . . . . . . . . . . . . . . . . . . . . . . . . . . . . . . . . . . . . . . . . . . . . . . . . . . . . . . . . . . . . . . . . . . . . . . 3 . 2 5 . 3 7 . 2 9 . 7 1 2 . 3 1 5 . 5 1 9 . 4 2 3 . 7 2 8 . 8 3 3 . 8 4 0 . 2 5 0 . 1 5 7 . 8 6 8 . 1 7 6 . 0
C R U D E P E T R O L E U M , N A T U R A L G A S A N D L I Q U I D S . . . . . . . . . . . . . . . . . . . . . . . . . 2 . 9 4 . 6 6 . 4 7 . 8 1 0 . 2 1 2 . 9 1 5 . 6 1 9 . 3 2 4 . 3 2 8 . 8 3 4 . 3 4 3 . 1 5 0 . 3 6 1 . 7 6 9 . 6O I L A N D G A S F I E L D S E R V I C E S . . . . . . . . . . . . . . . . . . . . . . . . . . . . . . . . . . . . . . . . . . . . . . . . 6 . 5 1 1 . 3 1 3 . 9 2 C . 3 2 4 . 5 2 9 . 2 3 4 . 2 3 9 . 4 4 3 . 8 4 8 . 7 5 3 . 5 6 0 . 2 6 5 . 1 7 2 . 5 7 8 . 7
C O N T R A C T C O N S T R U C T I O N . . . . . . . . . . . . . . . . . . . . . . . . . . . . . . . . . . . . . . . . . . . . . . . . . . . . . . . . . . . . 5 . 3 8 . 3 1 1 . 7 1 5 . 2 1 9 . 4 2 3 . 7 2 8 . 1 3 3 . 0 3 7 . 9 4 2 . 9 4 7 . 8 5 2 . 8 5 6 . 9 6 4 . C 7 1 . 2H I G H W A Y A N D S T R E E T C O N S T R U C T I O N . . . . . . . . . . . . . . . . . . . . . . . . . . . . . . . . . . . . . . . 5 . 9 9 . 4 1 2 . 8 1 7 . 3 2 3 . 7 2 9 . 7 3 6 . 1 4 3 . 6 4 9 . 8 5 6 u . O 6 0 . 7 6 5 . 1 6 9 . 2 7 5 . 9 8 2 . 0H E A V Y C O N S T R U C T I O N , N E C . . . . . . . . . . . . . . . . . . . . . . . . . . . . . . . . . . . . . . . . . . . . . . . . . . . . . 5 . 8 9 . 7 1 3 . 3 1 7 . 5 2 1 . 6 2 7 . 0 3 1 . 8 3 6 . 9 4 1 . 4 4 6 . 5 5 1 . 0 5 4 . 8 5 8 . 2 6 4 . 4 7 1 . 5P L U M B I N G , H E A T I N G , A I R C O N D I T I O N I N G . . . . . . . . . . . . . . . * . . . . . . . . . . . . . . 5 . 1 7 . 4 9 . 9 1 2 . 6 1 6 . 0 1 9 . 6 2 3 . 8 2 8 . 1 3 2 . 8 3 7 . 4 , 4 2 . 2 4 6 . 9 5 0 . 3 5 7 . 2 6 3 . 7P A I N T I N G , P A P E R H A N G I N G , D E C O R A T I N G . . . . . . . . . . . . . . . . . . . . . . . . . . . . . . . . 8 . 7 1 1 . 9 1 6 . 1 2 C . 8 2 6 . 9 3 0 . 9 3 7 . 4 4 3 . 9 5 0 . 5 5 5 . 2 6 1 . 3 6 6 . 2 7 0 . 1 7 6 . 1 8 3 . 6E L E C T R I C A L W O R K . . . . . . . . . . . . . . . . . . . . . . . . . . . . . . . . . . . . . . . . . . . . . . . . . . . . . . . . . . . . . . . . . . . 3 . 1 4 . 8 7 . 0 8 . 8 1 1 . 7 1 5 . 1 1 7 . 9 2 1 . 8 2 6 . 4 3 0 . 8 3 4 . 8 3 9 . 4 4 2 . 8 4 9 . 8 5 7 . 2M A S O N R Y , S T O N E W O R K , A N D P L A S T E R I N G . . . . . . . . . . . . . . . . . . . . . . . . . . . . . . . . . . 7 . 8 1 2 . 3 1 7 . 6 2 3 . 3 2 8 . 3 3 3 . 2 3 8 . 2 4 3 . 4 4 8 . 4 5 3 . 8 5 9 . 2 6 3 . 6 6 8 . 2 7 4 . 7 8 3 . 2C A R P E N T E R I N G A N D F L O O R I N G . . . . . . . . . . . . . . . . . . . . . . . . . . . . . . . . . . . . . . . . . . . . . . . . . 1 0 . 2 1 3 . 3 1 8 . 4 2 4 . 3 2 8 . 5 3 2 . 2 3 8 . 9 4 3 . 8 4 9 . 4 5 4 . 9 5 9 . 7 6 5 . 1 6 8 . 9 7 6 . 3 8 2 . 3R O O F I N G A N D S H E E T M E T A L W O R K . . . . . . . . . . . . . . . . . . . . . . . . . . . . . . . . . . . . . . . . . . . . 9 . 1 1 3 . 6 1 9 . 1 2 2 . 9 2 8 . 4 3 2 . 8 3 7 . 6 4 2 . 6 4 7 . 2 5 2 . 7 5 6 . 7 6 1 . 7 6 4 . 8 7 1 . 5 7 8 . 5C O N C R E T E W O R K . . . . . . . . . . . . . . . . . . . . . . . . . . . . . . . . . . . . . . . . . . . . . . . . . . . . . . . . . . . . . . . . . . . . . . 8 . 7 1 3 . 3 1 7 . 5 2 4 . 1 2 9 . 7 3 4 . 5 3 9 . 9 4 4 . 0 5 0 . 0 5 3 . 8 6 0 . 2 6 5 . 2 6 8 . 5 7 4 . 9 8 0 . 2
m a n u f a c t u r i n g . . . . . . . . . . . . . . . . . . . . . . . . . . . . . . . . . . . . . . . . . . . . . . . . . . . . . . . . . . . . . . . . . . . . . . . . . . 3 . A 5 . 9 9 . 3 1 4 . 1 2 0 . 0 2 6 . 3 3 2 . 5 3 8 . 9 4 5 . 1 5 1 . 3 5 7 . 3 6 4 . 2 6 9 . 4 7 6 . 8 8 2 . 6A M M U N I T I O N , E X C E P T F O R S M A L L A R M S . . . . . . . . . . . . . . . . . . . . . . . . . . . . . . . . . . . . 0 . 8 2 . 1 3 . 2 4 . 7 6 . 7 9 . 3 1 4 . 2 1 9 . 5 2 5 . 3 3 2 . 5 3 8 . 6 4 7 . 6 5 3 . 9 6 2 . 7 6 9 . 1M E A T P R O D U C T S . . . . . . . . . . . . . . . . . . . . . . . . . . . . . . . . . . . . . . . . . . . . . . . . . . . . . . . . . . . . . . . . . . . . . 5 . 7 9 . 7 1 3 . 7 1 8 . 7 2 6 . 1 3 2 . 7 3 7 . 3 4 1 . 7 4 6 . 0 5 0 . 1 5 4 . 9 6 1 . 5 6 7 . 3 7 6 . 3 8 6 . 5
6 . 3 9 . 2 1 1 . 8 1 5 . 4 1 9 . 5 2 4 . 2 3 0 . 7 3 6 . 9 4 3 . 6 5 0 . 9 5 7 . 2 6 5 . 2 7 1 . 0 8 0 . 2 8 8 . 7C A N N E D , C U R E D , A N D F R O Z E N F O O D S . . . . . . . . . . . . . . . . . . . . . . . . . . . . . . . . . . . . . . . 1 3 . 5 1 9 . 7 2 5 . 5 3 2 . 7 4 0 . 3 4 7 . 1 5 4 . 3 6 . 0 . 2 6 5 . 6 7 0 . 7 7 5 . 3 8 0 . 0 8 2 . 7 8 7 . 7 9 1 . 1G R A I N M I L L P R O D U C T S . . . . . . . . . . . . . . . . . . . . . . . . . . . . . . . . . . . . . . . . . . . . . . . . . . . . . . . . . . . . 6 . A 8 . 1 1 1 . 3 1 4 . 1 1 8 . 2 2 2 . 8 2 7 . 2 3 2 . 1 3 8 . 1 4 4 . 8 5 2 . 1 6 0 . 5 6 8 . 1 7 5 . 7 8 2 . 0B A K E R Y P R O D U C T S . . . . . . . . . . . . . . . . . . . . . . . . . . . . . . . . . . . . . . . . . . . . . . . . . . . . . . . . . . . . . . . . . . . 5 . 9 9 . 4 1 3 . 2 1 6 . 6 2 1 . 2 2 6 . 0 3 1 . 4 3 7 . 8 4 4 . 5 , 5 1 . 0 5 8 . 2 6 6 . 2 7 1 . 3 8 0 . 2 8 7 . 0
5 . 5 8 . 8 1 1 . 3 1 4 . 2 1 7 . 7 2 2 . 3 2 7 . 1 3 2 . 6 3 8 . 3 4 4 . 5 5 0 . 9 5 7 . 0 6 3 . 1 7 3 . 2 8 2 . 5W E A V I N G M I L L S , C O T T O N . . . . . . . . . . . . . . . . . . . . . . . . . . . . . . . . . . . . . . . . . . . . . . . . . . . . . . . . 4 . 2 7 . 5 1 1 . 7 1 8 . 3 2 8 . 9 4 3 . 8 5 8 . 1 6 8 . 0 7 5 . 4 8 1 . 5 8 5 . 7 8 9 . 2 9 1 . 7 9 4 . 0 9 5 . 0W E A V I N G M I L L S , S Y N T H E T I C S . . . . . . . . . . . . . . . . . . . . . . . . . . . . . . . . . . . . . . . . . . . . . . . . . 4 . 7 7 . 4 1 2 . 2 2 0 . 2 3 1 . 4 4 6 . 9 6 2 . 4 6 9 . 8 7 8 . 6 8 3 . 0 6 6 . 6 8 9 . 5 9 1 . 7 9 5 . 3 9 6 . 0K N I T T I N G M I L L S . . . . . . . . . . . . . . . . . . . . . . . . . . . . . . . . . . . . . . . . . . . . . . . . . . . . . . . . . . . . . . . . . . . . . 7 . 1 1 3 . 9 2 3 . 1 3 7 . 0 5 4 . 1 6 5 . 9 7 5 . 3 8 0 . 8 8 5 . 3 8 7 . 7 8 9 . 9 9 2 . 3 9 3 . 6 9 5 . 1 9 6 . 1Y A R N A N D T H R E A D M I L L S . . . . . . . . . . . . . . . . . . . . . . . . . . . . . . . . . . . . . . . . . . . . . . . . . . . . . . . . 5 . 1 9 . 7 1 5 . 8 2 5 . 4 4 1 . 9 5 8 . 6 7 0 . 8 7 8 . 4 8 4 . 4 8 8 . 9 9 1 . 5 9 4 . 0 9 5 . 6 9 6 . 6 9 7 . 5M E N ' S A N D B O Y S ' S U I T S A N D C O A T S . . . . . . . . . . . . . . . . . . . . . . . . . . . . . . . . . . . . . . . 5 . 0 9 . 1 1 6 . 8 2 8 . 1 4 1 . 7 5 4 . 5 6 4 . 7 7 2 . 4 7 9 . 0 8 4 . 1 8 6 . 8 8 9 . 0 9 0 . 7 9 2 . 8 9 4 . 3M E N ' S A N D B O Y S ' F U R N I S H I N G S . . . . . . . . . . . . . . . . . . . . . . . . . . . . . . . . . . . . . . . . . . . . . . 7 . 1 1 4 . 4 2 6 . 5 4 7 . 1 6 5 . 4 7 8 . 0 8 5 . 2 8 9 . 7 9 2 . 0 9 3 . 8 9 4 . 7 9 5 . 8 9 6 . 5 9 7 . 1 9 7 . 5W O M E N ' S A N D M I S S E S ' O U T E R W E A R . . . . . . . . . . . . . . . . . . . . . . . . . . . . . . . . . . . . . . . . . . 9 . 4 1 6 . 6 2 9 . 3 4 6 . 8 6 1 . 4 7 1 . 7 7 8 . 4 8 2 . 3 8 5 . 5 8 7 . 7 8 8 . 9 9 0 . 5 9 1 . 5 9 3 . 0 9 3 . 9W O M E N ' S A N D C H I L D R E N ' S U N D E R G A R M E N T S . . . . . . . . . . . . . . . . . . . . . . . . . . . . . . . 8 . 0 1 7 . 1 3 0 . 9 5 0 . 0 6 5 . 6 7 5 . 5 8 3 . 2 8 7 . 6 9 0 . 4 9 1 . 8 9 2 . 8 9 3 . 9 9 4 . 5 9 5 . 5 9 6 . 3C H I L D R E N ' S O U T E R W E A R . . . . . . . . . . . . . . . . . . . . . . . . . . . . . . . . . . . . . . . . . . . . . . . . . . . . . . . . . . 9 . 6 1 7 . 8 3 0 . 2 5 0 . 9 6 8 . 9 7 7 . 0 8 4 . 2 8 9 . 0 9 0 . 7 9 1 . 6 9 2 . 3 9 4 . 0 9 4 . 9 9 6 . 3 9 6 . 6S A W M I L L S A N D P L A N I N G M I L L S . . . . . . . . . . . . . . . . . . . . . . . . . . . . . . . . . . . . . . . . . . . . . . . . 8 . 3 1 3 . 6 2 1 . 1 2 9 . 8 3 8 . 1 4 5 . 1 5 1 . 1 5 6 . 9 6 3 . 6 6 9 . 9 7 5 . 6 8 0 . 9 8 3 . 8 8 8 . 4 9 2 . 8M I L L W O R K , P L Y W O O D A N D R E L A T E D P R O D U C T S . . . . . . . . . . . . . . . . . . . . . . . . . . . 5 . 4 9 . 0 1 2 . 8 1 9 . 1 2 5 . 3 3 2 . 4 3 9 . 2 4 7 . 5 5 4 . 7 6 2 . 8 6 8 . 5 7 4 . 4 7 8 . 9 8 3 . 4 8 7 . 7H O U S E H O L D F U R N I T U R E . . . . . . . . . . . . . . . . . . . . . . . . . . . . . . . . . . . . . . . . . . . . . . . . . . . . . . . . . . . . 6 . 8 1 0 . 7 1 5 . 9 2 3 . 7 3 5 . 6 4 7 . 9 5 9 . 0 6 8 . 2 7 5 . 1 7 9 . 9 8 4 . 2 8 8 . 3 9 0 . 4 9 3 . 4 9 5 . 0P U L P A N D P A P E R M I L L S . . . . . . . . . . . . . . . . . . . . . . . . . . . . . . . . . . . . . . . . . . . . . . . . . . . . . . . . . . 1 . 8 2 . 8 3 . 8 5 . 2 7 . 4 9 . 6 1 2 . 5 1 7 . 1 2 3 . 1 2 9 . 4 3 7 . 7 4 9 . 0 5 8 . 1 7 0 . 6 8 0 . 4P A P E R B O A R D C O N T A I N E R S A N D B O X E S . . . . . . . . . . . . . . . . . . . . . . . . . . . . . . . . . . . . . . . 4 . 3 6 . 8 1 1 . 0 1 5 . 1 2 1 . 2 2 8 . 1 3 4 . 6 4 3 . 3 5 1 . 8 6 0 . 0 6 6 . 2 7 3 . 3 7 8 . 4 8 5 . 3 8 9 . 7
9 . 6 1 3 . 1 1 6 . 2 1 9 . 8 2 4 . 4 2 9 . 3 3 3 . 8 3 8 . 0 4 1 . 8 4 6 . 1 5 0 . 1 5 7 . 0 6 2 . 1 7 0 . 5 7 8 . 0C O M M E R C I A L P R I N T I N G . . . . . . . . . . . . . . . . . . . . . . . . . . . . . . . . . . . . . . . . . . . . . . . . . . . . . . . . . . . . 5 . 8 8 . 5 1 1 . 3 1 5 . 0 2 0 . 5 2 5 . 4 3 0 . 5 3 5 . 4 4 0 . 2 4 5 . 2 5 0 . 0 5 5 . 8 6 1 . 4 6 8 . 8 7 6 . 4
I N D U S T R I A L C H E M I C A L S . . . . . . . . . . . . . . . . . . . . . . . . . . . . . . . . . . . . . . . . . . . . . . . . . . . . . . . . . 0 . 8 1 . 3 2 . 0 3 . 1 4 . 7 6 . 7 9 . 4 1 3 . 3 1 7 . 4 2 3 . 0 2 8 . 7 3 6 . 7 4 3 . 9 5 6 . 5 6 8 . 2P L A S T I C S M A T E R I A L S A N D S Y N T H E T I C S . . . . . . . . . . . . . . . . . . . . . . . . . . . . . . . . . . . . 1 . 4 2 . 3 3 . 9 5 . 9 8 . 3 1 1 . 1 1 6 . 9 2 4 . 4 3 2 . 4 4 0 . 9 4 8 . 7 5 7 . 5 6 5 . 3 7 5 . 5 8 3 . 3
1 . 8 2 . 9 4 . 2 6 . 3 1 0 . 1 1 4 . 4 1 9 . 0 2 5 . 2 3 1 . 6 3 8 . 6 4 4 . 8 5 2 . 8 5 7 . 3 6 4 . 2 7 1 . 9S O A P , C L E A N E R S , A N D T O I L E T G O O D S . . . . . . . . . . . . . . . . . . . . . . . . . . . . . . . . . . . . 3 . 7 6 . 4 9 . 4 1 3 . 5 1 8 . 5 2 4 . 2 2 9 . 9 3 5 . 4 4 0 . 6 4 6 . 3 5 1 . 4 5 6 . 8 6 1 . 1 6 7 . 3 7 3 . 9P E T R O L E U M R E F I N I N G . . . . . . . . . . . . . . . . . . . . . . . . . . . . . . . . . . . . . . . . . . . . . . . . . . . . . . . . . . . . . 1 . 2 2 . 1 2 . 4 3 . 6 5 . 1 6 . 7 8 . 4 1 1 . 6 1 3 . 7 1 7 . 8 2 1 . 4 2 6 . 5 3 3 . 8 4 8 . 9 6 4 . 6T I R E S A N D I N N E R T U B E S . . . . . . . . . . . . . . . . . . . . . . . . . . . . . . . . . . . . . . . . . . . . . . . . . . . . . . . . 1 . 4 2 . 8 4 . 2 5 . 1 6 . 4 7 . 7 1 1 . 2 1 4 . 8 2 1 . 6 2 8 . 4 3 5 . 5 4 3 . 5 5 0 . 7 6 3 . 5 7 5 . 8O T H E R R U B B E R P R O D U C T S . . . . . . . . . . . . . . . . . . . . . . . . . . . . . . . . . . . . . . . . . . . . . . . . . . . . . . . . 3 . 3 5 . 4 9 . 7 1 4 . 1 1 9 . 8 2 6 . 8 3 5 . 9 4 4 . 3 5 3 . 0 5 9 . 4 6 6 . 2 7 3 . 6 7 8 . 4 8 3 . 8 8 9 . 5F O O T W E A R , E X C E P T R U B B E R . . . . . . . . . . . . . . . . . . . . . . . . . . . . . . . . . . . . . . . . . . . . . . . . . . . . 7 . 2 1 2 . 3 2 1 . 1 3 4 . 5 4 9 . 9 6 3 . 0 7 3 . 6 7 9 . 9 8 4 . 9 8 8 . 7 9 1 . 5 9 3 . 9 9 4 . 9 9 6 . 0 9 6 . 7G L A S S A N D G L A S S W A R E , P R E S S E D O R B L O W N . . . . . . . . . . . . . . . . . . . . . . . . . . . . . 3 . 1 5 . 3 7 . 2 9 . 4 1 2 . 7 1 7 . 8 2 4 . 2 3 4 . 8 4 5 . 5 5 3 . 8 6 0 . 5 6 9 . 7 7 4 . 8 8 1 . 6 8 7 . 0C O N C R E T E , G Y P S U M , A N D P L A S T E R P R O D U C T S . . . . . . . . . . . . . . . . . . . . . . . . . . . 4 . 6 7 . 6 1 1 . 7 1 6 . 0 2 0 . 1 2 5 . 6 3 1 . 5 3 8 . 9 4 4 . 9 5 0 . 5 5 6 . 8 6 3 . 5 6 9 . 3 7 8 . 0 8 4 . 8B L A S T F U R N A C E A N D B A S I C S T E E L P R O D U C T S . . . . . . . . . . . . . . . . . . . . . . . . . . . 1 . 1 1 . 8 3 . 0 4 . 2 5 . 3 7 . 6 1 0 . 4 1 4 . 0 1 9 . 5 2 6 . 0 3 3 . 9 4 1 . 9 5 0 . 9 6 4 . 9 7 6 . 9I R O N A N D S T E E L F O U N D R I E S . . . . . . . . . . . . . . . . . . . . . . . . . . . . . . . . . . . . . . . . . . . . . . . . . . . 2 . 9 5 . 3 7 . 7 1 0 . 2 1 3 . 6 1 7 . 8 2 3 . 5 3 0 . 7 3 7 . 4 4 6 . 9 5 6 . 2 6 4 . 2 7 1 . 7 8 1 . 1 8 5 . 9
N C N F E R R O U S R O L L I N G A N D D R A W I N G . . . . . . . . . . . . . . . . . . . . . . . . . . . . . . . . . . . . . . . . . 2 . 1 3 . 6 5 . 6 7 . 6 1 1 . 0 1 4 . 2 2 0 . 1 2 6 . 0 3 3 . 2 4 1 . 5 4 9 . 0 5 9 . 5 6 7 . 2 7 6 . 6 8 2 . 1C U T L E R Y , H A N D T O O L S , A N D H A R D W A R E . . . . . . . . . . . . . . . . . . . . . . . . . . . . . . . . . . . . 3 . 1 5 . 1 7 . 0 1 C . 5 1 7 . 1 2 3 . 9 3 2 . 5 4 0 . 6 4 8 . 8 5 7 . 3 6 4 . 3 7 1 . 0 7 5 . 3 8 1 . 2 8 4 . 9F A B R I C A T E D S T R U C T U R A L M E T A L P R O D U C T S . . . . . . . . . . . . . . . . . . . . . . . . . . . . . . . 3 . 9 6 . 7 9 . 5 1 2 . 7 1 7 . 1 2 2 . 7 2 8 . 1 3 4 . 5 4 1 . 5 4 8 . 9 5 6 . 4 6 4 . 0 7 0 . 0 7 7 . 4 8 2 . 9S C R E W M A C H I N E P R O D U C T S , B O L T S , E T C . . . . . . . . . . . . . . . . . . . . . . . . . . . . . . . . . 3 . 9 5 . 5 7 . 8 1 0 . 6 1 5 . 1 2 0 . 6 2 6 . 5 3 3 . 6 4 0 . 2 4 7 . 1 5 4 . 3 6 2 . 5 6 8 . 6 7 6 . 9 8 3 . 0M E T A L S T A M P I N G S . . . . . . . . . . . . . . . . . . . . . . . . . . . . . . . . . . . . . . . . . . . . . . . . . . . . . . . . . . . . . . . . . . . 2 . 9 5 . C 6 . 9 1 C . 8 1 4 . 6 1 9 . 2 2 4 . 9 3 0 . 1 3 7 . 1 4 1 . 8 4 8 . 0 5 4 . 8 5 9 . 9 6 8 . 0 7 3 . 9E N G I N E S A N D T U R B I N E S . . . . . . . . . . . . . . . . . . . . . . . . . . . . . . . . . . . . . . . . . . . . . . . . . . . . . . . . . . 1 . 1 2 . 7 3 . 8 5 . 0 7 . 2 9 . 5 1 4 . 1 2 0 . 1 2 6 . 6 3 5 . 6 4 4 . 8 5 6 . 5 6 5 . 1 7 6 . 9 8 3 . 4
2 . 4 4 . 2 6 . 2 9 . 3 1 4 . 0 1 7 . 3 2 3 . 0 2 8 . 5 3 4 . 0 3 9 . 7 4 7 . 2 5 7 . 2 6 4 . 5 7 2 . 9 8 0 . 0C O N S T R U C T I O N A N D R E L A T E D M A C H I N E R Y . . . . . . . . . . . . . . . . . . . . . . . . . . . . . . . . . . 2 . 4 3 . 4 4 . 9 6 . 8 9 . 3 1 3 . 1 1 6 . 9 2 1 . 8 2 8 . 6 3 6 . 0 4 4 . 8 5 5 . 8 6 4 . 4 7 4 . 8 8 1 . 9
Digitized for FRASER http://fraser.stlouisfed.org/ Federal Reserve Bank of St. Louis
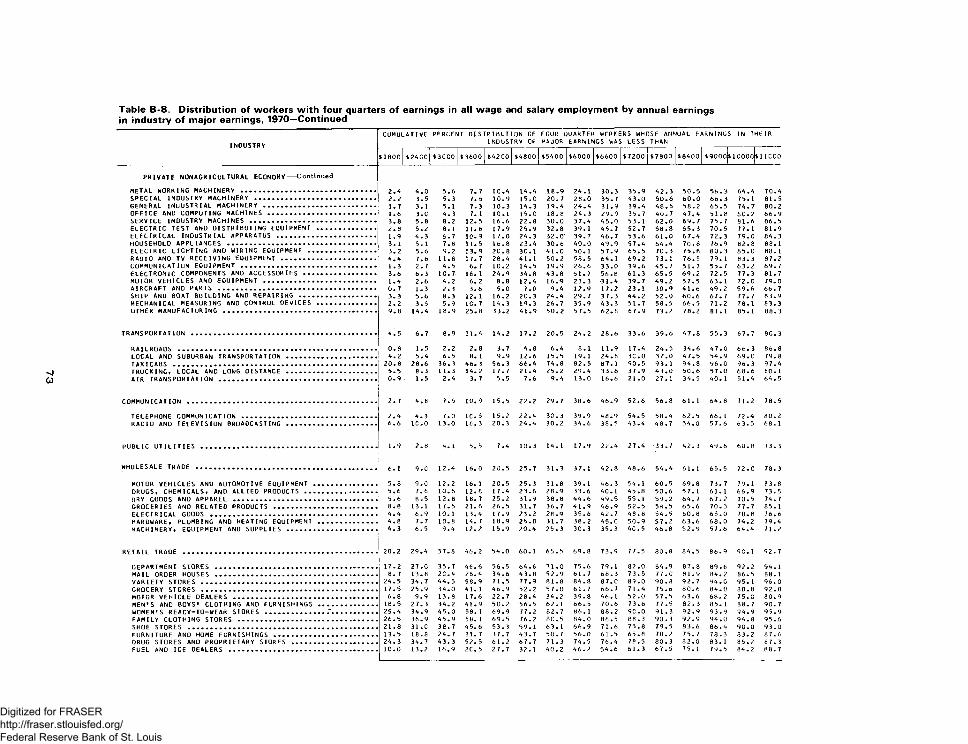
INDUSTRY
CUMULATIVE PERCENT DISTRIBUTION OF INDUSTRY OF
FOUR QUARTER WORKERS WHOSE ANNUAL EARNINGS MAJOR EARNINGS WAS LESS THAN
IN THEIR
$1800 $2ACC $3CC0 $3600 $A2 CO $A800 $5A00 $6000 $6600 $7200 $7800 $ 8A00 $ 9000|$ 1C00C S11CC0
PRIVATE NONAGRICULTURAL ECONOMY---- Continued
METAL WORKING MACHINERY .................................................................... 2 . A A . 0 5.6 7. 7 IC .A l A . A 18.9 2A.1 30.3 35.9 A2.3 50.5 56 .3 6A.A 7 0 .ASPECIAL INDUSTRY MACHINERY ............................................................. 2 .2 3.5 5.3 7.6 10.9 15.0 20 .7 28.0 35.7 A3.0 50 .6 60 .0 66 ,3 75. 1 81.5GENERAL INDUSTRIAL MACHINERY ........................................................ 1.7 3.1 5. 1 7.3 10.3 1A . 3 19. A 2A.A 31.9 3 9 .A A8.6 58.2 65.5 7A.7 80.2OFFICE AND COMPUTING MACHINES ...................................................... 1.6 3.0 A. 3 7. 1 10.1 15.0 18.8 2 A . 3 29.9 35.7 A O .7 A7.A 51.8 6 C . 2 66.9SERVICE INDUSTRY MACHINES ............................................................... 3 .8 5.8 8.2 12.5 16.6 22.8 30.0 3 7 . A A5.0 53.1 62 .0 69 .7 75.7 81.6 86.5ELECTRIC TEST AND DISTRIBUTING EQUIPMENT .............................. 2.8 5.2 8.1 11.6 17.9 25.9 32.8 39.1 A5.7 52.7 58.8 65.3 70.5 77. 1 81.9ELECTRICAL INDUSTRIAL APPARATUS .................................................. 1.9 A . 3 6.7 10. 9 17.0 2A.3 32.0' 39.7 A6.7 53.6 61 .0 6 7 . A 72.3 79.0 8A.3HOUSEHOLD APPLIANCES .......................................................................... 3. 1 5.1 7.8 11.5 16.8 2 3 .A 30.6 AO . 0 A9.9 5 7 .A 6A .A 70.8 76 .9 82.8 88.1ELECTRIC LIGHTING AND WIRING EQUIPMENT .................................. 3.2 5.6 9.2 13.9 20 .8 30.1 A 1.0 50. 1 57.9 65 .5 70.3 75.8 80 .3 85.0 88. 1RADIO AND TV RECEIVING EQUIPMENT ............................................... A. A 7.6 11.8 17. 7 2 8 .A A l . 1 50.2 58.5 6 A . 1 69 .2 73.1 76.5 79. 1 83.3 87.2COMMUNICATION EQUIPMENT .................................................................... 1.3 2.7 A . 5 6. 7 1C.2 1A.5 19.9 26.6 33.0 39.6 A5.7 51.7 55 .7 63.2 69.7ELECTRONIC COMPONENTS AND ACCESSORIES .................................... 3.6 6.3 1C.7 16. 1 2 A . 9 3 A . 8 A3.8 51.7 56.8 61.3 65 .5 69 .2 72.5 77.3 81.7MOTOR VEHICLES AND EQUIPMENT ........................................................ I • A 2.6 A . 2 6. 2 8.8 1 2 .A 16.9 23.3 31. A 39.7 A9.2 57.5 63.1 72.0 79.0AIRCRAFT AND PARTS ............................................................................... 0 .7 1.3 2.3 3.6 5.0 7.0 9 . A 12.9 17.2 23.1 30.9 A 1.6 A9.2 59.6 66.7SHIP AND BOAT BUILDING AND REPAIRING ....................................... 3 .3 5.6 8.3 12. 1 16.2 20.3 2A.A 29.7 37.3 AA.2 52 .0 60 .6 67 .7 77.7 83.9MECHANICAL MEASURING AND CONTROL DEVICES .............................. 2 .2 3.5 5.9 IC.7 IA .3 19.3 26.7 35.9 A3.3 51.7 58.5 66 .5 71.2 78.1 83.3OTHER MANUFACTURING ............................................................................ 9 .8 1A.A 18.9 25.8 33.2 A 1.9 50 .2 57.5 62.8 67.9 73.2 78.2 81.1 85.1 88.3
TRANSPORTATION ............................................................................................ A . 5 6.7 8.9 11. A 1A . 2 17.2 20.5 2A. 2 28.6 33.6 39.6 A7.8 55.3 67.7 80.3
RAILROADS .................................................................................................... 0.8 1.5 2.2 2.8 3.7 A . 8 6 . A 8.1 11.9 17 .A 2A.5 3A.6 A7.0 66.3 86.8LOCAL AND SUBURBAN TRANSPORTATION ............................................. A . 2 5 . A 6.5 8. 1 9.9 12.6 15.5 19.1 2A.8 3C.0 37.0 A7.5 5 A . 9 69.0 79.8t a x i c a b s ...................................................................................................... 20 .8 28.6 36.3 A6.3 56 .3 66 . A 7A.8 82.5 87. 1 90.5 93.1 9A.8 96 .0 96.3 97. ATRUCKING, LOCAL AND LONG DISTANCE .......................................... . . 5.5 8.3 11.3 1A. 2 17.7 2 1 . A 25.2 29. A 33.6 37.9 A 3.0 50.6 57.0 68 .6 80.1AIR TRANSPORTATION ............................................................................... 0 .9 1.5 2 . A 3.7 5.5 7.6 9 . A 13.0 16.6 21.0 27.1 3 A . 5 AO. 1 5 1 . A 6A.5
COMMUNICATION ............................................................................................... 2 .7 A . 8 7.5 10.9 15.5 22.2 29.7 38.6 A6.9 52.6 56.8 61.1 6A.8 71.2 78.5
TELEPHONE COMMUNICATION .................................................................... 2. A A . 3 7.0 1C.5 15.2 2 2 . A 30.3 39.9 A8.9 5A.5 5 8 . A 62.5 66.1 72 .A 80.2RADIO AND TELEVISION BROADCASTING ............................................. 6 .6 1C.0 13.0 16. 3 20.3 2A.A 30.2 3 A . 6 38.5 A3 .A A 8 .7 5 A . 0 57.6 63.5 68. 1
PUBLIC UTIL IT IES ............................................................................... .. 1.9 2.8 A. 1 5. 5 7 . A 10.3 l A . 1 17.9 2 2 .A 2 7 .A 33.7 A2.3 A9.6 60.8 73.3
WHOLESALE TRACE .......................................................................................... 6. 1 9 . C 12 .A 16. C 20.5 25.7 31.3 37. 1 A2.8 A8.6 5A.A 61.1 65.5 7 2 . C 78.3
MOTOR VEHICLES AND AUTOMOTIVE EQUIPMENT ................................ 5 .8 9.0 12.2 16. 1 20.5 25.3 31.8 39.1 A6.3 5A.1 60 .5 69.8 73.7 79.1 83.8DRUGS, CHEMICALS, AND ALLIED PRODUCTS .................................... 5.6 7.6 10.6 12. 8 1 7 .A 23.6 28.9 33.6 AO. 1 A5.8 50.6 57.1 61.1 66.9 73.5dry gooos ano APPAREL ........................................................................ 5.6 8.5 12.8 18. 7 25.2 31.9 38 .8 AA.6 A9.5 55.1 59 .2 6A.7 67 .2 70.5 7A.7GROCERIES AND RELATED PRODUCTS .................................................... 8.8 13.1 17.5 21.6 26.5 31.7 36.7 A 1.9 A6.9 52.5 58.5 65.6 70.3 77.7 85. 1ELECTRICAL GOODS ................................................................................... A.A 6.9 10. 1 13. A 17.9 23.2 28.9 35.6 A2.7 A8.8 5A.5 60.8 65 .0 70.8 76.6HARDWARE, PLUMBING AND HEATING EQUIPMENT .............................. A . 8 7.7 10.8 1 A. 7 18.9 25.8 31.7 38.2 A5.0 50.9 57.2 63 .6 68 .0 7A.2 7 9 .AMACHINERY, EQUIPMENT AND SUPPLIES ............................................. A . 3 6.5 9 . A 12.2 15.9 2 0 .A 25.3 30.3 35.3 AO.5 A6.8 52.9 57.6 6 A . A 71.2
RETAIL TRADE ................................................................................................. 20.2 2 9 .A 37.8 A6. 2 5A.0 60.1 65.5 69.8 73.9 77.5 80.8 8A.5 86 .9 90. 1 92.7
DEPARTMENT STORES ................................................................................. 17.2 27.0 35.7 A6.6 56.5 6A.6 71 .0 75.6 79.1 82.0 8A.9 87.8 89.6 92.2 9 A . 1MAIL ORDER HOUSES ................................................................................. 8 .7 13.8 2C.A 26. A 3A.6 A3.8 52 .9 61 .7 68 .3 73 .5 77.0 81.9 8 A . 2 86.5 88.1VARIETY STORES ........................................................................................ 2A.5 3A.7 A A . 5 58.9 71.5 77.9 81 .8 8 A . 8 87.0 89.0 90 .8 92 .7 9 A . 0 95. 1 96.0GROCERY STORES ........................................................................................ 17.5 25.9 3 A . 0 A l . 1 A6.9 52.2 57.0 61.7 66 .7 7 1 .A 75.6 80.6 8 A . 0 88.8 92.8MOTOR VEHICLE DEALERS ........................................................................ 6 .8 9.9 13.8 17.6 22 .7 2 8 .A 3A.2 39.8 A6.1 52.0 57.5 63 .6 68 .2 75.0 80.9MEN* S AND BOYS' CLOTHING AND FURNISHINGS .............................. 18.5 27.3 3A.2 A l . 9 50.2 56.5 62. 1 66.5 70 .6 73.6 77.5 82.3 85. 1 88.7 90.7WOMEN'S READY-TO-WEAR STORES ............................. .......................... 2 5 . A 3A.9 A 5.0 58. 1 69 .9 77.2 82.7 86.1 88.2 90.0 91.3 92.9 93.9 9 A . 9 95.9FAMILY CLOTHING STORES ...................................................................... 26.5 36.9 A 5.9 58. 1 69.5 76.2 80.5 8 A . 0 86.5 es .3 90 .3 92 .9 9A.0 9 A . 8 95.6SHOE STORES ............................................................................................... 21.8 31 .C 38.7 A5. 6 53.3 59. 1 63.1 66 .9 71.6 75.8 79.5 83.6 86. A 90.0 93.0FURNITURE AND HOME FURNISHINGS .................................................... 13.5 18.8 2 A . 7 31.7 37.7 A3.7 50.7 56.0 61.5 65.8 70.2 75.7 78.3 83.2 87.6Drug s t o r e s and p r o p r i e t a r y sto res ........................................... 2A.3 3A.7 A3.3 52.5 61.2 67.7 71 .3 7 A . 5 76. A 78.5 80.3 82.0 83.1 85.2 87.3FUEL AND ICE DEALERS .......................................................................... 10.0 13.2 16.9 2C. 5 27.7 32.1 AO.2 A 6 . 2 5 A . 6 61 .3 67.5 75. 1 79.5 8A.2 88.7
Digitized for FRASER http://fraser.stlouisfed.org/ Federal Reserve Bank of St. Louis
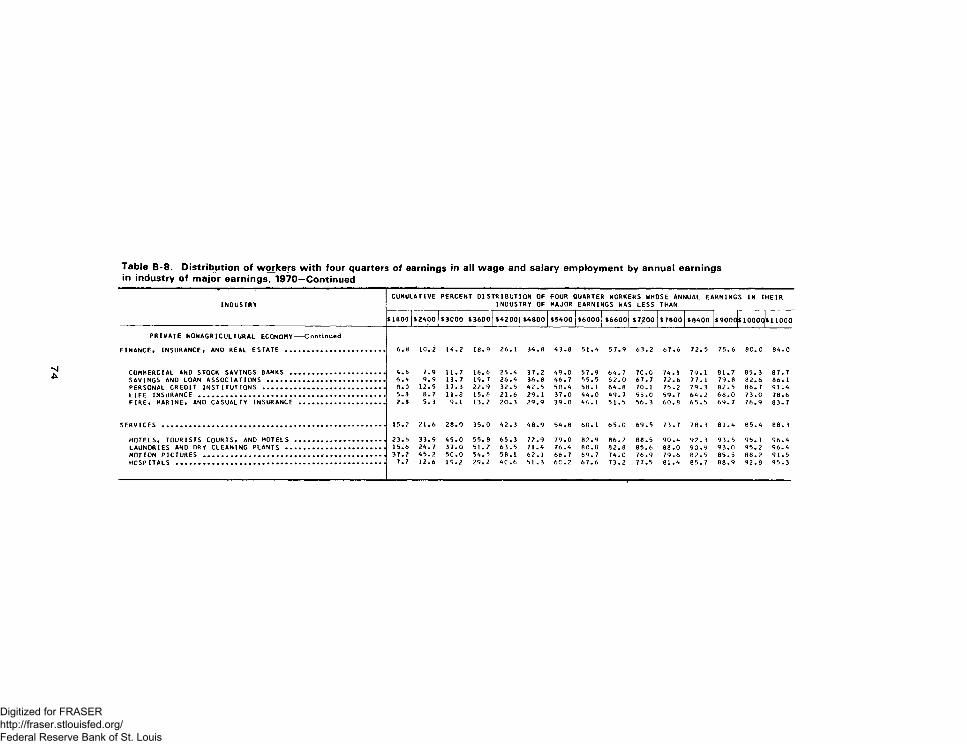
INDUSTRYCUMULATIVE PERCENT DISTRIBUTION OF
INDUSTRY OFFOURMAJOR
QUARTER WORKERS WHOSE ANNUAL EARNINGS IN THEIR EARNINGS WAS LESS THAN
$1800 $2400|$3000 $3600 $4200|$4800 $5400 | $6000 $6600 $7200 $7800 $8400 <o o o $ 1 0 0 0 0 $ 1 1 0 0 0
PRIVATE NONAGRICULTURAL ECONOMY ------Continued
FINANCE, INSURANCE, AND REAL ESTATE ......................... 6 . 8 1 0 . 2 1 4 . 2 1 8 . 9 2 6 . 1 3 4 . 8 4 3 . 8 5 1 . 4 5 7 . 9 6 3 . 2 6 7 . 6 7 2 . 5 7 5 . 6 8 0 . 0 8 4 . 0
COMMERCIAL AND STOCK SAVINGS BANKS ........................ 4 . 6 7 . 9 1 1 . 7 1 6 . 6 2 5 . 4 3 7 . 2 4 9 . 0 5 7 . 9 6 4 . 7 7 0 . 0 7 4 . 1 7 9 . 1 8 1 . 7 8 5 . 3 8 7 . 7SAVINGS AND LOAN ASSOCIATIONS ............................. 6 . 4 9 . 9 1 3 . 7 1 9 . 7 2 6 . 4 3 6 . 8 4 6 . 7 5 5 . 5 6 2 . 0 6 7 . 7 7 2 . 6 7 7 . 1 7 9 . 8 8 2 . 6 8 6 . 1PERSONAL CREDIT INSTITUTIONS .............................. 8 . 0 1 2 . 5 1 7 . 3 2 2 . 9 3 2 . 5 4 2 . 5 5 0 . 4 5 8 . 1 6 4 . 8 7 0 . 1 7 5 . 2 7 9 . 3 8 2 . 5 8 6 . 7 9 1 . 4LIFE INSURANCE .............................................. 5 . 8 8 . 7 1 1 . 8 1 5 . 6 2 1 . 6 2 9 . 1 3 7 . 0 4 4 . 0 4 9 . 7 5 5 . 0 5 9 . 7 6 4 . 2 6 8 . 0 7 3 . 0 7 8 . 6FIRE, MARINE, AND CASUALTY INSURANCE ..................... 2 . 8 5 . 3 9 . 1 1 3 . 2 2 0 . 3 2 9 . 9 3 9 . 0 4 6 . 1 5 1 . 5 5 6 . 3 6 0 . 8 6 5 . 5 6 9 . 7 7 6 . 9 8 3 . 7
^ F f t y i r F s . . ................ .............. ........................ ................................................................... r ................................................ ..... 1 5 . 2 2 1 . 6 2 8 . 0 3 5 . 0 4 2 . 3 4 8 . 9 5 4 . 8 6 0 . 1 6 5 . 0 6 9 . 5 7 3 . 7 7 8 . 3 8 1 . 4 8 5 . 4 8 8 . 3
HOTELS, TOURISTS COURTS, AND MOTELS ....................... 2 3 . 6 3 3 . 9 4 5 . 0 5 5 . 8 6 5 . 3 7 2 . 9 7 9 . 0 8 2 . 9 8 6 . 2 8 8 . 5 9 0 . 4 9 2 . 3 9 3 . 5 9 5 . 1 9 6 . 4LAUNDRIES AND DRY CLEANING PLANTS ......................... 1 5 . 6 2 4 . 7 3 7 . 0 5 1 . 2 6 3 . 5 7 1 . 4 7 6 . 4 8 0 . 0 8 2 . 8 8 5 . 6 8 8 . 0 9 0 . 9 9 3 . 0 9 5 . 2 9 6 . 4M D f I D M P I P T I J H F S ____________________________________ ____ _______ ______. . . . . 3 7 . 2 4 5 . 2 5 0 . 0 5 4 . 5 5 8 . 1 6 2 . 1 6 6 . 7 6 9 . 7 7 4 . 0 7 6 . 9 7 9 . 6 8 2 . 5 8 5 . 5 8 8 . 2 9 1 . 5HOSPITALS .................................................... 7 . 7 1 2 . 6 1 9 . 2 2 9 . 2 4 C . 6 5 1 . 3 6 C . 2 6 7 . 6 7 3 . 2 7 7 . 5 8 1 . 4 8 5 . 7 8 8 . 9 9 2 . 8 9 5 . 3
Digitized for FRASER http://fraser.stlouisfed.org/ Federal Reserve Bank of St. Louis
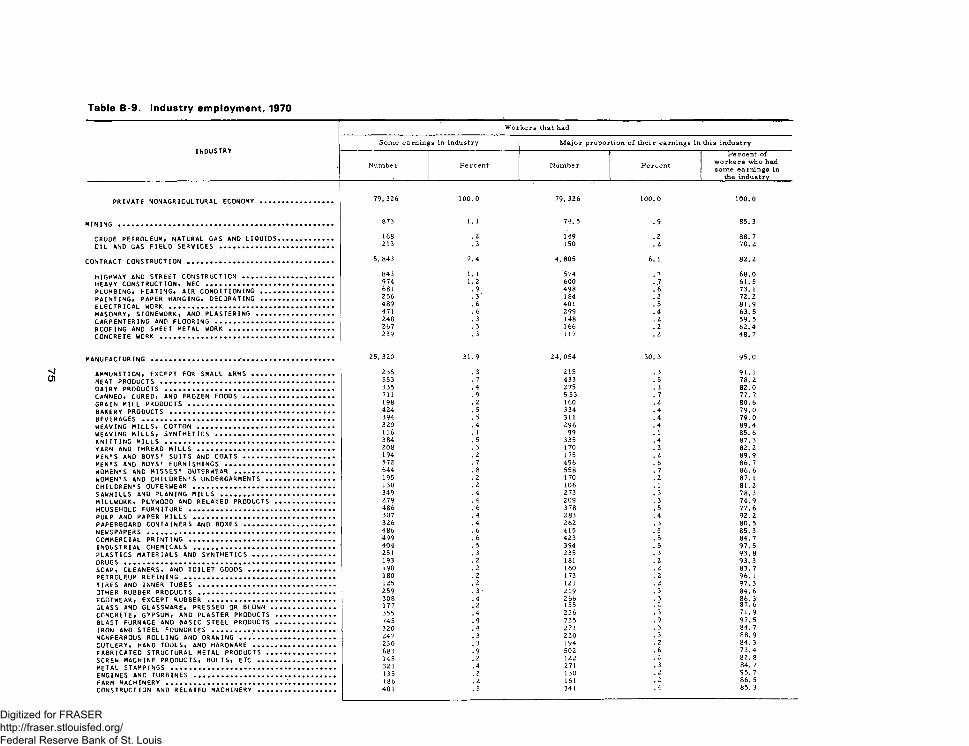
I N D U S T R YSome earnings in industry M a jo r proportion of their earnings in this industry
Numbe r Percent Numbe j- Percent
Percent of workers who hadsome earnings in
the industry
P R I V A T E N O N A G R I C U L T U R A L E C O N O M Y
M I N I N G . . . . . . . . . . . . . . . . . . . . . . . . . . . . . . . . . . . . . . . . . . . . . . . . . . . . . . . . . . .
C R U D E P E T R O L E U M , N A T U R A L G A S A N D L I Q U I D S O I L A N D G A S F I E L D S E R V I C E S . . . . . . . . . . . . . . . . . . . . .
C O N T R A C T C O N S T R U C T I O N . . . . . . . . . . . . . . . . . . . . . . . . . . . . . . .
H I G H W A Y A N O S T R E E T C O N S T R U C T I O N . . . . . . . . . . . .H E A V Y C O N S T R U C T I O N , N E C . . . . . . . . . . . . . . . . . . . . . . . . . .P L U M B I N G , H E A T I N G , A I R C O N D I T I O N I N G . . . . P A I N T I N G , P A P E R H A N G I N G , D E C O R A T I N G . . . .E L E C T R I C A L W O R K . . . . . . . . . . . . . . . . . . . . . . . . . . . . . . . . . . . . . . . .M A S O N R Y , S T O N E W O R K , A N D P L A S T E R I N G . . . . . . .C A R P E N T E R I N G A N D F L O O R I N G . . . . . . . . . . . . . . . . . . . . . . .R O O F I N G A N D S H E E T M E T A L W O R K . . . . . . . . . . . . . . . . .C O N C R E T E W O R K . . . . . . . . . . . . . . . . . . . . . . . . . . . . . . . . . . . . . . . . . . .
MANUFACTURING .............................
AMMUNITION, EXCEPT FOR SMALL ARMS ....MEAT PRODUCTS ...........................DAIRY PRODUCTS ..........................CANNED, CURED, AND FROZEN FOODS .......GRAIN MILL PRODUCTS ....................BAKERY PRODUCTS .........................BEVERAGES ................................WEAVING MILLS, COTTON ..................WEAVING MILLS, SYNTHETICS ..............KNITTING MILLS ..........................YARN AND THREAD MILLS ..................MEN'S AND BOYS' SUITS AND COATS .......MEN'S AND BOYS' FURNISHINGS ............WOMEN'S AND MISSES' OUTERWEAR ........ .WOMEN'S AND CHILDREN'S UNDERGARMENTS ..CHILDREN'S OUTERWEAR ...................SAWMILLS AND PLANING MILLS ............MILLWORK, PLYWOOD AND RELATED PRODUCTSHOUSEHOLD FURNITURE .................... .PULP AND PAPER MILLS .................. .PAPERBOARD CONTAINERS AND B O X E S .......n e w s p a p e r s ...............................COMMERCIAL PRINTING ................... .INDUSTRIAL CHEMICALS .................. .PLASTICS MATERIALS AND SYNTHETICS .....DRUGS ........................ ............SOAP, CLEANERS, AND TOILET G O O D S ......PETROLEUM REFINING ......................TIRES AND INNER TUBES ................. .OTHER RUBBER PRODUCTS ................. .FOOTWEAR, EXCEPT RUBBER ............ .GLASS AND GLASSWARE, PRESSED OR BLOWN CONCRETE, GYPSUM, AND PLASTER PRODUCTS BLAST FURNACE AND BASIC STEEL PRODUCTSIRON AND STEEL FOUNDRIES ...............NCNFERROUS ROLLING AND DRAWING .......CUTLERY, HAND TOOLS, ANO HARDWARE .....FABRICATED STRUCTURAL METAL PRODUCTS ., SCREW MACHINE PRODUCTS, BOLTS, ETC ...METAL STAMPINGS ........................ENGINES AND TURBINES ..................FARM MACHINERY .........................CONSTRUCTION AND RELATED MACHINERY ...
79,326 100.0 79,326 100. 0 100.0
873 1. 1 74. 5 .9 85.3
168 . 2 149 . 2 88. 7213 . 3 150 . 2 70. 2
5, 843 7.4 4, 805 6. 1 82. 2
843 1. 1 574 . 7 68.0974 1.2 600 ..7 61.5681 .9 498 .6 73. 1256 . 3“ 184 . 2 72.2489 . 6 401 . 5 81.9471 .6 299 .4 63.5248 . 3 148 . 2 59.5267 . 3 166 . 2 62.4239 . 3 117 . 2 48. 7
25, 320 31.9 24, 054 30. 3 95.0
235 . 3 215 . 3 91. 1553 . 7 433 . 5 78. 2335 .4 275 . 3 82.0711 .9 553 . 7 77. 7198 . 2 160 . 2 80.6424 . 5 334 .4 79.0394 . 5 311 .4 79.0320 .4 296 .4 89.4116 . 1 99 . 1 85. 63 84 . 5 335 .4 87. 3208 . 3 170 . 2 82.2194 . 2 175 . 2 89.9572 . 7 496 . 6 86. 7644 . 8 558 . 7 86.6195 . 2 170 . 2 87. 1130 . 2 106 . 1 81.2349 .4 273 . 3 78.3279 .4 209 . 3 74.9486 . 6 378 . 5 77.6307 .4 283 .4 92.2326 .4 262 . 3 80. 5486 . 6 415 . 5 85.3499 . 6 423 . 5 84.7404 . 5 394 . 5 97.5251 . 3 235 . 3 93. 8193 . 2 181 . 2 93.3190 . 2 160 . 2 83. 7180 . 2 173 . 2 96. 1125 .2 121 . 2 97.3259 . 3 • 219 . 3 84. 6308 .4 2 66 . 3 86. 3177 . 2 155 . 2 87. 6355 .4 256 . 3 71.9745 .9 725 .9 97.5320 .4 271 . 3 84. 7247 . 3 220 . 3 88. 9230 . 3 194 . 2 84. 3683 .9 502 . 6 73.4148 . 2 122 . 2 82. 8321 .4 271 . 3 84. 7135 . 2 130 .2 95. 7186 . 2 161 . 2 86. 5401 . 5 341 .4 85. 3
Digitized for FRASER http://fraser.stlouisfed.org/ Federal Reserve Bank of St. Louis
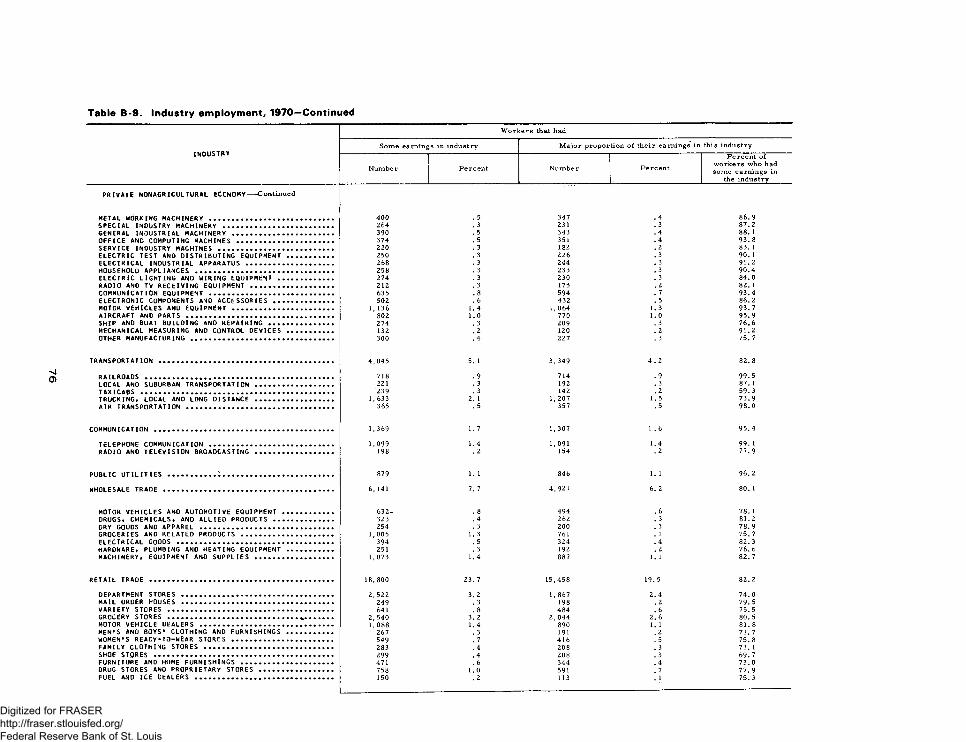
INDUSTRY
PRIVATE NONAGRICULTURAL. ECONOMY--Continued
METAL WORKING MACHINERY .................SPECIAL INDUSTRY MACHINERY ..............GENERAL INDUSTRIAL MACHINERY ............OFFICE AND COMPUTING MACHINES ..........SERVICE INOUSTRY MACHINES ...............ELECTRIC TEST AND DISTRIBUTING EQUIPMENTELECTRICAL INDUSTRIAL APPARATUS ........HOUSEHOLD APPLIANCES .....................ELECTRIC LIGHTING AND WIRING EQUIPMENT .RADIO AND TV RECEIVING EQUIPMENT .......COMMUNICATION EQUIPMENT .................ELECTRONIC COMPONENTS AND ACCESSORIES ..MOTOR VEHICLES AND EQUIPMENT ............AIRCRAFT ANC PARTS .......................SHIP AND BOAT BUILDING AND REPAIRING ... MECHANICAL MEASURING AND CONTROL DEVICES OTHER MANUFACTURING ......................
TRANSPORTATION
RAILROADS ......................... .LOCAL AND SUBURBAN TRANSPORTATIONTAXICABS .......................... .TRUCKING* LOCAL AND LONG DISTANCE AIR TRANSPORTATION ............... .
COMMUNICATION ....................... ,
TELEPHONE COMMUNICATION ........ .RADIO AND TELEVISION BROADCASTING
PUBLIC UTILITIES
WHOLESALE TRADE
MOTOR VEHICLES AND AUTOMOTIVE EQUIPMENT DRUGS, CHEMICALS, AND ALLIED PRODUCTS ..DRY GOODS ANO APPAREL ....................GROCERIES AND RELATED PRODUCTS .........ELECTRICAL GOODS .........................HARDWARE, PLUMBING AND HEATING EQUIPMENT MACHINERY, EQUIPMENT AND SUPPLIES ......
RETAIL TRADE ................................
DEPARTMENT STORES ........................MAIL ORDER HOUSES ........................VARIETY STORES ............................GROCERY STORES ............................MOTOR VEHICLE DEALERS ....................MEN'S AND BOYS' CLOTHING AND FURNISHINGSWOMEN'S READY-TO-WEAR STORES ............FAMILY CLOTHING STORES ...................SHOE STORES ...............................FURNITURE AND HOME FURNISHINGS .........DRUG STORES AND PROPRIETARY STORES .....FUEL AND ICE DEALERS .....................
Some earnings in industry M a jo r proportion of their earnings in this industry
Numbe r Percent Numbe r Percent
Percent of workers who had some earnings in
the industry
400 . 5 347 . 4 86. 9264 . 3 231 . 3 87.2390 . 5 343 .4 88. 1374 . 5 351 . 4 93. 8220 . 3 182 . 2 83. 1250 . 3 226 . 3 90. 1268 . 3 244 . 3 91.2258 . 3 233 . 3 90.4274 . 3 230 . 3 84.0212 . 3 175 . 2 82. 1635 . 8 594 . 7 93.4502 . 6 432 . 5 86. 2
1, 136 1.4 1,064 1.3 93.7802 1.0 770 1.0 95.9274 . 3 209 . 3 76.6132 . 2 120 . 2 91.2300 .4 227 . 3 75. 7
4, 045 5. 1 3,349 4 . 2 82.8
718 .9 714 .9 99.5221 . 3 192 ' . 3 87. 1
‘239 . 3 142 . 2 59.31,633 2. 1 1, 207 1.5 73.9
365 . 5 357 . 5 98.0
1,369 1. 7 1, 307 1 . 6 95.4
1,099 1.4 1,091 1.4 99. 1198 . 2 154 . 2 77.9
879 1 . 1 846 1 . 1 96.2
6, 141 7. 7 4,921 6. 2 80. 1
632- . 8 494 . 6 78. 1323 .4 262 . 3 81.2254 . 3 200 . 3 78.9
1,005 1.3 761 . 1 75. 7394 . 5 324 . 4 82. 3251 . 3 192 . 2 76. 6
1,073 1.4 887 1 . 1 82. 7
18,800 23. 7 15,458 19. 5 82. 2
2, 522 3. 2 1,867 2.4 74.0249 . 3 198 . 2 79.5641 . 8 484 . 6 75. 5
2, 540 3. 2 2,044 2. 6 80. 51,088 1.4 890 1 . 1 81.8
267 . 3 191 . 2 71.7549 . 7 416 . 5 75. 8283 .4 208 . 3 73. 1299 .4 208 . 3 69.7471 . 6 344 . 4 73.0758 1.0 591 . 7 77. 9150 . 2 113 . 1 75.3
Digitized for FRASER http://fraser.stlouisfed.org/ Federal Reserve Bank of St. Louis
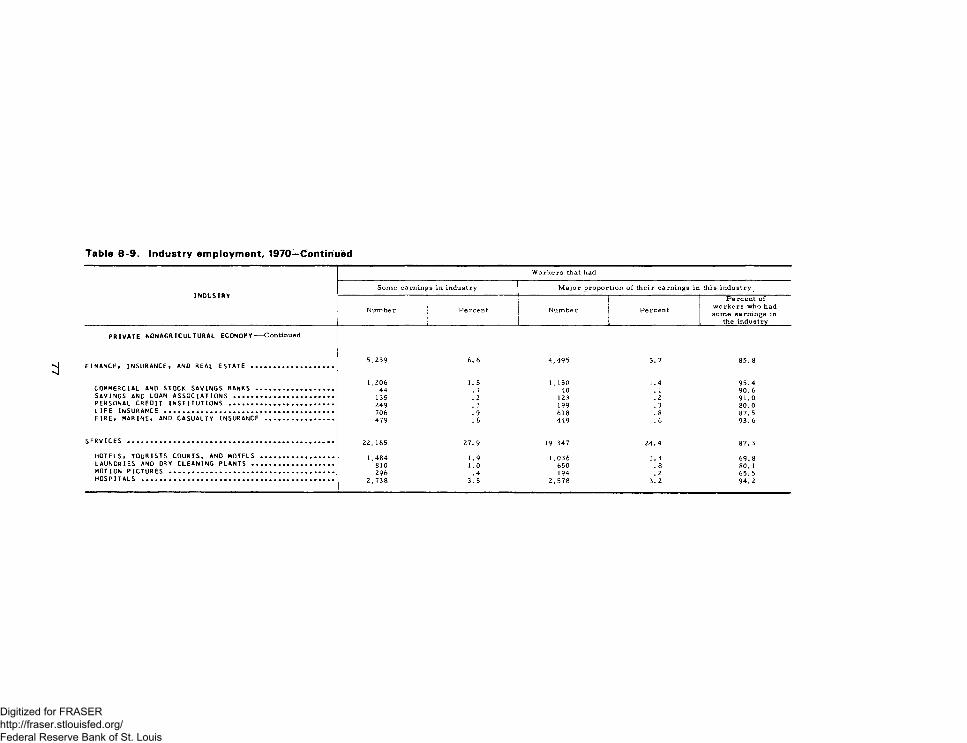
W orkers that had
INDUSTRY
PRIVATE NONAGRICULTURAL ECONOMY---- Continued
FINANCE, INSURANCE, AND REAL ESTATE
COMMERCIAL AND STOCK SAVINGS BANKS .SAVINGS AND LOAN ASSOCIATIONS ......PERSONAL CREOIT INSTITUTIONS .......LIFE INSURANCE.......................FIRE, MARINE, AND CASUALTY INSURANCE
SERVICES ............................... .
HOTELS, TOURISTS COURTS, AND MOTELS LAUNDRIES AND DRY CLEANING PLANTS .MOTION PICTURES .....................HOSPITALS ............................
Some earnings in industry M a jo r proportion of their earnings in this industry
Numbe r Percent Numbe r j Percent
] _________________________________Percent of
workers who had some earnings in
the industry
5,239 6.6 4, 495 5., 7 85. 8
1,206 1.5 1 , 150 1..4 95.444 . 1 40 , 1 90. 6
135 . 2 123 , 2 91.0249 . 3 199 . 3 80.0706 .9 618 , 8 87.5479 . 6 449 . 6 93.6
22,165 27.9 19, 347 24.,4 87.3
1,484 1.9 1 , 036 1., 3 69.8810 1.0 650 , 8 80. 1296 .4 194 , 2 65.5
2, 738 3. 5 2,, 578 3,. 2 94. 2
Digitized for FRASER http://fraser.stlouisfed.org/ Federal Reserve Bank of St. Louis
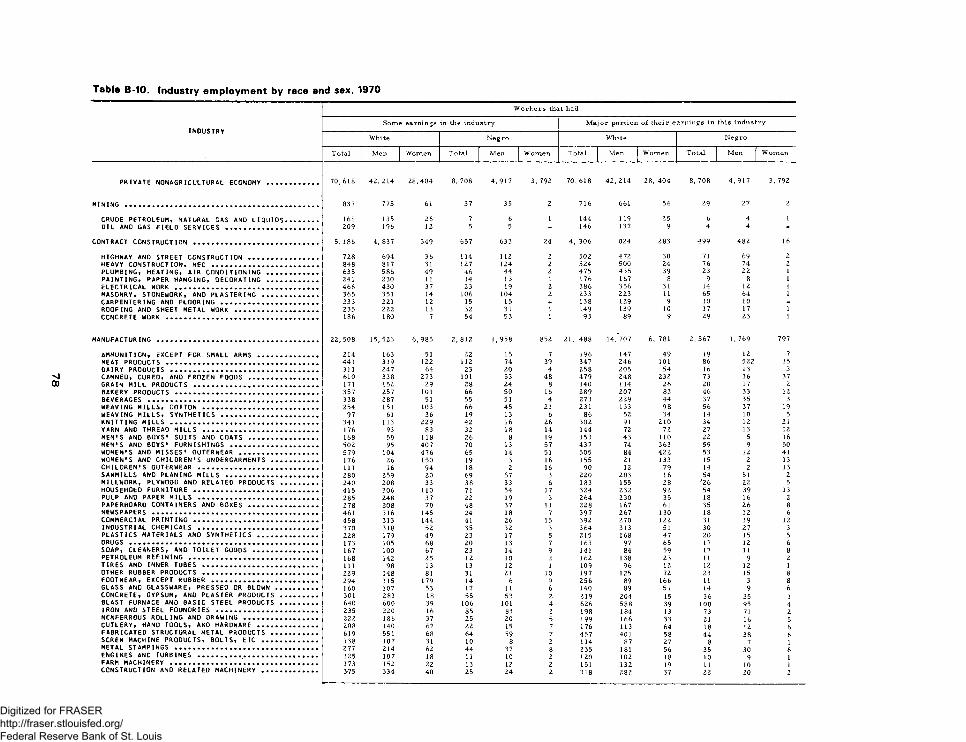
White Negro White Negro
Total Men Women Total Men Women T otal Men Women Total Men Women
PRIVATE NONAGRICULTURAL ECONOMY
Some earnings in the industry Major portion of their earnings in this industry
MINING ............................................
CRUDE PETROLEUM, NATURAL GAS AND LIQUIDS OIL AND GAS FIELD SERVICES ...............
CONTRACT CONSTRUCTION ...................
HIGHWAY AND STREET CONSTRUCTION .........HEAVY CONSTRUCTION, NEC ...................PLUMBING, HEATING, AIR CONDITIONING .... PAINTING, PAPER HANGING, DECORATING ....ELECTRICAL WORK .............................MASONRY, STONEWORK, AND PLASTERING .....CARPENTERING AND FLOORING .................ROOFING AND SHEET METAL WORK .............CONCRETE WORK ................................
MANUFACTURING ..........................................................
AMMUNITION, EXCEPT FOR SMALL ARMS . . . .MEAT PRODUCTS .....................................................DAIRY PRODUCTS ................................................... .
■nJ CANNED, CURED, AND FROZEN FOODS ............ .00 GRAIN MILL PRODUCTS ........................................
BAKERY PRODUCTS .................................................BEVERAGES ..........................................................WEAVING MILLS, COTTON ................................... .WEAVING MILLS, SYNTHETICS ..........................KNITTING MILLS ...................................................YARN AND THREAD MILLS ....................................MEN'S AND BOYS' SUITS AND C O A T S ............ .MEN'S AND BOYS' FURNISHINGS .....................WOMEN'S AND MISSES' OUTERWEAR ..................WOMEN'S AND CHILDREN'S UNDERGARMENTS .,CHILDREN'S OUTERWEAR ................................... ..SAWMILLS AND PLANING MILLS .......................MILLWORK, PLYWOOD AND RELATED PRODUCTSHOUSEHOLD FURNITURE ........................................PULP AND PAPER MILLS ..................................... .PAPERBOARD CONTAINERS AND B O X E S ............ .NEWSPAPERS ............................................................ .COMMERCIAL PRINTING ....................................... .INDUSTRIAL CHEMICALS ..................................... .PLASTICS MATERIALS AND SYNTHETICS . . . . .DRUGS .........................................................................SOAP, CLEANERS, AND TOILET GOODS ...........PETROLEUM REFINING ...........................................TIRES AND INNER TUBES ................................... .OTHER RUBBER PRODUCTS ....................................FOOTWEAR, EXCEPT RUBBER .............................. .GLASS AND GLASSWARE, PRESSED OR BLOWN , CONCRETE, GYPSUM, AND PLASTER PRODUCTS BLAST FURNACE AND BASIC STEEL PRODUCTSIRON AND STEEL FOUNDRIES ............................ .NCNFERROUS ROLLING AND DRAWIN G.............. .CUTLERY, HAND TOOLS, AND HARDWARE . . . . . FABRICATED STRUCTURAL METAL PRODUCTS ., SCREW MACHINE PRODUCTS, BOLTS, ETC . . . .METAL STAMPINGS ..................................................ENGINES AND TURBINES ..................................... .FARM MACHINERY ................................................... .CONSTRUCTION AND RELATED MACHINERY . . . .
70,618 42, 214 28,404 8, 708 4,917 3, 792
837 775 61 37 35 2
161 135 26 7 6 1209 196 12 5 5
5, 186 4, 837 349 657 633 24
728 694 36 114 112 2848 817 31 127 124 2635 586 49 46 44 2241 230 11 14 13 1466 430 37 23 19 2365 351 14 106 104 2233 221 12 15 15 _235 222 13 32 31 1186 180 7 54 53 1
22,508 15,523 6, 985 2, 812 1,958 852
214 163 51 22 15 7441 319 122 112 74 39311 247 64 23 20 4610 338 273 101 53 48171 152 29 28 24 8357 257 101 66 50 16338 287 51 55 51 4254 151 103 66 45 2197 61 36 19 13 6
341 113 229 42 16 26176 93 83 32 18 14168 50 118 26 8 19502 95 407 70 13 57579 104 476 65 14 51176 26 150 19 3 16111 16 94 18 2 16280 259 20 69 67 3240 208 33 38 33 6415 306 110 71 54 17285 248 37 22 19 3278 208 70 48 37 11461 316 145 24 18 7458 313 144 41 26 15370 318 52 35 32 3228 179 49 23 17 5173 105 68 20 13 7167 100 67 23 14 9168 142 25 12 10 2111 98 13 13 12 1229 148 81 31 21 10294 115 179 14 6 9160 107 53 17 11 6301 283 18 55 53 2640 600 39 106 101 4235 220 16 85 83 2222 186 37 25 20 5208 140 67 22 15 7619 551 68 64 59 7138 107 31 10 8 2277 214 62 44 37 8125 107 18 11 10 2173 152 22 13 12 23-75 334 40 25 24 2
70,618 42, 214 28, 404 8, 708 4, 917 3, 792
716 661 54 29 27 2
144 119 25 6 4 1146 137 9 4 4 -
4, 306 024 283 499 482 16
502 472 30 71 69 2524 500 24 76 74 2475 435 39 23 22 1176 167 8 9 8 1386 356 31 14 12 1233 223 11 65 64 1138 129 9 10 10 -149 139 10 17 17 193 89 9 29 23 1
21, 488 14, 707 6, 781 2, 567 1, 769 797
196 147 49 19 12 7347 246 101 86 522 35258 205 54 16 13 3479 248 232 73 36 37140 114 26 20 17 2289 207 83 46 33 12273 229 44 37 35 3231 133 98 56 37 19
86 52 34 14 10 5302 91 210 34 12 21144 72 72 27 13 12153 43 110 22 5 16437 74 363 59 9 50505 84 422 53 12 41155 21 133 15 2 1390 12 79 14 2 13
220 203 16 54 51 2183 155 28 •'26 22 5324 232 92 54 39 13264 230 35 18 16 2228 167 61 35 26 8397 267 130 18 12 6392 270 122 31 19 123 64 313 51 30 27 3215 168 47 20 15 5163 97 65 17 12 6141 84 59 17 11 8162 138 23 11 9 2109 96 12 12 12 1197 125 72 23 15 8256 89 166 11 3 8140 89 51 14 9 6219 204 15 36 35 1626 588 39 100 95 4198 184 13 73 71 2199 166 33 21 16 5176 113 64 18 12 6457 401 58 44 38 6114 87 27 8 7 1235 181 56 35 30 6120 102 18 10 9 1151 132 19 1 1 10 1318 282 37 22 20 2
Digitized for FRASER http://fraser.stlouisfed.org/ Federal Reserve Bank of St. Louis
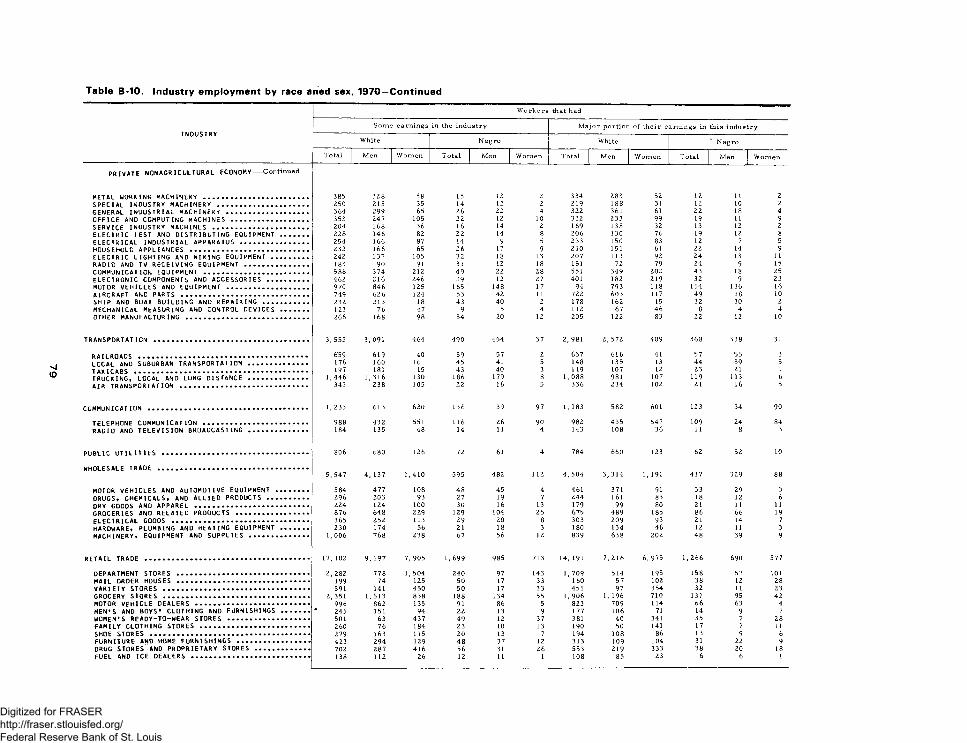
INDUSTRY
Wo rke rs that had
Some earnings in the industry Major portion of their earnings in this industry
White Negro White Negro
Total Men Women T otal Men Women Total Men Women Total Men Women
PRIVATE NONAGRICULTURAL ECONOMY---- Continued
METAL WORKING MACHINERY .................................................... 385 328 58 15 12 2 334 283 52 12 11 2SPECIAL INDUSTRY MACHINERY ............................................. 250 215 35 14 12 2 219 188 31 12 10 2GENERAL INDUSTRIAL MACHINERY ......................................... 364 299 65 26 22 4 322 361 61 22 18 4OFFICE AND COMPUTING MACHINES ....................................... 353 247 105 22 12 10 332 233 99 19 11 9SERVICE INOUSTRY MACHINES ................................................ 204 168 36 16 14 2 169 138 32 13 12 2ELECTRIC TEST AND DISTRIBUTING EQUIPMENT .............. 228 146 82 22 14 8 206 130 76 19 12 8ELECTRICAL INDUSTRIAL APPARATUS .................................. 254 166 87 14 9 5 233 150 83 12 7 5HOUSEHOLD APPLIANCES ........................................................... 232 166 65 26 17 9 210 151 61 22 14 9ELECTRIC LIGHTING AND WIRING EQUIPMENT .................. 242 137 105 32 18 13 207 113 92 24 13 11RADIO AND TV RECEIVING EQUIPMENT ................................ 183 90 91 31 12 18 151 72 79 24 9 15COMMUNICATION EQUIPMENT .................................................... 586 374 212 49 22 28 551 349 202 43 18 25ELECTRONIC COMPONENTS AND ACCESSORIES ..................... 462 216 246 39 12 27 401 182 219 32 9 23MOTOR VEHICLES AND EQUIPMENT ......................................... 970 846 125 165 ' 148 17 94 793 118 154 136 16AIRCRAFT AND PARTS ................................................................ 749 626 124 53 42 11 722 603 117 49 38 10SHIP AND BOAT BUILDING AND REPAIRING ....................... 232 213 18 43 40 2 178 162 15 32 30 2MECHANICAL MEASURING AND CONTROL DEVICES .............. 123 76 47 9 5 4 112 67 46 8 4 4OTHER MANUFACTURING ............................................................. 266 168 98 34 20 12 205 122 83 22 12 10
TRANSPORTATION .............................................................................. 3, 555 3, 091 464 490 454 37 2, 981 2, 572 409 368 338 31
RAILROADS .................................................................................... 659 619 40 59 57 2 657 616 41 57 55 3LOCAL AND SUBURBAN TRANSPORTATION .............................. 176 160 16 45 41 5 148 135 13 44 39 5
197 181 15 43 40 3 119 107 12 23 21 1TRUCKING, LOCAL AND LONG DISTANCE .............................. 1,446 1,316 130 186 179 8 1,088 981 107 119 113 6AIR TRANSPORTATION ................................................................ 343 238 105 22 16 5 336 234 102 21 16 5
COMMUNICATION ................................................................................ 1, 233 613 620 136 39 97 1, 183 582 601 123 34 90
TELEPHONE COMMUNICATION .................................................... 988 432 551 116 26 90 982 435 547 109 24 84RADIO AND TELEVISION BROADCASTING .............................. 184 135 48 14 11 4 143 108 36 11 8 3
PUBLIC U TIL IT IES ......................................................................... 806 680 126 72 61 4 784 660 123 62 52 10
WHOLESALE TRADE ...........................................................................5, 547 4, 137 1,410 595 482 112 4, 504 3, 314 1, 191 417 329 88
MOTOR VEHICLES AND AUTOMOTIVE EQUIPMENT ................ 584 477 108 48 45 4 461 371 91 33 29 3ORUGS, CHEMICALS, AND ALLIED PRODUCTS ..................... 296 203 93 27 19 7 244 161 83 18 12 6DRY GOODS AND APPAREL ......................................................... 224 124 100 30 16 13 179 99 80 21 11 11GROCERIES AND RELATED PROOUCTS .................................... 876 648 229 129 104 25 675 489 185 86 66 19ELECTRICAL GOODS .................................................................... 365 252 113 29 20 8 303 209 93 21 14 7HARDWARE, PLUMBING AND HEATING EQUIPMENT .............. 230 174 56 21 18 3 180 134 46 12 11 3MACHINERY, EQUIPMENT AND SUPPLIES .............................. 1,006 768 238 67 56 12 839 638 202 48 39 9
RETAIL TRADE .................................................................................. 17, 102 9, 197 7, 905 1,699 985 713 14,191 7, 216 6, 975 1,266 690 577
DEPARTMENT STORES .................................................................. 2, 282 778 1, 504 240 97 143 1, 709 514 195 158 57 101MAIL ORDER HOUSES .................................................................. 199 74 125 50 17 33 160 57 102 38 12 28VARIETY STORES ......................................................................... 591 141 450 50 17 33 451 97 354 32 11 23GROCERY STORES ................... ...................................................... 2, 351 1,513 838 188 134 55 1,906 1, 196 710 137 95 42MOTOR VEHICLE DEALERS ......................................................... 996 862 135 91 86 5 823 709 114 66 63 4MEN* S AND BOYS' CLOTHING AND FURNIS HIN GS.............. * 245 151 94 22 13 9 177 106 71 14 9 7WOMEN'S READY-TO-WEAR STORES ......................................... 501 63 437 49 12 37 381 40 341 35 7 28FAMILY CLOTHING STORES ....................................................... 260 76 184 23 10 13 190 50 141 17 7 11SHOE STORES ................................................................................ 279 163 115 20 13 7 194 108 86 13 9 6FURNITURE AND HOME FURNISHINGS .................................... 423 294 129 48 37 12 313 109 104 31 22 9DRUG STORES ANO PROPRIETARY STORES ........................... 702 287 416 56 31 26 553 219 333 38 20 18FUEL AND ICE DEALERS ........................................................... 138 112 26 12 11 1 108 85 23 6 6 1
Digitized for FRASER http://fraser.stlouisfed.org/ Federal Reserve Bank of St. Louis
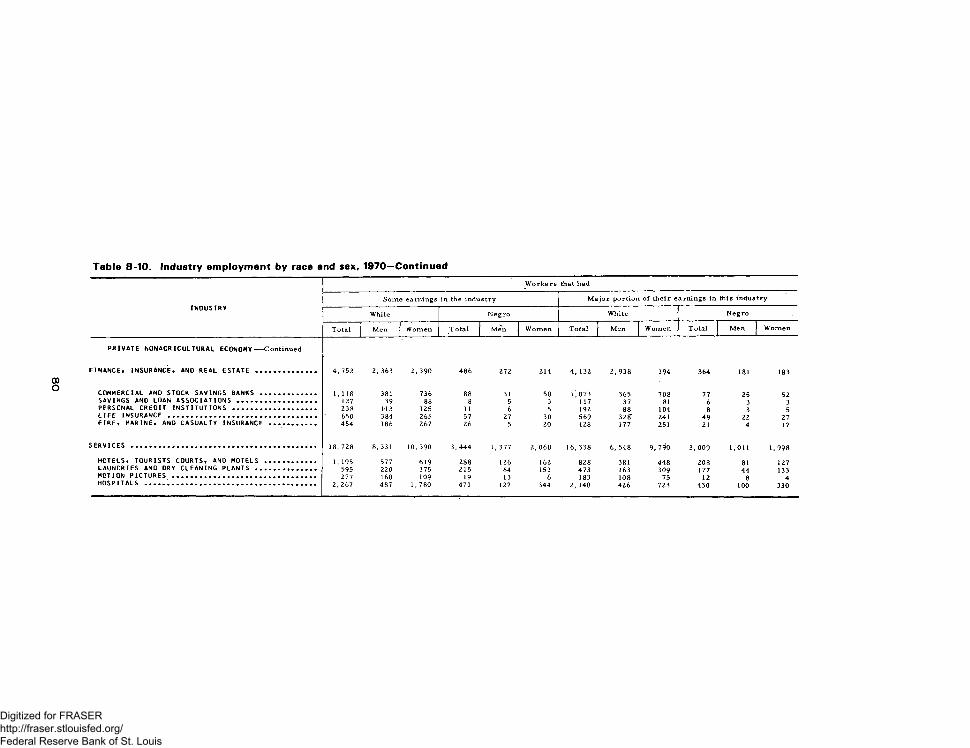
INDUSTRY
W orkers that had
Some earnings in the industry M a jo r portion of their earnings in this industry
White Negro White Negro
Total Men Women Total Men Women Total Men Women Total Men Women
PRIVATE NONAGRICULTURAL ECONOMY---- Continued
FINANCE* INSURANCE, AND REAL ESTATE .............................. 4, 752 2, 363 2, 390 486 272 214 4, 132 2, 938 194 364 181 183
COMMERCIAL AND STOCK SAVINGS BANKS ............................ 1, 118 381 736 88 31 58 1 ’ 073 365 708 77 25 52SAVINGS AND LOAN ASSOCIATIONS ........................................ 127 39 88 8 5 3 117 37 81 6 3 3PERSONAL CREDIT INSTITUTIONS .......................................... 238 1-13 125 11 6 5 192 88 104 8 3 5LIFE INSURANCE ............................................... ........................... 650 384 265 57 27 30 569 32fT 241 49 22 27FIRE, MARINE, AND CASUALTY INSURANCE ....................... 454 186 267 26 5 20 428 177 251 21 4 17
SERVICES ............................................................................................. 18,728 8, 331 10,390 3, 444 1, 377 2, 068 16,338 6, 548 9, 790 3, 009 1,011 1,998
HOTELS, TOURISTS COURTS, AND MOTELS .......................... 1, 195 577 619 288 126 162 828 381 448 208 81 127LAUNDRIES AND DRY CLEANING PLANTS .............................. 595 220 375 215 64 151 473 163 309 177 44 133MOTION PICTURES ........................................................................ 277 168 109 19 13 6 183 108 75 12 8 4HOSPITALS ................................... .................................................. 2, 267 487 1,780 471 127 344 2, 148 426 723 430 100 330
Digitized for FRASER http://fraser.stlouisfed.org/ Federal Reserve Bank of St. Louis
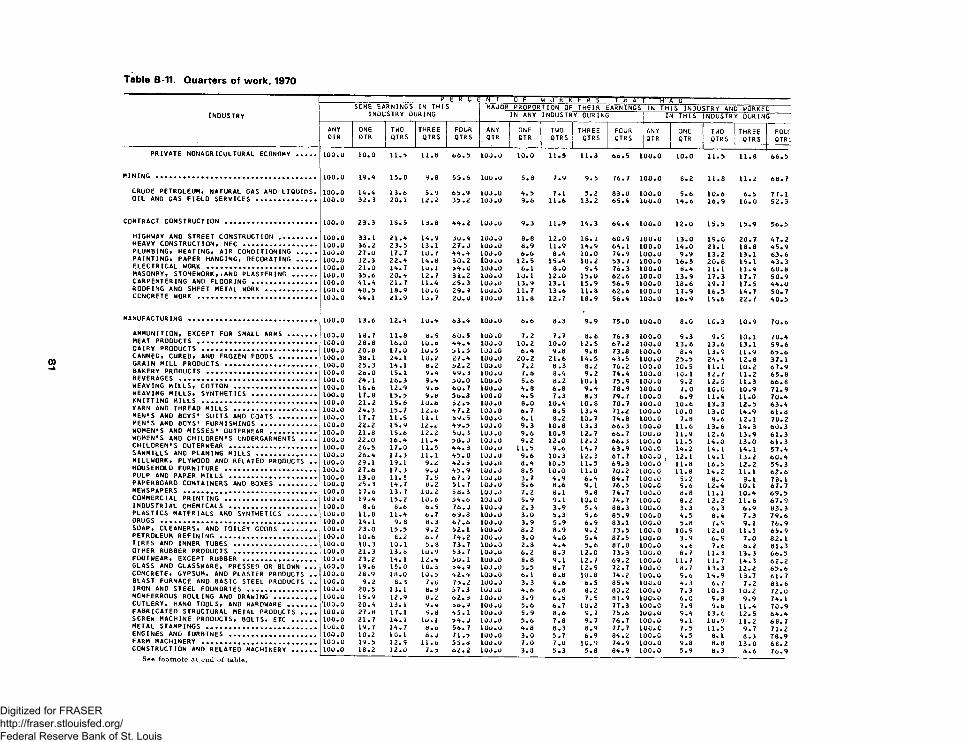
INDUSTRY
T T H n r r — 0 F W O R K T T s T H A 1i— F n \ uSOME EARNINGS IN THIS
INDUSTRY DURINGMAJOR PROPORTION OF THEIR EARNINGS IN THIS INDUSTRY AND WORKED
IN ANY INDUSTRY DURING IN THIS INDUSTRY DURING
ANYQTR
ONEQTR
TWOQTRS
THREEQTRS
FOURQTRS
ANYQTR
ONEQTR
TWOQTRS
THREEQTRS
FOURQTRS
ANYQTR
ONEQTR
TWOQTRS
THREEQTRS
FOUPQTRi
PRIVATE NONAGRICULTURAL ECONOMY ..... 100.0 10.0 11.5 11.8 66.5 100.0 10.0 11.5 11.8 66.5 100.0 10.0 11.5 11.8 66.5
MINING ............................................ 100.0 19.4 15.0 9.8 55.6 100.0 5.8 7.9 9. 5 76.7 100.0 8.2 11.8 11.2 68.7
CRUDE PETROLEUM, NATURAL GAS AND LIQUIDS. 100.0 14.4 13.6 5.9 65.9 1 0 0 . 0 4.5 7.1 5.2 83.0 100.0 5.6 10.6 6.5 77.1OIL AND GAS FIELD SERVICES ................ 100.0 32.3 20.1 12.2 35.2 100.0 9.6 11.6 13.2 65.4 1 0 0 . 0 14.6 16.9 16.0 52.3
c o n t r a c t c o n s t r u c t i o n ......................... 100.0 23.3 18.5 13.8 44.2 100.0 9.3 11.9 14.3 64.4 100.0 12.0 15.5 15.9 56.5
HIGHWAY AND STREET CONSTRUCTION .......... 100.0 33.1 21.4 14.9 30.4 100.0 8.8 12.0 18. 1 60.9 100.0 13.0 19.0 20.7 47.2HEAVY CONSTRUCTION, NEC .................... 100.0 36.2 23.5 13.1 27.0 1 0 0 . 0 8.9 11.9 14.9 64.1 1 0 0 . 0 14.0 21.1 18.8 45.9PLUMBING, HEATING, AIR CONDITIONING ..... 100.0 27.0 17.7 10. 7 44.4 100.0 6.6 8.4 10.0 74.9 1 0 0 . 0 9.9 13.2 13.1 63. 6PAINTING, PAPER HANGING, DECORATING ..... 100.0 32.3 22.4 14.8 30.2 too.o 12.5 15.4 18.2 53.7 100.0 16.5 20.8 19.1 43.3ELECTRICAL WORK .............................. 100.0 21.0 14.7 lu.l 54.0 100.0 6. 1 8.0 9.4 76.3 100.0 8.4 11.1 11.4 68.8MASONRY, STONEWORK,,AND PLASTERING ...... 100.0 35.6 20.4 12.7 31.2 100.0 10.1 12.0 15.0 62.6 100.0 13.9 17.3 17.7 50.9CARPENTERING AND FLOORING .................. 100.0 41.4 21. 1 11.4 25.3 100.0 13.9 13.1 15.9 56.9 100.0 18.6 19. 7 17.5 44.0ROOFING AND SHEET METAL WORK .............. 100.0 40.5 18.9 10.6 29.9 loo.o 11.7 13.6 11.8 62.6 100.0 17.9 16.5 14.7 50.7CONCRETE WORK ................................. 100.0 44.1 21.9 13.7 20.0 10 0 . 0 11.8 12.7 18.9 56.4 100.0 16.9 19.6 22.7 40.5
MANUFACTURING ................................... 100.0 13.6 12.4 10.4 63.4 100.0 6.6 8.3 9.9 75.0 1 0 0 . 0 8.0 10.3 10.9 70.6
AMMUNITION, EXCEPT FOR SMALL ARMS ........ 100.0 18.7 11.8 8.9 60.5 1 0 0 . 0 7.2 7.7 8. 6 76.3 100.0 9.3 9.9 10. 1 70.4MEAT PRODUCTS ................................. 100.0 28.8 16.0 10.6 44.4 1 0 0 . 0 10.2 10.0 12.5 67.2 100.0 13.6 13.6 13.1 59.6DAIRY PRODUCTS ................................ 1 0 0 . 0 20.8 17.0 10.5 51.5 1 0 0 . 0 6.4 9.8 9.8 73.8 100.0 8.4 13.9 11.9 65.6CANNED, CURED, ANO FROZEN FOODS .......... 100.0 38.1 24.1 10.2 27.4 1 0 0 . 0 20.2 21.6 14.5 43.5 100.0 25.5 24.4 12.8 37. 1GRAIN MILL PRODUCTS ......................... 100.0 25.3 14.1 6.2 32.2 1 0 0 . 0 7.2 8.3 8.2 76.2 100.0 10.5 11.1 10.2 67.9BAKERY PRODUCTS .............................. 100.0 26.0 15. 1 9.4 49.3 100.0 7.8 8.4 9.2 74.4 100.0 10. 1 12.7 11.2 65.8BEVERAGES ...................................... 100.0 24.1 16.3 9.4 50.0 100.0 5.6 8.2 10.1 75.9 100.0 9.2 12. 5 11.3 66.8WEAVING MILLS, COTTON ....................... 100.0 16.6 12.9 9.6 60. 7 100.0 4.8 6.8 9.4 78.9 100.0 7. 0 10.0 10.9 71.9WEAVING MILLS, SYNTHETICS .................. 100.0 17.8 15.5 9.8 56.8 100.0 4.5 7.3 8.3 79.7 100.0 6.9 11.4 11.0 70.4100.0 21.2 15.6 10.6 52.5 1 0 0 . 0 8.0 10.4 10.8 70.7 100.0 10.6 13.3 12.5 63.4YARN AND THREAD MILLS ................ ..... 100.0 24.3 15.7 12.0 47.2 100.0 6.7 8.5 13.4 71.2 1 0 0 . 0 10.0 13.0 14.9 61.8MEN'S AND BOYS' SUITS AND COATS .......... 100.0 17.7 11.5 11.1 59.5 1 0 0 . 0 6.1 8.2 10.7 74.8 100.0 7.8 9.6 12.1 70.2MEN'S AND BOYS' FURNISHINGS ............... 100.0 22.2 15.9 12.2 49.5 1 0 0 . 0 9.3 10.8 13.3 66.3 100.0 11.6 13. 6 14. 3 60.3WOMEN'S AND MISSES' OUTERWEAR ............. 100.0 21.8 15.6 12.2 50.3 1 0 0 . 0 9.6 10.9 12.7 66.7 100.0 11.9 12.6 13.9 61.3WOMEN'S AND CHILDREN'S UNDERGARMENTS .... 100.0 22.0 16.4 11.4 50.0 100.0 9.2 12.0 12.2 66.3 1 0 0 . 0 11.5 14.0 13.0 61.3CHILDREN'S OUTERWEAR ........................ 100.0 26.5 17.0 11.5 44.8 100.0 11.5 9.6 14.7 63.9 1 0 0 . 0 14.2 14. 1 14. 1 57.4SAWMILLS AND PLANING MILLS ................ 100.0 26.4 17.3 11.1 45.0 1 0 0 . 0 9.6 10.3 12.3 67.7 1 0 0 . 0 , 12.1 14. 1 13.2 60.4MILLWORK, PLYWOOD AND RELATED PRODUCTS .. 100.0 29.1 19.1 9.2 42.5 1 0 0 . 0 8.4 10.5 11.5 69.3 1 0 0 . 0 ‘ 11.8 16.5 12.2 59.3HOUSEHOLD FURNITURE ......................... 100.0 27.6 17.3 9.0 45.9 1 0 0 . 0 8.5 10.0 11.0 70.2 100.0 11.8 14.2 1 1. 1 62.6PULP AND PAPER MILLS ........................ 100.0 13.0 11.5 7.5 67.9 1 0 0 . 0 3. 7 4.9 6.4 84.7 1 0 0 . 0 5.2 8.4 8.1 7 8.1PAPERBOARD CONTAINERS AND BOXES .......... 1 0 0 . 0 25.3 14.7 8.2 51.7 1 0 0 . 0 5.6 8.6 9. 1 76.5 100.0 9.6 12.4 10. 1 67.7
n e w s p a p e r s .................................... 100.0 17.6 13. 7 10.2 5.8.3 1 0 0 . 0 7.2 8.1 9.8 74.7 100.0 8.8 11.1 10.4 69.5COMMERCIAL PRINTING ......................... 1 0 0 . 0 19.4 15.2 10.6 54.6 1 0 0 . 0 5.9 9.1 10.0 74.7 100.0 8.2 12.2 11.6 67.9INDUSTRIAL CHEMICALS ........................ 1 0 0 . 0 8.6 8.6 6.5 76.0 1 0 0 . 0 2.3 3.9 5.4 88.3 100.0 3.3 6.3 6.9 83.3PLASTICS MATERIALS AND SYNTHETICS ........ 100.0 11.8 11.4 6.7 69.8 1 0 0 . 0 3.0 5.3 5.6 85.9 100.0 4.5 8.4 7.3 79.6DRUGS ........................................... 100.0 14.1 9.8 8.3 6 7.6 100.0 3.9 5.9 6.9 83.1 100.0 5.8 7.9 9.1 76.9SOAP, CLEANERS, AND TOILET GOODS ......... 100.0 23.0 15.5 9.2 32.1 1 0 0 . 0 8.2 8.9 9.2 73.5 100.0 10.9 12.0 11.1 65.9PETROLEUM REFINING .......................... 100.0 10.6 8.2 6.7 74.2 100.0 3.0 4.0 5.4 87.5 100.0 3.9 6.9 7.0 82.1TIRES AND INNER TUBES ....................... 100.0 10.3 10.1 5.8 73.7 100.0 2.8 4.4 5.6 87.0 100.0 4.6 7.6 6.2 81.3OTHER RUBBER PRODUCTS ...................... 100.0 21.3 13.8 10.9 53. 7 100.0 6.2 8.3 12.0 73.3 1 0 0 . 0 8. 1 11.3 13. 3 66.5FOOTWEAR, EXCEPT RUBBER .................... 100.0 23.2 14.1 12.4 50. 1 100.0 8.8 9.1 12.7 69.2 100.0 11.7 11.7 14.3 62.2GLASS AND GLASSWARE, PRESSED OR BLOWN ... 100.0 19.6 15.0 10.3 34.9 1 0 0 . 0 5.5 8.7 12.9 72.7 100.0 8.7 13.3 12.2 65.6c o n c r e t e , g y p s u m , AND PLASTER PRODUCTS .. 100.0 28.9 18.0 10.3 42.4 1 0 0 . 0 6. 1 8.8 10.8 74.2 100.0 9.6 14.9 13.7 61.7BLAST FURNACE AND BASIC STEEL PRODUCTS .. 100.0 9.2 8.3 7.0 73.2 100.0 3.3 4.6 6.5 85.4 1 0 0 . 0 4.3 6.7 7.2 81.6IRON AND STEEL FOUNDRIES ................... 100.0 20.5 13. 1 8.9 57.3 1 0 0 . 0 4.6 6.8 8.2 80.2 100.0 7.3 10.3 10.2 72.0NCNFERROUS ROLLING AND DRAWING ........... 100.0 15.9 12.9 8.2 62.8 100.0 3.9 6.5 7. 5 81.9 100'. 0 6.0 9.8 9.9 74. 1CUTLERY, HAND TOOLS, AND HARDWARE ........ loo.o 20.4 13.1 9.4 36.9 1 0 0 . 0 5.6 6.7 10.2 77.3 100.0 7.9 9.6 11.4 70.9FABRICATED STRUCTURAL METAL PRODUCTS .... 100.0 27.8 17. 1 9.8 45.1 1 0 0 . 0 5.9 8.6 9. 7 75.6 100.0 9.4 13.6 12.5 64.4SCREW MACHINE PRODUCTS, BOLTS, ETC ...... 100.0 21.7 14.1 10.1 54.0 1 0 0 . 0 5.6 7.8 9. 7 76.7 100.0 9.1 10.9 11.2 68.7m e t a l s t a m p i n g s .............................. 100.0 19.7 14.7 8.0 56. 7 100.0 4.8 8.3 8.9 77.7 1 0 0 . c 7.5 11.5 9.7 71.2ENGINES AND TURBINES ........................ 100.0 10.2 10. 1 8.0 71.3 100.0 3.0 5.7 6.9 84.2 100.0 4.5 8.1 8.3 78.9FARM MACHINERY ............................... 100.0 19.5 12.9 11.6 55.8 1 0 0 . 0 7.0 7.0 10.9 74.9 100.0 9.8 8.8 13.0 66.2CONSTRUCTION AND RELATED MACHINERY ...... 100.0 18.2 12.0 7.5 62.2 1 0 0 . 0 3.8 5.3 5.8 84.9 100.0 5.9 8.3 8.6 76.9
See footnote at end of table.
Digitized for FRASER http://fraser.stlouisfed.org/ Federal Reserve Bank of St. Louis
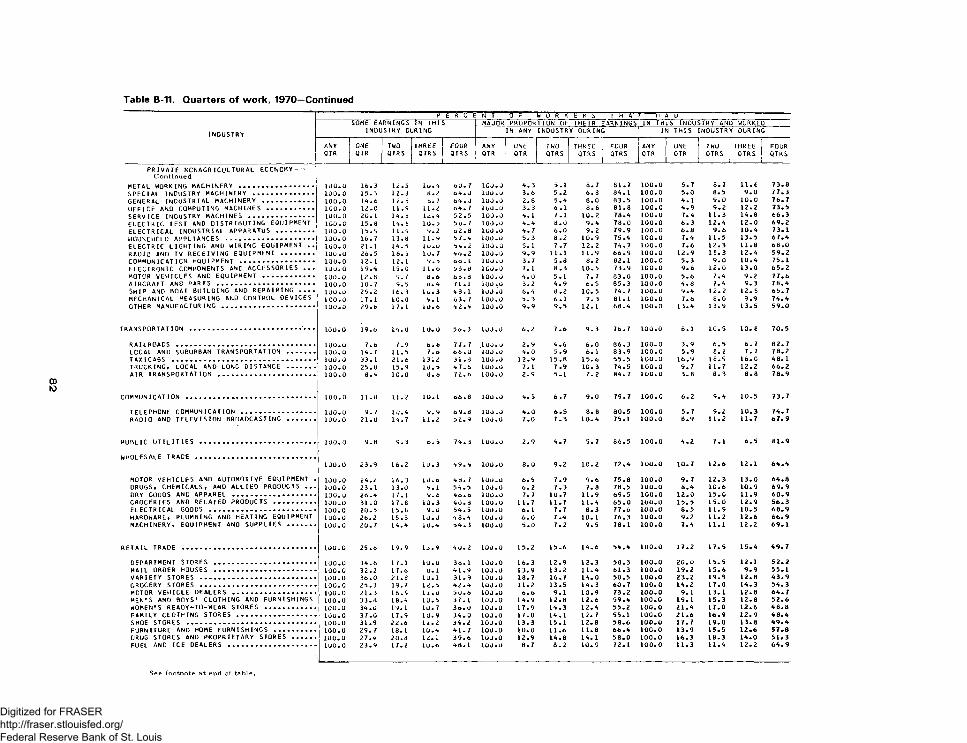
----------- (5" e V c " e: N T 0 F W O R K fc R S T H A 1 H A USOME EARNINGS IN THIS MAJOR PROPORTION OF THEIR EARNINGS IN THIS INDUSTRY AND WORKED
INDUSTRY INDUSTRY DURING IN ANY INDUSTRY DURING IN THIS INDUSTRY DURING
ANYQTR
ONEQTR
TWOQTRS
THREEQTRS
FOURQTRS
ANYQTR
ONEQTR
TWOQTRS
THREEQTRS
FOURQTRS
ANYQTR |
__________L
ONEQTR
TWOQTRS
THREEQTRS
FOURQTRS
PRIVATE NCNAGRICULTURAL ECCNCMY----Continued
METAL WORKING MACHINERY ..................................... 100.0 16.3 12.5 l u . 4 60 . 7 100.0 4. 3 5.1 8.7 81.7 100.0 5.7 8.7 1 1 . t 73.8SPECIAL INDUSTRY MACHINERY .............................. 100. 0 15.3 12.3 8.2 04 .0 100.0 3.6 5.2 6.8 84.1 100.0 5.0 8.5 9 .0 77 .3GENERAL INDUSTRIAL MACHINERY .......................... 100.0 14.6 12.5 6.7 64 .0 100.0 2.8 5.4 8.0 83.5 i o o . o 4.1 9 .0 10.0 76 .7OFFICE AND COMPUTING MACHINES ....................... 100.0 12.0 11.9 11.2 o4 . 7 100.0 3.3 6 .1 8.6 81.8 100.0 4 .9 9.2 12.2 73.5SERVICE INDUSTRY MACHINES ................................. 100.0 20. i 14.8 12.4 52 .5 100.0 4. 1 7.1 10.2 78.4 100.0 7.4 11.3 14.8 66 .3ELECTRIC TEST AND DISTRIBUTING EQUIPMENT 100.0 15.8 14. 8 10.8 50. 7 100.0 4.4 8.0 9.4 78.0 IOO.O 6 .3 12.4 12.0 69 .2ELECTRICAL INDUSTRIAL APPARATUS ................... 100.0 15.9 11.9 9.2 o2 .8 100.0 4 .7 6.0 9.2 79.9 100.0 6 .8 9 .6 10.4 73.1HOUSEHOLD APPLIANCES ............................................ 100.0 16.7 13.8 11.9 57.4 100.0 5.3 8 .2 10.9 75.4 100.0 7.4 11.5 13.5 67 .4ELECTRIC LIGHTING AND WIRING EQUIPMENT . . 100.0 21.1 14.5 10.0 54 .2 100.0 5. 1 7.7 12.2 74.7 100.0 7.6 12.3 11.8 68 .0RADIO AND TV RECEIVING EQUIPMENT ................. 100.0 26.5 16. 5 10.7 40 .2 100.0 9.9 11.1 11.9 66 .9 100.0 12.9 15.3 12.4 59 .2COMMUNICATION EQUIPMENT ..................................... 100.0 12-1 12. 1 9 .5 0 6 . 1 100.0 3.7 5.8 8.2 82.1 100.0 5.3 9.0 10.4 75.1ELECTRONIC COMPONENTS AND ACCESSORIES . . . 100.0 19.4 15.0 1 1 . o 53.8 i o o . o 7.1 8 .3 10.5 73.9 100.0 9.6 12.0 13.0 65 .2MOTOR VEHICLES AND EQUIPMENT .......................... 100.0 12.8 9. 7 6 .6 66 .8 100.0 4.0 5.1 7. 7 83.0 100.0 5.6 7.4 9 .2 77 .6AIRCRAFT AND PARTS ................................................. 100.0 10.7 9.5 0 .4 71.1 100 .0 3.2 4 .9 6 .5 85 .3 100.0 4.8 7.4 9.3 78 .4Sh i p and boa t b u i l o i n g and r e p a i r i n g . . . . 100.0 25.2 16.3 10.3 48 .1 100.0 6.4 8.2 10.5 74.7 100.0 9.4 12.2 12. 5 65 .7MECHANICAL MEASURING AND CONTROL DEVICES 100.0 17.1 10.0 9.1 63. 7 100.0 5.3 6 .1 7.3 81.1 100.0 7.6 8.0 9.9 74.4OTHER MANUFACTURING .............................................. 100.0 29.6 17.1 10.6 42 .4 100.0 9.9 9.5 12. 1 68.4 100.0 13.4 13.9 13.5 59 .0
TRANSPORTATION ....................................................... • • • 100.0 19.6 14.0 10 .0 5o .3 100.0 6.2 7.6 9 .3 76.7 100.0 8.1 10.5 1 0 . e 70.5
RAILROADS ..................................................................... 100.0 7.6 7.9 6 .6 77.7 ,100.0 2.9 4 .6 6 .0 86.3 100.0 3.9 6.5 6 .7 82 .7LOCAL AND SUBURBAN TRANSPORTATION .............. 100.0 14.7 11.5 7.0 66 .0 100.0 4 .0 5.9 6.1 83.9 100.0 5.9 8.2 7 .7 78.2TAXICABS ........................................................................ 100.0 33.1 21.6 13.2 3 1 . d 100.0 12.9 15.8 15.6 55.5 100.0 16.9 18.9 1 6 .C 48.1TRUCKING, LOCAL AND LONG DISTANCE .............. 100.0 25.8 15.9 10.5 47 .6 100.0 7.1 7 .9 10.3 74.5 100.0 9 .7 11.7 12.2 66 .2AIR TRANSPORTATION ................................................ : i o o . o 8.4 10.0 8 .6 72.6 100.0 2.9 5.1 7.2 84.7 100.0 3.8 8.3 8 .8 78.9
c o m m u n i c a t i o n ......................* ........................... ............. 100.0 11.8 11.2 10.1 06 .8 100.0 4.5 6 .7 9 .0 79.7 100.0 6.2 9.4 10.5 73 .7
TELEPHONE COMMUNICATION ..................................... 100.0 9. 7 10.4 9 .9 69 .8 100.0 4 .0 6 .5 8.8 80.5 100.0 5.7 9.2 10.3 74.7RADIO AND TELEVISION BROADCASTING .............. 100.0 21.0 14.7 11.2 32 .9 100.0 7.0 7 .3 10. 4 75.1 100.0 8.9 11.2 11.7 67 .9
PUBLIC U TIL IT IES .......................................................... 100.0 9.8 9.3 0.5 74.3 100.0 2.9 4 .7 5.7 86.5 100.0 4.2 7.1 6 .5 81 .9
w h o l e s a l e tr ad e ............................................................100.0 23.9 16.2 10.3 49 .4 100.0 8.0 9.2 10.2 72.4 100.0 10. 7 12.6 12.1 64 .4
MOTOR VEHICLES AND AUTOMOTIVE EQUIPMENT . 100.0 24.2 16.3 l o . o 48 . 7 100.0 6.5 7.9 9 .6 75.8 100.0 9 .7 12.3 13.0 64.8DRUGS, CHEMICALS, AND ALLIED PRODUCTS . . . 100.0 23.1 13.0 * . l 54 .5 100.0 6 .2 7 .3 7.8 78.5 100.0 8.4 10.6 10.9 69 .9DRY GOODS AND APPAREL .......................................... 100.0 26.4 17.1 9.6 40 .6 100.0 7.7 10.7 11.9 69.5 100.0 12.0 15.0 11.9 60 .9GROCERIES ANO RELATED PRODUCTS ..................... 100.0 31.0 17.8 10.3 40 .6 100.0 11.7 11.7 11.4 65 .0 100.0 15.5 15.0 12.9 56 .3ELECTRICAL GOODS ..................................................... 100.0 20.5 15.8 9.0 54 .5 100.0 6.1 7.7 8 .3 77.6 100.0 8.5 11.9 10.5 68 .9HARDWARE, PLUMBING AND HEATING EQUIPMENT 100.0 26.2 15.3 10.0 48 .4 100.0 6 .0 7.4 10. 1 76.3 100.0 9.2 11.2 12.6 66 .9MACHINERY, EQUIPMENT ANO SUPPLIES .............. 100.0 20.7 14.4 10.9 54 .3 100.0 5.0 7.2 9 .5 78.1 100.0 7.4 11.1 12.2 69.1
RETAIL TRADE ................................................................... 100.0 25.8 19.9 13.9 40 .2 100.0 15.2 15.6 14.6 54.4 100.0 17.2 17.5 15.4 49 .7
DEPARTMENT STORES ................................................... 100.0 34.6 17.1 10.0 36. 1 100.0 16.3 12.9 12.3 58.3 100.0 20.0 15.5 12.1 52 .2MAIL ORDER HOUSES ................................................... 100.0 32.2 17.6 6.1 41 .9 100.0 13.9 13.2 11.4 61.3 100.0 19.2 15 .6 9 .9 55.1VARIETY STORES .......................................................... 100.0 36.0 21.8 10.1 31 .9 100.0 18.7 16.7 14.0 50.5 100.0 23.2 19.9 12.8 43 .9GROCERY STORES .......................................................... 100.0 25.3 19.7 12.5 42 .4 100.0 11.2 13.5 14.3 60.7 100.0 14.2 17.0 14.3 54 .3MCTOR VEHICLE DEALERS .......................................... 100.0 21.3 16.9 11.0 50 .6 100.0 6 .6 9.1 10.9 73.2 100.0 9. 1 13.1 12.8 64 .7MEN'S AND BOYS' CLOTHING AND FURNISHINGS 100.0 33.8 18.4 10.5 37. 1 100.0 14.9 12.8 12.6 59.4 100.0 19.1 15.3 12.8 52 .6WOMEN'S READY-TO-WEAR STORES ..................... .. 100.0 34.0 19. 1 10.7 36 .0 100.0 17.9 14.3 12.4 55.2 100.0 21 .4 17.0 12.6 48 .8FAMILY CLOTHING STORES ........................................ 100.0 37.0 17.9 10.9 34 .0 100.0 17.8 14.1 12.7 55.1 100.0 21 .6 16.9 12 .9 48 .4SHOE STORES ................................................................. 100.0 31.9 22.6 11.2 34 .2 100.0 13.3 15.1 12.8 58.6 100.0 17.7 19.0 13.8 49 .4FURNITURE AND HOME FURNISHINGS ..................... 100.0 29.7 18.1 10.4 4 1 .7 i o o . o 10.0 11.6 11.8 66 .4 100.0 13.9 15.5 12.6 57 .8DRUG STORES AND PROPRIETARY STORES ............ 100.0 27.4 20.8 12.1 39 .6 100.0 12.9 14.8 14. 1 58 .0 100.0 16.3 18.3 14.0 51 .3FUEL AND ICE DEALERS ............................................ 1U0.0 23.9 17.2 10. o 48 .1 100.0 8.7 8 .2 10.9 72.1 100.0 11.3 11.4 12.2 64 .9
Digitized for FRASER http://fraser.stlouisfed.org/ Federal Reserve Bank of St. Louis
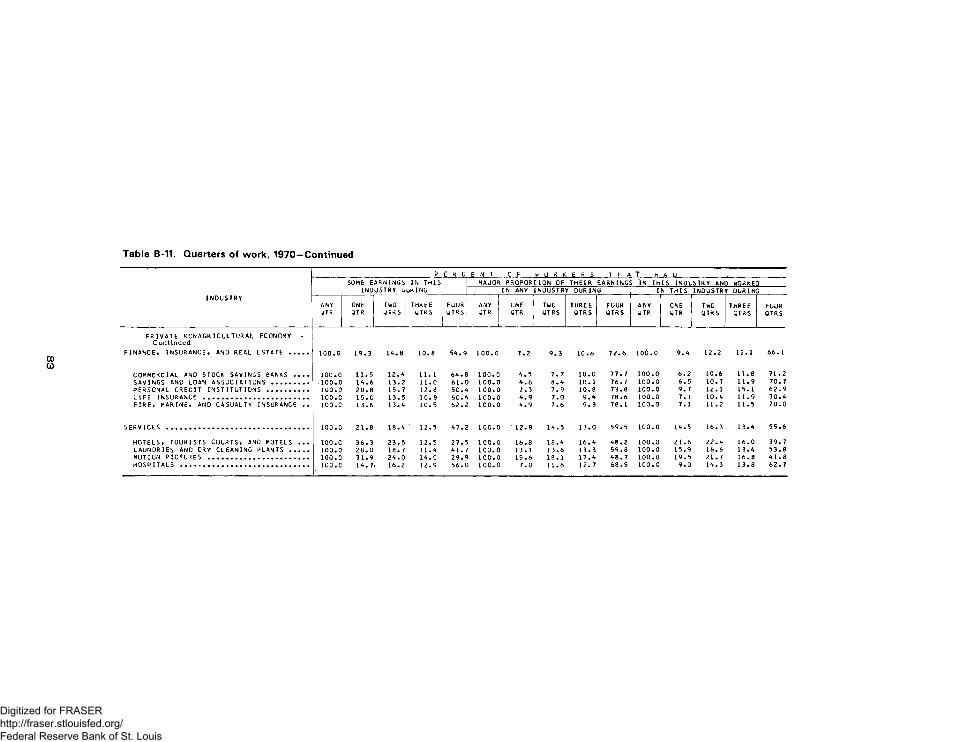
INDUSTRY
P E R C E: N T 0 F W U R K1 E R S T H A T H A USOME EARNINGS IN THIS
INDUSTRY DURINGMAJOR PROPORTION OF THEIR EARNING! IN THIS INDUSTRY AND WORKED
IN ANY INDUSTRY DURING IN THIS INDUSTRY DURING
ANYJTR
ONEQTR
TWOQTRS
THREEQTRS
FUURwTRS
ANYQTR
ONEQTR
TWOQTRS
THREEQTRS
FOURQTRS
ANYQTR
GNE QTR 1
1
TWOQTRS
THREEQTRS
FOURQTRS
PRIVATE NCNAGRICULTURAL ECONOMY -----Continued
FINANCE, INSURANCE, AND REAL ESTATE ..... 100.0 19.3 14.8 10.8 54.9 100.0 7.2 9.3 10.6 72.6 100.0 9.4 12.2 12. 1 66. 1
COMMERCIAL AND STOCK SAVINGS BANKS .... . 100.0 11.5 12.4 11.1 64.8 10 0 .C) 4 .5 7.7 10.0 77.7 100.0 6.2 10.6 11.8 71.2SAVINGS AND LOAN ASSOCIATIONS ......... 1 0 0 . c1 14.6 13.2 1 1 .C 61.0 100.0 4 .6 8.4 10.1 76.7 100.0 6.5 10.7 11.9 70.7PERSONAL CREDIT INSTITUTIONS .......... 100.c1 20 .8 15.7 12.8 50.< 100.0 7.3 7 .9 10.8 73.8 100.0 9.7 12.1 15.1 62.9LIFE INSURANCE .......................... 100.c! 15.0 13.5 10.8 60. < i c o . c ) 4 .9 7.0 9.4 78 .6 100.0 7.1 10.4 11.9 70.4FIRE, MARINE, AND CASUALTY INSURANCE .. 1 0 0 . c' 13.6 13.4 10.5 62.2 100.0 4.9 7.6 9 .3 78.1 100.0 7.1 11.2 11.5 70.0
SERVICES ................................... 100.c1 21 .8 18.4 12.5 47.2) 100.0 12.8 14.5 13.0 59.5 100.0 14.5 16.3 13.4 55.6
HOTELS, TOURISTS COURTS, AND MOTELS ... 100.c 36 .3 23.5 12.5 2 7 .« 100.0 16.8 18.4 16.4 48 .2 100.0 21.6 22.4 16.0 39.7LAUNDRIES AND DRY CLEANING PLANTS ..... 1 0 0 . c1 28 .0 18.7 11.4 41.1f ICO.CJ 13.1 13.6 13.3 59.8 100.0 15.9 16.6 13.4 53.8MOTION PICTURES ......................... 100.c1 31.9 24.0 1 4 .C 29.9 100.0 15.6 18.1 17.4 48 .7 100.0 19.5 21.7 16.8 41 .8HOSPITALS ................................ 100.c 14.7 , 16.2 12.9 56.0 10C.0 7.0 11.6 12.7 68.5 100.0 9.0 14.3 13.8 62.7
Digitized for FRASER http://fraser.stlouisfed.org/ Federal Reserve Bank of St. Louis
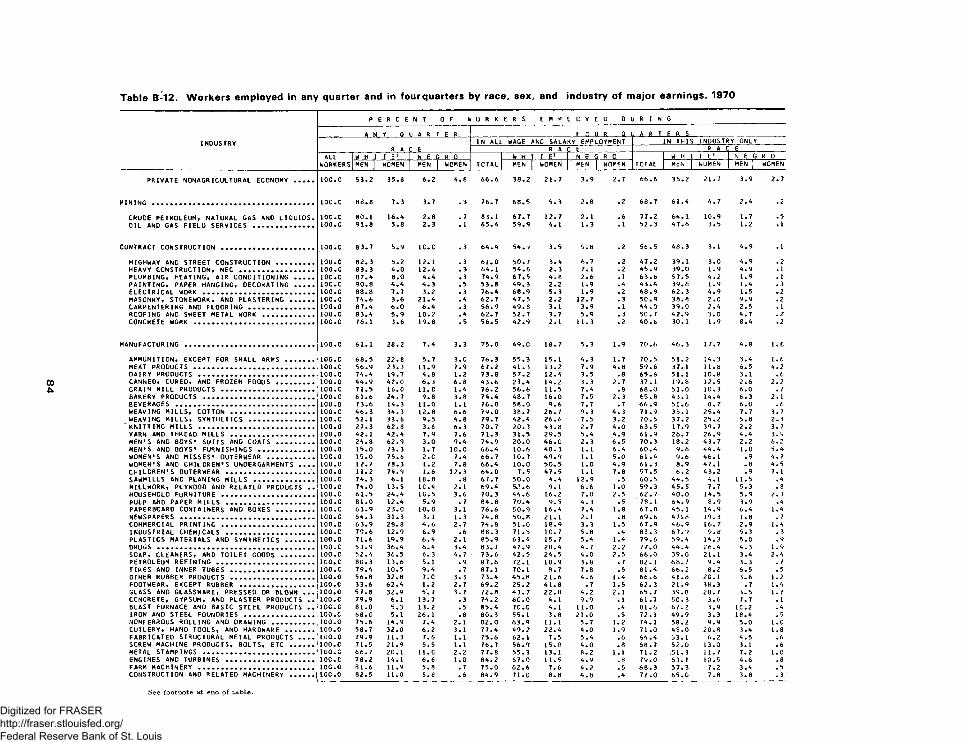
INDUSTRY
p E R C E N T 0 F Vi 0 R K E R S E M P L C Y E D D U R I N G
A N Y 0 U A R T E R F C U R____Q l A R T F R SIN ALL WAGE AND SALARY EMPLOYMENT IN THIS INDUSTRY ONLY
R A F E R A C E R A C 6ALL
WORKERSW H I T E 1 N E G R 0
TOTALW H 1[ T E1 N E G R C J
TCTALW H I T E1 N E G R Q
MEN | WOMEN MEN | WOMEN MEN | WOMEN MEN | WOMEN MEN | WOMEN MEN y WOMEN
PRIVATE NONAGRICULTURAL ECONOMY .......... 100.0 53.2 35.8 6.2 4.8 66.6 38.2 21 .7 3.9 2.7 66 .6 38.2 21.7 3.9 2.7
MINING ............................ .................................................... 100.c 88.8 7.3 3.7 .3 76 .7 68 .5 5 .3 2.8 .2 68 .7 61 .4 4 .7 2.4 .2
CRUOE PETROLEUM, NATURAL GAS AND LIQUIDS. 100 .c 80.1 16.4 2.8 .7 83.1 67 .7 12.7 2. 1 .6 77.2 64. 1 10.9 1.7 .5OIL and GAS FIELD SERVICES .............................. 100.c 91.8 5.8 2.3 . 1 65 .4 59.9 4.1 1.3 .1 52 .3 47.6 3.5 1.2 .1
CONTRACT CONSTRUCTION .............................................. 100.c 83 .7 5.9 1C.C .3 64 .4 54 .9 3.5 5.8 .2 56.5 48 .3 3. 1 4 .9 . 1
HIGHWAY AND STREET CONSTRUCTION ................... 100.0 82 .3 5.2 12.1 .3 61 .0 50.7 3.4 6.7 .2 47 .2 39.1 3.0 4.9 .2HEAVY CONSTRUCTION, NEC ..................................... 100.0 83 .3 4 .0 12.4 .3 64.1 54 .6 2.3 7.1 .2 45 .9 39.0 1.9 4.9 . 1PLUMBING, HEATING, AIR CONDITIONING .......... 100.c 87.4 8.0 4.4 .3 74.9 67 .5 4 . e 2.6 . 1 63.6 57.5 4.2 1.9 .1PAINTING, PAPER HANGING, DECORATING .......... 100.c 90.8 4.4 4.3 .5 53.8 49 .3 2.2 1.9 .4 43 .4 39.8 1.9 1.4 .3ELECTRICAL WORK ........................................................ 100.c 88.8 7.7 3.2 .3 76.4 68 .9 5.3 1.9 .2 68 .9 62 .3 4 .9 1.5 .2MASONRY, STONEWORK, AND PLASTERING ............ 100.0 74.6 3.6 21.4 .4 62 .7 47 .5 2.2 12.7 .3 50 .9 38.8 2.0 9.9 .2CARPENTERING AND FLOORING ................................. 100.0 87.4 6 .0 6 .4 .3 56 .9 49 .8 3.1 3.9 .1 44 .0 39.0 2.4 2.5 . 1ROOFING AND SHEET METAL WORK .......................... 100.0 83.4 5.9 10.2 .4 62 .7 52.7 3.7 5.9 .3 50.7 42 .9 3.0 4 .7 .2CONCRETE WORK ............................................................ 100 .c 76.1 3.6 19.8 .5 56 .5 42 .9 2.1 11.3 .2 40 .6 30. 1 1.9 8.4 .2
MANUFACTURING ................................................................. 100.0 61.1 28.2 7.4 3.3 75 .0 4 9 . C 18.7 5.3 1.9 70.6 46 .3 17.7 4.8 1.8
AMMUNITION, EXCEPT FOR SMALL ARMS .............. 100 .c 68 .5 22.8 5.7 3.0 76 .3 55.3 15. 1 4.3 1.7 70.5 51.2 14.3 3.4 1.6MEAT PRODUCTS ............................................................ 100. c 56.9 23.3 11.9 7.9 67 .2 41 .3 13.2 7.9 4.8 59.6 37. 1 11.8 6.5 4.2DAIRY PRODUCTS .......................................................... 1C0.C 74.4 19.7 4.8 1.2 73.8 57 .2 12.4 3.5 .8 65 .6 51.1 10.8 3.1 .6CANNED, CURED, AND FROZEN FOODS ................... 100.c 44.9 42.0 6 .3 6 .8 43.6 23.4 14.2 3.3 2.7 37.1 19.8 12.5 2.6 2.2GRAIN MILL PRODUCTS .............................................. 100.c 71.5 16.0 11.0 1.4 76.2 56 .6 11.5 7.4 .8 68 .0 51.0 10.3 6.0 .7BAKERY PRODUCTS ....................................................... 100.0 61 .6 24.7 9.8 3.8 74.4 48 .7 16.0 7.5 2.3 65.8 43.1 14.4 6.3 2.1BEVERAGES ..................................................................... 100.0 73.6 14.3 11.0 1. 1 76.0 58 .0 9.6 7.7 .7 66 .9 51.6 8.7 6.0 .6WEAVING MILLS, COTTON .......................................... 100.c 46 .3 34.3 12.8 6.6 79.0 38.7 26 .7 9.3 4 .3 71.9 35. 1 25.4 7.7 3.7WEAVING MILLS, SYNTHETICS ................................. 100.c 52.1 33.6 9.5 4.8 79.7 42.4 26 .6 7.5 3.2 70.5 37.2 25.2 5.8 2.3
' KNITTING MILLS .......................................................... 100.0 27.3 62.8 3.6 6.3 70.7 20.3 43.8 2.7 4.0 63.5 17.9 39.7 2.2 3.7YARN AND THREAD MILLS .......................................... 100.0 42.1 42.4 7.9 7.6 71 .3 31.5 29.5 5.4 4.9 61.9 26.7 26.9 4.4 3.9MEN'S ANO BOYS' SUITS AND COATS ................... 100.0 24.8 62.9 3.0 9.4 74 .9 20.0 46 .0 2.3 6.5 70.3 18.2 43.7 2.2 6.2MEN'S AND BOYS' FURNISHINGS ............................ 100.0 15.0 73.3 1.7 10.0 66 .4 10.6 48 .3 1.1 6.4 60.4 9.6 44.4 1.0 5.4WOMEN'S AND MISSES' OUTERWEAR ....................... 10C.0 15.0 75.6 2.C 7.4 66.7 10.7 49 .9 1.1 5.0 61 .4 9.6 46.1 .9 4 .7WOMEN'S AND CHILDREN'S UNDERGARMENTS . . . . 100.c 12.7 78.3 1.2 7.8 66.4 10.0 50 .5 1.0 4.9 61.3 8.9 47.1 .8 4.5CHILDREN'S OUTERWEAR ..........................................'. 100.0 11.2 74.9 1.6 12.3 64 .0 7.5 47 .5 1.1 7.8 57.5 6.2 43.2 .9 7.1SAWMILLS AND PLANING MILLS .............................. 100.c 74. 3 6.1 18.8 .8 67 .7 50.0 4.4 12.9 .5 60.5 44.5 4.1 11.5 .4MILLWORK, PLYWOOD AND RELATED PRODUCTS . . 100.c 74.0 13.5 1C.4 2.1 69 .4 5,2.6 9. 1 6.6 1.0 59.3 45 .5 7.7 5.3 .8HOUSEHOLD FURNITURE .............................................. 100.0 61.5 24.4 1C.5 3.6 70 .3 44 .6 16.2 7.0 2.5 62 .7 40.0 14.5 5.9 2.3PULP AND PAPER MILLS ............................................ 100.0 81.0 12.4 5.9 . 7 84.8 70.4 9.5 4.3 .5 78.1 64 .9 8.9 3.9 .4PAPERBOARD CONTAINERS AND BOXES ................... 100.c 63 .9 23.0 10.0 3. 1 76.6 50 .9 16.4 7.4 1.8 67.8 45.1 14.9 6.4 1.4NEWSPAPERS ................................................................... 100.c 64.3 31.3 3. 1 1.3 74.8 50.8 21.1 2.1 .8 69.6 47-. 8 19.3 1.8 .7COMMERCIAL PRINTING .............................................. 100.0 63 .9 28.8 4.6 2.7 74.8 51.0 18.9 3.3 1.5 67 .9 46 .9 16.7 2.9 1.4INDUSTRIAL CHEMICALS ............................................ 100.c 79 .6 12.9 6.9 .6 88.3 71.5 10.7 5.8 .4 83.3 67 .9 9.8 5.3 .3PLASTICS MATERIALS AND SYNTHETICS .............. 100.0 71.6 19.9 6.4 2.1 85.9 63 .4 15.7 5.4 1.4 79.6 59.4 14.3 5.0 .9DRUGS .............................................................................. 100.c 53 .9 36.4 6.4 3.4 83. 1 47 .9 28 .4 4.7 2.2 77.0 44 .4 26.4 4.3 1.9SOAP, CLEANERS, AND TOILET GOODS ................ 100. c 52.4 36.5 fc. 3 4. 7 73.6 42.5 24 .5 4.0 2.5 66 .0 39.0 21.1 3.4 2.4PETROLEUM REFINING ................................................. 1C0.C 80.3 13.6 5.1 .9 87.6 72.1 10.9 3.8 .7 82.1 68 .7 9.4 3.3 . 7TIRES AND INNER TUBES .......................................... 100.c 79 .4 10.5 9.4 .7 87. 1 70. 1 8.7 7.8 .5 81.4 66 .2 8.2 6.5 .5OTHER RUBBER PRODUCTS .......................................... 100.0 56.8 32.8 7.0 3.3 73.4 45 .8 21.6 4.6 1.4 66 .6 41 .8 20. 1 3.6 1.2FOOTWEAR, EXCEPT RUBBER ..................................... 100 .c 33.6 62.4 1.2 2.7 69 .2 25 .2 41 .8 .7 1.5 62 .3 21.9 38.3 .7 1.4GLASS AND GLASSWARE, PRESSED OR BLOWN . . . 100.0 57.8 32.9 5.7 3.7 72.8 43 .7 22.8 4.2 2.1 65 .7 39.8 20.7 3.5 1.7CONCRETE, GYPSUM, AND PLASTER PROOUCTS . . 100.c 79.9 6.1 13.7 .3 74.2 60 .0 4.1 9.9 . 1 61 .7 50.3 3.6 1.7 . 1BLAST FURNACE AND BASIC STEEL PRODUCTS . . 10C.C 81.0 5.3 13.2 .5 85 .4 70.0 4.1 l i . O .4 81.6 67.2 3.9 1C.2 .4IRON AND STEEL FOUNDRIES ................................... 100. c 68.0 5.1 26.1 .8 80.3 55.1 3.8 21.0 .5 72.1 49 .9 3.3 18.4 .5NCNFERROUS ROLLING AND DRAWING ..................... 100.c 75.6 14.9 7.4 2.1 82.0 63 .9 11.1 5.7 1.2 74.1 58.2 9.9 5.0 1.0CUTLERY, HAND TOOLS, AND HARDWARE .............. 100.0 58.7 32.0 6.2 3.1 77.4 49 .2 22 .4 4.0 1.9 71.0 45.0 20.8 3.4 1.8FABRICATED STRUCTURAL METAL PRODUCTS . . . . 100.0 79.9 11.3 7.6 1.1 75 .6 62.1 7.5 5.4 .6 64.4 53. 1 6.2 4.5 .6SCREW MACHINE PRODUCTS, BOLTS, ETC ............ 100.c 71.5 21.9 5.5 1.1 76.7 56 .9 15.0 4.0 .8 68 .7 52.0 13.0 3. 1 .6me tal STAMPINGS ........................................................ 100.c 66 .7 20.1 1 l .C 2.2 77.8 55.3 13. 1 8.2 1. 1 71.2 ,51.3 11.7 7.2 1.0ENGINES AND TURBINES ............................................ 10C.C 78.2 14.1 6.6 1.0 84.2 67.0 11.5 4.9 .8 79.0 63. 1 10.5 4.6 .8FARM MACHINERY .......................................................... 1OC.0 81.6 11.9 5.8 .7 75.0 62.6 7.6 4.2 .5 68 .3 57.3 7.2 3.4 .5CONSTRUCTION AND RELATED MACHINERY ............ 10C.0 82.5 11.0 5.e .6 84.9 71.0 8.8 4.8 .4 77.0 65.0 7.8 3.8 .3
Digitized for FRASER http://fraser.stlouisfed.org/ Federal Reserve Bank of St. Louis
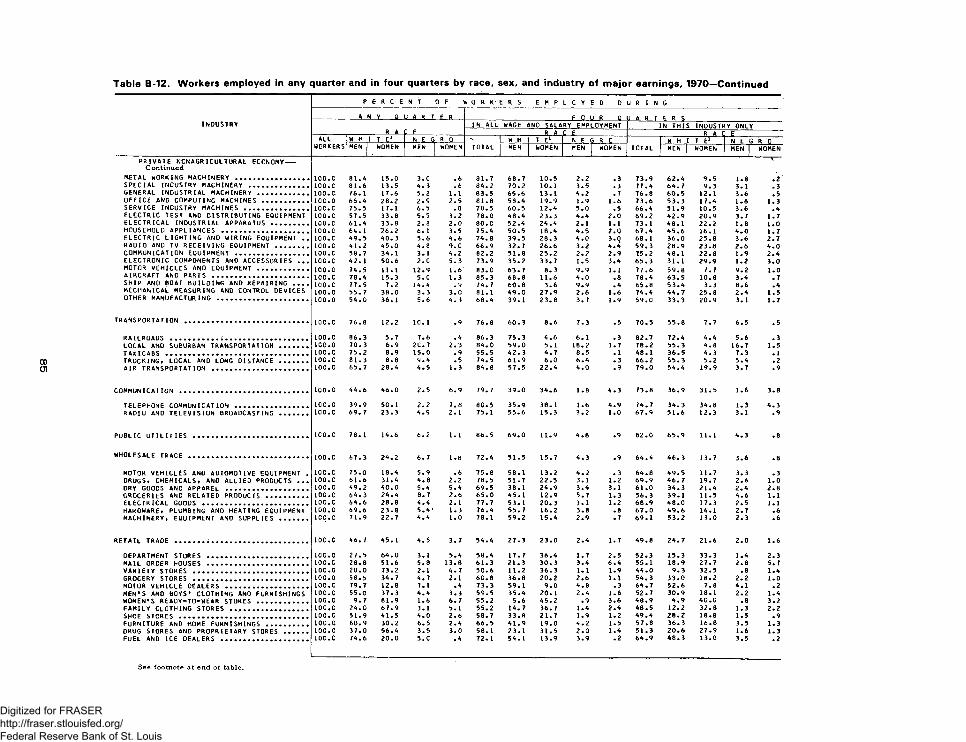
INDUSTRY
p € R C E N T Cl F 1p» 0 R K> E R S E M P L C Y E D D U R I N G
___A._N ___ Q_JU. A _R T ,J_B__ F 0 U R Q U A R T E R SIN ALL WAGE iAND SALARY EMPLOYMENT IN THIS INDUSTRY ONLY
R A p E R A C E R A C EALL
WORKERSW H I T E1 N E G R 0
TOTAL1 W H I T E1 N E G R C
TOTALW H I T E1 N E G R 0
MEN | WOMEN MEN ] WOMEN | MEN | WOMEN MEN J WOMEN MEN p WOMEN MEN 1 WOMEN
PRIVATE NCNAGR1CULTURAL ECCNCMY----- 5--
ContinuedM£TAL w o r k i n g m a c h i n e r y .................. 1CC.C 81.A 15.0 3.C .6 81.7 68.7 10.5 2.2 .3 73.9 62.A 9.5 1.8 .2SPECIAL INCUSTRY MACHINERY ............... 100.C 81.6 13.5 A. 3 .6 8A.2 70.2 10. 1 3.5 .3 77.A 6A.7 9.3 3.1 .3GENERAL INDUSTRIAL MACHINERY ............ 100.C 76. 1 17.6 5.2 l.l 83.5 65.6 13. 1 A.2 .7 76.8 60.5 12.1 3.6 .5OFFICE AND COMPUTING MACHINES ........... 10C.0 66.A 28.2 2.9 2.5 61.8 58.A 19.9 1.9 1.6 73.6 53.3 17.A 1.6 1.3SERVICE INDUSTRY MACHINES ................ 10C.C 75.5 17.1 6.5 .8 78.5 60.5 12.A 5.0 .5 66.A 51.9 10.5 3.6 .AELECTRIC TEST AND DISTRIBUTING EQUIPMENT 100.C 57.5 33.8 5.5 3.2 78.0 A8.A 23.3 A.A 2.0 69.2 A2.9 20.9 3.7 1.7ELECTRICAL INDUSTRIAL APPARATUS ......... 100.C 61.A 33.8 2.8 2.0 80.C 52.A 2A.A 2.1 1.1 73.1 A8.1 22.2 1.8 1.0HOUSEHOLD APPLIANCES .................. . 100.c 6A.1 26.2 6. 1 3.5 75.A 50.5 18.A A.5 2.0 67.A A5.6 16.1 A. 0 1.7ELECTRIC LIGHTING AND WIRING EQUIPMENT .. 1 0 0 . c A9.5 AO.3 5.6 A.6 7A.8 39.5 28.3 A . 0 3.0 68.1 36.0 25.8 3.6 2.7RADIO AND TV RECEIVING EQUIPMENT....... 100.0 A 1.2 A5.0 A.8 9. C 66.9 32.7 26.6 3.2 A.A 59.3 28.9 23.8 2.6 A. 0COMMUNICATION EQUIPMENT .................. 100.c 58.7 3A.1 3. 1 A.2 82.2 51.8 25.2 2.2 2.9 75.2 A8.1 22.8 1.9 2.AELECTRONIC COMPONENTS AND ACCESSORIES ... 1CC.C A2. 1 50.6 2 . C 5.3 73.9 35.2 33.7 1.5 3.A 65.3 31.1 29.9 1.2 3.0MOTOR VEHICLES AND EQUIPMENT ............ 100.0 7A.5 11.1 12.9 1.6 83.0 63.7 8.3 9.9 1.1 77.6 59.8 7.7 9.2 1.0AIRCRAFT AND PARTS ........................ 1C0.C 78.A 15.3 5.0 1.3 85.3 68.8 11.6 A . 0 .8 78.A 63.5 10.8 3.A .7SHIP AND BOAT BUILDING AND REPAIRING .... 100.c 77.5 7.2 1A. A .9 7A.7 60.8 3.6 9.9 .A 65.8 53.A 3.3 8.6 .AMECHANICAL MEASURING AND CONTROL DEVICES 100.0 55.7 38.0 3.3 3.0 81.1 A9.0 27.9 2.6 1.6 7A.A AA.7 25.8 2.A 1.5OTHER MANUFACTURING ....................... 100.0 5A.0 36. 1 5.6 A.3 68.A 39.1 23.8 3.7 1.9 59.0 33.3 20.9 3.1 1.7
TRANSPORTATION ............................... 10C.C 76.8 12.2 10. 1 .9 76.8 60.3 8.6 7.3 .5 70.5 55.8 7.7 6.5 .5
RAILROADS .................................. 100.c 86.3 5.7 7.6 .A 86.3 75.3 A.6 6.1 .3 82.7 72.A A.A 5.6 .3LOCAL AND SUBURBAN TRANSPORTATION ....... 1CC.C 70.3 6.9 2C.7 2.3 8A.0 59.0 5.1 18.2 1.7 78.2 55.3 A.8 16.7 1.5TAXICABS ................................... 100.c 75.2 8.9 15.0 .9 55.5 A2.3 A.7 8.5 .1 A8.1 36.5 A.3 7.3 . lTRUCKING* LOCAL AND LONG DISTANCE ....... 100.c 81.3 8.8 9. A .5 7A.5 61.9 6.0 6.A .3 66.2 55.3 5.2 5.A .2AIR TRANSPORTATION ........................ 100.c 65.7 28.A A.5 1.3 8A.8 57.5 22.A A. 0 .9 79.0 5A.A 19.9 3.7 .9
COMMUNICATION ................................ 100.c A A . 6 A6.0 2.5 6.9 79.7 39.0 3A.6 1.8 A.3 73.8 36.9 31.5 1.6 3.8
TELEPHONE COMMUNICATION .................. ICC.C 39.9 50.1 2.2 7. 8 80.5 35.9 38. 1 1.6 A.9 7A.7 3A.3 3A.8 1.3 A.3RADIO AND TELEVISION BROADCASTING ....... 100.c 69.7 23.3 A.9 2.1 75. 1 55.6 15.3 3.2 1.0 67.9 51.6 12.3 3.1 .9
PUBLIC UTILITIES ............................ ICC.C 78. 1 1A . 6 6.2 l.l 86.5 69.0 11.9 A.8 .9 82.0 65.9 11.1 A.3 .8
WHOLESALE TRADE .............................. 100.c 67.3 2A.2 6.7 1.8 72.A 51.5 15.7 A.3 .9 6A.A A6.3 13.7 3.6 .8
MOTOR VEHICLES AND AUTOMOTIVE EQUIPMENT . 10C.C 73.0 18.A 5.9 .6 75.8 58.1 13.2 A.2 .3 6A.8 A9.5 11.7 3.3 .3DRUGS, CHEMICALS, AND ALLIED PROOUCTS ... 100.c 61.6 31.A A.8 2.2 78.5 51.7 22.5 3.1 1.2 69.9 A6.7 19.7 2.6 1.0ORY GOODS AND APPAREL .................... 100.c A9.2 AO. 0 5.A 5.A 69.5 38.1 2 A.9 3.A 3. 1 61.0 3A.3 21.A 2.A 2.8GROCERIES AND RELATED PRODUCTS .......... 100.c 6A.3 2A.A 8.7 2.6 65.0 A5.1 12.9 5.7 1.3 56.3 39.1 11.5 A.6 l.lELECTRICAL GOODS .......................... 100.c 6 A. 6 28.8 A.A 2.1 77.7 53.1 20.3 3.1 1.2 68.9 A8.0 17.3 2.5 1.1HARDWARE, PLUMBING ANO HEATING EQUIPMENT 100.c 69.6 23.8 5.A 1 1.3 76.A 55.7 16.2 3.8 .8 67.0 A9.6 1A.1 2.7 .6MACHINERY, EQUIPMENT AND SUPPLIES ....... ICC.C 71.9 22.7 A. A 1.0 78. 1 59.2 15.A 2.9 .7 69.1 53.2 13.0 2.3 .6
RETAIL T R A D E ....... ......................... 10C.C A6.7 A5.1 A.5 3.7 5A.A 27.3 23.0 2.A 1.7 A9.8 2A.7 21.6 2.0 1.6
DEPARTMENT STORES ................. ....... 100.0 27.5 6A.0 3. 1 5.A 58.A 17.7 36.A 1.7 2.5 52.3 15.3 33.3 l.A 2.3MAIL ORDER HOUSES ......................... 100.c 28.8 51.6 5.8 13.8 61.3 21.3 30.3 3.A 6.A 55.1 18.9 27.7 2.8 5.7VARIETY STORES ............................. 100.0 20.0 73.2 2.1 A. 7 50.6 11.2 36. 3 1.1 1.9 AA.O 9.3 32.5 .8 l.AGROCERY STORES ............................ 100.0 58.5 3A.7 A.7 2.1 60.8 36.8 20.2 2.6 1.1 5A.3 33.0 18.2 2.2 1.0MOTOR VEHICLE DEALERS .................... 100.c 79.7 12.8 7.1 .A 73.3 59.1 9.0 A.8 .3 6A.7 52.6 7.8 A . 1 .2MEN'S ANO BOYS' CLOTHING AND FURNISHINGS 100.c 55.0 37.3 A. A 3.3 59.5 35.A 20.1 2.A 1.6 52.7 30.9 18.1 2.2 l.AWOMEN'S READY-TO-WEAR STORES ............ 100.0 9.7 81.9 1.6 6.7 55.2 5.6 A5.2 .9 3.6 A8.9 A.9 AO .0 .8 3.2FAMILY CLOTHING STORES ................... 10C.C 2A.0 67.9 3.1 5. 1 55.2 1A.7 36.7 1. A 2.A A8.5 12.2 32.8 1.3 2.2SHOE STORES ................................ 100.c 51.9 A 1 • 5 A. 0 2.6 58.7 33.8 21.7 1.9 1.2 A9.A 28.2 18.8 1.5 .9FURNITURE ANO HOME FURNISHINGS .......... 10C.0 60.9 30.2 6.5 2.A 66.5 A1.9 19.0 A.2 1.5 57.8 36.3 16.8 3.5 1.3DRUG STORES AND PROPRIETARY STORES ...... 100.c 37.0 56.A 3.5 3.0 58.1 23.1 31.5 2.0 1 . A 51.3 20.6 27.9 1.6 1.3FUEL AND ICE DEALERS ...................... 100.c 7A.6 20.0 5 . C .A 72. 1 5 A . 1 13.9 3.9 .2 6A.9 A8.3 13.0 3.5 .2
Digitized for FRASER http://fraser.stlouisfed.org/ Federal Reserve Bank of St. Louis
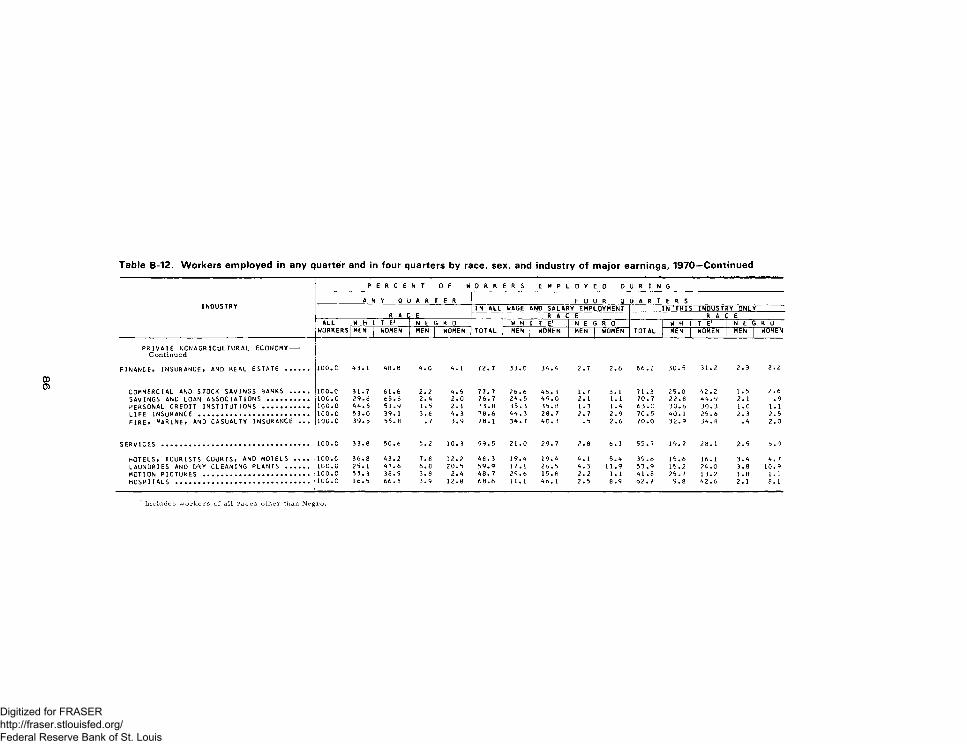
INOUSTRY
p E R C E N T O F W 0 R K E R S E M P L. 0 Y E 0 D U R I N G
A N Y Q U A R T E R F 0 U R 0 U A R T E R SIN ALL WAGE AND SALARY EMPLOYMENT IN THIS INDUSTRY ONLY
R A C E R A C : E R A 1: EALL
WORKERSW H I T E1 N E G R 0
TOTALW H I T E1 N E G R 0
TOTALW H I T El N E G R 0
MEN | WOMEN MEN | WOMEN MEN j WOMEN MEN 1WOMEN MEN | WOMEN MEN | WOMEN'
PRIVATE NCNAGRICULTURAL ECONOMY----Continued
FINANCE, INSURANCE, AND REAL ESTATE ............ 100 .c A3. 1 A8.8 A . 0 A. 1 72.7 33.0 3 A . A 2.7 2.6 66.2 30.5 31.2 2.3 2.2
COMMERCIAL AND STOCK SAVINGS BANKS ......... 100.c 31.7 61.6 2.2 A . 5 77.7 26.6 A6.3 1.7 3.1 71.3 25.0 A2.2 1.5 2.6SAVINGS ANC LOAN ASSOCIATIONS ..................... I0C.C 29.8 65.8 2. A 2.0 76.7 2A.5 A9.0 2.1 1.1 70.7 22.8 A A . 9 2.1 .9PERSONAL CREDIT INSTITUTIONS ....................... 100.c AA.5 51.9 1.5 2.1 73.8 35.3 35.8 1.3 1. A 6 3 . C 30.6 30.3 l .C 1.1LIFE INSURANCE ....................................................... 1C0.C 53.0 39.1 3.6 A. 3 78.6 AA. 3 28. 7 2.7 2.9 70.5 AO. 1 25.6 2.3 2.5FlREt MARINE, AND CASUALTY INSURANCE . . . 1 0 0 . c 39.5 55.8 .7 3.9 78.1 3A.7 AO .3 .5 2.6 70.0 32.9 3 A . 8 .A 2.0
SERVICES .......................................................................... 100.c 33.8 50.6 5.2 10.3 59.5 21.0 29. 7 2.8 6. 1 55.7 19.2 28.1 2.5 5.9
HOTELS, TOURISTS COURTS, AND MOTELS . . . . 100.c 36.8 A3.2 7.8 12.2 A 8.3 19 .A 19. A A. 1 5. A 39.8 15.6 16.1 3 . A A. 7LAUNDRIES AND DRY CLEANING PLANTS ............ 10C.C 25.1 A7.6 6.8 20.5 59.9 17.1 26.5 A . 3 11.9 53.9 15.2 2A.0 3.8 10.9MOTION PICTURES ..................................................... 100.c 55.3 38.5 3.8 2 . A A8.7 29 .6 15.8 2.2 1.1 A 1.8 25.7 13.2 1.8 1.1HOSPITALS ................................................................... 10C.C 16.5 66.8 3.9 12.8 68.6 11.1 A6. 1 2.5 8.9 62 .7 9.8 A2.6 2.1 8. 1
Includes workers of all races other than Negro .
Digitized for FRASER http://fraser.stlouisfed.org/ Federal Reserve Bank of St. Louis
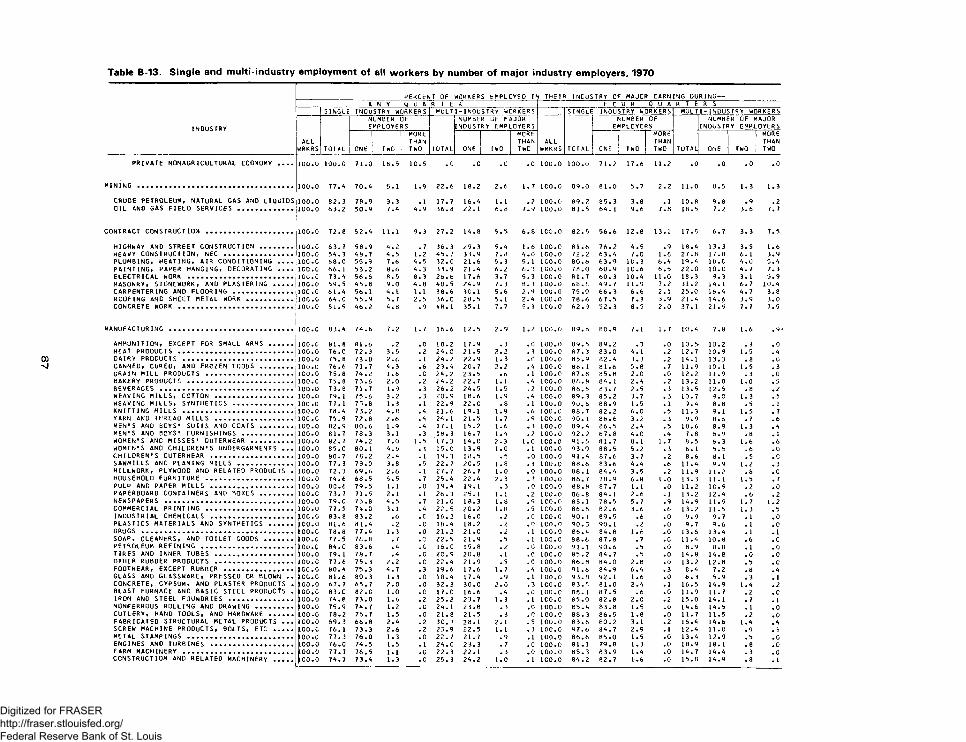
PERCENT OF WORKERS EMPLOYED IN THE I ft INDUSTRY OF MAJOR EARNING DURING-A N Y Q U A R T E R F C U R Q U A R T E R S
SINGLE INDUSTRY WORKERS MULTI-INDUSTRY WORKERS SINGLE INDUSTRY WORKERS MULTI-INDUSTRY WORKERSNUMBER OF NUMBER OF MAJOR NUMBER OF NUMBER OF MAJOR
INDUSTRY EMPLOYERS INDUSTRY EMPLOYERS EMPLOYERS INDUSTRY EMPLOYERSMORE MORE MORE MORE
ALL THAN THAN ALL THAN THANWRKRS TOTAL ONE TWO TWO TOTAL ONE TWO TWO WRKRS TCTAL CNE TWO TWO TOTAL ONE TWO TWO
PRIVATE NONAGRICULTURAL ECONOMY . . . . 100.0 100.c 71.0 18.5 10.5 . C .0 .0 .0 100.0 100.0 71.2 17.6 11.2 .0 .0 .0 .0
MINING .............................................................................. 100.0 77.4 70 .4 5.1 1.9 22.6 18.2 2.6 1.7 1C0.0 89.0 81.0 5.7 2.2 11.0 8.5 1.3 1.3
CRUDE PETROLEUM, NATURAL GAS AND LIQUIDS 100.0 82.3 78.9 3.3 .1 17.7 16.4 1.1 .2 100.0 89 .2 85.3 3.8 . 1 10.8 9.8 .9 .2OIL AND GAS FIELD SERVICES ............................ 100.0 63.2 50 .9 7.4 4.9 36.8 22.1 6.8 7.9 ICO.O 81.5 64.1 9.6 7.8 18.5 7.2 3.6 7. 7
CONTRACT CONSTRUCTION ........................................... 100.0 72.8 52 .4 11.1 9.3 27.2 14.8 5.5 6 .8 1C0.0 82.5 56.6 12.8 13.1 17.5 6.7 3.3 7.5
HIGHWAY AND STREET CONSTRUCTION ................ 100.c 63.7 58.9 4.2 .7 36.3 29.3 5 .4 1.6 100.0 81 .6 76 .2 4.5 .9 18.4 13.3 3.5 1.6HEAVY CONSTRUCTION, NEC .................................. 100.0 54.3 48.7 4.5 1.2 45. 7 33.9 7.8 4 .0 100.0 72.2 63 .4 7.0 1.8 27.8 17.8 6.1 3.9PLUMBING, HEATING, AIR CONDITIONING . . . . 100.0 6 8 . C 55.9 7.6 4.5 32.0 21.6 5 .3 5.1 ICO.O 80 .6 63 .9 10.3 6.4 19.4 10.C 4.0 5.4PAINTING, PAPER HANGING, DECORATING . . . . 1C0.C 66. 1 53.2 8.6 4.3 33.9 21.4 6.2 6.3 ICO.O 78.0 60.9 10.6 6.5 22 .0 10.0 4 .7 7.3ELECTRICAL WORK ..................................................... 1CC.C 73.4 56.6 8.5 8.3 26.6 17.6 3.7 5.3 ICO.O 81.7 60 .3 10.4 11.0 18.3 9.3 3.1 5.9MASONRY, STONEWORK, AND PLASTERING .......... 100.0 59.5 45.8 9.0 4 .8 40.5 24.9 7.3 8.3 ICO.O 68.8 49.7 11.9 7.2 31.2 14.1 6. 7 10.4CARPENTERING AND FLOORING .............................. 100.0 61.4 56.1 4.1 l . l 38.6 30.1 5.6 2.9 100.0 75.0 66 .3 6.6 2.1 25.0 16.4 4.7 3.8ROOFING AND SHEET METAL WORK ....................... 10C.0 6 4 . C 55.9 5.7 2.5 3 6 . C 28.5 5.1 2.4 100.0 78 .6 67 .5 7.3 3.9 21.4 14.6 3.9 3.0CONCRETE WORK ....................................... ................. 100.0 51.9 46 .2 4.8 .9 48.1 35.1 7.7 5.3 ICO.O 62.9 52.3 8.5 2.0 37.1 21.9 7.7 7.5
MANUFACTURING .............................................................. 10G.0 83.4 74.6 7.2 1.7 16.6 12.5 2.9 1.2 ICO.O 89.6 80 .9 7.1 1.7 10.4 7.8 1.6 .9 -
AMMUNITION, EXCEPT FOR SMALL ARMS ............ 1C0.C 81.8 81.6 .2 .0 18.2 17.9 .3 .0 100.0 89 .5 89.2 .3 .0 10.5 10.2 . 3 .0MEAT PRODUCTS ......................................................... 100.0 7 6 .C 72.3 3.5 .2 24.0 21.5 2.2 . 3 100.0 87.3 83.0 4.1 .2 12.7 10.9 1.5 .4DAIRY PRODUCTS ..................................... ................. 100.0 75.8 73.0 2.6 . 1 24.2 22.9 1.3 . 0 100.0 85 .9 82 .4 3.3 .2 14.1 13.3 . 8 .0CANNED, CURED, AND FROZEN FOODS ................ 100.0 76.6 71.7 4.3 .6 23.4 20.7 2.2 .4 100.0 88.1 81.6 5.8 .7 11.9 10.1 1.5 .3GRAIN MILL PRODUCTS ........................................... 1C0.0 75.8 74.2 1.6 .0 24.2 23.5 .6 . 1 100.0 87.8 85.8 2.0 .0 12.2 11.9 . 3 .0BAKERY PRODUCTS ..................................................... 100.0 75. B 73.6 2.0 .2 24.2 22.7 1.1 .4 ICO.O 86 .8 84.1 2.4 .2 13.2 11.8 1.0 . 5BEVERAGES .................................................................. 100.0 73.8 71.7 1.9 .3 26.2 24.5 1.5 .2 ICO.O 86.5 83.7 2.5 . 3 13.5 12.5 .8 .2WEAVING MILLS, COTTON ....................................... 1CC.0 79. 1 75.6 3.2 .3 20.9 18.6 1.9 .4 ICO.O 89.3 85.2 3.7 .3 10.7 9.0 1.3 .5WEAVING MILLS, SYNTHETICS .............................. 100 .0 77.1 75.8 1.3 . 1 22.9 22.0 . 8 . 1 100.0 90 .6 88 .9 1.5 . 1 9.4 8 . 8 .5 . 1KNITTING MILLS ....................................................... 100.0 78.4 73.2 4.8 .4 21.6 19.1 1.9 .6 100.0 88 .7 82.2 6.0 .5 11.3 9.1 1.5 . 7YARN AND THREAD MILLS ....................................... 100.0 75.9 72.8 2.6 .4 24. 1 21.5 1.7 .9 ICO.O 90.1 86.6 3.2 . 3 9.9 8.6 .7 .6MEN'S ANO BOYS' SUITS AND COATS ................ 100.0 82.9 8 C .6 1.9 .4 17.1 15.2 1.6 .3 100.0 89 .4 86.5 2.4 .5 10.6 8.9 1.3 .4MEN'S AND BOYS' FURNISHINGS ......................... 100.0 81.7 78.3 3.1 .3 18. 3 16.7 1.4 .2 100.0 92 .2 87.8 4 . C .4 7.8 6.9 .8 . 1WOMEN'S AND MISSES' OUTERWEAR ..................... 100.0 82.7 74.2 7.0 1.5 17.3 1 4 .C 2.3 1.0 ICO.O 91.5 81 .7 8.1 1.7 8.5 6.3 1.6 .6WOMEN'S AND CHILDREN'S UNDERGARMENTS . . . 100.0 8 5 . C 80.1 4.5 .3 15.0 13.9 1.0 . 1 100.0 93 .9 88 .5 5.2 .3 6. 1 5.5 .6 .0CHILDREN'S OUTERWEAR ......................................... 100.0 80.7 78.2 2.4 . 1 19.3 18.5 . 8 .0 100.0 91 .4 87.6 3.7 .2 8.6 8.1 .5 .CSAWMILLS AND PLANING MILLS ........................... 100.0 77.3 73.0 3.8 .5 22. 7 20.5 1.8 .3 100.0 88.6 83.6 4.4 .6 11.4 9.9 1.2 .3MILLWORK, PLYWOOD AND RELATED PRODUCTS . 100.0 72.3 69 .6 2.6 . 1 27.7 26.7 1.0 .0 100.0 88.1 84.4 3.5 .2 11.9 11.2 .8 .0HOUSEHOLD FURNITURE .............................. ............. 10C.0 74.6 68.5 5.5 . 7 25.4 22.4 2.3 .7 ICO.O 86.7 78.9 6.8 1.0 13.3 11.1 1.5 . 7PULP AND PAPER MILLS ......................................... 100.0 80.6 79.5 1.1 .0 19.4 19.1 . 3 .0 100.0 88.8 87 .7 1.1 .0 11.2 10.9 .2 .0PAPERBOARD CONTAINERS AND BOXES ................ 100.c 73.7 71.5 2.1 . 1 26.3 25.1 1 . 1 .2 ICO.O 86.8 84. 1 2.6 . 1 13.2 12.4 .6 .2NEWSPAPERS ................................................................ 100.0 79.0 73.8 4.5 .7 21.0 18.3 1.8 . 9 100.0 85.1 78.5 5.7 .9 14.9 11.9 1.7 1.2COMMERCIAL PRINTING ........................................... 100.0 77.5 74.0 3. 1 .4 22.5 20.2 1.8 .5 ICO.O 86.8 82.6 3.6 .6 13.2 11.5 1.3 .5INDUSTRIAL CHEMICALS ......................................... ^00.0 83.8 83.2 .6 .0 16.2 16.0 .2 .0 ICO.O 90.1 89.5 .6 .0 9 .9 9.7 . 1 .0PLASTICS MATERIALS AND SYNTHETICS ............ 100.0 81.6 81.4 .2 .0 18.4 18.2 .2 .0 ICO.O 90 .3 90. 1 .2 .0 9.7 9.6 . 1 .0DRUGS ............................................................................ 100.C 78.8 77.4 1.3 .0 21.2 21.0 .2 . 1 ICO.O 86.4 84.8 1.6 .0 13.6 13.4 . 1 .1SOAP, CLEANERS, AND TOILET GOODS .............. LOO . 0 77.5 76.8 . 7 .c 22.5 21.9 .5 . 1 100.0 88.6 87.8 .7 .0 11.4 10.8 .6 .CPETROLEUM REFINING .............................................. 100.0 8 4 . C 83.6 .4 .0 1 6 .C 15.8 .2 .0 ICO.O 91.1 90.6 .5 .0 8.9 8.8 . 1 .0TIRES AND INNER TUBES ....................................... 100.0 79.1 78.7 .4 .0 20 .9 20.8 . 1 .0 100.0 85.2 84.7 .5 .0 14.8 14.8 .0 .0OTHER RUBBER PRODUCTS ....................................... 100.c 77.6 75.3 2.2 .c 22.4 21.9 .5 .0 100.0 86.8 84.0 2.8 .0 13.2 12.8 .5 .0FOOTWEAR, EXCEPT RUBBER .................................. ^00.0 80.4 75.3 4.7 .3 19.6 17.6 1.7 .4 100.0 91 .6 84.9 6.4 .3 8.4 7.2 .8 .4GLASS AND GLASSWARE, PRESSED OR BLOWN . . i c c . c 81.6 80.3 1.3 .0 18.4 17.4 .9 .1 100.0 93 .8 92.1 1.6 .0 6.3 5.9 .3 .1CONCRETE, GYPSUM, AND PLASTER PRODUCTS . i o o . o 67.7 65.7 2.0 .0 32.3 30.0 2 .0 .3 ICO.O 83.5 81.0 2.4 . 1 16.5 14.9 1.4 .2BLAST FURNACE AND BASIC STEEL PRODuCfS . 100.0 8 3 .C 82.0 1.0 .0 1 7 .C 16.6 .4 .0 100.0 88.1 87 .5 .6 .0 11.9 11.7 .2 .CIRON AND STEEL FOUNDRIES ................................ 100.0 7 4 .e 73.0 1.6 .2 25.2 2 3.7 1.3 . 1 100.0 85.0 82.8 2.C .2 15.0 14. 1 . 7 .1n g n f er r o u s r o l l i n g AND DRAWING ................... j i o o . o 75.9 74.7 1.2 .0 24.1 23.8 . 3 .0 100.0 85.4 83 .8 1.5 .0 14.6 14.5 . 1 .0CUTLERY, HAND TOOLS, AND HARDWARE ............ 100.0 78.2 76.7 1.5 .0 21.8 21.5 .3 .0 ICO.O 88.3 86.5 1.8 .0 11.7 11.5 .2 .0FABRICATED STRUCTURAL METAL PRODUCTS . . . 100.0 69.3 66.8 2.4 .2 30. 7 28.1 2.1 .5 100.0 83 .6 80.2 3.1 .2 16.4 14.6 1.4 .4SCREW MACHINE PRODUCTS, BOLTS, ETC .......... 100.c 76. 1 73.3 2.6 .2 23.9 22.5 l . l . 3 100.0 87 .6 84.7 2.9 . 1 12.4 11.0 .9 .5METAL STAMPINGS ..................................................... ^00.0 77.3 76.0 1.3 .0 22.7 21.7 .9 .1 100.0 86 .6 85 .0 1.5 .0 13.4 12.9 .5 .0ENGINES AND TURBINES ......................................... 100.0 76.0 74.5 1.5 . 1 2 4 . C 23.3 .7 .0 100.0 81.1 79.8 1.3 .0 18.9 18. 1 .8 .0FARM MACHINERY ....................................................... l o o . o 77.7 76.5 1.1 .0 22.3 22.1 . 3 .0 100.0 35.3 83 .9 1.4 .0 14.7 14.4 .3 .0CONSTRUCTION AND RELATED MACHINERY ......... ^00.0 74.7 73.4 1.3 .0 25. 3 24.2 1.0 . 1 ICO.O 84.2 82.7 1.6 .0 15.8 14.9 .8 . 1
Digitized for FRASER http://fraser.stlouisfed.org/ Federal Reserve Bank of St. Louis
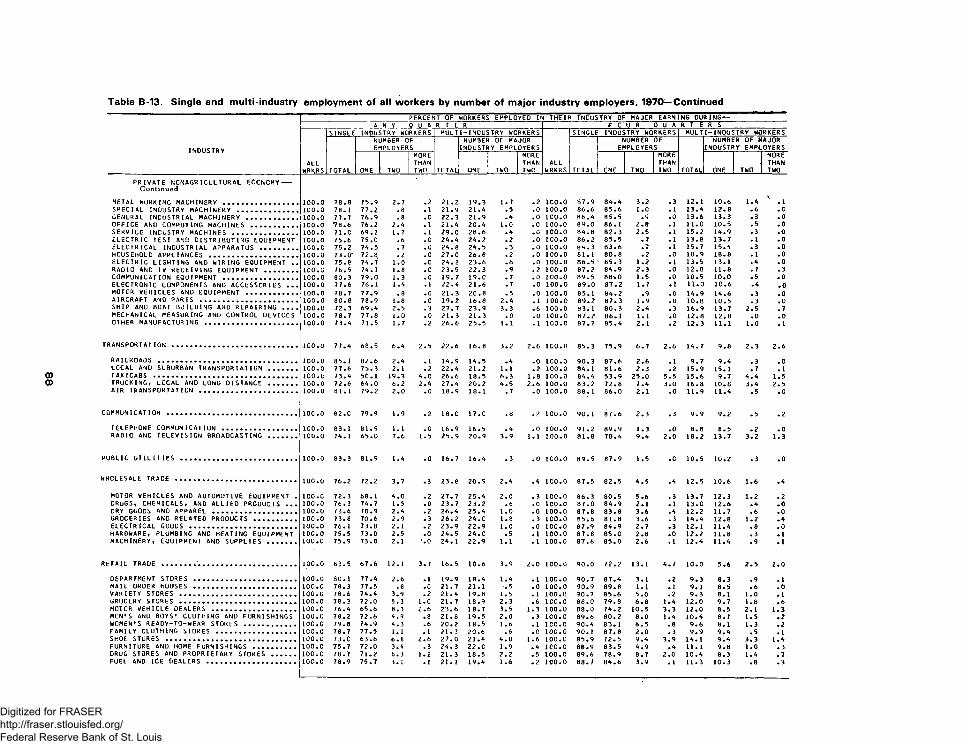
PERCENT OF WORKERS EMPLOYED IN THEIR INDUSTRY OF MAJOR EARNING DURING—A N Y Q U A R T E R F C U R Q U A R T E R S
SINGLE INDUSTRY WORKERS MULTI-INDUSTRY WORKERS SINGLE INDUSTRY WORKERS MULTI-INDUSTRY WORKERSNUMBER OF NUMBER OF MAJOR 1 NUMBER OF NUMBER OF MAJOR
INDUSTRY EMPLOYERS INDUSTRY EMPLOYERS EMPLOYERS INDUSTRY EMPLOYERSMORE MORE MORE MORE
ALL THAN THAN ALL THAN THANWRKRS TOTAL ONE TWO TWO TOTAL ONE TWO TWO WRKRS TOTAL CNE TWO TWO TOTAL ONE TWO TWO
PRIVATE NCNAGRICULTURAL ECONOMY-----Continued
METAL WORKING MACHINERY ..................................... 100.0 78.8 75.9 2.7 .2 21.2 19.3 1.7 .2 100.0 87.9 84 .4 3.2 .3 12.1 10.6 1.4 ' .1SPECIAL INDUSTRY MACHINERY .............................. 100.0 78.1 77.2 .8 .1 21.9 21.4 .5 .0 100.0 86.6 85.6 1.0 .1 13.4 12.8 .6 .0GENERAL INDUSTRIAL MACHINERY .......................... 100.0 77.7 76.9 .8 .0 22 .3 21.9 .4 .0 100.0 86.4 85.5 .9 .0 13.6 13.3 .3 .0OFFICE ANO COMPUTING MACHINES ....................... 100.0 *78.6 76.2 2.4 . 1 21.4 20.4 1.0 .0 100.0 89 .0 86.1 2.8 .1 11.0 10.5 .5 .0SERVICE INDUSTRY MACHINES ................................ 100.0 7 1 .C 69.2 1.7 .1 29.0 28.6 .4 .0 100.0 84.8 82 .3 2:5 .1 15.2 14.9 .3 .0ELECTRIC TEST AND DISTRIBUTING EQUIPMENT 100.0 7 b . 6 75.0 .6 .0 24.4 24.2 .2 .0 100.0 86.2 85 .5 .7 .1 13.8 13.7 .1 .0ELECTRICAL INDUSTRIAL APPARATUS ................... 100.0 75.2 74.5 .7 .0 24.8 24.5 .3 .0 ICO.O 84 .3 83 .6 .7 .1 15.7 15.4 .3 .0HOUSEHOLD APPLIANCES ............................................ 100.0 73.0' 72.8 .2 .0 27 .0 26.8 .2 .0 100.0 81.1 80 .8 .2 .0 18.9 18.8 .1 .0ELECTRIC LIGHTING AND WIRING EQUIPMENT . . 100.0 75.8 74.7 1.0 .0 24.2 23.6 .6 .0 100.0 86.5 • 85.3 1.2 .1 13.5 13.1 .4 .0RADIO AND TV RECEIVING EQUIPMENT ................. 100.0 76.5 74.7 1.8 .c 23.5 22.3 .9 . 2 100.0 87.2 84.9 2.3 .0 12.8 11.8 .7 .3COMMUNICATION EQUIPMENT .................. .................. 100.0 80.3 79.0 1.3 .0 19.7 19.0 .7 .0 100.0 89 .5 88\.0 1.5 .0 10.5 10.0 .5 .0ELECTRONIC COMPONENTS AND ACCESSORIES . . . 100.0 77.6 76.1 1.4 .1 22.4 21.6 .7 .0 100.0 89.0 87 .2 1.7 .1 11.0 10.6 .4 .0MOTOR VEHICLES AND EQUIPMENT .......................... 100.0 78.7 77.9 .8 .0 21.3 20.8 .5 .0 100.0 85.1 84.2 .9 .0 14.9 14.6 .3 .0AIRCRAFT ANC PARTS ................................................. 100.0 80.8 78.9 1.8 .0 19.2 16.8 2.4 . 1 100.0 89.2 87 .3 1.9 .0 10.8 10.5 .3 .0SHIP AND BOAT BUILDING AND REPAIRING . . . . 100.0 72.3 69.4 2.5 .3 27.7 23.9 3.3 .6 100.0 83.1 80 .3 2.4 .3 16.9 13.7 2.5 .7MECHANICAL MEASURING AND CONTROL DEVICES 100.0 78.7 77.8 1.0 .0 21.3 21 .3 .0 .0 100.0 87.2 86.1 1.1 .0 12.8 12.8 .0 .0OTHER MANUFACTURING .............................................. 100.0 7 3 . A 71.5 1.7 .2 26.6 25.5 1.1 . 1 100.0 87.7 85.4 2.1 .2 12.3 11.1 1.0 .1
TRANSPORTATION ............................................................... 100.0 77.4 68.5 6 .4 2.5 22 .6 16.8 3.2 2.6 ICO.O 85.3 75.9 6 .7 2.6 14.7 9.8 2.3 2.6
RAILROADS ......................... , ......................................... 100.0 85. 1 82.6 2.4 .1 14.9 14.5 .4 .0 ICO.O 90 .3 87 .6 2.6 .1 9 .7 9 .4 .3 .0LOCAL AND SUBURBAN TRANSPORTATION .............. 100.0 77.6 75.3 2.1 .2 22.4 21.2 1.1 .2 100.0 84.1 81 .6 2.3 .2 15.9 15.1 .7 .1TAXICABS ........................................................................ 100 .c 73.4 50.1 19.3 4.0 26.6 18.5 6 .3 1.8 100.0 84.4 53 .9 25.0 5.5 15.6 9.7 4 .4 1.5TRUCKING, LOCAL AND LONG DISTANCE .............. 100.0 72.6 64.0 6.2 2.4 27.4 20.2 4.5 2.6 100.0 83 .2 72 .8 7.4 3.0 16.8 10.8 3.4 2.5AIR TRANSPORTATION ................................................. 100.0 81.1 79.2 2.0 .0 18.9 18.1 .7 .0 100.0 88.1 86 .0 2.1 .0 11.9 11.4 .5 .0
COMMUNICATION ................................................................. 10C.0 8 2 .C 79.9 1.9 .2 18.0 1 7 .C .8 .2 ICO.O 90.1 87 .6 2.3 .3 9 .9 9.2 .5 .2
TELEPHONE COMMUNICATION ..................................... 100.0 83. 1 81.9 1.1 .0 16.9 16.5 .4 .0 100.0 91 .2 89 .9 1.3 .0 8.8 8 .5 .2 .0RADIO AND TELEVISION BROADCASTING .............. 100.0 74.1 65.0 7.6 1.5 25.9 20.9 3.9 1.1 100.0 81.8 70.4 9 .4 2.0 18.2 13.7 3.2 1.3
PUBLIC U T IL IT IES .......................................................... 100.0 83.3 81.9 1.4 .0 16.7 16.4 .3 .0 ICO.O 89 .5 87 .9 1.5 .C 10.5 10.2 .3 .0
WHOLESALE TRADE ............................................................ 100.0 76.2 72.2 3.7 .3 23.8 20.9 2.4 .4 ICO.O 87.5 82 .5 4 .5 .4 12.5 10.6 1.6 .4
MOTOR VEHICLES AND AUTOMOTIVE EQUIPMENT . ICO.C 72.3 68.1 4.0 .2 27.7 25.4 2.0 .3 100.0 86.3 80.5 5.6 .3 13.7 12.3 1.2 .2DRUGS, CHEMICALS, AND ALLIED PRODUCTS . . . 100.0 76.3 74.7 1.5 .0 23 .7 23.2 .6 .0 100.0 87.0 84 .9 2.1 .1 13.0 12.6 .4 .0DRY GOODS AND APPAREL .......................................... 100.0 73.6 70.9 2.4 .2 26.4 25.4 1.0 .0 100.0 87.8 83 .8 3.6 .4 12.2 11.7 .6 .0GROCERIES AND RELATED PRODUCTS ..................... 100.0 73.8 70.6 2.9 .3 26 .2 24. C 1.8 .3 100.0 85.6 81.8 3.6 .3 14.4 12.8 1.2 .4ELECTRICAL GOODS ..................................................... 100.0 76.1 73.8 2. 1 .2 23 .9 22 .9 1.0 .0 100.0 87.9 84 .9 2.7 .3 12.1 11.4 .8 .0HARDWARE, PLUMBING AND HEATING EQUIPMENT 100.0 75.5 73.0 2.5 .0 24.5 2 4 . C .5 .1 100.0 87.8 85.0 2.8 .0 12.2 11.8 .3 .1MACHINERY, EQUIPMENT AND SUPPLIES .............. 100 .c 75.9 73.8 2.1 ’.0 24.1 22.9 1.1 . 1 100.0 87.6 85.0 2.6 .1 12.4 11.4 .9 .1
RETAIL TRADE ................................................................... 100.0 83.5 67.6 12.1 3.7 16.5 10.6 3.9 2.0 100.0 90 .0 72 .2 13.1 4.7 10.0 5.6 2.5 2.0
DEPARTMENT STORES ................................... ............... 100.0 80.1 77.4 2.6 .1 19.9 18.4 1.4 .1 100.0 90 .7 87 .4 3.1 .2 9 .3 8.3 .9 .1MAIL ORDER HOUSES ..................... ............................. 100.0 78.3 7 7.5 .8 .0 21 .7 21.1 .5 .0 100.0 90 .9 89 .8 1.1 .1 9.1 8.5 .6 .0VARIETY STORES .......................................................... 100.0 78.6 74.4 3.9 .2 21.4 19.8 1.5 . 1 100.0 90.7 85 .6 5.0 .2 9 .3 8.1 1.0 .1GROCERY S T O R ES ............ ............................................. 100.0 78.3 72.0 5.3 1.0 21 .7 18.9 2.3 .6 ICO.O 88.0 79.8 6.8 1.4 12.0 9 .7 1.8 .6MOTOR VEHICLE DEALERS .......................................... 100.0 76.4 65.6 8.3 2.6 23.6 18.7 3.5 1.3 100.0 88.0 74 .2 10.5 3.3 12.0 8.5 2.1 1.3MEN'S AND BOYS' CLOTHING AND FURNISHINGS 100 .c 78.2 72.6 4.9 .8 21.8 19.5 2 .0 .3 ICO.O 89.6 80.2 8.0 1.4 10.4 8.7 1.5 .2WOMEN'S READY-TO-WEAR STORES .......................... 100.0 79.8 74.9 4.3 .6 20.2 18.5 1.6 . 1 ICO.O 90.4 83 .1 6.5 .8 9 .6 8.1 1.3 .2FAMILY CLOTHING STORES ........................................ 100.0 78.7 77.5 l . 1 .1 21.3 20.6 .6 .0 100.0 90.1 87 .8 2.0 .3 9 .9 9 .4 .5 .1SHOE STORES ............................ •.................................... 100.0 7 3 . C 63.6 6.6 2.6 27.0 21.4 4 .0 1.6 100.0 85.9 72.5 9.4 3.9 14.1 9.4 3.3 1.4FURNITURE AND HOME FURNISHINGS ..................... 100.0 75.7 72.0 3.4 .3 24.3 22.0 1.9 .4 ICO.O 88.9 83.5 4.9 .4 11.1 9.8 1.0 .3DRUG STORES AND PROPRIETARY STORES ............ 100.0 78.7 71.2 6.3 1.2 21.3 18.5 2.2 .5 100.0 89.6 78 .9 8.7 2.0 10.4 8.3 1.4 .7FUEL AND ICE DEALERS ............................................ 10C.C 78.9 75.7 3.1 .1 21.1 19.4 1.6 .2 ICO.O 88.7 84 .6 3.9 .1 11.3 10.3 .8 .3
Digitized for FRASER http://fraser.stlouisfed.org/ Federal Reserve Bank of St. Louis
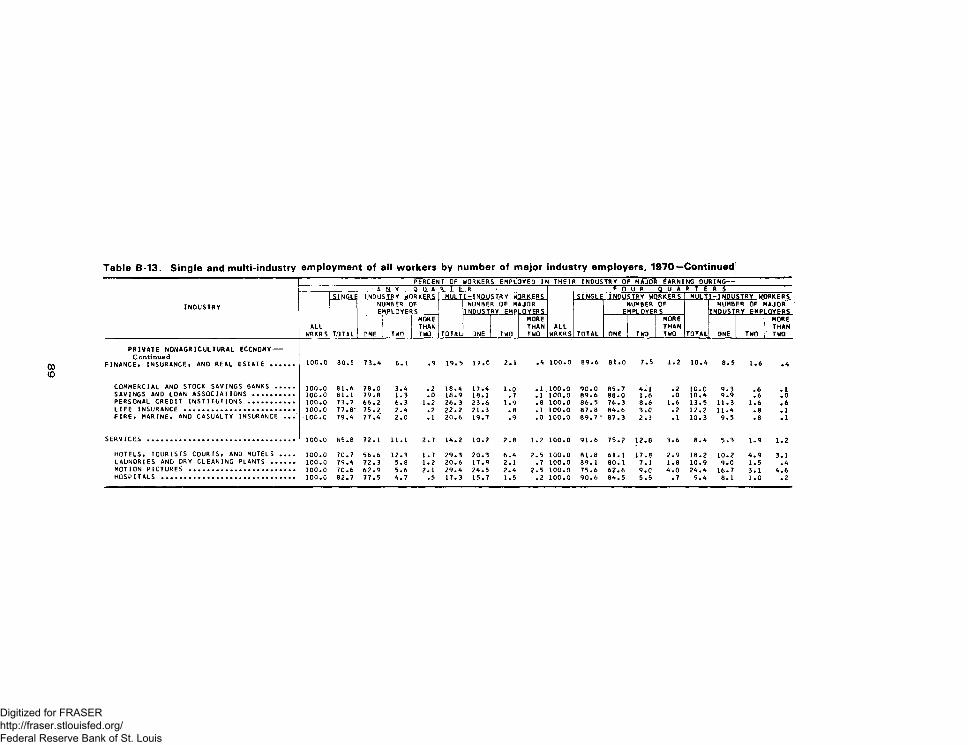
PERCENT OF WORKERS EMPLOYED IA1 THEIR INDUSTRY OF MAJOR EARNING DURING—A N Y Q U A R T E R F 0 U R Q U A R T E R S
SINGLE INDUSTRY WORKERS MULTI-INDUSTRY WORKERS SINGLE INDUSTRY WORKERS MULTI-INDUSTRY WORKERSINDUSTRY NUMBER OF NUMBER OF MAJOR NUMBER OF NUMBER OF MAJOR
EMPLOYERS INDUSTRY EMP LOYERS EMPLOYERS INDUSTRY EMP LOYERSMORE MORE MORE MORE
ALL THAN THAN ALL THAN THANWRKRS T.0TAL ONE TWO TWO TOTAL ONE TWO TWO WRKRS TOTAL ONE TWO TWO TOTAL ONE TWO TWO
p r i v a t e n o n a g r i c u l t u r a l e c o n o m y--Continued
FINANCE, INSURANCE, AND REAL ESTATE ...... 100.0 80.5 73.4 6.1 .9 19.5 17.0 2.1 .4 100.0 89.6 81.0 7.5 1.2 10.4 8.5 1.6 .4
COMMERCIAL AND STOCK SAVINGS BANKS ..... 100.0 81.6 78.0 3.4 .2 18.4 17.4 1.0 .1 100.0 90.0 85.7 4.1 .2 10.0 9.3 .6 .1SAVINGS AND LOAN ASSOCIATIONS .......... 100.0 81.1 79.8 1.3 .0 18.9 18.1 .7 .1 100.0 89.6 88.0 1.6 .0 10.4 9.9 .6 .0PERSONAL CREDIT INSTITUTIONS ........... 100.0 73.7 66.2 6.3 1.2 26. 3 23.6 1.9 .8 100.0 86.5 76.3 8.6 1.6 13.5 11.3 1.6 .6LIFE INSURANCE ......................... .. 100.0 77.8' 75.2 2.4 .2 22.2 21.3 .8 . 1 100.0 87.8 84.6 3.C .2 12.2 11.4 .8 .1FIRE, MARINE, AND CASUALTY INSURANCE ... 100.C 79.4 77.4 2.0 .1 20.6 19.7 .9 .0 100.0 89.7 " 87.3 2.3 .1 10.3 9.5 .8 .1
SERVICES ..................................... 100.0 85.8 72.1 11.1 2.7 14.2 10.2 2.8 1.2 100.0 91.6 75.2 12.8 3.6 8.4 5.3 1.9 1.2
HOTELS, TOURISTS COURTS, AND MOTELS .... 100.0 70.7 56.6 12.3 1.7 29.3 20.3 6.4 2.5 100.0 81.8 61.1 17.8 2.9 18.2 10.2 4.9 3.1LAUNDRIES AND DRY CLEANING PLANTS ...... 100.c 79.4 72.3 5.8 1.2 20.6 17.9 2.1 .7 100.0 89.1 80. 1 7.1 1 .8 10.9 9.0 1.5 .4MOTION PICTURES .......................... 100.0 70.6 62.9 5.6 2.1 29.4 24.5 2.4 2.5 100.0 75.6 62.6 9.0 4.0 24.4 16.7 3.1 4.6HOSPITALS ................................. 100.c 82.7 77.5 4.7 .5 17.3 15.7 1.5 .2 100.0 90.6 84.5 5.5 .7 9.4 8.1 1.0 .2
Digitized for FRASER http://fraser.stlouisfed.org/ Federal Reserve Bank of St. Louis
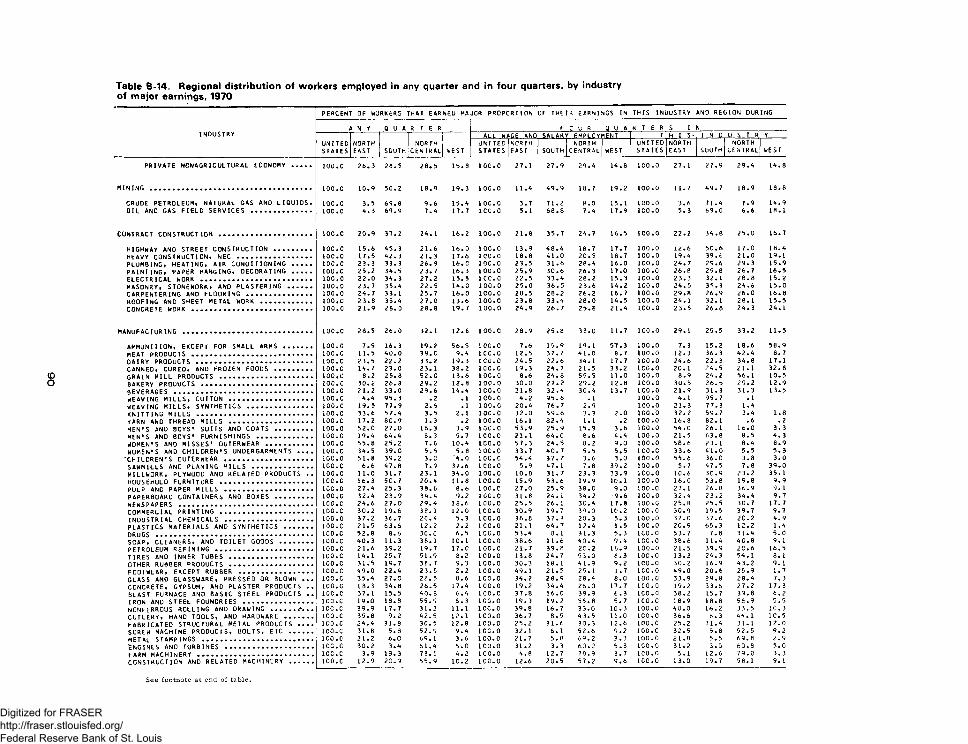
PERCENT OF WORKERS THAT EARNED MAJCR PROPCRTION OF THEIR EARNINGS IN THIS INDUSTRY AND REGION DURING
INDUSTRYN Y Q U A R T E R F C U R Q U A R T E R S I N
UNITEDSTATES
NORTHEAST SOUTH
NORTHCENTRAL WEST
ALL WAGE AND SALARY EMPLOY?4ENT 1 T H l S- I N D U S T R Y____UNITEDSTATES
NORTHEAST SOUTH
NORTH 1c e n t r a l | 71 UNITED
STATESNORTHEAST SOUTH
NORTH^CENTRAL WEST
PRIVATE NONAGRICULTURAL ECONOMY ..... 100.c 26.3 28.5 28.5 15.8 100.0 27.1 27.9 29.4 14.8 100.0 27.1 27.9 29.4 14.8
m i n i n g ........................................ 100.c 10.9 50.2 18.9 19.3 100.0 11.4 49.9 18.7 19.2 100.0 11.7 49.7 18.9 18.8
CRUDE PETROLEUM, NATURAL GAS AND LIQUIDS. 100.0 3.5 69.8 9.6 15.4 100.0 3.7 71.2 8.0 15.1 100.0 3.6 71.4 7.9 14.9OIL AND GAS FIELD SERVICES ............... 10C.C A.3 69.9 7.4 17.7 1C0.0 5.1 68.8 7.4 17.9 ICO.O 5.3 69.0 6.6 18.1
CONTRACT CONSTRUCTION ....................... 100.c 20.9 37.2 24.1 16.2 100.0 21.8 35.7 24.7 16.5 100.0 22.2 34.8 25.0 16.7
HIGHWAY AND STREET CONSTRUCTION ......... 100.0 15.6 45.3 21.6 16.0 100.0 13.9 48.4 18.7 17.7 100.0 12.6 50.6 17.0 18.4HEAVY CONSTRUCTION, NEC .................. 100.0 17.5 42.3 21.3 17.6 100.0 18.8 41.0 20.5 18.7 100.0 19.4 39.6 21.0 19.1PLUMBING, HEATING, AIR CONDITIONING ..... 100.c 23.3 33. 3 26.9 16.0 100.0 23.5 31.6 28.4 16.0 100.0 24.7 29.6 29.3 15.9PAINTING, PAPER HANGING, DECORATING ..... 100.0 25.2 34.5 23.7 16.3 100.0 25.9 30.6 26.3 17.0 100.0 26.8 29.8 26.7 16.5ELECTRICAL WORK ............................ 100.0 22.0 34.3 27.2 15.5 ICO.C 22.5 33.4 28.2 15.3 100.0 23.3 32.1 28.8 15.2MASONRY, STONEWORK, ANO PLASTERING ...... 100.c 23.7 38.4 22.5 14.0 100.0 25.0 36.5 23.6 14.2 100.0 24.5 35.3 24.6 15.0CARPENTERING AND FLOORING ................ 100.0 24.7 33. 1 25.7 16.0 1C0.0 28.5 28.2 26.2 16.7 100.0 29.8 26.9 26.0 16.8ROOFING AND SHEET METAL WORK ............. 100. c 23.8 35.4 27.0 13.6 100.0 23.8 33.4 28.0 14.5 100.0 24.1 32.1 28. 1 15.5CONCRETE WORK .............................. 100.0 21.9 28.0 28.8 19.7 100.0 24.9 26.7 25.8 21.4 100.0 23.5 26.8 24.3 24.1
m a n u f a c t u r i n g ................................ 100.c 28.5 26.0 32. 1 12.6 100.0 28.9 25.8 33.0 11.7 ICO.O 29. 1 25.5 33.2 11.5
AMMUNITION, EXCEPT FOR SMALL ARMS ....... 100.0 7.9 16. 3 19.2 56.5 100.0 7.6 15.9 19.1 57.3 100.0 7.3 15.2 18.6 58.9m e a t p r o d u c t s .............................. 100.c 11.5 40.0 39.C 9.4 1CC.0 12.5 37.7 41.0 8.7 100.0 12.3 36.3 42.4 8.7DAIRY PRODUCTS ............................. 10C.C 23.5 22.2 33.2 19.3 1C0.0 24.5 22.6 34.1 17.7 ICO.O 24.6 22.3 34.8 17.1CANNED, CURED, AND FROZEN FOODS ......... 100.c 14.7 23.0 23. 1 38.2 100.0 19.3 24.7 21.5 33.2 ICO.O 20.1 24.5 21.1 32.8GRAIN MILL PRODUCTS ....................... 1C0.0 8.2. 25.8 52.C 13.6 100.0 8.6 24.8 55.5 11.0 100.0 8.9 24.2 56. 1 10.5BAKERY PRODUCTS ........................... 100.c 30.2 26.8 29.2 12.8 100.0 30.0 27.2 29.2 12.8 100.0 30.5 26.5 29.2 12.9BEVERAGES .................................. 100.c 21.2 33.0 29.6 14.4 1C0.0 21.8 32.4 30.4 13.7 ICO.O 21.9 31.3 31.3 13.5WEAVING MILLS, COTTON ..................... 100.c 4.4 95. 3 .2 .1 1C0.0 4.2 95.6 . 1 100.0 4.1 95.7 . 1WEAVING MILLS, SYNTHETICS ................ 100.c 19.5 77.9 2.5 . 1 100.0 20.4 76.7 2.9 100.0 21.3 77.3 1.4KNITTING MILLS ............................. 100.c 33.6 57.4 3.5 2.1 10C.0 32.0 59.8 3.3 2.0 100.0 32.2 59.7 3.4 1.8YARN AND THREAD MILLS ..................... 100.c 17.2 80.9 1.3 .2 100.0 16.1 82.4 l.l .2 100.0 16.8 82.1 .6 .2MEN'S AND BOYS' SUITS AND COATS ......... 100.c 52.0 27.0 16.3 3.9 100.0 53.9 25.9 15.9 3.6 100.0 54.0 26.1 16.0 3.3MEN'S AND BOYS' FURNISHINGS .............. 100.0 19.4 64.4 8. 3 5.7 1C0.0 21.1 64.0 8.6 4.4 100.0 21.5 63.8 8.5 4.3WOMEN'S AND MISSES' OUTERWEAR ........... LOO . 0 55.8 25.2 7.6 10.4 100.0 57.3 24.5 8.2 9.0 100.0 58.6 23. 1 8.4 8.9WOMEN'S AND CHILDREN'S UNDERGARMENTS .... 1 0 0 . c 34.5 39.0 5.5 5.8 10C.0 33.7 40.7 5.5 5.5 ICO.C 33.6 41.0 5.5 5.3CHILDREN'S OUTERWEAR ...................... 100.0 51.8 39.2 3. C '4.0 1C0.0 54.4 37.7 3.6 3.0 100.0 55.6 36.0 3.8 3.0SAWMILLS AND PLANING MILLS ............... 100.c 6.6 47.8 7.9 37.6 1C0.0 5.9 47. 1 7.8 39.2 100.0 5.7 47.5 7.8 39.0MILLWORK, PLYWOOD AND RELATED PRODUCTS .. 100.c 11.0 31.7 23. 1 34.0 100.0 10.8 31.7 23.3 33.9 ICO.O 10.6 30.9 23.2 35. 1HOUSEHOLD FURNITURE ....................... 10C.C 16.3 5C. 7 20.4 11.8 100.0 15.9 53.6 19.9 1C.1 100.0 16.0 53.8 19.8 9.9PULP ANO PAPER MILLS ...................... 1CC.C 27.4 25.3 38.6 8.6 100.0 27.0 25.9 38.0 9.0 100.0 27.1 26.8 36.9 9. 1PAPERBOARD CONTAINERS AND BOXES ......... 100.0 32.4 23.9 34.4 9.2 100.0 31.8 24.1 34.2 9.6 100.0 32.4 23.2 34.4 9.7NEWSPAPERS ................................. 1 0 0 . c 24.6 27.0 29.4 18.6 100.0 25.5 26.1 30.4 17.8 100.c 25.8 25.5 30.7 17. 7COMMERCIAL PRINTING ....................... 100.c 30.2 19.6 3 8.1 12.0 1C0.0 30.9 19.7 39.0 IC.2 100.0 30.9 19.5 39.7 9.7INDUSTRIAL CHEMICALS ...................... 100.0 37.2 36.7 2C.4 5.3 1C0.0 36.8 37.3 20.3 5.3 100.0 37.0 37.6 20.2 4.9PLASTICS MATERIALS AND SYNTHETICS ....... 1 0 0 . c 21.5 63.6 12.2 2.2 ICO.O 21.1 64.7 12.4 1.5 100.0 20.9 65.3 12.2 1.4DRUGS ....................................... ICO.C 52.8 8.6 3C.C 6.5 1CC.0 53.4 8.1 31.3 5.3 ICO.O 53.7 7.8 31.4 5.0SOAP, CLEANERS, AND TOILET GOODS ........ 100.C 40.3 11.3 38. 1 10. 1 ICO.O 38.6 11.6 40.4 9.4 ICO.O 38.6 11.4 40.8 9.1PETROLEUM REFINING ........................ 100.c 21.6 39.2 19.7 17.C 100.0 21.7 39.8 20.2 16.9 ICO.O 21.5 39.9 20.6 16.5TIRES AND INNER TUBES ..................... 100. c 14.1 25.7 51.9 8.2 100.0 13.8 24.7 53.0 8.3 100.0 13.2 24.3 54.1 8. 1OTHER RUBBER PRODUCTS ..................... 100.c 31.5 19.7 38. 7 9.3 ICO.O 30.3 18. 1 41.9 9.2 ICO.O 30.2 16.9 43.2 9. 1FOOTWEAR, EXCEPT RUBBER .................. 100.c 49.0 22.4 23.5 2.2 100.0 49.1 21.5 25. 1 1.7 ICO.O 49.0 20.6 25.9 1.7GLASS AND GLASSWARE, PRESSED OR BLOWN ... 100.c 35.4 27.0 28.5 8.6 ICO.O 34.2 28.9 28.4 8.0 100.0 33.9 29.8 28.4 7.3CONCRETE, GYPSUM, AND PLASTER PRODUCTS .. 100.0 18.3 34.8 26.5 17.4 ICO.O 19.2 34.4 26.0 17.7 ICO.O 19.2 33.6 27.2 17.3BLAST FURNACE AND BASIC STEEL PRODUCTS .. 100.c 37.1 15.5 40.8 6.4 100.0 37.8 16.0 39.9 6.3 100.0 38.2 15.7 39.8 6.2IRON AND STEEL FOUNDRIES ................. 100.c 19.0 18.8 55.9 6.3 ICO.O 19.3 19.2 55.8 5.7 ICO.C 18.9 18.8 56.9 5.5NONFERROUS ROLLING AND D R A W I N G .......-. . . 10C.C 39.9 17.7 31.2 11.1 1CC.0 39.8 16. 7 33.0 10.3 100.0 40.0 16.2 33.5 1C.3CUTLERY, HAND TOOLS, AND HARDWARE ....... 100.c 35.8 9.2 42.5 12.1 100.0 36.7 8.5 43.5 11.0 100.0 36.6 8.3 44.1 10.5FABRICATED STRUCTURAL METAL PRODUCTS .... 100.c 24.4 31.8 30.5 12.8 100.0 25.2 31.6 30.3 12.6 100.C 25.2 31.4 31.1 12.0SCREW MACHINE PRODUCTS, BOLTS, ETC ...... 100. c 31.8 5.8 52.9 9.4 100.0 32.1 6. 1 52.6 9.2 100.0 32.5 5.8 52.5 9.2m e t a l STAMPINGS ........................... ICO.C 21.2 6.0 69.1 3.6 100.0 21.7 5.8 69.2 3.3 100.0 21.8 5.5 69.8 2.9ENGINES AND TURBINES ...................... 10C.C 30.2 3.4 61.4 5.0 ICO.O 31.2 3.3 60.2 5.3 ICO.O 31.2 3.0 60.8 5.0FARM MACHINERY ............................. 10C.C 3.9 13.3 78.5 4.2 ICO.O 4.8 12.7 78.9 3.7 100.0 5.1 12.6 79.0 3.3CONSTRUCTION AND RELATED MACHINERY ...... ICO.C 12.9 20.9 55.9 10.2 ICO.O 12.6 20.5 57.2 9.6 100.0 13.0 19.7 58.1 9.1
Digitized for FRASER http://fraser.stlouisfed.org/ Federal Reserve Bank of St. Louis
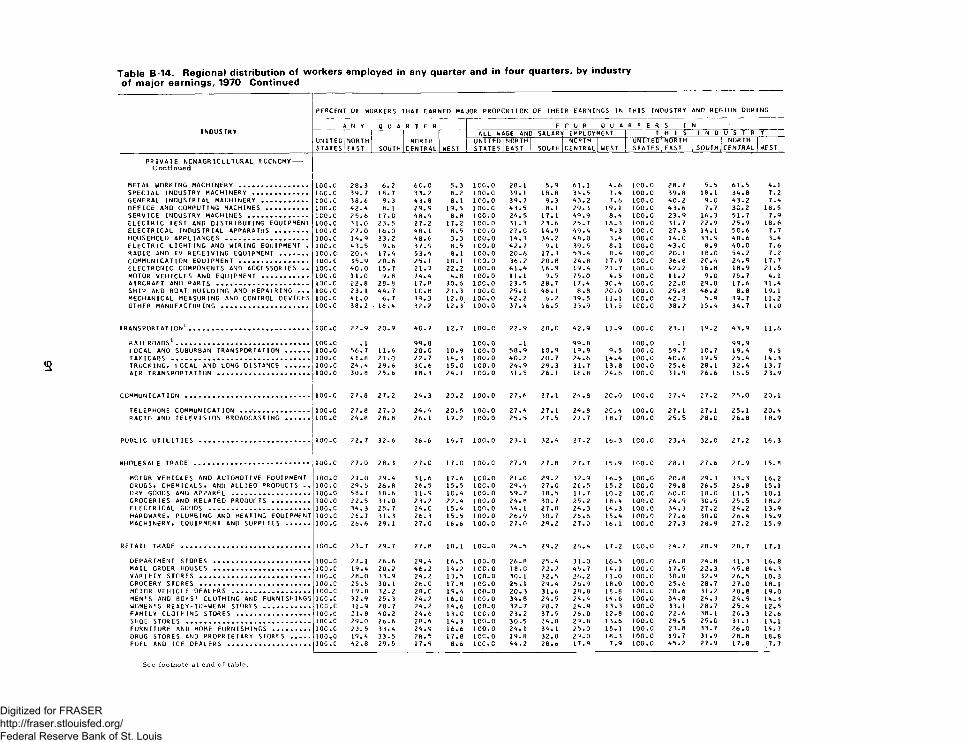
INDUSTRY
PERCENT OF WORKERS THAT EARNED MAJOR PROPCRTION OF THEIR EARNINGS IN THIS INOUSTRY AND REGION DURING
N Y Q U A R T E R F C U R Q U A R T E R S I 1N
UNITEDSTATES
NORTHEAST SOUTH
NORTHCENTRAL WEST
ALL WAGE AND SALARY EMPLOYMENT T H I S I N D U S T R YUNITEDSTATES
NORTH 1 EAST SOUTH ]
NORTHCENTRAL WEST
UNITEDSTATES
NORTHEAST SOUTH
NORTHCENTRAL WEST
PRIVATE NCNAGRICULTURAL ECCNCMY--Continued
METAL WORKING MACHINERY ................. 100. C 28.3 6.2 6C.C 5.3 1C0.0 28. 1 5.9 61.1 4.6 100.0 28.7 5.5 61.5 4.1SPECIAL INDUSTRY MACHINERY .............. 1CC.C 39.7 18.7 33.2 8.2 100.0 39.1 18.8 34.5 7.4 100.0 39.8 18.1 34.8 7.2GENERAL INDUSTRIAL MACHINERY ........... 100.C 3 8.6 9.3 43.8 8.1 1C0.0 39.7 9.3 43.2 7.6 ICO.O 40.2 9.0 43.2 7.4OFFICE AND COMPUTING MACHINES .......... 100. c 42.4 8. 1 29.9 19.5 1CC.C 43.5 8.1 29.3 19.1 100.0 43.6 7.7 30.2 18.5SERVICE INDUSTRY MACHINES ............... 1C0.C 25.6 17.0 48.4 8.8 1C0.0 24.5 17. 1 49.9 8.4 ICO.O 23.9 16.3 51.7 7.9ELECTRIC TEST AND DISTRIBUTING EQUIPMENT 100.c 31.0 23.5 27.2 17.2 100.0 31.3 23.6 25.7 18.3 100.0 31.7 22.9 25.9 18.6ELECTRICAL INDUSTRIAL APPARATUS ........ 100.c 27.0 16.0 48. 1 8.5 1C0.0 27.0 14.9 49.4 8.3 100.c 27.3 14.1 50.6 7.7HOUSEHOLD APPLIANCES .................... 100.c 14.9 33.2 48.6 3.3 100.0 14.3 34.2 48.0 3.4 100.0 14.0 33.9 48.6 3.4ELECTRIC LIGHTING AND WIRING EQUIPMENT . 1C0.C 43.5 9.6 37.9 8.5 100.0 42.7 9. 1 39.5 8.1 100.0 43.0 8.9 40.0 7.6RADIO AND TV RECEIVING EQUIPMENT ....... 100.c 20.4 17.4 53.4 8.1 ICO.O 20.6 17.3 53.4 8.4 100.0 20. 1 18.0 54.2 7.2COMMUNICATION EQUIPMENT ................. 100.c 35.9 20.6 25. 1 18.1 1C0.0 36.2 20.8 24.8 17.9 ICO.O 36.8 20.4 24.9 17.7ELECTRONIC COMPONENTS AND ACCESSORIES .. 10C.C 40.0 15.7 21.7 22.2 100.0 41.4 16.9 19.4 21.7 100.0 42.2 16.8 18.9 21.5MOTOR VEHICLES AND EQUIPMENT ........... 100.c 11.0 9.8 74.4 4.8 100.0 11.1 9.5 75.0 4.5 100.0 11.2 9.0 75.7 4.1AIRCRAFT AND PARTS ....................... 100.c 22.8 28.8 17.e 30.6 1CC.0 23.5 28.7 17.4 3C.4 100.0 22.0 29.0 17.6 31.4SHIP AND BOAT BUILDING AND REPAIRING ... 1CC.C 23.1 44.7 1C. 8 21.3 100.0 25.1 46. 1 8.8 20.0 100.0 25.8 46.2 8.8 19.1MECHANICAL MEASURING AND CONTROL DEVICES 10C.C 41.0 6.7 39.3 12.0 lOG-O 42.2 6.2 39.5 11.1 ICO.O 42.3 5.9 39.7 11.2OTHER MANUFACTURING ..................... 100.c 38.2 , 16.4 32.2 12.3‘ 100.0 37.4 16.5 33.9 11.5 ICO.O 38.2 15.4 34.7 ll.O
TRANSPORTATION1.............................. 1CC.C 22.9 20.9 40.7 12.7 100.c 22.9 20.0 42.9 11.9 100.c 23. 1 19.2 43.9 11.6
RAILROADS1................................. 100.0 . 1 99.8 ICO.O .1 99.8 100.0 . 1 99.9LOCAL AND SUBURBAN TRANSPORTATION ...... 100.0 56.7 11.6 20.C 10.9 ICO.O 58.9 10.9 19.9 9.5 100.0 59.7 10.7 19.4 9.5TAXICABS .................................. 100.c 41.8 21.0 22.7 14.3 100.0 40.2 20.7 24.6 14.4 100.0 40.6 19.5 25.4 14.3TRUCKING, LOCAL AND LONG DISTANCE ...... 100. c 24.4 29.6 30.6 15.0 ICO.O 24.9 29.3 31.7 13.8 100.0 25.6 28.1 32.4 13. 7AIR TRANSPORTATION ....................... 100.0 30.8 25.6 18. 3 24.1 ICO.O 31.5 26. 1 16.8 24.6 100.0 31.9 26.6 16.5 23.9
COMMUNICATION ............................... 100.c 27.8 27.2 24.3 20.2 100.0 27.6 27. 1 24.8 20.0 100.0 27.4 27.2 25.0 20.1
TELEPHONE COMMUNICATION . . ............... 100.c 27.8 27.0 24.4 20.5 100.0 27.4 27. 1 24.8 20.4 100.0 27.1 27.1 25.1 20.4RADIO AND TELEVISION BROADCASTING ...... 100.0 24.8 28.8 26. 1 19.2 1 0 0 . 0 25.5 27.5 27.7 18.7 100.0 25.5 28.0 26.8 18.9
PUBLIC UTILITIES ........................... 100.c 22.7 32.6 26.6 16.7 100.0 23.1 32.4 27.2 16.3 ICO.O 23.4 32.0 27.2 16.3
100.c 27.0 28.3 27.C 17.0 100.0 27.9 27.8 27.7 15.9 100.0 28.1 27.6 27.9 15.8
MOTOR VEHICLES AND AUTOMOTIVE EQUIPMENT 100.0 2 1.0 29.4 31.6 17.6 1CC.0 21.0 29.2 32.9 16.5 100.0 20.8 29.3 33.3 16.2DRUGS, CHEMICALS, AND ALLIED PRODUCTS .. 100.c 29.5 26.8 26.5 15.5 1CC.0 29.4 27.0 26.5 15.2 ICO.O 29.8 26.5 26.8 15.1DRY GOOOS AND APPAREL ................... 100.0 58.7 18.6 11.9 10.4 100.0 59.2 18.5 11.7 10.2 100.0 60.0 18.0 11.5 10.1GROCERIES AND RELATED PRODUCTS ......... 100.0 22.5 31.0 23.2 22.4 100.0 24.8 30.7 25.2 18.4 100.0 24.9 30.5 25.5 18.2ELECTRICAL GOODS ......................... 100.c 34.3 25.7 24.C 15.4 ICO.O 34.1 27.0 24.3 14.3 100.0 34.3 27.2 24.2 13.9HARDWARE, PLUMBING AND HEATING EQUIPMENT 100.c 26.7 31.3 26.3 15.5 100.0 26.9 30.7 26.6 15.4 100.0 27.6 30.0 26.4 15.9MACHINERY, EQUIPMENT AND SUPPLIES ...... 100.c 26.6 29. 1 27.0 16.6 100.0 27.0 29.2 27.0 16.1 100.0 27.3 28.9 27.2 15.9
RETAIL TRADE ................................ 1C0.C 23.7 29.7 27.8 18. 1 10C.0 24.5 29.2 28.4 17.2 ICO.O 24.7 28.9 28.7 17.1
DEPARTMENT STORES ........................ 100.c 27.1 26.6 29.4 16.5 100.0 26.8 25.4 31.0 16.5 100.0 26.8 24.8 31.3 16.8MAIL ORDER HOUSES ........................ 100.c 19.4 20.2 46.2 14.2 10C.0 18.0 22.2 45.7 14.1 100.0 17.5 22.3 45.8 14.3VARIETY STORES ........................... 100.c 28.0 33.9 24.2 13.5 ICO.O 30. 1 32.5 26.2 11.0 100.0 30.0 32.9 26.5 10.3GROCERY STORES ........................... 100.c 25.5 30. 1 26.C 17.3 1 0 0 . 0 25.1 29.4 26.9 18.0 100.0 25.6 28.7 27.0 18. 1MOTOR VEHICLE DEALERS ................... 100'.c 19.8 32.2 28.C 19.4 ICO.O 20.3 31.6 28.8 18.8 100.0 20.6 31.2 28.8 19.0MEN'S AND BOYS' CLUTHING AND FURNISHINGS 10C.C 32.9 25.3 24.2 16.0 ICO.O 34.8 24.5 24.4 14.6 100.0 34.8 24.3 24.9 14.3WOMEN'S REACY-TO-WEAR STORES ........... 10C.C 31.9 28. 7 24.2 14.6 100.0 32.7 28.7 24.9 13.3 100.0 33. 1 28.7 25.4 12.5FAMILY CLOTHING STORES .................. 100.c 2 1.8 40.2 24.6 13.0 ICO.O 23.2 37.5 26.0 12.8 100.0 22.6 38.1 26.3 12.6SHOE STORES ............................... 10C.C 29.0 26.6 28.6 14. 3 100.0 30.5 24.8 29.8 13.6 100.0 29.5 25.0 31.1 13.1FURNITURE AND HOME FURNISHINGS ......... 10C.C 23.5 33.4 24.S 16.6 ICO.O 24. 1 34.1 25.0 15.1 100.0 23.8 33.7 26.0 14.7DRUG STORES AND PROPRIETARY STORES .... 1 0 0 . 0 19.4 33.5 28.5 1 7.8 1CC.0 19.8 32.0 29.0 18.3 100.0 19.7 31.9 28.8 18.8FUEL AND ICE DEALERS .................... 100.c 42.8 29.5 17.9 8.6 1CC.C 44.2 28.6 17.9 7.9 1 0 0 . 0 45.2 27.9 17.8 7.7
Digitized for FRASER http://fraser.stlouisfed.org/ Federal Reserve Bank of St. Louis
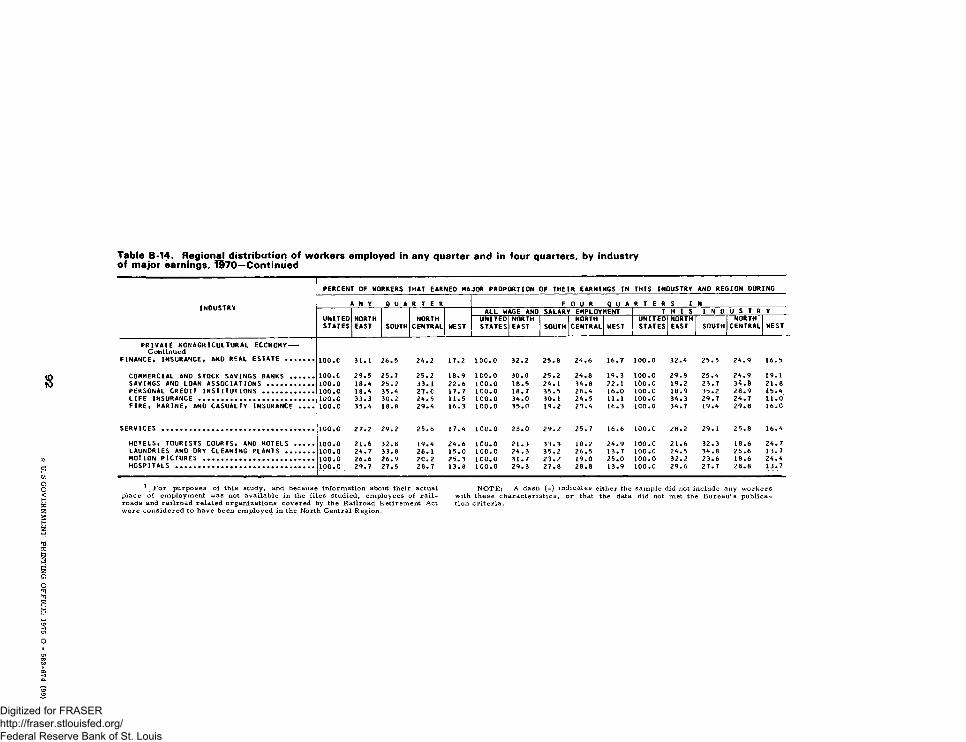
☆
u. s
GO
VE
RN
ME
NT
P
RIN
TIN
G
OF
FIC
E: 1975
O - 58
3-674 (9
9)
PERCENT OF WORKERS THAT EARNED MAJOR PROPORTION OF THEIR EARNINGS IN THIS INDUSTRY AND REGION DURING
INDUSTRY11 N Y Q U A R T E R F O U R Q U A R T E R S I N
ALL WAGE AND SALARY EMPLOYMENT T H I S I N 0 U S T R YUNITEDSTATES
NORTHEAST SOUTH
NORTHCENTRAL WEST
UNITEDSTATES
NORTHEAST SOUTH
NORTHCENTRAL WEST___ 1
UNITEDSTATES____
NORTHEAST SOUTH
NORTHCENTRAL WEST
PRIVATE NCNAGRICULTURAL ECONOMY--Continued
FINANCE* INSURANCE* AND REAL ESTATE ....... 100.c 31.1 26.5 24.2 17.2 100.0 32.2 25.8 24.6 16.7 100.0 32.4 25.5 24.9 16.5
COMMERCIAL AND STOCK SAVINGS BANKS ...... 1 0 0 . c 29.5 25.7 25.2 18.9 1C0.0 30.0 25.2 24.8 19.3 100.c 29.8 25.4 24.9 19. 1SAVINGS ANO LOAN ASSOCIATIONS ........... 100.0 18.4 25.2 33.1 22.6 10C.0 18.5 24.1 34.8 22.1 100.0 19.2 23.7 34.8 21.8PERSONAL CREOIT INSTITUTIONS ............. 100.c 18.4 35.4 27.C 17.7 1C0.0 18.7 35.5 2R.4 16.0 100.c 18.9 35.2 28.9 15.4LIFE INSURANCE ............................. 100.c 33.3 30.2 24.5 11.5 100.0 34.0 30. 1 24.5 11.1 100.0 34.3 29.7 24.7 11.0FIRE, MARINE, ANO CASUALTY INSURANCE .... 100. c 35.4 18.8 29.4 16.3 100.0 35.0 19.2 29.4 16.3 ICO.O 34.7 19.4 29.8 16.0
SERVICES ...................................... 10C.C 27.2 29.2 25.6 17.4 ICC.O 28.0 29.2 25.7 16.6 100.0 28.2 29.1 25.8 16.4
HOTELS, TOURISTS COURTS, AND MOTELS ..... 100.0 21.6 32.8 19.4 24.6 1C0.0 21.3 3 3 . 3 18.2 24.9 100.0 21.6 32.3 18.6 24.7LAUNDRIES AND DRY CLEANING PLANTS ....... 100.0 24.7 33.8 26. 1 15.0 ICO.O 24.3 35.2 26.5 13.7 100.c 24.5 34.8 26.6 13.7MOTION PICTURES ........................... 100. c 26.6 26.9 2C.2 25.3 1C0.0 31.7 23.2 19.0 25.0 100.0 32.2 23.6 18.6 24.4HOSPITALS .................................. 100.c 29.7 27.5 28. 7 13.8 ICO.O 29.3 27.8 28.8 13.9 100.0 29.6 27.7 28.8 13.7
1 F o r purposes of this study, and because information about their actual place of employment was not ava ilab le in the files studied, employees of r a i l roads and ra ilro ad re lated organizations covered by the Railroad Retirement Act w ere considered to have been employed in the North Central Region.
N O T E : A dash ( - ) indicates either the sam ple did not include any w ork erswith these characteristics, or that the data did not met the B ureau 's publication c rite ria .
Digitized for FRASER http://fraser.stlouisfed.org/ Federal Reserve Bank of St. Louis
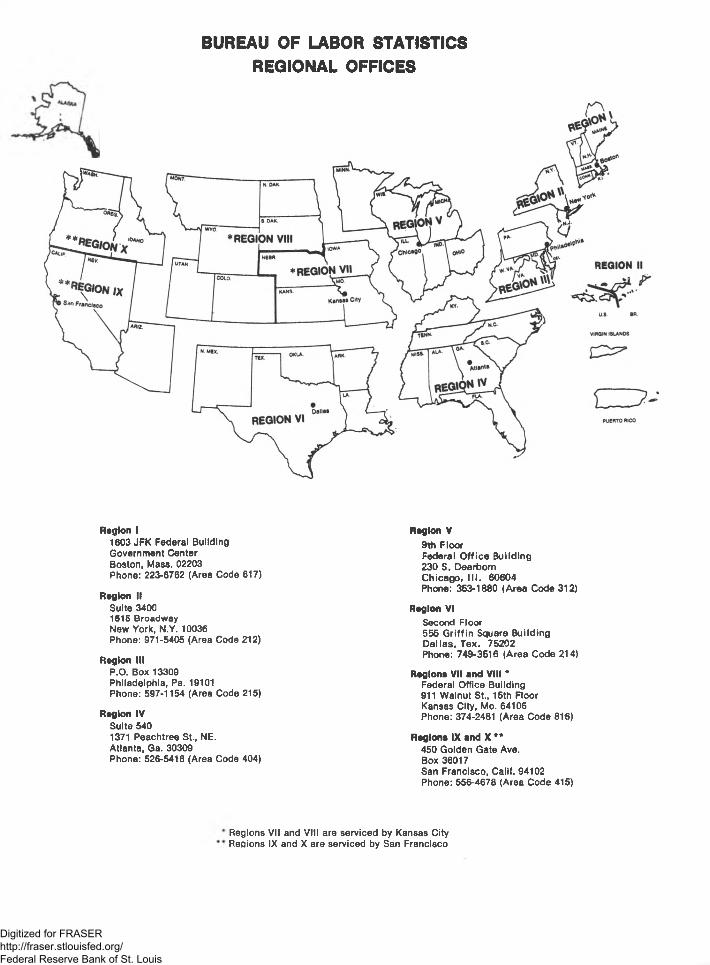
BUREAU OF LABOR STATISTICS REGIONAL OFFICES
Region I1603 JFK Federal Building Government Center Boston, Mass. 02203 Phone: 223-6762 (Area Code 617)
Region IISuite 34001515 BroadwayNew York, N.Y. 10036Phone: 971-5405 (Area Code 212)
Region IIIP.O. Box 13309Philadelphia, Pa. 19101Phone: 597-1154 (Area Code 215)
Region IVSuite 5401371 Peachtree St., NE.Atlanta, Ga. 30309Phone: 526-5418 (Area Code 404)
Region V9th FloorFederal Office Building230 S. DearbornChicago, III . 60604Phone: 353-1880 (Area Code 312)
Region VISecond Floor555 Griffin Square BuildingDallas. Tex. 75202Phone: 749-3516 (Area Code 214)
Regions VII and VIII *Federal Office Building 911 Walnut St., 15th Floor Kansas City, Mo. 64106 Phone: 374-2481 (Area Code 816)
Regions IX and X **450 Golden Gate Ave.Box 36017San Francisco, Calif. 94102 Phone: 556-4678 (Area Code 415)
Regions VII and VIII are serviced by Kansas City Regions IX and X are serviced by San Francisco
Digitized for FRASER http://fraser.stlouisfed.org/ Federal Reserve Bank of St. Louis


