Embed Size (px)
Citation preview
N E WS U. $. DEPARTMENT OF LABORIHUI IF UUt STATISTICS
USDL - 73-535FOR RELEASE: Transmission Embargo
10:00 A. M (EST)Friday, November 2, 1973
Washington, D. C. 20212J. Bregger (202) 961-2633
961-2472961-2531
K. Hoyle (202) 961-2913home: 333-1384
THE EMPLOYMENT SITUATION: OCTOBER 1973
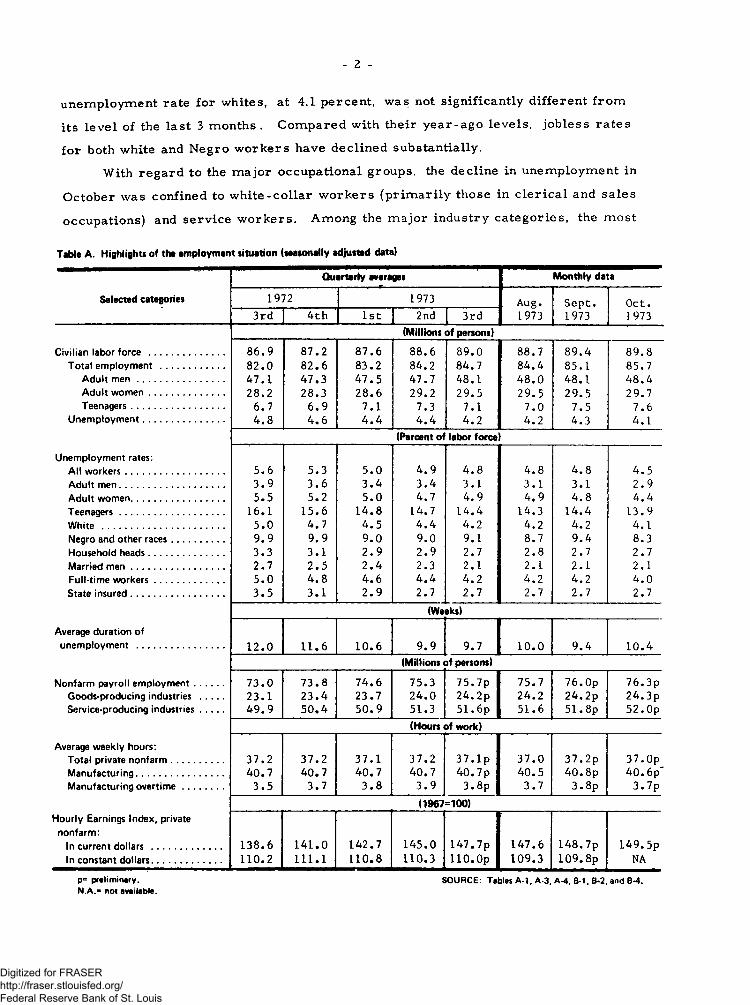
Employment posted another large increase in October and unemployment
dropped after holding steady for several months, it was announced today by the
Bureau of Labor Statistics, U. S. Department of Labor. At 4. 5 percent, the unem
ployment rate was down from the 4. 8-percent plateau at which it had held since June
and from the 5. 5-percent level of October 1972.
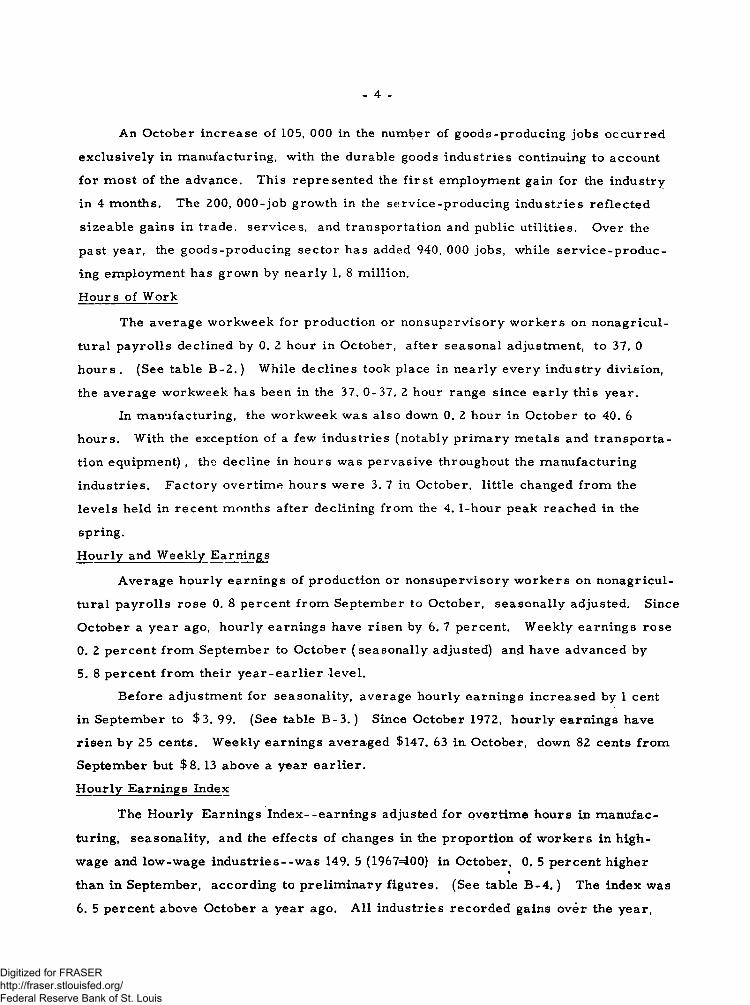
Total employment (as measured by the household survey) expanded by 570, 000
in October to 85. 7 million, seasonally adjusted. Employment had risen by an even
larger amount in September. Since October a year ago, total employment has grown
by 3. 2 million persons, an unusually large increase for a 12-month period.
The number of nonagricultural payroll jobs (as measured by the establishment
survey) increased by 305, 000, seasonally adjusted, to 76. 3 million in October. This
was paced by a strong increase in manufacturing. Compared with October of last '
year, payroll employment rose by 2. 7 million.
U nemployment
The number of unemployed persons declined 210, 000 (seasonally adjusted) in
October to 4. 1 million. This decrease, combined with the strong advance in employ
ment, brought the overall jobless rate to its lowest level since April 1970.
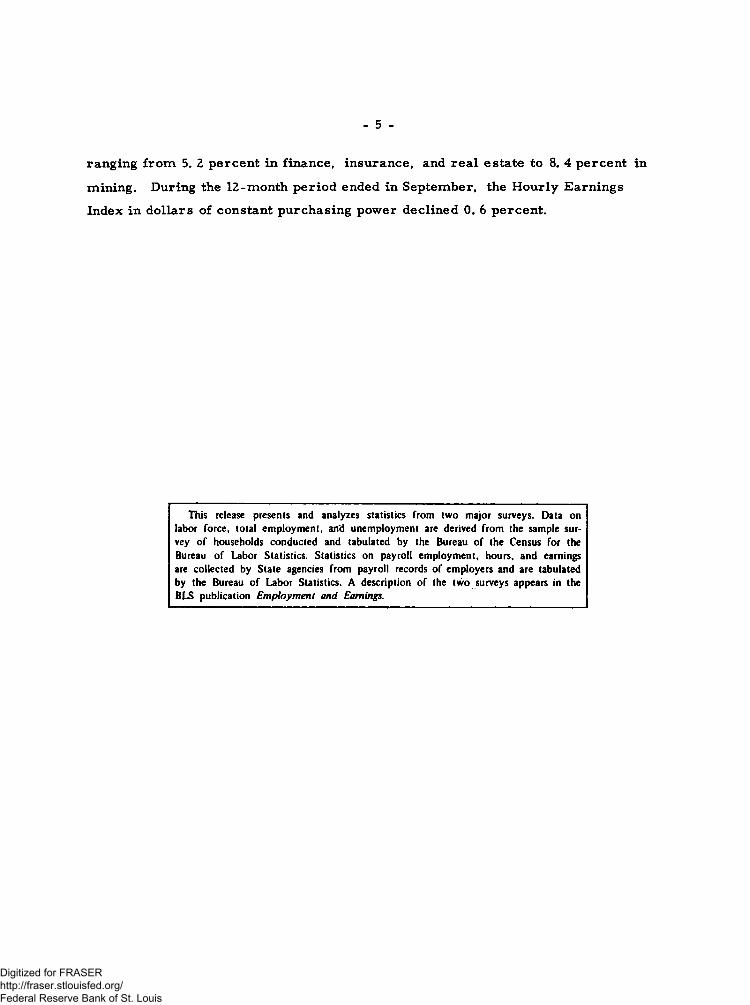
Among the major demographic groups, the unemployment rate for adult women
declined from 4. 8 to 4. 4 percent in October. (See table A -3. ) In addition, there
was a slight decrease in the rate for adult men, from 3. 1 to 2. 9 percent. Reductions
in both groups were concentrated among 20-24 year-olds. Unemployment rates for
teenagers (13. 9 percent) , household heads (2. 7 percent), and married men (2. 1 per
cent) approximated the levels they have maintained since July. However, all of
these groups have improved their unemployment picture over the last year.
The jobless rate for Negro workers receded from 9. 4 to 8. 3 percent in
October, largely as a result of reduced unemployment among Negro teenagers. The
Digitized for FRASER http://fraser.stlouisfed.org/ Federal Reserve Bank of St. Louis
- 2 -
unemployment rate for whites, at 4.1 percent, was not significantly different from
its level of the last 3 months . Compared with their year-ago levels, jobless rates
for both white and Negro workers have declined substantially.
With regard to the major occupational groups, the decline in unemployment in
October was confined to white-collar workers (primarily those in clerical and sales
occupations) and service workers. Among the major industry categories, the most
Table A. Highlights of the employment situation (seasonally adjusted data)
Selected categories
Quarterly averages Monthly data
1972 1973 Aug. S e p t .1973
O c t .19733 rd 4 t h 1 s t | 2nd 3 rd 1973
(Millions of persons)
Civilian labor force ......................... 8 6 ,9 8 7 .2 8 7 .6 8 8 .6 8 9 .0 88 .7 8 9 .4 8 9 .8Total employment ..................... 8 2 .0 8 2 .6 83 .2 84 .2 84 .7 8 4 .4 85 .1 85 .7
Adult m e n ............................. 4 7 .1 4 7 .3 4 7 .5 47 .7 48 .1 4 8 .0 48 .1 4 8 .4Adult women......................... 2 8 .2 28 .3 2 8 .6 29 .2 2 9 .5 29 .5 29 .5 29 .7Teenagers............................... 6 .7 6 . 9 7 .1 7 .3 7 .1 7 .0 7 .5 7 .6
Unemployment........................... 4 . 8 4 .6 4 . 4 4 .4 4 .2 4 .2 4 .3 4 .1
(Percent of labor force)
Unemployment rates:All workers................................. 5 .6 5 .3 5 .0 4 .9 4 .8 4 .8 4 .8 4 .5Adult men................................... 3 . 9 3 . 6 3 . 4 3 .4 3 .1 3 .1 3 .1 2 .9Adult women............................... 5 .5 5 .2 5 .0 4 .7 4 .9 4 .9 4 .8 4 .4Teenagers................................... 16 .1 1 5 .6 1 4 .8 14.7 1 4 .4 14 .3 1 4 .4 1 3 .9White ......................................... 5 .0 4 .7 4 .5 4 .4 4 .2 4 .2 4 .2 4 .1Negro and other races................. 9 .9 9 .9 9 .0 9 .0 9.1 8 .7 9 .4 8 .3Household heads......................... 3 .3 3 .1 2 . 9 2 .9 2 .7 2 .8 2 .7 2 .7Married m e n ............................... 2 .7 2 .5 2 . 4 2 .3 2 .1 2 .1 2 .1 2 .1Full-time workers....................... 5 .0 4 . 8 4 .6 4 .4 4 .2 4 .2 4 .2 4 .0State insured............................... 3 . 5 3 .1 2 . 9 2 .7 2 .7 2 .7 2 .7 2 .7
(Weeks)
Average duration ofunemployment ............................. 1 2 .0 1 1 .6 1 0 .6 9 .9 9 .7 1 0 .0 9 .4 1 0 .4
(Millions of persons)
Nonfarm payroll employment.......... 7 3 .0 7 3 .8 7 4 .6 75 .3 7 5 . 7p 75 .7 7 6 . Op 7 6 . 3pGoods-producing industries ........ 23 .1 2 3 .4 2 3 .7 2 4 .0 2 4 . 2p 2 4 .2 2 4 . 2p 2 4 . 3pService-producing industries........ 4 9 .9 5 0 .4 5 0 .9 51 .3 5 1 . 6p 5 1 .6 5 1 . 8p 5 2 . Op
(Hours of work)
Average weekly hours:Total private nonfarm................. 3 7 .2 3 7 .2 37 .1 3 7 .2 37 . I p 3 7 .0 3 7 . 2p 3 7 . OpManufacturing............................. 4 0 .7 4 0 .7 4 0 .7 4 0 .7 4 0 . 7p 4 0 .5 4 0 . 8p 4 0 . 6p~Manufacturing overtime............. 3 .5 3 .7 3 . 8 3 .9 3 .8 p 3 .7 3 • 8p 3 . 7p
(1967=100)Hourly Earnings Index, privatenonfarm:
In current dollars ....................... 1 38 .6 1 4 1 .0 142 .7 1 4 5 .0 1 4 7 .7p 1 4 7 .6 1 4 8 .7p 1 4 9 .5pIn constant dollars....................... 110 .2 111 .1 110 .8 110 .3 1 1 0 .Op 109 .3 1 0 9 . 8p NA
p= preliminary. SOURCE: Tables A-1, A-3, A-4. B-1, B-2, and B-4.N .A ." not available.
Digitized for FRASER http://fraser.stlouisfed.org/ Federal Reserve Bank of St. Louis

- 3 -
prominent change in unemployment was a further decline in the rate for manufactur
ing workers, particularly those in durable goods. The jobless rate for all manu
facturing workers reached its lowest point since the end of 1969.
The unemployment rate for the most recently discharged Vietnam Era veterans
(20-24 year-olds) was 8. 0 percent in October, little changed over the month and still
higher than the rate for nonveterans of the same ages (5. 7 percent) . In contrast,
jobless rates for veterans 25 to 29 (3. 2 percent) and 30 to 34 (2. 6 percent) were
lower than in September and were not materially different from the rates of their
nonveteran counterparts. Over the past year,' there has been a decline in the
unemployment rates of 20-24 and 25-29 year-old veterans. (See table A -7.)
The unemployment rate for workers covered by State unemployment insurance
programs, at 2. 7 percent in October, has been about the same since April.
Nearly the entire decline in total unemployment took place among those who had
been seeking work for a month or less. (See table A -4 .) Primarily as a result, the
average (mean) duration of unemployment rose from 9. 4 weeks in September to 10. 4
weeks in October, following a drop in the previous month.
The proportion of jobless persons who had lost their last job showed a substan
tial decline in October. (See table A -5.) The number of such persons dropped below
1. 5 million, its lowest level since February 1970.
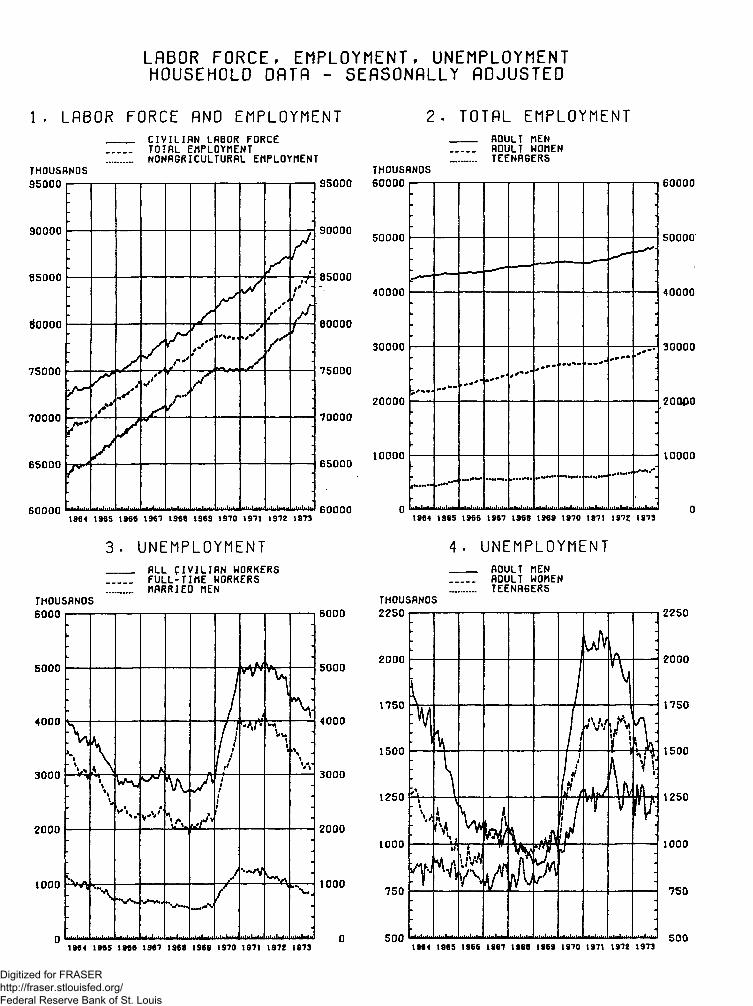
Civilian Labor Forca and Total Employment
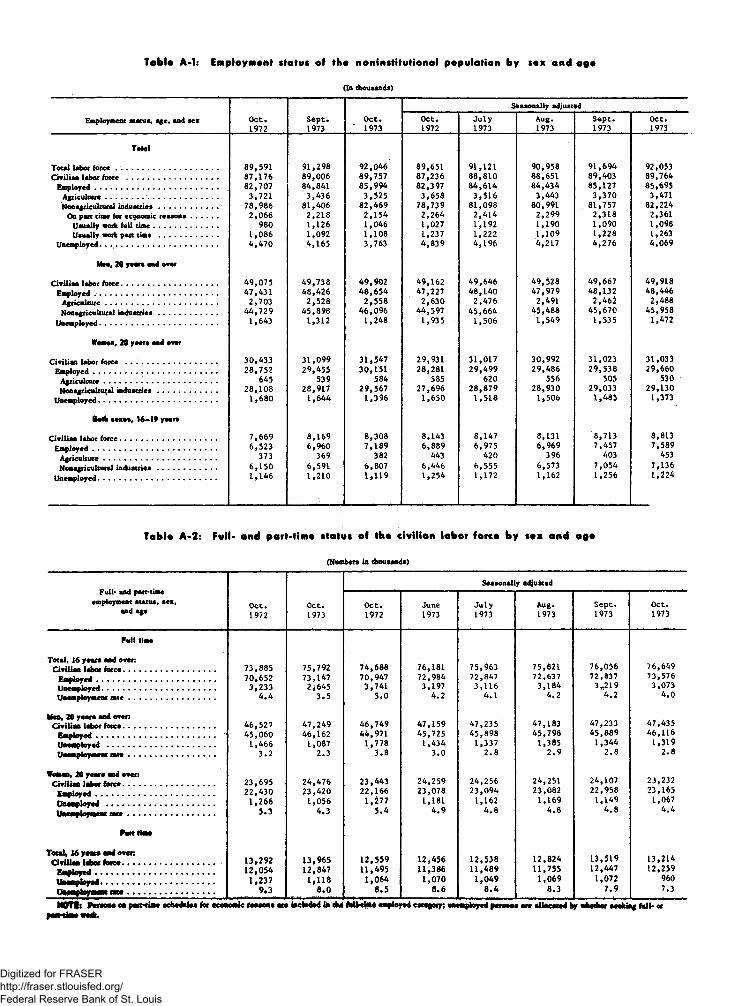
The civilian labor force rose by 360, 000 in October (seasonally adjusted)
following an even larger increase in September (750, 000) . While teenagers
accounted for most of the increase in September, adult men made up the bulk of the
October expansion. (See table A - l. )
Employment also rose considerably for the second straight month, advancing
by 570, 000, seasonally adjusted, to 85.7 million. Adult men accounted for over
300, 000 of this increase, with the balance divided about equally between teenagers
and adult women. Since October a year ago, total employment has risen by 3. 2
million persons; adult women made up 1. 4 million of this gain, with adult men (1. 2
million) and teenagers (660, 000) accounting for the remainder.
Industry Payroll Employment
Nonagricultural payroll employment continued its strong expansionary trend,
rising by 305, 000 to a seasonally adjusted level of 76. 3 million in October. Over
the year, payroll jobs have increased by 2. 7 million. (See table B -l.)
Digitized for FRASER http://fraser.stlouisfed.org/ Federal Reserve Bank of St. Louis
- 4 -
An October increase of 105, 000 in the number of goods-producing jobs occurred
exclusively in manufacturing, with the durable goods industries continuing to account
for most of the advance. This represented the first employment gain for the industry
in 4 months. The 200, 000-job growth in the service-producing industries reflected
sizeable gains in trade, services, and transportation and public utilities. Over the
past year, the goods-producing sector has added 940, 000 jobs, while service-produc
ing employment has grown by nearly 1. 8 million.
Hours of Work
The average workweek for production or nonsupervisory workers on nonagricul-
tural payrolls declined by 0. 2 hour in October, after seasonal adjustment, to 37. 0
hours. (See table B-2.) While declines took place in nearly every industry division,
the average workweek has been in the 37. 0-37. 2 hour range since early this year.
In manufacturing, the workweek was also down 0. 2 hour in October to 40. 6
hours. With the exception of a few industries (notably primary metals and transporta
tion equipment) , the decline in hours was pervasive throughout the manufacturing
industries. Factory overtime hours were 3. 7 in October, little changed from the
levels held in recent months after declining from the 4. 1-hour peak reached in the
spring.
Hourly and Weekly Earnings
Average hourly earnings of production or nonsupervisory workers on nonagricul-
tural payrolls rose 0. 8 percent from September to October, seasonally adjusted. Since
October a year ago, hourly earnings have risen by 6. 7 percent. Weekly earnings rose
0. 2 percent from September to October (seasonally adjusted) and have advanced by
5. 8 percent from their year-earlier level.
Before adjustment for seasonality, average hourly earnings increased by 1 cent
in September to $3. 99. (See table B-3. ) Since October 1972, hourly earnings have
risen by 25 cents. Weekly earnings averaged $147. 63 in October, down 82 cents from
September but $8. 13 above a year earlier.
Hourly Earnings Index
The Hourly Earnings Index--earnings adjusted for overtime hours in manufac
turing, seasonality, and the effects of changes in the proportion of workers in high-
wage and low-wage industries--was 149. 5 (1967=100) in October, 0. 5 percent higher
than in September, according to preliminary figures. (See table B-4.) The index was
6. 5 percent above October a year ago. A ll industries recorded gains over the year,
Digitized for FRASER http://fraser.stlouisfed.org/ Federal Reserve Bank of St. Louis
- 5 -
ranging from 5. 2 percent in finance, insurance, and real estate to 8. 4 percent in
mining. During the 12-month period ended in September, the Hourly Earnings
Index in dollars of constant purchasing power declined 0. 6 percent.
This release presents and analyzes statistics from two major surveys. Data on labor force, total employment, and unemployment are derived from the sample survey of households conducted and tabulated by the Bureau of the Census for the Bureau of Labor Statistics. Statistics on payroll employment, hours, and earnings are collected by State agencies from payroll records of employers and are tabulated by the Bureau of Labor Statistics. A description of the two surveys appears in the BLS publication Employment and Earnings.
Digitized for FRASER http://fraser.stlouisfed.org/ Federal Reserve Bank of St. Louis
(In thousands)
T a b U A-1: Employmaitt status off tka noninstitutional population by sax a nd ago
Employment status, age, and sex O c t.1972
S e p t .1973
O c t. ‘ 1973
Seasonally adjusted
O c t.1972
J u ly1973
Aug.1973
S e p t .1973
O ct.1973
Total
Total labor force . ............................................... 89 ,591 91,298 92,046 89,651 91,121 90,958 91,694 92,053Civilian labor force ............................................ 87 ,176 89,006 89,757 87,236 88,810 88,651 89,403 89,764
Employed............................................................ 82 ,707 84,841 85 ,994 82,397 84 ,614 84 ,434 85,127 85,695Agriculture.................. .................................... 3 ,721 3 ,436 3 ,525 3 ,658 3 ,5 1 6 3,443 3 ,3 7 0 3,471
Nonagricultural industries............................. 78 ,986 81,406 82 ,469 78,739 81,098 80,991 81*757 82,224
On part time for economic reasons............. 2 ,066 2 ,218 2 ,1 5 4 2 ,264 2 ,4 1 4 2 ,299 2 ,318 2,361Usually work full tim e............................... 980 1 ,126 1 ,046 1,027 1 ,192 1 ,190 1 ,090 1,098Usually work part t im e ............................. 1 ,086 1,092 1 ,108 1,237 1 ,222 1 ,109 1 ,228 1,263
Unemployed. . ................................................. 4 ,470 4 ,165 3,763 4 ,839 4 ,196 4,217 4 ,276 4 ,069
Aten, 20 years and over
Civilian labor force............................................... 49 ,075 49 ,738 49,902 49,162 49 ,646 49,528 49,667 49,918
Employed ............................................................ 47 ,431 48,426 48 ,654 47,227 48 ,140 47 ,979 48,132 48,446
Agriculture....................................... ............... 2 ,703 2 ,528 2 ,5 5 8 2 ,630 2 ,476 2,491 2 ,462 2*488
Nonagricultural industries............................. 44 ,729 45,898 46 ,096 44,597 4 5 ,664 45,488 45 ,670 45,958
Unemployed......................................................... 1 ,643 1,312 1 ,248 1,935 1 ,506 1 ,549 1 ,535 1,472
Women, 20 years and over
Civilian labor force ............................................. 30 ,433 31 ,099 31,547 29,931 31 ,017 30,992 31,023 31,033
Em ployed............................................................ 28 ,752 29,455 30,151 28,281 29 ,499 29,486 29,538 29,660
Agriculture....................................................... 645 539 584. 585 620 556 505 530
Nonagricultural industries............................. 28 ,108 28,917 29,567 27,696 28 ,879 28,930 29,033 29,130
Unemployed.......................................................... 1 ,680 1 ,644 1 ,396 1 ,650 1 ,518 1 ,506 1 ,485 1,373
Both sexes, 16-19 years
Civilian labor force............................................... 7 ,669 8 ,169 8 ,308 8,143 8 ,147 8,131 8,713 8,813
Em ployed........................................................... 6 ,523 6 ,960 7 ,1 8 9 6 ,889 6 ,975 6 ,969 7 ,457 7 ,589
Agriculture.................................................... .. 373 369 382 443 420 396 403 453
Nonagricultural industries ............................. 6 ,150 6 ,591 6 ,807 6 ,446 6 ,555 6,573 7 ,054 7,136
Unemployed............................................... .. . . . 1 ,146 1 ,210 1 ,1 1 9 1 ,254 1 ,172 1,162 1 ,256 1,224
TabU A-2: Full- and part-fin* a status off tka civilian labor fforca by sax and aga
(Numbers in thousands)
Full* and part-time employment status, sex,
and age
Seasonally adjusted
O c t.1972
O c t.1973
O c t.1972
June1973
J u ly1973
Aug.1973
S e p t .1973
O ct.1973
Full time
Total, 16 years and over:76 ,056 76,649Civilian labor force............................................. 73 ,885 75,792 74,688 76,181 75,963 75,821
Em ployed.......................................................... 70 ,652 73,147 70,947 72,984 72,847 72,637 72,837 73,576
Unemployed....................................................... 3 ,233 2*645 3,741 3,197 3 ,1 1 6 3 ,184 3*219 3,073
Unemployment r a t e .......................................... 4 .4 3 .5 5 .0 4 .2 4 .1 4*2 4 .2 4 .0
lien, 20 years and over:47,233 47,435Civilian labor force............................................. 46 ,527 47 ,249 46 ,749 47 ,159 47 ,235 47,183
Em ployed.......................................................... 45 ,060 46,162 44,971 45,725 45 ,898 45 ,798 45 ,889 46,116
U nem ployed............................................. 1 ,466 1,087 1 ,778 1 ,434 1,337 1,385 1 ,344 1 ,319
Unemployment r a t e ....................................... 3 .2 2 .3 ‘ 3 .8 3 .0 2 .8 2 .9 2 .8 2 .8
Women, 20 years and over:24,107 23,232Civilian labor force............................................. 23 ,695 24,476 23,443 24,259 24,256 24,251
E a p lo yed .......................................................... 22 ,430 23 ,420 22 ,166 23,078 2 3 ,094 23,082 22,958 23,165
U nem ployed .................................................... 1 ,266 1 ,056 1 ,277 1,181 1,162 1 ,169 1 ,149 1,067
Unemployment cate .......................................... 5 .3 4 .3 5 .4 4 .9 4 *8 4 .8 4 .8 4 .4
Fart flaw
Total, 16 yearn and oven Civilian labor force ............................................. 13 ,292 13,965 12 ,559 12,456 12,538 12,824 13,519 13,214
Employed......................................... 12 ,054 12,847 11,495 11,386 11 ,489 11,755 12,447 12,259
Unemployed............... ....................... 1,237 1 ,118 1 ,064 1 ,070 1 ,0 4 9 1 ,069 1,072 960
9*3 8 .0 8 .5 8 .6 8 .4 8 .3 7 .9 7.3
NOTIt N o on part-time schedules far economic renooos me included in the fullrtime employed category; unemployed persoos me sllocmed by sOmber seeking full- or
Digitized for FRASER http://fraser.stlouisfed.org/ Federal Reserve Bank of St. Louis
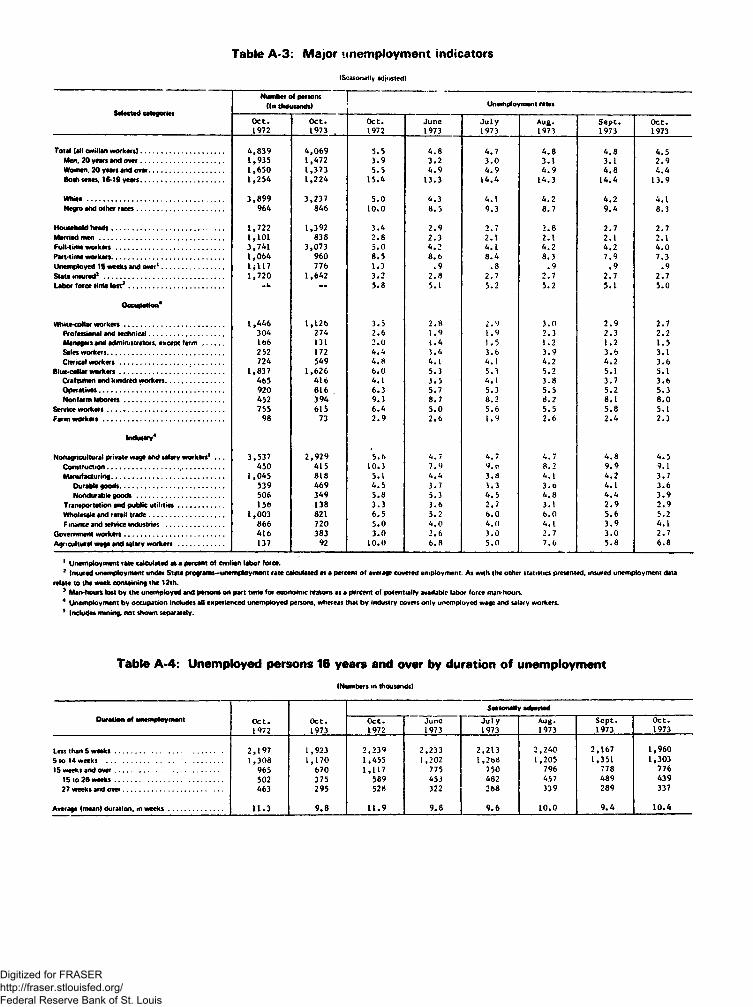
Table A-3: Major unemployment indicators
(Seasonally adjuster!)
Selected categories
Number of persons (In thousands) Unemployment rates
O c t.L972
O c t. 1973 .
O ct.1972
June1973
J u ly1973
Aug.1973
S ep t.1973
O ct.1973
Total (all civilian workers)........................................ 4 ,839 4 ,069 5.5 4 .8 4 .7 4 .8 4 .8 4 .5Men, 20 years and over........................................ 1 ,935 1,472 3.9 3 .2 3 .0 3.1 3.1 2 .9Women. 20 years and over.................................... 1 ,650 1,373 5.5 4 .9 4 .9 4 .9 4 .8 4 .4Both sexes, 16-19 years........................................ 1 ,254 1,224 15.4 13.3 14 .4 14.3 14.4 13.9
W h ite .................................................................. 3 ,899 3,237 5.0 4 .3 4.1 4 .2 4 .2 4.1Negro and other races.......................................... 964 846 10.0 8 .5 9.3 8.7 9 .4 8.3
Household heads...................................................... 1 ,722 1,392 3 .4 2 .9 2.7 2 .8 2.7 2.7Married m en ............................................................ 1,101 838 2 .8 2 .3 2.1 2.1 2.1 2.1Full-time workers.................................................... 3,741 3,073 5.0 4 .2 4. L 4 .2 4 .2 4 .0Part-time workers...................................................... 1 ,064 960 8 .5 8 .6 8 .4 8 .3 7 .9 7.3Unemployed 16 weeks and over1.............................. 1 j 1 17 776 1.3 .9 .8 .9 .9 .9State insured2 .......................................................... 1 ,720 1,642 3.2 2 .8 2 .7 2.7 2 .7 2.7Labor force time lost3 .............................................. — 5.8 5.L 5.2 5.2 5.1 5 .0
Occupation4
White-collar workers................................................ 1 ,446 1,126 3 .5 2 .8 2 .9 3 .0 2 .9 2.7Professional and technical.................................... 304 274 2 .6 1 .9 1 .9 2.3 2 .3 2.2Managers and administrators, except fa rm .......... 166 131 2 .0 L. 4 1.5 1.2 1.2 1.5Sales workers........................................................ 252 172 4 .4 3 .4 3 .6 3 .9 3 .6 3.1Clerical workers.................................................. 724 549 4 .8 4.1 4.1 4.2 4 .2 3 .6
Blue-collar workers.................................................. 1,837 1,626 6*0 5.3 5.3 5.2 5.1 5.1Craftsmen and kindred workers............................ 465 416 4.1 3 .5 4.1 3 .8 3 .7 3 .6Operatives............................................................ 920 616 6.3 5.7 5.3 5.5 5.2 5.3Nonfarm laborers................................................ 452 394 9.3 8 .7 8.2 8 .2 8.1 8 .0
Service workers........................................................ 755 615 6 .4 5 .0 5 .6 5 .5 5 .8 5.1Farmworkeis.......................................................... 98 73 2 .9 2 .6 1 .9 2 .6 2 .4 2.3
Industry4
Nonagricultural private wage and salary workers3 . . . 3 ,537 2 ,929 5 .6 4. 7 4 .7 4 .7 4 .8 4. 5Construction.................................. ...................... 450 415 10.3 7 .9 9 .r 8 .2 9 .9 9.1Manufacturing...................................................... 1 ,045 818 5. L 4 .4 3 .8 4.1 4 .2 3.7
Our able goods.................................................. 539 469 4 .5 3.7 3.3 3 .0 4.1 3 .6Nondurable good s .......................................... 506 349 5.8 5.3 4 .5 4 .8 4 .4 3 .9
Transportation and public utilities...................... 156 138 3 .3 3 .6 2.7 3.1 2 .9 2 .9Wholesale and retail trade.................................... 1,003 821 6 .5 5.2 6 .0 6 .0 5 .6 5.2F mance and service industries ............................ 866 720 5 .0 4 .0 4 .0 4. L 3 .9 4.1
Government workers................................................ 416 383 3 .0 2 .6 3 .0 2.7 3 .0 2.7Agricultural wage and salary workers ...................... 137 92 10.0 6 .8 5 .0 7 .6 5 .8 6 .8
1 Unemployment rate calculated at a percent of civilian labor force.2 Insured unemployment under State programs-unemployment rate calculated as a percent of average covered employment. As with the other statistics presented, insured unemployment data
relate to the week containing the 12th.3 Man-hours lost by the unemployed and persons on part time for economic reasons as a percent of potentially available labor force man-hours.4 Unemployment by occupation includes all experienced unemployed persons, whereas that by industry covers only unemployed wage and salary workers. s Includes mining, not shown separately.
Table A-4: Unemployed persons 16 years and over by duration of unemployment
(Numbers m thousands)
Duration of unemployment O cc.1972
O ct.1973
Seasonally adiusted
O c t.1972
June1973
J u ly1973
Aug.1973
S ep t.1973
O ct.1973
Less than 5 weeks.................................................... 2 ,197 1,923 2 ,239 2,233 2,213 2,240 2,167 1,9605 to 14 weeks ........................................................ 1 ,308 L, 17 0 l ,455 1,202 1 , 2 0 8 1,205 1,351 1,30315 weeks and over.................................................. 965 670 1,117 775 750 796 778 776
15 to 26 weeks.................................................... 502 375 589 45 J 482 457 489 43927 weeks and over................................................ 463 295 528 322 268 339 289 337
Average (mean) duration, m weeks.......................... 11 .3 9 .8 11 .9 9 .8 9 .6 10 .0 9 .4 10 .4
Digitized for FRASER http://fraser.stlouisfed.org/ Federal Reserve Bank of St. Louis

Table A-5: Unemployed persons by reason for unemployment
(Numbers in thousands)
Reason for unemployment O c t.1972
O ct.1973
Seasonally adjusted
O ct.1972
June1973
J u ly1973
Aug.1973
S e p t.1973
O ctl1973
Lost last jo b .......................................................... 1,651 1,218 1,988 1,713 1 ,584 1,609 1,659 1,467
Left last j o b .......................................................... 708 692 685 659 663 631 666 671
Reentered labor f o r c e .......................................... 1 ,508 1,284 1,450 1,203 1,301 1,381 1,308 1,236
Never worked b e fo re ............................................. 603 570 638 620 629 597 637 604
Percent distribution
Total unemployed.................................................. 100 .0 100.0 100.0 100 .0 100 .0 100.0 100.0 100.0
Lost last j o b ..................................................... 3 6 .9 32 .4 41 .8 40 .8 3 7 .9 38.1 3 8 .9 36 .9Left last j o b ..................................................... 15 .8 18 .4 14 .4 15.7 1 5 .9 15 .0 15 .6 16 .9
Reentered labor force........................................ 33 .7 34.1 30 .5 28.7 31.1 32.7 30 .6 31.1
Never worked before.......................................... 13 .5 15.1 13 .4 14.8 15.1 14.2 14 .9 15.2
Unemployed os a percent of thecivilian labor force
Lost last jo b .......................................................... 1 .9 1 .4 2.3 1 .9 1 .8 1 .8 1 .9 L .6Left lest j o b .......................................................... .8 .8 .8 .7 .7 .7 .7 i 7Reentered labor force............................................. 1 .7 1 .4 1.7 1 .4 1 .5 1 .6 1 .5 1 .4Never worked b e fo re ............................................. .7 .6 .7 .7 .7 .7 .7 .7
Tabla A-6: Unemployed persons by age and sex
Age and sex
Thousands o f persons Percent looking for
full-time work
Seasonally adjusted unemployment rates
O c t.1972
O c t.1973
O ct.1972
June!1973
#u! y 1973
Aug.1973
S o p t.1973
O ct.L973O c t. 1973
Tota l, 16 years and o v e r ................................ 4 ,470 3,763 70.3 5.5 4 .8 4 .7 4 .8 4 .8 4 .5
16 to 19 y e a rs ................................................. 1 ,146 1 ,119 4 4 .9 15 .4 13.3 1 4 .4 14.3 14 .4 13 .9
16 and 17 y e a r s ........................................ 551 572 22 .0 17 .6 17.2 16.3 16 .5 16 .9 16.3
18 and 19 y e a r s ........................................ 595 547 68 .6 13.7 10 .0 12.7 12.7 12.8 12 .0
20 to 24 y ea rs ................................................. 1 ,076 814 80.7 9 .2 7 .7 8 .0 7 .9 7 .9 6 .625 years and o v e r ......................................... 2 ,247 1 ,830 81.3 3 .6 3 .2 3 .0 3 .0 2 .9 2 .9
25 to 54 y e a r s ........................................... 1 ,790 1,487 82 .4 3 .6 3 .3 3 .0 3.1 3 .0 2 .955 years and o v e r ...................................... . 458 342 76.6 3 .4 2 .6 2 .8 2 .8 2 .6 2 .7
Males, 16 years and o v e r ................................ 2 ,227 1 ,819 73 .9 4 .8 4.1 3 .9 4 .0 3 .9 3 .9
16 to 19 y e a rs ................................................. 584 571 45.2 14.5 12 .8 14 .0 14.1 13.7 13.2
16 and 17 y e a r s ......................................... 299 307 2 7 .0 17.1 16.7 16.5 16.2 15.2 15.8
18 and 19 y e a r s ......................................... 285 264 66.3 12.5 9 .6 11 .4 12 .4 12.8 11 .0
20 to 24 y e a rs ................................................. 542 397 80 .6 8 .8 7 .4 6 .9 7 .4 7 .0 6.1
25 years and o v e r ......................................... 1 ,101 851 90.1 3 .1 2 .5 2 .4 2 .4 2 .4 2 .4
25 to 54 y e a r s ........................................... 814 630 9 4 .9 2 .9 2 .5 2.3 2 .4 2 .3 2 .2
55 years and o v e r ...................................... 287 221 76.5 3 .5 2 .8 2 .9 2 .6 2 .8 2 .8
Fem ales, 16 years and o v e r .......................... 2 ,243 1,945 6 6 .8 6 .7 5 .9 5 .9 5 .9 6 .0 5. fc
16 to 19 y e a rs ................................................. 563 548 44 .5 16 .6 1 3 .9 14 .9 14.5 15.3 14.7
16 and 17 y e a r s ......................................... 253 266 16.2 18 .4 17 .7 1 5 .9 16.7 19 .0 17.1
18 and 19 y e a r s .......................... ... . . . . 310 283 70.7 15.2 10 .4 14 .2 13.1 12.8 L3.1
20 co 24 y e a rs ................................................. 534 418 80 .6 9 .7 8 .0 9 .4 8 .6 8 .9 7.3
25 years and o v e r ......................................... ■ 1 ,146 979 7 3 .4 4 .5 4 .2 3 .9 4 .0 3 .8 3.7
25 to 54 y e a r s ............................................ 974 857 7 3 .0 4 .8 4 .7 4 .3 4 .3 4.1 4 .0
55 years and o v e r ...................................... 171 121 7 6 .9 3 .2 2 .4 2 .6 3 .2 2 .4 2 .4
Digitized for FRASER http://fraser.stlouisfed.org/ Federal Reserve Bank of St. Louis
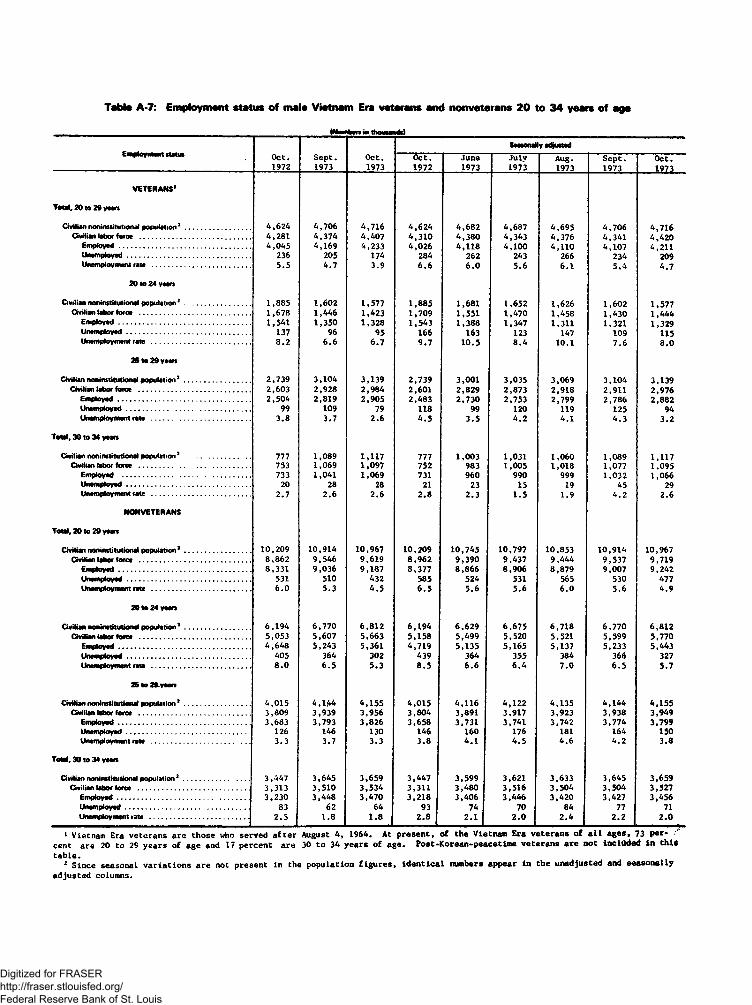
Table A-7: Employment status of male Vietnam Era veterans and nonveterans 20 to 34 years of age
INumben in thouandil
Employment statusSeasonally adjusted
O c t.1972
S e p t .1973
O c t.1973
O c t .1972
June1973
Ju ly1973
Aug.1973
S e p t . 1973
O c t.1973
VETERANS'
Total, 20 to 29 yean
Civilian noninstitutional population 3 ................................ 4 ,624 4 ,706 4 ,716 4 ,6 2 4 4 ,682 4,687 4 ,695 4 ,706 4 ,716Civilian labor force ........................................ 4 ,281 4 ,374
4 ,1694 ,4074,233
4 ,3 1 04 ,026
4 ,3804 ,118
4 ,3434 ,100
4 ,3764 ,110
4 ,3414 ,107
4 ,4204,211Employed................................................................ 4 ,045
Unemployed............................................................ 236 205 174 284 262 243 266 234 209Unemployment rate ................................................ 5 .5 4 .7 3 .9 6 .6 6 .0 5 .6 6 .1 5 .4 4 .7
20 to 24 years
Civilian noninstitutional population2 ................................ 1 ,885 1 ,602 1,577 1 ,885 1,681 1,652 1,626 1 ,602 1,577Civilian labor force ...................................................... 1 ,678 1 ,446 1,423 1 ,709 1,551 1 ,470 1,458 1 ,430 1 ,444
Employed................................................................ 1 ,541 1,350 1 ,328 1 ,543 1 ,388 1,347 1,311 1,321 1,329Unemployed............................................................ 137 96 95 166 163 123 147 109 115Unemployment rate ................................................ 8 .2 6 .6 6 .7 9 .7 10 .5 8 .4 10.1 7 .6 8 .0
25 to 29 years
Civilian noninstitutional population2 ................................ 2 ,739 3 ,104 3,139 2 ,739 3,001 3 ,035 3,069 3 ,104 3,139Civilian labor force ...................................................... 2 ,603 2,928 2,984 2,601 2 ,829 2,873 2 ,918 2,911 2,976
Employed................................................................ 2 ,504 2,819 2 ,905 2 ,483 2 ,730 2,753 2,799 2 ,786 2,882Unemployed............................................................ 99 109 79 118 99 120 119 125 94Unemployment rate ................................................ 3 .8 3 .7 2 .6 4 .5 3 .5 4 .2 4 .1 4 .3 3 .2
Total, 30 to 34 years
Civilian noninstitutional population3 .......................... 777 1,089 1,117 777 1,003 1,031 1,060 1,089 1,117Civilian labor force ...................................................... 753 1,069 1,097 752 983 1,005 1,018 1,077 1,095
Employed .............................................................. 733 1,041 1,069 731 960 990 999 1,032 1,066Unemployed............................................................ 20 28 28 21 23 15 19 45 29Unemployment rate ................................................ 2 .7 2 .6 2 .6 2 .8 2 .3 1 .5 1 .9 4 .2 2 .6
NONVETERANS
Total. 20 to 29 years
Civilian noninstitutional population3 ................................ 10 ,209 10,914 10,967 10,209 10,745 10,797 10,853 10,914 10,967Civilian labor force ...................................................... 8 ,862 9 ,546 9 ,619 8 ,9 6 2 9 ,3 9 0 9 ,437 9 ,444 9 ,537 9,719
Employed................................................................ 8 ,331 9 ,036 9 ,187 8 ,377 8 ,866 8 ,906 8 ,879 9 ,007 9 ,242Unemployed............................................................ 531 510 432 585 524 531 565 530 477Unemployment rate ................................................ 6 .0 5 .3 4 .5 6 .5 5 .6 5 .6 6 .0 5 .6 4 .9
20 to 24 yean
Civilian noninstitutional population3 ................................ 6 ,194 6 ,770 6 ,812 6 ,194 6 ,629 6 ,675 6 ,718 6 ,770 6 ,812Civilian labor force ...................................................... 5 ,053 5,607 5 ,663 5 ,158 5 ,499 5,520 5,521 5,599 5,770
Employed................................................................ 4 ,648 5,243 5,361 4 ,719 5 ,135 5 ,165 5,137 5,233 5,443Unemployed............................................................ 405 364 302 439 364 355 384 366 327Unemployment rate ................................................ 8 .0 6 .5 5 .3 8 .5 6 .6 6 .4 7 .0 6 .5 5 .7
25 to 29-yaan
Civilian noninstitutional population 3 ................................ 4 ,015 4 ,144 4 ,155 4 ,015 4 ,116 4 ,122 4 ,135 4 ,144 4 ,155Civilian labor force ...................................................... 3 ,809 3 ,939 3,956 3,804 3,891 3,917 3,923 3,938 3,949
Employed................................................................ 3 ,683 3,793 3 ,826 3,658 3,731 3,741 3,742 3 ,774 3,799Unemployed............................................................ 126 146 130 146 160 176 181 164 150Unemployment rate ................................................ 3 .3 3 .7 3 .3 3 .8 4 .1 4 .5 4 .6 4 .2 3 .8
Total, 30 to 34 yean
Civilian noninstitutional population2 ................................ 3 ,447 3,645 3,659 3 ,447 3 ,599 3,621 3,633 3,645 3,659Civilian labor force ...................................................... 3 ,313 3 ,510 3 ,534 3,311 3 ,480 3 ,516 3,504 3,504 3,527
Employed................................................................ 3 ,230 3 ,448 3 ,470 3 ,218 3,406 3,446 3 ,420 3,427 3,456Unemployed............................................................ 83 62 64 93 74 70 84 77 71Unemployment rate .............................................. .1 2 .5 1 .8 1 .8 2 .8 2 .1 2 .0 2 .4 2 .2 2 .0
1 V ietnam Era v e te r a n s a r e th o s e who s e rv e d a f t e r August 4 , 1964. A t p r e s e n t , o f th e V ie tn am Era v e t e r a n s o f a l l a g e s , 73 p e r cen t a r e 20 to 29 y e a rs o f a ge and 17 p e rc e n t a r e 30 t o 34 y e a r s o f a g e . P o s t -K o re a n -p e a c e t im e v e t e r a n s a r e n o t in c lu d e d in th is
t a b le .2 S in c e s ea son a l v a r ia t i o n s a r e not p r e s e n t in th e p o p u la t io n f i g u r e s , id e n t i c a l numbers ap p ea r in th e u n ad ju s ted and s e a s o n a lly
a d ju s te d colum ns.
Digitized for FRASER http://fraser.stlouisfed.org/ Federal Reserve Bank of St. Louis
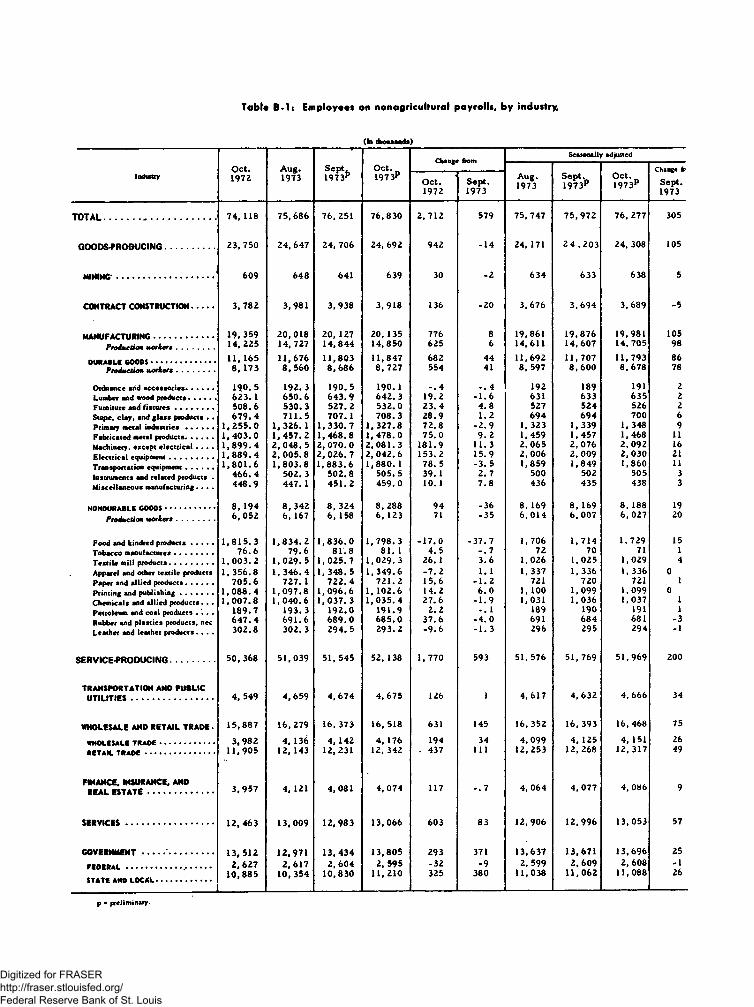
Table B-l: Employees on nonagricultural payrolls, by industry,
(In thousands)
Industry
TOTAL.....................
GOODS-PROBUCING
CONTRACT CONSTRUCTION
MANUFACTURING.......................Production w orkers................
DURABLE GOODS.............................Production w orkers................
Ordnance and accessories...........Lumber and wood products...........Furniture and fix tu res ................Stogie, clay, and glass products .Primary metal indu stries ...........Fabricated metal products...........Machinery, except electrical . . .Electrical equipment...................Transportation equipment...........Instruments and related products Miscellaneous manufacturing . . .
NONDURABLE GOODS......................Production w orkers ................
Food and kindred products . . . .Tobacco manufactures................Textile mill products...................Apparel and other textile productsPaper and allied products...........Printing and publishing.............Chemicals and allied producrs. . Petroleum and coal products . .Rubber and plastics products, nec Leather and leather products. . .
SERVICE-PRODUCING................
TRANSPORTATION ANO PUBLIC UTILITIES...................................
WHOLESALE AND RETAIL TRADE .
WHOLESALE TR AD E..........................RETAIL T R A D E .................................
FINANCE. INSURANCE. AND REAL ESTATE............................
SERVICES.....................................
GOVERNMENT ...............................
FEDERAL ........................... ..........
STATE AND LO CAL...........................
Oct.1972
Aug.1973
Sept,,1973p
Oct. 197 3P
Change fromSeasonally adjusted
Aug.1973
Sept-D1973p
Oct.1973p
Change fr
Sept.1973
Oct.1972
Sept.1973
74,118 75,686 76,251 76,830 2, 712 579 75, 747 75,972 76,277 305
23,750 24,647 24, 706 24, 692 942 -14 24,171 24,203 24,308 105
609 648 641 639 30 -2 634 633 638 5
3,782 3,981 3,938 3,918 136 -20 3,676 3,694 3, 689 -5
19.359 20,018 20,127 20,135 776 8 19,861 19.876 19,981 10514, 225 14, 727 14,844 14,850 625 6 14,611 14,607 14,705 98
11,165 11.676 11,803 11,847 68 2 44 11,692 11,707 11,793 868, 173 8, 560 8,686 8, 727 554 41 8, 597 8,600 8, 678 78
190.5 192. 3 190.5 190. 1 -. 4 -. 4 192 189 191 2623. 1 650.6 643.9 642. 3 19.2 -1.6 631 633 635 2508.6 530.3 527. 2 532.0 23.4 4.8 527 524 526 2679.4 711.5 707.1 708. 3 28.9 1.2 694 694 700 6
1,255.0 1, 326. 1 1,330.7 1, 327.8 72.8 -2.9 1, 323 1,339 1, 348 91,403.0 1,457.2 1, 468.8 1,478.0 75.0 9.2 1, 459 1,457 1,468 111,899.4 2,048. 5 2,070.0 2,081. 3 181.9 11. 3 2,065 2, 076 2,092 161,889.4 2, 005.8 2, 026.7 2, 042.6 153.2 15.9 2, 006 2, 009 2,030 211,801.6 1,803.8 1,883.6 1,880. 1 78. 5 -3.5 1,859 1,849 1,860 11
466.4 502. 3 502.8 505. 5 39. 1 2. 7 500 502 505 3448.9 447. 1 451.2 459. 0 10. 1 7.8 436 435 438 3
8, 194 8, 342 8, 324 8, 288 94 -36 8, 169 8, 169 8, 188 196,052 6, 167 6, 158 6, 123 71 -35 6, 014 6, 007 6, 027 20
1,815.3 1,834.2 1,836.0 1,798.3 -17.0 -37. 7 1, 706 1,714 1, 729 1576.6 79.6 81.8 81. 1 4. 5 -. 7 72 70 71 1
1,003.2 1,029.5 1,025.7 1,029.3 26. 1 3.6 1,026 l, 025 1,029 41,356.8 1, 346.4 1,348.5 1,349.6 -7. 2 1. 1 1, 337 1, 336 1, 336 0
705.6 727. 1 722. 4 721.2 15.6 -1. 2 721 720 721 11,088.4 1,097.8 1,096.6 1, 102.6 14. 2 6.0 1, 100 1,099 1,099 01,007.8 1,040.6 1,037.3 1,035. 4 27.6 -1.9 1.031 1,036 1,037 1
189.7 193.3 192.0 191.9 2.2 - . 1 189 190 191 1647.4 691.6 689.0 685.0 37.6 -4.0 691 684 681 -3302.8 302. 3 294. 5 293.2 -9.6 -1. 3 296 295 294 -1
50, 368 51,039 51, 545 52,138 1, 770 593 51, 576 51,769 51,969 200
4, 549 4,659 4, 674 4,675 126 1 4, 617 4, 632 4, 666 34
15,887 16,279 16,373 16,518 631 145 16,352 16,393 16, 468 75
3, 982 4, 136 4, 142 4, 176 194 34 4, 099 4, 125 4, 151 2611,905 12,143 12, 231 12,342 . 437 111 12,253 12,268 12,317 49
3,957 4, 121 4, 081 4, 074 117 -. 7 4, 064 4, 077 4, 086 9
12,463 13,009 12,983 13,066 603 83 12,906 12,996 13,053 57
13,512 12,971 13,434 13,805 293 371 13,637 13,671 13,696 252,627 2,617 2,604 2, 595 -32 -9 2, 599 2,609 2,608 -1
10,885 10,354 10,830 11, 210 325 380 11,038 11,062 11,088 26
p = preliminary.
Digitized for FRASER http://fraser.stlouisfed.org/ Federal Reserve Bank of St. Louis
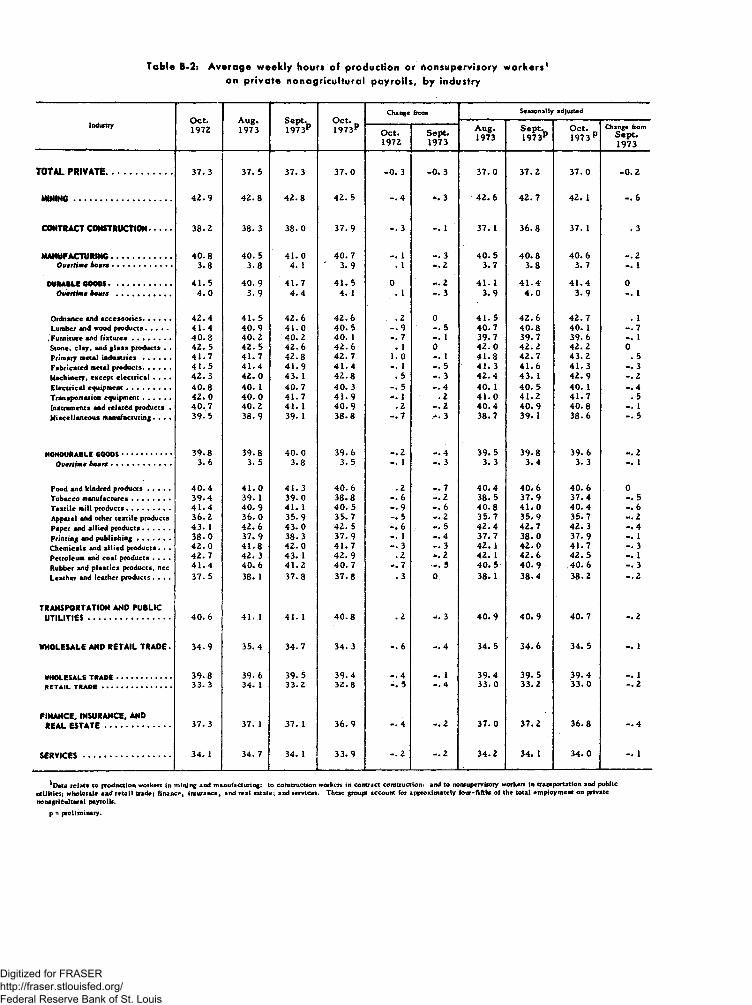
Table B-2: Average weekly hours of production or rionftupervisory workerson private nonagricultural payrolls, by industry
Industry Oct.1972
Aug.1973
s ept.1973p
Oct.1973p
Change from Seasonally adjusted
Aug.1973
Sept.1973p
Oct. _ 1973 P
Change fromSept.1973
Oct.1972
Sept.1973
TOTAL PRIVATE...... .................. 37.3 37.5 37. 3 37.0 -0. 3 -0.3 37.0 37.2 37.0 -0.2
MINING.......................................... 42.9 42.8 42.8 42.5 -.4 *. 3 42.6 42.7 42. 1 -.6
CONTRACT CONSTRUCTION.......... 38.2 38.3 38. 0 37.9 3 37. 1 36.8 37. 1 . 3
MANUFACTURING.......................... 40.8 40. 5 41.0 40.7 1 -.3 40. 5 40.8 40.6 -.2Overtime hours ............................. 3.8 3.8 4. 1 3.9 • 1 -.2 3.7 3.8 3.7 -. 1
DURABLE GOODS.............................. 41.5 40.9 41.7 41. 5 0 -.2 41. 1 41.4 41.4 0Overtime hours .......................... 4.0 3.9 4.4 4. 1 . 1 - .3 3.9 4.0 3.9 -. 1
Ordnance and accessories........ 42.4 41. 5 42.6 42.6 .2 0 41. 5 42.6 42.7 . 1Lumber and wood products. . . . . 41.4 40. 9 41. 0 40. 5 -.9 5 40.7 40.8 40. 1 -.7
. Furniture and fix tu res ................... 40.8 40.2 40.2 40. 1 -.7 -. 1 39.7 39.7 39.6 -. 1Stone, clay, and glass products . . 42.5 42. 5 42.6 42. 6 . 1 0 42. 0 42.2 42.2 0Primary metal in du stries ............. 41.7 41.7 42.8 42.7 1 . 0 -. 1 41.8 42.7 43.2 . 5Fabricated metal products............. 41.5 41.4 41. 9 41.4 -. 1 -. 5 41*3 41.6 41. 3 -. 3Machinery, except electrical . . . . 42.3 42.0 43. 1 42.8 .5 -. 3 42.4 43. 1 42. 9 -.2Electrical equipment « . . . ........... 40.8 40. 1 40.7 40. 3 -.4 40. 1 40. 5 40. 1 -.4Transportation equipment . . . . . . 42.0 40. 0 41.7 41.9 -. 1 .2 41.0 41.2 41.7 .5Instruments and related products . 40.7 40.2 41. 1 40.9 .2 -.2 40.4 40.9 40.8 -. 1Miscellaneous manufacturing. . . . 39.5 38.9 39. 1 38.8 -.7 .** 3 38.7 39. 1 38.6 -. 5
NONDURABLE GOODS................ 39.8 39.8 40. 0 39.6 -.2 -.4 39.5 39.8 39.6 -.2Overtime hours ............................. 3.6 3.5 3.8 3. 5 -. 1 3 3.3 3.4 3.3 -. 1
Food and kindred products........... 40.4 41. 0 41. 3 40.6 .2 - . 7 40.4 40.6 40. 6 0Tobacco manufactures.................. 39.4 39. 1 39.0 38.8 -.6 -.2 38.5 37.9 37.4 -. 5Textile mill products..................... 41.4 40. 9 41. 1 40. 5 -.9 -.6 40.8 41.0 40.4 -.6Apparel ahd other textile products 36.2 36.0 35.9 35.7 -.5 -.2 35.7 35.9 35.7 -.2Paper and allied products............. 43. 1 42.6 43. 0 42. 5 -.6 -. 5 42.4 42.7 42. 3 -.4Printing and publish ing................ 38.0 37.9 38.3 37.9 -. 1 -.4 37.7 38.0 37.9 -. 1Chemicals and allied products. . . 42.0 41.8 42.0 41.7 3 - 3 42. 1 42. 0 41.7 -.3Petroleum and coal products . . . . 42.7 42. 3 43. 1 42. 9 .2 2 42. 1 42.6 42.5 -. 1Rubber and plastics products, nec 41*4 40. 6 41.2 40. 7 -.7 -. 5 40.5 40. 9 40. 6 -.3Leather and leather products. . . . 37.5 38. 1 37.8 37.8 .3 0 38.1 38.4 38.2 -.2
TRANSPORTATION ANO PUBLICUTILITIES................................... 40. 6 41. 1 41. 1 40.8 .2 -. 3 40.9 40.9 40.7 -.2
WHOLESALE ANO RETAIL TRADE. 34.9 35.4 34.7 34. 3 -.6 -.4 34.5 34.6 34. 5 -. 1
WHOLESALE TRAO E.......................... 39.8 39.6 39.5 39.4 -.4 -. 1 39.4 39.5 39.4 -. 1RETAIL TR A D E ...................... 33. 3 34. 1 33.2 32.8 -. 5 - .4 33. 0 33.2 ‘33.0 -.2
F in a n c e , in su r a n c e , a nd
REAL ESTATE............................ 37. 3 37. 1 37. 1 36.9 - . 4 -.2 37.0 37.2 36.8 - . 4
SERVICES..................................... 34. 1 34.7 34. 1 33.9 -.2 -.2 34.2 34. 1 34.0 -. 1
*Data relate to production workers in mining and manufacturing: to construction workers in contract construction: and to nonsupervisoiy workers in transportation and public utilities; wholesale and retail trade; finance, insurance, and real estate; and services. These groups account for approximately four-fifths of the total employment on private nonagricultural payrolls,
p = preliminary.
Digitized for FRASER http://fraser.stlouisfed.org/ Federal Reserve Bank of St. Louis
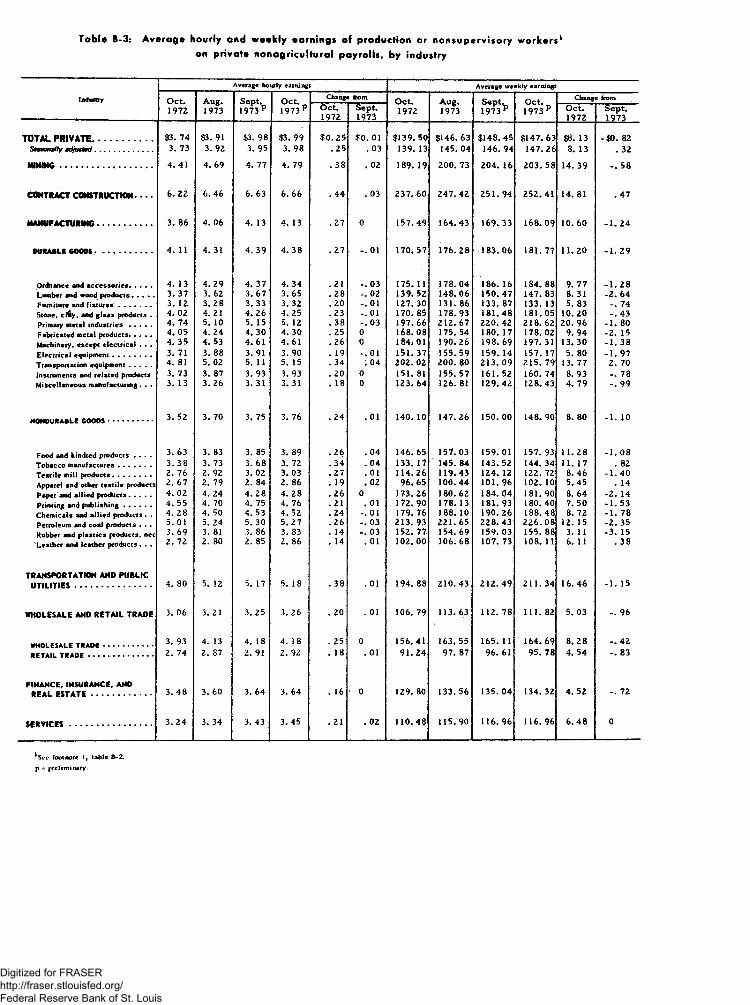
Table B-3: Average hourly and weekly earnings of production or nonsupervisory workers1on private nonagricultural payrolls, by industry
Industry
Average hourly earnings Average weekly earnings
Oct.1972
Aug.1973
Sept. 1973 p
Oct. . 1973 ̂
Change from Oct.1972
Aug.1973
Sept. 1973 ^
Oct. 1973 p
Change fromOct.1972
Sept.1973
Oct.1972
Sept.1973
TOTAL PRIVATE..................... $3. 74 $3. 91 $3. 98 $3.99 $0. 25 $0. 01 $139. 50 $146. 63 $148. 45 $147. 63 $8. 13 -$0. 82Seasonally adjusted............................ 3. 73 3. 92 3. 95 3. 98 .25 .03 139.13 145. 04 146. 94 147.26 8. 13 . 32
MINING........................................ 4. 41 4. 69 4. 77 4. 79 . 38 . 02 189.19 200. 73 204. 16 203.58 14. 39 -.58
CONTRACT CONSTRUCTION------ 6. 22 6. 46 6. 63 6.66 . 44 . 03 237.60 247. 42 251. 94 252.41 14. 81 .47
MANUFACTURING....................... 3. 86 4. 06 4. 13 4. 13 .27 0 157. 49 164. 43 169.33 168.09 10. 60 -1. 24
DURABLE GOOOS. ........................ 4. 11 4. 31 4. 39 4.38 .27 -.01 170.57 176.28 183.06 181.77 11.20 -1.29
Ordnance and accessories........... 4. 13 4. 29 4. 37 4. 34 .21 -.03 175.11 178. 04 186. 16 184.88 9. 77 -1.28Lumber and wood products........... 3. 37 3.62 3.67 3.65 .28 -. 02 139.52 148. 06 150.47 147. 83 8. 31 -2. 64Furniture and fixtures . . . . . . . 3. 12 3.28 3. 33 3. 32 . 20 -.01 127.30 131. 86 133. 87 133.13 5. 83 -. 74Scone. clAy, and glass products . 4. 02 4.21 4.26 4.25 .23 -.01 170.85 178.93 181.48 181.05 10. 20 -.43Primary metal industries........... 4. 74 5. 10 5. 15 5. 12 . 38 -.03 197.66 212.67 220.42 218. 62 20. 96 -1. 80Fabricated metal products........... 4. 05 4. 24 4.30 4. 30 .25 0 168. 08 175.54 180. 17 178. 02 9. 94 -2. 15Machinery, except electrical . . . 4.35 4. 53 4.61 4.61 .26 0 184.01 190.26 198. 69 197.31 13.30 -1. 38Electrical equipment................... 3. 71 3. 88 3.91 3. 90 . 19 -.01 151.37 155.59 159. 14 157.17 5. 80 -1. 97Transportation equipment........... 4. 81 5. 02 5. 11 5. 15 . 34 . 04 202.02 200. 80 213. 09 215.79 13. 77 2. 70Instruments and related products 3. 73 3. 87 3. 93 3. 93 .20 0 151. 81 155. 57 161.52 160. 74 8. 93 - . 78Miscellaneous manufacturing. . . 3. 13 3. 26 3.31 3. 31 . 18 0 123. 64 126. 81 129. 42 128. 43 4. 79 99
NONDURABLE GOOOS...................... 3. 52 3. 70 3. 75 3. 76 . 24 . 01 140.10 147.26 150. 00 148. 90 8. 80 -1. 10
Food and kindred products . . . . 3. 63 3. 83 3. 85 3. 89 .26 . 04 146.65 157. 03 159.01 157.93 11.28 -1. 08Tobacco manufactures ................ 3. 38 3. 73 3.68 3. 72 . 34 . 04 133. 17 145. 84 143.52 144.34 11. 17 . 82Textile mill products............. 2. 76 2. 92 3. 02 3.03 .27 .01 114.26 119. 43 124.12 122. 72 8. 46 -1.40Apparel and other textile products 2.67 2. 79 2. 84 2. 86 . 19 . 02 96. 65 100.44 101. 96 102.10 5.45 . 14Paper and allied products........... 4.02 4. 24 4.28 4. 28 .26 0 173.26 180. 62 184.04 181. 90 8. 64 -2. 14Printing and publish ing............. 4.55 4. 70 4. 75 4. 76 .21 . o r 172. 90 178. 13 181. 93 180.40 7. 50 -1. 53Chemicals and allied products. . 4.28 4. 50 4. 53 4.52 . 24 -.01 179.76 188. 10 190.26 188.48 8. 72 -1. 78Petroleum and coal products . . . 5.01 5.24 5. 30 5.27 .26 -. 03 213.93 221.65 228.43 226.08 12. 15 -2. 35Rubber and plastics products, nec 3.69 3. 81 3. 86 3. 83 . 14 -.03 152.77 154.69 159. 03 155.88 3. 11 -3. 15Leather and leather products . . . 2. 72 2. 80 2. 85 2. 86 . 14 . 01 102.00 106. 68 107. 73 108. 11 6. 11 . 38
TRANSPORTATION AND PUBLICUTILITIES................................. 4. 80 5. 12 5. 17 5. 18 . 38 . 01 194. 88 210.43 212.49 211.34 16.46 -1. 15
WHOLESALE AND RETAIL TRADE 3.06 3. 21 3.25 3. 26 .20 . 01 106* 79 113. 63 112.78 111. 82 5. 03 -. 96
WHOLESALE TRAO E........................ 3. 93 4. 13 4. 18 4. 18 .25 0 156.41 163.55 165.11 164. 69 8.28 -. 42RETAIL T R A D E ............................... 2. 74 2. 87 2. 91 2. 92 . 18 . 01 91.24 97. 87 96.61 95.78 4. 54 - . 83
FINANCE, INSURANCE, ANDREAL ESTATE.......................... 3. 48 3. 60 3. 64 3. 64 . 16 ' 0 129. 80 133.56 135.04 134.32 4. 52 - . 72
SERVICES................................... 3.24 3. 34 3.43 3. 45 .21 .02 110.48 115. 90 116. 96 116.96 6.48 0
1 See footnote 1, tabic B-2. p - preliminary.
Digitized for FRASER http://fraser.stlouisfed.org/ Federal Reserve Bank of St. Louis
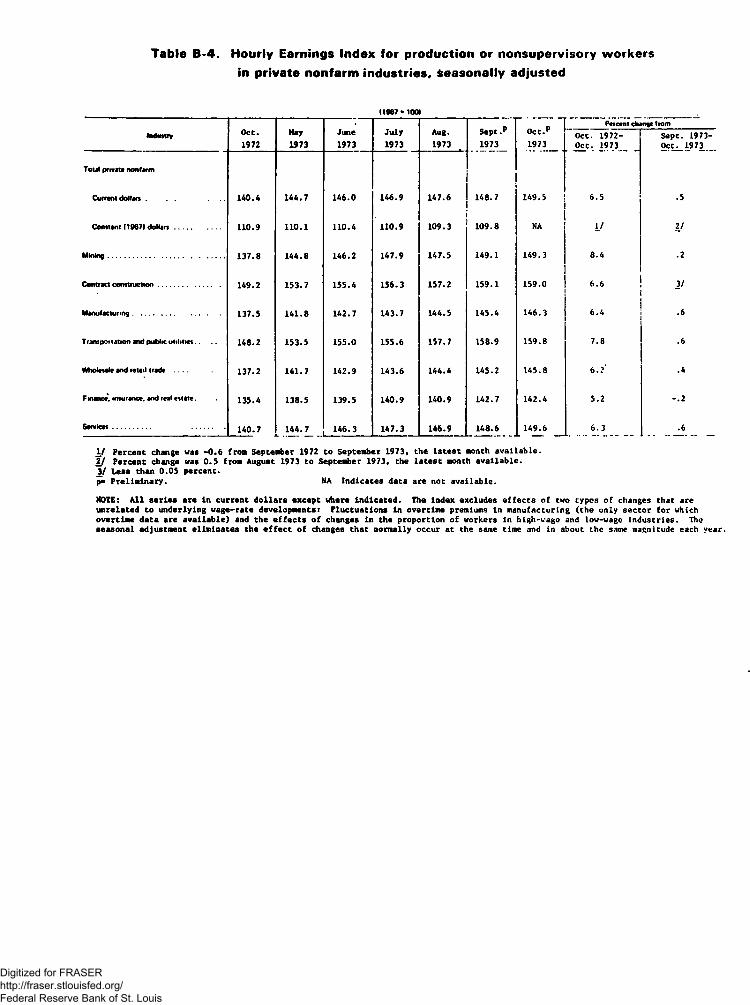
Table B-4. Hourly Earnings Index for production or nonsupervisory workers
in private nonfarm industries. Seasonally adjusted
(1967 - 100)
July1973
Sept.p1973
Oct.p1973
Percent change from
Industry O c t.
1972May1973
June1973
Aug.1973
Oct. 1972- Oct. 1973
Sept. 1973- JL9 7 3___
Total private nonfarm
Current dollars . . . . 140.4 144.7 146.0 146.9 147.6 148.7 149.5 | 6.5 .5
Constant (1967) dollars...................... 110.9 110.1 110.4 110.9i
109.3j
109.8 NA 1J 2 /
Mining........................................................ 137.8 144.8 146.2 147.9 147.5 149.1 149.3 8.4 .2
Contract construction.............................. 149.2 153.7 155.4 156.3 157.2 159.1 159.0 6.6 3/i
Manufacturing.......................................... 137.5 141.8 142.7 143.7 144.5 145.4 L46.3i
6.4ii .6
T ranspertation and public utilities 148.2 153.5 155.0 155.6 157.7 158.9 159.8 7.8 .6
Wholesale and retail trade ----- 137.2 141.7 142.9 143.6 144.4 145.2 145.8 6.?' .4
Finance* insurance, and real estate. 135.4 138.5 139.5 140.9 140.9 142.7 142.4 5.2 -.2
Services.................. ................ 140.7 144.7 146.3 147.3 146.9 148.6 149.6 6.3 .6
1/ Percent change was -0.6 from September 1972 to September 1973, the latest month available.2/ Percent change was 0.5 from August 1973 to September 1973, the latest month available.3/ Less than 0.05 percent.p- Preliminary. NA Indicates data are not available.
NOTE: All series are in current dollars except where indicated. The index excludes effects of two types of changes that areunrelated to underlying wage-rate developments: Fluctuations in overtime premiums in manufacturing (the only sector for whichovertime data are available) and the effects of changes in the proportion of workers in high-u-agc and low-wage industries. The seasonal adjustment eliminates the effect of changes that normally occur at the same time and in about the same magnitude each year.
Digitized for FRASER http://fraser.stlouisfed.org/ Federal Reserve Bank of St. Louis
LABOR FORCE, EMPLOYMENT, UNEMPLOYMENTHOUSEHOLD DATA - SEASONALLY ADJUSTED
1 . LABOR FORCE AND EMPLOYMENT_____ C IV ILIAN LABOR FORCE........ TOTAL EMPLOYMENT......... NONAGRICULTURAL EMPLOYMENT
THOUSANDS
1964 196S 1966 196*7 1968 1969 1970 1971 1972 1973
2- TOTAL EMPLOYMENTAOULT MEN ADULT WOMEN TEENAGERS
THOUSANOS
1964 1965 1966 1967 1968 1969 1970 1971 1972 1973
60000
50000'
40000
30000
20000
10000
0
3. UNEMPLOYMENT_____ ALL C IV ILIAN WORKERS......... FULL-TIME WORKERS......... MARRIED MEN
THOUSANOS
1964 1965 1966 1967 I960 1969 1970 1971 1972 1973
4. UNEMPLOYMENT_____ AOULT MEN........ AOULT WOMEN......... TEENAGERS
THOUSANOS
1964 1965 1966 1967 1968 1969 1970 1971 1972 1973
Digitized for FRASER http://fraser.stlouisfed.org/ Federal Reserve Bank of St. Louis
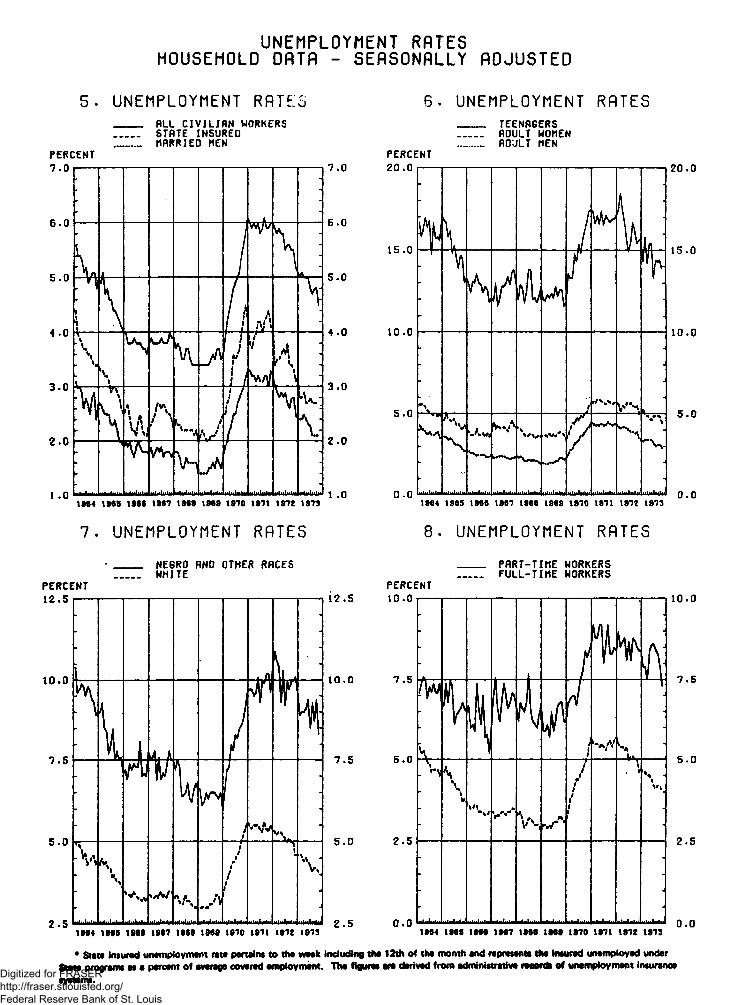
UNEMPLOYMENT RATESHOUSEHOLD DATA - SEASONALLY ADJUSTED
5. UNEMPLOYMENT RATES S. UNEMPLOYMENT RATES_____ ALL C IV IL IAN WORKERS......... STATE INSURED......... flARRIED MEN
PERCENT
t H 4 1865 1966 196*7 1966 1969 19*70 19*71 19*72 1973
_____ TEENAGERS........ ADULT WOMEN......... ADULT MEN
PERCENT
7. UNEMPLOYMENT RATES 8. UNEMPLOYMENT RATES
• _____ NEGRO AND OTHER RACES......... WHITE
PERCENT
PART-TIME WORKERS FULL-TIME WORKERS
1964 1965 1966 1967 1968 1969 1970 1971 1972 1973
* Stats insur'd unemployment rate pertains to the week including the 12th of the month and represent* the insured unemployed under State programs as a percent of average covered employment. The figures are derived from administrative records of unemployment insurance
Digitized for FRASER http://fraser.stlouisfed.org/ Federal Reserve Bank of St. Louis
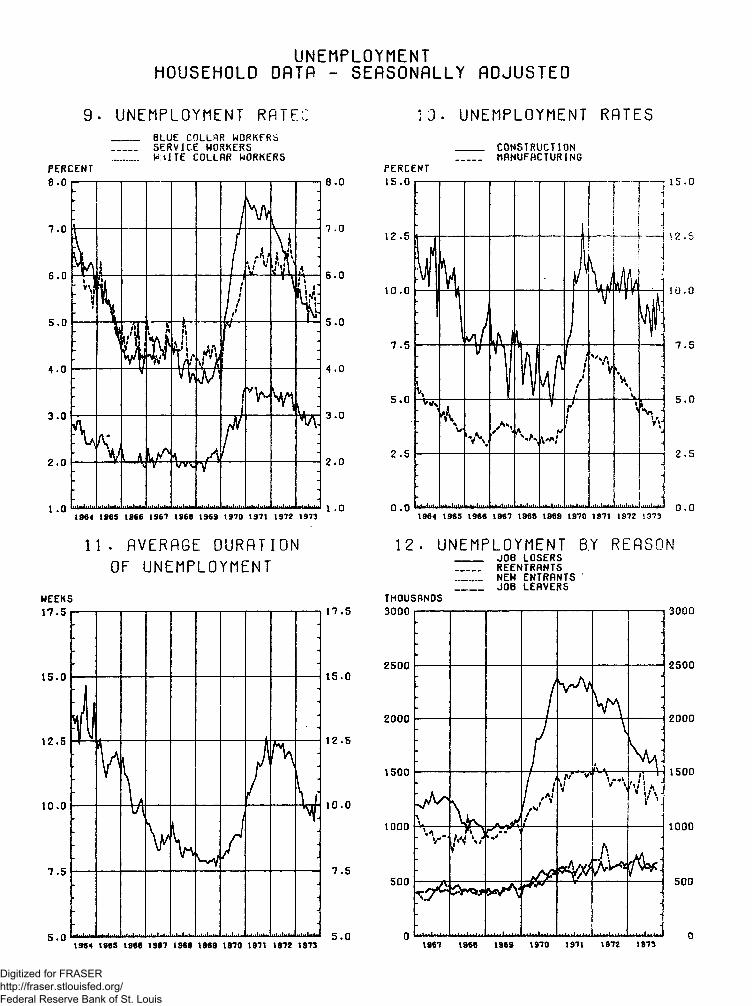
UNEMPLOYMENTHOUSEHOLD DATA - SEASONALLY ADJUSTED
9. UNEMPLOYMENT RATE 13. UNEMPLOYMENT RATES_____ BLUE COLLAR WORKERS........ SERVICE WORKERS _____ CONSTRUCTION......... M UTE COLLAR WORKERS MANUFACTURING
PERCENT
1964 1965 1966 1967 1968 1969 1970 1971 1972 1973 1964 1965 1966 1967 1968 1969 1970 1971 1972 1973
15.0
\ 2 . 5
10.0
7 .5
5 .0
2 .5
0. 0
1 1 . AVERAGE DURATION OF UNEMPLOYMENT
MEEKS
1964 1965 1966 1967 1968 1969 1970 1971 1972 1973
12. UNEMPLOYMENT B.Y REASON_____ JOB LOSERS........ REENTRANTS......... NEW ENTRANTS_____ JOB LEAVERS
1967 1968 1969 1970 1971 1972 1973
3000
2500
2000
1500
1000
500
0
Digitized for FRASER http://fraser.stlouisfed.org/ Federal Reserve Bank of St. Louis
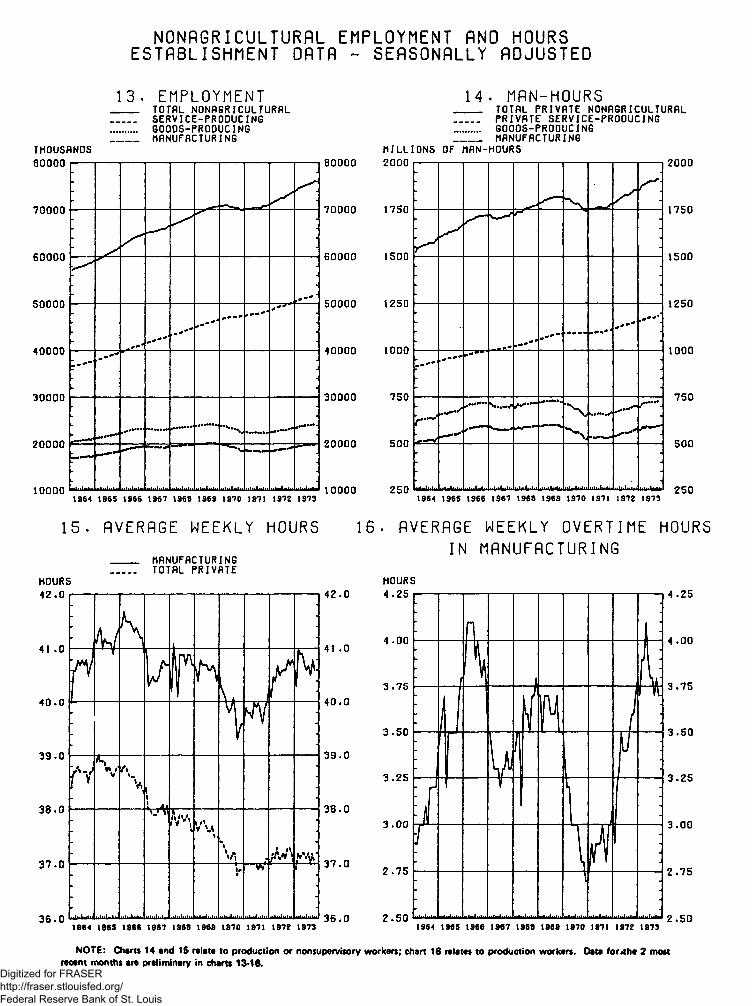
13. EMPLOYMENT 14. MAN-HOURS
NONflGRICULTURRL EMPLOYMENT AND HOURSESTABLISHMENT DATA - SEASONALLY ADJUSTED
_____ TOTAL NONAGRI CULTURAL........ SERVICE-PRODUCING......... GOODS-PROOUCING_____ MANUFACTURING
THOUSANDS
1964 196S 1966 1967 1968 1969 1970 1971 1972 1973
TOTAL PRIVATE NONAGRICULTURAL PRIVATE SERVICE-PROOUCING GOOOS-PROOUCING
_____ MANUFACTURING
2000
1750
1500
1250
1000
750
500
1964 1965 1966 1967 1968 1969 1970 1971 1972 1973
25Q
15. AVERAGE WEEKLY HOURS
_____ MANUFACTURING........ TOTAL PRIVATE
16. AVERAGE WEEKLY OVERTIME HOURS IN MANUFACTURING
HOURS4.25
4.00
3.75
3.50
3.25
3.00
2.75
2.501964 1965 1966 1967 1968 1969 1970 1971 1972 1973 1964 1965 1966 1967 1968 1969 1970 1971 1972 1973
NOTE: Charts 14 and 15 relate to production or nonsupervisory workers; chart 16 relates to production workers. Data for4he 2 most recent months are preliminary in charts 13-16.
Digitized for FRASER http://fraser.stlouisfed.org/ Federal Reserve Bank of St. Louis


