Embed Size (px)
DESCRIPTION
Â
Citation preview

M h 25 20141
March 25, 2014

AGENDA
I t d ti & G l f th W t & Effi i Introductions & Goals of the Waste & Efficiency Commission
Snapshot of the City’s Current State
Discussion: Initial Ideas
Next Steps
2

Introducing the Mayor’s Blue Ribbon Commission on Waste & Efficiency in Government
CITY COUNCIL
Waste & Efficiency in Government
BUSINESS LABOR
Howard Shook (Co-Chair) District 7
Yolanda AdreanDi t i t 8
Richard Anderson (Co-Chair) CEO, Delta
Ken AllenInternational Brotherhood of Police Officers
Stephen BordersDistrict 8
Keisha Lance Bottoms, District 11
C.T. Martin
Martin L. FlanaganPresident & CEO, Invesco
William TaggartPresident & CEO, Atlanta Life
Stephen BordersAtlanta Professional Firefighters union
Alan LeeA i F d ti f C.T. Martin
District 10
Mary NorwoodAt Large Post 2
Jo ce Shepa d
Financial Group
Geri ThomasState President of Georgia, Bank of America
American Federation of State, County and Municipal Employees
Gina PagnottaProfessional Association of City Joyce Shepard
District 12
Alex WanDistrict 6
Professional Association of City Employees
Terrance SimonProgressive Firefighters of Atlanta union
Collectively, the Commission is charged with strengthening the City of Atlanta’s fiscal health by identifying efficiencies that support investment in
Atlanta union
3
infrastructure and ensure operational excellence in all parts of the City

Objectives
The Commission is charged with making recommendations to the Mayor that identify savings and efficiencies to put the City on a sustainable CHARGE that identify savings and efficiencies to put the City on a sustainable fiscal path
Recommendations will enable the City to address the infrastructure backlog and ongoing infrastructure maintenance requirements
CHARGE
Efforts will strengthen Atlanta’s position as a leader among cities in finding new ways to ensure a strong financial and operational position
Th t t f Atl t ’ i f t t th t t th Cit ’ The state of Atlanta’s infrastructure poses a threat to the City’s competitiveness as an economic leader in the Southeast and the nation
Addressing the highest priority items must begin immediately; opportunities for savings identified by the Commission are essential to
URGENCY
pp g ymeet annual debt financing requirements of the bond
City Operations and Council are always looking at our operations and hi i l
UNIQUE ROLE ways to save money—this is not unusual
However, the scope of the challenge requires us to step back from incremental cost improvements and consider bolder, structural changes
OF COMMISSION
4

Commission on Waste & Efficiency Timeline
KICK-OFF IDEA COLLECTION IDEA DEVELOPMENT PRIORITIZATION RECOMMENDATIONS
Week ofth
Week of t
April 28th
thWeek of
thWeek of
th
DEVELOPMENT
March 28th
Goals /
April 21st to May 9th May 11th June 24th
Goals / Objectives
Review Current State
Assign Preliminary
Ideas to Working Groups
Idea Development /
Analysis
Initial Prioritizations
of Ideas
Review and Finalize
Recomm-endationsState
Launch Idea Collection
Process
Review Prioritization
Criteria
Prioritize Potential Ideas
Identify FY15 vsFY16 Timing
Develop Phased Approach for
FY15/FY16 Process
Review of
Key Opportunity Themes
And Creation of Sub-groups
Key Budget Dates:
5
y g-Council Break April 7-18-Proposed Budget Book Delivery: April 25-Budget Amendments, Full Council: May 29 (Finance/Exec Committee: May 14)-Budget Amendments, FINAL Input to Full Council: June 16 (Finance/Exec Committee: June 11)

AGENDA
I t d ti & G l f th W t & Effi i Introductions & Goals of the Waste & Efficiency Commission
Snapshot of the City’s Current State
Discussion: Initial Ideas
Next Steps
6

State of Atlanta’s Infrastructure
In the midst of a nationwide economic downturn, the City of Atlanta has been working in a constrained fiscal environment, grappling with strategies to enable us to do more with less
During this time we have pursued a fiscal strategy focused on stabilizing City services and increasing efficiencies – since 2007, the city has cut over $125M f om a Gene al F nd b dget of $670M do n to a b dget of $544M hil from a General Fund budget of $670M down to a budget of $544M, while also improving services to Citizens
This strategy comes at a cost, and the City has under-invested in core infrastructure
Th Cit tl h $1 1B i f t t b kl fi i th f ll The City currently has a $1.1B infrastructure backlog; financing the full backlog , would require ~$75M in incremental revenue per year to cover debt service
Additionally the City needs approximately $95M in incremental operatingAdditionally, the City needs approximately $95M in incremental operatingfunds to maintain infrastructure and avoid future backlogs
Forecasted revenue growth of ~1% per year would bring in a total of $30-35Mincremental revenue over the next 3 years, which is insufficient to 3 y ,address core infrastructure issues
Ensuring fiscal stability in future years, requires that the City take dramatic steps to increase efficiencies and change the way we do business
7Source: City of Atlanta CAFR; Office of Budget; 2010 State of the City’s Transportation Infrastructure & Fleet Inventory Report; 2012 Bain Infrastructure Report; Department conversations

The General Fund’s inability to capture City growth is unsustainableunsustainable
Inflation-adjusted revenue and expenditures currently
below 1993 levels
8
Note: GDP, Revenue, and Expenditures all adjusted for inflation based on CPI-U for the metropolitan Atlanta region. Fiscal year change-over occurred in 2006; thus, FY2006 numbers are estimated assuming constant growth from 2005-2007Source: Bureau of Economic Analysis, Bureau of Labor Statistics, City of Atlanta CAFR

The City identified a $1.1B backlog in 2012 that continues to grow due to lack of annual fundingcontinues to grow due to lack of annual funding
TOTAL INFRASTRUCTURE BACKLOG CURRENTLY EXCEEDS $1.1BPRELIMINARY
Funding an Infrastructure Bond to address the full backlog would require
9
Note: $922M in public right of way infrastructure may be reduced by ~30K due to recent investment in bridgesSource: FY13 City of Atlanta Adopted Budget; City of Atlanta Departments; 2010 State of the City’s Transportation Infrastructure & Fleet Inventory Report; 2012 Bain Infrastructure Report
~$75M/year in financing costs

In addition, the City needs ~$95M more per year to prevent future backlogsg
Assumes backlog is addressed; increase below reflects the requirements necessary to
PRELIMINARY
below reflects the requirements necessary to prevent future deferred needs
L d
High-end
Low-end
~$95M steady-state need based on refined 2014
analysis by the f bliDepartment of Public
Works
10Source: 2011 CAFR; Department estimates; 2010 State of the City’s Transportation Infrastructure & Fleet Inventory Report

A tightly prioritized list still requires an immediate need for $250M to address the highest-priority backlog items
EXAMPLE LIST OF INVESTMENT NEEDS FOR FIRST $250M
PROPER EXECUTION OF THE INITIAL INVESTMENTS IS PARAMOUNT
$ g p y g
PRELIMINARY
• Rate all potential projects on a detailed basis, for example:
- Compliance with federal, state, local lawsCompliance with federal, state, local laws
- Safety assessments, age, useful life
- Cost, return on investment, funding /sources
- Alignment with the City’s long-term vision
- Future operations and management costs
- Environmental/sustainability concerns
• For highly ranked projects, refine cost estimates with respective departments with respective departments
• Iterate internally within departments
• Work with City Council, Departments and other key stakeholders to finalize prioritization
• Communicate proactively with the public and focus on positive impact and transparencyBaseline prioritization
11
and transparency
Source: City of Atlanta Departments; 2010 State of the City’s Transportation Infrastructure & Fleet Inventory Report
Baseline prioritization to be developed with key
stakeholders

Failing infrastructure, both chronic and acute, can significantly hamper Atlanta’s economyg y p y
CHRONIC: General traffic ACUTE: A major bridge ffcongestion costs the city
economy:$313 Million per year
j gfailure could cost the city
economy:$28 Million per week$313 Million per year $28 Million per week
• Wear and tear on roads• Excess fuel consumption• Increased CO2 emissions
Shi i ti
• Lost productivity and increased commute times
• Reduced spending on local b i
12
• Shipping congestion
Source: Texas A&M Transportation Institute; 2011 COA Community Development Plan report; City internal analysis and assumptions
businesses

The City cannot fund this work with current budgets and is projecting budget over-runs in FY14 through FY16is projecting budget over runs in FY14 through FY16
$700
$
$500
$600
$200
$300
$400
$M
M
$-
$100
$
FY 10 FY 11 FY 12 FY 13 FY 14* FY 15* FY 16*
Revenues $552 $559 $556 $532 $537 $545 $552 Expenses $487 $539 $523 $521 $540 $581 $587
$(100)
p $4 7 $539 $5 3 $5 $54 $5 $5 7Surplus/Deficit $65 $20 $33 $11 $(3) $(36) $(35)
Revenues Expenses Surplus/Deficit
13Note: City of Atlanta Published Budget Book, FY10-FY13; FY14 Q2 Budget Update; FY14 Five Year Budget Plan; Department of Finance
General Fund expenses must be streamlined to avoid going into deficit

Atlanta’s tax base does not support infrastructure needs
City of Atlanta Regional Position is not reflected in population tax base
Atlanta receives far less state support than peers
PRELIMINARY
45%
18 000 000
20,000,000
2012 METRO AREA
reflected in population tax base than peers
30%
35%
40%
14,000,000
16,000,000
18,000,000 POPULATION
CITY POPULATION AS % OF METRO POPULATION
20%
25%
30%
8 000 000
10,000,000
12,000,000
10%
15%
4,000,000
6,000,000
8,000,000
0%
5%
0
2,000,000
k C
ity
usto
n
hville
oeni
x
gele
s
cago
elph
ia
enve
r
rtlan
d
Dal
las
osto
n
apol
is
D.C
.
tlant
a
14
New
Yor
k
Hou
Nas Pho
Los
Ang
Chi
c
Phila
de De
Por D B
o
Min
nea
Was
hing
ton,
At
Source: Fiscal Research Center for Georgia State University, Governor’s Adopted FY2013 Budget Report, GA Dept. of Revenue, GA Dept. of Transportation, Bureau of Economic Analysis, GA Dept. of Education, city CAFRs
Property inflation does not automatically increase property tax revenue for the citytax revenue for the city
Atlanta property tax revenue growth forecast 2014 - 2024
Estimated annual rollback Estimated annual rollback $20M - $59M
Estimated property tax revenue $169M; growing at $1 2M each year
N ti d i t th f f t d i f
$1-2M each year
New properties and improvements are the source of forecasted revenue increases for the city State Law requires cities to rollback revenue from property inflation on existing
properties or declare a tax increase
15
p p

This has forced Atlanta to already be one of the most efficient Citiesefficient Cities
General Fund Expenditure per Capita Already Lower than Peer Cities PRELIMINARY
Further improvements will require new operating norms;
16Note: *Capita = daytime population; 2010 most recent year for which all cities’ data is available; average includes peers and Atlanta status quoSource: City CAFRs
Further improvements will require new operating norms; however, these changes will move us from good to best in class

However, despite efficiencies, cost of personnel is trending upwardg p
Following a sharp decline in FY10, headcount and salary expenditures have trended upward
$420
4 700
4,800
Employee headcount over time
$380
$400
4 400
4,500
4,600
4,700
$340
$360
4 100
4,200
4,300
4,400
FY 09 FY 10 FY 11 FY 12 FY 13 FY 14$300
$320
3,900
4,000
4,100
Headcount 4,668 4,156 4,443 4,552 4,488 4,492 Salaries and Benefits ($MM) $397 $311 $331 $327 $333 $335
H d t S l i d B fit ($MM)
17Source: Department of Human Resources Headcount Report; COA Budget Books
Headcount Salaries and Benefits ($MM)
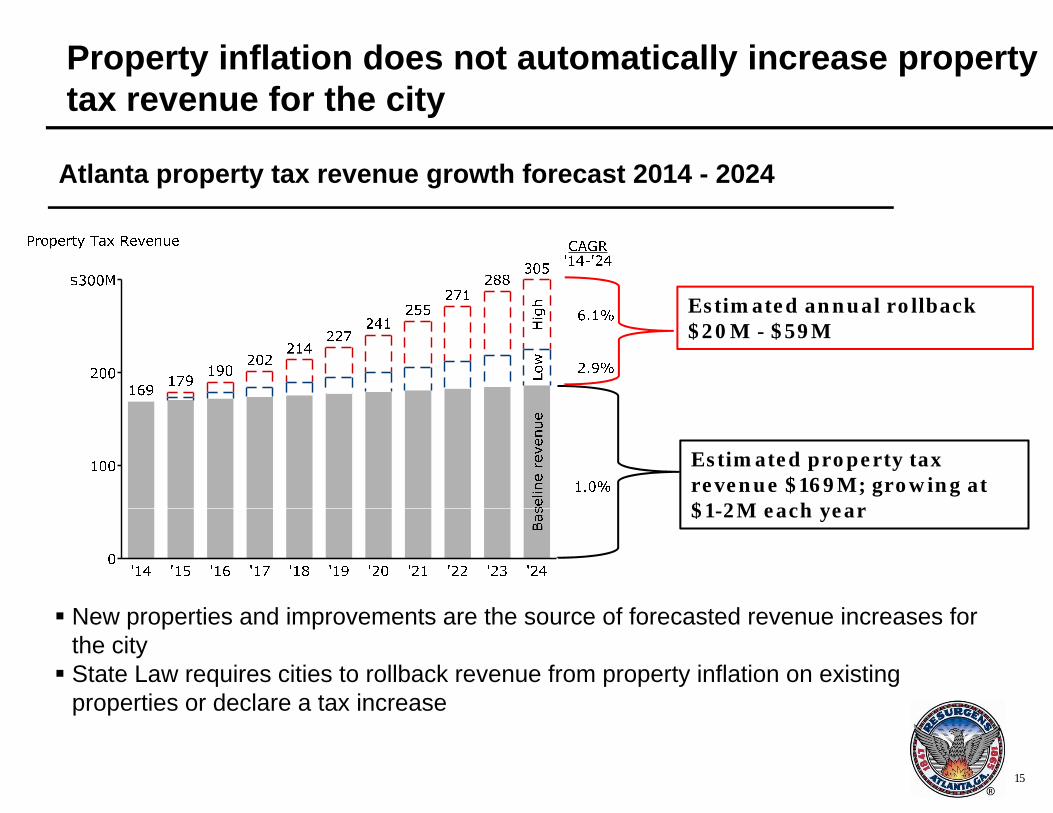
Given increase in headcount and current state of the healthcare systems, healthcare costs are projected to
ti i i ifi tl f ti l ticontinue growing significantly for retiree populationProjected retiree healthcare costs projected to increase at 4% per year for next 30 years
PRELIMINARY
More than 65% of healthcare costs sit
y
$160
Annual Cash Cost for Retirees ($M)CAGR(FY14-FY44)
with the General Fund
Retiree healthcare t j t d t
$120
$140 4%
costs are projected to grow at 4% per year for the next 30 years
Total cash costs are
$80
$100
Total cash costs are forecast to double in the next 13 years and triple over the next
$40
$60
30 years
$0
$20
2014 2016 2018 2020 2022 2024 2026 2028 2030 2032 2034 2036 2038 2040 2042 2044
18
Current retirees Current employees Future employees
Note: Rough, initial valuation; should not be relied upon for City or State decisions; nominal values shownSource: Actuarial reports; Segal July 1, 2011 valuation and projection of OPEB plan; Expert interviews

Growing pension costs are also expected to continue, triggering employee cost sharinggg g p y g
With a change in annual required contributions, City anticipates hitting 35% cap on pension funds by 2029
PRELIMINARY
Given current trajectory, City expects to hit 35% cap (and trigger
employee cost sharing) by 2029.Estimate that 50 bps improvement 5 p p
in rate of return delays trigger by 3-5 years; 100 bps improvement
likely avoids trigger altogether
19Note: Rough initial valuation based on Segal valuation as of July, 1, 2012 uses 30 years and 6% discount rate; additional analysis requiredSource: Segal projection of General Employees plan and rough estimate of Fire and Police plans

AGENDA
I t d ti & G l f th W t & Effi i Introductions & Goals of the Waste & Efficiency Commission
Snapshot of the City’s Current State
Discussion: Initial Ideas
Next Steps
20

Collectively, the Mayor has formed this Commission to find ways to address these challengesfind ways to address these challenges
Over the next 3 months, the Commission on Waste & Efficiency will be tasked with recommending a series of opportunities that will be tasked with recommending a series of opportunities that have the potential to: Provide the City with necessary funds to support investment in the
infrastructure backlog and ongoing operating & maintenance expenditures along infrastructure backlog and ongoing operating & maintenance expenditures along with core operations
Create excellence in City operations and position Atlanta as a best-in-class City for operational effectiveness
NS
h ve I
id e II
Longer-Term
Put City on a trajectory for long-term fiscal stability
UIC
K W
IN Short-term
One-time revenue b
Wav Mid-Term
Recurring savings h d
Wav
e Longer Term
Larger recurring savings that may
QU boost/
cost reductionthat do not require upfront investment
savings that may require upfront investment
21

We are asking all Committee members to spend the next 3 weeks collecting ideas for the Commission to consider3 weeks collecting ideas for the Commission to consider
GUIDING PRINCIPLES Questions to Consider
Think big and bold; nothing is off the table
GUIDING PRINCIPLES
How will the recommendation:
I th ffi i f Cit
Questions to Consider
off the table
Generate as many options as possible
F d i i h
Improve the efficiency of City operations?
Generate savings or revenue for the Ci i h h di d l Frame recommendations with a
focus on impact
Maintain focus on public impact
City in the short, medium and long-term?
Be sustained?of recommendations
Ensure mix of short, medium and long-term opportunities
Impact public services and citizens?
Impact City staff?
Enhance the City of Atlanta?
The Blue Ribbon Panel will serve in an advisory capacity, making
Enhance the City of Atlanta?
22
recommendations to the Mayor that will ensure the appropriate mix of short and long-term efficiency opportunities

In addition to Commission ideas, we will be soliciting input from the publicinput from the public
[email protected] inbox is [email protected] inbox is live and accepting ideas from the public, staff members and Commission membersTh i b ill b it d b th M ’ Offi d The inbox will be monitored by the Mayor’s Office and ideas will be collected and shared with the Commission
The City will also be hosting a public hearing to collect ideas from the public
23

AGENDA
I t d ti & G l f th W t & Effi i Introductions & Goals of the Waste & Efficiency Commission
Snapshot of the City’s Current State
Discussion: Initial Ideas
Next Steps
24

Next steps
Review City of Atlanta Fiscal Fact Book to identify potential areas of opportunity
Discuss Commission charge with stakeholders and gather ideas
Submit ideas via [email protected]
S d i ill b h d l d f W k f A il t Second meeting will be scheduled for Week of April 21st : City staff will follow-up with date, time, logistics
25
Appendix
26

Implementation & Referendum Timeline
JULY 2014City assesses Commission
d i l Realize benefits
f “ i k i ”recommendations; releases Efficiency Plan laying out timeline and implementation roadmap
AUGUST 2014L h i k i
from “quick wins”
Launch Wave I initiatives
FALL 2015
FY17: Realize “run rate” benefits from implemented
Q1/Q2 2015 Q1/Q2 2016 Q1/Q2 2017Q2 2014
Launch quick win program (FY15 budget)
Issue Bond recommendations
Q3/Q4 2014 Q3/Q4 2015 Q3/Q4 2016
MAY 2014 MARCH 2015
Bond Referendum
Wave I Initiatives Submitted in FY16
Wave I Initiatives Implemented; initial savings realized
Incorporate Wave II
Bond announced
JUNE 2014Commisionrecommendations
Budget Plan Initiatives in FY17 Budget
submitted to Mayor
JUNE 2014CoA FY15 Budget Established
27
Community outreach and engagement for the Infrastructure Bond will take place in a separate, parallel effort

INFRASTRUCTURE BACKLOG
28

Deferred capital projects and infrastructure investments exceed $1B todayexceed $1B today
BACKLOG* CONSISTS PRIMARILY OF DEFERRED INFRASTRUCTURE
BACKLOG FOR PUBLIC WORKS GROWS EXPONENTIALLY
PRELIMINARY
$3.2B deficit in 2027 if City does not address backlog or
DEFERRED INFRASTRUCTURE GROWS EXPONENTIALLY
does not address backlog or annual maintenance need
The CoA must address the infrastructure backlog before the need exceeds f
29
reasonable funding capacity*$922M in public right of way infrastructure may be reduced by ~30K due to recent investment in bridgesSource: FY13 City of Atlanta Adopted Budget; City of Atlanta Departments; 2010 State of the City’s Transportation Infrastructure & Fleet Inventory Report; 2012 Bain Infrastructure Report

Right-of-way has a backlog of ~$922M* as of 2010
PRELIMINARY
30
* $922M in public right of way infrastructure may be reduced by ~30K due to recent investment in bridgesSource: 2010 State of the City’s Transportation Infrastructure & Fleet Inventory Report; Bain analysis
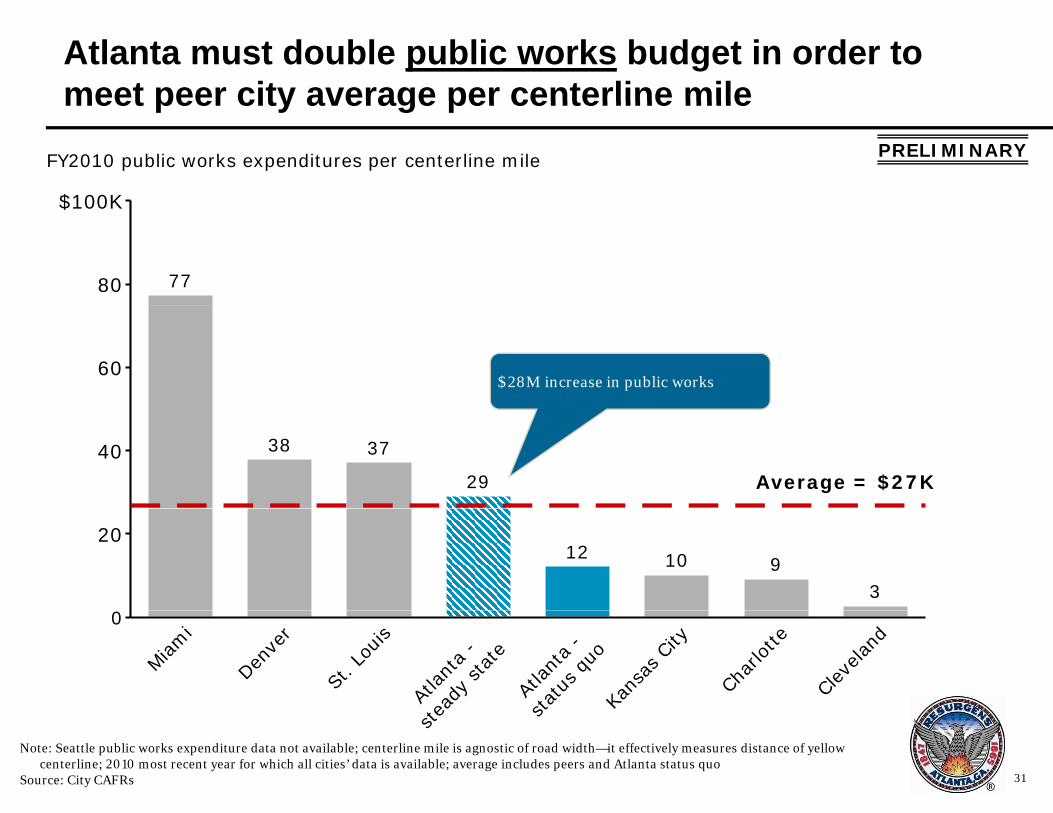
Atlanta must double public works budget in order to meet peer city average per centerline mile
$100K
FY2010 public works expenditures per centerline mile
meet peer city average per centerline milePRELIMINARY
80
$100K
77
60$28M increase in public works
40 38 37
29 Average = $27K
2012 10 9
30
Miam
i
Denver
St.Lo
uis
Atlanta
-
teady
state
Atlanta
-
statu
squo
Kansas
City
Charlotte
Clevela
nd
31
ste s
Note: Seattle public works expenditure data not available; centerline mile is agnostic of road width—it effectively measures distance of yellow centerline; 2010 most recent year for which all cities’ data is available; average includes peers and Atlanta status quo
Source: City CAFRs
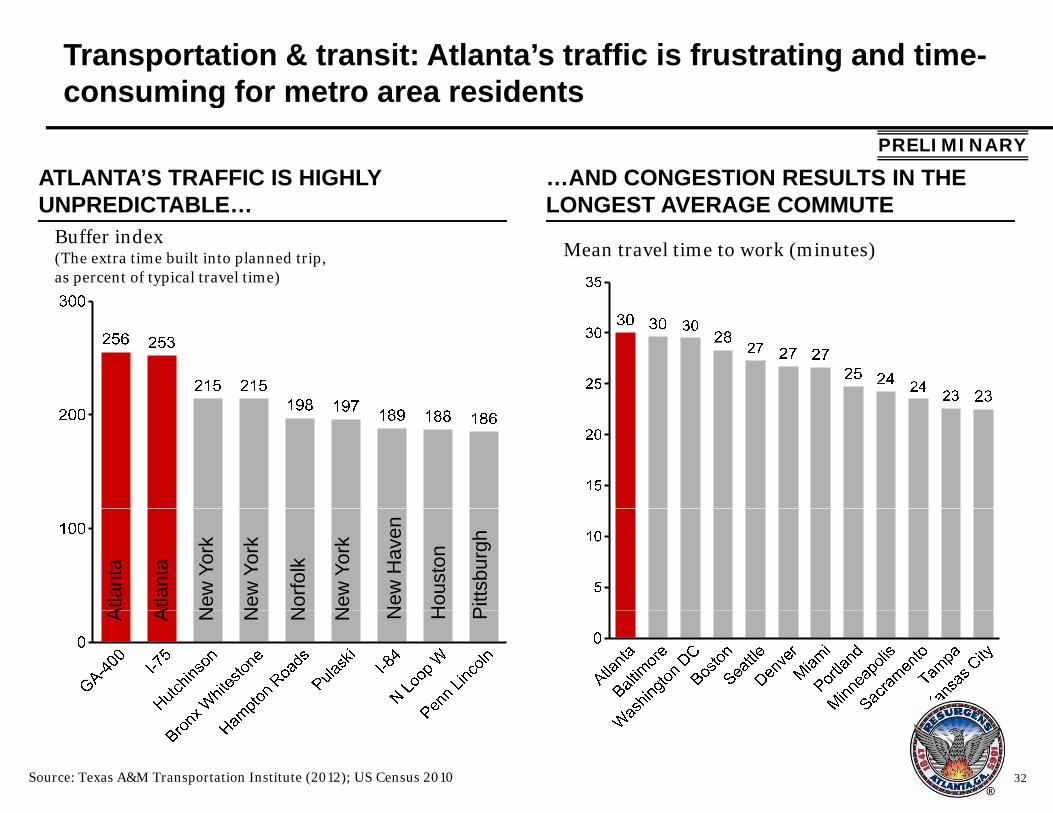
Transportation & transit: Atlanta’s traffic is frustrating and time-consuming for metro area residentsconsuming for metro area residents
ATLANTA’S TRAFFIC IS HIGHLY UNPREDICTABLE
…AND CONGESTION RESULTS IN THE LONGEST AVERAGE COMMUTE
PRELIMINARY
Buffer index(The extra time built into planned trip,as percent of typical travel time)
Mean travel time to work (minutes)
UNPREDICTABLE… LONGEST AVERAGE COMMUTE
Atla
nta
Atla
nta
New
Yor
k
New
Yor
k
Nor
folk
New
Yor
k
New
Hav
en
Hou
ston
Pitt
sbur
gh
A A N N N N N H P
32Source: Texas A&M Transportation Institute (2012); US Census 2010

REVENUES AND EXPENSES
33

Atlanta’s State and local tax burden is slightly higher than averagethan average
PRELIMINARY
34
Note: Excludes Cincinnati, Cleveland, Miami, Pittsburgh, Sacramento, St. Louis, and Tampa due to lack of comparable data; sales tax based on information from 2010 Consumer Expenditure Survey; property tax based on estimated home values at the $50,000 income level
Source: Bureau of Labor Statistics, U.S. Census, “Tax Rates and Tax Burdens in the District of Columbia—A Nationwide Comparison”

Atlanta’s recovery from the recession is close to peer city averageaverage
EMPLOYMENT RATE OUTPUT (GDP)
PRELIMINARY
Growth in employment rate since recession peak
EMPLOYMENT RATE OUTPUT (GDP)
Growth in GDP since recession trough
35Source: Brookings Institution

City of Atlanta is a net exporter to State of Georgia and receives far less state support than peersfar less state support than peers
COA receives only ~70¢for each d ll it t ib t t t t
Atlanta receives far less state support th
PRELIMINARY
dollar it contributes to state than peers
36
Note: *Methodology based on research by Andrew Young School of Policy Studies at Georgia State University, Atlanta based on Fulton County due to data availability; **FY2010 most recent year for which all peer data is available
Source: Fiscal Research Center for Georgia State University, Governor’s Adopted FY2013 Budget Report, GA Dept. of Revenue, GA Dept. of Transportation, Bureau of Economic Analysis, GA Dept. of Education, city CAFRs

Revenues in peer cities have grown in line with or above regional inflationregional inflation
DENVER MINNEAPOLIS
CAGR (’02-’12)
1.8%0.5%
CAGR (’02-’12)
3.0%3.0%
0.4%3.0%1.6%
37
Note: GDP represents metro region for Denver and Minneapolis. Inflation adjusted using CPI-U for Denver and Minneapolis metro regions.Source: Bureau of Economic Analysis, Bureau of Labor Statistics, City CAFRs

Employee healthcare costs are growing rapidly
$16 000 $140 000 000 Total medical and dental
PRELIMINARY
$14,000
$16,000
$120,000,000
$140,000,000 Total medical and dental expenses faced by the City and City employees have grown by 3.4% a year in recent years.
$10,000
$12,000
$80,000,000
$100,000,000 This is a $22M increase
between 2008 ($101M) and 2014 ($123.5M).
The total cost per employee
$6,000
$8,000
$60,000,000
The total cost per employee has grown even more quickly, rising from $10,500 in 2008 to $14,600 in 2014.
$2,000
$4,000
$20,000,000
$40,000,000 The pace of growth in medical and dental expenses is much faster than City revenues or employee earnings can continue to sustain
$-$0
2008 2009 2010 2011 2012 2013 2014
Annual Total Medical/Dental Expense Expense per Employee
continue to sustain.
38
Annual Total Medical/Dental Expense Expense per Employee