Embed Size (px)
Citation preview

LABORATORY MANUAL
PROGRAMME: B.Tech
SEMESTER /YEAR:VII / IV
SUBJECT CODE:BMO413
SUBJECT NAME: Virtual Instrumentation Lab
Prepared By: Prepared By:
Name:T.Rajalakshmi Name:P.Vinupritha
Designation:AP(OG) Designation:AP(OG)
DEPARTMENT OF BIOMEDICAL ENGINEERING SCHOOL OF BIOENGINEERING,
FACULTY OF ENGINEERING & TECHNOLOGY
SRM UNIVERSITY (UNDER SECTION 3 of UGC ACT 1956) KATTANKULATHUR-603203
Tamil Nadu, India

List of Experiments
1. BASIC ARITHMETIC OPERATIONS
2. BOOLEAN OPERATIONS
3. SUM OF ‘n’ NUMBERS USING ‘FOR’ LOOP
4. FACTORIAL OF A GIVE NUMBER USING FOR LOOP
5. SUM OF ‘n’ NATURAL NUMBERS USING WHILE LOOP
6. FACTORIAL OF A GIVE NUMBER USING WHILE LOOP
7. SORTING EVEN NUMBERS USING WHILE LOOP IN AN ARRAY
8. ARRAY MAXIMUM AND MINIMUM
9. BUNDLE AND UNBUNDLE CLUSTER
10. FLAT AND STACKED SEQUENCE
11. APPLICATION USING FORMULA NODE
12. MEDIAN FILTER
13. DISCRETE COSINE TRANSFORM
14. CONVOLUTION OF TWO SIGNALS
15. WINDOWING TECHNIQUE
16. INSTRUMENTATION OF AN AMPLIFIER TO ACQUIRE AN ECG SIGNAL
17. ACQUIRE, ANALYSE AND PRESENT AN EEG USING VIRTUAL INSTRUMENTATION

Exp No: 1
BASIC ARITHMETIC OPERATIONS
Aim: To perform basic arithmetic operations using Labview.
Algorithm:
Step 1: Start the Lab view and select the blank VI.
Step 2: Create front and block diagram panel.
Step 3: Numeric controls are given as inputs and numeric indicators are given as output they are selected by right clicking on the front panel.
Step 4: Different arithmetic operators such as addition, subtraction, multiplication and division are generated in block diagram panel.
Step 5: Using wiring operation inputs and outputs are connected to the respective operators in the block diagram panel.
Step 6: Input values are given in the front panel and the program is executed. Hence the output is generated.

Block Diagram Panel:

Front Panel:
Input:
:
Output:
Result:
Thus the arithmetic operations were performed and the result is verified using lab view.

Exp No: 2
BOOLEAN OPERATIONS
Aim: To perform Boolean operations using Labview.
Algorithm:
Step 1: Start the Labview and select the blank VI.
Step 2: Create front and block diagram panel.
Step 3: To perform Boolean operation push buttons are taken as inputs and round LED as output.
Step 4: Different Boolean operations such as AND, OR, XOR, NOT, NAND are selected from the block diagram panel.
Step 5: Boolean inputs and outputs are wired in the block diagram panel.
Step 6: Logic values 0 & 1 are given in the front panel and the program is executed.

Block diagram:

Front Panel:
Input:
Output:

Truth Table:
AND:
X1 X2 Y
0
0
1
1
0
1
0
1
0
0
0
1
OR:
X1 X2 Y
0
0
1
1
0
1
0
1
0
1
1
1

XOR:
X1 X2 Y
0
0
1
1
0
1
0
1
0
1
1
0
NAND:
X1 X2 Y
0
0
1
1
0
1
0
1
1
1
1
0
NOT:
X Y
0
1
1
0
RESULT: Thus the Boolean operation using LAB view is performed.

Exp No: 3
SUM OF ‘n’ NUMBERS USING ‘FOR’ LOOP
Aim: To find the sum of ‘n’ numbers using FOR loop.
Algorithm:
Step 1: Create blank VI.
Step 2: Right click on the block diagram panel, select program , go to structures and select a FOR loop.
Step 3: Right click on the border of the FOR loop and select add shift register, borders are converted into shift register.
Step 4: Using wiring operations required connections are given in the block diagram.
Step 5: Inputs are given in the front panel and the program is executed.

Block diagram:

Front Panel:
Input:
Output:
Result: Thus the sum of ‘n’ natural numbers using FOR loop is performed in LABview.

Exp No: 4
FACTORIAL OF A GIVE NUMBER USING FOR LOOP
Aim: To perform the factorial of a given number using FOR loop.
Algorithm:
Step 1: Create blank VI.
Step 2: Right click on the block diagram panel , select program , go to structures and select a FOR loop.
Step 3: Right click on the border of the FOR loop and select add shift register, borders are converted into shift register.
Step 4: Using wiring operations required connections are given in the block diagram.
Step 5: Inputs are given in the front panel and the program is executed.

Block diagram panel:
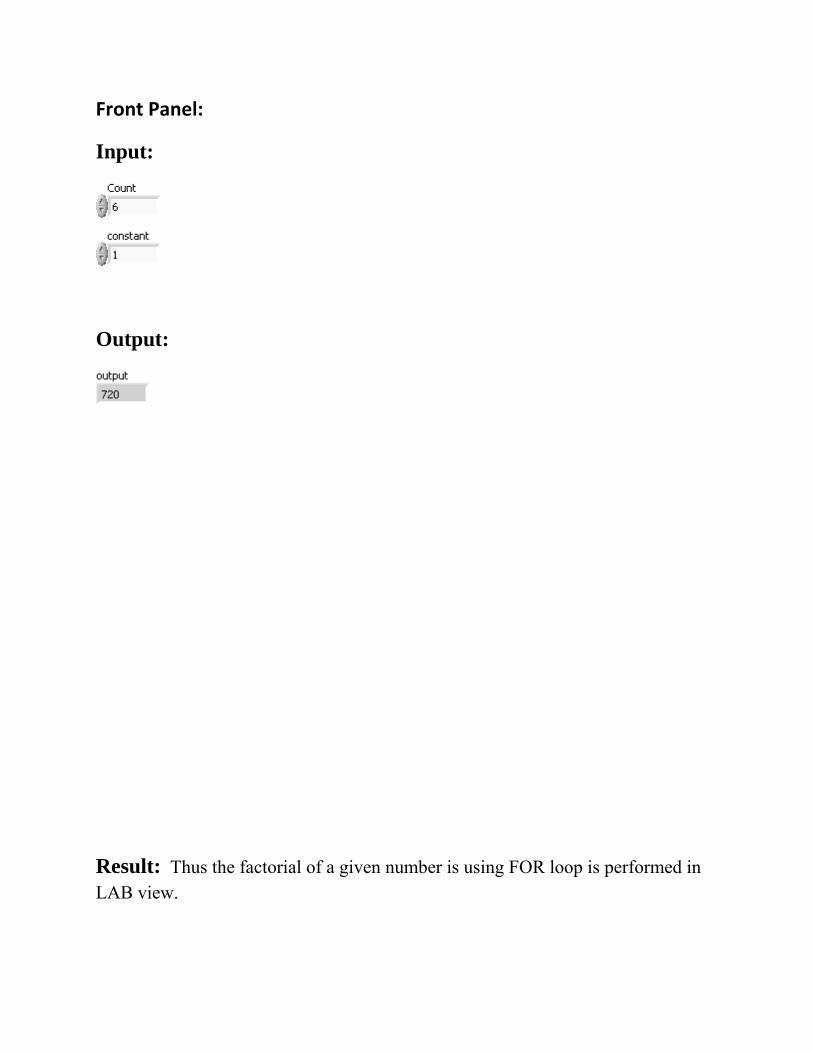
Front Panel:
Input:
Output:
Result: Thus the factorial of a given number is using FOR loop is performed in LAB view.

Exp No:5
SUM OF ‘n’ NATURAL NUMBERS USING WHILE LOOP
Aim: To find the sum of n natural numbers using while loop.
Algorithm:
Step 1: Create blank VI.
Step 2: Right click on the block diagram panel , select program , go to structures and select a WHILE loop.
Step 3: The tunnels of the border are converted to shift register.
Step 4: Generate an adder and greater than equal to inside the WHILE loop .
Step 5: Using wiring operation required wiring is done in the block diagram panel.
Step 6: Input values are given in front panel and the output is generated.

Block diagram panel:

FRONT PANEL:
Input:
Output:
Result: Thus the sum of n natural numbers using WHILE loop is performed.
Exp No:6
FACTORIAL OF A GIVE NUMBER USING WHILE
LOOP
Aim: To perform the factorial of a given number using WHILE loop.
Algorithm:
Step 1: Create blank VI.
Step 2: Right click on the block diagram panel , select program , go to structures and select a WHILE loop.
Step 3: Right click on the border of the WHILE loop and select add shift register, borders are converted into shift register.
Step 4: Using wiring operations required connections are given in the block diagram.
Step 5: Inputs are given in the front panel and the program is executed.

Block diagram panel:

Front Panel:
Input:
Output:
Result: Thus the factorial of the given number using WHILE loop is performed.

Exp No:7
SORTING EVEN NUMBERS USING WHILE LOOP IN AN ARRAY
Aim: To sort even numbers using WHILE loop in an array.
Algorithm:
Step 1: Create blank VI.
Step 2: Right click on the block diagram panel , select program , go to structures and select a WHILE loop.
Step 3: Create an array in the front panel and add numeric indicator to it.
Step 4: Add the numeric control in the front panel.
Step 5: Using wiring operations required connections are given in the block diagram.
Step 6: Inputs are given in the front panel and the program is executed.

Block diagram panel:

FRONT PANEL:
Result: Thus the even numbers from the given set of numbers is sorted using WHILE loop in an array.

Exp No:8
ARRAY MAXIMUM AND MINIMUM
Aim: To find the maximum and minimum variable from an array.
Algorithm:
Step 1: Create blank VI.
Step 2: Right click on the front panel →modern →array→ array matrix→ numeric control.
Step 3: Create four numeric indicators in the front panel for maximum variable, index, minimum variable and index.
Step 4: Using wiring operations required connections are given in the block diagram.
Step 5: Inputs are given in the front panel and the program is executed.

Block diagram panel:

Front Panel:
Input:
Output:
Result: Hence the maximum and minimum values of array were displayed using LabVIEW.

Exp No:9
BUNDLE AND UNBUNDLE CLUSTER
Aim: To bundle and unbundle a cluster.
Algorithm:
For Bundling cluster:
Step 1: Create blank VI.
Step 2: Select numeric control, string control for inputs.
Step 3: Select bundle operation from a cluster.
Step 4: Create a new cluster add numeric indicator , string indicator and round LED.
Step 5: Using wiring operations required connections are given in the block diagram.
Step 6: Inputs are given in the front panel and the program is executed.
For unbundling cluster:
Step 1: Create a new VI.
Step 2: Create a cluster with numeric control, string and round LED.
Step 3: Create numeric indicator , Boolean indictor and string indicator.
Step 4: Using wiring operations required connections are given in the block diagram.
Step 5: Inputs are given in the front panel and the program is executed.

Block diagram panel:

Front Panel:
Bundle cluster:
Input:

Un bundle cluster:
Input:
Output:
Result: Hence a cluster is bundled and unbundled using LabVIEW.

Exp No: 10
FLAT AND STACKED SEQUENCE
Aim: To perform functions using flat and stacked sequence.
Algorithm:
Step 1: Create blank VI.
Step 2: Create flat and stacked sequence.
Step 3: Right click on the boundary and add sequence local connect adder with the boundary.
Step 4: Using wiring operations required connections are given in the block diagram.
Step 5: Inputs are given in the front panel and the program is executed.

Block diagram panel:
Flat sequence:
Stacked sequence:
(i)

(ii)
(iii)

Front Panel:
Flat sequence:
Result: Thus various functions using flat and stacked sequence using LabVIEW was performed.

Exp No: 11
APPLICATION USING FORMULA NODE
Aim: To create a sine wave using formula node.
Algorithm:
Step 1: Create blank VI.
Step 2: Create formula node, waveform chart and waveform graph in the front panel.
Step 3: Connections are given as per the circuit diagram with necessary wirings.
Step 4: Inputs are given in the front panel and the program is executed.

Block Diagram Panel:

FRONT PANEL:
Result: Thus a sine waveform is generated using formula node.

Exp No:12
MEDIAN FILTER
Aim: To apply filtering technique for a given input signal.
Algorithm:
Step 1: Create a blank VI.
Step 2: In the block diagram panel go to signal processing and create a noise signal.
Step 3: Select any one input signal.
Step 4: Create median filter from signal processing block.
Step 5: Using wiring operations required connections are given in the block diagram.
Step 6: Inputs are given in the front panel and the program is executed.

Block diagram panel:
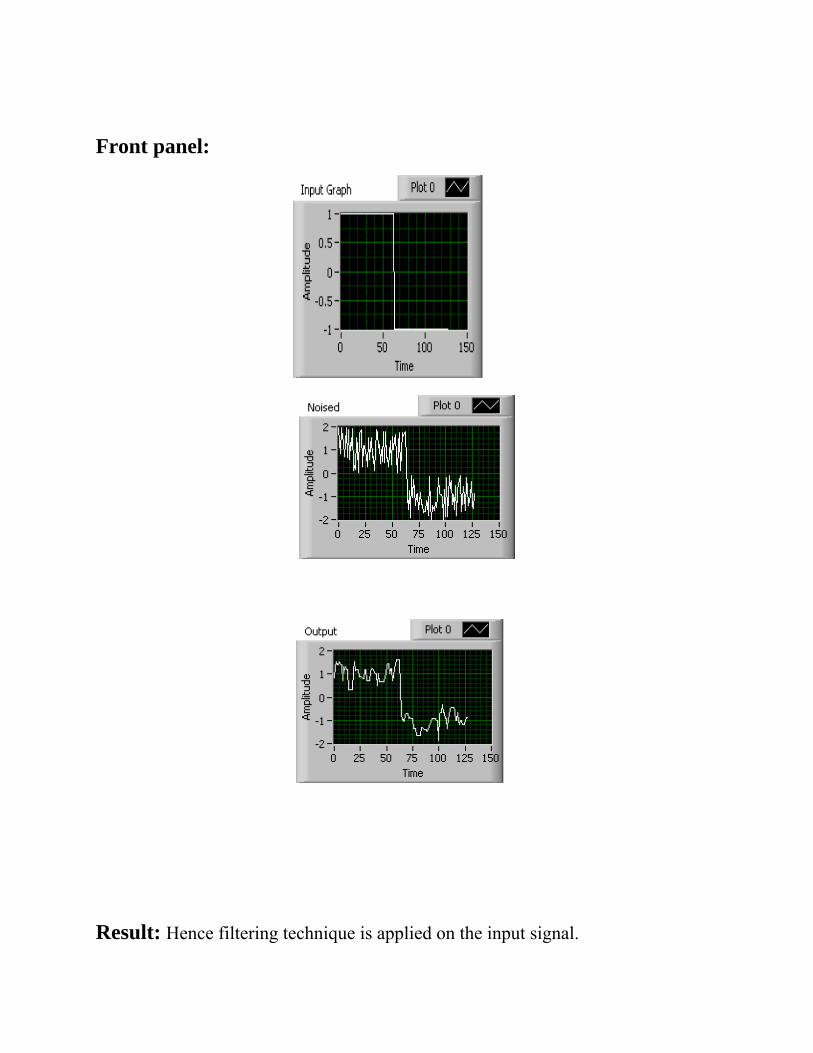
Front panel:
Result: Hence filtering technique is applied on the input signal.

Exp No:13
DISCRETE COSINE TRANSFORM
Aim: To perform discrete cosine transform on the given signal
Algorithm:
Step 1: Create a blank VI
Step 2: Generate a waveform from the signal processing block.
Step 3: Create a discrete cosine transform and waveform graph in the front panel.
Step 4: Using wiring operations required connections are given in the block diagram.
Step 5: Inputs are given in the front panel and the program is executed.

Block diagram panel:

Front panel:
Result: Hence discrete cosine transform was performed on the given input signal.

Exp No:14
CONVOLUTION OF TWO SIGNALS
Aim: To perform convolution of two signals.
Algorithm:
Step 1: Create a blank VI.
Step 2: Create two inputs and waveform graph.
Step 3: Apply FFT for the two inputs and give it to multiplier.
Step 4: In the receiver end IFFT is performed and the convolved output is displayed in the waveform graph.

Block Diagram panel:

Front panel:

Result: Hence two signals were convolved and the result is verified using LabVIEW.

Exp No:15
WINDOWING TECHNIQUE
Aim: To apply different windowing technique on the give input signal
Algorithm:
Step 1: Create a blank VI.
Step 2: Create hanning, hamming, Blackman, cheby shev window on the block diagram panel.
Step 3: Generate a input waveform and create extract single tone for all the windows.
Step 4: Using wiring operations required connections are given in the block diagram.
Step 5: Inputs are given in the front panel and the program is executed.

Block diagram panel:

Front panel:
Result:
Hence the characteristics of various windows are performed using LabVIEW.

Exp No:16
INSTRUMENTATION OF AN AMPLIFIER TO ACQUIRE AN ECG SIGNAL
Aim: To acquire and analyze an ECG signal using NI ELVIS Lab VIEW.
Algorithm:
Procedure Without Express: 1. Construct the basic block diagram for acquiring a signal without using express.
2. For acquiring ECG Signal: * From the front panel, set the number of samples to read as 3000 and the sampling rate as 1000.From the physical channel drop down menu select device and the channel no. (DEVICE 1 / AI0 CHANNEL).

* Set the Voltage Maximum and Minimum to -5/5 V * Save the program (CTRL + S). From the Front panel tool bar menu select * Operate →Run (or press CTRL + R) to execute the program. Raw ECG Signal Output:
3. Taking FFT for raw ECG: Right click on the block diagram. From the menu appearing select Signal Processing�Wfm Measure�FFT Spectrum magnitude and phase. Place the FFT block in the block diagram. 4. Connect the data in the DAQmx read terminal to Time signal terminal of the FFT block.

5. Configuring FFT block: Keep the cursor over Window. Right click on it. A menu will pop up. Select Create → control.
6. Similarly create a control for view.
7. Displaying the FFT magnitude: In the front panel do right click. Select Graph�Waveform Graph. Place the Waveform Graph in the front panel.

8. Connect the FFT magnitude terminal of the FFT block to the waveform Graph in the block diagram. 9. While running the application select ‗db On (F)‟ in the view palette in the front panel. Select Hanning window using the control in the front panel. Final Block Diagram:
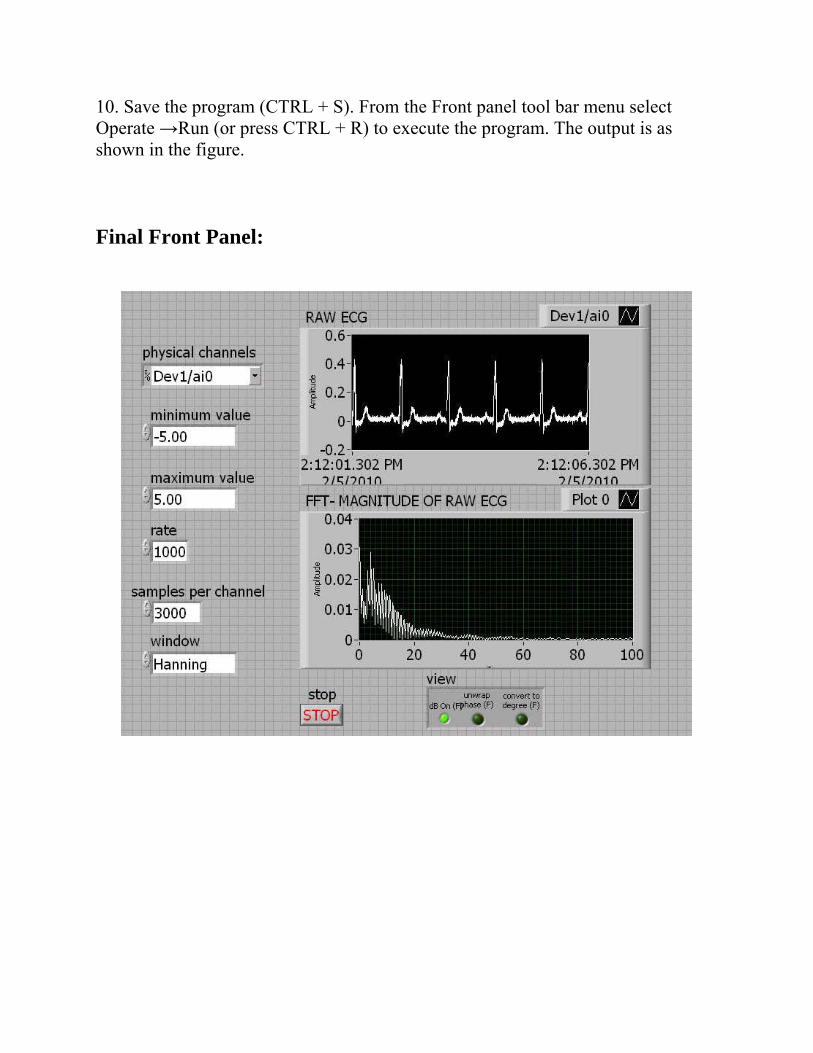
10. Save the program (CTRL + S). From the Front panel tool bar menu select Operate →Run (or press CTRL + R) to execute the program. The output is as shown in the figure. Final Front Panel:

Final Block Diagram:
Final Front Panel:
Result: Thus the raw ECG signal (0-40Hz) was acquired and its FFT was obtained. Power line interference occurred at 50Hz.

Exp No:17
ACQUIRE, ANALYSE AND PRESENT AN EEG
USING VIRTUAL INSTRUMENTATION Aim: To acquire, analyze and present an EEG using Virtual instrumentation. Algorithm:
1. To acquire EEG Signal:
• From the front panel, set the number of samples to read as 2000 and the sampling rate as 1000. • From the physical channel drop down menu select device and the channel no.
(DEVICE 1 / AI0 CHANNEL). • Set the Voltage Maximum and Minimum to -5/5 V.
2. Taking FFT for raw EEG:
• Right click on the block diagram. From the menu appearing select Signal Processing�Wfm Measure�FFT Spectrum magnitude and phase. • Place the FFT block in the block diagram. • Connect the data in the DAQmx read terminal to time signal terminal of the
FFT block.

3. Configuring FFT block: • Keep the cursor over window. Right click on it. A menu will pop up. Select
create →control. 4. Similarly create a control for view.

5. Displaying the FFT magnitude: • In the front panel, right click. Select Graph�Waveform Graph. Place the Waveform Graph in the front panel. 6. While running the application select ‗db On (F)‘ in the view palette in the front panel.Select Hanning window using the control in the front panel. 7. Connect the Magnitude terminal of the FFT block to the Waveform Graph in the block diagram.
8. Right click on the block diagram. Select Signal Processing → Wfm Condition → Filter Configure the Filter as Follows:

9. Create a Graph Indicator for the filter output. 10. As before, take FFT for the output of the Lowpass filter. 11. Right click on the block diagram. Select Express →Signal Analysis →Filter. Place the filter block in the block diagram. Connect the Signal terminal of the Filter to ‟Filtered X‟ terminal of Lowpass Filter. 12. Configuring the filter: When the filter block is placed in the Block Diagram panel, a dialog box appears.

Select the following options: a) Set Filtering Type as Smoothing. b) Filter Specifications: Moving Average →Triangular. c) Set Half-width of moving average as 10. d) Click Ok.
13. As before, take the FFT of the output of the Smoothing filter. 14. Right-click in the Block Diagram panel, select Signal Processing → Signal Operation → Autocorrelation.vi

15. Connect the output of the Lowpass filter to the Autocorrelation block. Take the FFT of the Autocorrelation output. Create a waveform graph to view the same. 16. Similarly, create another Autocorrelation block and connect the output of the Smoothing filter to it. Take the FFT of the autocorrelation output. Create a waveform graph to view the same. 17. Right-click in the Block Diagram panel, select Signal Processing → Wfm Measure →Spectral Measurements
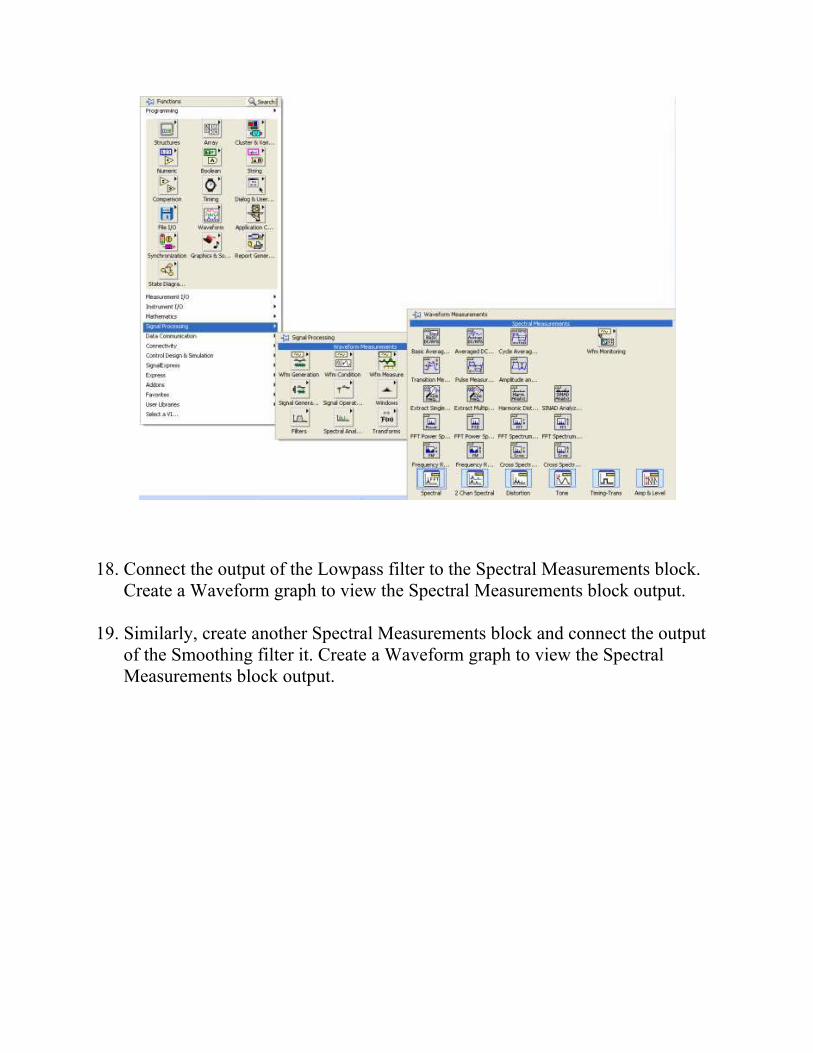
18. Connect the output of the Lowpass filter to the Spectral Measurements block. Create a Waveform graph to view the Spectral Measurements block output. 19. Similarly, create another Spectral Measurements block and connect the output of the Smoothing filter it. Create a Waveform graph to view the Spectral Measurements block output.

Final Block Diagram:

FINAL FRONT PANEL:

Result: Hence an EEG signal is acquired, analyzed and presented using Virtual instrumentation.