Embed Size (px)
Citation preview
[email protected] • MTH15_Lec-12_sec_3-1_Rel_Extrema_.pptx1
Bruce Mayer, PE Chabot College Mathematics
Bruce Mayer, PELicensed Electrical & Mechanical Engineer
Chabot Mathematics
§3.1 RelativeExtrema
[email protected] • MTH15_Lec-12_sec_3-1_Rel_Extrema_.pptx2
Bruce Mayer, PE Chabot College Mathematics
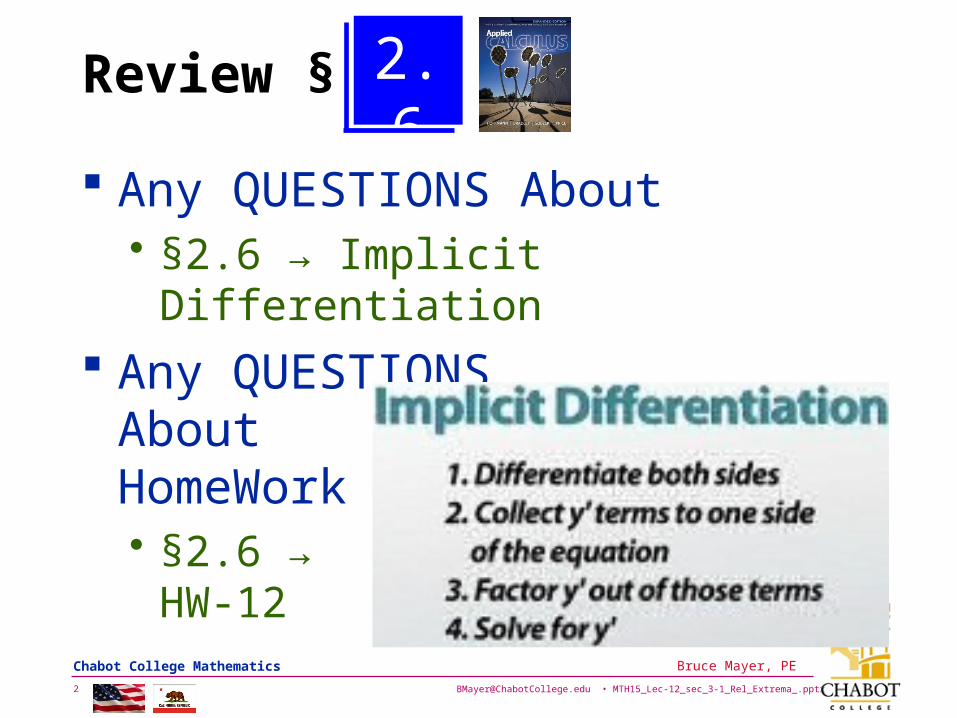
Review §
Any QUESTIONS About• §2.6 → Implicit Differentiation
Any QUESTIONS About HomeWork• §2.6 →
HW-12
2.6

[email protected] • MTH15_Lec-12_sec_3-1_Rel_Extrema_.pptx3
Bruce Mayer, PE Chabot College Mathematics
§3.1 Learning Goals
Discuss increasing and decreasing functions
Define critical points and relative extrema
Use the first derivative test to study relative extrema and sketch graphs

[email protected] • MTH15_Lec-12_sec_3-1_Rel_Extrema_.pptx4
Bruce Mayer, PE Chabot College Mathematics
Increasing & Decreasing Values
A function f is INcreasing if whenever a<b, then:
• INcreasing is Moving UP from Left→Right
A function f is DEcreasing if whenever a<b, then:
• DEcreasing is Moving DOWN from Left→Right
)()( bfaf

[email protected] • MTH15_Lec-12_sec_3-1_Rel_Extrema_.pptx5
Bruce Mayer, PE Chabot College Mathematics
Inc & Dec Values Graphically
0 1 2 3 4 5 6 7 8 9 10-4
-3
-2
-1
0
1
2
3
4
5
6
7
x
y =
f(x)
MTH15 • Bruce Mayer, PE
XYf cnGraph6x6BlueGreenBkGndTemplate1306.m
INcreasing
DEcreasing

[email protected] • MTH15_Lec-12_sec_3-1_Rel_Extrema_.pptx6
Bruce Mayer, PE Chabot College Mathematics
Inc & Dec with Derivative
If for every c on the interval [a,b]• That is, the Slope is POSITIVE
Then f is INcreasing on [a,b]
If for every c on the interval [a,b]• That is, the Slope is NEGATIVE
Then f is DEcreasing on [a,b]
0)(' cxdx
dfcf
0)(' cxdx
dfcf

[email protected] • MTH15_Lec-12_sec_3-1_Rel_Extrema_.pptx7
Bruce Mayer, PE Chabot College Mathematics
Example Inc & Dec
The function, y = f(x),is decreasing on [−2,3] and increasing on [3,8]
43 2 xxfy

[email protected] • MTH15_Lec-12_sec_3-1_Rel_Extrema_.pptx8
Bruce Mayer, PE Chabot College Mathematics
Example Inc & Dec Profit
The default list price of a small bookstore’s paperbacks Follows this Formula• Where
– x ≡ The Estimated Sales Volume in No. Books– p ≡ The Book Selling-Price in $/book
The bookstore buys paperbacks for $1 each, and has daily overhead of $50
[email protected] • MTH15_Lec-12_sec_3-1_Rel_Extrema_.pptx9
Bruce Mayer, PE Chabot College Mathematics
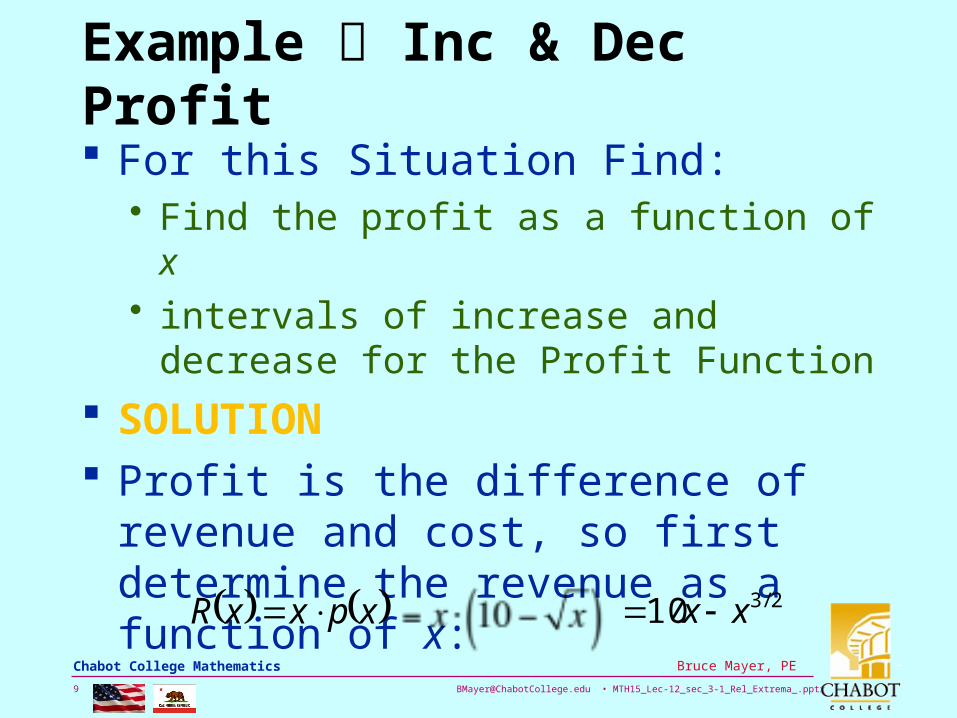
Example Inc & Dec Profit
For this Situation Find:• Find the profit as a function of x • intervals of increase and decrease for the
Profit Function
SOLUTION Profit is the difference of revenue and
cost, so first determine the revenue as a function of x:
xpxxR 2/310 xx

[email protected] • MTH15_Lec-12_sec_3-1_Rel_Extrema_.pptx10
Bruce Mayer, PE Chabot College Mathematics
Example Inc & Dec Profit
And now cost as a function of x:
Then the Profit is the Revenue minus the Costs:
cost fixedcost variable xC 501 x
xCxRxP

[email protected] • MTH15_Lec-12_sec_3-1_Rel_Extrema_.pptx11
Bruce Mayer, PE Chabot College Mathematics
Example Inc & Dec Profit
Now we turn to determining the intervals of increase and decrease.
The graph of the profit function is shown next on the interval [0,100] (where the price and quantity demanded are both non-negative).
[email protected] • MTH15_Lec-12_sec_3-1_Rel_Extrema_.pptx12
Bruce Mayer, PE Chabot College Mathematics
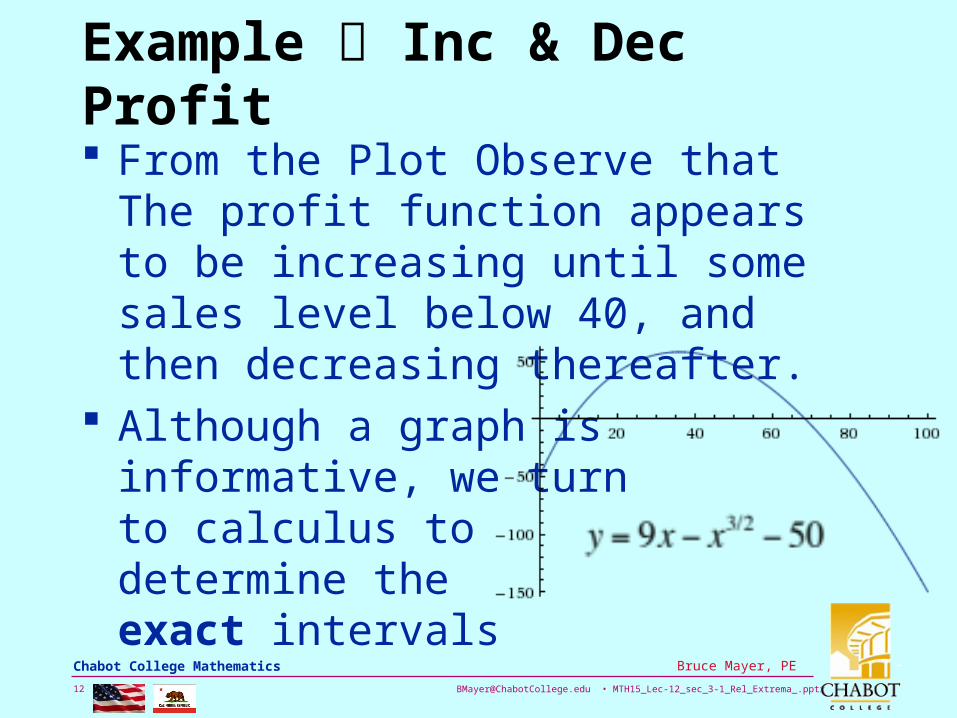
Example Inc & Dec Profit
From the Plot Observe that The profit function appears to be increasing until some sales level below 40, and then decreasing thereafter.
Although a graph is informative, we turn to calculus to determine the exact intervals

[email protected] • MTH15_Lec-12_sec_3-1_Rel_Extrema_.pptx13
Bruce Mayer, PE Chabot College Mathematics
Example Inc & Dec Profit
We know that if the derivative of a function is POSITIVE on an open interval, the function is INCREASING on that interval. Similarly, if the derivative is negative, the function is decreasing
So first compute thederivative, or Slope,function:
509' 2/3 xxdx
dxP
2/1
2
39 x
[email protected] • MTH15_Lec-12_sec_3-1_Rel_Extrema_.pptx14
Bruce Mayer, PE Chabot College Mathematics
Example Inc & Dec Profit
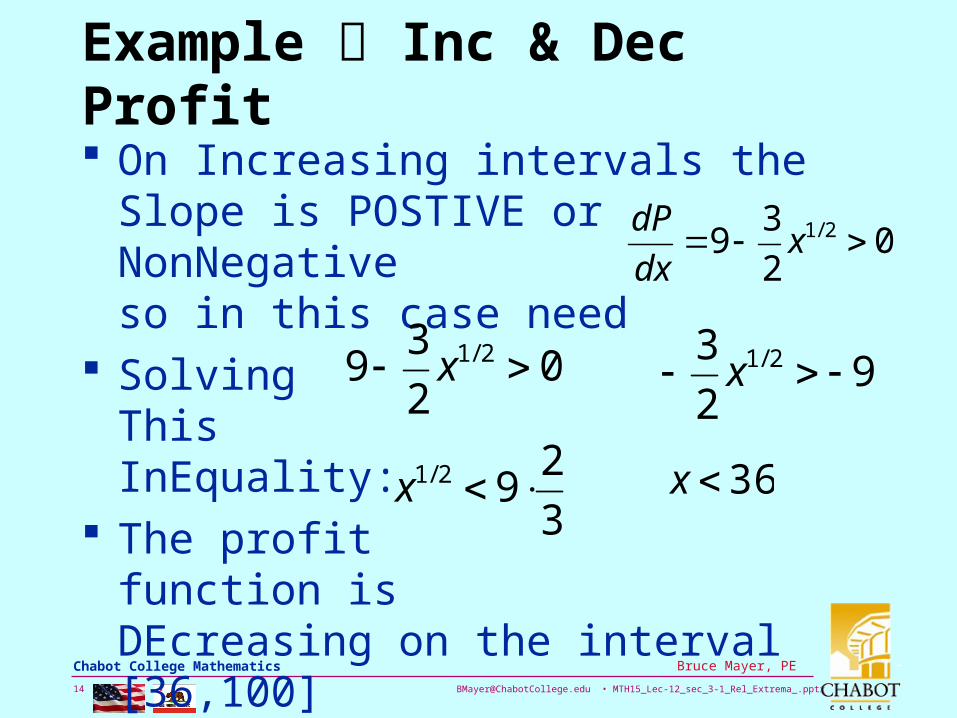
On Increasing intervals the Slope is POSTIVE or NonNegative so in this case need
SolvingThisInEquality:
The profit function is DEcreasing on the interval [36,100]
02
39 2/1 x
dx
dP
02
39 2/1 x
3
292/1 x 36x
92
3 2/1 x

[email protected] • MTH15_Lec-12_sec_3-1_Rel_Extrema_.pptx15
Bruce Mayer, PE Chabot College Mathematics
Relative Extrema (Max & Min)
A relative maximum of a function f is located at a value M such that f(x) ≤ f(M) for all values of x on an interval a<M<b
A relative minimum of a function f is located at a value m such that f(x) ≥ f(m) for all values of x on an interval a<m<b

[email protected] • MTH15_Lec-12_sec_3-1_Rel_Extrema_.pptx16
Bruce Mayer, PE Chabot College Mathematics
Peaks & Valleys
Extrema is precise math terminology for Both of• The TOP of a
Hill; that is, a PEAK
• The Bottom of a Trough, That is a VALLEY
0 10 20 30 40 50-3
-2
-1
0
1
2
3
4
x
y =
f(x)
MTH15 • Bruce Mayer, PE
PEAKPEAK
VALLEY
VALLEY

[email protected] • MTH15_Lec-12_sec_3-1_Rel_Extrema_.pptx17
Bruce Mayer, PE Chabot College Mathematics
Rel&
Ab
s Max&
Min
0 10 20 30 40 50-3
-2
-1
0
1
2
3
4
x
y =
f(x)
MTH15 • Bruce Mayer, PE
RelativeMax
AbsoluteMax
RelativeMin
AbsoluteMin

[email protected] • MTH15_Lec-12_sec_3-1_Rel_Extrema_.pptx18
Bruce Mayer, PE Chabot College Mathematics
Critical Points
Let c be a value in the domain of f Then c is a Critical Point If, and only if
cxcx dx
df
dx
dfOR0
HORIZONTAL slopeat c
VERTICAL slopeat c

[email protected] • MTH15_Lec-12_sec_3-1_Rel_Extrema_.pptx19
Bruce Mayer, PE Chabot College Mathematics
Critical Points GeoMetrically Horizontal Vertical
0 0.5 1 1.5 2 2.5 30
2
4
6
8
10
12
14
16
18
20
x
y =
f(x)
MTH15 • Critical-Pt
0.05 0.1 0.15 0.2 0.250.6
0.7
0.8
0.9
1
1.1
1.2
1.3
x
y=f(
x)
MTH15 • Zero Critical-Pt
(0.1695, 1.2597)

[email protected] • MTH15_Lec-12_sec_3-1_Rel_Extrema_.pptx20
Bruce Mayer, PE Chabot College Mathematics
MA
TL
AB
Co
de
% Bruce Mayer, PE% MTH-15 • 07Jul13% XYfcnGraph6x6BlueGreenBkGndTemplate1306.m%clear; clc;% The Limitsxmin = 0; xmax = 0.27; ymin =0; ymax = 1.3;% The FUNCTIONx = linspace(xmin,xmax,1000); y1 = x.*(12-10*x-100*x.^2); %% The Max Condition[yHi,I] = max(y1); xHi = x(I);y2 = yHi*ones(1,length(x));% The ZERO Lineszxh = [xmin xmax]; zyh = [0 0]; zxv = [0 0]; zyv = [ymin ymax];%% the 6x6 Plotaxes; set(gca,'FontSize',12);whitebg([0.8 1 1]); % Chg Plot BackGround to Blue-Greenplot(x,y1, 'LineWidth', 5),axis([.05 xmax .6 ymax]),... grid, xlabel('\fontsize{14}x'), ylabel('\fontsize{14}y=f(x)'),... title(['\fontsize{16}MTH15 • Zero Critical-Pt',]),... annotation('textbox',[.15 .05 .0 .1], 'FitBoxToText', 'on', 'EdgeColor', 'none', 'String', ' ','FontSize',7)hold onplot(x,y2, '-- m', xHi,yHi, 'd r', 'MarkerSize', 10,'MarkerFaceColor', 'r', 'LineWidth', 2)set(gca,'XTick',[xmin:.05:xmax]); set(gca,'YTick',[ymin:.1:ymax])hold off

[email protected] • MTH15_Lec-12_sec_3-1_Rel_Extrema_.pptx21
Bruce Mayer, PE Chabot College Mathematics
MA
TL
AB
Co
de
% Bruce Mayer, PE% MTH-15 • 23Jun13% XYfcnGraph6x6BlueGreenBkGndTemplate1306.m% ref:%% The Limitsxmin = 0; xmax = 3; ymin = 0; ymax = 20;% The FUNCTIONx = linspace(xmin,1.99,1000); y = -1./(x-2);% % The ZERO Lineszxh = [xmin xmax]; zyh = [0 0]; zxv = [0 0]; zyv = [ymin ymax];%% the 6x6 Plotaxes; set(gca,'FontSize',12);whitebg([0.8 1 1]); % Chg Plot BackGround to Blue-Greenplot(x,y, 'LineWidth', 4),axis([xmin xmax ymin ymax]),... grid, xlabel('\fontsize{14}x'), ylabel('\fontsize{14}y = f(x)'),... title(['\fontsize{16}MTH15 • \infty Critical-Pt',]),... annotation('textbox',[.51 .05 .0 .1], 'FitBoxToText', 'on', 'EdgeColor', 'none', 'String', ' ','FontSize',7)hold onplot([2 2], [ymin,ymax], '--m', 'LineWidth', 3)set(gca,'XTick',[xmin:0.5:xmax]); set(gca,'YTick',[ymin:2:ymax])

[email protected] • MTH15_Lec-12_sec_3-1_Rel_Extrema_.pptx22
Bruce Mayer, PE Chabot College Mathematics
Example Critical Numbers
Find all critical numbers and classify them as a relative maximum, relative minimum, or neither for The Function:
2
24
xxxf
-10 -8 -6 -4 -2 0 2 4 6 8 10-40
-30
-20
-10
0
10
20
30
40
x
y =
f(x)
MTH15 • Bruce Mayer, PE
XYf cnGraph6x6BlueGreenBkGndTemplate1306.m

[email protected] • MTH15_Lec-12_sec_3-1_Rel_Extrema_.pptx23
Bruce Mayer, PE Chabot College Mathematics
Example Critical Numbers
SOLUTION Relative extrema can only take place at
critical points (but not necessarily all critical points end up being extrema!)
Thus we need to find the critical points of f. In other words, values of x so that
UnDefinedOR0 dx
df
dx
df
Think Division by Zero

[email protected] • MTH15_Lec-12_sec_3-1_Rel_Extrema_.pptx24
Bruce Mayer, PE Chabot College Mathematics
Example Critical Numbers
For theZeroCriticalPoint
Now need to consider critical points due to the derivative being undefined
22
242
4)('0
xx
dx
d
xx
dx
dxf
1x

[email protected] • MTH15_Lec-12_sec_3-1_Rel_Extrema_.pptx25
Bruce Mayer, PE Chabot College Mathematics
Example Critical Numbers
The Derivative Fcn, f’ = 4 − 4/x3 is undefined when x = 0.
However, it is very important to note that 0 cannot be the location of a critical point, because f is also undefined at 0
In other words, no critical point of a function can exist at c if no point on f exists at c

[email protected] • MTH15_Lec-12_sec_3-1_Rel_Extrema_.pptx26
Bruce Mayer, PE Chabot College Mathematics
Example Critical Numbers
Use Direction Diagram to Classify the Critical Point at x = 1
Calculating the derivative/slope at a test point to the left of 1 (e.g. x = 0.5) find
Similarly for x>1, say 2:28)5.0(44)5.0(' 3 f → f is DEcreasing
5.3)2(44)2(' 3 f → f is INcreasing

[email protected] • MTH15_Lec-12_sec_3-1_Rel_Extrema_.pptx27
Bruce Mayer, PE Chabot College Mathematics
Example Critical Numbers
From our Direction Diagram it appears that f has a relative minimum at x = 1.
A graph of the function corroborates this assessment.
Relative Minimum
[email protected] • MTH15_Lec-12_sec_3-1_Rel_Extrema_.pptx28
Bruce Mayer, PE Chabot College Mathematics
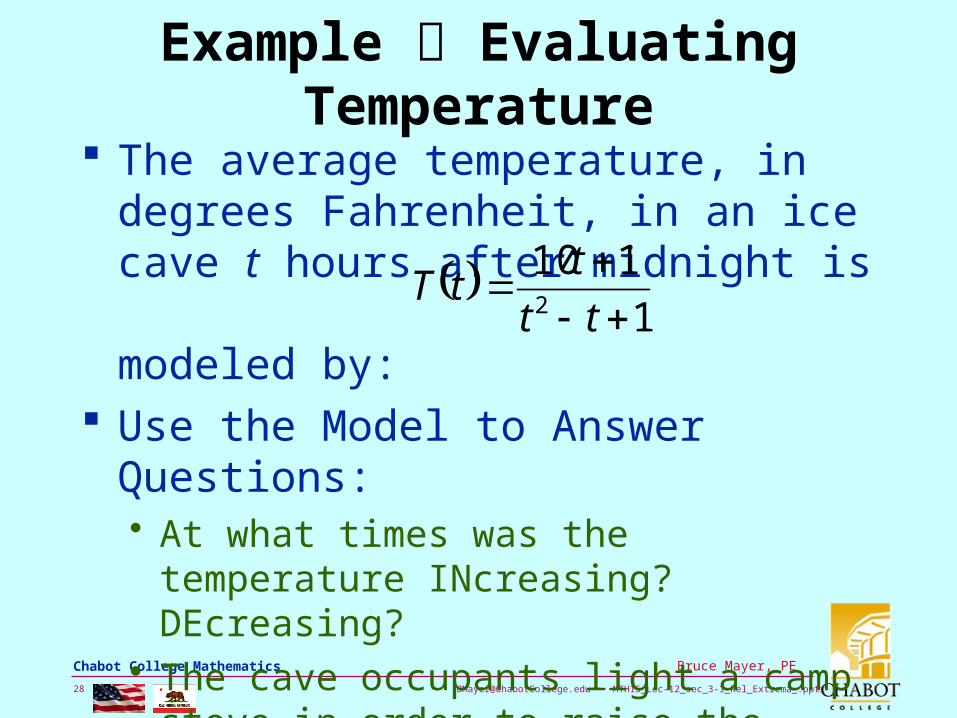
Example Evaluating Temperature
The average temperature, in degrees Fahrenheit, in an ice cave t hours after midnight is modeled by:
Use the Model to Answer Questions:• At what times was the temperature
INcreasing? DEcreasing? • The cave occupants light a camp stove in
order to raise the temperature. At what times is the stove turned on and then off?
1
1102
tt
ttT

[email protected] • MTH15_Lec-12_sec_3-1_Rel_Extrema_.pptx29
Bruce Mayer, PE Chabot College Mathematics
Example Evaluating Temperature
SOLUTION: The Temperature “Changes Direction”
before & after a Max or Min (Extrema)• Thus need to find the Critical Points which
give the Location of relative Extrema• To find critical points of T, determine values
of t such that one these occurs– dT/dt = 0 or – dT/dt → ±∞ (undefined)

[email protected] • MTH15_Lec-12_sec_3-1_Rel_Extrema_.pptx30
Bruce Mayer, PE Chabot College Mathematics
Example Evaluating Temperature
Taking dT/dt:
Using the Quotient Rule
22
22
1
11101101
tt
ttdtd
ttdtd
tt
dt
dT
22
2
1
12110101
tt
tttt
dt
dT
222
11101
110
tttdt
d
dt
dT
tt
ttT
dt
d

[email protected] • MTH15_Lec-12_sec_3-1_Rel_Extrema_.pptx31
Bruce Mayer, PE Chabot College Mathematics
Example Evaluating Temperature
Expanding and Simplifying
When dT/dt → ∞
• The denominator being zero causes the derivative to be undefined– however,(t2−t +1)2 is zero exactly when t2−t + 1
is zero, so it results in NO critical values
22
2
22
22
1
11210
1
1820101010
tt
tt
tt
tttt
dt
dT
011
11210 2222
2
tt
tt
tt
dt
dT

[email protected] • MTH15_Lec-12_sec_3-1_Rel_Extrema_.pptx32
Bruce Mayer, PE Chabot College Mathematics
Example Evaluating Temperature
When dT/dt = 0
Thus Find: Using the quadratic
formula (or a computer algebra system such as MuPAD), find
112101011
112100 22222
22
2
tttttt
tt
tt
011210 2 tt

[email protected] • MTH15_Lec-12_sec_3-1_Rel_Extrema_.pptx33
Bruce Mayer, PE Chabot College Mathematics
Example Evaluating Temperature
For dT/dt = 0 find: t ≈ −1.15 or t ≈ 0.954 Because T is always continuous (check
that the DeNom fcn, (t2−t +1)2 has no real solutions) these are the only two values at which T can change direction
Thus Construct a Direction Diagram with Two BreakPoints:• t ≈ −1.15• t ≈ +0.954

[email protected] • MTH15_Lec-12_sec_3-1_Rel_Extrema_.pptx34
Bruce Mayer, PE Chabot College Mathematics
Example Evaluating Temperature
The DirectionDiagram
We test the derivative function in each of the three regions to determine if T is increasing or decreasing. Testing t = −2
The negative Slope indicates that T is DEcreasing
954.015.1
| |
49
25
1)2(2
11)2(221022
2
2
tdt
dT

[email protected] • MTH15_Lec-12_sec_3-1_Rel_Extrema_.pptx35
Bruce Mayer, PE Chabot College Mathematics
Example Evaluating Temperature
The DirectionDiagram
Now we test in the second region using t = 0:
The positive Slope indicates that T is INcreasing
954.015.1
| |
11
1)0(0
11)0(201022
2
0
tdt
dT

[email protected] • MTH15_Lec-12_sec_3-1_Rel_Extrema_.pptx36
Bruce Mayer, PE Chabot College Mathematics
Example Evaluating Temperature
The DirectionDiagram
Now we test in the second region using t = 1:
Again the negative Slope indicates that T is DEcreasing
954.015.1
| |
1
1)1(1
11)1(211022
2
1
tdt
dT

[email protected] • MTH15_Lec-12_sec_3-1_Rel_Extrema_.pptx37
Bruce Mayer, PE Chabot College Mathematics
Example Evaluating Temperature
The Completed SlopeDirection-Diagram:
We conclude that the function is increasing on the approximate interval (−1.15, 0.954) and decreasing on the intervals (−∞, −1.15) & (0.954, +∞) • It appears that the stove was lit around
10:51pm (1.15 hours before midnight) and turned off around 12:57am (0.95 hours after midnight), since these are the relative extrema of the graph.
954.015.1
| |

[email protected] • MTH15_Lec-12_sec_3-1_Rel_Extrema_.pptx38
Bruce Mayer, PE Chabot College Mathematics
Example Evaluating Temperature
GraphicallyRelative Max (Stove OFF)
Relative Min (Stove On)
1
1102
tt
ttT

[email protected] • MTH15_Lec-12_sec_3-1_Rel_Extrema_.pptx39
Bruce Mayer, PE Chabot College Mathematics
MuPAD Plot Code

[email protected] • MTH15_Lec-12_sec_3-1_Rel_Extrema_.pptx40
Bruce Mayer, PE Chabot College Mathematics
WhiteBoard Work
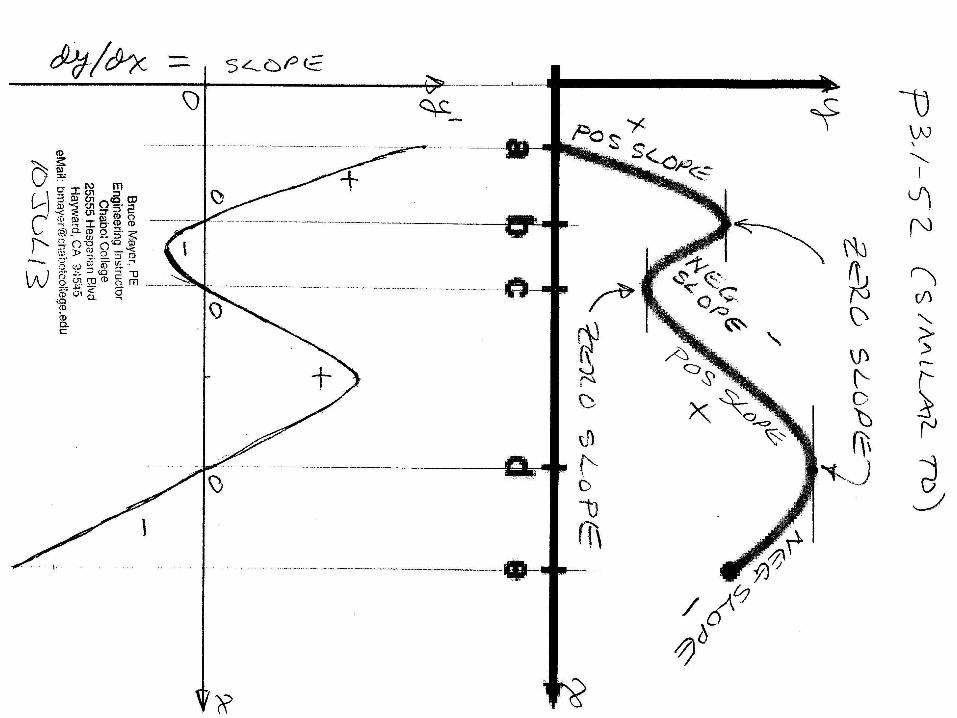
Problems From §3.1• P40 → Use Calculus to Sketch Graph• Similar to P52 →
Sketch df/dx for f(x) Graph at right
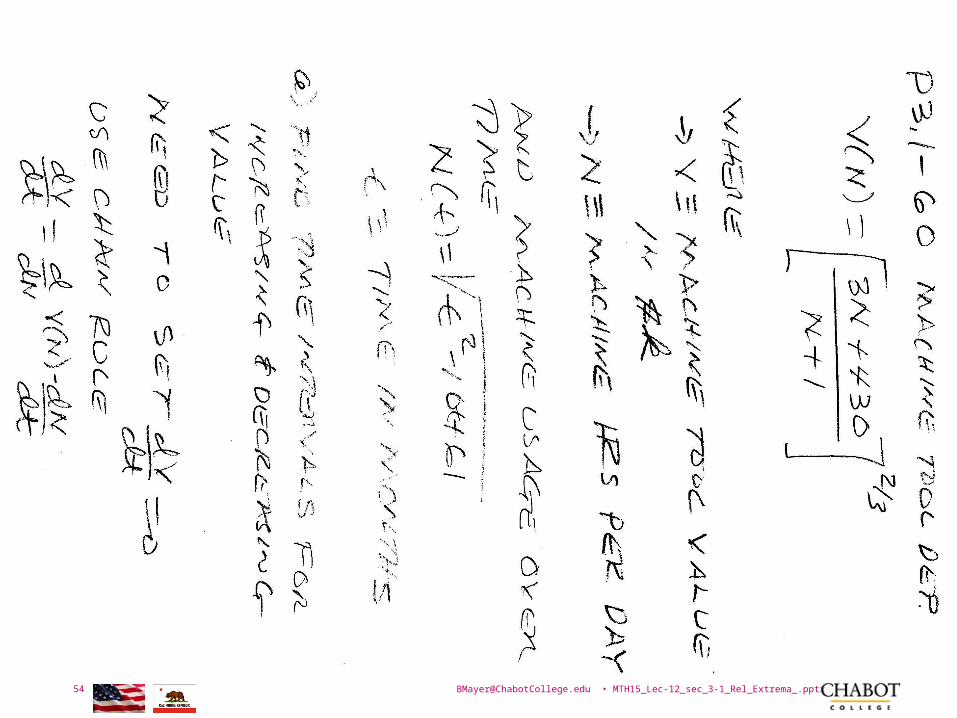
• P60 → MachineTool Depreciation

[email protected] • MTH15_Lec-12_sec_3-1_Rel_Extrema_.pptx41
Bruce Mayer, PE Chabot College Mathematics
All Done for Today
Critical(Mach)Number
Ernst Mach

[email protected] • MTH15_Lec-12_sec_3-1_Rel_Extrema_.pptx42
Bruce Mayer, PE Chabot College Mathematics
Bruce Mayer, PELicensed Electrical & Mechanical Engineer
Chabot Mathematics
Appendix srsrsr 22

[email protected] • MTH15_Lec-12_sec_3-1_Rel_Extrema_.pptx43
Bruce Mayer, PE Chabot College Mathematics

[email protected] • MTH15_Lec-12_sec_3-1_Rel_Extrema_.pptx44
Bruce Mayer, PE Chabot College Mathematics

[email protected] • MTH15_Lec-12_sec_3-1_Rel_Extrema_.pptx45
Bruce Mayer, PE Chabot College Mathematics

[email protected] • MTH15_Lec-12_sec_3-1_Rel_Extrema_.pptx46
Bruce Mayer, PE Chabot College Mathematics

[email protected] • MTH15_Lec-12_sec_3-1_Rel_Extrema_.pptx47
Bruce Mayer, PE Chabot College Mathematics

[email protected] • MTH15_Lec-12_sec_3-1_Rel_Extrema_.pptx48
Bruce Mayer, PE Chabot College Mathematics

[email protected] • MTH15_Lec-12_sec_3-1_Rel_Extrema_.pptx49
Bruce Mayer, PE Chabot College Mathematics

[email protected] • MTH15_Lec-12_sec_3-1_Rel_Extrema_.pptx50
Bruce Mayer, PE Chabot College Mathematics
P3.1-40 Hand Sketch

[email protected] • MTH15_Lec-12_sec_3-1_Rel_Extrema_.pptx51
Bruce Mayer, PE Chabot College Mathematics
P3.1-40 MuPAD Graph

[email protected] • MTH15_Lec-12_sec_3-1_Rel_Extrema_.pptx52
Bruce Mayer, PE Chabot College Mathematics
Wh
iteBd
Grap
hic
for P
3.1-52
[email protected] • MTH15_Lec-12_sec_3-1_Rel_Extrema_.pptx53
Bruce Mayer, PE Chabot College Mathematics
[email protected] • MTH15_Lec-12_sec_3-1_Rel_Extrema_.pptx54
Bruce Mayer, PE Chabot College Mathematics

[email protected] • MTH15_Lec-12_sec_3-1_Rel_Extrema_.pptx55
Bruce Mayer, PE Chabot College Mathematics

[email protected] • MTH15_Lec-12_sec_3-1_Rel_Extrema_.pptx56
Bruce Mayer, PE Chabot College Mathematics

[email protected] • MTH15_Lec-12_sec_3-1_Rel_Extrema_.pptx57
Bruce Mayer, PE Chabot College Mathematics

[email protected] • MTH15_Lec-12_sec_3-1_Rel_Extrema_.pptx58
Bruce Mayer, PE Chabot College Mathematics

[email protected] • MTH15_Lec-12_sec_3-1_Rel_Extrema_.pptx59
Bruce Mayer, PE Chabot College Mathematics

[email protected] • MTH15_Lec-12_sec_3-1_Rel_Extrema_.pptx60
Bruce Mayer, PE Chabot College Mathematics

[email protected] • MTH15_Lec-12_sec_3-1_Rel_Extrema_.pptx61
Bruce Mayer, PE Chabot College Mathematics
P3.1-60 MuPAD

[email protected] • MTH15_Lec-12_sec_3-1_Rel_Extrema_.pptx62
Bruce Mayer, PE Chabot College Mathematics