Embed Size (px)
Citation preview
BioMed CentralBMC Bioinformatics
ss
Open AcceResearchReconstructing networks of pathways via significance analysis of their intersectionsMirko Francesconi1,2, Daniel Remondini1,3, Nicola Neretti2,4, John M Sedivy5, Leon N Cooper4,6, Ettore Verondini1,3, Luciano Milanesi7 and Gastone Castellani*1,2,4Address: 1Centro Interdipartimentale “L. Galvani”, Università di Bologna, , Bologna 40127, Italy, 2Dipartimento di Morfofisiologia veterinaria e Produzioni Animali (DIMORFIPA), Università di Bologna, Bologna 40064, Italy, 3Department of Physics , Università di Bologna, Bologna 40127, Italy, 4Institute for Brain and Neural Systems, Brown University, Providence RI 02906, USA, 5Department of Molecular Biology, Cell Biology and Biochemistry, Brown University, Providence, RI 02903, USA, 6Department of Physics, Brown University, Providence RI 02906, USA and 7Istituto di Tecnologie Biomediche (ITB) CNR, Milano 20090, Italy
Email: Mirko Francesconi - [email protected]; Daniel Remondini - [email protected]; Nicola Neretti - [email protected]; John M Sedivy - [email protected]; Leon N Cooper - [email protected]; Ettore Verondini - [email protected]; Luciano Milanesi - [email protected]; Gastone Castellani* - [email protected]
* Corresponding author
AbstractBackground: Significance analysis at single gene level may suffer from the limited number ofsamples and experimental noise that can severely limit the power of the chosen statistical test. Thisproblem is typically approached by applying post hoc corrections to control the false discoveryrate, without taking into account prior biological knowledge. Pathway or gene ontology analysis canprovide an alternative way to relax the significance threshold applied to single genes and may leadto a better biological interpretation.
Results: Here we propose a new analysis method based on the study of networks of pathways.These networks are reconstructed considering both the significance of single pathways (networknodes) and the intersection between them (links).
We apply this method for the reconstruction of networks of pathways to two gene expressiondatasets: the first one obtained from a c-Myc rat fibroblast cell line expressing a conditional Myc-estrogen receptor oncoprotein; the second one obtained from the comparison of Acute MyeloidLeukemia and Acute Lymphoblastic Leukemia derived from bone marrow samples.
Conclusion: Our method extends statistical models that have been recently adopted for thesignificance analysis of functional groups of genes to infer links between these groups. We showthat groups of genes at the interface between different pathways can be considered as relevant evenif the pathways they belong to are not significant by themselves.
from Seventh International Workshop on Network Tools and Applications in Biology (NETTAB 2007)Pisa, Italy. 12-15 June 2007
Published: 25 April 2008
BMC Bioinformatics 2008, 9(Suppl 4):S9 doi:10.1186/1471-2105-9-S4-S9
<supplement> <title> <p>A Semantic Web for Bioinformatics: Goals, Tools, Systems, Applications</p> </title> <editor>Paolo Romano, Michael Schroeder, Nicola Cannata and Roberto Marangoni</editor> <note>Research</note> </supplement>
This article is available from: http://www.biomedcentral.com/1471-2105/9/S4/S9
© 2008 Francesconi et al.; licensee BioMed Central Ltd. This is an open access article distributed under the terms of the Creative Commons Attribution License (http://creativecommons.org/licenses/by/2.0), which permits unrestricted use, distribution, and reproduction in any medium, provided the original work is properly cited.
Page 1 of 12(page number not for citation purposes)
BMC Bioinformatics 2008, 9(Suppl 4):S9 http://www.biomedcentral.com/1471-2105/9/S4/S9
BackgroundHigh-throughput gene expression analysis has becomeone of the methods of choice in the exploratory phase ofcellular molecular biology and medical research studies.Although microarray technology has improved measure-ment accuracy, and new statistical algorithms for bettersignal estimation have been developed [1-3], reproduci-bility remains an issue [4]. A way to overcome this diffi-culty is to move the analysis from the gene level to ahigher level where genes are grouped into functional cate-gories. This approach has been shown to be more robustand reproducible [5,6], and leads to an easier biologicalinterpretation of the experimental observations.
Gene Ontology (GO) [7] and pathways are the two maingene-grouping schemes in use. GO organizes genesaccording to a hierarchy of terms divided into three cate-gories: “cellular component”, “biological process”, and“molecular function”. Genes appear in more than onelevel in each of the three categories, but no relationbetween genes is described (apart from them being in thesame group). KEGG [8] is one of the most popular path-way databases; it groups genes into pathways of interact-ing genes and substrates, and contains specific linksbetween genes and substrates that interact directly. Bothdatabases are manually curated but incomplete. The GOdatabase is also redundant, as it contains several terms inthe top of the hierarchy that are too broad in their mean-ing and include thousands of genes. KEGG provides amore detailed organization of the genes but containsinformation on fewer genes than GO.
Different approaches have been proposed to identify sig-nificant gene groups based on lists of differentiallyexpressed genes. Several methods have been implementedthat can be directly applied to existing gene-groupingschemes. GOstat [9] compares the occurrences of each GOterm in a given list of genes (tested group) with its occur-rence in a reference group (typically all the genes on thearray) assigning a p value to each term. In the context ofpathway analysis, a similar approach is used by PathwayMiner [10], which ranks pathways by p values obtainedvia a one-sided Fisher exact test. Other methods allowinvestigators the possibility to define their own gene-grouping schemes. For example, Global Test package [11]applies a generalized linear model to determine if a user-defined group of genes is significantly related to a clinicaloutcome. With the Gene Set Enrichment Analysis (GSEA)[12,5] an investigator can test if the members of a gene settend to occur towards the top or the bottom of a rankedgene list obtained from the differential expression analy-sis, and therefore are correlated with the phenotypic classdistinction.
In this paper, we extend the significance analysis of genepathways to higher order structures, i.e. networks of path-ways whose intersections contain a significant number ofdifferentially expressed genes. Network structure canreveal the degree of coordination of different biologicalfunctions as a consequence of the treatment, as well as thepresence of “focal areas” in which groups of genes playcentral roles. We show examples in which some biologicalfunctions (related to specific pathways) are biologicallyrelevant for the studied process, due to their positioninside the pathway network. This analysis can be extendedto groups of genes at the “interface” between pathways,whose imbalance can affect more than one biologicalfunction.
Our approach is aimed at understanding how externalperturbations, such as gene activation or tumor induction,can induce in various types of cells, cell lines or derivedtissues, behaviours that can generate, integrate, andrespond to dynamic informational cues.
The broad question that we are trying to answer is how acell converts perturbations to signalling activity into abinary decision resulting from the appearance of a givenphenotype. Thus the signalling activity has to be diffusedwithin the cell between and within pathways. A signalingpathway is not a rigid unit, but is made of modules withdifferent functions (e.g. the communication with otherpathways) that may be captured by selecting those ele-ments belonging to the interface between pathways.
MethodsData setThe first dataset we consider consist of time course geneexpression arrays based on reconstituted c-myc-/- ratfibroblast cell lines with the conditionally active,tamoxifen-specific c-Myc-estrogen receptor fusion pro-tein. Binding of Tamoxifen to the estrogen receptordomain elicits a conformational change that allows thefusion protein to migrate to the nucleus and to act as atranscription factor.
This data set (MYC data set) contains the gene expressiondata collected after the addition of Tamoxifen. Sampleswere harvested at five time points after the addition ofTamoxifen to the culture medium: 0, 2, 4, 8, and 16 h. Theentire experiment was repeated on three separate occa-sions, providing three biological replicates for each geneand time point. Expression profiling was done by usingthe Affymetrix platform and U34A Gene Chips [13].
The second dataset we consider consists of the geneexpression measurements described in [14]. This data setcontains bone marrow samples obtained from acute leu-kaemia patients, that can be classified as Acute Lymphob-
Page 2 of 12(page number not for citation purposes)

BMC Bioinformatics 2008, 9(Suppl 4):S9 http://www.biomedcentral.com/1471-2105/9/S4/S9
lastic Leukemia (ALL) and Acute Myeloid Leukemia(AML). The mRNA prepared from bone marrow mononu-clear cells was hybridized with Affymetrix Hgu6800 con-taining probes for 6817 human genes. The experimentaldesign is a comparison between ALL and AML (one factor)on the basis of 6817 probes. The dataset (AML/ALL data-set) contains 72 samples, 47 obtained from ALL patientsand 25 obtained from AML patients.
Gene selection and pathway groupingFor the MYC dataset, one-way ANOVA was applied toeach of the 8799 probe sets to identify those that signifi-cantly changed expression level over time. A p value of0.05 was chosen as the cut-off significance level. No post-hoc correction for multiple testing (i.e. Benjamini-Hock-berg, FDR) was applied, since post-hoc validation is pro-vided by pathway analysis: 765 genes resulted significant,251 of which are annotated in KEGG and belonged to 142pathways.
The AML/ALL dataset was analysed with a linear modelwith an empirical Bayes method to shrink gene variances(limma, R package) and 1924 genes were found as signif-icantly differentially expressed between the AML and theALL groups (p <0.05). Among the differentially expressedgenes, 801 genes were annotated in the KEGG database.
Pathway significance and pathway networkIn order to reconstruct a network, we need to specify bothits nodes and links. From a biological point of view, nodescan be defined as groups of genes (such as pathways orontologies) coding for proteins/peptides with similarfunctional properties (e.g. ion channels, kinases, phos-phatases, and transcription factors), performing similartasks or involved in the same biological function. Thelinks between nodes can be drawn in various ways andtheir definition may also depend on the particular type ofexperimental design (e.g. temporal correlation or physicalinteractions of proteins) [15,16].
We choose to define network nodes as groups of genesbelonging to the same pathway as described in the KEGGdatabase. To each node we associate a feature correspond-ing to the state of the pathway, which can be significantlyinvolved (overrepresented), significantly not involved(underrepresented) or not significant in the experimentalcontext [17]. The same classification is used for the linksbetween nodes by analyzing the ratio of significant genesat the intersection between the corresponding pathways.
Significance of nodes and links can be assessed within theframework of 2×2 contingency tables (Table 1) where:
α = number of significant genes ∈ G
β = number of not significant genes ∈ G.
γ = number of significant genes ∉ G.
δ = number of not significant ∉ G.
S= α +γ = number of significant genes in the array
= number of not significant genes in the array
NG = α + β = number of genes ∈ G
= number of genes ∉ G
N = total number of measured genes
Given a subset G of the N measured genes with NG genes,α will be differentially expressed while β = NG - α will not.We compare α and β to the number of differentiallyexpressed genes γ and not differentially expressed genes δnot belonging to G. The statistical significance of the con-tingency table can be computed in different ways: Fisherexact test, binomial and χ2 distribution-based tests [17].We chose to apply the Fisher exact test because the com-putation of the hypergeometric distribution is straightfor-ward for tables with both small numbers (arising whentesting intersections, see below) and large numbers (aris-ing when testing pathways). The Fisher exact test firstcomputes the probability p* of the observed 2×2 table byusing the hypergeometric distribution with parameters(S,NG,N):
S= +β δ
NG= +γ δ
Table 1: 2X2 Contingency table.
Differentially expressed Not differentially expressed
∈ α β NG
∉G γ δ
S N
α = number of significant genes ∈ G, β = number of not significant genes∈ G, γ = number of significant genes ∉ G, δ = number of not significant ∉ G, S = α + γ = number of significant genes in the array
= number of not significant genes in the array, NG = α +
β = number of genes ∈ G, = number of genes ∉ G, N
= total number of measured genes
NG
S
S= +β δN
G= +γ δ
Page 3 of 12(page number not for citation purposes)
BMC Bioinformatics 2008, 9(Suppl 4):S9 http://www.biomedcentral.com/1471-2105/9/S4/S9
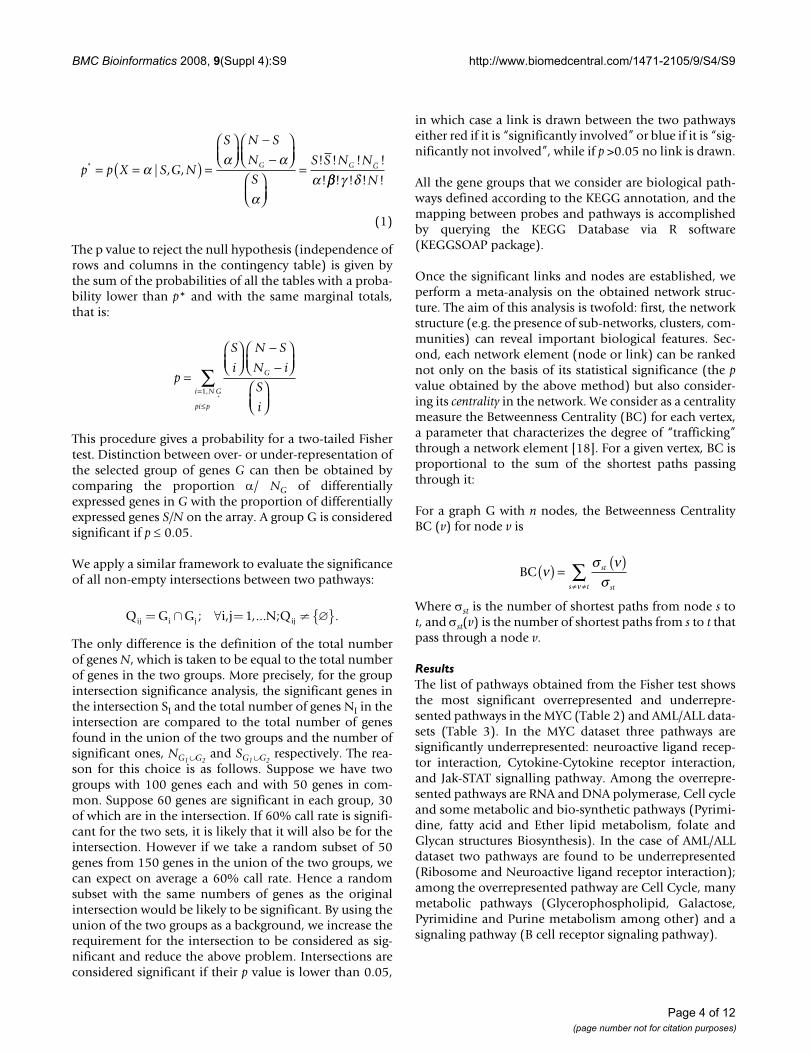
The p value to reject the null hypothesis (independence ofrows and columns in the contingency table) is given bythe sum of the probabilities of all the tables with a proba-bility lower than p* and with the same marginal totals,that is:
This procedure gives a probability for a two-tailed Fishertest. Distinction between over- or under-representation ofthe selected group of genes G can then be obtained bycomparing the proportion α/ NG of differentiallyexpressed genes in G with the proportion of differentiallyexpressed genes S/N on the array. A group G is consideredsignificant if p ≤ 0.05.
We apply a similar framework to evaluate the significanceof all non-empty intersections between two pathways:
The only difference is the definition of the total numberof genes N, which is taken to be equal to the total numberof genes in the two groups. More precisely, for the groupintersection significance analysis, the significant genes inthe intersection SI and the total number of genes NI in theintersection are compared to the total number of genesfound in the union of the two groups and the number ofsignificant ones, NG1∪G2
and SG1∪G2 respectively. The rea-
son for this choice is as follows. Suppose we have twogroups with 100 genes each and with 50 genes in com-mon. Suppose 60 genes are significant in each group, 30of which are in the intersection. If 60% call rate is signifi-cant for the two sets, it is likely that it will also be for theintersection. However if we take a random subset of 50genes from 150 genes in the union of the two groups, wecan expect on average a 60% call rate. Hence a randomsubset with the same numbers of genes as the originalintersection would be likely to be significant. By using theunion of the two groups as a background, we increase therequirement for the intersection to be considered as sig-nificant and reduce the above problem. Intersections areconsidered significant if their p value is lower than 0.05,
in which case a link is drawn between the two pathwayseither red if it is “significantly involved” or blue if it is “sig-nificantly not involved”, while if p >0.05 no link is drawn.
All the gene groups that we consider are biological path-ways defined according to the KEGG annotation, and themapping between probes and pathways is accomplishedby querying the KEGG Database via R software(KEGGSOAP package).
Once the significant links and nodes are established, weperform a meta-analysis on the obtained network struc-ture. The aim of this analysis is twofold: first, the networkstructure (e.g. the presence of sub-networks, clusters, com-munities) can reveal important biological features. Sec-ond, each network element (node or link) can be rankednot only on the basis of its statistical significance (the pvalue obtained by the above method) but also consider-ing its centrality in the network. We consider as a centralitymeasure the Betweenness Centrality (BC) for each vertex,a parameter that characterizes the degree of “trafficking”through a network element [18]. For a given vertex, BC isproportional to the sum of the shortest paths passingthrough it:
For a graph G with n nodes, the Betweenness CentralityBC (v) for node v is
Where σst is the number of shortest paths from node s tot, and σst(v) is the number of shortest paths from s to t thatpass through a node v.
ResultsThe list of pathways obtained from the Fisher test showsthe most significant overrepresented and underrepre-sented pathways in the MYC (Table 2) and AML/ALL data-sets (Table 3). In the MYC dataset three pathways aresignificantly underrepresented: neuroactive ligand recep-tor interaction, Cytokine-Cytokine receptor interaction,and Jak-STAT signalling pathway. Among the overrepre-sented pathways are RNA and DNA polymerase, Cell cycleand some metabolic and bio-synthetic pathways (Pyrimi-dine, fatty acid and Ether lipid metabolism, folate andGlycan structures Biosynthesis). In the case of AML/ALLdataset two pathways are found to be underrepresented(Ribosome and Neuroactive ligand receptor interaction);among the overrepresented pathway are Cell Cycle, manymetabolic pathways (Glycerophospholipid, Galactose,Pyrimidine and Purine metabolism among other) and asignaling pathway (B cell receptor signaling pathway).
p p X S G N
S N S
N
S
S S N NG G G* | , ,! ! ! !
!= =( ) =
⎛⎝⎜
⎞⎠⎟
−−
⎛⎝⎜
⎞⎠⎟
⎛⎝⎜
⎞⎠⎟
=αα α
αα ββ γ δ! ! ! !N
(1)
p
S
i
N S
N i
S
i
G
i NG
pi p
=
⎛⎝⎜
⎞⎠⎟
−−
⎛⎝⎜
⎞⎠⎟
⎛⎝⎜
⎞⎠⎟
=
≤
∑1,
*
Q G G i,j N;Qij i j ij= ∩ ∀ = ≠ ∅{ }; ,... .1
BC νσ ν
σν( ) =
( )≠ ≠∑ st
sts t
Page 4 of 12(page number not for citation purposes)

BMC Bioinformatics 2008, 9(Suppl 4):S9 http://www.biomedcentral.com/1471-2105/9/S4/S9
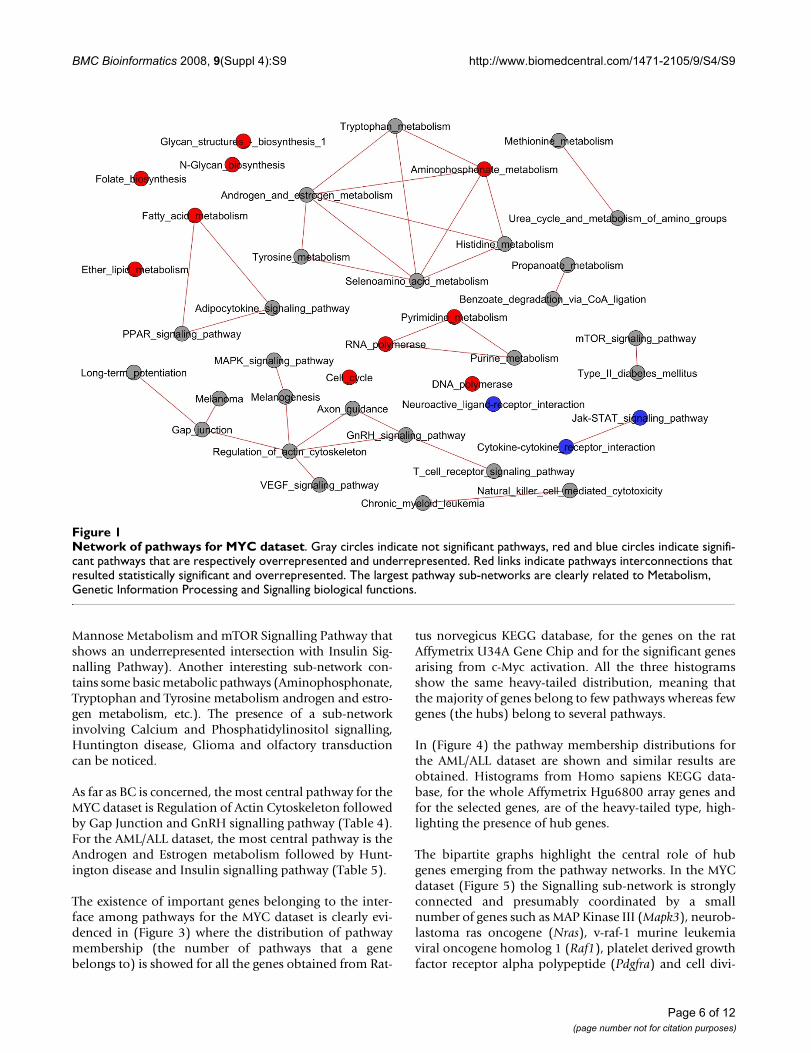
In our case studies (see Figures 1, 2) the networks are verysmall, due to the sparseness of the significant links andnodes, thus very few network elements have nontrivialvalues of BC. Anyway, the analysis of the MYC networkshows the emergence of four main sub-networks (Figure1). These sub-networks are related to different biologicalfunctions: the first sub-network is composed by pathwaysinvolved in signalling processes (MAP Kinases SignallingPathway, VEGF Signalling Pathway, Gonadotropin-releas-ing hormone (GnRH) Signalling Pathway) and pathwaysthat are related to the communication between cells andthe external environment (Regulation of actin cytoskele-ton and Gap junction). Another interesting sub-networkconnects the Metabolism with the Signalling system,
showing links between PPAR Signalling Pathway, Adi-pocytokine Signalling Pathway and Fatty Acid Metabo-lism. A further sub-network is related to nucleic acidsprecursors synthesis and nucleic acids polymerisation(Pyrimidine metabolism, RNA polymerase and Purinemetabolism). Another interesting sub-network containssome basic metabolic pathways (Aminophosphonate,Tryptophan and Tyrosine metabolism androgen andestrogen metabolism among them).
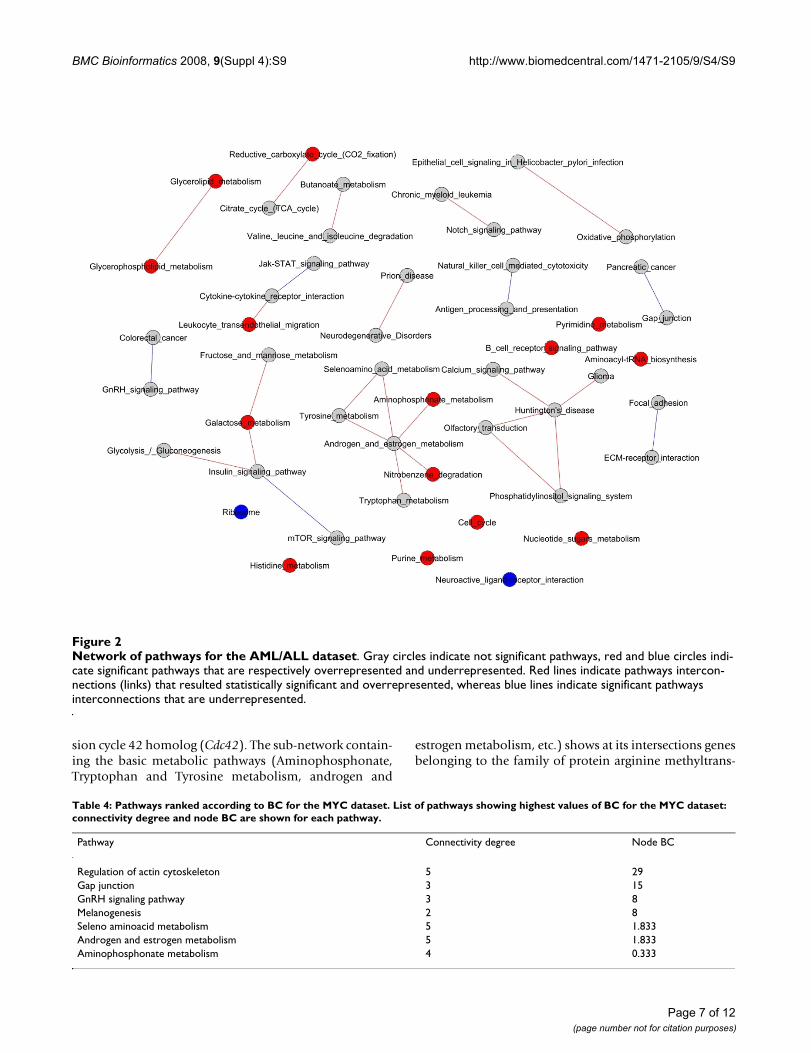
For the AML/ALL dataset, the pathways network showedin Figure 2 evidences a sub-network connecting signallingand metabolism (Insulin Signalling pathway, Glycolysis/Gluconeogenesis, Galactose Metabolism, Fructose and
Table 2: MYC dataset: statistically significant pathways. The table shows the significantly over- or under-represented pathways (p < 0.05) for the MYC dataset. For each pathway the p value, the total number of genes, the number of significant genes and the over or under-representation status are shown.
Pathway p value genes Significantgenes Under/Over representation
Neuroactive ligand-receptor interaction 1.02E-05 223 11 underRNA polymerase 0.000354 4 4 overCytokine-cytokine receptor interaction 0.002103 87 3 underPyrimidine metabolism 0.002192 23 9 overDNA polymerase 0.003769 9 5 overAminophosphonate metabolism 0.009321 4 3 overCell cycle 0.014101 44 12 overN-Glycan biosynthesis 0.016643 12 5 overJak-STAT signaling pathway 0.019052 69 3 underFolate biosynthesis 0.025244 9 4 overFatty acid metabolism 0.027632 37 10 overEther lipid metabolism 0.044526 15 5 overGlycan structures - biosynthesis 1 0.046622 20 6 over
Table 3: AML/ALL dataset: statistically significant pathways. The table shows the significantly over- or under-represented pathways (p < 0.05) for the AML/ALL dataset. For each pathway the p value, the total number of genes, the number of significant genes and the over or under-representation status are shown.
Pathway p value genes Significant genes Under/Over representation
Ribosome 6.70E-05 78 10 underCell cycle 0.00152 80 40 overGlycerophospholipid metabolism 0.003631 28 17 overNeuroactive ligand-receptor interaction 0.004484 211 51 underGalactose metabolism 0.008409 21 13 overB cell receptor signaling pathway 0.008725 49 25 overAminoacyl-tRNA biosynthesis 0.015056 20 12 overPyrimidine metabolism 0.016126 51 25 overPurine metabolism 0.02202 90 40 overGlycerolipid metabolism 0.024062 39 20 overLeukocyte transendothelial migration 0.0245 75 34 overHistidine metabolism 0.033768 26 14 overNitrobenzene degradation 0.03577 3 3 overProteasome 0.040852 27 14 overReductive carboxylate cycle (CO2 fixation) 0.043013 7 5 overProtein export 0.043013 7 5 overAminophosphonate metabolism 0.043363 5 4 overNucleotide sugars metabolism 0.043363 5 4 over
Page 5 of 12(page number not for citation purposes)
BMC Bioinformatics 2008, 9(Suppl 4):S9 http://www.biomedcentral.com/1471-2105/9/S4/S9
Mannose Metabolism and mTOR Signalling Pathway thatshows an underrepresented intersection with Insulin Sig-nalling Pathway). Another interesting sub-network con-tains some basic metabolic pathways (Aminophosphonate,Tryptophan and Tyrosine metabolism androgen and estro-gen metabolism, etc.). The presence of a sub-networkinvolving Calcium and Phosphatidylinositol signalling,Huntington disease, Glioma and olfactory transductioncan be noticed.
As far as BC is concerned, the most central pathway for theMYC dataset is Regulation of Actin Cytoskeleton followedby Gap Junction and GnRH signalling pathway (Table 4).For the AML/ALL dataset, the most central pathway is theAndrogen and Estrogen metabolism followed by Hunt-ington disease and Insulin signalling pathway (Table 5).
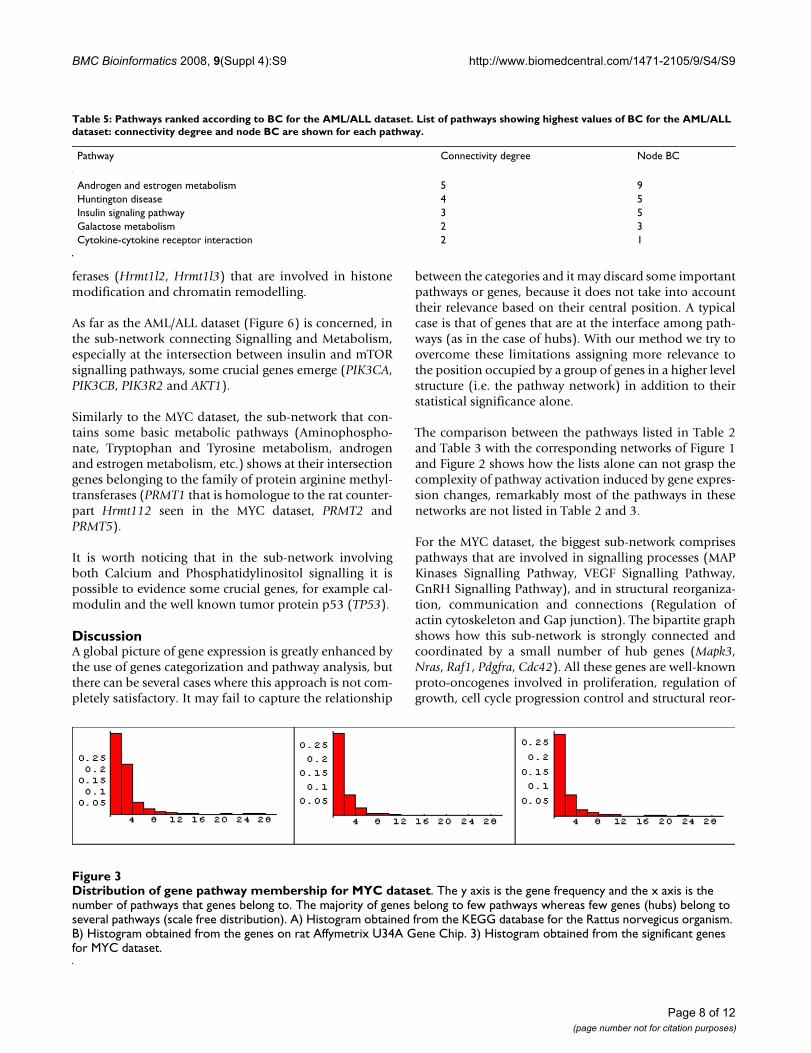
The existence of important genes belonging to the inter-face among pathways for the MYC dataset is clearly evi-denced in (Figure 3) where the distribution of pathwaymembership (the number of pathways that a genebelongs to) is showed for all the genes obtained from Rat-
tus norvegicus KEGG database, for the genes on the ratAffymetrix U34A Gene Chip and for the significant genesarising from c-Myc activation. All the three histogramsshow the same heavy-tailed distribution, meaning thatthe majority of genes belong to few pathways whereas fewgenes (the hubs) belong to several pathways.
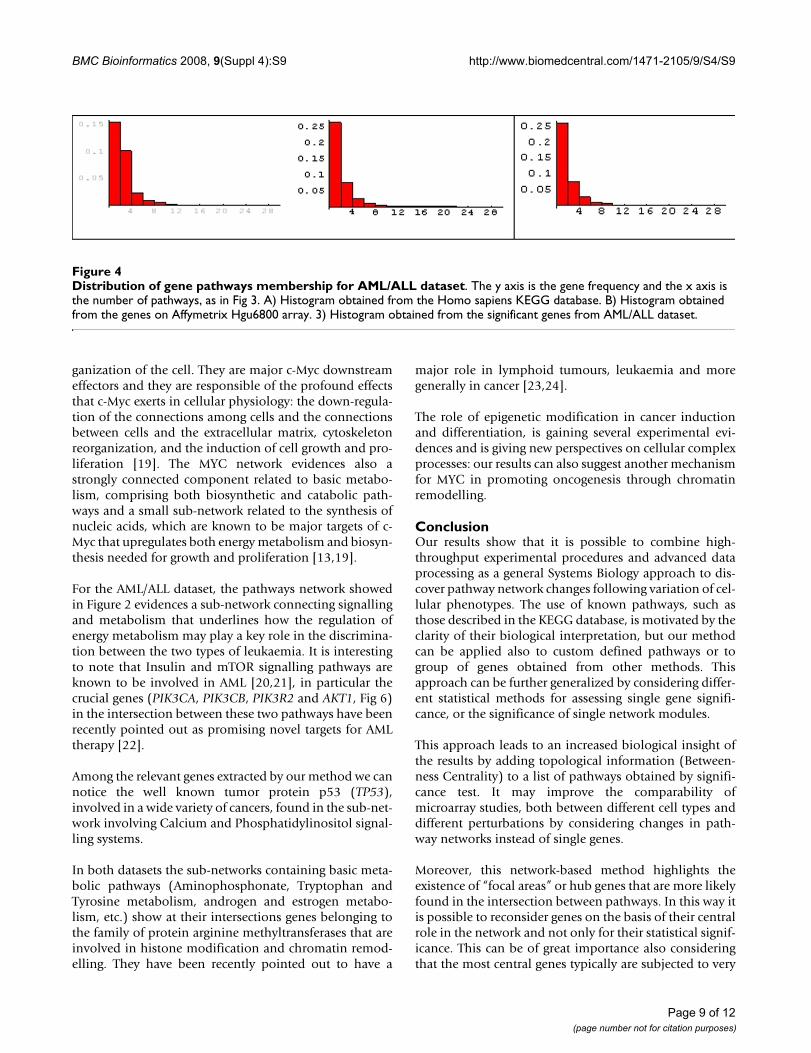
In (Figure 4) the pathway membership distributions forthe AML/ALL dataset are shown and similar results areobtained. Histograms from Homo sapiens KEGG data-base, for the whole Affymetrix Hgu6800 array genes andfor the selected genes, are of the heavy-tailed type, high-lighting the presence of hub genes.
The bipartite graphs highlight the central role of hubgenes emerging from the pathway networks. In the MYCdataset (Figure 5) the Signalling sub-network is stronglyconnected and presumably coordinated by a smallnumber of genes such as MAP Kinase III (Mapk3), neurob-lastoma ras oncogene (Nras), v-raf-1 murine leukemiaviral oncogene homolog 1 (Raf1), platelet derived growthfactor receptor alpha polypeptide (Pdgfra) and cell divi-
Network of pathways for MYC datasetFigure 1Network of pathways for MYC dataset. Gray circles indicate not significant pathways, red and blue circles indicate signifi-cant pathways that are respectively overrepresented and underrepresented. Red links indicate pathways interconnections that resulted statistically significant and overrepresented. The largest pathway sub-networks are clearly related to Metabolism, Genetic Information Processing and Signalling biological functions.
Page 6 of 12(page number not for citation purposes)
BMC Bioinformatics 2008, 9(Suppl 4):S9 http://www.biomedcentral.com/1471-2105/9/S4/S9
sion cycle 42 homolog (Cdc42). The sub-network contain-ing the basic metabolic pathways (Aminophosphonate,Tryptophan and Tyrosine metabolism, androgen and
estrogen metabolism, etc.) shows at its intersections genesbelonging to the family of protein arginine methyltrans-
Network of pathways for the AML/ALL datasetFigure 2Network of pathways for the AML/ALL dataset. Gray circles indicate not significant pathways, red and blue circles indi-cate significant pathways that are respectively overrepresented and underrepresented. Red lines indicate pathways intercon-nections (links) that resulted statistically significant and overrepresented, whereas blue lines indicate significant pathways interconnections that are underrepresented.
Table 4: Pathways ranked according to BC for the MYC dataset. List of pathways showing highest values of BC for the MYC dataset: connectivity degree and node BC are shown for each pathway.
Pathway Connectivity degree Node BC
Regulation of actin cytoskeleton 5 29Gap junction 3 15GnRH signaling pathway 3 8Melanogenesis 2 8Seleno aminoacid metabolism 5 1.833Androgen and estrogen metabolism 5 1.833Aminophosphonate metabolism 4 0.333
Page 7 of 12(page number not for citation purposes)
BMC Bioinformatics 2008, 9(Suppl 4):S9 http://www.biomedcentral.com/1471-2105/9/S4/S9
ferases (Hrmt1l2, Hrmt1l3) that are involved in histonemodification and chromatin remodelling.
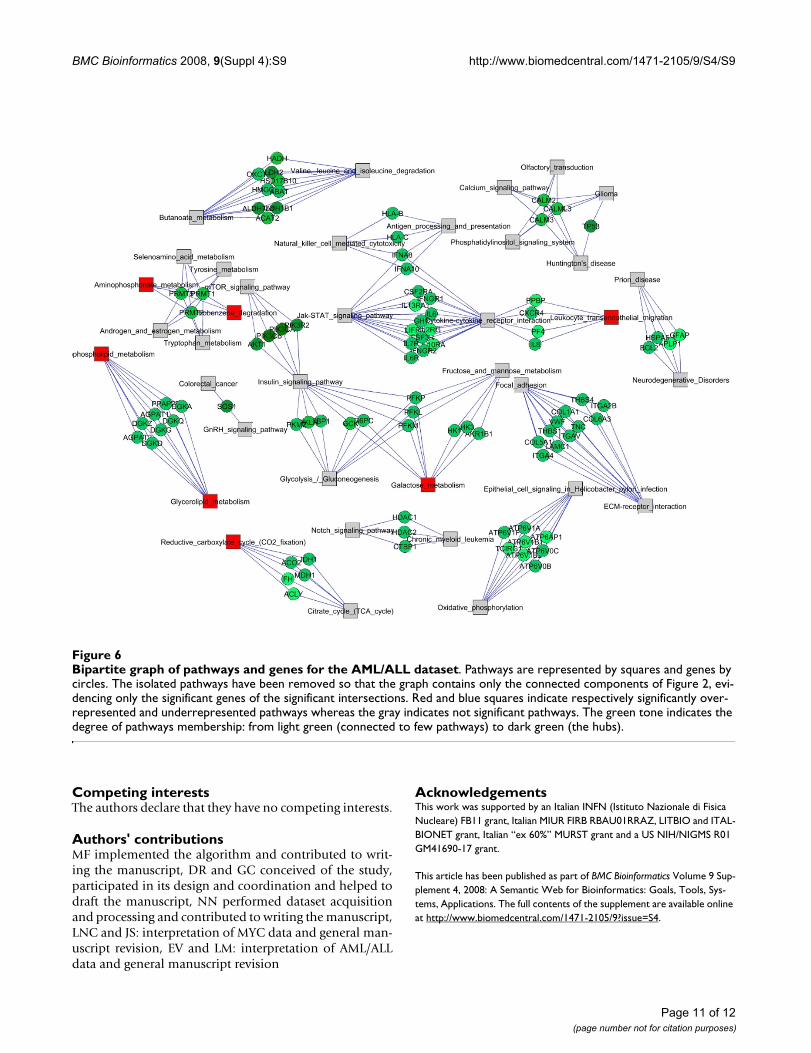
As far as the AML/ALL dataset (Figure 6) is concerned, inthe sub-network connecting Signalling and Metabolism,especially at the intersection between insulin and mTORsignalling pathways, some crucial genes emerge (PIK3CA,PIK3CB, PIK3R2 and AKT1).
Similarly to the MYC dataset, the sub-network that con-tains some basic metabolic pathways (Aminophospho-nate, Tryptophan and Tyrosine metabolism, androgenand estrogen metabolism, etc.) shows at their intersectiongenes belonging to the family of protein arginine methyl-transferases (PRMT1 that is homologue to the rat counter-part Hrmt112 seen in the MYC dataset, PRMT2 andPRMT5).
It is worth noticing that in the sub-network involvingboth Calcium and Phosphatidylinositol signalling it ispossible to evidence some crucial genes, for example cal-modulin and the well known tumor protein p53 (TP53).
DiscussionA global picture of gene expression is greatly enhanced bythe use of genes categorization and pathway analysis, butthere can be several cases where this approach is not com-pletely satisfactory. It may fail to capture the relationship
between the categories and it may discard some importantpathways or genes, because it does not take into accounttheir relevance based on their central position. A typicalcase is that of genes that are at the interface among path-ways (as in the case of hubs). With our method we try toovercome these limitations assigning more relevance tothe position occupied by a group of genes in a higher levelstructure (i.e. the pathway network) in addition to theirstatistical significance alone.
The comparison between the pathways listed in Table 2and Table 3 with the corresponding networks of Figure 1and Figure 2 shows how the lists alone can not grasp thecomplexity of pathway activation induced by gene expres-sion changes, remarkably most of the pathways in thesenetworks are not listed in Table 2 and 3.
For the MYC dataset, the biggest sub-network comprisespathways that are involved in signalling processes (MAPKinases Signalling Pathway, VEGF Signalling Pathway,GnRH Signalling Pathway), and in structural reorganiza-tion, communication and connections (Regulation ofactin cytoskeleton and Gap junction). The bipartite graphshows how this sub-network is strongly connected andcoordinated by a small number of hub genes (Mapk3,Nras, Raf1, Pdgfra, Cdc42). All these genes are well-knownproto-oncogenes involved in proliferation, regulation ofgrowth, cell cycle progression control and structural reor-
Table 5: Pathways ranked according to BC for the AML/ALL dataset. List of pathways showing highest values of BC for the AML/ALL dataset: connectivity degree and node BC are shown for each pathway.
Pathway Connectivity degree Node BC
Androgen and estrogen metabolism 5 9Huntington disease 4 5Insulin signaling pathway 3 5Galactose metabolism 2 3Cytokine-cytokine receptor interaction 2 1
Distribution of gene pathway membership for MYC datasetFigure 3Distribution of gene pathway membership for MYC dataset. The y axis is the gene frequency and the x axis is the number of pathways that genes belong to. The majority of genes belong to few pathways whereas few genes (hubs) belong to several pathways (scale free distribution). A) Histogram obtained from the KEGG database for the Rattus norvegicus organism. B) Histogram obtained from the genes on rat Affymetrix U34A Gene Chip. 3) Histogram obtained from the significant genes for MYC dataset.
Page 8 of 12(page number not for citation purposes)
BMC Bioinformatics 2008, 9(Suppl 4):S9 http://www.biomedcentral.com/1471-2105/9/S4/S9
ganization of the cell. They are major c-Myc downstreameffectors and they are responsible of the profound effectsthat c-Myc exerts in cellular physiology: the down-regula-tion of the connections among cells and the connectionsbetween cells and the extracellular matrix, cytoskeletonreorganization, and the induction of cell growth and pro-liferation [19]. The MYC network evidences also astrongly connected component related to basic metabo-lism, comprising both biosynthetic and catabolic path-ways and a small sub-network related to the synthesis ofnucleic acids, which are known to be major targets of c-Myc that upregulates both energy metabolism and biosyn-thesis needed for growth and proliferation [13,19].
For the AML/ALL dataset, the pathways network showedin Figure 2 evidences a sub-network connecting signallingand metabolism that underlines how the regulation ofenergy metabolism may play a key role in the discrimina-tion between the two types of leukaemia. It is interestingto note that Insulin and mTOR signalling pathways areknown to be involved in AML [20,21], in particular thecrucial genes (PIK3CA, PIK3CB, PIK3R2 and AKT1, Fig 6)in the intersection between these two pathways have beenrecently pointed out as promising novel targets for AMLtherapy [22].
Among the relevant genes extracted by our method we cannotice the well known tumor protein p53 (TP53),involved in a wide variety of cancers, found in the sub-net-work involving Calcium and Phosphatidylinositol signal-ling systems.
In both datasets the sub-networks containing basic meta-bolic pathways (Aminophosphonate, Tryptophan andTyrosine metabolism, androgen and estrogen metabo-lism, etc.) show at their intersections genes belonging tothe family of protein arginine methyltransferases that areinvolved in histone modification and chromatin remod-elling. They have been recently pointed out to have a
major role in lymphoid tumours, leukaemia and moregenerally in cancer [23,24].
The role of epigenetic modification in cancer inductionand differentiation, is gaining several experimental evi-dences and is giving new perspectives on cellular complexprocesses: our results can also suggest another mechanismfor MYC in promoting oncogenesis through chromatinremodelling.
ConclusionOur results show that it is possible to combine high-throughput experimental procedures and advanced dataprocessing as a general Systems Biology approach to dis-cover pathway network changes following variation of cel-lular phenotypes. The use of known pathways, such asthose described in the KEGG database, is motivated by theclarity of their biological interpretation, but our methodcan be applied also to custom defined pathways or togroup of genes obtained from other methods. Thisapproach can be further generalized by considering differ-ent statistical methods for assessing single gene signifi-cance, or the significance of single network modules.
This approach leads to an increased biological insight ofthe results by adding topological information (Between-ness Centrality) to a list of pathways obtained by signifi-cance test. It may improve the comparability ofmicroarray studies, both between different cell types anddifferent perturbations by considering changes in path-way networks instead of single genes.
Moreover, this network-based method highlights theexistence of “focal areas” or hub genes that are more likelyfound in the intersection between pathways. In this way itis possible to reconsider genes on the basis of their centralrole in the network and not only for their statistical signif-icance. This can be of great importance also consideringthat the most central genes typically are subjected to very
Distribution of gene pathways membership for AML/ALL datasetFigure 4Distribution of gene pathways membership for AML/ALL dataset. The y axis is the gene frequency and the x axis is the number of pathways, as in Fig 3. A) Histogram obtained from the Homo sapiens KEGG database. B) Histogram obtained from the genes on Affymetrix Hgu6800 array. 3) Histogram obtained from the significant genes from AML/ALL dataset.
Page 9 of 12(page number not for citation purposes)

BMC Bioinformatics 2008, 9(Suppl 4):S9 http://www.biomedcentral.com/1471-2105/9/S4/S9
small changes that could be hardly detectable by any sin-gle gene statistical analysis, but can anyway exert greatbiological effects due to their central role in pathway inter-connections and communication. Recently other authorsare developing methods trying to extract from the datagenes that can be biologically relevant even if they are nottop-ranking in terms of statistical significance [25].
The problem of assessing pathway relevance is issued in adifferent way by Draghici [26]. In his paper the biologicalrelevance of each pathway is scored both on the basis of astatistical significance test (pathway enrichment analysis)and on other parameters referred to the position of single
genes in the pathway. Our method for pathway relevancecan be seen as a top-down approach (from a KEGG-basednetwork to single pathways and genes), as much as themethod by Draghici is a bottom-up one (from genes topathways).
List of abbreviations usedGO: gene ontology, KEGG Kyoto Encyclopedia of Genesand Genomes, GSEA: Gene Set Enrichment Analysis, ALL:Acute Lymphoid Leukemia, AML: Acute Myeloid Leuke-mia, FDR: False Discovery Rate, ANOVA: Analysis of Vari-ance, BC: Betweenness Centrality.
Bipartite graph of pathways and genes for the MYC datasetFigure 5Bipartite graph of pathways and genes for the MYC dataset. Pathways are represented by squares and genes by cir-cles. The isolated pathways have been removed so that the graph contains only the connected components of Figure 1, evi-dencing only the significant genes of the significant intersections. Red and blue squares indicate respectively significantly overrepresented and underrepresented pathways whereas the gray indicates not significant pathways. The green tone indicates the degree of pathways membership: from light green (connected to few pathways) to dark green (the hubs).
Page 10 of 12(page number not for citation purposes)
BMC Bioinformatics 2008, 9(Suppl 4):S9 http://www.biomedcentral.com/1471-2105/9/S4/S9
Competing interestsThe authors declare that they have no competing interests.
Authors' contributionsMF implemented the algorithm and contributed to writ-ing the manuscript, DR and GC conceived of the study,participated in its design and coordination and helped todraft the manuscript, NN performed dataset acquisitionand processing and contributed to writing the manuscript,LNC and JS: interpretation of MYC data and general man-uscript revision, EV and LM: interpretation of AML/ALLdata and general manuscript revision
AcknowledgementsThis work was supported by an Italian INFN (Istituto Nazionale di Fisica Nucleare) FB11 grant, Italian MIUR FIRB RBAU01RRAZ, LITBIO and ITAL-BIONET grant, Italian “ex 60%” MURST grant and a US NIH/NIGMS R01 GM41690-17 grant.
This article has been published as part of BMC Bioinformatics Volume 9 Sup-plement 4, 2008: A Semantic Web for Bioinformatics: Goals, Tools, Sys-tems, Applications. The full contents of the supplement are available online at http://www.biomedcentral.com/1471-2105/9?issue=S4.
Bipartite graph of pathways and genes for the AML/ALL datasetFigure 6Bipartite graph of pathways and genes for the AML/ALL dataset. Pathways are represented by squares and genes by circles. The isolated pathways have been removed so that the graph contains only the connected components of Figure 2, evi-dencing only the significant genes of the significant intersections. Red and blue squares indicate respectively significantly over-represented and underrepresented pathways whereas the gray indicates not significant pathways. The green tone indicates the degree of pathways membership: from light green (connected to few pathways) to dark green (the hubs).
Page 11 of 12(page number not for citation purposes)

BMC Bioinformatics 2008, 9(Suppl 4):S9 http://www.biomedcentral.com/1471-2105/9/S4/S9
Publish with BioMed Central and every scientist can read your work free of charge
"BioMed Central will be the most significant development for disseminating the results of biomedical research in our lifetime."
Sir Paul Nurse, Cancer Research UK
Your research papers will be:
available free of charge to the entire biomedical community
peer reviewed and published immediately upon acceptance
cited in PubMed and archived on PubMed Central
yours — you keep the copyright
Submit your manuscript here:http://www.biomedcentral.com/info/publishing_adv.asp
BioMedcentral
References1. Hekstra D, Taussig AR, Magnasco M, Naef F: Absolute mRNA con-
centrations from sequence-specific calibration of oligonucle-otide arrays. Nucleic Acids Res 2003, 31:1962-1968.
2. Affymetrix Inc: Technical note: guide to probe logarithmicintensity error (PLIER) estimation. 2005.
3. Irizarry RA, Hobbs B, Collin F, Beazer-Barclay YD, Antonellis KJ,Scherf U, Speed TP: Exploration, normalization, and summa-ries of high density oligonucleotide array probe level data.Biostatistics 2003, 4:249-264.
4. Fortunel NO, Otu HH, Ng HH, Chen J, Mu X, Chevassut T, Li X,Joseph M, Bailey C, Hatzfeld JA, Hatzfeld A, Usta F, Vega VB, Long PM,Libermann TA, Lim B: Comment on “ ‘Stemness’: transcrip-tional profiling of embryonic and adult stem cells” and “astem cell molecular signature. Science 2003, 302(5644):393.author reply 393
5. Subramanian A, Tamayo P, Mootha VK, Mukherjee S, Ebert BL, Gil-lette MA, Paulovich A, Pomeroy SL, Golub TR, Lander ES, Mesirov JP:Gene set enrichment analysis: a knowledge-based approachfor interpreting genome-wide expression profiles. Proc NatlAcad Sci USA 2005, 102:15545-15550.
6. Manoli T, Gretz N, Gröne HJ, Kenzelmann M, Eils R, Brors B: Grouptesting for pathway analysis improves comparability of dif-ferent microarray datasets. Bioinformatics 2006, 22:2500-2506.
7. Ashburner M, Ball CA, Blake JA, Botstein D, Butler H, Cherry JM,Davis AP, Dolinski K, Dwight SS, Eppig JT, Harris MA, Hill DP, Issel-Tarver L, Kasarskis A, Lewis S, Matese JC, Richardson JE, Ringwald M,Rubin GM, Sherlock G: Gene ontology: tool for the unificationof biology. The Gene Ontology Consortium. Nat Genet 2000,25:25-29.
8. Kanehisa M, Goto S: KEGG: kyoto encyclopedia of genes andgenomes. Nucleic Acids Res 2000, 28:27-30.
9. Beissbarth T, Speed T.P.: GOstat: find statistically overrepre-sented Gene Ontologies within a group of genes. Bioinformatics2004, 20:1464-1465.
10. Pandey R, Guru RK, Mount DW: Pathway Miner: extractinggene association networks from molecular pathways for pre-dicting the biological significance of gene expression micro-array data. Bioinformatics 2004, 20:2156-2158.
11. Goeman JJ, van de Geer SA, de Kort F, van Houwelingen HC: A glo-bal test for groups of genes: testing association with a clinicaloutcome. Bioinformatics 2004, 20:93-99.
12. Mootha VK, Lindgren CM, Eriksson KF, Subramanian A, Sihag S, LeharJ, Puigserver P, Carlsson E, Ridderstråle M, Laurila E, Houstis N, DalyMJ, Patterson N, Mesirov JP, Golub TR, Tamayo P, Spiegelman B,Lander ES, Hirschhorn JN, Altshuler D, Groop LC: PGC-1alpha-responsive genes involved in oxidative phosphorylation arecoordinately downregulated in human diabetes. Nat Genet2003, 34:267-273.
13. O'Connell BC, Cheung AF, Simkevich CP, Tam W, Ren X, MateyakMK, Sedivy JM: A large scale genetic analysis of c-Myc-regu-lated gene expression patterns. J Biol Chem 2003,278:12563-12573.
14. Golub TR, Slonim DK, Tamayo P, Huard C, Gaasenbeek M, MesirovJP, Coller H, Loh ML, Downing JR, Caligiuri MA, Bloomfield CD,Lander ES: Molecular classification of cancer: class discoveryand class prediction by gene expression monitoring. Science1999, 286:531-537.
15. Lezon TR, Banavar JR, Cieplak M, Maritan A, Fedoroff NV: Using theprinciple of entropy maximization to infer genetic interac-tion networks from gene expression patterns. Proc Natl AcadSci USA 2006, 103:19033-8.
16. Hooper SD, Boué S, Krause R, Jensen LJ, Mason CE, Ghanim M,White KP, Furlong EE, Bork P: Identification of tightly regulatedgroups of genes during Drosophila melanogaster embryo-genesis. Mol Syst Biol 2007, 3:72.
17. Draghici S, Khatri P, Martins RP, Ostermeier GC, Krawetz SA: Glo-bal functional profiling of gene expression. Genomics 2003,81:98-104.
18. Freeman LC: A Set of Measures of Centrality Based onBetweenness. Sociometry 1977, 40:35-41.
19. Dang CV, O'Donnell KA, Zeller KI, Nguyen T, Osthus RC, Li F: Thec-Myc target gene network. Semin Cancer Biol 2006, 16:253-264.
20. Doepfner KT, Boller D, Arcaro A: Targeting receptor tyrosinekinase signaling in acute myeloid leukemia. Crit Rev OncolHematol. 2007, 63:215-30.
21. Récher C, Dos Santos C, Demur C, Payrastre B: mTOR, a newtherapeutic target in acute myeloid leukemia. Cell Cycle 2005,4:1540-1549.
22. Martelli AM, Tazzari PL, Evangelisti C, Chiarini F, Blalock WL, Billi AM,Manzoli L, McCubrey JA, Cocco L: Targeting the phosphatidyli-nositol 3-inase/Akt/mammalian target of rapamycin modulefor acute myelogenous leukemia therapy: from bench tobedside”. Curr Med Chem. 2007, 14:2009-2023.
23. Cheung N, Chan LC, Thompson A, Cleary ML, So CW: Proteinarginine-methyltransferase-dependent oncogenesis. NatureCell Biology 2007, 9:1208-1215.
24. Pal S, Baiocchi RA, Byrd JC, Grever MR, Jacob ST, Sif S: Low levelsof miR-92b/96 induce PRMT5 translation and H3R8/H4R3methylation in mantle cell lymphoma. The EMBO Journal 2007,26:3558-3569.
25. Chuang HY, Lee E, Liu YT, Lee D, Ideker T: Network-based clas-sification of breast cancer metastasis. Molecular Systems Biology2007, 3:140.
26. Draghici S, Khatri P, Tarca AL, Amin K, Done A, Voichita C, Geor-gescu C, Romero R: A systems biology approach for pathwaylevel analysis. Genome Res. 2007, 17:1537-1545.
Page 12 of 12(page number not for citation purposes)