Embed Size (px)
Citation preview
This Provisional PDF corresponds to the article as it appeared upon acceptance. Fully formattedPDF and full text (HTML) versions will be made available soon.
Values and preferences in oral anticoagulation in patients with atrial fibrilation:physicians' and patients' perspectives. Protocol for a two-phase study
BMC Health Services Research 2008, 8:221 doi:10.1186/1472-6963-8-221
Pablo Alonso-Coello ([email protected])Victor M Montori ([email protected])
Ivan Sola ([email protected])Holger J Schunemann ([email protected])
Philipe Devereaux ([email protected])Cathy Charles ([email protected])
Merce Roura ([email protected])M Gloria Diaz ([email protected])
Juan Carlos Souto ([email protected])Rafael Alonso ([email protected])
Sven Oliver ([email protected])Rafael Ruiz ([email protected])
Blanca Coll-Vinent ([email protected])Ana Isabel Diez ([email protected])
Ignasi Gich ([email protected])Gordon Guyatt ([email protected])
ISSN 1472-6963
Article type Study protocol
Submission date 30 September 2008
Acceptance date 27 October 2008
Publication date 27 October 2008
Article URL http://www.biomedcentral.com/1472-6963/8/221
Like all articles in BMC journals, this peer-reviewed article was published immediately uponacceptance. It can be downloaded, printed and distributed freely for any purposes (see copyright
notice below).
Articles in BMC journals are listed in PubMed and archived at PubMed Central.
BMC Health Services Research
© 2008 Alonso-Coello et al. , licensee BioMed Central Ltd.This is an open access article distributed under the terms of the Creative Commons Attribution License (http://creativecommons.org/licenses/by/2.0),
which permits unrestricted use, distribution, and reproduction in any medium, provided the original work is properly cited.

For information about publishing your research in BMC journals or any BioMed Central journal, go to
http://www.biomedcentral.com/info/authors/
BMC Health Services Research
© 2008 Alonso-Coello et al. , licensee BioMed Central Ltd.This is an open access article distributed under the terms of the Creative Commons Attribution License (http://creativecommons.org/licenses/by/2.0),
which permits unrestricted use, distribution, and reproduction in any medium, provided the original work is properly cited.
1
Values and preferences in oral anticoagulation in patients with atrial fibrillation, physicians' and
patients' perspectives: protocol for a two-phase study
Pablo Alonso-Coello1,2
, Victor M. Montori3, Ivan Solà
1, Holger J. Schünemann
4, Philipe
Devereaux4, Cathy Charles
4, Mercè Roura
5, M. Gloria Díaz
6, Juan Carlos Souto
7, Rafael
Alonso8, Sven Oliver
9, Rafael Ruiz
10, Blanca Coll-Vinent
11, Ana Isabel Diez
12, Ignasi Gich
1,2,
Gordon Guyatt4.
1. Iberoamerican Cochrane Center, Hospital Sant Pau, Sant Antoni Maria Claret 171,
Barcelona, Spain.
2. CIBER de Epidemiología y Salud Pública (CIBERESP), Spain.
3. Knolwedge and Encounter Research Unit, Mayo Clinic, 200 First Street SW, Rochester, MN
55905, United States of America.
4. Department of Clinical Epidemiology & Biostatistics, CLARITY Research Group, McMaster
University Medical Centre 2C9, 1200 Main St W, Hamilton, ON, Canada.
5. SAP Litoral de Barcelona, Lope de Vega, 138, Barcelona, Spain.
6. Unidad Docente de Medicina Familiar y Comunitaria, Hospital Donostia, Paseo Dr.
Beguiristain s/n, Donostia, Spain.
7. Unitat d'Hemostàsia i Trombosi, Hospital Sant Pau, Sant Antoni Maria Claret 171,
Barcelona, Spain.
8. Equipo de Atención Primaria Griñón, Area 10, Madrid, Spain.
9. Unidad Formadora de Medicina Familiar y Comunitaria de A Coruña, Spain.
10. Institut Català de la Salut, c/ Sardenya 375. Entlo 4ª, Barcelona, Spain.
11. Hospital Clínic. Villarroel 170, Barcelona, Spain.
12. Centro de Salud de Beraun. Avenida Galtzaraborda 67, Errenteria, San Sebastian, Spain.
PAC: [email protected]
VMM: [email protected]
HJS: [email protected]
MGD: [email protected]
JCS: [email protected]

2
BCV: [email protected]
AID: [email protected]
Corresponding author: Pablo Alonso Coello. Iberoamerican Cochrane Center, Hospital Sant
Pau, Sant Antoni Maria Claret 171, 08042, Barcelona. CIBER de Epidemiología y Salud Pública
(CIBERESP), Spain; [email protected].
3
Abstract
Background: Oral anticoagulation prevents strokes in patients with atrial fibrillation but, for
reasons that remain unclear, less than 40% of all patients with atrial fibrillation receive warfarin.
The literature postulates that patient and clinician preferences may explain this low utilization.
Design: The proposed research seeks to answer the following questions: i) When assessed
systematically, do patients’ and clinicians’ preferences explain the utilization of warfarin to
prevent strokes associated with atrial fibrillation? ii) To what extent do patients’ and clinicians’
treatment preferences differ? iii) What factors explain any differences that exist in treatment
preferences between patients and clinicians? To answer these questions we will conduct a two-
phase study of patient and clinician preferences for health states and treatments. In the first
phase of this study we will conduct structured interviews to determine their treatment
preferences for warfarin vs. aspirin to prevent strokes associated with atrial fibrillation using the
probability trade-off technique. In the same interview, we will conduct preference-elicitation
exercises using the feeling thermometer to identify the utilities that patients place on taking
medication (warfarin and aspirin), and on having a mild stroke, a severe stroke, and a major
bleed. In the second phase of the study we will convene focus groups of clinicians and patients
to explore their answers to the exercises in the first phase.
Discussion: This is a study of patient and clinician preferences for health states and treatments.
Because of its clinical importance and our previous work in this area, we will conduct our study
in the clinical context of the decision to use antithrombotic agents to reduce the risk of stroke in
patients with non-valvular chronic atrial fibrillation
4
Background:
Chronic atrial fibrillation (AF) is the commonest sustained cardiac arrhythmia. The prevalence of
AF increases from less than 1% in patients younger than 60 years to almost 10% in patients
over the age of 80 years [1,2] (Go AS 2001, Feinberg WM 1995). Similarly, the incidence of AF
increases from 0.2% per year in men under the age of 40 years to more than 2% per year in
men aged 80–89 years, with a lower age-adjusted incidence in women [3] (Heeringa J 2006).
This condition is associated with substantial mortality and morbidity from stroke,
thromboembolism and heart failure [4] (Lip GY 2007). On average, 5 out of every 100 patients
will have a stroke every year of whom 3 will have severe disability or die prematurely [5,6]
(Fuster V 2001, Kannel WB 1998). Warfarin reduces the risk of strokes by 65% [7] (Hart RG
1999).
A recent systematic review of practice surveys found that 56 to 85% of patients with atrial
fibrillation are not receiving warfarin [8] (Bungard 2000). As a result thousands of these patients
will suffer preventable strokes every year and many will be left with severe and permanent
disability or will die prematurely. Why do these patients and their clinicians choose not to use
warfarin? Although this review identifies some system barriers to anticoagulation [8] (Bungard
2000), the most common reason for not offering and prescribing warfarin to patients with atrial
fibrillation was clinicians’ perception that patients were at high risk of bleeding [9] (Weisbord SD
2001). This point suggests that clinicians must consider the majority of patients with atrial
fibrillation to be at sufficiently high risk of bleeding to warrant withholding warfarin. This behavior
is consistent with clinicians being more bleeding-averse than stroke-averse. The catastrophic
impact of major stroke on patients’ lives raises questions about these apparent values. The
wisdom of withholding anticoagulation is further challenged by data suggesting that clinicians’
ability to assess their patients’ risk of bleeding on warfarin is no better than chance [10] (Beyth
RJ).
One needs to weigh the benefits of stroke prevention against the inconvenience and cost of
taking warfarin daily, the inconvenience of periodic blood testing to monitor anticoagulation, and
the risk of both minor and major bleeding. In addition, there are alternatives to warfarin. Aspirin
is less effective than warfarin in avoiding strokes, it is less likely to cause bleeding [11] (van
Walraven C 2002), and requires no laboratory testing to monitor its effects. If patients choose
not to take either warfarin or aspirin, they minimize their risk of bleeding and the inconvenience
of using these treatments, but are left with an increased risk of stroke.
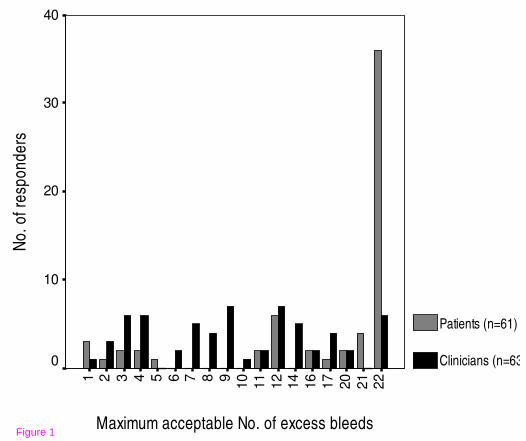
Perhaps patients and clinicians do not choose to use warfarin because they prefer to avoid the
risk of bleeding associated with its use. This perspective may be particularly true for those
patients considered at high risk of bleeding. In this proposal, we will describe a prior study we
conducted that suggests that this explanation is unlikely [12] (Deveraux 2001). Our results
suggested that patients were much more stroke-averse than bleeding-averse (Figure 1). On the
5
other hand, clinicians were less stroke-averse and more bleeding-averse than the patients. If
these results are accurate and widely generalizable, they suggest that warfarin is underutilized
and that the utilization rates are not consistent with patient values but are determined by
physician values. Another way to look at the results involves determining what participants
implied about the relative values of strokes and bleeds. In effect, clinicians’ felt that the adverse
consequences of a severe gastrointestinal hemorrhage had more or less the same value (or
disutility) as the adverse consequences of a stroke. This was in spite of describing that half of
the strokes were severe enough to lead to irreversible major disability or death and of
describing severe gastrointestinal bleeds as transitory events associated with transfusions,
endoscopy, and relatively rapid recovery to pre-morbid function.
If our findings were valid (i.e., they truly reflect individual patient and clinician choices) and
generalizable, they would have profound implications. First, they suggest that current clinician
behavior of withholding warfarin in patients at risk of bleeding is inconsistent with the values and
preferences of patients. Second, if clinicians were to behave in a way consistent with patient
preferences, patients would likely experience fewer strokes thanks to wider warfarin use. Thus,
if confirmed, our findings will call for interventions to align clinician behavior with patient
preferences.
It is possible, however, that other considerations may explain our previous findings. First, our
previous study lacked an optimally detailed presentation of warfarin use. To varying degrees,
most decision analyses on the choice of antithrombotic therapy for atrial fibrillation are sensitive
to patients utility for the inconvenience associated with warfarin administration [13-17] (Eckman
MH 1998 I y II, Naglie IG 1999, Gage 1995, Thomson R 1999), which has been as low as 0.92
on a 0 to 1.0 scale where 0 is death, and 1.0 full health [18] (Robinson 2001). Failure to present
all the inconveniences of warfarin use in vivid detail (“unpacked” and described in its many
components) could lead to an underestimation of its relative importance [19] (Rottenstreich Y
1997)
Second, we did not include consideration of deaths from all cause and those resulting from
bleeding. The literature does not emphasize the 20% reduction in the risk of dying associated
with warfarin when compared to placebo [7] (Hart 1999). There are fewer deaths (although this
difference does not reach statistical significance) among patients using warfarin than among
patients using aspirin [11] (van Walraven C 2002). However, as the bleeding risk increases with
warfarin (as we will model during the probability trade-off exercise) the number of deaths due to
bleeding (at most, 10% of severe gastrointestinal bleeds will die) will also increase and
eventually offset the small probable mortality benefit of warfarin over aspirin. We instructed
clinicians and patients to consider the scenarios as presented, ignoring other issues that might
come into play in other situation. It is possible, however, that while patients were easily able to
6
follow these instructions, clinicians incorporated their knowledge of issues of inconvenience of
warfarin use and of bleeding deaths in their evaluation.
Limitations of our prior study, however, permit alternative explanations of our findings. In
particular, we did not highlight for patients the inconvenience of warfarin therapy, the risk of
death with bleeding, nor the risk of death with strokes. Discrepancies in clinician and patient
responses may be explained by clinicians taking these factors into account, while patients did
not. The goal of this proposal is to resolve uncertainty in the interpretation of our prior study,
and deepen our understanding of how clinicians make decisions about warfarin use in patients
with atrial fibrillation. The implications of the study proposed are potentially profound: if
differences in clinician and patient values and preferences underlie the current apparent
underutilization of warfarin, it can be inferred that there are truly hundreds of thousands of
patients experiencing an unnecessary devastating stroke each year. Such a result will mandate
the development and testing of interventions to align clinician behavior with patient preferences.
7
Design:
The proposed research seeks to answer the following questions:
1) When assessed systematically, do patients’ and clinicians’ preferences explain the utilization
of warfarin to prevent strokes associated with atrial fibrillation?
2) To what extent do patients’ and clinicians’ treatment preferences differ?
3) What explains any differences in treatment preferences between patients and clinicians?
To answer these questions we will conduct a two-phase study of patient and clinician
preferences for health states and treatments. In the first phase of this study we will conduct
structured interviews with patients and clinicians to determine their treatment preferences for
warfarin vs. aspirin treatment to prevent strokes associated with atrial fibrillation. In the second
phase of the study we will convene focus groups of patients and clinicians to explore their
answers to the exercises in the first phase. The ethics committee of the Hospital Sant Pau
(Barcelona, Spain) approved the study.
Setting and target population Setting
We will conduct this study at three cities in Spain (Barcelona, La Coruña and San Sebastian).
For each site several hospitals will collaborate to recruit the required number of cardiologists
and internists. For the recruitment of general practicioners we will recruit from the Primary
Health Care areas that belong to these hospitals in each of the three cities. This multicenter
approach will limit the influence of local views about treatment of atrial fibrillation on the results
of our study and will increase generalizability.
Patients We will enroll patients 60 years of age or older with one or more of the following conditions:
diabetes, hypertension and history of cardiac disease (heart failure and myocardial infarction).
Exclusion criteria include: mini-mental state examination (MMSE) [20] (Folstein) score < 24,
inability to complete the research tasks, history of any form of atrial fibrillation, history of using
warfarin (but not of using aspirin or any other anti-platelet agent since their use is ubiquitous in
the target population), inability to participate because of illness, or unavailability.
Patients with newly diagnosed atrial fibrillation who are contemplating the choice of
antithrombotic therapy to prevent strokes represent the ideal patient population. There are,
however, logistical challenges in prospectively identifying such a group and in ensuring their
participation prior to their making a decision about using or not using antithrombotic therapy.
Not enrolling patients after they have made a decision regarding anticoagulation is crucial to
prevent bias as a result of cognitive dissonance. Cognitive dissonance (a state of psychological
8
discomfort due to inconsistent cognitions) could readily lead patients to modify their
interpretation of information provided during the study to ensure it was consistent with their
previous decision, a decision that may or may not have been well-informed [21] (Draycott S).
The next best choice is to enroll patients at high risk of developing atrial fibrillation who may
have to make this choice in the near future. This proximity to the choice increases the likelihood
that patients will view the exercise as relevant to them and we will obtain meaningful responses
that are reflective of the patients’ true preferences. Thus, the eligible patient will be at high risk
of atrial fibrillation according to data from the Framingham study [6] (Kannel 1998). This study
identified the following risk factors for atrial fibrillation: age, hypertension, diabetes, history of
cardiovascular disease, valvular heart disease, and heart failure. These inclusion and exclusion
criteria are broader than but consistent with eligibility criteria used in our previous work in which
we recruited patients with previous myocardial infarction or heart failure [12] (Devereaux 2001).
Recruitment strategy
We will use several strategies to recruit patients and clinicians for this study. In the case of
patients we will sample them from the different databases of the Health Areas from the three
sites where the study will take place. Each site will provide a random sample of patients fulfilling
eligibility criteria for participation. We will invite these patients to participate initially with a
phonecall from their primary care physician or a delegate from their center. The study
coordinator will follow-up with a phone call to verify eligibility, obtain verbal consent, and set up
an interview date. Patients will give written informed consent to participate.
We will sample practicing clinicians working in general medicine (primary care, family medicine,
internal medicine) and in cardiology, based in the community or in the hospitals. Clinicians who
spend less than 30% of their time seeing patients in the outpatient or inpatient settings or if they
have not cared for a patient with atrial fibrillation in the preceding six months are ineligible to
participate. These eligibility and exclusion criteria should select clinicians who participate in
making decisions about antithrombotic therapy with patients with atrial fibrillation, the most
relevant group for our study. We will send an electronic letter to clinicians inviting them to
participate in this study. A second mailing will follow if the local investigator receives no answer.
Finally, clinicians who have not responded to the 2 mailings will receive a phone call from the
local study investigator (a local colleague) inviting them to enroll.
In our experience, time is the main barrier to clinician participation. We plan to complete each
clinician interview within 30 minutes. To achieve this goal, we will use a highly scripted interview
with extreme economy of items. To ensure the success of the focus groups, we will use multiple
ways to get clinicians to the focus group venue on time. These include, but are not limited to,
sending periodic e-mail reminders, contacting their administrative assistants to include the focus
group on their daily calendars, making same-day reminder phone calls, and arranging for
transportation to the focus group venue, as needed.
9
First phase: the individual interview
The clinical context of this decision study is the use of antithrombotic agents to treat chronic
non-valvular atrial fibrillation. Both patients and clinicians will go through an individual highly
scripted interview. To determine their strength of preference for use of antithrombotic agents we
will conduct a probability trade-off exercise. This will answer the first research question and will
allow us to determine if there is a difference and if present the magnitude of the difference in
strength of preference for treatment between patients and clinicians, the second research
question.
To partially answer the third research question (whether differences in utilities for the relevant
health states explain differences in treatment preferences) we will ask participants to assign
relative value to the relevant health states using a visual analog scale (also known as the
feeling thermometer). The complete elicitation of treatment preferences and utilities will take
approximately 15 minutes. The patients will receive the mini-mental state examination and 2
additional “screening” scenarios to gauge their ability to participate in the probability trade-off
exercise. Thus, we expect patient interviews to take 45 minutes and clinician interviews to take
30 minutes to complete.
To account for order effects, we will randomize the order in which participants complete the
exercises (probability trade-off and feeling thermometer) and the health states within the feeling
thermometer (mild stroke, major stroke, taking warfarin, taking aspirin, severe bleeding).
Clinicians could answer questions thinking about what they would choose for themselves (if
they were to have atrial fibrillation) or what they would recommend to their patients. To eliminate
this ambiguity (and study this potential effect), and following the method by Cohen and Pauker
[22] (Cohen BJ 1994), we will randomize clinicians to instructions that ask them to participate
and complete the preference elicitation tasks in the role of a patient or as a clinician making a
recommendation to a patient.
Prior to the preferences elicitation exercises, patients will complete a brief questionnaire
indicating their age and gender and whether they have personal knowledge of someone who
had a major or a minor stroke, or a major gastrointestinal bleed. Likewise, clinicians will indicate
their demographic characteristics, the number of years in practice, specialty, and experience
with atrial fibrillation, bleeds and strokes.
The health states
The decision to use antithrombotic agents in patients with atrial fibrillation at risk of stroke
involves a choice between aspirin or warfarin use. “No therapy” is a realistic option only for the
lowest risk patients, or those with a serious bleeding problem. Decision analyses [23]
10
(Thompson 2000) and decision support [24] (Man-Son-Hing 1999) investigators have shown
that the choice of antithrombotic therapy is sensitive to preferences for the following health
states: major and minor stroke, major gastrointestinal bleed, and taking either warfarin or aspirin
daily (including the need for periodic monitoring and lifestyle modification with warfarin). We
plan to use the same health state descriptions for stroke and major bleed that we used in a
previous study [12] (Devereaux 2001), which in turn were modified from Man-Son-Hing et al [25]
(Man-Son-Hing 1996). These are almost identical to other descriptions in the literature and have
three advantages: (1) have been published before and were deemed valid to peer investigators
in the field of decision making; (2) have been used with clinicians for the conduct of a decision
study and therefore were deemed valid and understandable to participants similar to those we
propose to enroll for the present study; (3) their use will allow our results to compare to other
studies in this field, including our previous study in a different sample of clinicians.
Probability trade-off
We propose to use the probability trade-off technique to determine the strength of preference
patients and clinicians have for antithrombotic use to prevent strokes associated with atrial
fibrillation. We have described the conduct of the probability trade-off exercise for the same
decision context [12] (Devereaux 2001). During the interview, the researcher, following a pre-
written script, presents information both verbally and visually with the use of colored pictorial flip
charts, known as decision boards (Figure 2). Participants will review the decision boards
describing major and minor stroke, major bleeding, and inconveniences and costs of
treatments. After presenting the descriptions, interviewers will ask participants if the scenarios
reflect their own appreciation of the issues involved in the decision and will note any
discrepancies. Whatever their response, we will ask participants to provide responses assuming
that the scenarios represent an accurate and complete characterization of the health states.
This instruction seeks to reduce information asymmetry between patients and clinicians and
between specialists and generalists. Also, we will use the same decision boards and the same
scripts to interview both patients and clinicians. The only difference in the scripts is that
clinicians, when randomized to respond like a clinician making a recommendation to a patient,
would need to indicate whether they would recommend using warfarin at the given risks while
patients would need to indicate whether they would use warfarin at the given risks.
During the individual interview, we will present complete information about the risks, benefits,
and inconveniences of warfarin and aspirin. To demonstrate how we will determine a patient’s
threshold for accepting a treatment we will discuss the scenario for determining the maximum
bleeding increase acceptable for warfarin therapy (i.e. the bleeding threshold for warfarin) in a
comparision of warfarin vs. aspirin.
The scenario is based on the absolute effects of both drugs on 100 patients over a two-year
period. We will use a probability trade-off with the elicitation method of “ping-ponging” to
determine participant’s thresholds. The interviewer will systematically vary the risk of bleeding
11
with warfarin (alternating between high and low risk of bleeding) to determine the maximum
acceptable increase in the risk of bleeding with warfarin, given a fixed reduction in the risk of
stroke with warfarin relative to a fixed risk of bleeding and stroke with aspirin. The alternating
presentation of high and low risk of bleeding may reduce “start point bias” resulting from starting
the exercise at the point of known efficacy and safety of the medications.
Given the risk of bleeding with aspirin is two patients in a hundred (over a two year period) we
will offer probabilities from 0 additional bleeds with warfarin to 38 additional bleeds with the use
of two sets of flipcharts (one exploring up to 17 and one exploring up to 38 additional
bleedings). In our previous study, we compared warfarin versus no treatment and the mode for
patients’ bleeding threshold was 22 additional bleeds per 8 fewer strokes with warfarin therapy
(10.3 [6.1] and 17.4 [7.1] additional bleeds for physicians and patients respectively) [12]
(Devereaux 2001). The 22 additional bleeds corresponded to the maximum bleeding threshold
explored. Since in this proposal the number of strokes avoided is 3 (in the comparison of
warfarin versus aspirin), we will increase the range explored by going up to 38 additional
bleeds. Additionally, in the case of participants willing to take warfarin given an increased risk of
an additional 38 bleeds, we will ask them, without the use of flipcharts, what is the maximum
number of bleeds they would accept before switching to aspirin (being 100 the maximum). This
range should ensure capturing the preferences of all clinicians and most patients interviewed.
Initially, participants will complete two eligibility scenarios that compare the outcomes of stroke
and bleeding with two ficticious drugs with the same adverse effects, burdens and cost, but with
major differences in terms of stroke reduction. If participants do not select the medication with
the higher stroke reduction in both instances they will be excluded as their choice reflects
inadequate comprehension.
The decision boards will reflect the best available evidence, namely from the meta-analysis of
warfarin vs. aspirin for atrial fibrillation [11] (van Walraven 2002) (Table 1). Our scenario will
start with a statement of the baseline risk—“with aspirin treatment there is a baseline risk of a
major or minor stroke over the next two years of 8 patients out of 100 and a risk of severe
bleeding over the next two years of two patients out of 100. In the case of warfarin there is a
baseline risk of major or minor stroke over the next two years of 5 patients out of 100”. We will
then present that risk of bleeding using a flipchart. In this first flipchart we will start randomly
with either no additional bleedings or with up to 17 additional bleeds. If the participant decides
that she would still take warfarin with 17 additional bleeds, with the help of a second flipchart,
we will offer up to 38 additional bleeds (starting either at 18 additional bleeds or at 38 and using
the same “ping-ponging” method). In the case of a patient or physician accepting the 38
additional bleeds we will ask her what is the maximum number of bleeds she would accept
before switching to aspirin.
12
We will present patients and clinicians with the choice between warfarin and aspirin use as we
think that is the dominant choice for patients with atrial fibrillation at average risk of stroke. For a
group, perhaps as large as 20% of patients with atrial fibrillation (i.e., young patients without
hypertension, diabetes, or previous stroke) the pertinent choice may be between aspirin and no
antithrombotic therapy [26] (van Walraven 2003). This group will not be represented in our
intended sample of patients (i.e., individuals at risk of atrial fibrillation >60 years-old, with
hypertension, diabetes, or previous cardiovascular events). Adding this choice (or the choice of
warfarin vs. no antithrombotic therapy) to the probability trade-off would require more time than
feasible during clinician interviews. More importantly, the choice between warfarin and aspirin is
most likely to demonstrate omission bias (physicians may place a relatively higher value on
avoiding a bleed than on avoiding a stroke because they do not witness the strokes they have
prevented) or differences in values and preferences between patients and clinicians, if these
were present. Therefore, we will limit the probability trade-off exercises to the choice of warfarin
vs. aspirin.
The feeling thermometer
To further understand the treatment preferences elicited using the probability trade-off and
capture the values patients and clinicians place on the health states that may result from their
choice, namely strokes and bleeds, we will conduct preference-elicitation exercises using the
feeling thermometer, a visual analogue scale [27,28] (Schünemann HJ 2003, 2004). When
completing the feeling thermometer patients choose the score on the thermometer that
represents the value they place on the health state they are being asked to evaluate. The
feeling thermometer is anchored at death (0) and perfect health (100). The feeling thermometer
will allow us to check understanding of the relative severity of the health states in question (i.e.,
patients should assign a lower value (a value closer to 0) to a major stroke with severe and
permanent disability than a minor stroke).
Because the visual analogue scales may be prone to context bias, that is rating of one state
may influence rating of other states [29,30], (Robinson 2001, Bleichrodt H 1997) we will
randomize the order in which participants will consider the health states to minimize this bias.
We will ask participants to consider the following health states one at a time on the feeling
thermometer:
� Major and minor strokes. We will inform patients that the sequelae of the stroke will last
for the patient’s life expectancy.
� Severe bleed. We will inform patients that they will have a major bleed within the first
year of taking the antithrombotic agent but will not have another severe bleeding event
for the rest of their life
� Taking warfarin
� Taking aspirin
13
The second phase: the focus groups
Qualitative research methods are well suited to study personal meaning, perceptions, beliefs,
and values [31] (Berg 1989). These methods are therefore appropriate to provide clinicians and
patients with the opportunity to make explicit the thinking process, and explore the various
hypotheses suggested as to why participants hold the views they do. Individual in-depth
interviews and focus groups could provide this information. The individual clinician interviews
will create an appropriate mindset for participants to consider in the focus groups why they hold
the views they do. An important advantage of focus groups over in-depth personal interviews is
the opportunity to explore dynamic interactions among the group members. These interactions
include sharing of ideas and insights, stimulating others to consider the issues that may underlie
their own preferences, and exploring areas of consensus and dissensus [32] (Morgan 1998).
Thus, the focus groups are most likely to offer plausible explanations of clinicians’ and patients
treatment choices and the reasons for any inconsistency of these choices with their utilities for
the health states of interest. If our results of the first phase confirm our preliminary findings, then
these explanations will shed light on differences in preferences between clinicians and patients.
Setting and participants
At each of the 3 sites we will convene focus groups of clinicians and patients. We will follow the
recommendation to keep the focus groups as homogeneous as possible in terms of preferences
regarding the bleeding threshold [32] (Morgan 1998). To the extent that group members
perceive others around the table as similar to themselves, they may feel safe to express
themselves while expecting understanding and respect from the other members. We plan to
convene six focus groups in total (3 of clinicians and 3 of patients). These numbers relate to our
experience with focus groups and their information yield and to what is feasible for this
proposal. Members of the focus group will be recruited from phase I to represent different
preferences
Group configuration and data collection
Each group will have 10 participants per session, a trained facilitator (a clinician) and an expert
assistant (not a clinician) [32] (Morgan 1998). The facilitator leads the focus group, facilitates
the group ensuring that all participate, ensures that the group completes the agenda on time,
and monitors and manages the group dynamic. The assistant (i.e., an expert qualitative
researcher) will participate in all focus groups at all site and will document seating
arrangements, the first words of each member, take notes on interaction dynamics and
nonverbal behaviors, and operate the tape recorders. A digital tape recorder (and a backup)
equipped with tabletop microphones will document all acoustic data for later transcription. The
setting will be a small conference room in the hospital or primary care center. We will pay
particular attention to issues related to noise, will limit interruptions once the focus group
14
dynamic begins, and will keep the meeting on time. Participants will spend about 90 minutes
discussing the agenda described in the following section.
Focus group agenda
The goals of the focus group are to educate the members about the results of the individual
interviews, and to explore why clinicians and patients have the preferences they do. The
facilitator will first ask about this in an open ended way, allowing participants to express their
views in their own words in order to explore what reasons they give. Another goal of the focus
groups is to get members to make explicit their thinking process that led to those preferences,
and to explore the various hypotheses suggested (e.g., omission bias, avoidance of clinician-
associated risk) as to why clinicians hold the views they do. The facilitator will start the
proceedings by setting ground rules, making introductions, and using warm-up exercises to set
a comfortable and open environment for exchange of ideas.
To achieve the research goals of the focus group, the facilitator will guide focus group members
through a structured process: The facilitator will first present results from the individual
interviews. Aggregate data will be presented and in addition, each participant will receive the
results of their individual responses during the preference elicitation exercises. The facilitator
will then elicit member responses to open–ended questions that he will pose to the group about
these findings. For example, the facilitator will check that group members understand the
findings before further discussion. Then, the facilitator will ask whether group members are
surprised about the findings and if so, why or why not. They will be asked to comment on why
they hold the particular treatment preferences expressed in the individual exercises. This will be
followed with more structured elicitation exercises. The facilitator will contrast the results of the
treatment preference exercise with the results of the feeling thermometer exercises to the extent
that these exercises reveal, on average, different apparent values placed upon the health
states. In addition, the following contrasts will be presented to initiate or continue discussion
with the group:
� Direct contrast of the choices and strength of preferences for antithrombotic treatment
of the average clinician in the focus group and of the average patient in the study (i.e.,
the number of additional bleeds that clinicians and patients are willing to tolerate to
prevent an additional stroke at the point of indifference between using warfarin and
using aspirin).
� Direct contrast of the average utilities for stroke, bleeding, and using antithrombotic
agents between patients and clinicians.
To promote and focus debate the facilitator may ask the following questions to the group (if
appropriate given the results):
15
� Can you describe, in your own words, the thought processes you went through in
making your decisions during the probability trade-off and feeling thermomether
exercises?
� Do you think that your answers to probability trade-off and feeling thermomether are
consistent with each other? Why or why not?
� Which one of the exercises (probability trade-off, feeling thermomether) do you think
captured more accurately the true relative values you place on avoiding bleeds and
preventing strokes? Why?
Depending on the results during phase 1 (individual interviews), other questions could be
relevant, including the following:
� You placed a relatively higher value on bleeding and a relatively lower value on stroke
when making a decision (probability trade-off) than when we looked at those outcomes
separately (feeling thermomether). Why?
� Can you think of plausible explanations for the differences between clinicians and
patients choices and preferences for treatment?
� Can you think of plausible explanations for the differences between the answers that
clinicians gave when they participated as patients and when they participated as
clinicians?
Analysis plan
Research question 1: When assessed systematically, do patients’ and clinicians’ preferences
explain the apparent underutilization of warfarin to prevent strokes associated with atrial
fibrillation?
Description of treatment preferences: We will use probability trade-off results to determine the
number of additional bleeds that participants are willing to tolerate per stroke prevented with
warfarin at the point of switch to aspirin. We will call this variable b. We will describe the
distribution of b in clinicians grouped by age, gender, years in practice, specialty, experience
with atrial fibrillation, experience with bleeds and strokes, and whether they participated as
clinicians or as patients. We will also describe b in patients grouped by age and gender, and by
personal knowledge of someone who had a major or a minor stroke, or a major gastrointestinal
bleed. We will also describe the distribution of b in clinicians and patients by site. We will
conduct exploratory linear regression analysis using b as the dependent variable and clinician
characteristics listed above as the independent variables. The results of this analysis will guide
our choices for subgroup analyses to answer Research Question 2.
Research question 2: To what extent do patients’ and clinicians’ treatment preferences differ?
16
Differences in treatment preferences between patients and clinicians: We will test the difference
of the means of b between the patients (bp) and clinicians (bc ) using an unpaired t test. The
observed distribution of bp in our preliminary work was highly skewed. This was because
patients clustered at the highest b offered. For this study, we propose to offer a maximum b that
is twice as large as the maximum b offered in our preliminary study. Furthermore, we will be
studying a relatively large number of patients and clinicians with distribution of the means
approximating the normal distribution with SEM = SD/√n. Our sample sizes will be considerably
larger than 30, a size which is often taken as a guideline threshold, above which the sample
distribution of the sample mean will be reasonably normally distributed, even if the distribution of
individual values is substantially skewed. Thus, the use of the t-test is appropriate. However, we
will also use the Mann-Whitney test, a non-parametric test that does not require the assumption
of normality of the distribution. After identifying pertinent subgroups in the analysis to Research
Question 1, we will conduct modified t tests to test the difference of the means of b between the
patients and the subgroup of clinicians of interest. A modified t test is based on the pooled
estimate of variance from all the subgroups [33] (Altman 2001). The resulting P values can be
adjusted for multiple comparisons using the Bonferroni method (multiplying the resulting P value
by the number of paired comparisons performed).
We will also determine the proportion of patients and clinicians who would choose to take or
recommend warfarin when b = 0.5 (that is, when patients experience one bleed for every two
strokes prevented). We designate this value of b as bRCT because it is the average number of
additional bleeds per stroke prevented reported in randomized trials of warfarin vs. aspirin from
the meta-analysis [11] (van Walraven 2002) (Table 1). We will test the difference in these
proportions using Fisher’s exact test and will estimate the exact 95% confidence interval of the
odds ratio for the proportions of patients and clinicians who would use warfarin at bRCT. We will
also determine the proportion of clinicians from pertinent subgroups (identified in Research
Question 1) who would choose to recommend warfarin at bRCT = 0.5. Then, we will test the
differences between this proportion and the proportion of clinicians not in the subgroup
recommending warfarin when b=0.5, as well as the difference between the proportion
recommending in the subgroup and the proportion of patients who would choose to take
warfarin at bRCT.
Research question 3: What explains any differences in treatment preferences between patients
and clinicians?
Differences in utilities between patients and clinicians: In responding to the feeling thermometer,
each participant will provide 5 utilities (for major and minor stroke, major bleed, using daily
aspirin, using daily warfarin). We will compare the distributions of each of these utilities in
patients and clinicians using the Mann-Whitney test, a nonparametric test, as these variables
are usually highly skewed. We will also use the t test to test the difference of the means of the
17
utilities between patients and clinicians. To evaluate the consistency between participant utilities
for health states and b (that is, the number of additional bleeds per stroke prevented at the point
of switch from warfarin to aspirin in the probability trade-off exercise) we will examine scatter
plots of each of the utilities and b. Also, we will estimate the correlations between each of the
utilities for the 5 health states and b. We will conduct linear regression analysis with b as
dependent variable and with utilities as independent variables. We will attend to the interaction
between the utilities, which we anticipate being a key issue, in this analysis.
Analysis of focus group data: Data from the 6 focus groups sessions will be transcribed
verbatim and checked for accuracy by comparing the written text to each audio tape. Initially,
two experienced researchers in qualitative methods using an editing approach [34] (Creswell
1998) will work independently to develop a coding system to identify the major themes from
data contained in two of the focus groups transcripts. The researchers will then meet to
compare the consistency and meaning of the codes developed and their application in the first
set of two transcripts. Based on these results, researchers will then modify the coding scheme
based and establish an audit trail [35] (Wolcott H 1994). Then, the two researchers, working
independently, will code two further focus group transcripts using the coding scheme and again
compare results, discussing and resolving any disagreements. This iterative process will
continue until researchers finish coding all the transcripts. The codes (themes) developed will
focus on capturing the kinds of thought processes and rationales that clinicians used to make
their treatment preferences in the first phase interviews. In the focus group, clinicians will
receive feedback on the results of the first phase interviews to set the context for the discussion
of reasons for these preferences. The results will include the distribution of preferences of
patients and clinicians, differences in these distributions, and the degree of internal consistency
between clinicians’ treatment preferences and their utilities for the relevant health states.
Data from focus groups transcripts will be entered into Atlas.ti (http://www.atlasti.com/), a
computer friedly software program that assists with data management, search, and retrieval of
textual information [35] (Wolcott H 1994). Data analysis will occur at three different levels:
description, analysis, and interpretation [36] (Miles 1994). In terms of description, we will
develop a structured form to summarize key information from each focus group transcript. We
will also describe data segments from the transcripts and code them by theme. Next, we will
undertake a comparative a nalysis of themes across the six focus groups as a whole to identify
similarities and differences in the data. Finally, we will identify how participants think about the
underlying thought processes they used to determine their preferences and point out
implications for practice. During the data analysis and write up stages, we will ask clinicians
from each focus group to review and provide feedback on the written summary prepared for
their specific group in order to ensure that these summaries accurately reflect the key themes
from the participants’ perspective [32,37,38] (Morgan 1998, Marshall 1999, Patton M 2001).
18
Sample size estimation: We require six focus groups, 1 of generalists and 2 of cardiologists at
Barcelona, 1 of generalist at Galicia and País Vasco. We will undertake 1 group of patiens in
each site. Ideally, each group should have 8 to 10 participants. We anticipate that not every
clinician will be able to participate. To ensure 8 clinicians per group, we will enroll 12 potential
participants per group. We will construct the focus groups to maximize homogeneity of
specialty, experience with patients with atrial fibrillation, and treatment preferences during
individual interviews (phase 1). From our survey of faculty at the 3 sites, less than 10% of
clinicians at each site are not eligible. Therefore we would need to enroll 20% of eligible
clinicians at each site to achieve our sample size of 96 clinicians which will ensure adequate
numbers for the focus groups.
Our study should be powered to determine differences in means of bp and bc, that is, differences
in the treatment preferences of patients and clinicians, the key variable. In our previous study,
the effect size (difference in mean b between patients and clinicians) was 0.9 (this is calculated
from sample means (and SDs) of 2.2 (0.9) and 1.3 (0.8) in the patients and clinicians,
respectively). Although it is not immediately evident what magnitude of the difference in b would
be clinically important, readers and commentators have uniformly considered the differences we
showed as important. Table 2 shows the power we would have with the proposed sample size
of 96 clinicians and an equal number of patients, and also illustrates the limited impact of
increasing the number of patients from 1:1 to 1:3. Therefore, given the number of clinicians
available to us, we will have ≥ 80% power to detect differences in means ≥ 0.4·SD. We will have
≥ 80% power to detect differences in means of bp and bc ≥ 0.75·SD between subgroups of ≥ 20
clinicians and 96 patients. In summary, after enrolling 96 patients and 96 clinicians we will have
≥ 80% power to detect (1) bp – bc > 0.4 SD, (2) odds ratio ≥ 2.6 of the proportion of patients and
clinicians with b > bRCT (if that proportion is 0.63 or smaller among clinicians), and (3) a
difference in mean utilities of ≥ 0.4 SD. We need to enroll 96 clinicians to ensure 8 members per
focus group. Enrolling more than 96 patients has a very small impact on power. Thus, we will
recruit 96 patients and 96 clinicians for this study.
19
Discussion:
Thousands of patients with atrial fibrillation will suffer preventable strokes this year because
they do not receive anticoagulation. A number of lines of evidence, including our own prior
study, suggest that differences between clinician and patient preferences regarding warfarin
versus alternative management of atrial fibrillation may explain this apparent underutilization of
anticoagulation. If this is so, development and testing of interventions to increase rates of
anticoagulation in patients with atrial fibrillation should become a matter of urgency.
The evidence is not, however, strong enough to justify proceeding confidently with the
development and testing of such interventions. In particular, we have identified methodological
limitations in our prior work that raise the possibility that a different understanding of the options
presented may explain differences in clinicians and patients choice. We now propose to repeat
our prior study with a stronger methodology that will allow us to determine the true explanation
of the results. We may find that, when they understand the options in a similar way, clinicians
and patients make similar choices. If this proves to be the case, it would suggest that the low
rates of anticoagulation in patients with atrial fibrillation reflect a shared aversion to bleeding risk
in clinicians and patients. Such a finding would prompt the conclusion that current rates of
anticoagulation are, in fact, appropriate.
Our review of the evidence suggests that it is more likely that we will confirm substantially
different treatment choices in clinicians and patients. This result would suggest that current low
rates of anticoagulation in atrial fibrillation reflect clinician and not patient values, and mandate
urgent development and testing of interventions to increase rates of anticoagulation, and thus
prevent unnecessary strokes. Such findings would not, however, explain why clinician and
patient choices differ. We see two leading possibilities. One is that, relative to patients,
clinicians experience the post-stroke state as relatively less aversive, and having a
gastrointestinal bleed as relatively more aversive, than do patients. The second explanation is
that clinicians and patients share the same values for stroke and bleeding, but the
circumstances of clinical decision-making lead clinicians to make different choices. In particular,
we hypothesize that omission bias associated with efforts to reduce clinician-generated risk,
may explain the results. This explanation posits that clinicians put more weight on commission
of a behavior that leads to adverse consequences (bleeding through warfarin administration)
than an omission of behavior that could lead to beneficial consequences (stroke prevention
through warfarin administration). We will explore this issue through direct measurement of
utilities for stroke and bleeding, and through focus groups with the participating clinicians.
On completion of this study, we will hope to achieve major advances in understanding clinician
and patient decision-making in atrial fibrillation. Our anticipated results will challenge
investigators, medical educators, and health care providers to develop and test strategies to

20
deal with differences in clinician and patient choices. Our results will guide the development of
these strategies, which may include innovations in undergraduate and post-graduate education,
enhancements to the clinical encounter to facilitate patient-clinician communication and shared
decision-making, increasing use of decision support tools in clinical practice, and monitoring
and feedback of clinician success in providing optimal anticoagulation in patients with atrial
fibrillation. For example, our experience using decision boards in this study will inform the
organization and conduct of a randomized controlled trial to test their efficacy in helping patients
with atrial fibrillation make informed choices.
21
Abbreviations AF: atrial fibrillation , EC=extracranial, N: sample size, SD: standard deviation, SEM: Standard error of the mean. Competing interests The authors declare that they have no competing interests. Authors' contributions VM, GG, HS, PD, CC and PA-C participated in the conception and design of the protocol and drafted a first version. All authors participated in revising it critically for important intellectual content and have given final approval of the version to be published.
Acknowledgements We would like to thank Peggi Austin for her help with the interview preparation and Gema Mas and Esther Cánovas for their help with the data collection. This project is funded with a grant from the Instituto de Salud Carlos III, Ministerio de Sanidad, Spain (PI06/90391).
22
References
1. Go AS, Hylek EM, Phillips KA, Chang Y, Henault LE, Selby JV, Singer DE. Prevalence of diagnosed atrial fibrillation in adults: national implications for rhythm management and stroke prevention: the AnTicoagulation and Risk Factors in Atrial Fibrillation (ATRIA) Study. JAMA 2001, 285:2370–5.
2. Feinberg WM, Blackshear JL, Laupacis A, Kronmal R, Hart RG. Prevalence, age distribution, and gender of patients with atrial fibrillation. Analysis and implications. Arch Intern Med 1995, 155:469 –73.
3. Heeringa J, van der Kuip DA, Hofman A, Kors JA, van Herpen G, Stricker BH, Stijnen T, Lip GY, Witteman JC. Prevalence, incidence and lifetime risk of atrial fibrillation: the Rotterdam Study. Eur Heart J 2006, 27:949–53.
4. Lip GY, Tse HF: Management of atrial fibrillation. Lancet 2007,
18;370(9587):604-18. 5. Fuster V, Rydén LE, Asinger RW, Cannom DS, Crijns HJ, Frye RL et al.
ACC/AHA/ESC guidelines for the management of patients with atrial fibrillation. A report of the American College of Cardiology/American Heart Association Task Force on Practice Guidelines and the European Society of Cardiology Committee for Practice Guidelines and Policy Conferences (Committee to develop guidelines for the management of patients with atrial fibrillation) developed in collaboration with the North American Society of Pacing and Electrophysiology. Eur Heart J 2001, 22(20):1852-1923.
6. Kannel WB, Wolf PA, Benjamin EJ, Levy D: Prevalence, incidence, prognosis,
and predisposing conditions for atrial fibrillation: population-based estimates. Am J Cardiol 1998, 82(8A):2N-9N.
7. Hart RG, Benavente O, McBride R, Pearce LA. Antithrombotic therapy to
prevent stroke in patients with atrial fibrillation: a meta-analysis. Ann Intern Med 1999, 131(7):492-501.
8. Bungard TJ, Ghali WA, Teo KK, McAlister FA, Tsuyuki RT. Why do patients with
atrial fibrillation not receive warfarin?. Arch Intern Med 2000, 160(1):41-46. 9. Weisbord SD, Whittle J, Brooks RC. Is warfarin really underused in patients
with atrial fibrillation?. J Gen Intern Med 2001, 16(11):743-749. 10. Beyth RJ, Quinn LM, Landefeld CS. Prospective evaluation of an index for
predicting the risk of major bleeding in outpatients treated with warfarin. Am J Med 1998, 105(2):91-99.
11. Van Walraven C, Hart RG, Singer DE, Laupacis A, Connolly S, Petersen P,
Koudstaal PJ, Chang Y, Hellemons B. Oral anticoagulants vs aspirin in nonvalvular atrial fibrillation: an individual patient meta-analysis. JAMA 2002, 288(19):2441-2448.
12. Devereaux PJ, Anderson DR, Gardner MJ, Putnam W, Flowerdew GJ, Brownell
BF, Nagpal S, Cox JL. Differences between perspectives of physicians and patients on anticoagulation in patients with atrial fibrillation: observational study. BMJ 2001, 323(7323):1218-1222.
23
13. Eckman MH, Falk RH, Pauker SG. Cost-effectiveness of therapies for patients with nonvalvular atrial fibrillation. Arch Intern Med 1998, 158(15):1669-1677.
14. Eckman MH, Levine HJ, Salem DN, Pauker SG. Making decisions about
antithrombotic therapy in heart disease: decision analytic and cost-effectiveness issues. Chest 1998, 114(5 Suppl):699S-714S.
15. Naglie IG, Detsky AS. Treatment of chronic nonvalvular atrial fibrillation in the
elderly: a decision analysis. Med Decis Making 1992, 12(4):239-249. 16. Gage BF, Cardinalli AB, Albers GW, Owens DK. Cost-effectiveness of warfarin
and aspirin for prophylaxis of stroke in patients with nonvalvular atrial fibrillation. Jama 1995, 274(23):1839-1845.
17. Thomson R, Parkin D, Eccles M, Sudlow M, Robinson A. Decision analysis and
guidelines for anticoagulant therapy to prevent stroke in patients with atrial fibrillation. Lancet 2000, 355(9208):956-962.
18. Robinson A, Thomson R, Parkin D, Sudlow M, Eccles M. How patients with atrial
fibrillation value different health outcomes: a standard gamble study. J Health Serv Res Policy 2001, 6(2):92-98.
19. Rottenstreich Y, Tversky A. Unpacking, repacking, and anchoring: advances in
support theory. Psychol Rev 1997, 104(2):406-415. 20. Folstein M, Folstein S, McHugh P. "Mini-mental state". A practical method for
grading the cognitive state of patients for the clinician. J Psychiatr Res 1975, 12:189-198.
21. Draycott S, Dabbs A. Cognitive dissonance. 1: An overview of the literature
and its integration into theory and practice in clinical psychology. Br J Clin Psychol 1998, 37(Pt3):341-353.
22. Cohen BJ, Pauker SG. How do physicians weigh iatrogenic complications?. J
Gen Intern Med 1994, 9(1):20-23. 23. Thomson R, Parkin D, Eccles M, Sudlow M, Robinson A. Decision analysis and
guidelines for anticoagulant therapy to prevent stroke in patients with atrial fibrillation. Lancet 2000, 355(9208):956-962.
24. Man-Son-Hing M, Laupacis A, O'Connor AM, Biggs J, Drake E, Yetisir E, Hart RG. A patient decision aid regarding antithrombotic therapy for stroke prevention in atrial fibrillation: a randomized controlled trial. Jama 1999, 282(8):737-743.
25. Man-Son-Hing M, Laupacis A, O'Connor A, Wells G, Lemelin J, Wood W, Dermer M. Warfarin for atrial fibrillation. The patient's perspective. Arch Intern Med 1996, 156(16):1841-1848.
26. Van Walraven C, Hart RG, Wells GA, Petersen P, Koudstaal PJ, Gullov AL,
Hellemons BS, Koefed BG, Laupacis A. A clinical prediction rule to identify patients with atrial fibrillation and a low risk for stroke while taking aspirin. Arch Intern Med 2003, 163(8):936-943.
27. Schünemann HJ, Guyatt GH, Griffith L, Stubbing D, Goldstein R. A clinical trial to
evaluate the responsiveness and validity of two direct health state preference
24
instruments administered with and without hypothetical marker states in chronic respiratory disease. Medical Decision Making 2003, 23:140-149.
28. Schünemann HJ, Armstrong D, Fallone C, Barkun A, Degli’Innocenti A, Heels-
Ansdell D, Wiklund I, Tanser L, Chiba N, Austin P, Van Zanten S, El-Dika S, Guyatt GH. A Randomized Multi-Center Trial to Evaluate Simple Utility Elicitation Techniques in Patients with Gastro Esophageal Reflux Disease. Medical Care 2004, 42(11):11-42.
29. Robinson A, Loomes G, Jones-Lee M. Visual analog scales, standard gambles,
and relative risk aversion. Med Decis Making 2001, 21(1):17-27. 30. Bleichrodt H, Johannesson M. An experimental test of a theoretical foundation
for rating-scale valuations. Med Decis Making 1997, 17(2):208-216. 31. Berg B. Introduction. Qualitative Research Methods. Needham Heights,
Massachusetts: Allyn and Bacon; 1989:1-12. 32. Morgan D. What do you get from focus groups? The Focus Group Guidebook.
Thousand Oaks, California: Sage Publications, Inc; 1998:55-64. 33. Altman D. Comparing groups - continuous data. Practical Statistics for Medical
Research. London: Chapman & Hall; 1991:210-212.: Sage Publications; 2001. 34. Creswell J. Qualitative inquiry and research design: Choosing among five
traditions. Thousand Oaks, California: Sage Publications; 1998. 35. Wolcott H. Description, analysis, and interpretation in qualitative inquiry.
Transforming Qualitative Data: description, analysis, and interpretation. Thousand Oaks, California: Sage Publications; 1994:9-54.
36. Miles M, Weitzman E. Choosing computer programs for qualitative data
analysis. In: Miles M, Huberman A, eds. Qualitative Data Analysis. An expanded sourcebook. 2 ed. Thousand Oaks, California: Sage Publications; 1994:311-317.
37. Marshall C, Rossman G. Designing qualitative research. 3 ed. Thousand Oaks,
California: Sage Publications; 1999. 38. Patton M. Qualitative evaluation and research methods. 2 ed. Newbury Park,
California.

25
Figure legends Figure 1. Bleeding thresholds for warfarin [12] Figure 2. Section of the decision board for probability trade-off [1] comparing outcomes of 2 years of warfarin use vs. aspirin among 100 patients with atrial fibrillation, as used in our preliminary study [12].
26
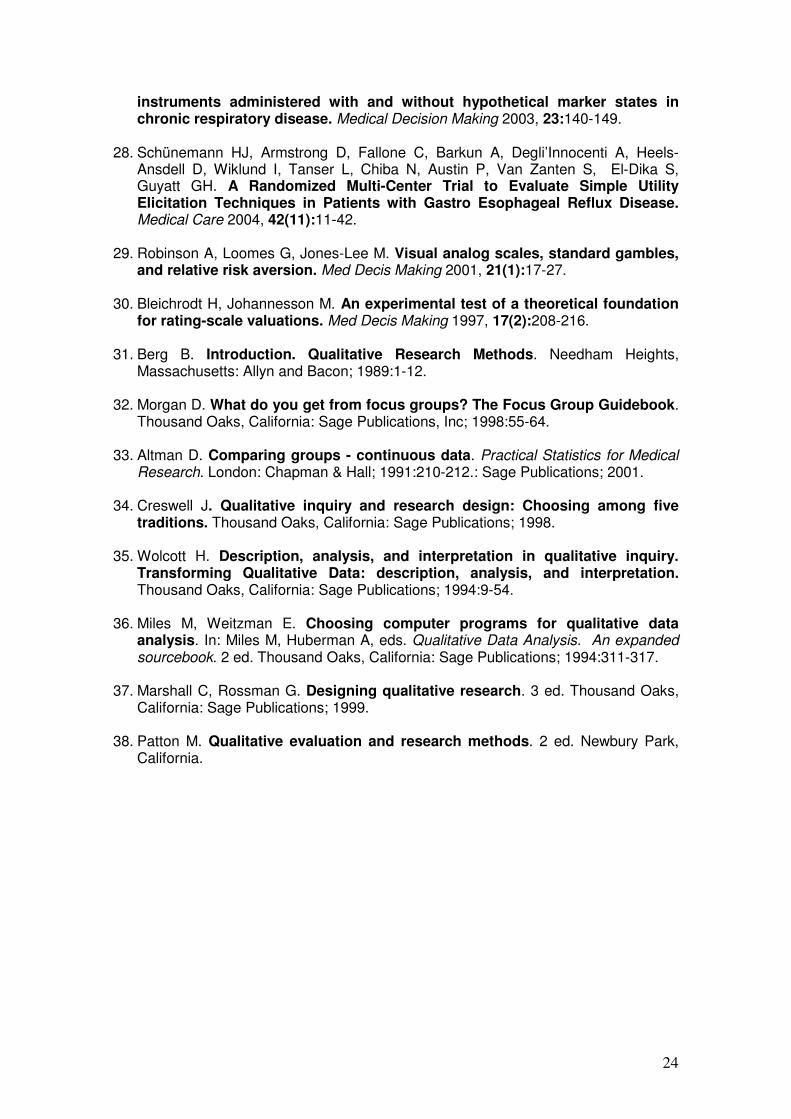
Table 1. Summary of results of meta-analysis of warfarin vs. aspirin in patients with atrial fibrillation [11].
Risk % for 2 years Aspirin* Warfarin Difference
between aspirin and warfarin
Stroke
All stroke 7.8 5.0 2.8 Ischemic stroke 7.4 4 3.4 Fatal ischemic stroke 0.925 0.5 0.425 Hemorrhagic stroke 0.4 1.0 -0.6 Fatal hemorrhagic stroke
0.19 0.35 -0.16
Total stroke deaths 1.15 0.85 0.3 All deaths** 10.2 9.4 0.8 Bleeds
EC bleeding*** 2 3.4 -1.4 Fatal EC bleeding 0.175 0.32 -0.145 *, Data correspond to the aspirin alone arms with exclusion of the aspirin + low-dose warfarin arms of the pooled studies; **, including stroke deaths, cardiovascular deaths, but not extracranial bleeding deaths; ***, EC=extracranial, mostly severe gastrointestinal bleeds requiring admission to hospital, 2 units of blood, or surgery.

27
Table 2. Power to detect differences in means of bp and bc 0.2 to 0.5 standard deviation units (α = 0.05)
Sample bp – bc difference in SD units
Clinicians Patients 0.2 0.3 0.4 0.5 96 96 .28 .54 .79 .93 96 144 .33 .62 .86 .97 96 192 .36 .67 .89 .98 96 288 .39 ,71 .92 .99
Maximum acceptable No. of excess bleeds
22
21
20
17
16
14
12
11
10987654321
No
. o
f re
spo
nd
ers
40
30
20
10
0
Patients (n=61)
Clinicians (n=63
Figure 1
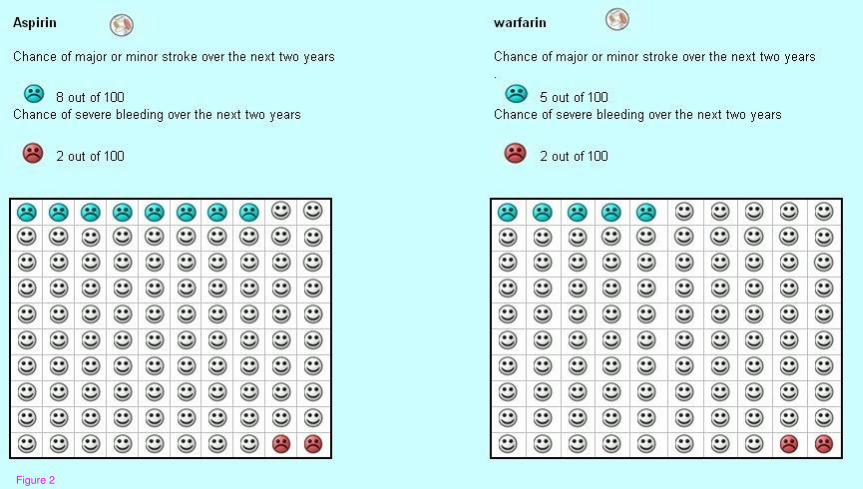
Figure 2