Embed Size (px)
Citation preview
This Provisional PDF corresponds to the article as it appeared upon acceptance. Fully formattedPDF and full text (HTML) versions will be made available soon.
World Health Organization fracture risk assessment tool in the assessment offractures after falls in hospital
BMC Health Services Research 2010, 10:106 doi:10.1186/1472-6963-10-106
Shin-ichi Toyabe ([email protected])
ISSN 1472-6963
Article type Research article
Submission date 13 July 2009
Acceptance date 27 April 2010
Publication date 27 April 2010
Article URL http://www.biomedcentral.com/1472-6963/10/106
Like all articles in BMC journals, this peer-reviewed article was published immediately uponacceptance. It can be downloaded, printed and distributed freely for any purposes (see copyright
notice below).
Articles in BMC journals are listed in PubMed and archived at PubMed Central.
For information about publishing your research in BMC journals or any BioMed Central journal, go to
http://www.biomedcentral.com/info/authors/
BMC Health Services Research
© 2010 Toyabe , licensee BioMed Central Ltd.This is an open access article distributed under the terms of the Creative Commons Attribution License (http://creativecommons.org/licenses/by/2.0),
which permits unrestricted use, distribution, and reproduction in any medium, provided the original work is properly cited.
- 1 -
World Health Organization fracture risk assessment tool in the
assessment of fractures after falls in hospital
Shin-ichi Toyabe
Niigata University Crisis Mangement Office, Niigata University Hospital, Asahimachi-dori 1-754, Chuoku,
Niigata City 951-8520, Japan
Email addresses:
- 2 -
Abstract
Background
Falls are very common accidents in a hospital. Various risk factors and risk assessment tools are used to
predict falls. However, outcomes of falls such as bone fractures have not been considered in these risk
assessment tools, and the performance of risk assessment tools in a Japanese hospital setting is not clear.
Methods
This was a retrospective single-institution study of 20,320 inpatients aged from 40 to 90 years who were
admitted to a tertiary-care university hospital during the period from April 2006 to March 2009. Possible
risk factors for falls and fractures including STRATIFY score and FRAX™ score and information on falls
and their outcome were obtained from the hospital information system. The datasets were divided randomly
into a development dataset and a test dataset. The chi-square test, logistic regression analysis and survival
analysis were used to identify risk factors for falls and fractures after falls.
Results
Fallers accounted for 3.1% of the patients in the development dataset and 3.5% of the patients in the test
dataset, and 2.6% and 2.9% of the fallers in those datasets suffered peripheral fractures. Sensitivity and
specificity of the STRATIFY score to predict falls were not optimal. Most of the known risk factors for falls
had no power to predict fractures after falls. Multiple logistic analysis and multivariate Cox’s regression
analysis with time-dependent covariates revealed that FRAX™ score was significantly associated with
fractures after falls.
Conclusions
Risk assessment tools for falls are not appropriate for predicting fractures after falls. FRAX™ might be a
useful tool for that purpose. The performance of STRATIFY to predict falls in a Japanese hospital setting
was similar to that in previous studies.
Background Falls are very common accidents in a hospital [1]. Falls in a hospital often cause severe injuries such
as bone fractures, soft tissue injuries and hematomas. About 3-10% of falls in hospitals result in physical
injuries including fractures [2]. Risk of hip fracture has been shown to be eleven-times greater in hospital
- 3 -
patients than in the general community [3]. These injuries may lead to additional healthcare costs, prolonged
length of hospital stay and psychological distress for the patients. This situation might result in complaints
and litigation from families of the patients [4].
A strategy that has been shown to be successful in preventing falls of inpatients is a target prevention
strategy by selecting patients at high risk for falls [5-7]. Several clinical characteristics have been shown to
be associated with increased incidence of falls in a hospital, and various risk assessment tools for falls have
been developed [4, 8-13]. In Japan, even the performance of popular risk assessment tools for inpatient falls
has not been examined, making international comparison difficult [1, 12]. A more important problem of
these risk assessment tools is that these tools were developed to find patients at high risk for falls and not to
predict patients who would suffer physical injuries after falls. In reality, more than 90% of inpatient falls do
not result in physical injuries [2], but the costs attributable to falls are highly skewed to those that result in
physical injuries. One of the most important reasons for preventing falls should be to prevent fractures and
other severe injuries [5]. Risk assessment tools are needed to predict falls that are likely to be complicated
with severe injuries such as fractures.
Measurement of bone mineral density (BMD) is the standard tool to assess susceptibility to fracture,
but it is costly and impractical to measure BMD in all inpatients. Recently, fractures risk assessment tool
(FRAX™) was developed by the World Health Organization [14-16]. FRAX™ has the advantage that it can
be used without information on BMD and is adjusted for ethnic differences. The aims of this study were (i)
to analyze the risk factors for fractures after falls among various patient characteristics including FRAX™
score and (ii) to examine the performance of the STRATFY tool (St. Thomas risk assessment tool in falling
elderly) [17] in a Japanese hospital setting.
Methods Settings
This study was conducted at Niigata University Hospital, an 810-bed academic teaching hospital in the city
of Niigata. There are 23 clinical departments and the service area of the hospital as a tertiary care hospital
covers all districts in Niigata Prefecture, which has a population of 2,400,000. All patients who had been
admitted to the hospital during the period from April 2006 to March 2009 and who were aged from 40 to 90
- 4 -
years at admission were studied. During that period, 20,973 patients were admitted to the hospital, but 653
patients were excluded from the study because of missing data. Finally, data were obtained for a total of
20,320 patients aged from 40 to 90 years (median, 65.0 years; 25th percentile, 56.0 years; 75th percentile,
74.0 years). The patients included 9,738 females and 10,582 males, and 4,949 (24.4%) of the patients
required acute admission. The dataset was randomly divided into two datasets of the same sizes by a person
blinded to our study. One dataset was used for receiver operating curve (ROC) analysis to determine cut-off
values (development dataset) and the other was used for validation of the analysis (test dataset).
Risk assessment tools for falls and fractures
Various risk assessment tools for prediction of inpatient falls have been developed, but only the STRATIFY
tool and the Morse Falls Scale [18] have been subjected to prospective validation in several cohorts with
appropriate tests of predictive validity [7, 8]. The STRATIFY tool showed high sensitivity and specificity in
the original study, and its simplicity has facilitated its wide use in clinical practice [19]. We therefore used
this tool in our study to assess patients’ risk for falls. However, systematic review of the STRATIFY tool
revealed that the tool may not be optimal for identifying individuals at high risk for falls and that population
and setting affect performance of the tool [10]. The risk factors of fractures related to osteoporosis are age,
prior fragility fracture, parental history of hip fracture, smoking, use of systemic corticosteroids, excess
alcohol intake and rheumatoid arthritis [15]. By integrating these risk factors, WHO proposed the FRAX™
tool to compute ten-year probability of osteoporotic fracture. The FRAX™ tool has the advantage that it can
be used without information on BMD and is adjusted for ethnic differences. Actually, it is used to determine
thresholds for therapeutic intervention in a Japanese setting [14]. We therefore used the tool in this study to
assess the risk for fracture.
Data collection
Information on patients’ background such as age, gender, body weight, height, history of bone fractures,
smoking history, alcohol consumption, prescription of drugs, coexisting illness, admission day and discharge
day was obtained from the hospital information system. Information on risk factors for falls was obtained
- 5 -
from medical charts of the patients and fall assessment records completed by attending nurses at admission
[8]. They included history of falls, gait instability, agitated confusion, urinary incontinence or frequency,
visual impairment, lower limb weakness and prescription of ‘culprit’ drugs. The assessment was performed
again when fall events occurred. Therefore, STRATIFY score [17] and FRAX™ score [14, 16] were
calculated at admission and when the fall events occurred. STRATIFY score was calculated on the basis of
the original method [17], and FRAX™ score was based on the ten-year probability of major osteoporotic
fracture according to body mass index.
Falls and fractures after falls
The clinical outcome we studied was fallers with or without fractures rather than falls [9, 20]. Data on fall
events were obtained from online incident reports, records of x-ray order entry and medical charts of the
patients. The incident reports concerning fall events were documented by the attending nurse and other
medical staff, and the reports contained data on time, location, injury sustained and potential causative factor
for falls. Peripheral fractures verified by radiological findings were included, but vertebral fractures were
excluded from the study [20].
Statistical analysis
Fall events and fracture after falls were analyzed by two different methods. The first method is the
traditional chi-square test and multiple logistic analysis, which has been used for analysis of inpatient falls.
For multiple logistic analysis, significant risk factors were selected by using the stepwise selection method
and by the forced entery method. The second method is survival analysis in which time between admission
and the event (falls or fractures after falls) during the hospital stay was considered as survival time.
Discharge of the patient without fall events was considered as censoring. The Kaplan-Meier method was
used for the analysis, and the logrank test was used to examine whether each risk factor was significantly
associated with events. Multivariate Cox’s proportional hazards regression model with time-dependent
covariates was used to examine the risk factors that were most significantly associated with events among
the various risk factors. Since values of several risk factors such as history of falls varied over time, these
- 6 -
factors were included in the model by defining them as time-dependent covariates. Significant factors were
selected by the stepwise selection method and by the forced entry method. A cut-off value to distinguish
patients at risk from patients not at risk was determined on the basis of results of ROC analysis of data in the
development dataset. The value corresponding to the nearest point of the ROC curve to the top left-hand
corner was chosen as a cut-off value to distinguish patients at risk from patients not at risk [21]. Sensitivity,
specificity and area under the ROC curve (AUC) were calculated. Distribution of continuous data was
shown by medians (25-percentiles, 75-percentiles). All statistical analyses were performed using SPSS
Statistics 17.0 (SPSS Japan Inc., Tokyo, Japan), and a p-value less than 0.05 was considered significant.
Ethical consideration
All data were analyzed anonymously. The Ethical Committee of Niigata University School of Medicine
gave ethical approval.
Results
Falls and fractures after falls
The numbers of patients who experienced more than one fall during admission were 308 (3.1%) in the
development dataset and 345 (3.4%) in the test dataset. Eight (2.6%) of the fallers in the development
dataset and 10 (2.9%) of the fallers in the test dataset suffered peripheral fractures after falls. The ages of the
patients who suffered fractures after falls were 78.0 (64.0, 83.0) years for the development dataset and 75.0
(64.5, 76.5) years for the test dataset. All but one of the patients who suffered peripheral fractures broke
bones during the first fall.
Risk factors for falls
Univariate analyses (chi-square test and logrank test) revealed that various known risk factors including
dichotomized STRATIFY score were significantly associated with fallers (Table 1). The cut-off value of the
STRATIFY score to predict falls was determined to be a value of 2 based on results of ROC analysis of data
in the development dataset. Proportions of high-risk patients based on the cut-off value of STRATIFY score
were 26.5% in the development dataset and 26.8% in the test dataset. Sensitivity and specificity of the cut-
off value to predict falls were 0.648 and 0.749 in the development dataset and 0.678 and 0.749 in the test
- 7 -
dataset, respectively (Table 2). LOS was dichotomized at 14 days, which was the median value for all
patients. Only the factor ‘visual impairment’ was not significant. When the risk factors as well as
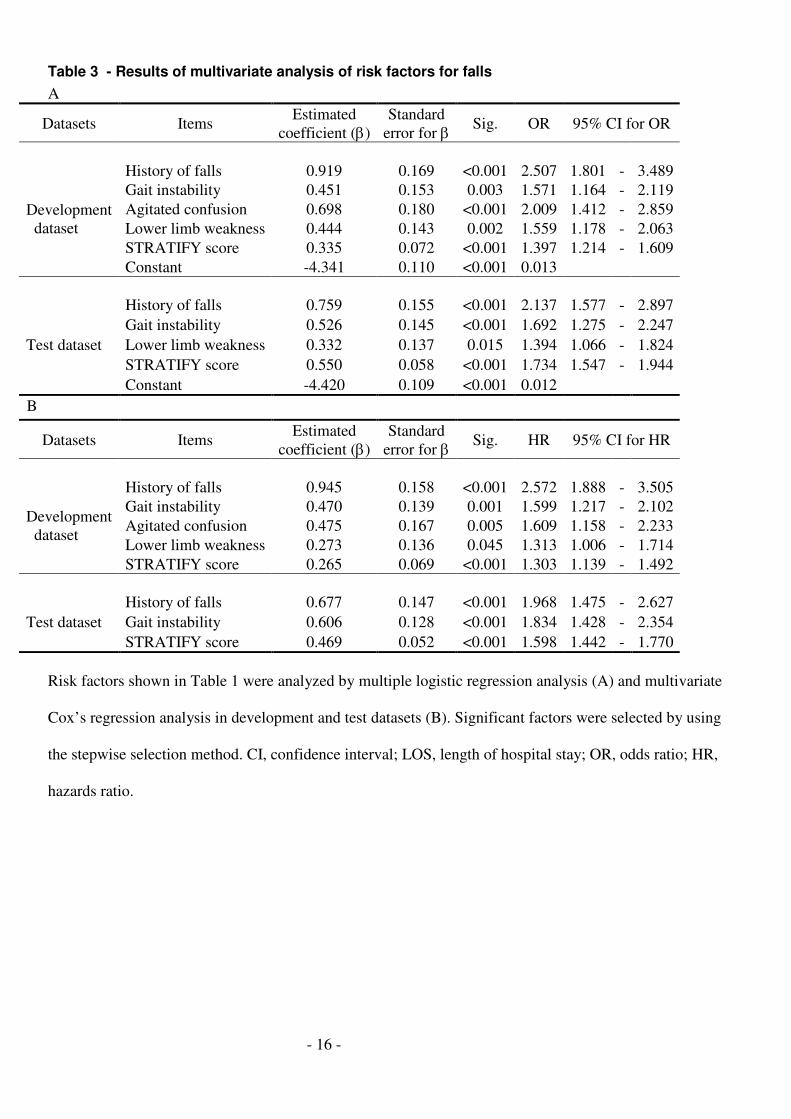
STRATIFY score were entered simultaneously into the multiple logisitc model, factors shown in Table 3A
were significantly associated. On the other hand, multivariate Cox’s regression analysis showed that the
factors in Table 3B were significantly associated with falls. In both datasets, the factor ‘history of falls’,
factor ‘gait instability’ and STRATIFY score were significantly associated with falls in both analyses.
Risk factors for fractures after falls
The chi-square test revealed that the factor ‘lower limb weakness’ and the FRAX™ score were significantly
associated with fracture after falls in both datasets (Table 4). In addition, dichotomized STRATIFY score
was a significant factor in the development dataset and dichotomized LOS was a significant factor in the test
dataset. The cut-off value of the FRAX™ score to predict fracture after falls was determined to be as a value
of 10 based on results of ROC analysis of data in the development dataset. Proportions of high-risk patients
based on the cut-off value of FRAX™ score were 34.1% in the development dataset and 33.9% in the test
dataset. Sensitivity and specificity of the cut-off value were 0.750 and 0.659 in the development dataset and
0.700 and 0.661 in the test dataset, respectively (Table 2B). On the other hand, the logrank test revealed that
only dichotomized FRAX™ score was significantly associated with fractures after falls both in the
development dataset and the test dataset (Table 4, Figure 1). When the risk factors shown in Table 4 were
entered into the multiple logisitc regression model, only FRAX™ score was selected as a factor significantly
associated with fractures after falls by the stepwise selection method both in the development dataset and the
test dataset (Table 5A). Similarly, multivariate Cox’s regression analysis showed that only FRAX™ score
was a significant factor (Table 5B). Next, we analyzed how the combination of STRATIFY and FRAX™
tools would work for prediction of fracture after falls. Both scores were forcibly entered into the multiple
logisitc model (Table 5C) and multivariate Cox’s regression model (Table 5D), but only FRAX™ score
was significantly associated with fracture after falls in Cox’s regression analysis.
Risk factors in aged patients
The performance of the two risk tools in a much more selected population was evaluated. We performed
multiple logisitc analysis and multivariate Cox’s regression analysis by entering the risk factors as well as
- 8 -
the two risk scores simultaneously into the models for patients more than 65 years old, who were at higher
risk for both falls and fractures. The results were almost the same as the results of analysis for all subjects
(Table 6). The factor ‘history of falls’, the factor ‘gait instability’ and STRATIFY score were significantly
associated with falls both in multiple logistic regression analysis (Table 6A) and multivariate Cox’s
regression analysis (Table 6B). FRAX™ was significantly associated with fracture after falls in the
development dataset analyzed by multivariate Cox’s regression analysis and in the test dataset analyzed by
both methods.
Discussion In this study, we analyzed the risk factors for falls resulting in fractures, focusing on FRAX™
fracture risk assessment tool. Most of the risk factors for falls had no power to predict fracture after falls, but
a high FRAX™ score was closely associated with fractures. This result was confirmed not only by
conventional multiple logisitc analysis but also by survival analysis referring to the fracture after a fall as
event and the time between admission and the event as survival time. By using the risk assessment tools for
fractures, we could identify and target fallers that were at high risk for fractures more efficiently.
Our results suggest that a strategy to prevent fractures after falls might require programs for patients
with bone fragilities apart from a program to prevent falls. The majority of patients who fell did not injure
themselves and only 2.6% - 2.9% of patients who fell incurred a peripheral fracture. The risk assessment
tools should be used for prediction of physical injuries resulting from falls, not for prediction of falls
themselves. However, the existing risk assessment tools have poor performance in predicting not only
fractures after falls but also falls themselves [10]. Several reports suggested that the risk assessment tools for
falls have the same poor performance as clinical judgment of nurses [22-25]. The use of risk assessment
tools for falls might have no clinical benefit and waste scarce nursing resources [23]. Hospitals should shift
their emphasis from simply targeting high-risk patients for falls to identifying high-risk patients for fractures
after falls and employing programs to prevent fractures. A targeted intervention for high-risk patients such
as the use of a hip protector [26, 27] might be beneficial even though the compliance with a hip protector
remains to be improved [28]. Our results suggest that a FRAX™ score of more than 10 is useful for
identifying the high-risk patients in terms of sensitivity. This cut-off point was consistent with the
- 9 -
recommended threshold for therapeutic intervention for osteoporotic fracture in the Japanese population
[14]. However, positive predictive value of FRAX™ score to predict fracture after falls was 0.003 in both
datasets. The low positive predictive value was problematic when FRAX™ score was used as a means of
screening [29]. More restrictive selection of patients at high risk for fractures is necessary.
Our study is the first study in which the performance of STRATIFY tools was examined in a
Japanese setting, but it was found that the performance of the STRATIFY risk assessment tool is not optimal
in a Japanese acute-care hospital setting. This tool was originally developed and validated in the United
Kingdom to predict falls occurring in a hospital, and sensitivity and specificity were both in excess 80% in
the original study [17]. However, systemic review of this tool has shown that this tool has poorer predictive
accuracy than the results of the original study and that population and setting affect the performance of this
tool [10]. Our results showed that the performance of the STRATIFY tool was not necessarily satisfactory in
a Japanese hospital setting but was similar to that in previous studies [30]. Since a weighted risk score based
on the STRATIFY tool could improve the performance of the tool [9], modification of the tool might be
needed for a Japanese setting.
There are several limitations of this study. First, we limited the study subjects to patients aged from
40 to 90 years. This was because the FRAX™ scoring system targets that age group. Second, no validation
study using a prospective cohort was performed in this study. A prospective study is needed to validate the
usefulness of the assessment tool for predicting fractures after falls and to generalize the findings of our
study. Third, sensitivity and specificity of the STRATIFY tool for falls, which were calculated by the
standard approach, might be incorrect because falls might be recurrent and time-dependent [31] . Finally and
most importantly, the sample size of our study was small in terms of number of fractures to construct proper
statistical models. Further investigation using larger sample sizes is needed to determine whether fracture
risk assessment is useful for predicting fractures after inpatient falls.
Conclusions Risk assessment tools for falls are not appropriate for predicting fractures after falls. FRAX™ might be a
useful tool for that purpose. The performance of STRATIFY to predict falls in a Japanese hospital setting
was similar to that in previous studies.
- 10 -
Competing interests The author declares that he has no competing interests.
Authors' contributions ST is solely responsible for this manuscript.
Acknowledgements Part of this work was supported by KAKENHI (Grant-in-Aid for Scientific Research (B), No.21390159).
KAKENHI is a project of the Japan Society for the Promotion of Science (JSPS).
References
1. Nakai A, Akeda M, Kawabata I: Incidence and risk factors for inpatient falls in an academic
acute-care hospital. J Nippon Med Sch 2006, 73(5):265-270.
2. Fischer ID, Krauss MJ, Dunagan WC, Birge S, Hitcho E, Johnson S, Costantinou E, Fraser VJ:
Patterns and predictors of inpatient falls and fall-related injuries in a large academic hospital.
Infect Control Hosp Epidemiol 2005, 26(10):822-827.
3. Uden G, Nilsson B: Hip fracture frequent in hospital. Acta Orthop Scand 1986, 57(5):428-430.
4. Oliver D, Killick S, Even T, Willmott M: Do falls and falls-injuries in hospital indicate negligent
care -- and how big is the risk? A retrospective analysis of the NHS Litigation Authority
Database of clinical negligence claims, resulting from falls in hospitals in England 1995 to 2006.
Qual Saf Health Care 2008, 17(6):431-436.
5. Gates S, Fisher JD, Cooke MW, Carter YH, Lamb SE: Multifactorial assessment and targeted
intervention for preventing falls and injuries among older people in community and emergency
care settings: systematic review and meta-analysis. BMJ 2008, 336(7636):130-133.
6. Rubenstein LZ: Falls in older people: epidemiology, risk factors and strategies for prevention.
Age Ageing 2006, 35 Suppl 2:ii37-ii41.

- 11 -
7. Haines TP, Hill K, Walsh W, Osborne R: Design-related bias in hospital fall risk screening tool
predictive accuracy evaluations: systematic review and meta-analysis. J Gerontol A Biol Sci Med
Sci 2007, 62(6):664-672.
8. Oliver D, Daly F, Martin FC, McMurdo ME: Risk factors and risk assessment tools for falls in
hospital in-patients: a systematic review. Age Ageing 2004, 33(2):122-130.
9. Papaioannou A, Parkinson W, Cook R, Ferko N, Coker E, Adachi JD: Prediction of falls using a
risk assessment tool in the acute care setting. BMC Med 2004, 2:1.
10. Oliver D, Papaioannou A, Giangregorio L, Thabane L, Reizgys K, Foster G: A systematic review
and meta-analysis of studies using the STRATIFY tool for prediction of falls in hospital
patients: how well does it work? Age Ageing 2008, 37(6):621-627.
11. Kim EA, Mordiffi SZ, Bee WH, Devi K, Evans D: Evaluation of three fall-risk assessment tools
in an acute care setting. J Adv Nurs 2007, 60(4):427-435.
12. Izumi K, Makimoto K, Kato M, Hiramatsu T: Prospective study of fall risk assessment among
institutionalized elderly in Japan. Nurs Health Sci 2002, 4(4):141-147.
13. Heinze C, Dassen T, Halfens R, Lohrmann C: Screening the risk of falls: a general or a specific
instrument? J Clin Nurs 2009, 18(3):350-356.
14. Fujiwara S, Nakamura T, Orimo H, Hosoi T, Gorai I, Oden A, Johansson H, Kanis JA:
Development and application of a Japanese model of the WHO fracture risk assessment tool
(FRAX). Osteoporos Int 2008, 19(4):429-435.
15. Kanis JA, Borgstrom F, De Laet C, Johansson H, Johnell O, Jonsson B, Oden A, Zethraeus N,
Pfleger B, Khaltaev N: Assessment of fracture risk. Osteoporos Int 2005, 16(6):581-589.
16. FRAX, WHO fracture risk assessment tool. [http://www.shef.ac.uk/FRAX/index.htm]
17. Oliver D, Britton M, Seed P, Martin FC, Hopper AH: Development and evaluation of evidence
based risk assessment tool (STRATIFY) to predict which elderly inpatients will fall: case-
control and cohort studies. BMJ 1997, 315(7115):1049-1053.
18. Morse JM: Preventing Patient Falls London: Sage Publications 1995.
- 12 -
19. Vassallo M, Stockdale R, Sharma JC, Briggs R, Allen S: A comparative study of the use of four
fall risk assessment tools on acute medical wards. J Am Geriatr Soc 2005, 53(6):1034-1038.
20. Lamb SE, Jorstad-Stein EC, Hauer K, Becker C: Development of a common outcome data set for
fall injury prevention trials: the Prevention of Falls Network Europe consensus. J Am Geriatr
Soc 2005, 53(9):1618-1622.
21. Armitage P BB, Matthews JNS: Statistical Methods in Medical Research, 4th edition Edited by
Oxford: Blackwell Science 2002.
22. Eagle DJ, Salama S, Whitman D, Evans LA, Ho E, Olde J: Comparison of three instruments in
predicting accidental falls in selected inpatients in a general teaching hospital. J Gerontol Nurs
1999, 25(7):40-45.
23. Myers H, Nikoletti S: Fall risk assessment: a prospective investigation of nurses' clinical
judgement and risk assessment tools in predicting patient falls. Int J Nurs Pract 2003, 9(3):158-
165.
24. Vassallo M, Poynter L, Sharma JC, Kwan J, Allen SC: Fall risk-assessment tools compared with
clinical judgment: an evaluation in a rehabilitation ward. Age Ageing 2008, 37(3):277-281.
25. Webster J, Courtney M, Marsh N, Gale C, Abbott B, Mackenzie-Ross A, McRae P: The
STRATIFY tool and clinical judgment were poor predictors of falling in an acute hospital
setting. J Clin Epidemiol 2010, 63(1):109-13.
26. Parker MJ, Gillespie WJ, Gillespie LD: Effectiveness of hip protectors for preventing hip
fractures in elderly people: systematic review. BMJ 2006, 332(7541):571-574.
27. Johal KS, Boulton C, Moran CG: Hip fractures after falls in hospital: a retrospective
observational cohort study. Injury 2009, 40(2):201-204.
28. Haines TP HK, Bennell KL, Osborne RH.: Hip protector use amongst older hospital inpatients:
compliance and functional consequences. Age Ageing 2006, 35(5):520-523.
29. Webster J, Courtney M, O'Rourke P, Marsh N, Gale C, Abbott B, McRae P, Mason K: Should
elderly patients be screened for their 'falls risk'? Validity of the STRATIFY falls screening tool
and predictors of falls in a large acute hospital. Age Ageing 2008, 37(6):702-706.

- 13 -
30. Haines T, Kuys SS, Morrison G, Clarke J, Bew P: Cost-effectiveness analysis of screening for risk
of in-hospital falls using physiotherapist clinical judgement. Medical care 2009, 47(4):448-456.
31. Haines TP, Hill KD, Bennell KL, Osborne RH: Recurrent events counted in evaluations of
predictive accuracy. J Clin Epidemiol 2006, 59(11):1155-1161.
Figures
Figure 1 - Survival plots for fractures after falls
All patients were plotted on the Kaplan-Meier survival curve as a function of length of stay. Cumulative
rates of fractures after falls were compared between patients with FRAX™ score of more than 10 and
patients with FRAX™ score of less than 10.
Tables
Table 1 - Results of univariate analysis of risk factors for falls
Number of patients Sig. Dataset Items
Fallers Non fallers Chi-square test Logrank test
n 308 9,852
History of falls 115 677 <0.001 <0.001
Gait instability 84 774 <0.001 <0.001
Agitated confusion 85 513 <0.001 <0.001
Urinary incontinence/frequency 65 785 <0.001 <0.001
Visual impairment 69 1,807 0.083 0.154
Lower limb weakness 143 1,614 <0.001 <0.001
Prescription of 'culprit' drugs 79 1,158 <0.001 <0.001
STRATIFY score ≥ 2 190 2,055 <0.001 <0.001
Development
dataset
(n=10,160)
LOS ≥ 14 157 4,836 0.552 -
n 345 9,815
History of falls 132 681 <0.001 <0.001
Gait instability 100 735 <0.001 <0.001
Agitated confusion 81 519 <0.001 <0.001
Urinary incontinence/frequency 76 801 <0.001 <0.001
Visual impairment 74 1,811 0.181 0.158
Lower limb weakness 157 1,555 <0.001 <0.001
Test dataset
(n=10,160)
Prescription of 'culprit' drugs 83 1,165 <0.001 0.002
- 14 -
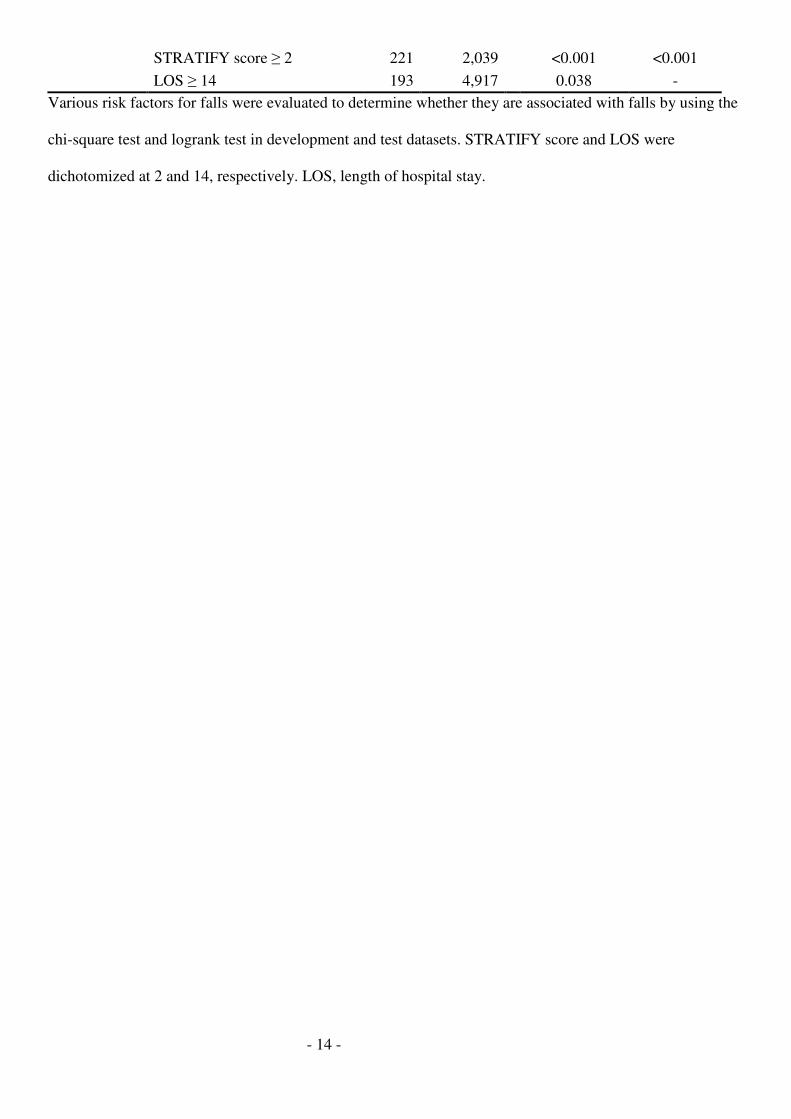
STRATIFY score ≥ 2 221 2,039 <0.001 <0.001
LOS ≥ 14 193 4,917 0.038 -
Various risk factors for falls were evaluated to determine whether they are associated with falls by using the
chi-square test and logrank test in development and test datasets. STRATIFY score and LOS were
dichotomized at 2 and 14, respectively. LOS, length of hospital stay.

- 15 -
Table 2 - Sensitivity and specificity of the STRATIFY score and the FRAX™™™™ score
A
95% CI Items Events Datasets AUC
lower upper
Development
dataset 0.749 0.719 0.779
Falls
Test dataset 0.765 0.736 0.794
Development
dataset 0.717 0.549 0.885
STRATIFY
Fracture
after falls Test dataset 0.636 0.464 0.808
Development
dataset 0.606 0.574 0.637
Falls
Test dataset 0.589 0.557 0.620 FRAX
Fracture
after falls
Development
dataset 0.749 0.580 0.917
Test dataset 0.727 0.552 0.901
B
95% CI 95% CI Items Events Datasets Sensitivity
lower upper Specificity
lower upper
Development
dataset 0.648 0.592 0.701 0.749 0.740 0.759
Falls
Test dataset 0.678 0.625 0.726 0.749 0.739 0.758
Development
dataset 0.625 0.306 0.863 0.736 0.726 0.745
STRATIFY
Fracture
after falls Test dataset 0.400 0.168 0.687 0.732 0.723 0.742
Development
dataset 0.481 0.425 0.536 0.663 0.654 0.672
Falls
Test dataset 0.496 0.443 0.548 0.666 0.657 0.675
Development
dataset 0.750 0.409 0.929 0.659 0.620 0.668
FRAX
Fracture
after falls Test dataset 0.700 0.397 0.892 0.661 0.652 0.670
AUC (A), sensitivity and specificity (B) of the STRATIFY score and the FRAX™ score to detect falls and
fracture after falls were calculated. Cut-off values for the STRATIFY score and the FRAX™ score were set
at 2 and 10, respectively.
- 16 -
Table 3 - Results of multivariate analysis of risk factors for falls
A
Datasets Items Estimated
coefficient (β)
Standard
error for β Sig. OR 95% CI for OR
History of falls 0.919 0.169 <0.001 2.507 1.801 - 3.489
Gait instability 0.451 0.153 0.003 1.571 1.164 - 2.119
Agitated confusion 0.698 0.180 <0.001 2.009 1.412 - 2.859
Lower limb weakness 0.444 0.143 0.002 1.559 1.178 - 2.063
STRATIFY score 0.335 0.072 <0.001 1.397 1.214 - 1.609
Development
dataset
Constant -4.341 0.110 <0.001 0.013
History of falls 0.759 0.155 <0.001 2.137 1.577 - 2.897
Gait instability 0.526 0.145 <0.001 1.692 1.275 - 2.247
Lower limb weakness 0.332 0.137 0.015 1.394 1.066 - 1.824
STRATIFY score 0.550 0.058 <0.001 1.734 1.547 - 1.944
Test dataset
Constant -4.420 0.109 <0.001 0.012
B
Datasets Items Estimated
coefficient (β)
Standard
error for β Sig. HR 95% CI for HR
History of falls 0.945 0.158 <0.001 2.572 1.888 - 3.505
Gait instability 0.470 0.139 0.001 1.599 1.217 - 2.102
Agitated confusion 0.475 0.167 0.005 1.609 1.158 - 2.233
Lower limb weakness 0.273 0.136 0.045 1.313 1.006 - 1.714
Development
dataset
STRATIFY score 0.265 0.069 <0.001 1.303 1.139 - 1.492
History of falls 0.677 0.147 <0.001 1.968 1.475 - 2.627
Gait instability 0.606 0.128 <0.001 1.834 1.428 - 2.354 Test dataset
STRATIFY score 0.469 0.052 <0.001 1.598 1.442 - 1.770
Risk factors shown in Table 1 were analyzed by multiple logistic regression analysis (A) and multivariate
Cox’s regression analysis in development and test datasets (B). Significant factors were selected by using
the stepwise selection method. CI, confidence interval; LOS, length of hospital stay; OR, odds ratio; HR,
hazards ratio.
- 17 -
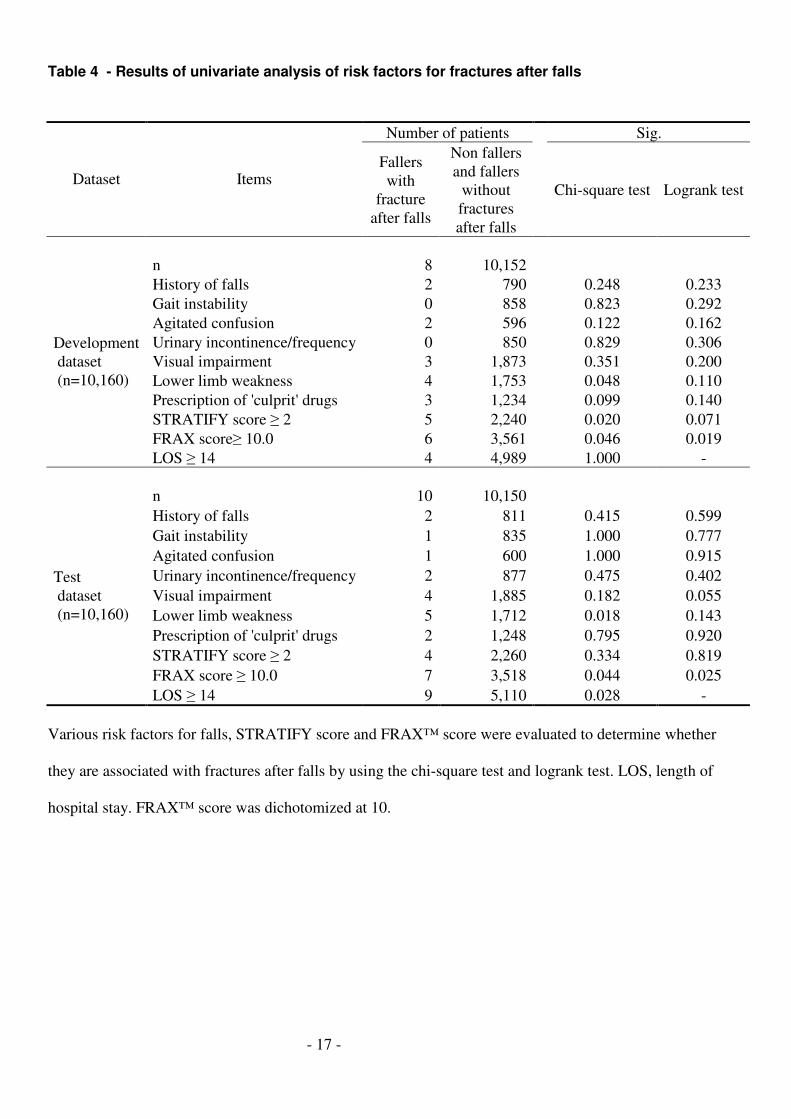
Table 4 - Results of univariate analysis of risk factors for fractures after falls
Number of patients Sig.
Dataset Items Fallers
with
fracture
after falls
Non fallers
and fallers
without
fractures
after falls
Chi-square test Logrank test
n 8 10,152
History of falls 2 790 0.248 0.233
Gait instability 0 858 0.823 0.292
Agitated confusion 2 596 0.122 0.162
Urinary incontinence/frequency 0 850 0.829 0.306
Visual impairment 3 1,873 0.351 0.200
Lower limb weakness 4 1,753 0.048 0.110
Prescription of 'culprit' drugs 3 1,234 0.099 0.140
STRATIFY score ≥ 2 5 2,240 0.020 0.071
FRAX score≥ 10.0 6 3,561 0.046 0.019
Development
dataset
(n=10,160)
LOS ≥ 14 4 4,989 1.000 -
n 10 10,150
History of falls 2 811 0.415 0.599
Gait instability 1 835 1.000 0.777
Agitated confusion 1 600 1.000 0.915
Urinary incontinence/frequency 2 877 0.475 0.402
Visual impairment 4 1,885 0.182 0.055
Lower limb weakness 5 1,712 0.018 0.143
Prescription of 'culprit' drugs 2 1,248 0.795 0.920
STRATIFY score ≥ 2 4 2,260 0.334 0.819
FRAX score ≥ 10.0 7 3,518 0.044 0.025
Test
dataset
(n=10,160)
LOS ≥ 14 9 5,110 0.028 -
Various risk factors for falls, STRATIFY score and FRAX™ score were evaluated to determine whether
they are associated with fractures after falls by using the chi-square test and logrank test. LOS, length of
hospital stay. FRAX™ score was dichotomized at 10.

- 18 -
Table 5 - Results of multivariate analysis of risk factors for fractures after falls
A
Datasets
Items
Estimated
coefficient (β)
Standard
error for β
Sig.
OR
95% CI for OR
FRAX score 0.069 0.026 0.008 1.072 1.018 - 1.128 Development
dataset Constant -7.865 0.572 <0.001 0.000
FRAX score 0.076 0.024 0.001 1.079 1.030 - 1.130 Test dataset
Constant -7.726 0.524 <0.001 0.000
B
Datasets
Items
Estimated
coefficient (β)
Standard
error for β
Sig.
HR
95% CI for HR
Development
dataset FRAX score 0.063 0.025 0.012 1.065 1.014 - 1.119
Test dataset FRAX score 0.065 0.022 0.003 1.067 1.022 - 1.114
C
Datasets
Items
Estimated
coefficient (β)
Standard
error for β
Sig.
OR
95% CI for OR
STRATIFY score 0.443 0.256 0.083 1.557 0.943 - 2.569
FRAX score 0.060 0.028 0.034 1.062 1.004 - 1.122 Development
dataset Constant -8.358 0.697 <0.001 0.000
STRATIFY score 0.289 0.241 0.231 1.335 0.832 - 2.141
FRAX score 0.070 0.025 0.004 1.072 1.022 - 1.125 Test dataset
Constant -8.020 0.603 <0.001 0.000
D
Datasets
Items
Estimated
coefficient (β)
Standard
error for β
Sig.
HR
95% CI for HR
STRATIFY score 0.330 0.257 0.200 1.391 0.840 - 2.302 Development
dataset FRAX score 0.056 0.027 0.035 1.058 1.004 - 1.115
STRATIFY score 0.153 0.240 0.523 1.165 0.729 - 1.864 Test dataset
FRAX score 0.064 0.022 0.004 1.066 1.020 - 1.114
Various risk factors for falls, STRATIFY score and FRAX™ score were evaluated in development and test
datasets to determine whether they are associated with fracture after falls by using multiple logistic
regression analysis (A) and multivariate Cox’s regression analysis (B). Significant factors were selected by
using the stepwise selection method. In Tables C and D, both STRATIFY score and FRAX™ score were
forcibly entered into the logistic model (C) and Cox’s regression model (D). CI, confident interval; LOS,
length of hospital stay; OR, odds ratio; HR, hazards ratio.

- 19 -
- 20 -
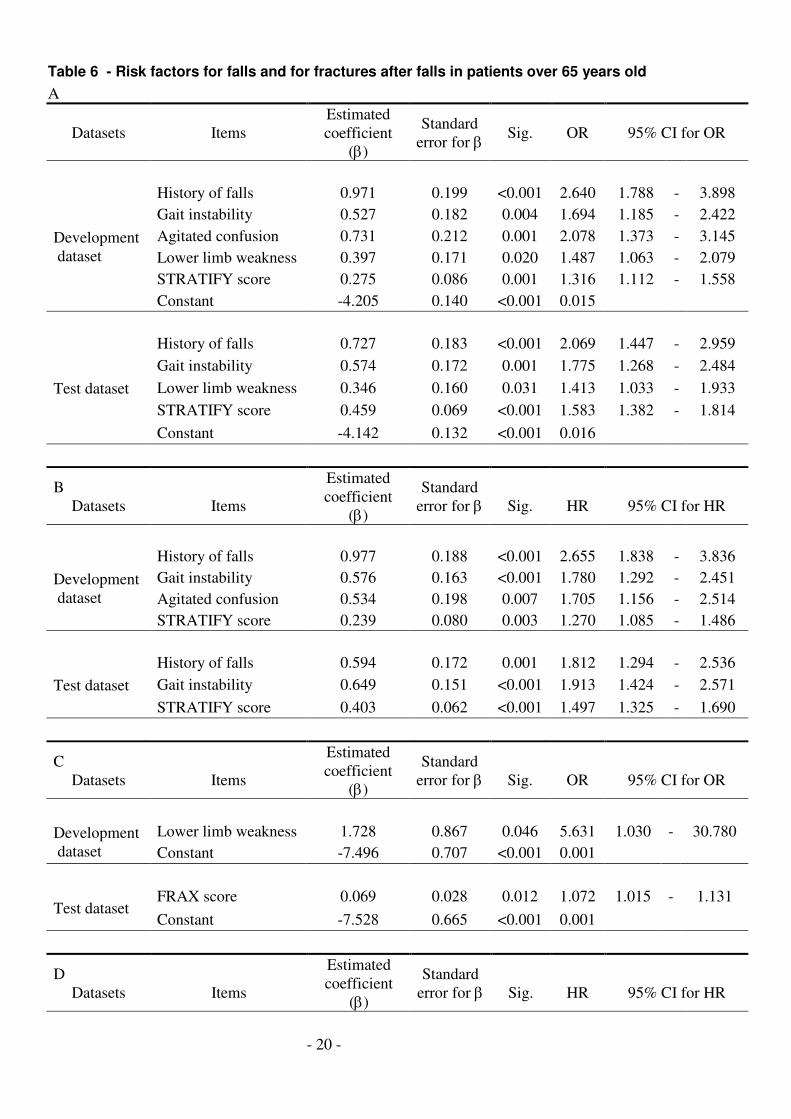
Table 6 - Risk factors for falls and for fractures after falls in patients over 65 years old
A
Datasets Items
Estimated
coefficient
(β)
Standard
error for β Sig. OR 95% CI for OR
History of falls 0.971 0.199 <0.001 2.640 1.788 - 3.898
Gait instability 0.527 0.182 0.004 1.694 1.185 - 2.422
Agitated confusion 0.731 0.212 0.001 2.078 1.373 - 3.145
Lower limb weakness 0.397 0.171 0.020 1.487 1.063 - 2.079
STRATIFY score 0.275 0.086 0.001 1.316 1.112 - 1.558
Development
dataset
Constant -4.205 0.140 <0.001 0.015
History of falls 0.727 0.183 <0.001 2.069 1.447 - 2.959
Gait instability 0.574 0.172 0.001 1.775 1.268 - 2.484
Lower limb weakness 0.346 0.160 0.031 1.413 1.033 - 1.933
STRATIFY score 0.459 0.069 <0.001 1.583 1.382 - 1.814
Test dataset
Constant -4.142 0.132 <0.001 0.016
B
Datasets
Items
Estimated
coefficient
(β)
Standard
error for β
Sig.
HR
95% CI for HR
History of falls 0.977 0.188 <0.001 2.655 1.838 - 3.836
Gait instability 0.576 0.163 <0.001 1.780 1.292 - 2.451
Agitated confusion 0.534 0.198 0.007 1.705 1.156 - 2.514
Development
dataset
STRATIFY score 0.239 0.080 0.003 1.270 1.085 - 1.486
History of falls 0.594 0.172 0.001 1.812 1.294 - 2.536
Gait instability 0.649 0.151 <0.001 1.913 1.424 - 2.571 Test dataset
STRATIFY score 0.403 0.062 <0.001 1.497 1.325 - 1.690
C
Datasets
Items
Estimated
coefficient
(β)
Standard
error for β
Sig.
OR
95% CI for OR
Lower limb weakness 1.728 0.867 0.046 5.631 1.030 - 30.780 Development
dataset Constant -7.496 0.707 <0.001 0.001
FRAX score 0.069 0.028 0.012 1.072 1.015 - 1.131 Test dataset
Constant -7.528 0.665 <0.001 0.001
D
Datasets
Items
Estimated
coefficient
(β)
Standard
error for β
Sig.
HR
95% CI for HR
- 21 -
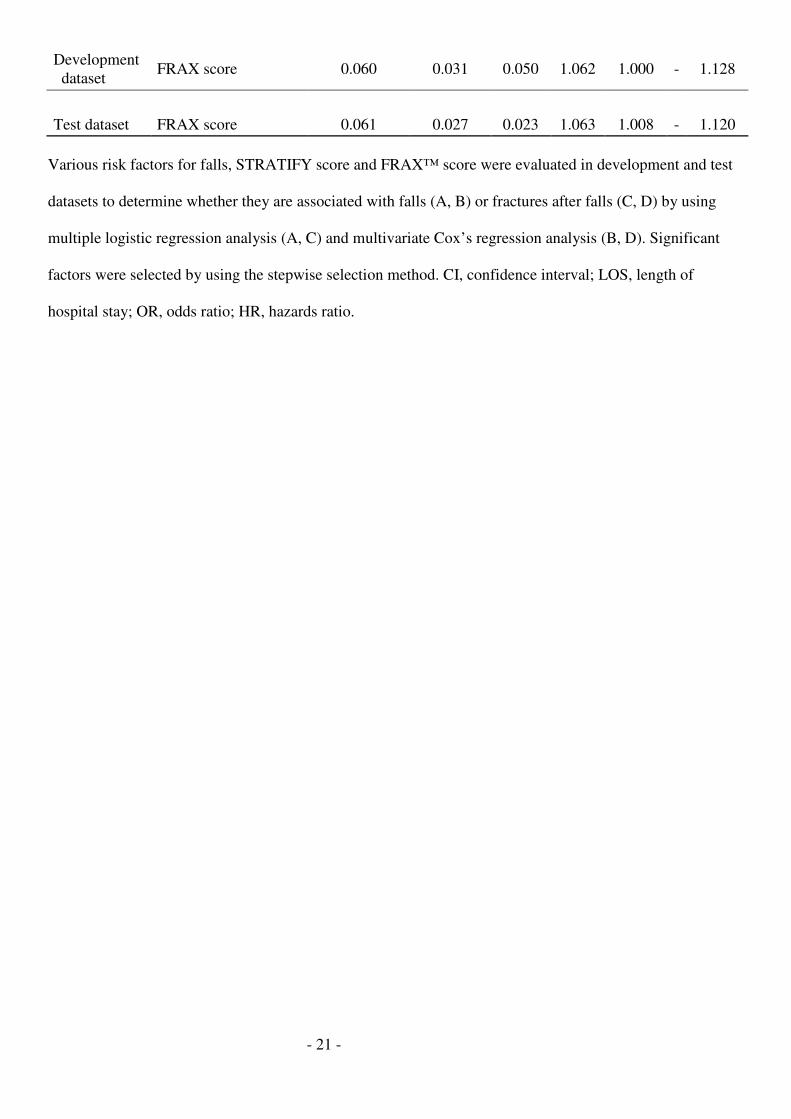
Development
dataset FRAX score 0.060 0.031 0.050 1.062 1.000 - 1.128
Test dataset FRAX score 0.061 0.027 0.023 1.063 1.008 - 1.120
Various risk factors for falls, STRATIFY score and FRAX™ score were evaluated in development and test
datasets to determine whether they are associated with falls (A, B) or fractures after falls (C, D) by using
multiple logistic regression analysis (A, C) and multivariate Cox’s regression analysis (B, D). Significant
factors were selected by using the stepwise selection method. CI, confidence interval; LOS, length of
hospital stay; OR, odds ratio; HR, hazards ratio.
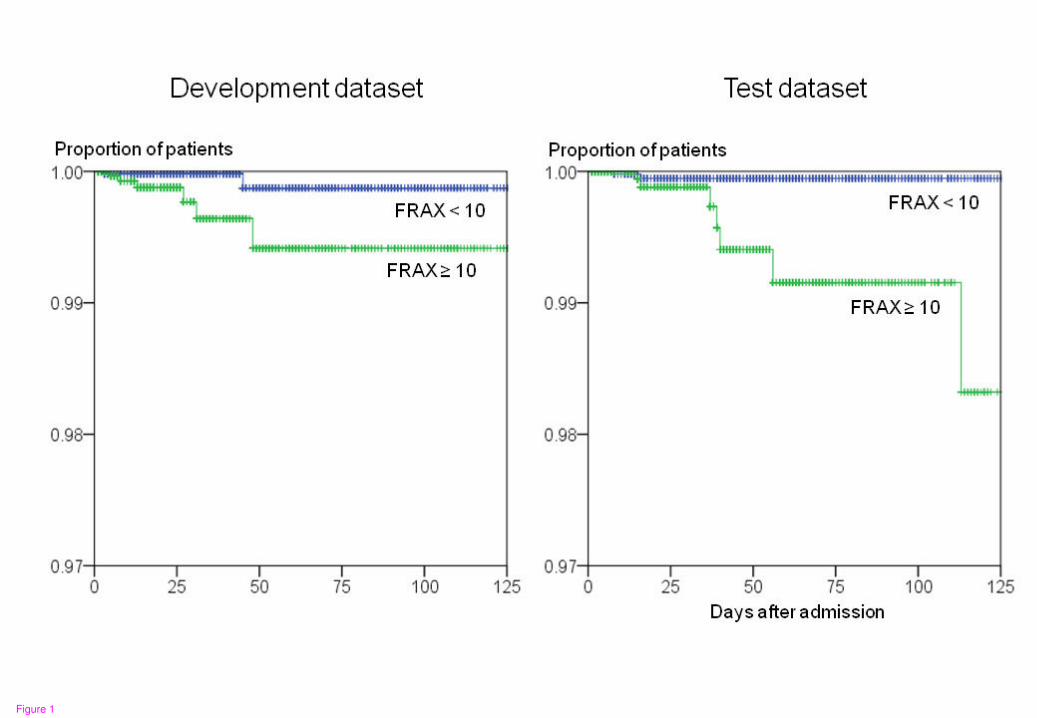
Figure 1