Embed Size (px)
Citation preview

BME 130 – Genomes
Lecture 20
Gene expression and mRNA processing

Administrivia
•Homework 2 grading will be finished today•Midterm 2 is Friday•Final paper presentations are next Wednesday (November 17)•Final or writing assignment – your choice
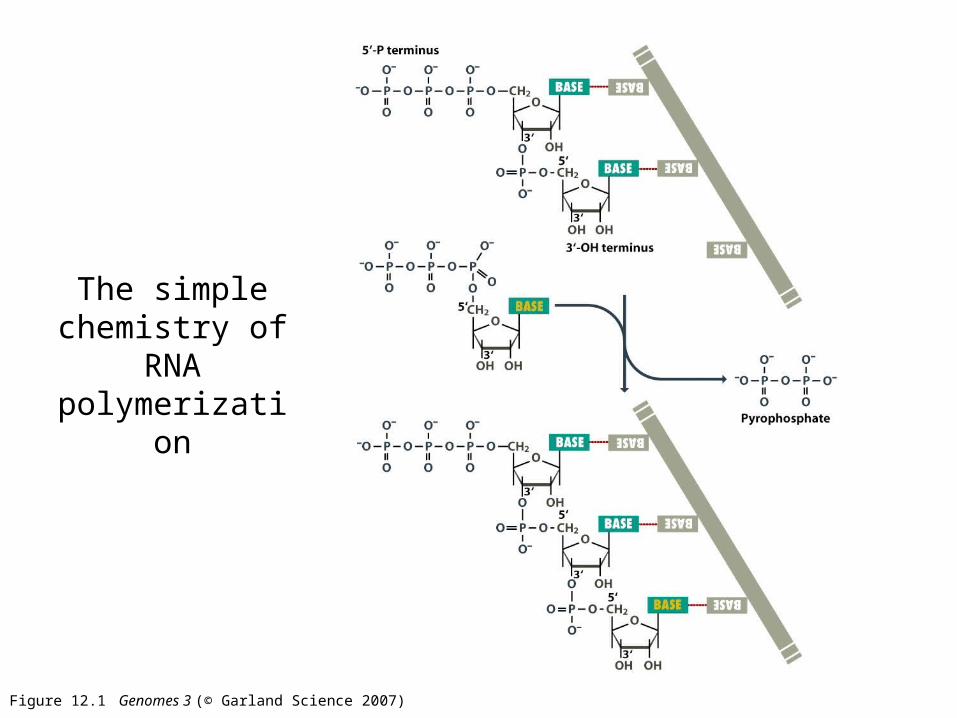
Figure 12.1 Genomes 3 (© Garland Science 2007)
The simple chemistry of
RNA polymerization
Figure 12.2 Genomes 3 (© Garland Science 2007)
The RNA polymerase complex is held together in part through interactions between the template DNA
and the RNA product at the transcription bubble

Figure 12.3 Genomes 3 (© Garland Science 2007)
Extensive interactions between bacterial RNA polymerase, template, and nascent RNA product

Template DNA strandNon-template DNA strand
RNA polymerase betaRNA polymerase beta’
RNA product

Figure 12.5 Genomes 3 (© Garland Science 2007)
Intrinsic terminator

Figure 12.6 Genomes 3 (© Garland Science 2007)

Figure 12.7 Genomes 3 (© Garland Science 2007)
Rho (helicase) dependent termination

Figure 12.10 Genomes 3 (© Garland Science 2007)

Figure 12.11 Genomes 3 (© Garland Science 2007)
Attenuation – feedback operon control

Figure 12.16 Genomes 3 (© Garland Science 2007)
rRNA expression
One transcriptEndonucleases separates
each rRNA gene;Exonucleases trim these

Figure 12.18 Genomes 3 (© Garland Science 2007)
tRNAs and rRNAs are extensively modified

Figure 12.19 Genomes 3 (© Garland Science 2007)
Bacterial RNA degradation

Eukaryotic pre-mRNA expression

Figure 12.20 Genomes 3 (© Garland Science 2007)

Figure 12.21 Genomes 3 (© Garland Science 2007)
Eukaryotic RNAPol II transcripts have a 7-methyl-G cap

Figure 12.22 Genomes 3 (© Garland Science 2007)
Eukaryotic 3’ end processing

Figure 12.25 Genomes 3 (© Garland Science 2007)
Splicing

Table 12.2 Genomes 3 (© Garland Science 2007)
Intron flavors

Table 12.3 Genomes 3 (© Garland Science 2007)
Intron content varies widely
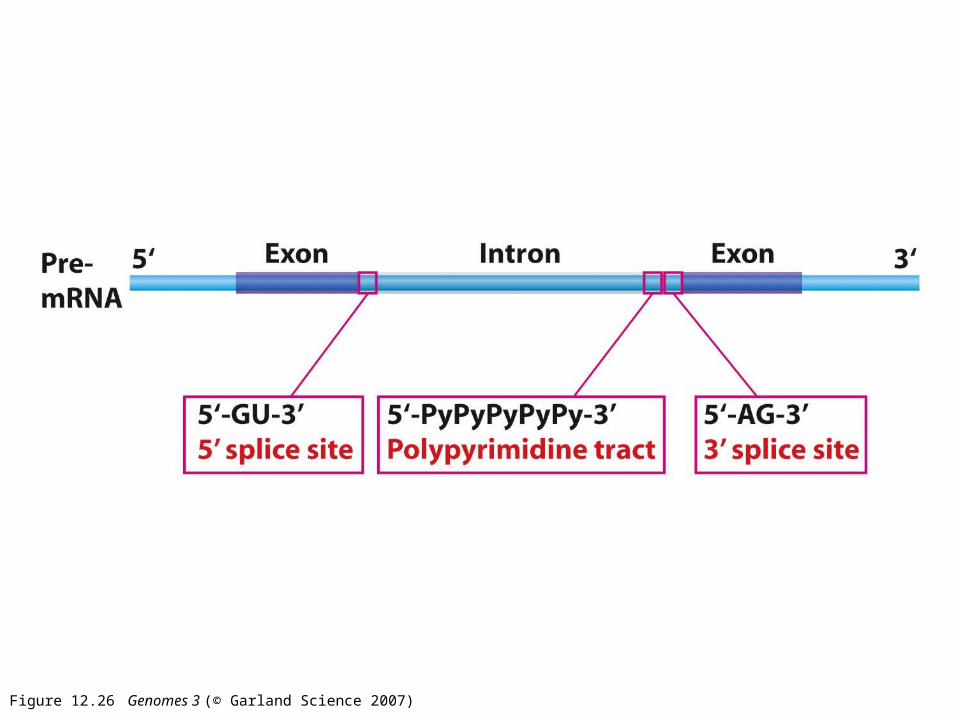
Figure 12.26 Genomes 3 (© Garland Science 2007)

Figure 12.27 Genomes 3 (© Garland Science 2007)
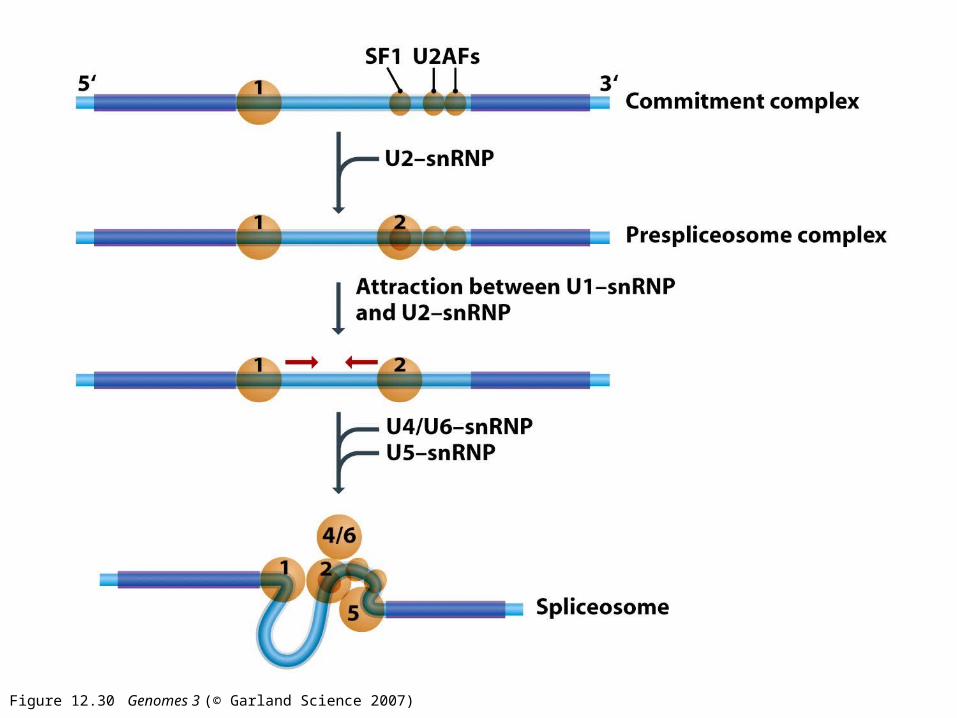
Figure 12.30 Genomes 3 (© Garland Science 2007)

Figure 12.31 Genomes 3 (© Garland Science 2007)
SR proteins are trans-acting splicing factors

Figure 12.32a Genomes 3 (© Garland Science 2007)

Figure 12.32b Genomes 3 (© Garland Science 2007)

Figure 12.33a Genomes 3 (© Garland Science 2007)

Figure 12.33b Genomes 3 (© Garland Science 2007)

Figure 12.33c Genomes 3 (© Garland Science 2007)

Figure 12.35 Genomes 3 (© Garland Science 2007)
Trans-splicing (C. elegans)

Figure 12.36 Genomes 3 (© Garland Science 2007)

Figure 12.42 Genomes 3 (© Garland Science 2007)
RNA editing

Table 12.5 Genomes 3 (© Garland Science 2007)

Figure 12.44 Genomes 3 (© Garland Science 2007)
Eukaryotic mRNA degradation

Figure 12.45a Genomes 3 (© Garland Science 2007)

Figure 12.45b Genomes 3 (© Garland Science 2007)
Nonsense-meditaed mRNA decay
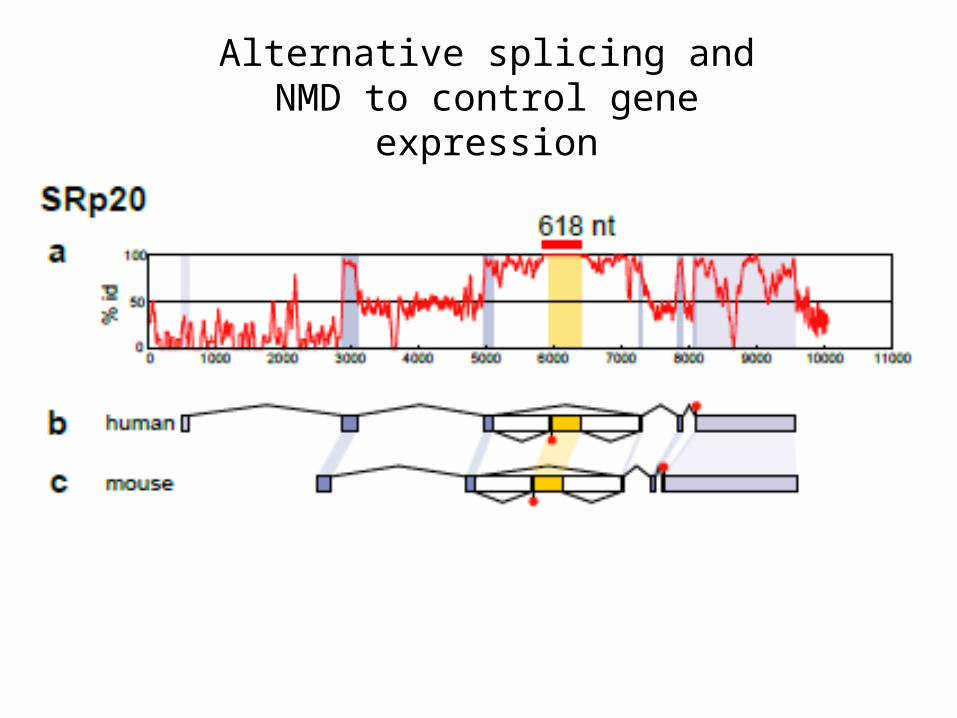
Alternative splicing and NMD to control gene expression

Alternative splicing and
NMD to control gene expression

Figure 12.47 Genomes 3 (© Garland Science 2007)
RNA interference (RNAi)

Figure 12.48 Genomes 3 (© Garland Science 2007)

Figure 12.49 Genomes 3 (© Garland Science 2007)