Embed Size (px)
Citation preview


Source: THE LANCET • Vol 363 • January 10, 2004 •www.thelancet.com
BMI and % body fat
21.2 %9.1 %
BMI =22.3
body fat

WHO recommended BMI cut offs for Asians 2004
WHO international classification retained with new subcategories: BMI <18.5 – underweightBMI 18.5-23 – increasing but acceptable riskBMI 23–27·5 kg/m2 – increasedBMI >27·5 kg/m2 - high risk.
THE LANCET • Vol 363 •January 10, 2004 •www.thelancet.com
AcceptableIncreased
High
Underweight Overweight Obesity I Obesity II Obesity III
25.0 30.0 35.0 40.0 18.5 23.0 27.5
Changes in BMI with age 0-20 yrs (Cole et al, 2000)
Point of adiposity rebound
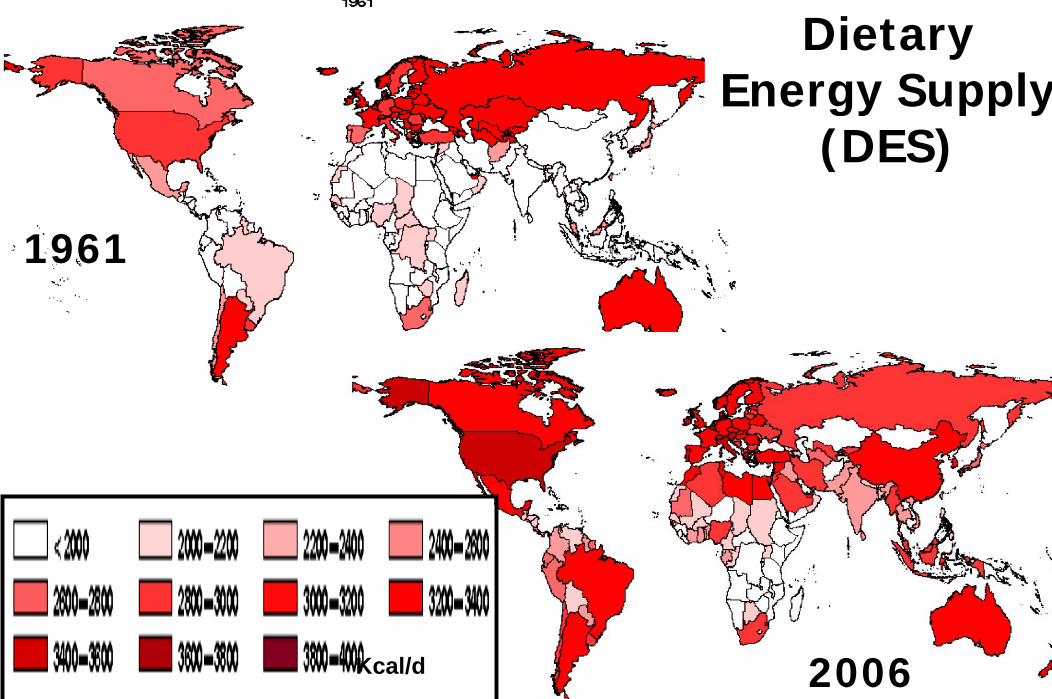
1961
2006
Dietary Energy Supply
(DES)
Kcal/d
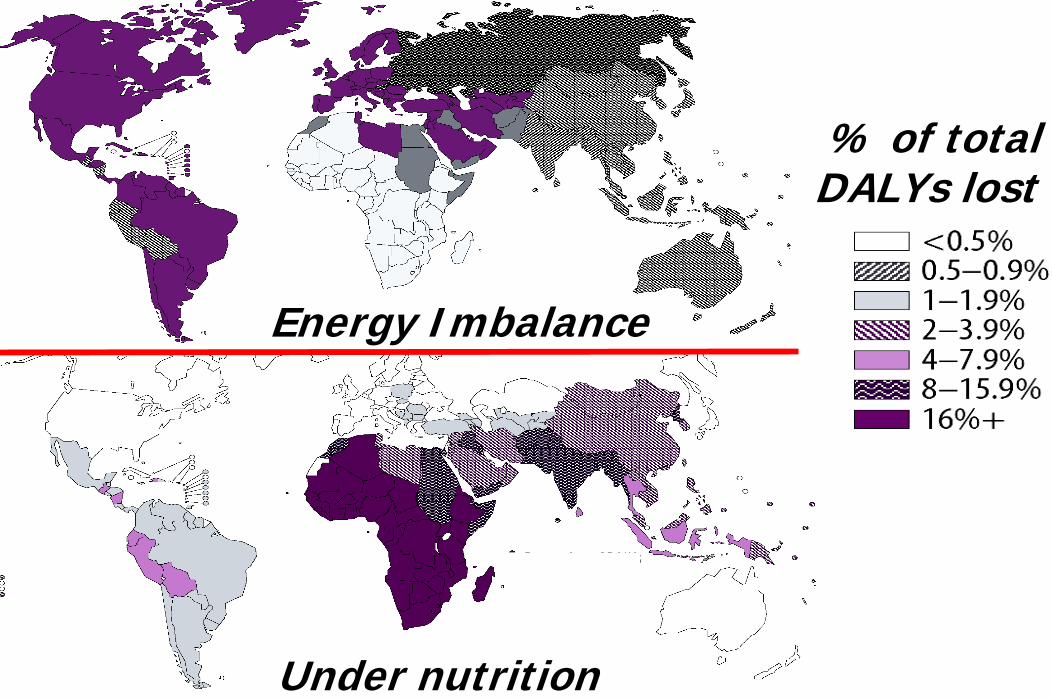
% of total DALYs lost
Energy Imbalance
Under nutrition

Trends and uncertainties of mean BMI for adults 20 years and older in 199 countries and territories. Data from published and unpublished health surveys (960 country-yrs 9.1 million participants)
Bayesian hierarchical model to estimate mean BMI by age, country, and year, accounting for whether a study was nationally representative.Published NEJM: Feb 4, 2011 DOI:10.1016/S0140- 6736(10)62037-5

Age-standardised mean BMI by gender 1980 - 2008
Males Females
NEJM: Feb 4, 2011

Published NEJM: Feb 4, 2011 DOI:10.1016/S0140- 6736(10)62037-5

Between 1980 -2008, mean BMI worldwide increased by 0.4 kg/m² per decade (95% CI 0.2–0.6) for men 0.5 kg/m² per decade (95% CI 0.3–0.7) for women.
National BMI change for women ranged from no change in 19 countries to increases > 2.0 kg/m² per decade in nine.
Male & female BMIs in 2008 were highest in Oceania reaching 34 kg/m² (32.8–35.0) for men and 35 kg/m²(33.6–36.3) for women in Nauru. The USA had the highest BMI of high-income countries.
Published NEJM: Feb 4, 2011 DOI:10.1016/S0140- 6736(10)62037-5

1999
Obesity Trends* Among U.S. AdultsBRFSS, 1990, 1999, 2009
(*BMI ≥30, or about 30 lbs. overweight for 5’4” person)
2009
1990
No Data <10% 10%–14% 15%–19% 20%–24% 25%–29% ≥30%
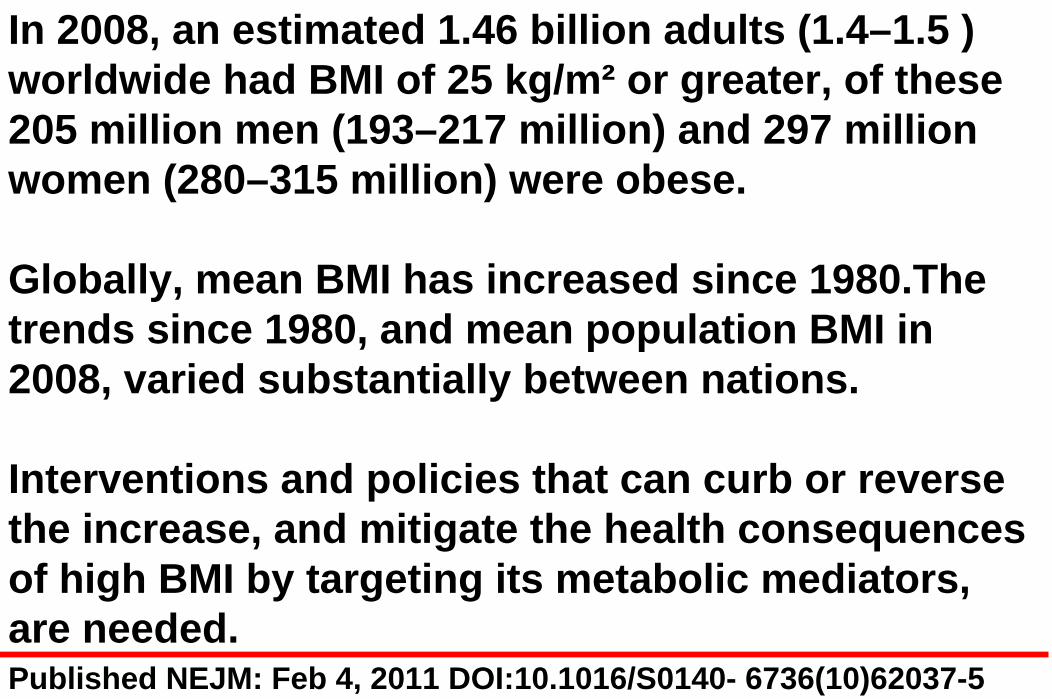
In 2008, an estimated 1.46 billion adults (1.4–1.5 ) worldwide had BMI of 25 kg/m² or greater, of these 205 million men (193–217 million) and 297 million women (280–315 million) were obese.
Globally, mean BMI has increased since 1980.The trends since 1980, and mean population BMI in 2008, varied substantially between nations.
Interventions and policies that can curb or reverse the increase, and mitigate the health consequences of high BMI by targeting its metabolic mediators, are needed. Published NEJM: Feb 4, 2011 DOI:10.1016/S0140- 6736(10)62037-5

Global epidemic of obesity
300 million BMI>301.5 billion BMI>251.7 billion BMI>23155 m school-age children overweight22 m under 5yrs overweight
“The epidemic of obesity, with its attendant comorbidities --- heart disease, hypertension, stroke, and diabetes --- is not a problem limited to industrialized countries” – WHO TRS 916


Energy Intake
Energy Expenditure
Unlimited Intake
Energy Intake
EnergyExpenditure
Limited Intake
Expenditure>Intake Intake>Expenditure
Low Energy Stores (body fat)
Increase in Energy Stores Energy balance established at unhealthy weight.
Primitive Life Modern LifeIncrease
Expenditure
ReduceIntake

www.who.int/hpr/nutrition/ExpertConsultationGE.htm
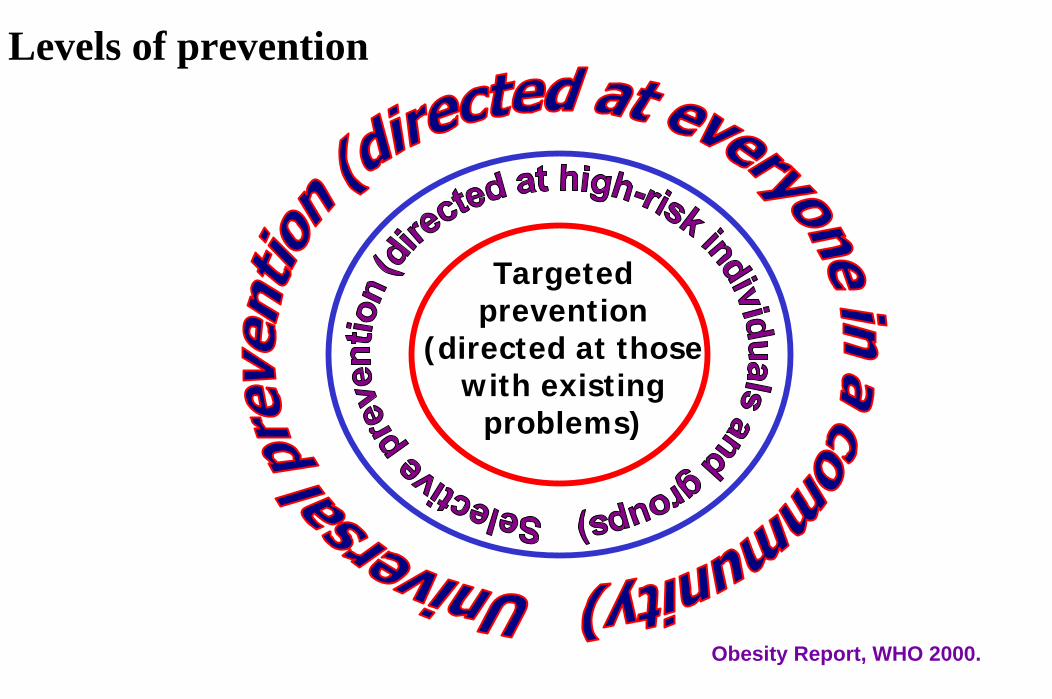
Targeted prevention
(directed at those with existing
problems)
Obesity Report, WHO 2000.
Levels of prevention

www.who.int/hpr/nutrition/ExpertConsultationGE.htm
Energy dense foods are high in fat &/or sugar. Low energy density (or energy dilute) foods are high in fibre and water, such as fruit, legumes, vegetables & whole grain cereals, as well as lean meat and fish.
Evidence Decreases risk None Increases risk
Convincing Regular physical activityHigh dietary NSP (fibre) intake
Increased intake energy-dense foodsSedentary lifestyles
Probable Home and school environments that support healthy food choices for children**
Heavy marketing of energy-dense foods** and fast-foodsAdverse socio-economic conditions (for women in developed world) Sugar-sweetened drinks /juices
Possible Low glycemic index foodsBreastfeeding
Protein content of the diet
Large portion sizesHigh proportion of food prepared outside the home (western countries)Restraint/disinhibition eating pattern
Nutrient recommendations for the prevention of excess weight gain and obesity

Total fatSaturated Fats (C14,C16)
Trans fatty acidsFree sugarsRefined starchesSodium/saltPreserved meats
Vegetables, Fruits, legumesFibre/NSP
ω - 3 fatty ac (LNA,EPA,DHA)
Iron/iodineZinc/folate?PHYSICAL ACTIVITY
Principal nutrient/food changesPrincipal nutrient/food changesPrincipal nutrient/food changes
IncreaseIncreaseIncreaseReduceReduceReduce

Low fat average proteinLow fat average protein Low fat high proteinLow fat high protein
High fat average proteinHigh fat average protein High fat high proteinHigh fat high protein

Objective: examined the effects of behavioral interventions onED values and explored how 6-mo ED changes relate to BW.Design: prospective study of 658 adults participating in the PREMIER trial, an 18-mo randomized, controlled, behavioral hypertensive persons were randomly assigned to 1 of 3 groups: the established group received monthly sessions implementing well-established hypertension recommendations and the Dietary Approaches to Stop Hypertension (DASH) increase plant foods, lower intake of meats, sugar, fats and sodium. Weight of food taken increased but Kcal intake dropped. Both large and modest reductions in energy density were associated with weight loss & better diet quality.
Am J Clin Nutr 2007;85:1212–21.

Am J Clin Nutr 2007;85:1212–21.

Objective: examine how changes in beverage consumption affect weight change among adults.Design: prospective study of 810 adults participating in the PREMIER trial, an 18-mo randomized, controlled, behavioral intervention trial. Measurements (weight, height, and 24-h dietary recall) were made at baseline, 6 mo, and 18 mo.Results: Liquid calorie intake had a stronger effect on weight loss than did solid calorie intake. Intake of sugar-sweetened beverages (SSBs) was significantly associated with weight. A reduction in SSB intake of 1 serving/d associated with a loss of 0.49 kg (0.11-0.82) p< 0.006) at 6 mo and of 0.65 kg (0.22- 1.09; p<0.003) at 18 mo.
Am J Clin Nutr 2009;89:1299–306.

Models were adjusted for baseline age, sex, race, education, income, BMI status, intervention groups, concurrent change in fitness, physical activity, and solid calorie intake

Model-adjusted mean 6-mo weight change and 95% Cls (6 mo – baseline) by tertile of 6-mo sugar-sweetened beverage (SSB) intake change and 18-mo weight change (18 mo – baseline) by tertile of 18-mo SSB intake change.

Total fatSaturated Fats (C14,C16)
Trans fatty acidsFree sugarsRefined starchesSodium/saltPreserved meats
Vegetables, Fruits, legumesFibre/NSP
ω - 3 fatty ac (LNA,EPA,DHA)
Iron/iodineZinc/folate?PHYSICAL ACTIVITY
Principal nutrient/food changesPrincipal nutrient/food changesPrincipal nutrient/food changes
IncreaseIncreaseIncreaseReduceReduceReduce
TOTAL ENERGY

Life Course approach to address obesity risk
Age
Dea
th a
nd D
isab
ilty
FetalLife
Adult LifeAdolescence
Infancy andChildhood
Breast FeedingSESInfectionPEM/StuntingMicronutrientsGrowth rateTallnessPhysical ActivityFood behaviourTV viewingSugary drinks
Childhood ObesityInactivityTV viewingSmoking Physical ActivityFood behaviourSugary drinks
Established adult risky behaviours Diet/Physical activity, Tobacco, AlcoholBiological risksSocioeconomic statusEnvironmentPoverty
SESMother’sNutritionGrowthBirth weight
Accumulated risk
Genetic susceptibility to disease
Elderly


![Fitness, Fatness, and Survival in Adults With Pre-Diabetes...2013/09/16 · adiposity (body mass index [BMI], waist circumference [WC], and body fat percentage [%BF]) with CVD and](https://img.pdfslide.net/doc/110x75/602758cd891b097d054c633d/fitness-fatness-and-survival-in-adults-with-pre-diabetes-20130916-adiposity.jpg)