Embed Size (px)
Citation preview
Research ArticleBMI Modulates the Effect of Thyroid Hormone on Lipid Profile inEuthyroid Adults
Yanqiu Wang,1 Qinglei Yin,1 Min Xu,1 Qicheng Ni,1 Weiqing Wang,1 and Qidi Wang1,2
1Shanghai National Clinical Research Center for Endocrine and Metabolic Diseases, Key Laboratory for Endocrine and MetabolicDiseases of Chinese Health Ministry, Ruijin Hospital Affiliated to Shanghai Jiaotong University School of Medicine, Shanghai200025, China2Sino-French Research Center for Life Sciences and Genomics, Ruijin Hospital Affiliated to Shanghai Jiaotong University School ofMedicine, Shanghai 200025, China
Correspondence should be addressed to Qidi Wang; [email protected]
Received 30 March 2017; Revised 26 May 2017; Accepted 8 June 2017; Published 13 August 2017
Academic Editor: Constantinos Pantos
Copyright © 2017 Yanqiu Wang et al. This is an open access article distributed under the Creative Commons Attribution License,which permits unrestricted use, distribution, and reproduction in any medium, provided the original work is properly cited.
The impacts of thyroid hormones (TH) on lipid profile in euthyroid adults have gained much attention. It is currently unknownwhether BMI influences such interaction. In the present study, we investigate the role of BMI in modulating the associationbetween TH and lipid parameters in 1372 euthyroid healthy adults. Our results show that thyroid parameters are differentiallyassociated with lipid profile. FT3 is positively correlated with total cholesterol (β = 0 176 ± 0 046, P < 0 001) and LDL cholesterollevels (β = 0 161 ± 0 040, P < 0 001). FT4 is negatively correlated with TG (β = −0 087 ± 0 029, P < 0 01) while positivelycorrelated with HDL cholesterol levels (β = 0 013 ± 0 005, P < 0 01). TSH is positively associated with TG (β = 0 145 ± 0 056,P < 0 05) and total cholesterol levels (β = 0 094 ± 0 030, P < 0 01). Importantly, BMI modulates the effect of TH on lipid profile:the interaction of FT4 and BMI and the interaction of FT3 and BMI reach statistical significance in predicting TG and HDLcholesterol levels, respectively. Stratified according to BMI levels, most associations between TH and lipid profile are significantonly in normal-weight group. In conclusion, in euthyroid adults, high normal FT3, TSH levels, and low normal FT4 levels areassociated with unfavorable lipid profile. BMI mediates the effect of thyroid function on lipid profile in euthyroid adults.
1. Introduction
Dyslipidemia constitutes a major risk factor for prematureatherosclerosis and cardiovascular disease (CVD), which isa major cause of morbidity and mortality in both developedand developing countries [1]. Dyslipidemia is defined asincreased triglycerides (TG) or low-density lipoproteincholesterol (LDL cholesterol) levels, or decreased high-density lipoprotein cholesterol (HDL cholesterol) levels. Aclustering of risk factors for developing dyslipidemia is age,eating habits, physical activity, stress, and heredity, as wellas thyroid function [2].
Thyroid hormones (TH) regulate multiple metabolicprocesses [3]. It is widely accepted that overt thyroid dys-functions (both hypo- and hyperthyroidism) are correlatedwith alternations in lipid and glucose metabolism [2].
Hyperthyroidism leads to a hypermetabolic state andincreased lipolysis, which is characterized by weight loss,lower plasma levels of HDL cholesterol, LDL cholesterol, andleptin [2]. Conversely, hypothyroidism has the oppositeeffects: hypothyroid patients are presentedwith higher plasmaTG, total cholesterol, and LDL cholesterol levels [2, 4, 5]. Themechanisms of thyroid hormone on metabolic phenotype inpatients with thyroid disease have been extensively investi-gated [3, 5]. Recently, the impacts of thyroid hormones withinnormal ranges on lipid profile have also been clarified [6–10].In euthyroid adults, FT3 within normal range is positivelycorrelated to dyslipidemia: high normal FT3 is associatedwitha less favorable metabolic phenotype in pregnant women [10]and in general euthyroid population [6]. On the other hand,several studies have shown that low normal FT4 or highnormalTSH levels are associatedwithunfavorable lipidprofile
HindawiInternational Journal of EndocrinologyVolume 2017, Article ID 8591986, 8 pageshttps://doi.org/10.1155/2017/8591986
and higher CVD risk [7, 9, 11–14]. Roos et al. found a negativerelation between FT4 and plasma total cholesterol and LDLcholesterol levels [7]. Moreover, a negative associationbetween FT4 and TG was also reported in euthyroid adults,even after adjustment for potential confounders [15, 16].TSH was positively associated with total cholesterol and LDLcholesterol levels both in euthyroid men and women [11, 13].Interestingly, in obese euthyroid population, Temizkan et al.could not identify significant associations between TSH andatherogenic dyslipidemia [8]. Moreover, in the obese setting,Marzullo et al. reported that TSH was positively associatedwith total cholesterol levels; however, the association disap-peared after controlling for individuals’ confounders, includ-ing BMI [16]. It is known that thyroid function status, evenwithin normal ranges, might correlate with alternationsin body weight and energy metabolism [17–19]. Moreover,it is well documented that obesity is correlated not onlywith unfavorable metabolic profiles but also with changesin thyroid hormone levels [20]. So far, little is knownwhether BMI mediates the influence of thyroid hormoneson lipid profile in euthyroid subjects.
The objective of the current study is to examine the asso-ciation between thyroid hormones and lipid parameters ineuthyroid adults. Furthermore, the role of BMI in modulat-ing the association between thyroid hormones and lipid pro-file is determined.
2. Methods
2.1. Study Population.We conducted this retrospective studywith subjects who participated in a routine health screeningexamination in Ruijin Hospital affiliated to Shanghai JiaoTong University School of Medicine between 2007 and2010. Individuals with previously diagnosed chronic cardio-vascular diseases, diabetes mellitus, and liver and kidneydiseases were excluded from our study. Women withdiagnosed pregnancy were also excluded. Furthermore,individuals receiving thyroid hormone substitutions orantithyroid drugs, which may potentially interfere withthyroid function or having TPO antibodies, antithyroglo-bulin antibodies above the clinical cutoff for positivity, orwith TSH levels outside the normal reference range ofour laboratory (TSH: 0.35–4.94mIU/L), were also excludedfrom our analyses, finally leaving 1372 subjects for inclu-sion in this investigation.
The study was approved by the Medical Ethics Commit-tee of Ruijin Hospital, Shanghai Jiao Tong University Schoolof Medicine and was conducted in accord with institutionalguidelines. The study was in accordance with the principleof the Helsinki Declaration II. All study participantsprovided written informed consents.
2.2. Measurements. Data on gender and age were obtainedfrom all the subjects. Standing height (cm) was measuredusing a wall-mounted Harpenden Stadiometer. Body weight(kg) was measured in light indoor clothing without shoes.Body mass index is defined as the body weight (kg) dividedby the square of the body height (m).
Normal weight is defined as 18.5≤BMI< 25 kg/m2, whileoverweight and obese are defined as BMI≥ 25 kg/m2 accord-ing to the WHO criteria [21].
2.3. Biochemical Determinations. Blood samples wereobtained from all the subjects after overnight fasting. Chemi-luminescent methods (Cobas E601; Roche, Basel, Switzer-land) were used to quantitate thyroid function based onfree triiodothyronine (FT3), free thyroxine (FT4), and thyro-tropin (TSH) levels. Serum total cholesterol, low-densitylipoprotein cholesterol (LDL cholesterol), high-densitylipoprotein cholesterol (HDL cholesterol), and TG were mea-sured using an autoanalyzer (ARCHITECT ci16200 analyzer;Abbott Laboratories, Abbott, IL) in the Shanghai Institute ofEndocrine and Metabolic Diseases.
2.4. Statistical Analysis. All statistical analyses (linear regres-sion analyses, logistic regression analyses, and one-wayanalysis of variance (ANOVA)) were performed using SAS9.2 (SAS Institute, Cary, NC). Data were given as mean± standard deviation for normally distributed continuousparameters, and for skewness distribution data, median andinterquartile range was used. Descriptive statistics were usedto describe the study population at the baseline.
Linear regression analysis was used to identify the associ-ation between different thyroid parameters and differentlipid parameters. These models were all adjusted for age, gen-der, and BMI. Each BMI subgroup was sequentially assignedto tertiles according to their plasma FT3, FT4, and TSHlevels. Associations between thyroid function parametersand lipid profile among tertiles were identified using one-way ANOVA in each BMI subgroup. P for interactionresulted from linear regression analysis with FT3∗BMI (FT4∗BMI, or TSH∗BMI) as independent variable and lipidprofile as dependent variables, after multiple adjustment forage, gender, BMI, and FT3 (or FT4 and TSH). We furtherdivided the population into subgroups according to gender,and P for interaction was calculated after adjustment forage, BMI, and FT3 (or FT4 and TSH).
The P values reported were two sided. Statistical signifi-cance was assumed for P values < 0.05.
3. Results
3.1. General Characteristics of the Study Population. Charac-teristics of the study population, their anthropometric data,metabolic parameters, and descriptions for thyroid hor-mones were shown in Table 1. A total of 1372 euthyroid sub-jects (973 males and 399 females) were enrolled in this study,in which 36.0% were overweight (25≤BMI< 30 kg/m2) and4.2% were obese (BMI≥ 30 kg/m2). There were evidentdifferences in lipid parameters and thyroid hormone levelsbetween subgroups with BMI≥ 25 kg/m2 (overweight/obesegroup: average BMI 27.28± 1.96 kg/m2) and with18.5≤BMI< 25 kg/m2 (normal-weight group: average BMI22.43± 1.70 kg/m2). Subjects in the overweight/obese grouphad worse lipid profile compared to the normal-weightcontrols: they had significantly higher TG levels (1.90(1.32–2.86) versus 1.27 (0.87–1.89) mmol/L, P < 0 001), total
2 International Journal of Endocrinology
cholesterol levels (4.95± 0.94 versus 4.82± 0.96mmol/L,P < 0 05), and lower HDL cholesterol levels (11.64± 2.95versus 13.21± 3.34mg/L, P < 0 001) (Table 1). There wasno significant difference in LDL cholesterol levels betweenthe two groups (Table 1).
Thyroid hormone levels between subjects in differentBMI categories also varied significantly. Subjects in the over-weight/obese group showed increased FT3 levels (4.29± 0.58versus 4.11± 0.57 pmol/L, P < 0 001), but decreased FT4levels (12.41± 1.54 versus 12.62± 1.70 pmol/L, P < 0 05).Moreover, TSH levels were slightly lower in the overweight/obese group but did not reach statistical significance(1.58± 0.85 versus 1.66± 0.86 mIU/L, P=0.074).
3.2. The Association between TH and Lipid Profile inEuthyroid Adults. To understand the relationship betweenthe levels of thyroid hormones and lipid parameters,we performed linear regression analyses, adjusted forage, gender, and BMI in euthyroid subjects. As shownin Table 2, FT3 and FT4 were differentially associatedwith lipid parameters in euthyroid subjects. FT3 wassignificantly and positively correlated with total choles-terol (β = 0 176 ± 0 046, P < 0 001) and LDL cholesterolconcentrations (β = 0 161 ± 0 040, P < 0 0001). On thecontrary, FT4 levels were negatively correlated with TG(β = −0 087 ± 0 029, P < 0 01) but positively associatedwith HDL cholesterol levels (β = 0 013 ± 0 005, P < 0 01).
TSH levels were significantly and positively related toboth TG (β = 0 145 ± 0 056, P < 0 05) and total choles-terol levels (β = 0 094 ± 0 030, P < 0 01).
3.3. BMI Modulates the Association between TH and LipidProfile in Euthyroid Adults. We further tested whether therewere interactions between BMI and thyroid parameters inmodulating lipid profile. Importantly, the interaction ofFT3 and BMI and the interaction of FT4 and BMI reachedstatistical significance in predicting serum HDL cholesterol(P < 0 05) and TG concentrations (P < 0 05), respectively,after multiple adjustment for age, gender, BMI, and FT3 (orFT4) (Table 3). We also examined the interaction of TSHand BMI in predicting lipid parameters; however, we couldnot find statistical significance in predicting any of theparameters in the whole population (Table 3).
It is known that thyroid function and lipid profile can beinfluenced by gender [6, 12, 14]. Therefore, gender-basedinteraction analyses were also performed. As shown in TableS1 available online at https://doi.org/10.1155/2017/8591986,the interaction of FT3 and BMI remained significant in pre-dicting serum HDL cholesterol in male subjects (P < 0 05),whereas the interaction of FT4 and BMI was significant inmodulating TG concentrations in females (P < 0 05). Inter-estingly, the interaction of TSH and BMI also appeared sta-tistical significance in both male and female subjects:predicting total cholesterol and LDL cholesterol levels inmales (both P < 0 05), while predicting TG levels in females(P < 0 01) (Table S1).
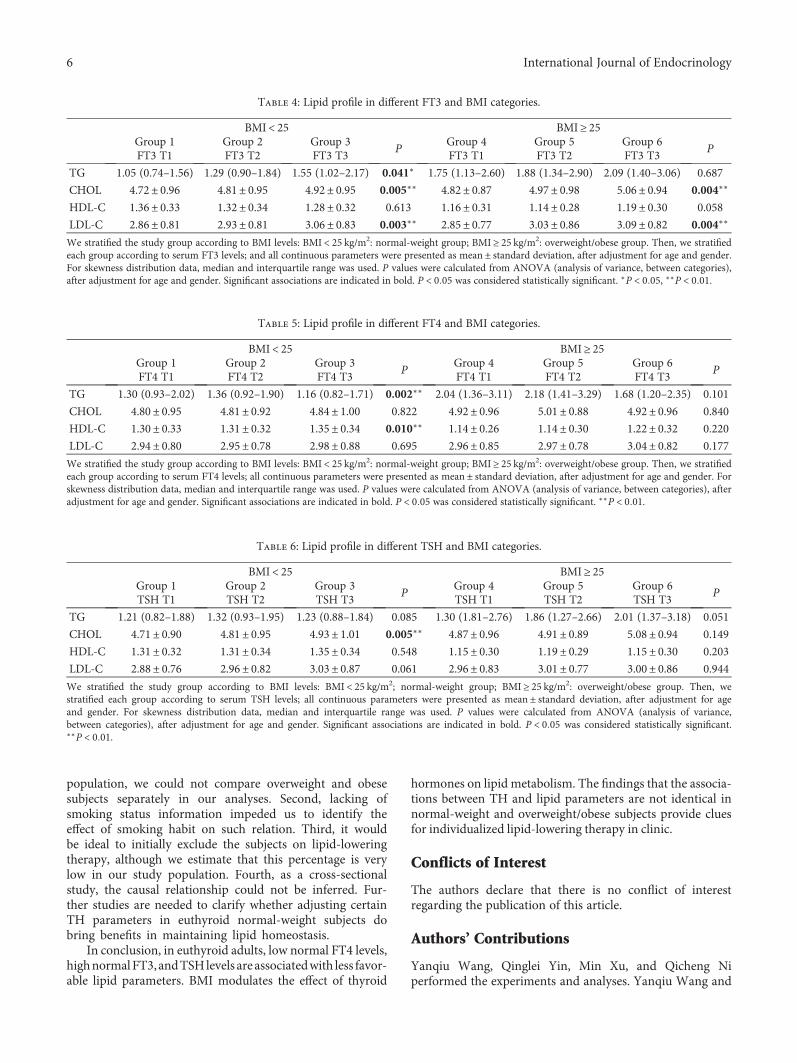
3.4. The Association between TH and Lipid Profile in theNormal-Weight and Overweight/Obese Groups. Since BMImodulates the interaction between thyroid parameters andlipid profile, we further checked whether the associationbetween thyroid parameters and lipid profile varied in sub-jects with different BMI. We performed linear regressionanalyses separately in the normal-weight and overweight/obese groups (Table 3). In the normal-weight and over-weight/obese groups, the subjects were further sequentiallyassigned to tertiles according to their plasma FT3 (Table 4),FT4 (Table 5), or TSH (Table 6) levels.
A positive correlation between FT3 andTG levels was onlysignificant in the normal-weight subjects (β = 0 145 ± 0 071,P < 0 05; Table 3), with an increase in TG level across the ter-tiles (P < 0 05; Table 4). In both normal-weight and over-weight/obese groups, FT3 was positively associated withtotal cholesterol and LDL cholesterol levels (both P < 0 01,Table 3). In parallel, the higher FT3 tertiles (T2 and T3) hadsignificantly elevated total cholesterol (P < 0 01) and LDLcholesterol levels (P < 0 01) compared to the lowest tertile(T1) in both normal-weight and overweight/obese groups(Table 4).
We then stratified the population according to theirserum FT4 levels. A significant correlation between FT4and TG (β = −0 071 ± 0 022, P < 0 01) as well as FT4 withHDL (β = 0 017 ± 0 006, P < 0 01) were only detected in thenormal-weight subjects (both P < 0 01), but not in the over-weight/obese group (Table 3). Similarly, significantlydecreased plasma TG and increased HDL cholesterol levels
Table 1: General, anthropometric, hormonal, and metabolicparameters of the study population.
18.5 ≤ BMI< 25 BMI ≥ 25P value
(n = 820) (n = 552)General characteristics
Age (years) 48.33 ± 9.28 48.64 ± 8.34 0.525
Height (cm) 167.56 ± 7.05 170.61 ± 6.08 <0.001∗∗∗
Body weight (kg) 63.20 ± 8.00 79.52 ± 8.28 <0.001∗∗∗
BMI (kg/m2) 22.43 ± 1.70 27.28 ± 1.96 <0.001∗∗∗
Lipid profile
TG (mmol/L) 1.27(0.87–1.89) 1.90 (1.32–2.86) <0.001∗∗∗
Total cholesterol (mmol/L) 4.82 ± 0.96 4.95 ± 0.94 <0.05∗
HDL cholesterol (mg/L) 13.21 ± 3.34 11.64 ± 2.95 <0.001∗∗∗
LDL cholesterol (mg/L) 29.53 ± 8.18 29.93 ± 8.18 0.386
TSH and thyroid hormones
FT3 (pmol/L) 4.11 ± 0.57 4.29 ± 0.58 <0.001∗∗∗
FT4 (pmol/L) 12.62 ± 1.70 12.41 ± 1.54 <0.05∗
TSH (mIU/L) 1.66 ± 0.86 1.58 ± 0.85 0.074
Subjects on thyroid medications, with TPO antibodies, anti-thyroglobulinantibodies above clinical cutoff, and with TSH levels outside the referencerange, were excluded from further analyses. We stratified the study groupaccording to BMI levels: 18.5 ≤ BMI< 25 kg/m2: normal-weight group;BMI ≥ 25 kg/m2: overweight/obese group. All continuous parameters werepresented as mean ± standard deviation. For skewness distribution data,median and interquartile range was used. P values were calculated fromone-way analysis of variance. BMI: body mass index; FT3: freetriiodothyronine; FT4: free thyroxine; TSH: thyrotropin; TG: triglycerides;HDL: high-density lipoprotein; LDL: low-density lipoprotein. Significantassociations are indicated in bold. P < 0 05 was considered statisticallysignificant. ∗P < 0 05, ∗∗∗P < 0 001
3International Journal of Endocrinology
(both P < 0 01) were observed in the highest tertile of FT4only in the normal-weight group (Table 5).
A significant positive association between serum TSHlevels and total cholesterol levels was only found in thenormal-weight group (β = 0 110 ± 0 039, P < 0 01; Table 3).Indeed, significantly increased total cholesterol levels in thehighest tertile of TSH were observed exclusively in thenormal-weight group (P < 0 01; Table 6).
4. Discussion
Thyroid hormones influence key metabolic pathways whichcontrol energy balance by regulating energy storage andexpenditure [5]. Overt thyroid dysfunctions are associatedwith alternations in lipid metabolism [2–5]. Recent studieshave shown that changes in thyroid hormone levels, evenwithin the physiological ranges, may contribute to the deteri-orating of atherogenic lipid profile [6, 7, 9, 11, 12]. Thepresent study with 1372 euthyroid adults demonstrated thatFT3 was significantly and positively correlated with totaland LDL cholesterol concentrations, whereas FT4 levels werenegatively correlated with TG but positively associated withHDL cholesterol levels. Moreover, TSH levels weresignificantly and positively related to both TG and totalcholesterol levels. Our findings were in line with several pre-vious studies [6, 7, 12–16, 22, 23], showing that low normalFT4 [7, 9, 11–14] and high normal FT3 [6, 10] and TSH[11, 13] levels are associated with unfavorable lipid profilein euthyroid subjects. However, in obese euthyroid popula-tion, previous studies showed that some of these associationscould not be identified [8] or disappeared after controllingfor individuals’ confounders including BMI [16]. Interest-ingly, when we performed linear regression analyses sepa-rately in the normal-weight and overweight/obese groups,we clearly reported that the associations between thyroidparameters and lipid parameters were not identical: thecorrelation between FT3 (or FT4) and TG and the correla-tion between TSH and total cholesterol were only signifi-cant in the normal-weight group, but not in individualswith BMI≥ 25 kg/m2. The observations strongly indicatethat body weight might interfere with the effect of THon lipid profile.
The thyroid and adipose tissue are organs producing thy-roid hormones and adipokines, respectively [24]. Both ofthem play central roles in the metabolism of the body. Several
studies have shown that variations in TSH and thyroid hor-mones within normal ranges can influence body weight andsubsequently alter lipid profile [25]. On the other hand, dis-turbed TH levels have been reported in obese subjects [25]and were also observed in subjects with BMI≥ 25 kg/m2 inthe current study. However, the influence of body weighton the interaction of TH and lipid profile has not been clearlyclarified in the literature. Importantly, we showed thatserum FT4 levels and BMI had interactions in predictingserum TG levels, whereas FT3 and BMI had interactionsin predicting HDL cholesterol levels in euthyroid popula-tion. Such interactions remained significant and even morepronounced when we performed gender-based interactionanalyses: TSH and BMI reached significance in predictingtotal cholesterol and LDL cholesterol levels in males, aswell as TG levels in females.
As generally accepted, obesity is closely associated withdyslipidemia, manifested as elevated fasting and postprandialTG in combination with the preponderance of small denseLDL and low HDL cholesterol [26]. Obesity increases freefatty acid (FFA) fluxes to the liver, adipose tissue, and skeletalmuscle, which leads to alter expression of lipoprotein lipase(LPL) activity and hampers lipolysis and TG accumulationand transport, subsequently causes dyslipidemia [26]. It iscurrently unknown how BMI interferes with the effect of thy-roid hormones on lipid profile, and it is possible that certainadipokines, such as leptin, play a role via hypothalamic-pituitary-thyroid axis [27, 28]. Although changes in THlevels within normal ranges have independent influence onlipid profile in normal-weight subjects, such impact mightbe neglectable in overweight/obese individuals. Thus, thecurrent observations might be clinical relevant regardingstrategies for individualized lipid control. In normal-weightsubjects, TH levels within normal ranges should be takeninto account: low normal FT3, TSH levels, and high nor-mal FT4 levels might be beneficial for lipid control. How-ever, in overweight/obese subjects, weight loss absolutelytakes priority. The disturbed levels of TH in obesity canbe reversed after weight loss [29] and might have addi-tional impact on lipid management.
The novelty of the study is that, to the best of ourknowledge, we are the first to identify the role of BMI inmodulating the effect of thyroid hormones on lipid profilein euthyroid adults. However, our study has several limita-tions. First, due to the small sample size of obese
Table 2: The association between lipid profile and thyroid parameters.
Dependent variableFT3 FT4 TSH
β± SE P β± SE P β± SE P
TG 0.075± 0.087 0.392 −0.087± 0.029 0.003∗∗ 0.145± 0.056 0.010∗
CHOL 0.176± 0.046 0.0002∗∗∗ 0.005± 0.016 0.761 0.094± 0.030 0.002∗∗
HDL-C 0.029± 0.015 0.051 0.013± 0.005 0.007∗∗ −0.002± 0.010 0.825
LDL-C 0.161± 0.040 P < 0 0001∗∗∗ 0.016± 0.013 0.237 0.039± 0.026 0.137
Reported values are betas ± standard error and results from linear regression analysis with lipid parameters as dependent variables and thyroid parameters asindependent variables. Betas are scaled and adjusted for age, gender, and BMI. CHOL: total cholesterol; HDL-C: high-density lipoprotein cholesterol; LDL-C:low-density lipoprotein cholesterol. Significant associations are indicated in bold. P < 0 05 was considered statistically significant. ∗P < 0 05, ∗∗P < 0 01, and∗∗∗P < 0 001.
4 International Journal of Endocrinology
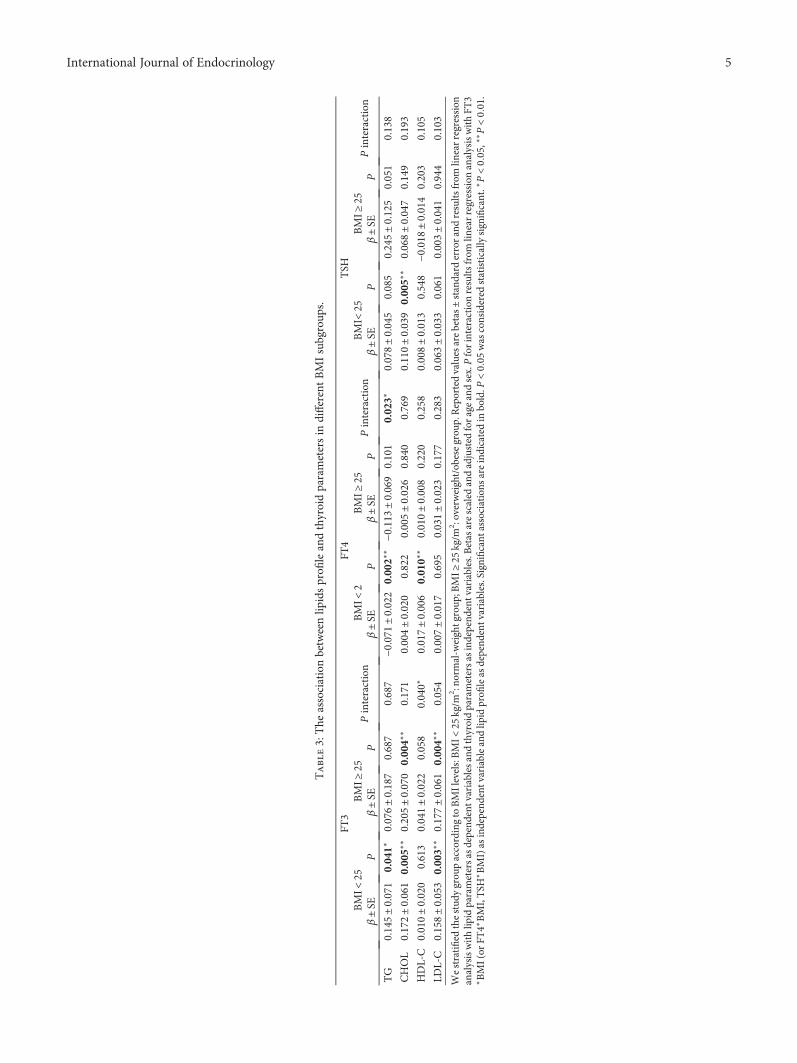
Table3:The
associationbetweenlip
idsprofi
leandthyroidparametersin
differentBMIsubgroup
s.
FT3
FT4
TSH
BMI<
25BMI≥
25Pinteraction
BMI<
2BMI≥
25Pinteraction
BMI<
25BMI≥
25Pinteraction
β±SE
Pβ±SE
Pβ±SE
Pβ±SE
Pβ±SE
Pβ±SE
P
TG
0.145±0.071
0.041∗
0.076±0.187
0.687
0.687
−0.071
±0.022
0.002∗
∗−0
.113
±0.069
0.101
0.023∗
0.078±0.045
0.085
0.245±0.125
0.051
0.138
CHOL
0.172±0.061
0.005∗
∗0.205±0.070
0.004∗
∗0.171
0.004±0.020
0.822
0.005±0.026
0.840
0.769
0.110±0.039
0.005∗
∗0.068±0.047
0.149
0.193
HDL-C
0.010±0.020
0.613
0.041±0.022
0.058
0.040∗
0.017±0.006
0.010∗
∗0.010±0.008
0.220
0.258
0.008±0.013
0.548
−0.018
±0.014
0.203
0.105
LDL-C
0.158±0.053
0.003∗
∗0.177±0.061
0.004∗
∗0.054
0.007±0.017
0.695
0.031±0.023
0.177
0.283
0.063±0.033
0.061
0.003±0.041
0.944
0.103
Westratified
thestud
ygrou
paccordingtoBMIlevels:BMI<
25kg/m
2 :no
rmal-w
eightgroup
;BMI≥
25kg/m
2 :overweight/obesegrou
p.Reportedvaluesarebetas±
standard
errorandresults
from
linearregression
analysiswithlip
idparametersasdepend
entvariablesandthyroidparametersas
independ
entvariables.B
etas
arescaled
andadjusted
forageandsex.Pforinteractionresults
from
linearregression
analysiswithFT
3∗BMI(or
FT4∗BMI,TSH
∗BMI)as
independ
entvariableandlip
idprofi
leas
depend
entvariables.Significant
associations
areindicatedin
bold.P
<005
was
considered
statistically
significant.∗P<005,∗
∗P<001.
5International Journal of Endocrinology
population, we could not compare overweight and obesesubjects separately in our analyses. Second, lacking ofsmoking status information impeded us to identify theeffect of smoking habit on such relation. Third, it wouldbe ideal to initially exclude the subjects on lipid-loweringtherapy, although we estimate that this percentage is verylow in our study population. Fourth, as a cross-sectionalstudy, the causal relationship could not be inferred. Fur-ther studies are needed to clarify whether adjusting certainTH parameters in euthyroid normal-weight subjects dobring benefits in maintaining lipid homeostasis.
In conclusion, in euthyroid adults, low normal FT4 levels,highnormalFT3, andTSHlevels are associatedwith less favor-able lipid parameters. BMI modulates the effect of thyroid
hormones on lipid metabolism. The findings that the associa-tions between TH and lipid parameters are not identical innormal-weight and overweight/obese subjects provide cluesfor individualized lipid-lowering therapy in clinic.
Conflicts of Interest
The authors declare that there is no conflict of interestregarding the publication of this article.
Authors’ Contributions
Yanqiu Wang, Qinglei Yin, Min Xu, and Qicheng Niperformed the experiments and analyses. Yanqiu Wang and
Table 5: Lipid profile in different FT4 and BMI categories.
BMI< 25 BMI≥ 25Group 1FT4 T1
Group 2FT4 T2
Group 3FT4 T3
PGroup 4FT4 T1
Group 5FT4 T2
Group 6FT4 T3
P
TG 1.30 (0.93–2.02) 1.36 (0.92–1.90) 1.16 (0.82–1.71) 0.002∗∗ 2.04 (1.36–3.11) 2.18 (1.41–3.29) 1.68 (1.20–2.35) 0.101
CHOL 4.80± 0.95 4.81± 0.92 4.84± 1.00 0.822 4.92± 0.96 5.01± 0.88 4.92± 0.96 0.840
HDL-C 1.30± 0.33 1.31± 0.32 1.35± 0.34 0.010∗∗ 1.14± 0.26 1.14± 0.30 1.22± 0.32 0.220
LDL-C 2.94± 0.80 2.95± 0.78 2.98± 0.88 0.695 2.96± 0.85 2.97± 0.78 3.04± 0.82 0.177
We stratified the study group according to BMI levels: BMI < 25 kg/m2: normal-weight group; BMI ≥ 25 kg/m2: overweight/obese group. Then, we stratifiedeach group according to serum FT4 levels; all continuous parameters were presented as mean ± standard deviation, after adjustment for age and gender. Forskewness distribution data, median and interquartile range was used. P values were calculated from ANOVA (analysis of variance, between categories), afteradjustment for age and gender. Significant associations are indicated in bold. P < 0 05 was considered statistically significant. ∗∗P < 0 01.
Table 6: Lipid profile in different TSH and BMI categories.
BMI< 25 BMI≥ 25Group 1TSH T1
Group 2TSH T2
Group 3TSH T3
PGroup 4TSH T1
Group 5TSH T2
Group 6TSH T3
P
TG 1.21 (0.82–1.88) 1.32 (0.93–1.95) 1.23 (0.88–1.84) 0.085 1.30 (1.81–2.76) 1.86 (1.27–2.66) 2.01 (1.37–3.18) 0.051
CHOL 4.71± 0.90 4.81± 0.95 4.93± 1.01 0.005∗∗ 4.87± 0.96 4.91± 0.89 5.08± 0.94 0.149
HDL-C 1.31± 0.32 1.31± 0.34 1.35± 0.34 0.548 1.15± 0.30 1.19± 0.29 1.15± 0.30 0.203
LDL-C 2.88± 0.76 2.96± 0.82 3.03± 0.87 0.061 2.96± 0.83 3.01± 0.77 3.00± 0.86 0.944
We stratified the study group according to BMI levels: BMI < 25 kg/m2; normal-weight group; BMI ≥ 25 kg/m2: overweight/obese group. Then, westratified each group according to serum TSH levels; all continuous parameters were presented as mean ± standard deviation, after adjustment for ageand gender. For skewness distribution data, median and interquartile range was used. P values were calculated from ANOVA (analysis of variance,between categories), after adjustment for age and gender. Significant associations are indicated in bold. P < 0 05 was considered statistically significant.∗∗P < 0 01.
Table 4: Lipid profile in different FT3 and BMI categories.
BMI< 25 BMI≥ 25Group 1FT3 T1
Group 2FT3 T2
Group 3FT3 T3
PGroup 4FT3 T1
Group 5FT3 T2
Group 6FT3 T3
P
TG 1.05 (0.74–1.56) 1.29 (0.90–1.84) 1.55 (1.02–2.17) 0.041∗ 1.75 (1.13–2.60) 1.88 (1.34–2.90) 2.09 (1.40–3.06) 0.687
CHOL 4.72± 0.96 4.81± 0.95 4.92± 0.95 0.005∗∗ 4.82± 0.87 4.97± 0.98 5.06± 0.94 0.004∗∗
HDL-C 1.36± 0.33 1.32± 0.34 1.28± 0.32 0.613 1.16± 0.31 1.14± 0.28 1.19± 0.30 0.058
LDL-C 2.86± 0.81 2.93± 0.81 3.06± 0.83 0.003∗∗ 2.85± 0.77 3.03± 0.86 3.09± 0.82 0.004∗∗
We stratified the study group according to BMI levels: BMI < 25 kg/m2: normal-weight group; BMI ≥ 25 kg/m2: overweight/obese group. Then, we stratifiedeach group according to serum FT3 levels; and all continuous parameters were presented as mean ± standard deviation, after adjustment for age and gender.For skewness distribution data, median and interquartile range was used. P values were calculated from ANOVA (analysis of variance, between categories),after adjustment for age and gender. Significant associations are indicated in bold. P < 0 05 was considered statistically significant. ∗P < 0 05, ∗∗P < 0 01.
6 International Journal of Endocrinology
Qidi Wang wrote the manuscript. Weiqing Wang and QidiWang designed the project, supervised the research, andcoordinated the execution of the experimental plan. YanqiuWang and Qinglei Yin contributed equally to this work.
Acknowledgments
This work was supported by the National Natural SciencesFoundation of China Grants (81370875 and 81670700)and the National Basic Research Program of China(2015CB553601). The authors thank M. Zhang (Depart-ment of Nuclear Medicine, Ruijin Hospital) for collectingthe clinical data.
References
[1] C. J. L. Murray and A. D. Lopez, “Mortality by cause for eightregions of the world: global burden of disease study,” TheLancet, vol. 349, no. 9061, pp. 1269–1276, 1997.
[2] Y. Chen, X. Wu, R. Wu et al., “Changes in profile of lipids andadipokines in patients with newly diagnosed hypothyroidismand hyperthyroidism,” Scientific Reports, vol. 6, article 26174,2016.
[3] R. Mullur, Y.-Y. Liu, and G. A. Brent, “Thyroid hormoneregulation of metabolism,” Physiological Reviews, vol. 94,no. 2, pp. 355–382, 2014.
[4] G. A. Brent, “Graves’ disease,” New England Journal ofMedicine, vol. 358, no. 24, pp. 2594–2605, 2008.
[5] G. A. Brent, “Mechanisms of thyroid hormone action,” TheJournal of Clinical Investigation, vol. 122, no. 9, pp. 3035–3043.
[6] G. L. Roef, E. R. Rietzschel, C. M. Van Daele et al., “Triiodothy-ronine and free thyroxine levels are differentially associatedwith metabolic profile and adiposity-related cardiovascularrisk markers in euthyroid middle-aged subjects,” Thyroid,vol. 24, no. 2, pp. 223–231, 2014.
[7] A. Roos, S. J. L. Bakker, T. P. Links, R. O. B. Gans, and B. H. R.Wolffenbuttel, “Thyroid function is associated with compo-nents of the metabolic syndrome in euthyroid subjects,” TheJournal of Clinical Endocrinology & Metabolism, vol. 92,no. 2, pp. 491–496, 2007.
[8] S. Temizkan, B. Balaforlou, A. Ozderya et al., “Effects ofthyrotrophin, thyroid hormones and thyroid antibodies onmetabolic parameters in a euthyroid population with obe-sity,” Clinical Endocrinology, vol. 85, no. 4, pp. 616–623,2016.
[9] F. Wang, Y. Tan, C. Wang et al., “Thyroid-stimulating hor-mone levels within the reference range are associated withserum lipid profiles independent of thyroid hormones,” TheJournal of Clinical Endocrinology & Metabolism, vol. 97,no. 8, pp. 2724–2731, 2012.
[10] J. Bassols, A. Prats-Puig, P. Soriano-Rodríguez et al., “Lowerfree thyroxin associates with a less favorable metabolic pheno-type in healthy pregnant women,” The Journal of ClinicalEndocrinology & Metabolism, vol. 96, no. 12, pp. 3717–3723,2011.
[11] Y. Zhang, P. Lu, L. Zhang, and X. Xiao, “Association betweenlipids profile and thyroid parameters in euthyroid diabeticsubjects: a cross-sectional study,” BMC Endocrine Disorders,vol. 15, p. 12, 2015.
[12] J. Wang, X. Zheng, M. Sun et al., “Low serum free thyroxineconcentrations associate with increased arterial stiffness ineuthyroid subjects: a population-based cross-sectional study,”Endocrine, vol. 50, no. 2, pp. 465–473, 2015.
[13] M. Laclaustra, Y. Hurtado-Roca, M. Sendin et al., “Lower-nor-mal TSH is associated with better metabolic risk factors: across-sectional study on Spanish men,” Nutrition, Metabolismand Cardiovascular Diseases, vol. 25, no. 12, pp. 1095–1103,2015.
[14] J. J. Lee, A. Pedley, E. Marqusee et al., “Thyroid function andcardiovascular disease risk factors in euthyroid adults: across-sectional and longitudinal study,” Clinical Endocrinol-ogy, vol. 85, no. 6, pp. 932–941, 2016.
[15] H. S. Shon, E. D. Jung, S. H. Kim, and J. H. Lee, “Free T4 isnegatively correlated with body mass index in euthyroidwomen,” The Korean Journal of Internal Medicine, vol. 23,no. 2, pp. 53–57, 2008.
[16] P. Marzullo, C. Mele, S. Mai et al., “The impact of the meta-bolic phenotype on thyroid function in obesity,” Diabetology& Metabolic Syndrome, vol. 8, no. 1, p. 59, 2016.
[17] A. Nagel, A. Spinneker, and M. Neuhäuser-Berthold, “Associ-ation of thyroid-stimulating hormone with resting energyexpenditure in euthyroid elderly subjects: a cross-sectionalstudy,” Annals of Nutrition and Metabolism, vol. 68, no. 1,pp. 12–18, 2016.
[18] B. O. Åsvold, T. Bjøro, and L. J. Vatten, “Association of serumTSH with high body mass differs between smokers and never-smokers,” The Journal of Clinical Endocrinology & Metabo-lism, vol. 94, no. 12, pp. 5023–5027, 2009.
[19] J. J. Díez and P. Iglesias, “Relationship between thyrotropinand body mass index in euthyroid subjects,” Experimentaland Clinical Endocrinology & Diabetes, vol. 119, no. 03,pp. 144–150, 2011.
[20] X. Wang, H. Liu, J. Chen et al., “Metabolic characteristics inobese patients complicated by mild thyroid hormone defi-ciency,” Hormone and Metabolic Research, vol. 48, no. 5,pp. 331–337, 2016.
[21] World Health, O, “Physical status: the use and interpretationof anthropometry,” WHO Technical Report Series, vol. 0,no. 854, 1995.
[22] B. O. Åsvold, T. Bjøro, C. Platou, and L. J. Vatten, “Thyroidfunction and the risk of coronary heart disease: 12-yearfollow-up of the HUNT study in Norway,” Clinical Endocri-nology, vol. 77, no. 6, pp. 911–917, 2012.
[23] Y. K. Lee, J. E. Kim, H. J. Oh et al., “Serum TSH level in healthyKoreans and the association of TSH with serum lipid concen-tration and metabolic syndrome,” The Korean Journal of Inter-nal Medicine, vol. 26, no. 4, pp. 432–439, 2011.
[24] S. Galic, J. S. Oakhill, and G. R. Steinberg, “Adipose tissue as anendocrine organ,” Molecular and Cellular Endocrinology,vol. 316, no. 2, pp. 129–139, 2010.
[25] T. Reinehr, “Obesity and thyroid function,” Molecular andCellular Endocrinology, vol. 316, no. 2, pp. 165–171, 2010.
[26] B. Klop, J. W. F. Elte, and M. Castro Cabezas, “Dyslipidemia inobesity: mechanisms and potential targets,” Nutrients, vol. 5,no. 4, pp. 1218–1240, 2013.
[27] F. Santini, P. Marzullo, M. Rotondi et al., “Mechanisms inendocrinology: the crosstalk between thyroid gland andadipose tissue: signal integration in health and disease,”European Journal of Endocrinology, vol. 171, no. 4,pp. R137–R152, 2014.
7International Journal of Endocrinology
[28] M. Yamamoto, K. Uchihashi, S. Aoki, E. Koike, N. Kakihara,and S. Toda, “Interaction between thyrocytes and adiposetissue in vitro,” Pathology International, vol. 66, no. 3,pp. 148–157, 2016.
[29] P. Kok, F. Roelfsema, J. G. Langendonk et al., “High circulatingthyrotropin levels in obese women are reduced after bodyweight loss induced by caloric restriction,” The Journal ofClinical Endocrinology & Metabolism, vol. 90, no. 8,pp. 4659–4663, 2005.
8 International Journal of Endocrinology

Submit your manuscripts athttps://www.hindawi.com
Stem CellsInternational
Hindawi Publishing Corporationhttp://www.hindawi.com Volume 2014
Hindawi Publishing Corporationhttp://www.hindawi.com Volume 2014
MEDIATORSINFLAMMATION
of
Hindawi Publishing Corporationhttp://www.hindawi.com Volume 2014
Behavioural Neurology
EndocrinologyInternational Journal of
Hindawi Publishing Corporationhttp://www.hindawi.com Volume 2014
Hindawi Publishing Corporationhttp://www.hindawi.com Volume 2014
Disease Markers
Hindawi Publishing Corporationhttp://www.hindawi.com Volume 2014
BioMed Research International
OncologyJournal of
Hindawi Publishing Corporationhttp://www.hindawi.com Volume 2014
Hindawi Publishing Corporationhttp://www.hindawi.com Volume 2014
Oxidative Medicine and Cellular Longevity
Hindawi Publishing Corporationhttp://www.hindawi.com Volume 2014
PPAR Research
The Scientific World JournalHindawi Publishing Corporation http://www.hindawi.com Volume 2014
Immunology ResearchHindawi Publishing Corporationhttp://www.hindawi.com Volume 2014
Journal of
ObesityJournal of
Hindawi Publishing Corporationhttp://www.hindawi.com Volume 2014
Hindawi Publishing Corporationhttp://www.hindawi.com Volume 2014
Computational and Mathematical Methods in Medicine
OphthalmologyJournal of
Hindawi Publishing Corporationhttp://www.hindawi.com Volume 2014
Diabetes ResearchJournal of
Hindawi Publishing Corporationhttp://www.hindawi.com Volume 2014
Hindawi Publishing Corporationhttp://www.hindawi.com Volume 2014
Research and TreatmentAIDS
Hindawi Publishing Corporationhttp://www.hindawi.com Volume 2014
Gastroenterology Research and Practice
Hindawi Publishing Corporationhttp://www.hindawi.com Volume 2014
Parkinson’s Disease
Evidence-Based Complementary and Alternative Medicine
Volume 2014Hindawi Publishing Corporationhttp://www.hindawi.com


![Atypical Thyroid Function Tests, Thyroid Hormone ... · Atypical Thyroid Function Tests, Thyroid Hormone Resistance [Atipik Tiroid Fonksiyon Testleri: Tiroid Hormon Direnci] Soner](https://img.pdfslide.net/doc/110x75/5c83755009d3f2be2a8b56f6/atypical-thyroid-function-tests-thyroid-hormone-atypical-thyroid-function.jpg)