Embed Size (px)
Citation preview


This document is a visual aid accompanying a presentation to analysts by Anthony Healy, Managing Director and Chief Executive Officer BNZ, Adrienne Duarte, Chief Financial Officer BNZ, and Peter Whitelaw, Chief Risk Officer BNZ on 5 June 2015. It is not intended to be read as a stand-alone document. It contains select information, in abbreviated or summary form, and does not purport to be complete. It is intended to be read by a sophisticated investor audience familiar with National Australia Bank Limited (Company) and its March 2015 Half Year Results, and to be accompanied by the verbal presentation. This document should not be read without first reading the National Australia Bank Limited March 2015 Half Year Results, which has been lodged with the Australian Securities Exchange and is available at www.nab.com.au.
The verbal presentation to analysts places emphasis on cash earnings measures of the Group’s performance. NAB uses cash earnings for its internal management reporting purposes and considers it a better reflection of the Group’s underlying performance. Accordingly, as a visual aid to that presentation, information in this document is presented on a cash earnings basis unless otherwise stated.
Cash earnings is calculated by excluding some items which are included within the statutory net profit attributable to owners of the Company. It is not a statutory financial measure and is not presented in accordance with Australian Accounting Standards nor audited or reviewed in accordance with Australian Auditing Standards. The definition of cash earnings, a discussion of non-cash earnings items and a full reconciliation of the cash earnings to statutory net profit attributable to owners of the company is set out on pages 2 – 8 of the National Australia Bank Limited March 2015 Half Year Results Announcement.
The Group’s financial statements, prepared in accordance with the Corporations Act 2001 (Cth) and Australian Accounting Standards, and reviewed by the auditors in accordance with Australian Auditing Standards, are included in Section 5 of the 2015 Half Year Results Announcement.
Note:• The inclusion of percentage changes in brackets in this document indicates an unfavourable movement on a prior comparative period.• This document is not intended to be relied upon as advice to investors or potential investors and does not take into account the investment objectives, financial
situation or needs of any particular investor. These should be considered, with or without professional advice, when deciding if an investment is appropriate.• This document may contain certain forward-looking statements. The words “anticipate”, “believe”, “expect”, “project”, “forecast”, “estimate”, “likely”, “intend”, “outlook”,
“should”, “could”, “may”, “target”, “plan” and other similar expressions are intended to identify forward-looking statements. Indications of, and guidance on, future earnings, future financial position and capital position, distributions and performance are also forward-looking statements as are statements regarding the Group’s future developments, the market outlook and the future operation of the Group. Such forward-looking statements are not guarantees of future performance and involve known and unknown risks (including the risks set out in this document), uncertainties and other factors, many of which are beyond the control of the Group, its officers, employees, agents and advisers, that may cause actual results to differ materially from those expressed or implied in such statements. There can be no assurance that actual outcomes will not differ materially from these statements. There are usually differences between forecast and actual results because events and actual circumstances frequently do not occur as forecast and their differences may be material. Investors should not place undue reliance on forward-looking statements. To the maximum extent permitted by law, responsibility for the accuracy or completeness of any forward-looking statements whether as a result of new information, future events or results or otherwise is disclaimed. The Group disclaims any responsibility to update or revise any forward-looking statement to reflect any change in the Group’s financial condition, status or affairs or any change in the events, conditions or circumstances on which a statement is based, except as required by law.
• This document is not, and should not, be considered an offer to sell, or a solicitation of an offer to acquire, any NAB securities or financial products.• Neither this document nor the information contained in this document is for publication, distribution or release, in whole or in part, directly or indirectly, in or into or from
any jurisdiction where to do so would constitute a violation of the relevant laws of such jurisdiction.• Certain figures contained in this document, including financial information, have been subject to rounding adjustments. Accordingly, in certain instances, the sum or
percentage change of the numbers contained in this document may not conform exactly with the total figure given.
2
Important notice

3
Agenda
BNZ overview – Anthony Healy, Managing Director & Chief Executive Officer
Strategic priorities – Anthony Healy
Financial performance – Adrienne Duarte, Chief Financial Officer
Risk and regulatory considerations – Peter Whitelaw, Chief Risk Officer
Summary – Anthony Healy
Q&A

4
The Executive Team – passionate, driven, experienced
Craig HerbisonDirector Retail and Marketing
• 4 years with BNZ• 21 years experience in
marketing and advertising, brand transformation, communications and law
Adrienne DuarteChief Financial Officer
• 3 years with BNZ, 15 years with NAB
• 20 years experience in corporate finance advisory and strategy consulting roles
Anthony HealyManaging Director & Chief Executive Officer
• 6 years with BNZ• 24 years experience in New
Zealand, Australia, Asia and the Middle East
Annie BrownDirector People and Communications
• 5 years with BNZ• 20 years experience in
organisational change, culture and capability development
David BullockDirector Products and Technology
• 10 years with BNZ• 20 years experience in finance
and retail banking including innovation, business strategy and operations
Richard GriffithsDirector Strategy and Business Performance
• 5 years with BNZ• 24 years experience in
leadership and organisational development, change and commercial operations
• 8 years with BNZ• 13 years experience in financial
and operations management
Martin GaskellDirector Customer Fulfilment Services
Shelley RuhaDirector BNZ Partners
• 25 years with BNZ• Joined BNZ in 1990 in graduate
programme, has extensive leadership experience across the bank
• 6 months with BNZ, 9 years with NAB
• 30 years banking experience in financial markets, market and liquidity risk management and risk system implementation
Peter WhitelawChief Risk Officer

5
Key messages
Long history of consistent earnings growth
Traditional strength in business banking, especially SME and Agri
Differentiated brand positioning and focus on customer experience delivering better customer advocacy
Broadening retail reach through broker and Auckland uplift
Market leading digital offerings
Strong balance sheet metrics and robust asset quality

BNZ Overview
Anthony HealyManaging Director and Chief Executive Officer

BNZ overview
Proud history in New Zealand
7
Founded in 1861, part of NAB since 1992
1.2 million customers and 5,500 staff
Focused on supporting New Zealand customers ‘Be Good With Money’
Substantial market shares in all key segments1
Growing digital presence
630k internet banking customers
o Personal internet banking customers 604k
o Business internet banking customers 26k
189k mobile app customers
79% of all transactions online
26.5%22.2%
15.8%23.4%
18.1%24.4%
Businesslending
Agribusinesslending
Housinglending
Creditcards
Retaildeposits
Businessdeposits
Broad-based distribution
• 174 BNZ Retail Stores
• 33 BNZ Partners Business Centres
• Growing broker presence
• 26 Retail Mobile Bankers
• 4 Retail Contact Centres
• 2 Small Business Hubs
• Fly Buys – 2.4m cardholders (BNZ 25% shareholder)
(1) Source: RBNZ Mar 15

Strong contributor to NAB Group earnings
8
EPS CAGR – March 2010 to March 2015
NZ Banking cash earnings NZ Banking contribution to NAB cash earnings2
(NZ$m)
Total lending breakdown 1H15 – NZ$66.2bn
Personal Lending
3%
Other Commercial
10%
Manufacturing5%
Retail and Wholesale
Trade4%
Agriculture, Forestry and
Fishing19%
Commercial Property
11%
Mortgages48%
9.0% 8.5%10.5% 11.3% 11.0% 11.8% 12.4%
Sep 10 Sep 11 Sep 12 Sep 13 Sep 14 Mar 15 Mar 15ex UK
& GWB
NZD AUD
NZ Banking 7.2% 10.9%
BNZ legal entity 11.5% 15.3%
364 430 482 517 524612
741 788 807
418
Sep 06 Sep 07 Sep 08 Sep 09 Sep 10 Sep 11 Sep 12 Sep 13 Sep 14 Mar 151
(1) 6 months to Mar 15(2) Excludes specified items announced at 2014 Full Year result

9
NZ economic outlook Economic growth running at an annualised rate of around 3.25% in the final
quarter of 2014
Forecast annual rate of GDP expansion to slow to under 2.5% by the end of 2015 and 2.0% for calendar 2016
Business sentiment remains buoyant regarding the activity outlook with firms reporting higher profits and the intention to continue hiring and investing
Aggregate picture looks fine, but important differences between sectors and regions. RBNZ estimates that lower dairy prices will cut 2014/15 incomes by NZ$6 billion, disproportionately affecting activity in important dairy regions like Taranaki and Waikato
Activity in the Auckland region (over one-third of the economy) supported by upturn in the housing market and disproportionate share of record high net immigration
Auckland house prices were up by 18% year on year in April 2015 with higher sales volumes also pointing to market strength and underpinning a solid upturn in Auckland building construction
Expect moderating housing credit growth partly as macro-prudential controls begin biting
Modest uplift in business credit growth likely due to broad based strength in the economy (outside dairy) supporting investment
Economic Indicators (%) CY12 CY13 CY14 CY15(f) CY16(f)
GDP growth1 2.4 2.3 3.3 2.8 2.0
Unemployment2 6.8 6.1 5.8 5.8 6.2
Inflation3 0.9 1.6 0.8 0.5 2.3
Cash rate2 2.5 2.5 3.5 3.5 3.5
System Growth (%) 4 FY12 FY13 FY14 FY15(f) FY16(f)
Housing 1.6 4.6 5.4 4.9 5.1
Personal 0.2 1.9 4.7 6.1 5.2
Business 2.6 3.3 3.4 5.3 5.8
Total lending 1.9 4.0 4.6 5.2 5.3
Household retail deposits 9.0 9.8 9.4 10.0 9.2
(1) Per cent change, average for year ended December quarter on average of previous year(2) Per cent, as at December(3) Per cent change, December quarter on December quarter of previous year(4) Per cent change, average for year-ended September (bank fiscal year end) on average of previous year

Key trends shaping our strategy
Auckland demographics… … driving higher and less volatile growth
Digital disruption
10
Half of total New Zealand population growth is in Auckland –2x national rate1
39% of residents born overseas (23% in Asia)1
Highest median annual household income ($76k vs national median $64k)1
In 2013, Auckland had larger proportions of people in every age group under 50 years than did the rest of NZ, and smaller proportions in every age group over 50 years1
More Fintech participants in payments (ApplePay), lending (Harmoney) and ecosystem platforms (Xero)
New technologies still emerging eg Cloud, Crypto-currencies and internet of things
Material increases in mobile as a channel for financial transactions – 0.3m transactions in FY13 vs 1.3m in FY15
Digital is creating opportunities to redefine customer experiences
Importance of Asia
Increased trade flows, especially demand for agricultural commodities
Important market for Dairy (32% of all dairy and 46% of milk powder exports to China for year end December 2013)
Asia migration
0
5
10
15
20
25
30
Dec 88 Sep 92 Jun 96 Mar 00 Dec 03 Sep 07 Jun 11 Mar 15
China US Australia
Share of NZ Merchandise Exports (Rolling annual %)3
Auckland City’s economic strategy is
targeting real GDP growth of 5% per annum over next three
years2
GDP – annual % change year end March2
(1) Source: Statistics New Zealand census 2013(2) Source: Auckland Council – Business and Economy in Auckland 2014(3) Source: BNZ, Statistics New Zealand

BNZ Strategic priorities
Anthony HealyManaging Director and Chief Executive Officer

12
Our focus
Our Core: Performance, Risk, Technology, Information
• Leveraging investment in BNZ Partners and Retail
• Customer experience
– Get the basics right
– Fix pain points– Digital enablement
• Clear segment and geographic focus
– SME
– Home loan customers– Auckland
• Culture– Bold, Brave and Blue– Living the customer promises
Strong NZ franchise
Delivering sustainable shareholder returns

Auckland key to retail growth
Underweight Auckland market
13
Positive retail Net Promoter Score (NPS)3
Auckland accounts for 35% of NZ GDP and targeted to grow at 5% per annum next 3 years1
Significant underweight position in Auckland housing
Retail main bank market share in Auckland only 9%
Distribution gaps being addressed – mobile and broker
Digital opportunity – 28% of BNZ customers Auckland based but account for >50% of digital activity
Investment in Auckland is underway
~ 50 new roles since April, 50 more this year
Expanded customer acquisition teams in Small Business, Migrants and Home Lending Specialists
Launched third party mortgage acquisition
NZ$12.7bnNZ$17.5bn
NZ$26.2bn
BNZ Peer 1 Peer 2
Total Auckland housing lending
1516
26
-115
-30
-10
10
30
50
Nov-12
Jan-13
Mar-13
May-13
Jul-13
Sep-13
Nov-13
Jan-14
Mar-14
May-14
Jul-14
Sep-14
Nov-14
Jan-15
Mar-15
BNZ Peer 1 Peer 2 Peer 3 Peer 4
(1) Source: Auckland Council, Auckland Tourism, Events and Economic Development(2) Mar 15 peer reports(3) Source: Retail Market Monitor data on a six monthly roll
2 2

Accelerating housing lending growth through broker channel
Regulatory changes driving shift to broker
Mortgage broker flows – 12 months to March 15 Customer preference for mortgage brokers4
14
Customers are time poor
Brokers valued for
Expertise
Independent advice
Perception of better pricing
Overseas experience reinforces global trend to third party advice for mortgage origination
38%26% 22%
1%ANZ WBC System BNZ
Re-entered broker market
Re-entered mortgage broker market on May 18 2015
Partnered with NZ Financial Services Group – New Zealand’s largest broker group
Launched with 100 individual Brokers – view to lift to 450 in first twelve months
Expansion to rest of broker market over next 5 years
(%)
3
(1) Source: RBNZ(2) Mar 15 peer reports(3) Source: Deloitte FY13 system flows(4) Internally commissioned customer survey outcomes
BNZ housing lending market share1
16.1
15.8
15.9
15.8
15.6
15.8
16.0
16.2
Sep 13 Mar 14 Sep 14 Mar 15
RBNZ Introduced LVR restrictions – Oct 13
2 2
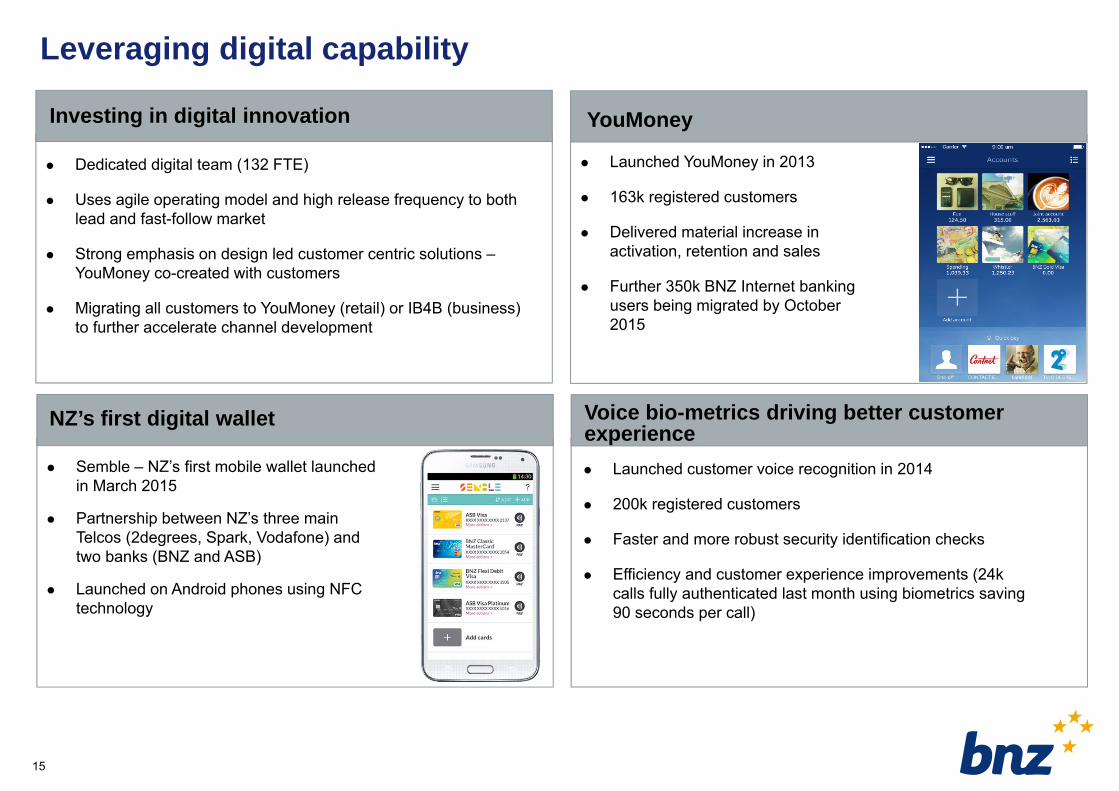
Leveraging digital capability
Voice bio-metrics driving better customer experience
15
Launched customer voice recognition in 2014
200k registered customers
Faster and more robust security identification checks
Efficiency and customer experience improvements (24k calls fully authenticated last month using biometrics saving 90 seconds per call)
NZ’s first digital wallet
Semble – NZ’s first mobile wallet launched in March 2015
Partnership between NZ’s three main Telcos (2degrees, Spark, Vodafone) and two banks (BNZ and ASB)
Launched on Android phones using NFC technology
YouMoney
Launched YouMoney in 2013
163k registered customers
Delivered material increase in activation, retention and sales
Further 350k BNZ Internet banking users being migrated by October 2015
Investing in digital innovation
Dedicated digital team (132 FTE)
Uses agile operating model and high release frequency to both lead and fast-follow market
Strong emphasis on design led customer centric solutions –YouMoney co-created with customers
Migrating all customers to YouMoney (retail) or IB4B (business) to further accelerate channel development

Customer centric approach to business banking
Business banking model Revenue contribution
Significant gains in customer advocacyHeld share in a competitive market
16
BNZ Partners Launched 2008 for all Agri, Property, Private Bank and business
customers with turnover greater than $1m 33 dedicated Partners Centres for customer use Adding value to customers through deep industry specialisation –
Agri, Health, Professional Services, Property, Not for Profit and Franchising
Small Business Customer with less than $1m turnover managed through two
small business hubs (contact centres)
23%
35%
16%16%
10%
20%
30%
40%
1Q10 3Q10 1Q11 3Q11 1Q12 3Q12 1Q13 3Q13 1Q14 3Q14 1Q15
BNZ Peer 1 Peer 2 Peer 3
Nominated Main BankBusiness segment1
(1) Business >$1m plus Agri $100k+. TNS Business Finance Monitor – Q1 2015
11
-7
25
-9
-30
-10
10
30
50
1Q10 3Q10 1Q11 3Q11 1Q12 3Q12 1Q13 3Q13 1Q14 3Q14 1Q15
BNZ Peer 1 Peer 2 Peer 3
Net Promoter Score (Main Bank)Business segment1
BNZ Partners
57%
Small Business
6%
Retail 37%
Other Partners 25%
Commercial and Medium Enterprises 20%
Agribusiness 12%

Small business (<$1m turnover) – Auckland growth a priority
Leading to material improvements in NPS1
Auckland market share opportunity
17
Increased Auckland investment underway
Market leading proposition
CANSTAR Small Business Bank of the Year 2011 to 2014
Market leading customer access – dedicated business teams available 7am to 7pm, 7 days a week
Track record for digital innovation
Payclip (1st to market – turning mobile phones into payment devices)
EDGE payroll (Cloud-based one click payroll / IRD / KiwiSaver payment and reporting)
Video access to business bankers
Plans to add further resourcing into Small Business in Auckland
Targeting segment revenue growth of 15% per annum
New auto-decisioning tool ready for release – will enable much higher rate of auto-decisioned loans
19%14%
21%
Total NZ Auckland Non-Auckland
35% of SME customers Auckland based
1
-13
16
-17
-50
-30
-10
10
30
1Q10 3Q10 1Q11 3Q11 1Q12 3Q12 1Q13 3Q13 1Q14 3Q14 1Q15
BNZ Peer 1 Peer 2 Peer 3
Net Promoter Score (Main Bank)Total small business
(1) Total Small Business (<$1m)(2) TNS Business Finance Monitor – Q1 2015
BNZ Small Business market share

Medium and Commercial Business ($1m – $20m turnover) – strong franchise position
… and innovationFocus on growth sectors …
18
Health – 17% of NZ population will be over 65 by 2020 –specialist health team to meet demand
Food value chain – post farm gate
Migrant business bankers embedded into Partners centres
Increased Auckland footprint
The ICEHOUSE Partnership (Business Incubator)
New revenues from Asset Finance and Invoice Finance platform
Launched FX online
Simplified online channels to one platform – IB4B
International trade platform
Recent market share performance1
31%
24%
15%
20%
25%
30%
35%
1Q10 3Q10 1Q11 3Q11 1Q12 3Q12 1Q13 3Q13 1Q14 3Q14 1Q15
BNZ Commercial ($5m to $20m) BNZ Business ($1m to $5m)
Strong gains in customer advocacy1
15
7
-40
-30
-20
-10
0
10
20
1Q10 3Q10 1Q11 3Q11 1Q12 3Q12 1Q13 3Q13 1Q14 3Q14 1Q15
BNZ Commercial ($5m to $20m) BNZ Business ($1m to $5m)
(1) TNS Business Finance Monitor – Q1 2015
Net Promoter Score

Agribusiness – material to NZ and BNZ
Agri underlying fundamentals remain robust Steady growth in Agribusiness share
Post farm gate opportunities
19
Traditional backbone of NZ economy – 40% of exports
Ministry of Primary Industries’ goal to double Agri exports from $32b in 2013 to $64b in 20251
Dairy long term outlook remains sound but near term challenges
• Post farm gate ~33% of agri revenue
• Delivers:
• Higher ROE
• Lower capital holdings
• Larger clientsPre-farm
gate67%
Post-farm gate33%
32%
23%17%
13%15%
0%
10%
20%
30%
40%
Dec-04 Mar-07 Jun-09 Sep-11 Dec-13
BNZ Peer 1 Peer 2 Peer 3 Peer 4
Agribusiness market share
(1) Source: Ministry for Primary Industries(2) Source: BNZ and peer general disclosure statements
Agriculture NZ$12.7bn – 19% of total GLAs
Agriculture, Forestry and
Fishing19% (NZ$12.7bn)
Mortgages48%
Other 33%
1
Dairy 62% (NZ$7.8bn)
Drystock 18%
Forestry 1%
Kiwifruit 3%
Other 11%
Services to Agriculture 5%
Financial performance
Adrienne DuarteChief Financial Officer

21
Key messages
Track record of consistent growth in earnings
Expenses well contained – CTI now below 40%
Good margin management in a competitive environment
Strong balance sheet metrics – capital, funding and liquidity
Robust asset quality and provision coverage

Consistent growth in earnings
Underlying profit
22
(NZ$m)
Cash earnings
364 430 482 517 524 612741 788 807
418
Sep 06 Sep 07 Sep 08 Sep 09 Sep 10 Sep 11 Sep 12 Sep 13 Sep 14 Mar 15
(NZ$m)
CTI over time and vs peersRevenue vs expense growth
599 685 763918 943 1,028 1,118 1,174 1,197
627
Sep 06 Sep 07 Sep 08 Sep 09 Sep 10 Sep 11 Sep 12 Sep 13 Sep 14 Mar 15
(NZ$m)
689 689 691 723 732 747 763 791 806 407
1,288 1,374 1,4541,641 1,675 1,775 1,881 1,965 2,003 1,034
Sep 06 Sep 07 Sep 08 Sep 09 Sep 10 Sep 11 Sep 12 Sep 13 Sep 14
Expenses Revenue
Mar 15
51.4% 50.1% 47.5% 44.1% 43.7% 42.1% 40.6% 40.3% 40.2% 39.4%
Sep 06 Sep 07 Sep 08 Sep 09 Sep 10 Sep 11 Sep 12 Sep 13 Sep 14 Mar 15
Peer 138.7%
Peer 340.6%
Peer 240.1%
Mar 15
Sep 06 – Sep 14 CAGR 10.5% Sep 06 – Sep 14 CAGR 9.0%
1
(1) Based on peers last reported 1H15 results

Good margin management, improving lending and deposit balances
23
Housing market share vs Housing margin1,2Net interest margin and proportion housing book fixed rate
1.2%
1.4%
1.6%
1.8%
2.0%
2.2%
2.4%
2.6%
2.8%
3.0%
15.5%
15.7%
15.9%
16.1%
16.3%
Sep 12 Dec 12 Mar 13 Jun 13 Sep 13 Dec 13 Mar 14 Jun 14 Sep 14 Dec 14 Mar 15
Housing Market Share 1 Yr Margin
Net interest margin
(%)
Lending and deposit balances(NZ$bn)
29.4 31.2 32.3 33.3
28.2 29.5 30.6 31.41.5 1.4 1.4 1.559.1 62.1 64.3 66.2
Sep 12 Sep 13 Sep 14 Mar 15Unsecured personal lendingHousing lendingBusiness lending
16.4 18.9 20.2 20.0
19.622.0 24.0 24.7
36.040.9 44.2 44.7
Sep 12 Sep 13 Sep 14 Mar 15
BNZ Retail depositsBNZ Partners deposits
2.34%2.41%
(0.13%)
(0.01%) (0.01%)
0.10% 0.02%
0.09% 0.01%
Mar 14 LendingMargin
Deposits Funding &Liquidity
Costs
CapitalBenefit
LiabilityMix
LendingMix
Other Mar 15
2.161.96 2.08
2.24 2.24 2.35 2.41 2.38 2.40 2.33 2.34 2.34 2.41
80%75% 65% 58%
45% 37% 32% 38% 43% 49% 58% 68% 71%
Mar09
Sep09
Mar10
Sep10
Mar11
Sep11
Mar12
Sep12
Mar13
Sep13
Mar14
Sep14
Mar15
NIM % Fixed
(1) Source: RBNZ(2) Margin derived from BNZ lowest carded 1 year fixed rate

Improved funding, liquidity and capital profile
BNZ Stable Funding Index (SFI) NAB Group debt funding of BNZ
BNZ Capital Ratios
24
22% to 11%
27% to 23%
(NZ$m)
53% 57% 57% 62% 67% 70% 69%
19%22% 23% 23% 22% 19% 20%72%79% 80%
85% 89% 89% 89%
Sep 09 Sep 10 Sep 11 Sep 12 Sep 13 Sep 14 Mar 15
Customer Funding Index Term Funding Index
5,4814,270
2,830 2,491
905
905
905 905
905 715 715Sep 09 Sep 10 Sep 11 Sep 12 Sep 13 Sep 14 Mar 15
Unsecured senior Subordinated
8.9%9.4%
10.8%11.9%
Sep 13 Sep 14 Mar 15 Mar 15Internationally
harmonisedCET1
Common Equity Tier 1Regulatory minimum 7.0%
12.6%12.0%
12.9%14.2%
Sep 13 Sep 14 Mar 15 Mar 15Internationally
harmonisedTotal Capital
Total CapitalRegulatory minimum 10.5%
LCR well above minimum
Net Cash Outflows
$7.4bn
HQLA
$9.7bn
Quarterly Average
LCR = 131% • The Liquidity Coverage Ratio (LCR) came into effect from 1 January 2015 with a minimum 100%
• Liquids that qualify for inclusion in the Group’s LCR, net of applicable regulatory haircuts were, on average, $9.7bn for the quarter ending 31 March 2015 resulting in an average LCR of 131%
• In addition, BNZ has a committed line of credit from NAB

Asset quality metrics reflect well managed risk
Total 90+ DPD and GIAs as % GLAs
25
(NZ$m)
B&DD charge and B&DD as a % of GLAs1
(NZ$m)
(1) Spot volumes(2) BNZ Banking Group
Collective provision to CRWAs2
53 52 67
188 187151
98 99 8746
0.14% 0.13% 0.13%
0.34% 0.34%0.27%
0.17% 0.16% 0.14% 0.14%
Sep 06 Sep 07 Sep 08 Sep 09 Sep 10 Sep 11 Sep 12 Sep 13 Sep 14 Mar 15
B&DD charge B&DD as a % of GLAs (Mar 15 half-year annualised)
71 106
286
849972
860 710 678488 511
0.00%
0.60%
1.20%
1.80%
2.40%
Sep 06Sep 07Sep 08Sep 09Sep 10Sep 11Sep 12Sep 13Sep 14Mar 1590+ DPD and GIAs Total 90+ DPD and GIAs as % GLAs (RHS)
0.70%
0.49%
0.77%
0.69%
Sep 10 Sep 11 Sep 12 Sep 13 Sep 14 Mar 15
BNZ Peer 1 Peer 2 Peer 3
Collective and specific provision coverage
36.4% 40.0% 42.1% 36.8% 33.4%42.9%
49.0%
0.81% 0.77% 0.74% 0.69% 0.67% 0.67% 0.75%
Mar 12 Sep 12 Mar 13 Sep 13 Mar 14 Sep 14 Mar 15
Specific Provisions as % of Impaired Assets
Collective provisions as % of Credit Risk Weighted Assets

Risk and regulatory considerations
Peter WhitelawChief Risk Officer

Overview
27
Well positioned for regulatory restrictions on housing lending
Agriculture portfolio geographically diversified and well secured
Long term fundamentals underpin dairy industry
Expect some deterioration in the portfolio given lower dairy payout

Housing lending – well positioned for regulatory changes
Macro-prudential tools Lowest proportion of >80% LVR mortgages versus key peers1
28
(1) As at Dec 14(2) Relates to retail housing lending portfolio
October 2013
Limited >80% LVR mortgage lending to 10% of new mortgage lending
May 2015
Residential property investors in Auckland required to have ≥30% deposit (<70% LVR) from 1 October Loans to residential property investors to have a higher risk weighting than owner occupier
Increased >80% LVR mortgage lending limit to 15% outside Auckland
Retained >80% LVR mortgage lending limit at 10% for owner-occupier lending in Auckland
10.5%14.0% 14.2%
17.1% 17.9%
BNZ Peer 1 Peer 2 Peer 3 Peer 4
LVR breakdown of investor lending flows –>70% LVR steady2 Investor 38% of retail mortgage book
0%
10%
20%
30%
40%
50%
60%
70%
LVR<70%
LVR>70%
Mar 12 Sep 12 Mar 13 Sep 13 Mar 14 Sep 14 Mar 15
10%
20%
30%
40%
50%
60%
70%
Sep 11 Sep 12 Sep 13 Sep 14 Mar 15Owner occupier Investor
Retail housing lending balances breakdown –Owner occupier vs investor

Agribusiness key to New Zealand economic prospects
Key messages Agriculture NZ$12.7bn – 19% of total GLAs
Agriculture portfolio well secured3
29
22.2% Agribusiness lending market share1 – stable since June 2013
Diversified by geography and type, but dairy the largest industry exposure by GLAs (NZ$7.8bn)
Asset quality has materially improved
Well secured portfolio
(1) RBNZ(2) Other includes Commercial Property, Other Commercial, Manufacturing, Retail and Wholesale Trade, and Personal Lending(3) Fully secured is where the loan amount is less than 100% of the bank extended value of security; partially secured is where the loan amount is greater than the bank
extended value of security; unsecured is where no security is held and negative pledge arrangements are normally in place. Bank extended value is calculated as a discount to market value based on the nature of the underlying security
Fully Secured
Partially secured
Unsecured
67%
32%
1%
Agriculture, Forestry and
Fishing19% (NZ$12.7bn)
Mortgages48%
Other 33%
2
Dairy 62% (NZ$7.8bn)
Drystock 18%
Forestry 1%
Kiwifruit 3%
Other 11%
Services to Agriculture 5%
Asset quality much improved since 2009
238 237199 172 142
57 56
2.70 2.59
2.031.59
1.22
0.47 0.46
Sep 09 Sep 10 Sep 11 Sep 12 Sep 13 Sep 14 Mar 15
90+DPD & Impaired 90+DPD & Impaired as % GLAs (%)
(NZ$m)
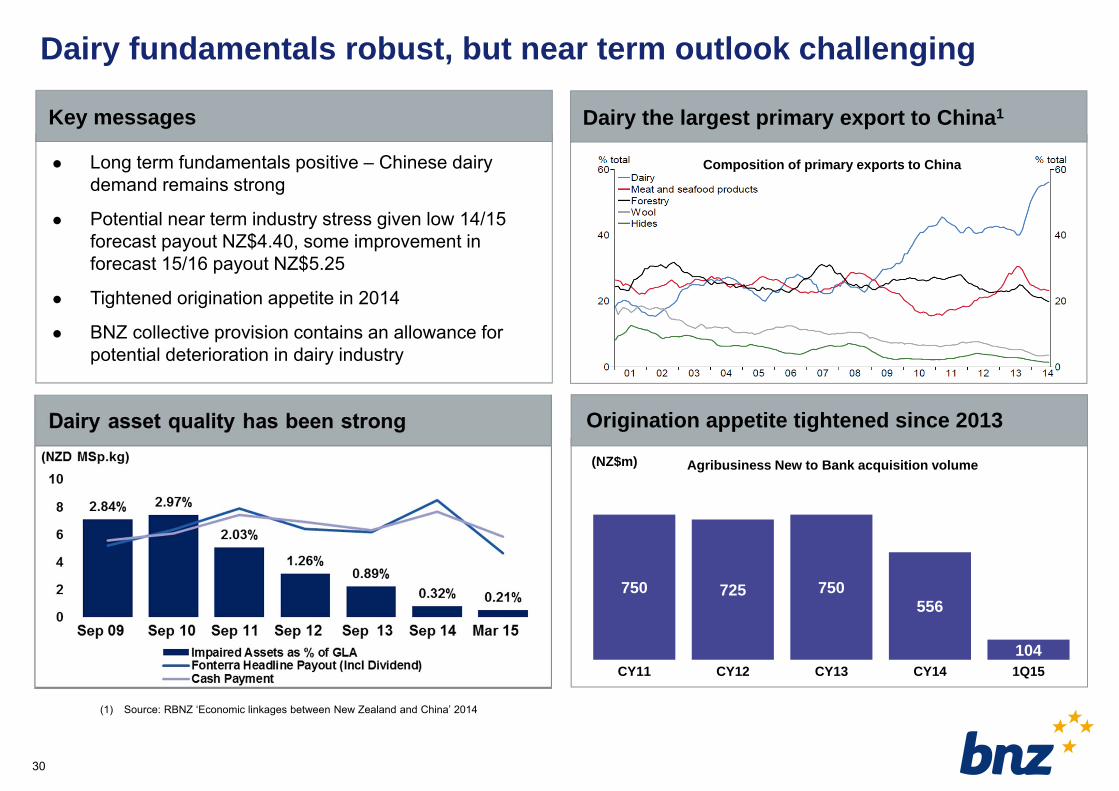
Dairy fundamentals robust, but near term outlook challenging
Key messages Dairy the largest primary export to China1
30
Long term fundamentals positive – Chinese dairy demand remains strong
Potential near term industry stress given low 14/15 forecast payout NZ$4.40, some improvement in forecast 15/16 payout NZ$5.25
Tightened origination appetite in 2014
BNZ collective provision contains an allowance for potential deterioration in dairy industry
(1) Source: RBNZ ‘Economic linkages between New Zealand and China’ 2014
Composition of primary exports to China
Origination appetite tightened since 2013
750 725 750556
104CY11 CY12 CY13 CY14 1Q15
Agribusiness New to Bank acquisition volume(NZ$m)

Summary
Anthony HealyManaging Director and Chief Executive Officer

Summary
32
Leveraging strong position in key segments – BNZ Partners and Retail
Investing in Auckland growth opportunity
Significant progress improving customer experience through innovative digital solutions
Well placed for near-term challenges – housing lending controls and lower dairy payouts
Consistent and growing contributor to NAB Group earnings

Questions and Answers

Appendix

Reconciliation of NZ Banking to BNZ Banking Group
NZ Banking vs BNZ Banking Group
35
418
483502
8
65
27
Mar 15 Cash Earnings (NZBanking)
Structural differencesbetween NZ Banking and
BNZ Banking Group
Mar 15 Cash Earnings(BNZ Banking Group)
Fair value movements andhedging gains/(losses)
Taxation on reconcilingitems (Fair value
movements)
Mar 15 net profitattributable to
shareholders of Bank ofNew Zealand
(1) NZ Banking operations are reported as a separate division and include the Retail, Business, Agribusiness, Corporate and Insurance businesses. It excludes BNZ’s Group Capital Management and BNZ Markets operations reported at a Group (NAB) level
(2) The BNZ Banking Group excludes the Insurance operations in New Zealand and includes BNZ's Group Capital Management and BNZ Markets operations
Consists of NZ Markets and Corporate office; less BNZ
Insurances
1
2

36
New Zealand: Housing lending – Key metrics
(1) Excludes Line of credit(2) Insured includes both LMI and Low Equity Premium(3) Loss Rate = 12 month rolling Net Write-offs / Spot Drawn Balances
New Zealand Housing lending Sep 13 Mar 14 Sep 14 Mar 15Low Documentation 0.23% 0.21% 0.18% 0.15%Proprietary 100% 100% 100% 100%Third Party Introducer 0.0% 0.0% 0.0% 0.0%
Variable rate lending drawn balance 46.6% 38.3% 28.2% 25.5%
Fixed rate lending drawn balance 49.4% 57.9% 68.1% 70.8%
Line of credit drawn balance 4.0% 3.8% 3.7% 3.7%
Interest only drawn balance1 23.0% 23.0% 23.5% 23.2%Insured % of Total Portfolio2 12.5% 11.4% 9.9% 8.5%Current LVR on a drawn balance calculated basis 64.7% 64.0% 63.8% 63.5%LVR at origination 69.9% 69.3% 69.1% 68.9%Average loan size NZ$ (’000) 272 281 289 296
90+ days past due ratio 0.20% 0.18% 0.11% 0.17%
Impaired loans ratio 0.21% 0.24% 0.21% 0.16%Specific provision coverage ratio 35.2% 32.7% 33.1% 36.9%Loss rate3 0.07% 0.04% 0.03% 0.04%
Mortgage lending breakdown by geography Mar 15
Auckland 40%
Canterbury 15%
Wellington 11%
Waikato 8%
Bay of Plenty 7%
Other 19%

37
Commercial Real Estate – NZ Banking
Region1 Auckland Other Regions TotalLocation % 43% 57% 100%Loan Balance < NZ$5m 27% 43% 36%Loan Balance > NZ$5m<NZ$10m 15% 15% 15%Loan Balance > NZ$10m 58% 42% 49%Loan tenor < 3 yrs 89% 84% 86%Loan tenor > 3 < 5 yrs 3% 6% 5%Loan tenor > 5 yrs 8% 10% 9%Average loan size NZ$m 4.6 2.6 3.3
Security Level2 Fully Secured 62% 68% 65%
Partially Secured 34% 29% 31%
Unsecured 4% 3% 4%90+ days past due 0.53% 1.00% 0.80%Impaired loans ratio 0.40% 0.70% 0.57%Specific Provision Coverage 11.3% 26.0% 21.5%
Trend Sep 13 Mar 14 Sep 14 Mar 15
90+ days past due 0.83% 0.64% 1.21% 0.80%Impaired loans ratio 1.02% 0.99% 0.58% 0.57%Specific Provision Coverage 46.3% 47.9% 22.5% 21.5%
Total NZ$7.0bn10.6% of Gross Loans & Acceptances
Office29%
Tourism & Leisure
2%
Land10%
Residential8%
Industrial18%
Other9%
Retail24%
(1) Data for individual regions is now presented on a stand-alone basis (previously regional data was shown on the basis of the proportional impact that region had on the total metrics)(2) Fully Secured represents loans of up to 70% of the Market Value of Security. Partially Secured are over 70%, but not Unsecured. Unsecured is primarily Negative Pledge lending

For further information visit www.nab.com.au or contact:
Ross Brown Meaghan TelfordInvestor Relations Group MediaMobile | +61 (0) 417 483 549 Mobile | +61 (0) 457 551 211
Dan ColmanInvestor RelationsMobile | +61 (0) 401 617 167
38