Embed Size (px)
Citation preview
Board of Directors Meeting March 27, 2014
1
2
Agenda
A. Call to Order and IntroductionsB. Public CommentC. Review and Approval of MinutesD. CEO ReportE. Operations UpdateF. Information Technology UpdateG. Community Outreach and EnrollmentH. Marketing & Sales UpdateI. All Payer Claims Database UpdateJ. Finance UpdateK. Network AdequacyL. Strategy Committee UpdateM. Executive SessionN. Adjournment
Welcome and Introductions

Public Comment
CEO Update
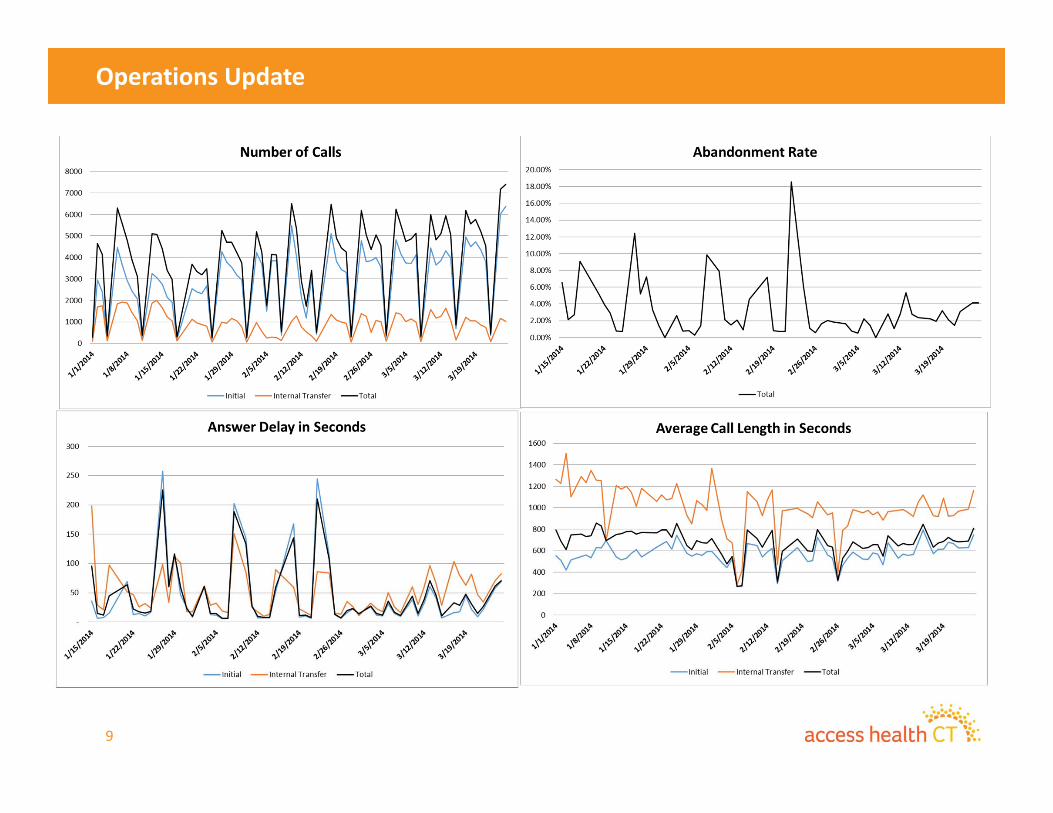
Operations Update
6
77
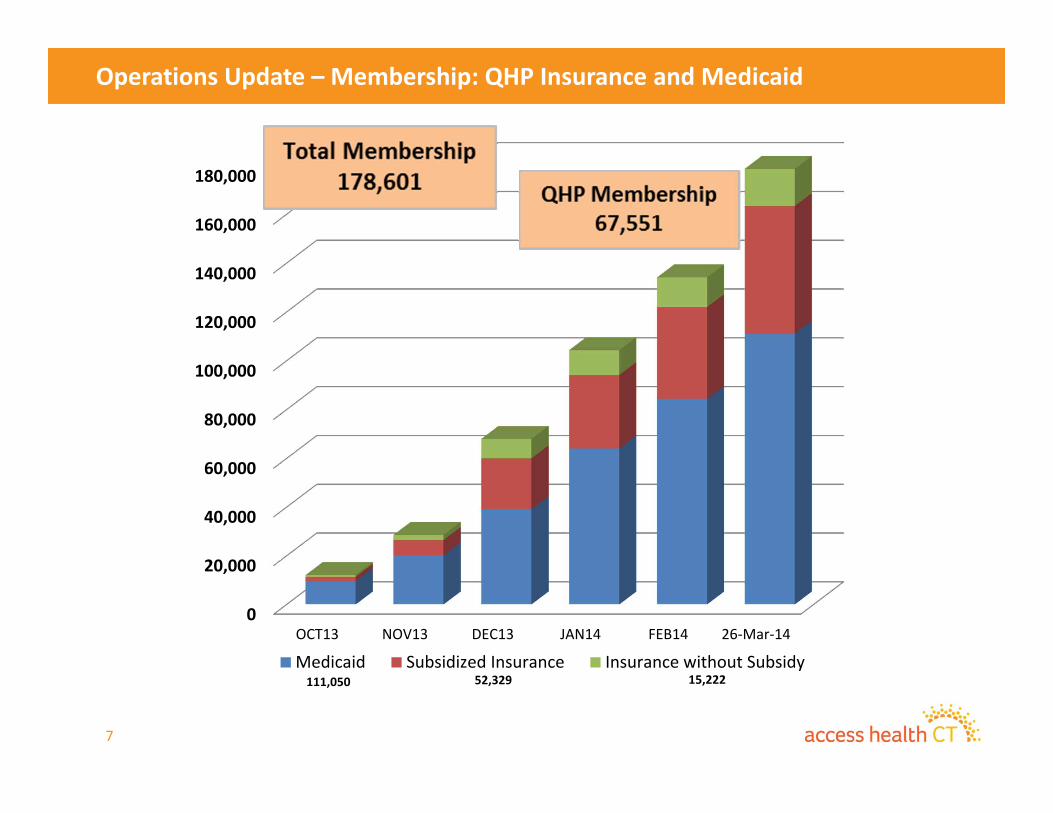
Operations Update – Membership: QHP Insurance and Medicaid
0
20,000
40,000
60,000
80,000
100,000
120,000
140,000
160,000
180,000
OCT13 NOV13 DEC13 JAN14 FEB14 26‐Mar‐14
111,050 52,329 15,222Medicaid Subsidized Insurance Insurance without Subsidy
88
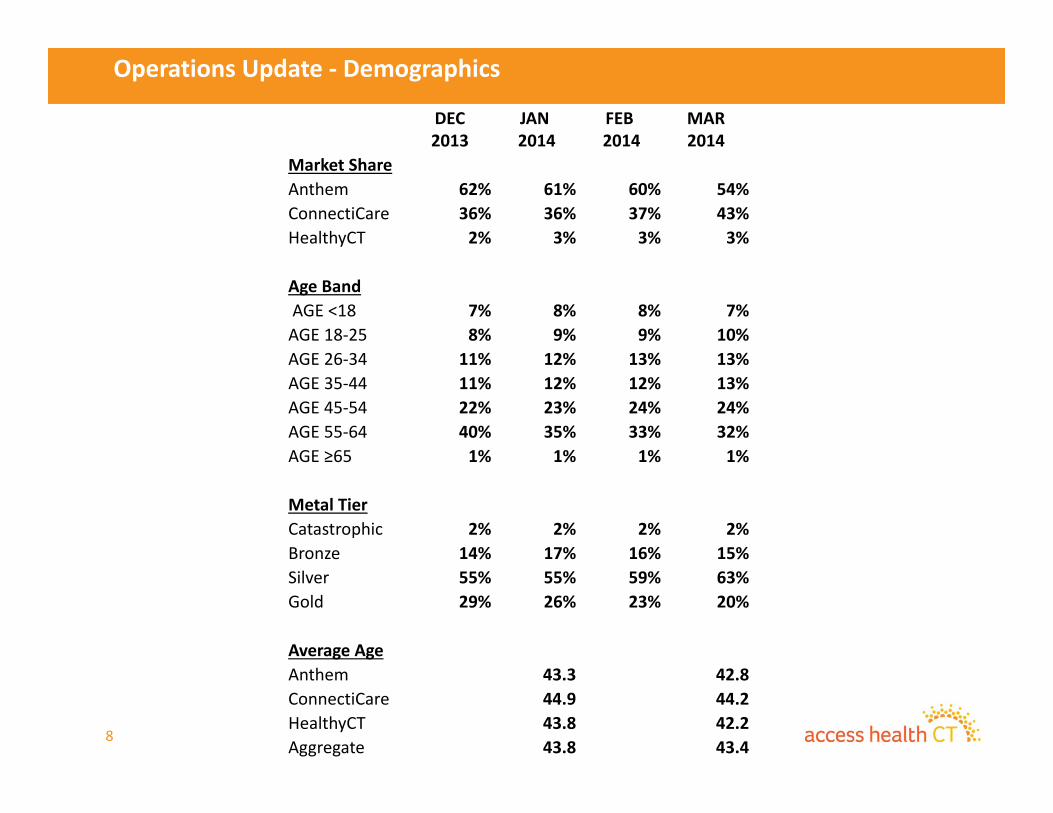
Operations Update ‐ Demographics
DEC 2013
JAN2014
FEB2014
MAR2014
Market ShareAnthem 62% 61% 60% 54%ConnectiCare 36% 36% 37% 43%HealthyCT 2% 3% 3% 3%
Age BandAGE <18 7% 8% 8% 7%AGE 18‐25 8% 9% 9% 10%AGE 26‐34 11% 12% 13% 13%AGE 35‐44 11% 12% 12% 13%AGE 45‐54 22% 23% 24% 24%AGE 55‐64 40% 35% 33% 32%AGE ≥65 1% 1% 1% 1%
Metal TierCatastrophic 2% 2% 2% 2%Bronze 14% 17% 16% 15%Silver 55% 55% 59% 63%Gold 29% 26% 23% 20%
Average AgeAnthem 43.3 42.8ConnectiCare 44.9 44.2HealthyCT 43.8 42.2Aggregate 43.8 43.4
99
Operations Update
Information Technology Update
11
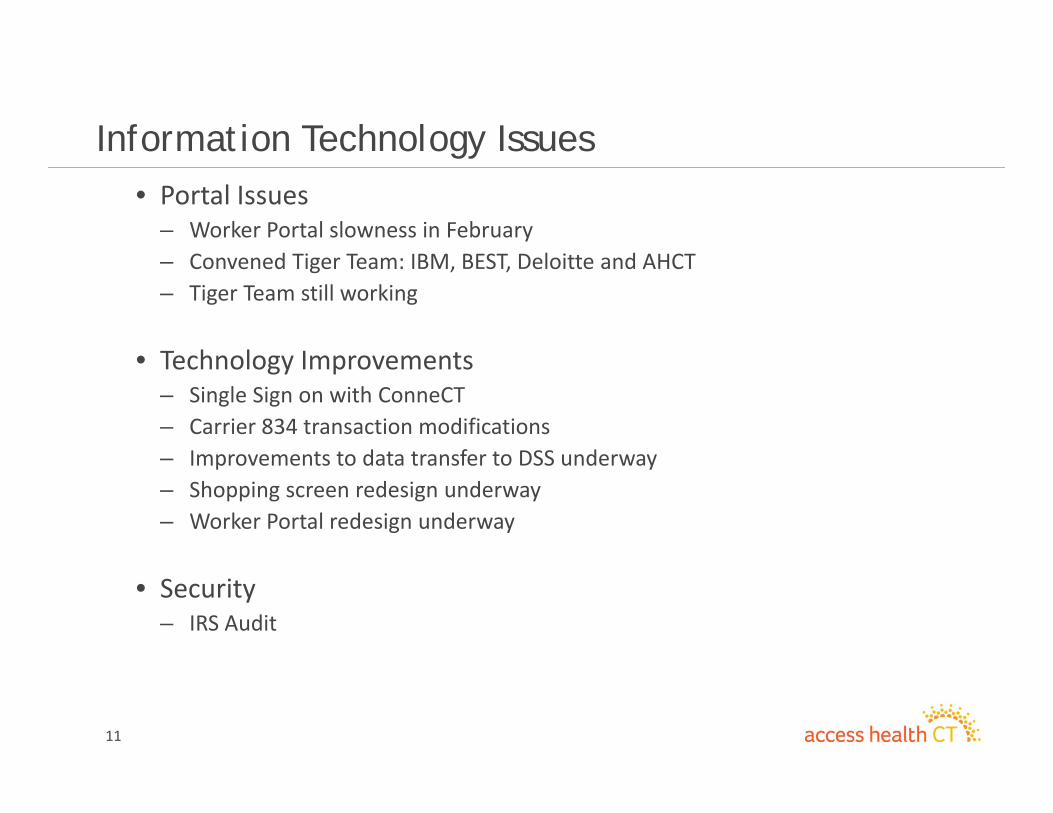
Information Technology Issues• Portal Issues
– Worker Portal slowness in February– Convened Tiger Team: IBM, BEST, Deloitte and AHCT– Tiger Team still working
• Technology Improvements– Single Sign on with ConneCT– Carrier 834 transaction modifications– Improvements to data transfer to DSS underway– Shopping screen redesign underway– Worker Portal redesign underway
• Security– IRS Audit
Community Outreach andEnrollment
13
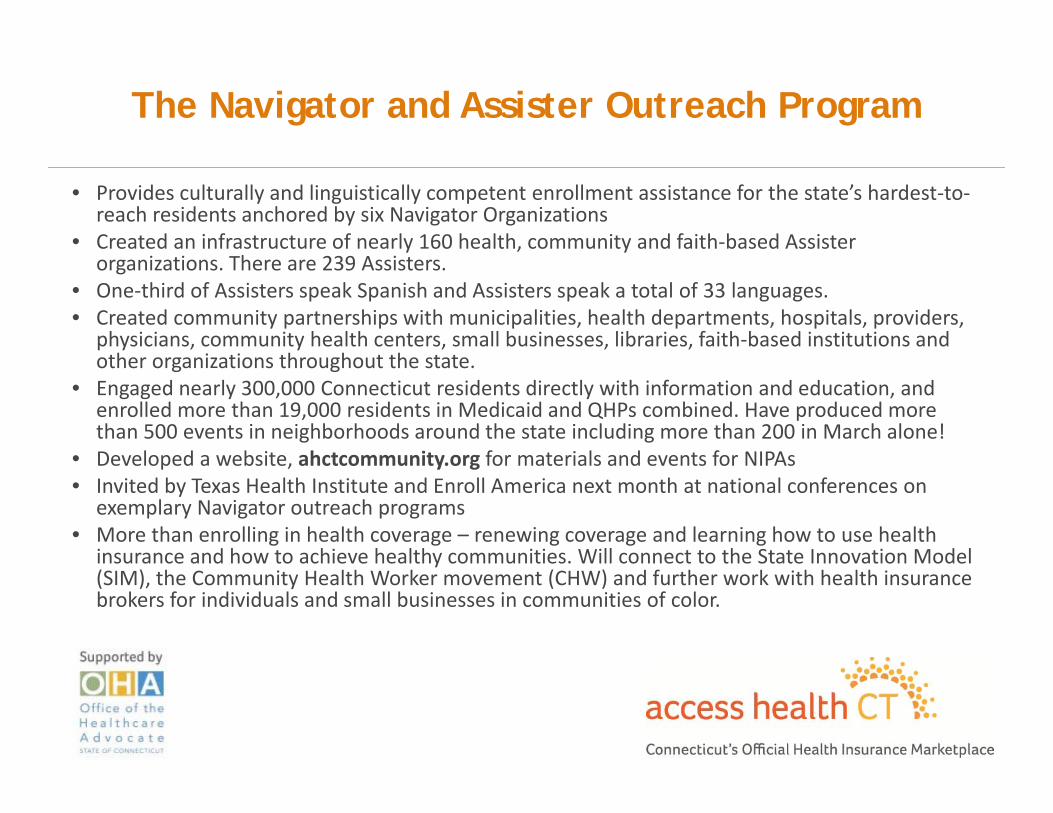
• Provides culturally and linguistically competent enrollment assistance for the state’s hardest‐to‐reach residents anchored by six Navigator Organizations
• Created an infrastructure of nearly 160 health, community and faith‐based Assister organizations. There are 239 Assisters.
• One‐third of Assisters speak Spanish and Assisters speak a total of 33 languages.• Created community partnerships with municipalities, health departments, hospitals, providers,
physicians, community health centers, small businesses, libraries, faith‐based institutions and other organizations throughout the state.
• Engaged nearly 300,000 Connecticut residents directly with information and education, and enrolled more than 19,000 residents in Medicaid and QHPs combined. Have produced more than 500 events in neighborhoods around the state including more than 200 in March alone!
• Developed a website, ahctcommunity.org for materials and events for NIPAs• Invited by Texas Health Institute and Enroll America next month at national conferences on
exemplary Navigator outreach programs• More than enrolling in health coverage – renewing coverage and learning how to use health
insurance and how to achieve healthy communities. Will connect to the State Innovation Model (SIM), the Community Health Worker movement (CHW) and further work with health insurance brokers for individuals and small businesses in communities of color.
The Navigator and Assister Outreach Program
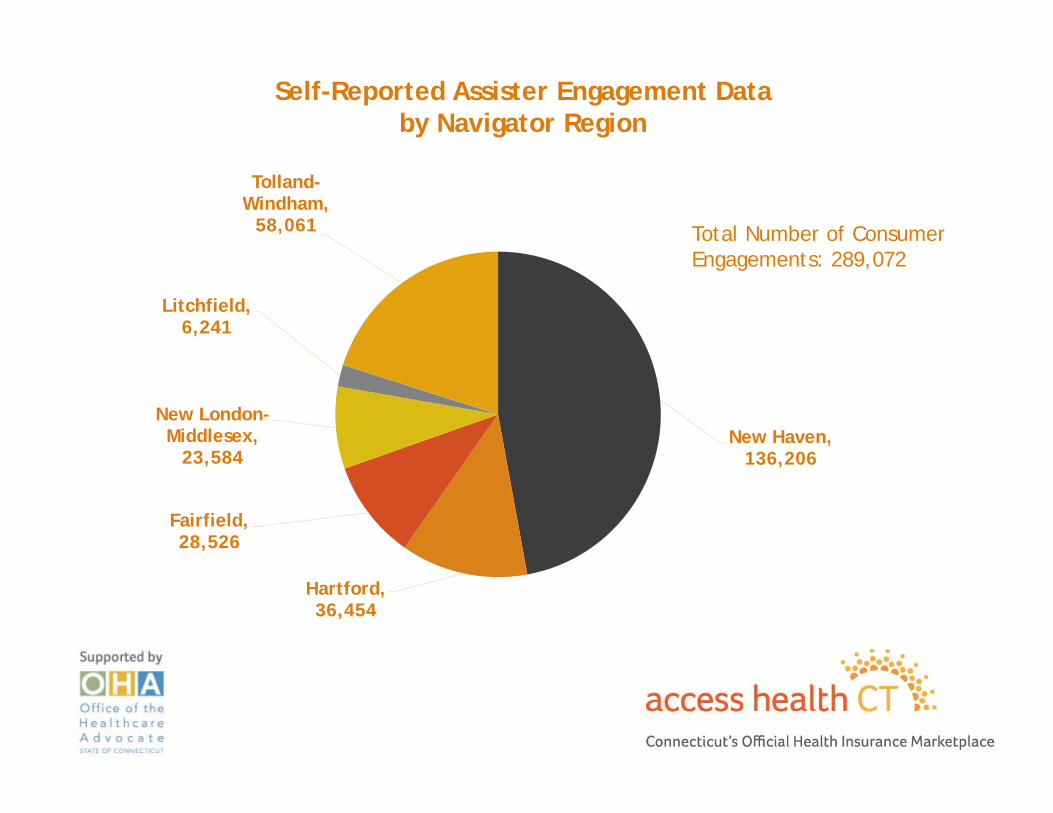
Self-Reported Assister Engagement Data by Navigator Region
New Haven, 136,206
Hartford, 36,454
Fairfield, 28,526
New London-Middlesex,
23,584
Litchfield, 6,241
Tolland-Windham,
58,061 Total Number of ConsumerEngagements: 289,072
Marketing Update
15
16
Contents
• Update on final enrollment efforts• Upcoming activity in April
17
Media Update
March media activity ends with deadline focused messaging
• Overall paid media stands at approximately $500k– Substantially less than the $1.2M spent in December– Given substantial momentum and awareness heading into the
month, targeted spend is generating robust activity
• Several new creative elements have been produced to support final week enrollment activity– New PSA’s (public service announcements) highlighting both the
deadline and the potential for a tax penalty (in English and Spanish)– 10 second “countdown” spot airing each day, calling attention to the
enrollment deadline – A new 30‐second spot produced with NBC promoting our final 7‐day
enrollment effort called “March to Enrollment”
18
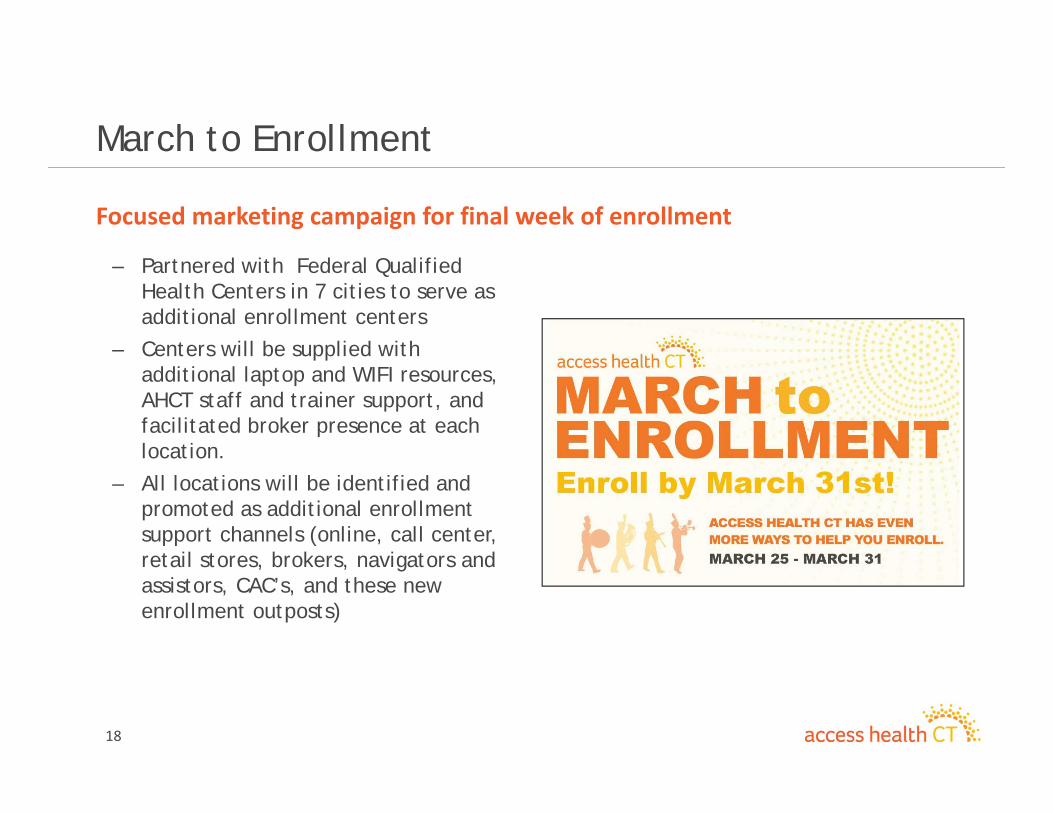
March to Enrollment
Focused marketing campaign for final week of enrollment
– Partnered with Federal Qualified Health Centers in 7 cities to serve as additional enrollment centers
– Centers will be supplied with additional laptop and WIFI resources, AHCT staff and trainer support, and facilitated broker presence at each location.
– All locations will be identified and promoted as additional enrollment support channels (online, call center, retail stores, brokers, navigators and assistors, CAC’s, and these new enrollment outposts)
19
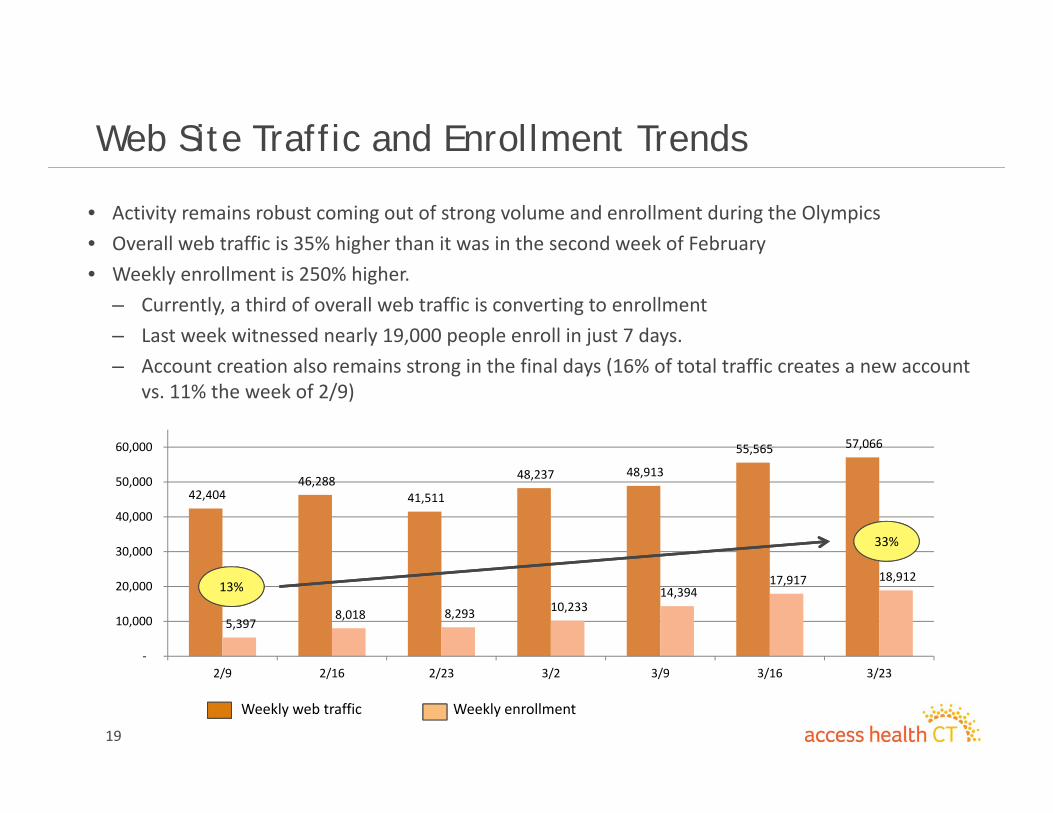
Web Site Traffic and Enrollment Trends
• Activity remains robust coming out of strong volume and enrollment during the Olympics• Overall web traffic is 35% higher than it was in the second week of February• Weekly enrollment is 250% higher.
– Currently, a third of overall web traffic is converting to enrollment– Last week witnessed nearly 19,000 people enroll in just 7 days.– Account creation also remains strong in the final days (16% of total traffic creates a new account
vs. 11% the week of 2/9)
42,404 46,288
41,511
48,237 48,913
55,565 57,066
5,397 8,018 8,293 10,233
14,394 17,917 18,912
‐
10,000
20,000
30,000
40,000
50,000
60,000
2/9 2/16 2/23 3/2 3/9 3/16 3/23
13%
Weekly web traffic Weekly enrollment
33%
20
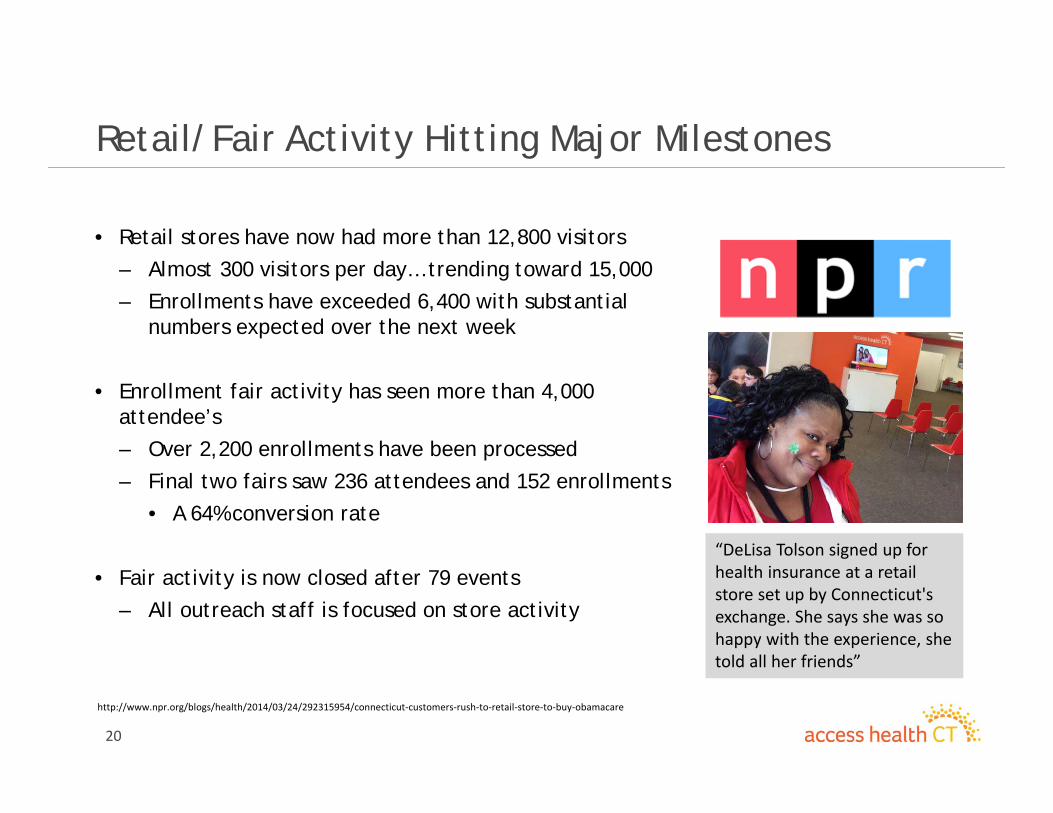
Retail/Fair Activity Hitting Major Milestones
• Retail stores have now had more than 12,800 visitors
– Almost 300 visitors per day… trending toward 15,000
– Enrollments have exceeded 6,400 with substantial numbers expected over the next week
• Enrollment fair activity has seen more than 4,000 attendee’s
– Over 2,200 enrollments have been processed
– Final two fairs saw 236 attendees and 152 enrollments
• A 64% conversion rate
• Fair activity is now closed after 79 events
– All outreach staff is focused on store activity
“DeLisa Tolson signed up for health insurance at a retail store set up by Connecticut's exchange. She says she was so happy with the experience, she told all her friends”
http://www.npr.org/blogs/health/2014/03/24/292315954/connecticut‐customers‐rush‐to‐retail‐store‐to‐buy‐obamacare
21
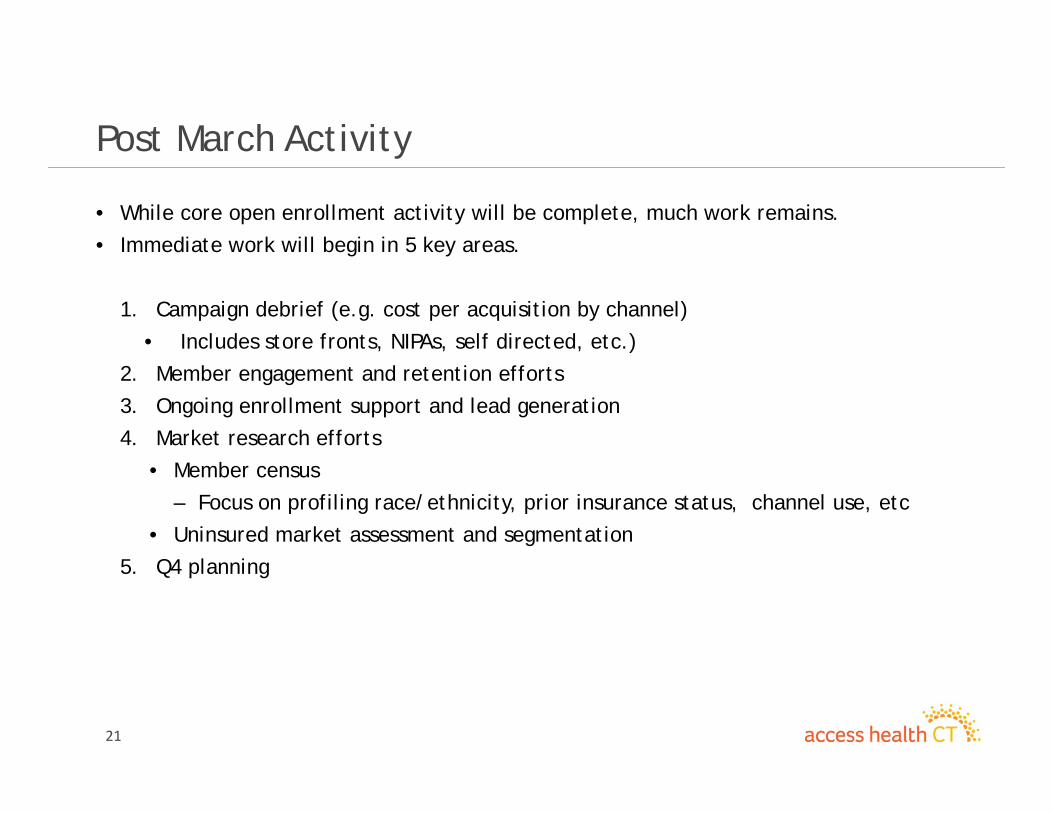
Post March Activity
• While core open enrollment activity will be complete, much work remains.
• Immediate work will begin in 5 key areas.
1. Campaign debrief (e.g. cost per acquisition by channel)
• Includes store fronts, NIPAs, self directed, etc.)
2. Member engagement and retention efforts
3. Ongoing enrollment support and lead generation
4. Market research efforts
• Member census
– Focus on profiling race/ethnicity, prior insurance status, channel use, etc
• Uninsured market assessment and segmentation
5. Q4 planning
All Payer Claims Database Update
23
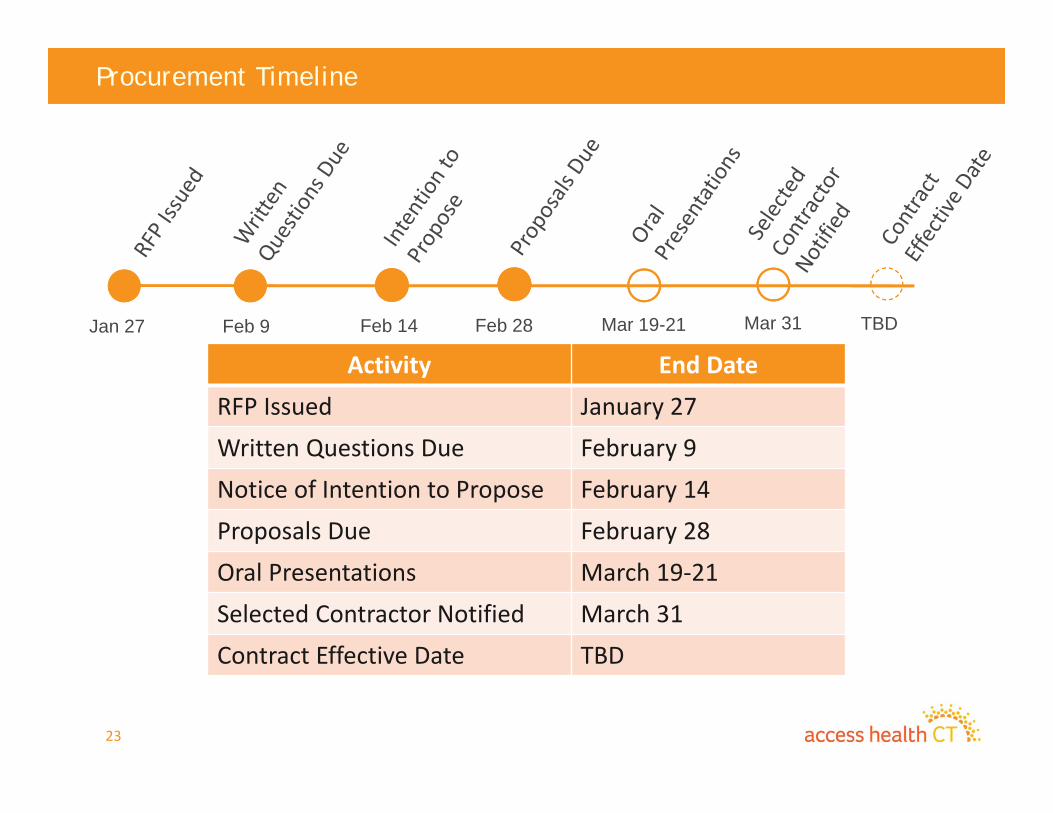
Procurement Timeline
Activity End DateRFP Issued January 27Written Questions Due February 9Notice of Intention to Propose February 14Proposals Due February 28Oral Presentations March 19‐21Selected Contractor Notified March 31Contract Effective Date TBD
Jan 27 Feb 28Feb 9 Feb 14 TBDMar 31Mar 19-21
2424
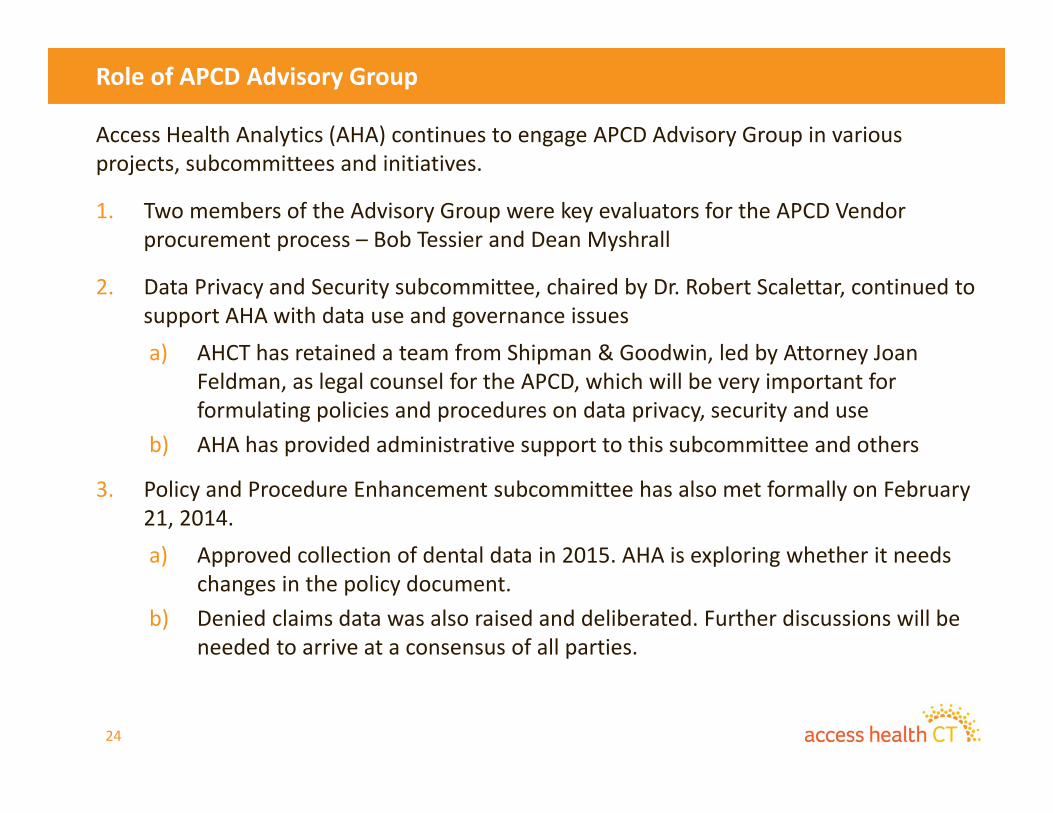
Role of APCD Advisory Group
Access Health Analytics (AHA) continues to engage APCD Advisory Group in various projects, subcommittees and initiatives.
1. Two members of the Advisory Group were key evaluators for the APCD Vendor procurement process – Bob Tessier and Dean Myshrall
2. Data Privacy and Security subcommittee, chaired by Dr. Robert Scalettar, continued to support AHA with data use and governance issuesa) AHCT has retained a team from Shipman & Goodwin, led by Attorney Joan
Feldman, as legal counsel for the APCD, which will be very important for formulating policies and procedures on data privacy, security and use
b) AHA has provided administrative support to this subcommittee and others
3. Policy and Procedure Enhancement subcommittee has also met formally on February 21, 2014. a) Approved collection of dental data in 2015. AHA is exploring whether it needs
changes in the policy document. b) Denied claims data was also raised and deliberated. Further discussions will be
needed to arrive at a consensus of all parties.
March 2014Finance Update
26
Finance Update
• Finance focus continues on tasks needed to effectively meet the commitments required by the transition to a “Going Concern”.
• As part of securing financial resources, 2014 market based assessments received to date total $4.8M and responses to capable carriers objecting to the assessment notices are in process, total anticipated collection totals $25.7 M.
• Business processes will be enhanced as the contract for an end user analytical and reporting tool vendor was signed. As previously noted, the product includes a new general ledger and a customer relationship management (CRM) application.
• Fulfilling regulatory requirements have focused on responding to requests and questions raised from the HHS Office of Inspector General Eligibility audit, which began January 6th. The auditors have selected the sample of 45 QHP completed applications and continue to have questions as they complete the audit of the samples. The auditors have left AHCT offices and will complete their work in their Boston office.
• The March 2014 dashboard follows, which displays year to date results through February 2014. Expenses continue to trend favorably to the Q1 2014 forecast due to the timing of Information Technology expenses for Design, Development and Implementation.
March Finance DashboardYTD February 2014
27
28
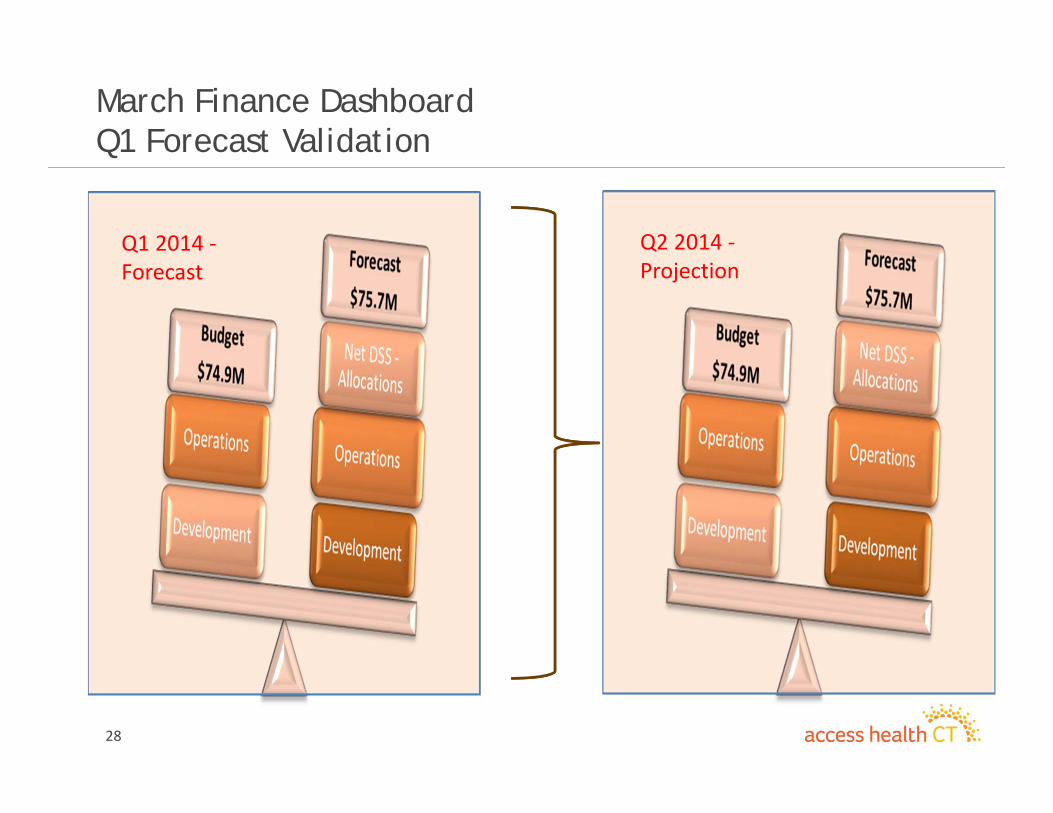
March Finance DashboardQ1 Forecast Validation
Q1 2014 ‐Forecast
Q2 2014 ‐Projection
29
March Finance Dashboard - YTD February 2014 Overview
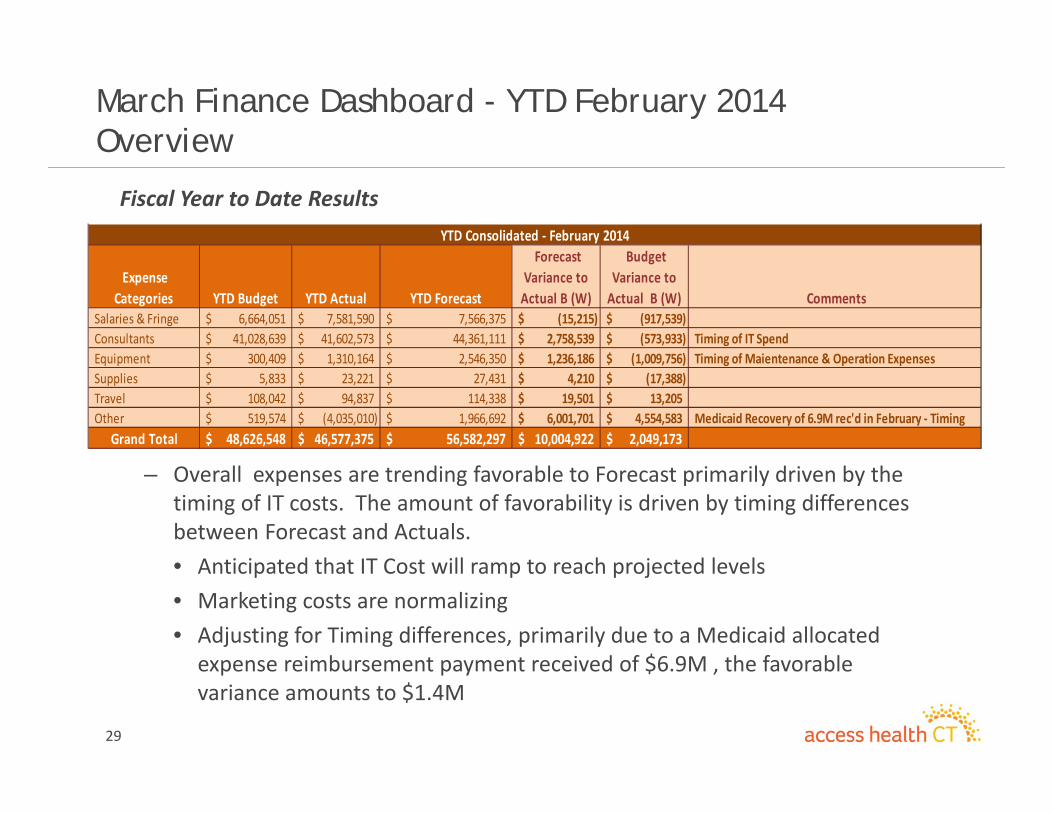
Fiscal Year to Date Results
– Overall expenses are trending favorable to Forecast primarily driven by the timing of IT costs. The amount of favorability is driven by timing differences between Forecast and Actuals.• Anticipated that IT Cost will ramp to reach projected levels• Marketing costs are normalizing• Adjusting for Timing differences, primarily due to a Medicaid allocated
expense reimbursement payment received of $6.9M , the favorable variance amounts to $1.4M
Expense Categories YTD Budget YTD Actual YTD Forecast
Forecast Variance to Actual B (W)
Budget Variance to Actual B (W) Comments
Salaries & Fringe 6,664,051$ 7,581,590$ 7,566,375$ (15,215)$ (917,539)$ Consultants 41,028,639$ 41,602,573$ 44,361,111$ 2,758,539$ (573,933)$ Timing of IT SpendEquipment 300,409$ 1,310,164$ 2,546,350$ 1,236,186$ (1,009,756)$ Timing of Maientenance & Operation ExpensesSupplies 5,833$ 23,221$ 27,431$ 4,210$ (17,388)$ Travel 108,042$ 94,837$ 114,338$ 19,501$ 13,205$ Other 519,574$ (4,035,010)$ 1,966,692$ 6,001,701$ 4,554,583$ Medicaid Recovery of 6.9M rec'd in February ‐ Timing
Grand Total 48,626,548$ 46,577,375$ 56,582,297$ 10,004,922$ 2,049,173$
YTD Consolidated ‐ February 2014
30
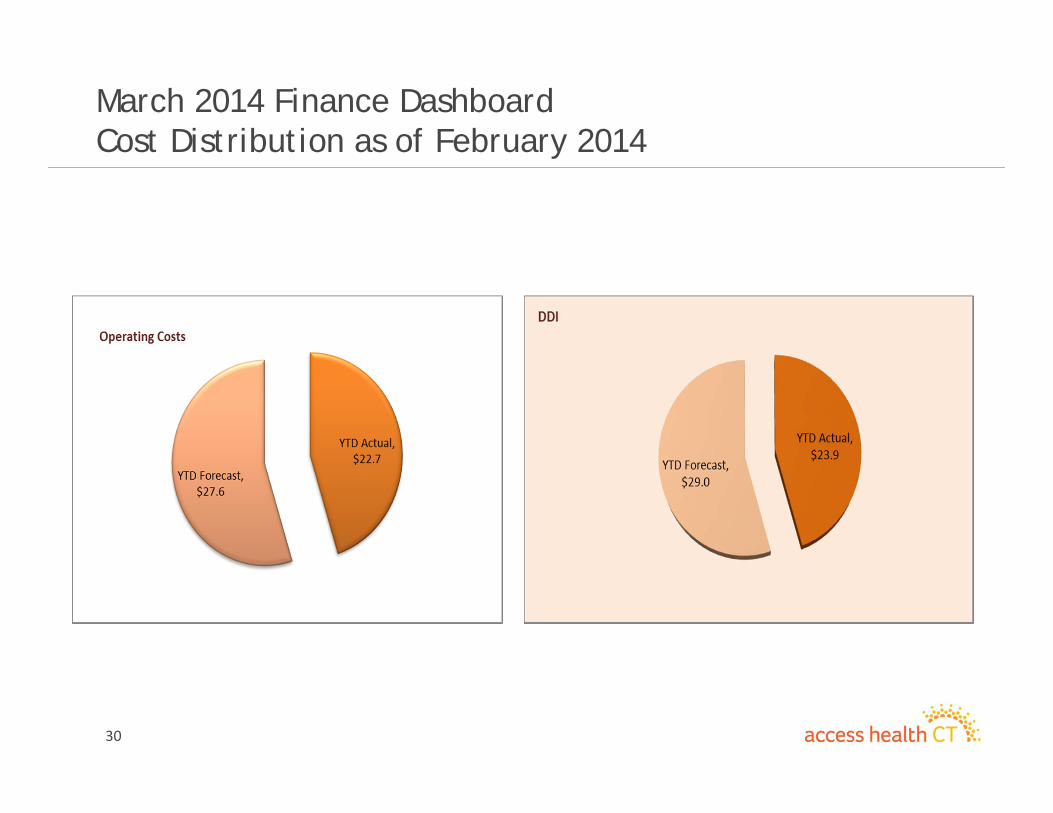
March 2014 Finance DashboardCost Distribution as of February 2014
31
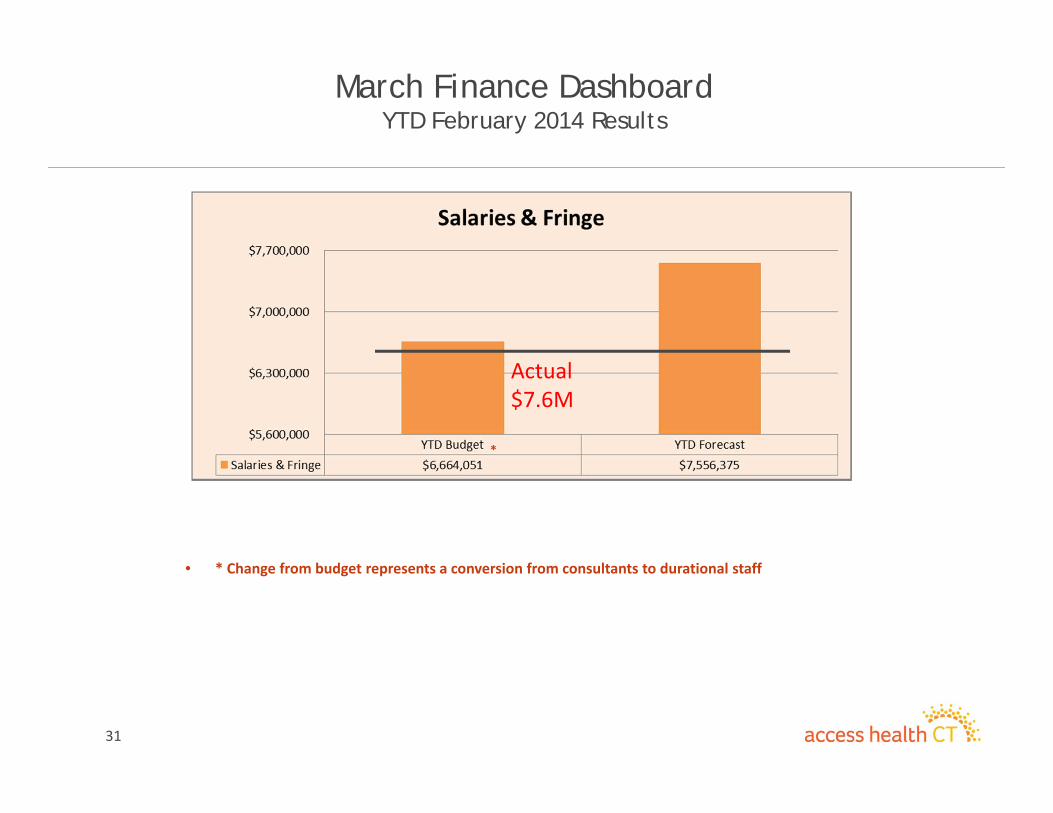
March Finance Dashboard YTD February 2014 Results
Actual$7.6M
• * Change from budget represents a conversion from consultants to durational staff
*
Plan Management Update Compliance with Network
Requirements
32
33
Network Information - Agenda
• “Substantially Similar” Standard Update• Connecticut Provider Counts• Essential Community Provider Contracting Status• Hospital Contracting• AHCT: Online Provider Directory Link• Next Steps
34
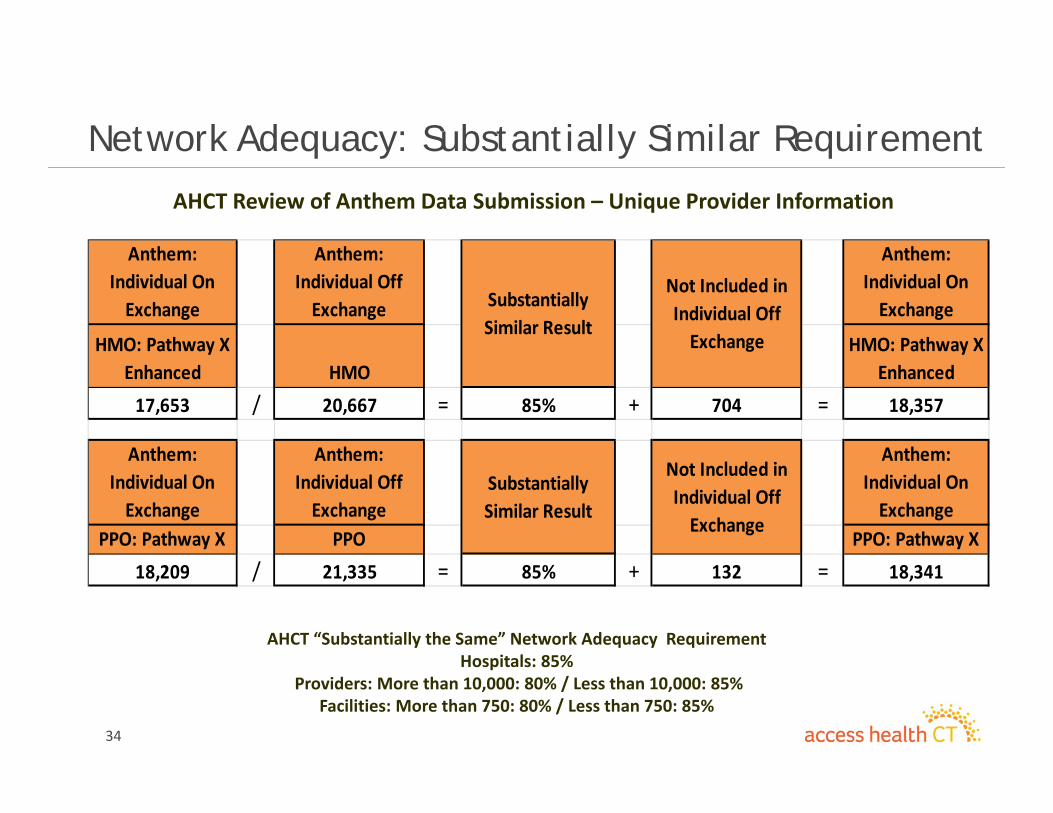
Network Adequacy: Substantially Similar Requirement
AHCT “Substantially the Same” Network Adequacy RequirementHospitals: 85%
Providers: More than 10,000: 80% / Less than 10,000: 85%Facilities: More than 750: 80% / Less than 750: 85%
AHCT Review of Anthem Data Submission – Unique Provider Information
Anthem: Individual On Exchange
Anthem: Individual Off Exchange
Anthem: Individual On Exchange
HMO: Pathway X Enhanced HMO
HMO: Pathway X Enhanced
17,653 / 20,667 = 85% + 704 = 18,357
Anthem: Individual On Exchange
Anthem: Individual Off Exchange
Anthem: Individual On Exchange
PPO: Pathway X PPO PPO: Pathway X
18,209 / 21,335 = 85% + 132 = 18,341
Substantially Similar Result
Substantially Similar Result
Not Included in Individual Off Exchange
Not Included in Individual Off Exchange
35
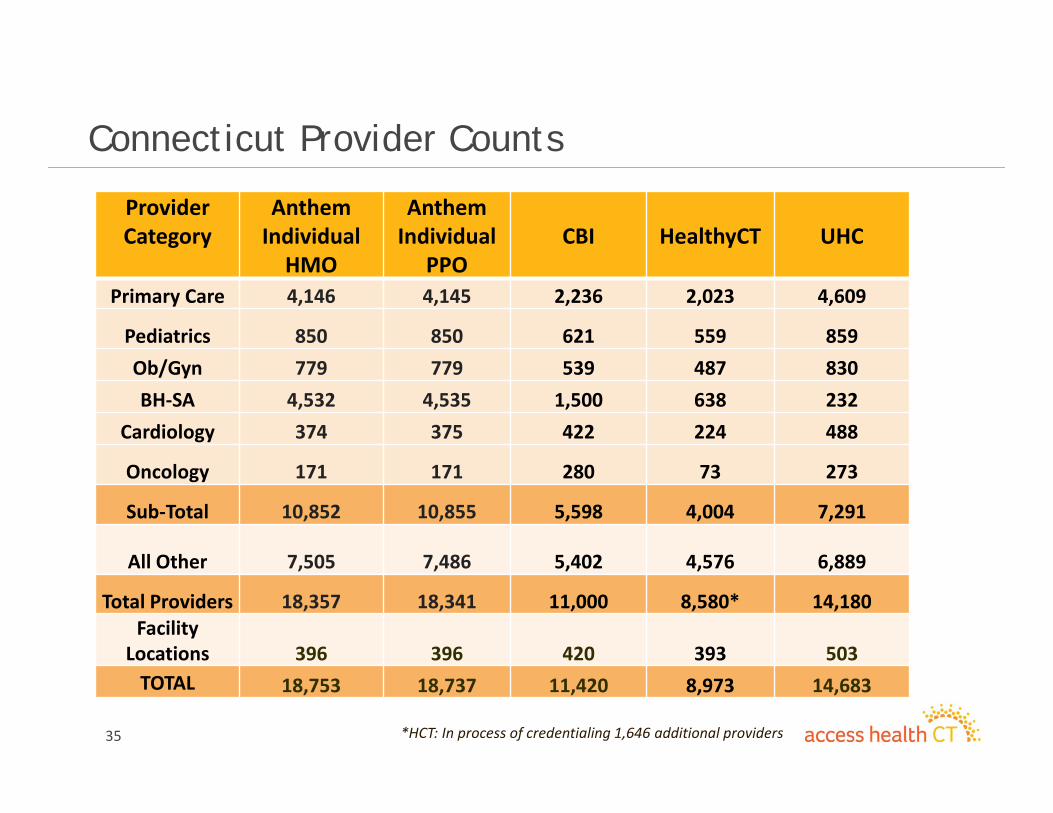
Connecticut Provider Counts
Provider Category
Anthem Individual HMO
Anthem Individual
PPOCBI HealthyCT UHC
Primary Care 4,146 4,145 2,236 2,023 4,609
Pediatrics 850 850 621 559 859Ob/Gyn 779 779 539 487 830BH‐SA 4,532 4,535 1,500 638 232
Cardiology 374 375 422 224 488
Oncology 171 171 280 73 273
Sub‐Total 10,852 10,855 5,598 4,004 7,291
All Other 7,505 7,486 5,402 4,576 6,889
Total Providers 18,357 18,341 11,000 8,580* 14,180Facility
Locations 396 396 420 393 503TOTAL 18,753 18,737 11,420 8,973 14,683
*HCT: In process of credentialing 1,646 additional providers
36
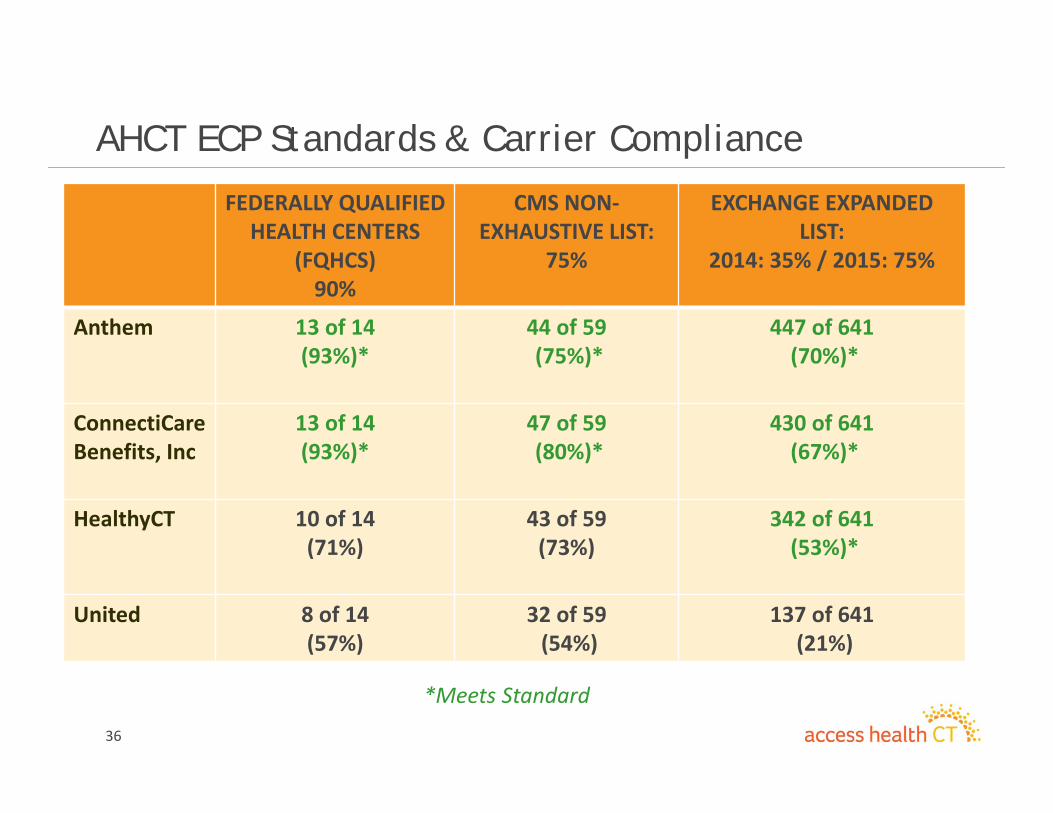
AHCT ECP Standards & Carrier Compliance
FEDERALLY QUALIFIED HEALTH CENTERS
(FQHCS)90%
CMS NON‐EXHAUSTIVE LIST:
75%
EXCHANGE EXPANDED LIST:
2014: 35% / 2015: 75%
Anthem 13 of 14 (93%)*
44 of 59(75%)*
447 of 641(70%)*
ConnectiCareBenefits, Inc
13 of 14 (93%)*
47 of 59(80%)*
430 of 641(67%)*
HealthyCT 10 of 14 (71%)
43 of 59(73%)
342 of 641(53%)*
United 8 of 14 (57%)
32 of 59(54%)
137 of 641(21%)
*Meets Standard
37
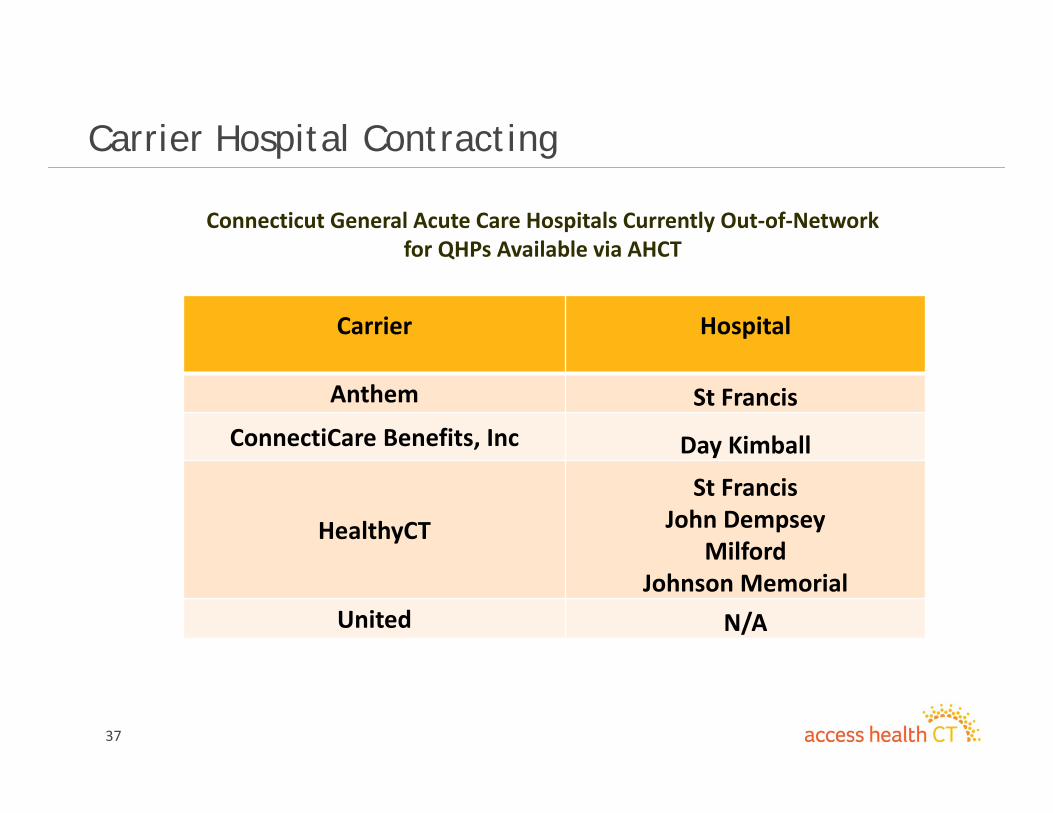
Carrier Hospital Contracting
Connecticut General Acute Care Hospitals Currently Out‐of‐Network for QHPs Available via AHCT
Carrier Hospital
Anthem St FrancisConnectiCare Benefits, Inc Day Kimball
HealthyCT
St FrancisJohn Dempsey
MilfordJohnson Memorial
United N/A
38
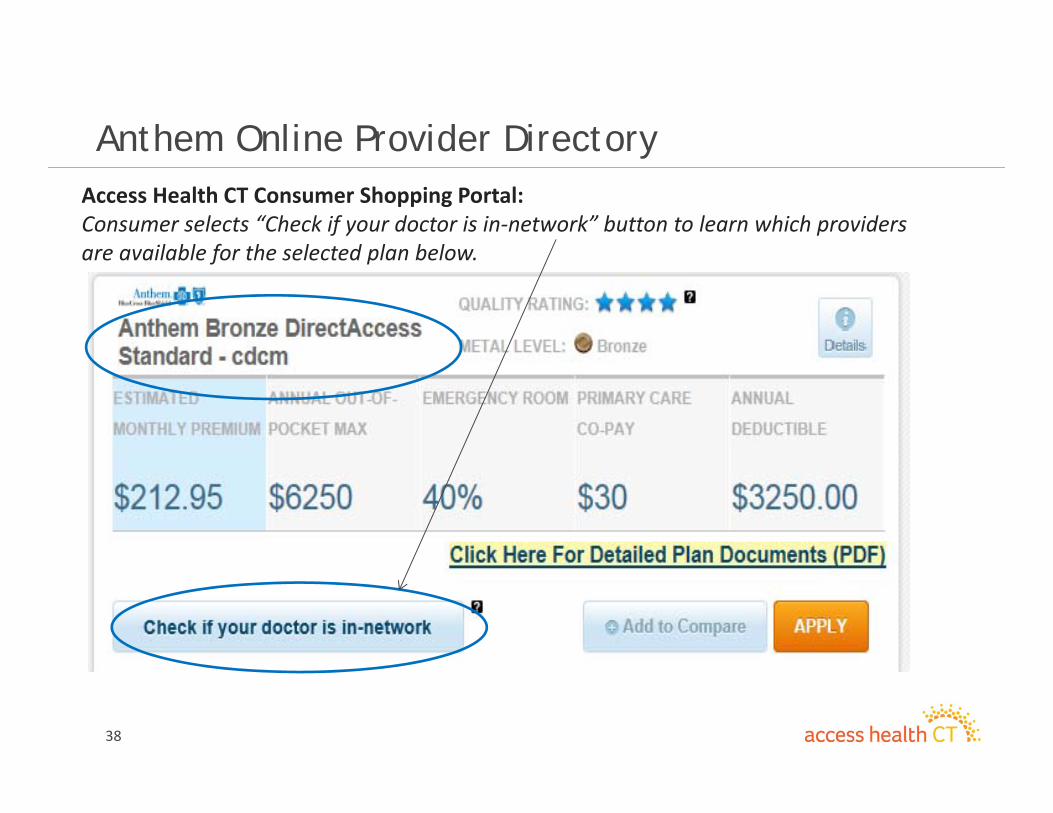
Anthem Online Provider DirectoryAccess Health CT Consumer Shopping Portal: Consumer selects “Check if your doctor is in‐network” button to learn which providersare available for the selected plan below.
39
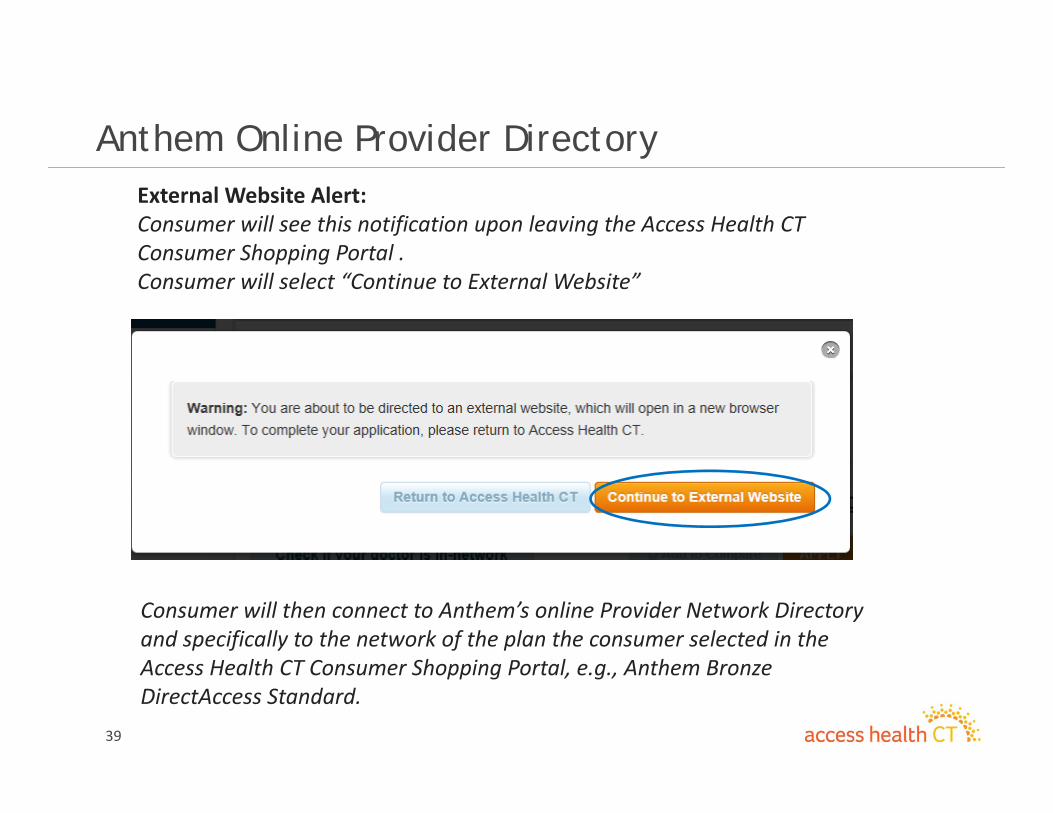
Anthem Online Provider DirectoryExternal Website Alert:Consumer will see this notification upon leaving the Access Health CT Consumer Shopping Portal . Consumer will select “Continue to External Website”
Consumer will then connect to Anthem’s online Provider Network Directory and specifically to the network of the plan the consumer selected in the Access Health CT Consumer Shopping Portal, e.g., Anthem Bronze DirectAccess Standard.
40
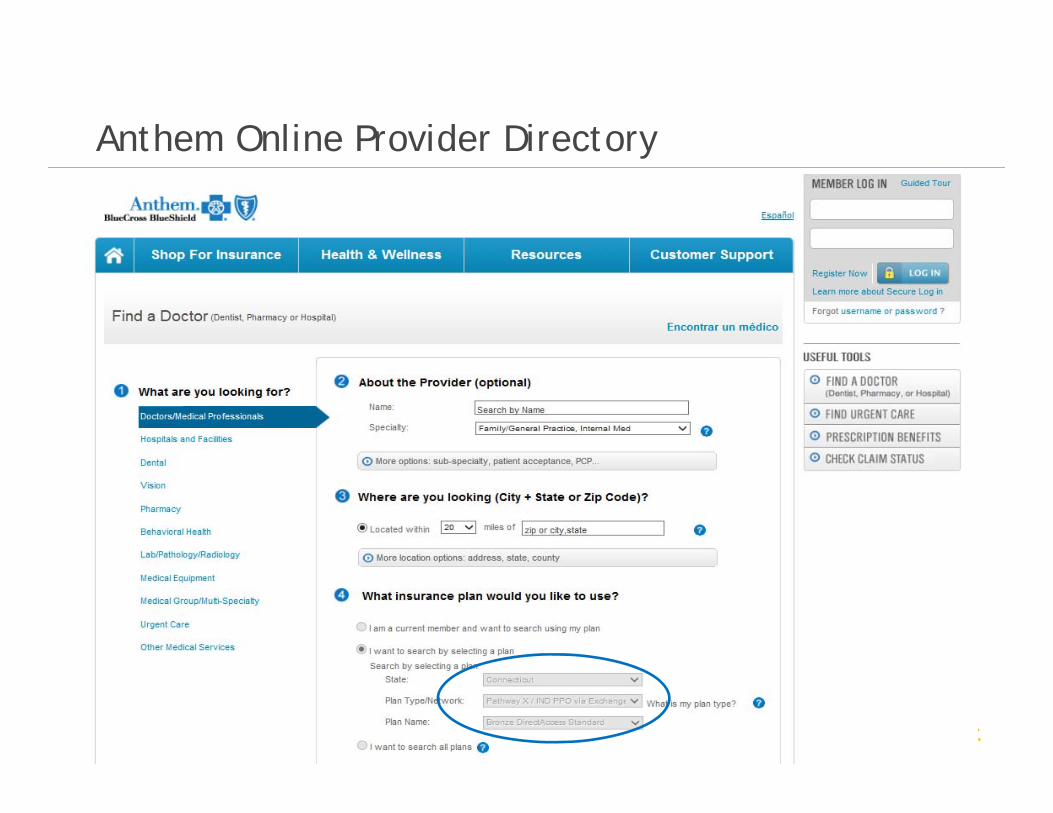
Anthem Online Provider Directory
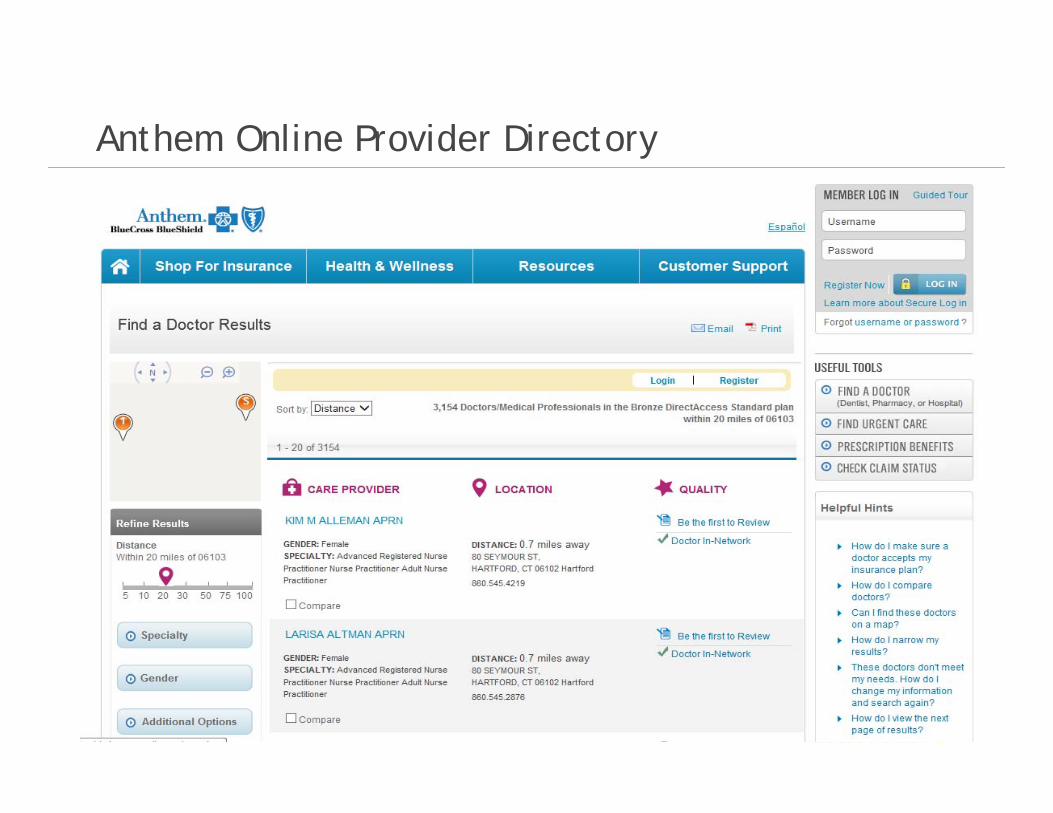
41
Anthem Online Provider Directory
42
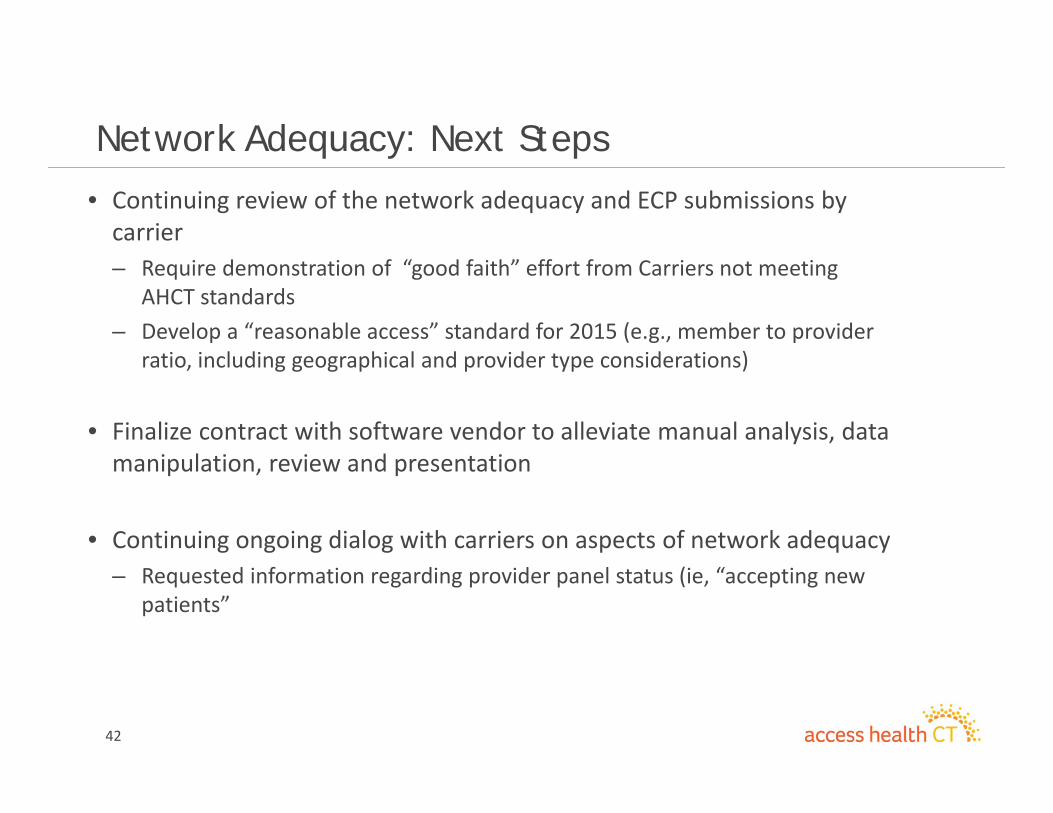
Network Adequacy: Next Steps
• Continuing review of the network adequacy and ECP submissions by carrier – Require demonstration of “good faith” effort from Carriers not meeting
AHCT standards– Develop a “reasonable access” standard for 2015 (e.g., member to provider
ratio, including geographical and provider type considerations)
• Finalize contract with software vendor to alleviate manual analysis, data manipulation, review and presentation
• Continuing ongoing dialog with carriers on aspects of network adequacy– Requested information regarding provider panel status (ie, “accepting new
patients”
Executive Session

Adjournment

4545
Operations Update
46
Since the program’s launch in March 2013, the Navigator and Assister Outreach Program has created an infrastructure of nearly 160 health, community and faith-based organizations. These Navigator and Assister organizations provide one-on-one enrollment support to the uninsured and underinsured in their communities and serve as trusted advisors promoting the benefits of health care coverage.
Navigators and Assisters have minimized cultural barriers to enrollment including language, transportation, technology barriers.
The program has continued to evolve as the Open Enrollment period has progressed. It responds to the needs of the community and serves the hard-to-reach populations.
The network which the Navigator and Assister Outreach Program has established is strengthening; building community partnerships with municipalities, health departments, hospitals, providers, physicians offices, community health centers, small businesses, libraries, faith-based institutions and other organizations throughout the state.
The Navigator and Assister Outreach Program