Embed Size (px)
Citation preview


2
Board Of Education 2012-2013Mr. Christopher C. Irving, President
Mr. Kenneth Simmons, Vice President
Ms. Chrystal Cleaves
Ms. Wendy Guzman
Dr. Jonathan Hodges
Mr. Errol S. Kerr
Mr. Manuel Martinez, Jr.
Mr. Alex Mendez
Mr. Corey L. Teague
Dr. Donnie W. Evans, State District Superintendent
Ms. Eileen Shafer, Deputy Superintendent

3
Table of ContentsBoard Of Education 2012-2013 ......................................................................................................... 2
Introduction ........................................................................................................................................ 5
The Paterson Public School District ............................................................................................ 5
Illustration 1: Paterson Public Schools Demographic Profile ..................................................... 6
Executive Summary ........................................................................................................................... 7
Bright Futures: The Strategic Plan for Paterson Public Schools 2009-2014 ..................................... 8
Overview ..................................................................................................................................... 8
Vision and Mission ................................................................................................................ 8
District Priorities, Goals, and Strategies ............................................................................... 9
Illustration 2: Bright Futures Priorities, Goals, & Strategies ...................................................... 10
Accomplishments: 2009-2012 School Years ...................................................................................... 12
District Transformation Initiatives: 2012-2013 .................................................................................. 14
Illustration 3: District Transformation Initiatives ........................................................................ 14
A Comprehensive and Robust Interim Assessment System ........................................................ 15
Renaissance Learning Star Mathematics and English Language Arts Assessments ............. 15
Critical-Thinking Aptitude Tests ........................................................................................... 16
PARCC .................................................................................................................................. 16
Common Core State Standards .................................................................................................... 18
Model Curriculum ................................................................................................................. 18
The University of Pittsburgh/Institute for Learning .............................................................. 19
Healthy School Culture ............................................................................................................... 20
Effective Schools Model ....................................................................................................... 20
Principals’ Autonomy ............................................................................................................ 22

4
Capacity Building ........................................................................................................................ 22
Pre-K Through Grade 3 Literacy Initiative ........................................................................... 22
School/District Restructuring ................................................................................................ 24
Special Education Restructuring ........................................................................................... 24
Restructuring Programs for English Language Learners (Bilingual) ................................... 25
The University of Pittsburgh/Institute or Learning ............................................................... 26
Teacher And Principal Evaluation Systems ................................................................................. 26
Focal Point ............................................................................................................................ 26
High Impact Interventions ........................................................................................................... 28
Paterson Innovation Zone ..................................................................................................... 28
Regional Achievement Centers ............................................................................................. 29
End Social Promotion ........................................................................................................... 31
Attendance Initiative ............................................................................................................. 31
Graduation Enhancements .................................................................................................... 31
NJPBSIS (Positive Behavior Support in Schools (PBSIS) ................................................... 32
Process Redesign ......................................................................................................................... 33
American Productivity and Quality Center (APQC) ............................................................ 33
Accomplishments: 2012-2013 School Year ....................................................................................... 34
Process & Fiscal Outcomes ......................................................................................................... 34
Academic Results ........................................................................................................................ 36
NJASK .................................................................................................................................. 36
HSPA ..................................................................................................................................... 38
SAT Results ........................................................................................................................... 39
PSAT Results ......................................................................................................................... 39
Graduation/Drop-Out Rate .................................................................................................... 40
Comprehensive State Review ...................................................................................................... 41
Quality Single Accountability Continuum (QSAC) .............................................................. 41
Staff Attendance .................................................................................................................... 42
Student Attendance................................................................................................................ 42
HSPA Results by High School ..................................................................................................... 43
Going Forward: 2013-2014 District Transformation Initiatives ........................................................ 48
Illustration 4: District Transformation Initiatives ........................................................................ 49
Closing Comments ...................................................................................................................... 49

5
IntroductionLocated outside of New York City, Paterson is the third largest city in the state of New Jersey. Origi-
nally established for its proximity to the Passaic Great Falls, Paterson became one of the first industrial
centers in the United States. In fact, Paterson became known as the “Silk City” because of its dominant
role in silk production in the nineteenth and twentieth centuries. Today, this historic city has a highly
diverse population of 146,000.
The Paterson Public School DistrictEducating Paterson’s youth is the function of the Paterson Public School District. With more than 40
languages spoken in its classrooms, it is one of New Jersey’s most diverse school districts. This urban
district enrolls 25,000 students in grades kindergarten through twelve and an additional 2,900 pre-
kindergarten students with community providers. Its 54 schools are largely configured as pre-K, K-8,
and 9-12 with a small number configured as grades K-4, pre-K-5 or 6-8. The district, one of four that is
state-operated, has been managed by the New Jersey Department of Education since 1991 because of its
previous fiscal mismanagement and poor student achievement.
More than ninety percent of district students receive free or reduced priced lunches. Fifteen percent
or 3,500 students receive special education services and thirteen percent of students are English Lan-
guage Learners (ELL) who receive bilingual/ESL services.
The student population in the Paterson district mirrors the trend of urban communities across the
nation and in New Jersey. Sixty percent of its students are of Hispanic origin, thirty percent are African-
American, and approximately nine percent are of Caucasian, Middle Eastern or Asian descent. Nearly
fifty percent of all students in Paterson speak a primary language other than English, with over 40 lan-
guages spoken in district schools. Its diversity among residents and the students enrolled in the district
is an asset. The city’s population has included residents from numerous cultural and ethnic orientations
since its inception. The rich diversity in the school district provides an opportunity for students to learn
firsthand about other cultures and develop an appreciation for similarities and differences as they prepare
for success in a multicultural world.

6
Illustration 1: Paterson Public Schools Demographic Profile
Number in District
Percent of District Population
Total Student Enrollment* 24,567Ethnicity Black 6,755 27.5%
Hispanic 15,325 62.4%White 1,400 5.7%Asian 1,050 4.3%American Indian/Alaskan Native 21 <1%Hawaiian Native/Pacific Islander 16 <1%
Gender Female 11,945 48.6%Male 12,622 51.3%
Economic Status Free and Reduced Lunch 22,623 92%Special Populations or Programs
Limited English Proficient (no pre-K students) 3,537 14.3%Special Education (Includes 145 in-district pre-K students) 3,342 13.6%
In-District Preschool 375Out-Of-District Preschool 3,180
Staff Total Instructional and Non-Instructional Staff 5,535Instructional 2,862 51.7%Non-Instructional (includes substitutes) 2,673 48.2%
* Does not include pre-K

7
Executive SummaryDuring the summer and fall of 2009, the district developed Bright Futures: A Strategic Plan for the
Children of Paterson. Guided by a vision to be a leader in educating the state’s urban youth and a
mission to prepare all its students for college and career, the district began a journey to transform itself.
During the next four years it implemented an array of school and district improvement strategies and
initiatives to accomplish the Plan’s twenty three goals.
For the 2012-2013 school year, the district identified seven transformation objectives aligned with
Bright Futures and developed a system-wide plan to further sharpen its focus. The objectives were
intended to build healthy school cultures, redesign critical processes and procedures, build capacity
among staff at all levels, implement a robust assessment system, develop a performance-based teacher
and administrator evaluation system, implement high impact academic interventions for low performing
students, and implement the new State Common Core Standards. Research-based strategies and inter-
ventions implemented to meet these objectives have resulted in improvements in academic and process
outcomes, including:
• The district’s graduation rate using the cohort method for the 2013 graduating class grew to
72.1% as compared to 66.4% in 2012, 64.3% in 2011 and 50.4% in 2010.
• The district has achieved its highest score ever for first-time takers of the High School
Proficiency Assessment (HSPA) with increases in proficiency for both language arts literacy
(LAL) and mathematics.
• HSPA LAL scores grew from 59.5% in 2011 to 66.4% in 2012 to 71.8% in 2013 with 88.6% of
general education students at or above proficient.
• HSPA mathematics scores have increased from 30.9% in 2011 to 46.6% in 2012 to 49.7% in
2013 with 60.7% of general education students at or above proficient.
• Percentage of graduates who have been accepted to and plan to attend a 2 or 4 year college/uni-
versity has grown to 70.8% in 2013 from 55.9% in 2011.
• The percentage of students in Grades 3-8 performing at or above proficient in language arts
increased from 35.5% in 2010-11 to 40.1% in 2012-13, from 49.1% to 52% in mathematics and
from 58.7% to 61.2% in science.
• The district’s average daily attendance rate for elementary students has increased from 93% in
2011-12 to 94.6% in 2012-13 which included a 3.8% increase in our high schools from 85.2% to
89%.

8
For the 2013-2014 school year and beyond, the district will continue to implement research-based
school improvement practices and strategies that will continue to generate increased outcomes while
sustaining current increases. It will also address other critical areas in need of improvement including its
Special Education and English Language Learners programs, updating and revising the strategic plan,
maintaining fiscal stability, and developing a long-term facilities plan.
Bright Futures: The Strategic Plan for Paterson Public Schools 2009-2014
Overview
Vision and MissionThe City of Paterson and the Paterson Public Schools possess enormous strength and much potential.
In addition to the positive attributes noted earlier, present in the city is a strong entrepreneurial spirit;
robust and post secondary institutions; resourceful community organizations and faith institutions; and a
strong will to rise above its challenges. This gave rise to the development of the district’s vision to
become a state leader in educating urban youth supported by a college ready mission to prepare all
students to be successful in the college or university of their choosing and in their chosen career.
Supporting the vision and mission are the following core beliefs:
• The core business of schools and the school district is teaching and learning, which drive all
decisions and activities in the district;
• All children can achieve at high levels and it is the responsibility of educators to create environ-
ments for student learning to occur;
• Effective instruction makes the most difference in student achievement;
• All staff must be committed to children and to the pursuit of high student achievement;
• All schools must be safe, caring and orderly to enable teachers to teach and students to learn; and
• Only through collaboration with and engagement of community organizations, institutions, agen-
cies, and families can the district realize its vision and mission.

9
District Priorities, Goals, and StrategiesRealization of our vision and mission requires nothing short of transforming the district.
1. Effective Academic Programs: All academic programs are research based and driven by
student outcomes.
2. Safe, Caring, and Orderly Schools: All schools are safe to enable teachers to teach and
students to learn.
3. Family and Community Engagement: District and school staff involve, engage, and collabo-
rate with families and community institutions, organizations, and agencies to improve student
outcomes.
4. Efficient and Responsive Operations: District office divisions and departments support the
district and school’s core business and is responsive to the needs of all staff, students, parents,
and community.
Twenty-three measurable goals and numerous school improvement strategies are aligned with each
priority (see Illustration 2). These priorities, goals, and strategies are intended to create an aligned
instructional system, build capacity among teachers and principals, create a strong district-level support
system, and involve parents and community partners.

10
Illustration 2: Bright Futures Priorities, Goals, & StrategiesPriority I: Effective Academic Programs
Goal 1: Increase Student Achievement • Aligned instructional system • Extended learning opportunities • High quality teachers in each classroom • Restructure schools• Evaluation of academic programs
Goal 2: Create Healthy School Cultures • Effective Schools Initiative • Attendance and truancy initiative • Student government associations
Goal 3: Improve Graduation Rate, Reduce Dropout Rate • High school renewal initiative • District-wide pre-K-12 progression plan
Goal 4: Improve Internal Communication • Internal communication plan • Teachers’ Roundtable • Principals’ Roundtable • Students’ Roundtable• Student forums
Goal 5: Progression Planning For School and Administrative Positions • Principals’ and Assistant Principals’ preparation program
Goal 6: Increase Academic Rigor • Gifted and talented program • Honors and advanced placement • International Baccalaureate program
Goal 7: Professional Development (teachers and administrators) Priority II: Safe, Caring and Orderly Schools
Goal 1: Create Schools with Healthy School Cultures and ClimatesGoal 2: Improve Student Discipline
• Review and revise student code of conduct • Expand alternative schools • In-school suspension programs • Professional development (classroom management)
Goal 3: School Uniforms (elementary/middle) Goal 4: Student Advisories

11
Goal 5: Character EducationGoal 6: Review and Revise Student Assignment/School Choice Plan Goal 7: Facilities are clean and safe and meet 21st century learning standards
Priority III: Family and Community EngagementGoal 1: Create Family and Community Engagement Plan
• Parent/teacher organizations in each school • District-wide PTA/PTO council • Ad hoc community-based committees and task forces • Annual community forums
Goal 2: External Communications Plan Goal 3: Customer Service Focus (Schools)
• Professional development for all staff • Translation and interpretation services
Goal 4: Partnerships with Community Organizations, Agencies, and Institutions • CEO roundtable • Roundtable for institutions of higher education • Faith-based initiatives
Goal 5: Full Service Schools (Community Schools) Goal 6: Parent Education
Priority IV: Efficient and Responsive OperationsGoal 1: Increase Accountability for Performance
• Revise performance appraisal system • Periodic assessment of services • Team building at all levels • Revamp operational procedures • Automate administrative functions • Whistle-blowers box
Goal 2: Customer Service Focus • Improve internal communications • Improve responsiveness to current and emergent needs district-wide• Professional development in best practices for operational functions • Suggestion box (online and at district office)
Goal 3: Increase Capacity • Reorganize and restructure district administration• Professional development• Update technology and instructional applications

12
Accomplishments: 2009-2012 School Years
Since the development of Bright Futures, the district has aggressively implemented many of its strat-
egies, such as:
1. Transformed (reorganizing and re-staffing) its large comprehensive high schools into autono-
mous small schools (Eastside and John F. Kennedy High Schools).
2. Restructured and re-staffed its lowest performing elementary schools (Schools 4, 6, & 10).
3. Converted all high schools into “thematic schools of choice” (All incoming ninth graders and
tenth graders choose the high school they attend).
4. Created three full service community schools (Schools 4, 5, & New Roberto Clemente).
5. Reorganized and re-staffed district operational divisions (finance, human resources, and facili-
ties).
6. Established Parent/Teacher Organizations in each school.
7. Created the state’s first curriculum based student operated credit union.
8. Reduced audit exceptions and resulting recommendations resulting from external fiscal audits
conducted annually for the past three years and brought stability to the district’s fiscal operation.
9. Scored 88 points on for the governance DPR on the two most recent QSAC reviews conducted
by the Executive County Superintendent and his team.
10. Created a continuum of Alternative Education schools and services to meet the needs of stu-
dents for whom traditional high schools were not meeting their unique and special needs.
11. Implemented the new Common Core Standards and Expectations to grades K-2.
12. Created and implemented a new Learning Walk protocol, including rubrics aligned to the new
state Common Core.
13. Acquired grant funding to support school improvement initiatives:
a. Promise Community Grant to support Full Service Community Schools - $2.3 million
b. Affordable Care Act Grant for School-Based Health Centers in full service schools -
$500,000.
c. Talent 21 grant to support technology initiatives - $2.2 million.
d. School Improvement Grants (SIG) for Schools 4 & 10 - $12 million
These and other changes have contributed to improvements in student academic outcomes.
1. The district has achieved its highest score ever for first-time takers of the High School

13
Proficiency Assessment (HSPA) with increases in proficiency for both language arts literacy
(LAL) and mathematics.
2. HSPA LAL scores grew from 59.5% in 2011 to 66.4% in 2012 to 71.8% in 2013 with 88.6% of
general education students at or above proficient.
3. HSPA mathematics scores have increased from 30.9% in 2011 to 46.6% in 2012 to 49.7% in
2013 with 60.7% of general education students at or above proficient.
4. The district’s graduation rate using the cohort method for the 2013 graduating class grew to
72.1% as compared to 66.4% in 2012, 64.3% in 2011 and 50.4% in 2010.
5. Percentage of graduates who have been accepted to and plan to attend a 2 or 4 year college/uni-
versity has grown to 70.8% in 2013 from 55.9% in 2011.
6. The percentage of students in Grades 3-8 performing at or above proficient in language arts
increased from 35.5% in 2010-11 to 40.1% in 2012-13, from 49.1% to 52% in mathematics and
from 58.7% to 61.2% in science.
7. Our preschool programmatic scores increased from 5.16 (2010-2011) to 5.66 (2012-2013) on the
Early Childhood Environmental Rating Scale-Revised (ECERS-R), a programmatic assessment
instrument utilized by the NJDOE statewide evaluation designed to measure the overall quality
of both the overall classroom environment and program quality.

14
District Transformation Initiatives: 2012-2013For the 2012-2013 school year, the school instituted additional steps to accelerate improvements in
academic and non-academic outcomes. In the spring of 2012, the district identified additional school
and district improvement objectives and strategies to accelerate increases in student academic outcomes.
Aligned with Bright Futures’ goals, the objectives were:
• Build healthy school cultures and climates
• Redesign critical processes and procedures
• Revise teacher and administrator evaluation systems
• Implement Common Core State Standards
• Implement high impact academic interventions for low performing students
• Strengthen the district’s assessment system
• Build capacity among staff
o Teachers
o Principals and vice-principals
o District administrators and supervisors
School improvement strategies aligned with each objective are noted in Illustration 3.
Illustration 3: District Transformation Initiatives
Comprehensive Assessment
System
Common Core
Healthy School Culture
Capacity Building
Teacher / Principal
Evaluation
High Impact Interventions
Process Redesign
Star Math & ELA Univ. of Pittsburgh IFL
Effective Schools
Univ. of Pittsburgh IFL
Focal Point Innovation Zone APQC
PARCC Model Curriculum
Principal’s Autonomy
K-3 Literacy Initiative
RAC
School/District Restructuring
End Social Promotion
Special Education Restructuring
Attendance Initative
ELL Restructuring
Graduation EnhancementNJPBSIS

15
A Comprehensive and Robust Interim Assessment SystemConsistent with state requirements, the district annually administers the New Jersey Assessment of
Skills and Knowledge (NJASK) to all students in grades three through eight. Similarly, the High School
Proficiency Assessment is administered to students in grade eleven. Fourth and eighth graders in the
district participate in the state’s science testing, and students enrolled in Algebra I participate in
Algebra I testing.
Among the strategies for improving student achievement in the district is frequent and regular use of
interim assessment. This is accomplished through formative assessments that are administered to moni-
tor student academic growth and inform teaching. Classroom teachers use the results to determine if
students have accomplished mastery of content to desired expectations and targets. Formative assess-
ments used in the district include Star Math and Reading, the Preliminary Scholastic Aptitude Test
(PSAT), and the Model Curriculum Unit Assessments.
Renaissance Learning Star Mathematics and English Language Arts AssessmentsRenaissance Learning’s assessment tools are short-cycle interim assessments that provide formative
assessment and periodic progress-monitoring to enhance delivery of the core curriculum and support
differentiated and personalized instruction in reading, writing and mathematics. All students take the
fifteen minute tests using computers in their school once each nine-week grading period.
STAR assessments are aligned to the Common Core State Standards and state-specific
standards so teachers can assess standards mastery. They are also linked and aligned to standards
and tests for 50 states and the District of Columbia to help identify students at risk of not meeting
adequate yearly progress and proficiency targets so teachers can intervene early.
Test results that are available to teachers immediately upon completion by students provide action-
able information that helps drive curriculum and instruction decisions quickly and intuitively. Key
features include:
• Reports that provide information on screening, progress-monitoring, instructional planning, state
standards, CCSS standards, and state performance.
• Skills-based testing to assist teachers with instructional planning.
• Benchmarks for response to intervention state test performance, to show if a student is on track
to reach proficiency or in need of intervention.

16
• Tools such as Core Progress learning progressions for math and reading and Student Growth
Percentile measurements
In September 2011, The Paterson Public School District engaged Renaissance Learning to begin
utilization of the Star Assessment System (Star Reading and Star Math) in grades K-12. The tests are
administered to all students once in each nine-week grading period.
Critical-Thinking Aptitude TestsAt the high school level, the Paterson Public School District annually administers the Preliminary
Scholastic Aptitude Test (PSAT) to all students in grades 9, 10, and 11. The PSAT/NMSQT measures
critical reading skills, math problem-solving skills, and writing skills
At the elementary level, Paterson’s Gifted & Talented Academy utilizes The Test of Critical Think-
ing (TCT) to assess critical thinking in students in grades 6, 7 and 8. The TCT is based theoretically on
aspects of the Delphi Report (Facione, 1990a) and especially Paul’s (1992) model of reasoning, specifi-
cally Paul’s eight elements of thought. The TCT consists of ten short stories or text scenarios, each of
which is followed by several multiple choice questions that require students to employ critical thinking,
rather than reading comprehension skills, to select correct responses.
PARCCIn the spring 2015, New Jersey’s NJASK and HSPA will be replaced by a standard set of K-12
assessments in English Language Arts and Mathematics developed by The Partnership for Assess-
ment of Readiness for
College and Careers
(PARCC). These new
summative assessments
will measure readiness and
mark progress toward the
goal of college and career
readiness, beginning in 3rd
grade through 11th grade.
The content of these as-
sessments is based on what
it takes to be successful
in college and careers in

17
the future. The assessments will enable teachers, schools, students, and their parents to gain important
insights into how well critical knowledge, skills and abilities essential for students to thrive in college
and careers are being mastered. The PARCC assessments will also coincide with the full range of the
Common Core State Standards roll-out, to ensure that the standards are present in classrooms.
The PARCC assessment will contain two summative components – a performance-based assessment
(PBA) and an End-of-Year Assessment (EOY). The PBA portion will be administered when approxi-
mately 75 percent of the school year is complete (February-March). ELA students will analyze and
write about a text, whereas in the mathematics section, students will apply skills, concepts and under-
standings to solve problems. The EOY portion will be administered when approximately 90 percent of
the school year is complete (April-May). The EOY will focus on reading comprehension for ELA and
innovative problem solving for math. The assessments will provide teachers and schools with timely
information to inform instruction and provide student support.
PARCC assessments will be fully administered in spring 2015, where schools will have a maximum
of 20 school days to administer the PBA and a maximum of 20 school days to administer the EOY.
Field testing for the PARCC assessments will begin in spring 2014. There are 26 schools in Paterson that
will be field testing the PARCC assessments in spring 2014.
Paterson Public Schools- PARCC Field TestingGrades Number of Classrooms for Each Grade
3 84 115 106 147 88 109 6
10 1011 2
Algebra II 6Geometry 4
Total Classrooms 89

18
Common Core State StandardsThe Common Core State Standards initiative is a state-led effort coordinated by the National Gover-
nors Association Center for Best Practices (NGA Center) and the Council of Chief State School Of-
ficers (CCSSO). In June 2010, the New Jersey State Board of Education (NJBOE) and the New Jersey
Department of Education (NJDOE) adopted the Common Core State Standards (CCSS). The standards
were developed in collaboration with teachers, school administrators, and experts, to provide a clear and
consistent framework to prepare our children for college and the workforce.
The standards are informed by the highest, most effective models from states across the country and
countries around the world, and provide teachers and parents with a common understanding of what
students are expected to learn. Consistent standards will provide appropriate benchmarks for all stu-
dents, regardless of where they live.
These standards define the knowledge and skills students should have within their K-12 education
careers so that they will graduate high school able to succeed in entry-level, credit-bearing academic
college courses and in workforce training programs. The standards:
• Are aligned with college and work expectations;
• Are clear, understandable and consistent;
• Include rigorous content and application of knowledge through high-order skills;
• Build upon strengths and lessons of current state standards;
• Are informed by other top performing countries, so that all students are prepared to succeed in
our global economy and society; and
• Are evidence-based.
Model CurriculumTo assist districts and schools with implementation of the Common Core State Standards and New
Jersey Core Curriculum Content Standards, The New Jersey Department of Education provides a
“model” that serves as an example from which to develop or align their curriculum and/or a product
they can implement. Each unit contains targeted student learning objectives (SLOs) that explain what
students need to know and be able to do within the unit. The six-week formative assessments included
in the model curriculum help clarify the level of rigor expected from the standards and provide a great
set of assessment tools that are often difficult for districts and schools to create on their own.
The Paterson Public School District initially used the model curriculum for English/language arts

19
and developed its own aligned curriculum for mathematics. More recently, the district has aligned its
K-12 curriculum in English/language arts to the new Common Core State Standards.
The University of Pittsburgh/Institute for LearningThe University of Pittsburgh’s Institute for Learning (IFL) is a non-profit organization dedicated to
improving the education and achievement of all students, especially those traditionally underserved.
Their research-based curriculum materials, assessment instruments, and professional development build
instructional and leadership capacity of teachers and administrators, and provide students with high
quality instruction and learning opportunities that align with the Core Curriculum Content Standards
(CCCS), Common Core State Standards (CCSS) and emerging assessments. Their work is rooted in the
research on teaching and learning that confirms that virtually all students, if they work hard at the right
kinds of learning tasks, in the right kinds of environments, are capable of high achievement.
The IFL base their work on nine Principles of Learning, which was introduced to Paterson Public
Schools in the 2011-2012 school year. They are:
1. Organizing for Effort
2. Clear Expectations
3. Fair and Credible Evaluations
4. Recognition of Accomplishment
5. Academic Rigor in a Thinking Curriculum
6. Accountable Talk
7. Socializing Intelligence
8. Self-management of Learning
9. Learning as an Apprenticeship
The IFL is currently providing services and support to the Paterson Public Schools for accomplishing
the following goals, which are critical to accomplishment of Priority 1, Effective Academic Programs, of
Bright Futures: the Strategic Plan for Paterson Public Schools, 2009-2014:
1. Improve the quality of teaching and learning for all students in the PPS, starting in 2011-2013
with teachers, coaches, and school leaders of 25 schools in Unit 1, adding staff from 10 addi-
tional Unit 1 schools in 2012-2013, and expanding to all Unit 1 and selected Unit 2 teachers and
coaches of specific subjects at specific grade levels in 2013-2014.

20
2. Ensure that high quality support for English Language Learners is embedded in the core instruc-
tional program.
3. Develop capacity district-wide for the development and effective use of high quality curriculum
and formative assessments that are aligned to existing New Jersey Core Curriculum Content
Standards, the new Common Core State Standards (CCSS), and the emerging work of the Part-
nership for the Assessment of Readiness for College and Careers (PARCC).
The strategy and implementation plan for accomplishing these objectives has evolved based on the
district’s system-wide capacity, PPS data related to student achievement, IFL’s System-Wide Instruction-
al Improvement Framework, and the availability of IFL resources. The intent is to collaboratively design
and implement a powerful, system-wide strategy that engages district and school staff in the work of
improving student learning, while at the same time developing the instructional program coherence, and
the organizational, human, and social capacity required to take this work to scale in the 3-5 years
to follow.
Healthy School Culture
Effective Schools ModelThe Paterson Effective Schools model includes ten dimensions of school effectiveness which are
grounded in The Seven Correlates of Highly Effective Schools (Larry Lezotte) as well as research and
practice on professional development and school culture. Paterson’s model is patterned after similar
models successfully implemented in the Hillsborough County Schools in Tampa, Florida and The Provi-
dence Public Schools, in Providence, Rhode Island. Each of the model’s dimensions includes indicators
that define effective, specific observable practices which will:
1. Provide a blueprint or roadmap for creating and maintaining effective schools.
2. Serve as a curriculum for continuous professional development for school and district adminis-
trators and teachers.
3. Provide tools for gathering consistent information to determine a school’s strengths and areas in
need of improvement in the context of effective schools’ research and practice.
4. Provide uniform expectations and practices for all schools.
5. Serve as the basis for assessing the effectiveness of individual schools.
6. Provide a common set of “Correlates” or “Dimensions” through which Comparability of Educa-
tion Quality can be assessed and assured – a lens through which all schools can be viewed.
Research has clearly demonstrated that a school that rates high on the first nine effectiveness

21
dimensions is highly effective in meeting the needs of all its students. To this end, each school will use
a locally developed assessment instrument to internally assess its performance on all ten dimensions of
the model. This instrument will assess the attitudes and impressions of school faculty (teaching and non-
teaching staff), parents and students. The results of the assessments will be used in the development of
individual school improvement plans and will inform performance appraisals of principals.
Several guiding assumptions provide the foundation for this model:
1. All students under the right conditions can achieve at high levels.
2. The unit of analysis for school effectiveness must be the school; the unit of analysis for effective-
ness within each school must be the classroom.
3. The effectiveness of every school must be assessed; no school will be exempt from analysis.
4. Improving school effectiveness is non-negotiable; every school’s effectiveness can and will be
maximized.
5. When evaluation data suggest that a project
or program no longer contributes to the ef-
fectiveness of the school or district, or to the
realization of the district’s vision or mission,
it will be discontinued.
6. Pre-existing expectations and behavioral
norms not aligned to the model will norms are
no longer acceptable mentalities.
The Ten Dimensions of School Effectiveness Are:
1. Principal as Leader: The principal leads,
manages and communicates the total instruc-
tional program to staff, students and parents.
2. Clearly Stated Vision and Mission: The
school’s vision/mission is clearly articulated
and understood.
3. High Expectations: The staff believes, demonstrates and promotes the belief that all students can
achieve at a high level.
4. Assessment and Monitoring: Student academic progress is monitored frequently with a variety
of assessment instruments.
5. Instructional Delivery: Teachers consistently use effective teaching practices and allocate a

22
significant amount of time to instruction in essential content and skill areas.
6. Safe, Caring and Orderly Environment: The school’s atmosphere is orderly, caring, purposeful
and professional.
7. Parent and Community Involvement: Parents support the school’s mission and play an active
role in its achievement.
8. Professional Development: Professional development for all faculty and staff supports the in-
structional program.
9. School Culture: The school’s culture, climate, or both are responsive to and support the needs of
the students, parents and community.
10. Ethics in Learning: The school community is innovative in modeling and building a school cul-
ture that is characterized by integrity, fairness and ethical practices.
Successful implementation of this model requires that all dimensions are fully implemented. Suc-
cessful implementation requires that all stakeholders, including unions, community partners, parents,
and colleges and universities work collaboratively.
Principals’ AutonomyIn the spring 2011, the district instituted steps to increase principal’s autonomy by affording them
more control in the hiring of their teachers and other instructional staff. Additionally, a principal’s abili-
ty to remove ineffective teachers from schools is enabled by the use of an aggressive performance-based
evaluation system that is linked to student achievement. The district has further enhanced a principal’s
autonomy by implementing a “no forced placement” policy.
Capacity Building
Pre-K Through Grade 3 Literacy InitiativeDuring the 2012-2013 school year, the Paterson Public School district continued to strengthen its
early childhood programs to provide each child with high quality learning experiences in grades pre-K
through 3. A plan was created to develop an early learning system in Paterson that provides every
student with access to consistent quality standards and a solid foundation for academic success. The
plan aims to offer children and families from pre-school through third grade a common road map and
unified goals.
Thirty-six hundred three and four year old students are enrolled in provider settings and in-district
pre-school programs. One strategy is to relocate students in private providers that are not meeting

23
district and staff standards and expectations to programs and schools that are meeting these expecta-
tions. To that end, in September 2012, ten classrooms opened at St. Mary’s school providing 150 seats
for three and four year olds and two classrooms opened at School 24 providing thirty additional seats.
In 2013, an additional ten pre-school classrooms were added to three priority schools (schools 6, 10, and
28) and our collaboration with Head Start will be expanded.
Additional strategies implemented for students grades pre-k through grade 3 include:
• Providing skills aligned to the domains of children’s development: cognitive, social/emotional,
and physical.
• Using a curriculum which encompasses the New Jersey Department of Education’s K-3 Teaching
and Learning Expectations. These expectations, along with the Common Core State Standards
are the foundation of curriculum development and implementation with the emphasis on the
development of children’s thinking, reasoning, decision making, and problem-solving abilities.
• Offering Literacy Instructional Blocks (120 minutes) to help ensure Language Arts experiences
in early childhood concentrate on foundational skills including: print concepts, phonological
awareness, phonics and word recognition, and fluency.
• Providing reading comprehension, writing, speaking and listening opportunities, and language
goals integrated in content areas.
• Providing young children with extensive exposure to high quality text and opportunities to trans-
fer and practice reading and decoding skills is a necessary for success in later grades.
• Ensuring that classrooms that have various reading materials on multiple levels to scaffold
students reading.
• Integrating Social Studies experiences to assist the early learner to develop an understanding of
people and how they relate to others and the world around them, themselves, their families, and
their communities through interdisciplinary and thematic lessons.
• Integrating science curriculum that is interdisciplinary and thematic. Early learners are encour-
aged to wonder “what will happen if” and test possibilities demonstrating cause and effect. The
integration of the arts, health and physical education in early learning.
• Integrating art and music with other academic subjects with the purpose of developing skills,
exploring roles, assessing learning and understanding concepts.
As we continue to strengthen our early learning system our work with Paterson Reads, a community
collaboration of the Paterson Alliance, the Paterson Education Fund and other community agencies will
provide opportunities to enhance and improve Summer Learning, Reading on grade level by third grade
24
and attendance for our youngest students. Paterson Reads has expanded the Paterson Public library
summer reading program offering students more books, reading circles and literacy activities during the
summer, works with New Jersey Reach out and Read to identify Paterson pediatricians and funders to
implement “Reach Out and Read”, which provides reading assistance books for each child at their well
child visit and continues their efforts to implement Breakfast After the Bell to help increase on time
attendance at designated elementary schools.
School/District RestructuringDuring the four years since 2009, the district has restructured a number of elementary and high
schools. Schools identified for restructuring typically were not meeting academic targets or had per-
vasive staff or discipline challenges that otherwise impeded progress. Specific changes that occurred
included a combination of changes in:
• leadership and administrative structure;
• faculty and staff;
• students;
• grade configuration; and
• curriculum and instructional approaches, including the addition of thematic or special programs.
In most instances the schools were closed and reopened as a newly configured school with a new
principal, new faculty, new students, and often new instructional programming. During the 2012-2013
school year, the district restructured schools 11, 15, 28, and New Roberto Clemente. New programs
included an Academy for the Gifted & Talented at School 28, a Newcomers program at School 11 for
non-English speakers new to the district, a middle school at New Roberto Clemente, and a newly con-
figured K-5 elementary school at School 15.
Previous to last year, the district restructured and re-staffed its high schools into autonomous small
thematic choice schools and reconfigured and re-staffed three of its elementary schools.
Special Education RestructuringAlthough the district has experienced significant improvements in academic gains in recent years,
significant achievement gaps remain among subgroups. This includes, but is not limited to special
education. For this and other reasons, the district engaged The Center for Research and Evaluation on
Education and Human Services (CREEHS) at Montclair State University to conduct a comprehensive
evaluation of its special education programs and services which began September 2011.
As requested, the resulting evaluation report identified several significant findings and areas in need

25
of improvement. Chief among the findings was that proficiency rates on state achievement tests are par-
ticularly low for students with disabilities and that students receiving special education services are also
less likely to graduate high school in four years, more likely to drop out of school, and more likely to be
suspended than are those who do not receive special education services.
Numerous recommendations for improvements were forwarded including (but not limited to):
• An integrated “one-world” district-wide plan, philosophy, and vision should be developed to ad-
dress the current separation between general and special education and allow for the provision of
consistent and effective services across schools;
• A coordinated organizational and supervisory structure, including clear roles and responsibilities
for each position, should be developed and disseminated to clarify staff expectations, improve
communication, and streamline processes;
• Effective transitional counseling should be provided for students moving from school to school
and from high school to post-secondary life;
• Ongoing, coherent professional development should be provided to all teachers regarding best
practices for teaching students with diverse needs, including those with and without disabilities;
• Comprehensive and ongoing training and support should be provided to building administrators
regarding best practices for teaching students with diverse needs and for administrating special
education services, including compliance to state and federal regulations; and
• An integrated and cohesive data system is needed to coordinate and share data across depart-
ments and schools and to allow for ongoing monitoring of program success.
An implementation plan for the recommendations was developed during the 2012-2013 school year
and is currently being implemented.
Restructuring Programs for English Language Learners (Bilingual)Among the student subgroups for whom significant achievement gaps exist are English Language
Learners or students with Limited English Proficiency. To better align bilingual instruction with state
and local initiatives and bring about needed academic and programmatic improvements, the district
engaged the University of Pittsburgh Institute for Learning (IFL) to conduct a review of the education
program for the district’s English Language Learners (ELLs). Of particular interest was making
improvements to its instructional core – how students learn and teachers teach, and how the teacher’s
work affects student learning.
To this end, this report: (1) describes the service delivery educational system for ELLs in Paterson;

26
(2) delineates the management of programs for ELLs, its central functions as well as the school-based
responsibilities and authority; (3) lists Paterson’s observed assets and the challenges facing Paterson
administrators and teachers in improving educational outcomes for ELLs; (4) describes the district’s
readiness to provide ELLs access to the Common Core State Standards (CCSS); and (5) provides a list
of recommendations intended to improve the education of English Learners.
As noted in the evaluation report, to bring coherence and a robust program design for Paterson
ELLs, the following recommendations are offered:
• Develop a clear vision and set of beliefs, accompanied by a theory of action that is
grounded in research-based practices for the education of ELLs so that they can be
college-ready;
• Develop an organizational structure to support the vision and program. Coherence is
at the center of this request;
• Appoint a permanent leader to the Bilingual/ESL Department as part of this organizational struc-
ture;
• Design a research-based program of instruction for ELLs that will provide continuity of service
to ELLs and can be resourced by the district;
• Ensure that teachers are knowledgeable about pedagogy, supports, rituals, and routines for sup-
porting ELLs. Teachers and principals need intensive professional development on how to help
ELLs access the CCSS through best practices for English Learners;
• Provide EL students with resources that will give them access to the CCSS. The materials and
texts provided to them must meet the CCSS requisites regarding grade level and complexity;
• Set up a communication mechanism for stakeholder input with central leaders; and
• Recognize that parents of ELLs have a voice in their children’s education and some have much
to say regarding the quality of education they think students are currently receiving.
The University of Pittsburgh/Institute or Learning (Please see Common Core Standards section on page 18)
Teacher And Principal Evaluation Systems
Focal Point Since 2010, the New Jersey Department of Education has been working to improve educator evalu-
ation and supports. These efforts included a two-year pilot that involved more than 15,000 teachers and

27
principals. Building on this work, New Jersey’s 2012 TEACHNJ Act now mandates many requirements
for the new statewide educator evaluation system and links tenure decisions to evaluation ratings. On
September 11, 2013, the State Board approved regulations outlining specific evaluation policies for
2013–14 which is the first year of full statewide implementation of this new system, AchieveNJ.
As a result, all school districts in New Jersey are required to adopt and implement evaluations
systems for principals and teachers that
are approved by the Department of Edu-
cation. Paterson has selected
Focal Point’s teacher and principal evalu-
ation instruments. These instruments
help guide observers as they identify key
components of effective teaching, ensure
that a
teacher’s practice is evaluated consistent-
ly, and that teachers are receiving mean-
ingful feedback.
All administrators and teachers have been trained on the new systems. Teacher training has also
focused on curriculum alignment/instructional strategies and the teacher evaluation performance rubric.
In addition, in September 2012, a crosswalk tool and process was introduced district-wide to help pre-
pare staff for full implementation in September 2013.
Attributes or components of the new administrator and teacher evaluation systems include:
• New instruments and processes;
• Consideration of student academic performance;
• Aligned instructional system (standards, curriculum, assessment, & professional development);
• Performance criteria for teachers
o Preparation for instruction
o Use of data to inform instruction
o Delivery of instruction
o Interventions to meet diverse needs
o Classroom environment
o Leadership
o Professionalism
28
• Performance criteria for administrators
o Leadership
o Instructional Program
o Staff Development
o Effective Management
o Professional Responsibilities
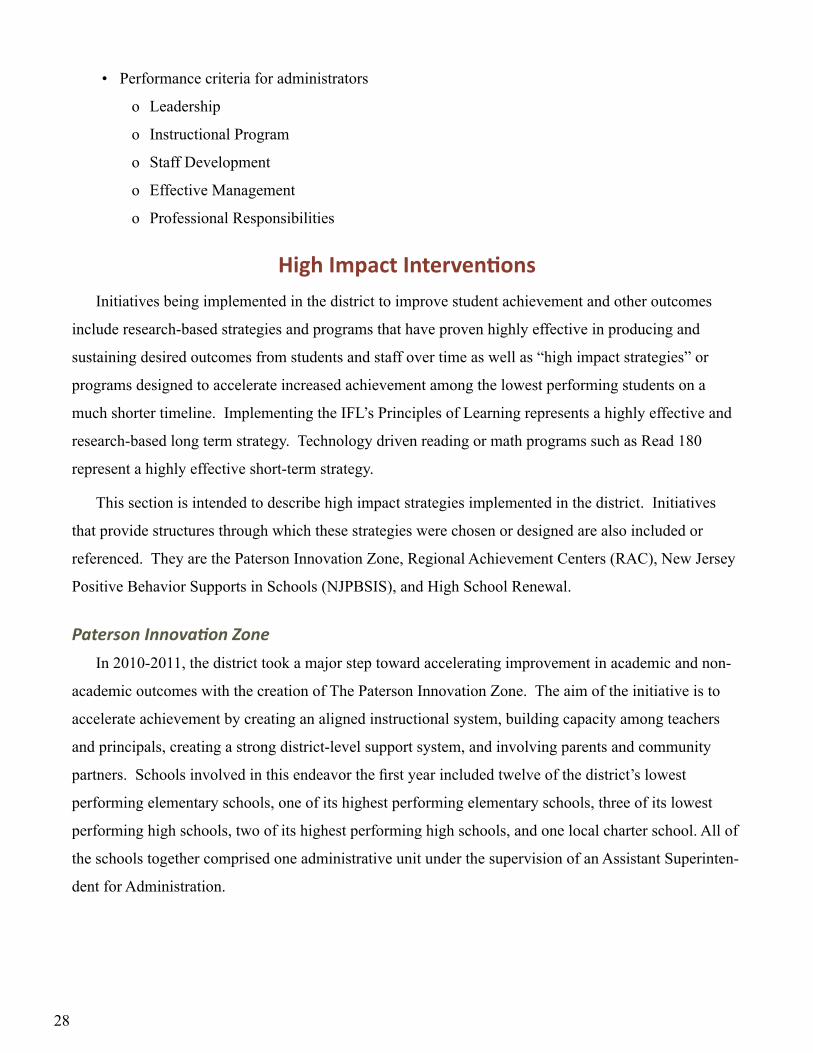
High Impact InterventionsInitiatives being implemented in the district to improve student achievement and other outcomes
include research-based strategies and programs that have proven highly effective in producing and
sustaining desired outcomes from students and staff over time as well as “high impact strategies” or
programs designed to accelerate increased achievement among the lowest performing students on a
much shorter timeline. Implementing the IFL’s Principles of Learning represents a highly effective and
research-based long term strategy. Technology driven reading or math programs such as Read 180
represent a highly effective short-term strategy.
This section is intended to describe high impact strategies implemented in the district. Initiatives
that provide structures through which these strategies were chosen or designed are also included or
referenced. They are the Paterson Innovation Zone, Regional Achievement Centers (RAC), New Jersey
Positive Behavior Supports in Schools (NJPBSIS), and High School Renewal.
Paterson Innovation ZoneIn 2010-2011, the district took a major step toward accelerating improvement in academic and non-
academic outcomes with the creation of The Paterson Innovation Zone. The aim of the initiative is to
accelerate achievement by creating an aligned instructional system, building capacity among teachers
and principals, creating a strong district-level support system, and involving parents and community
partners. Schools involved in this endeavor the first year included twelve of the district’s lowest
performing elementary schools, one of its highest performing elementary schools, three of its lowest
performing high schools, two of its highest performing high schools, and one local charter school. All of
the schools together comprised one administrative unit under the supervision of an Assistant Superinten-
dent for Administration.

29
All Zone schools are held accountable for operating consistent with district policies, procedures,
and academic and non-academic expectations. In addition, Zone schools:
1. Employ the “managed instruction” theory of action.
2. Benchmark and set academic targets: analyze test scores and establish academic and non-aca-
demic performance targets for district identified indicators of success.
3. Implement with fidelity the University of Pittsburgh’s Principles of Learning instructional model
to build capacity among teachers and administrators.
4. Participate in targeted and focused professional development by the Institute for Learning for
teachers and administrators.
5. Implement with fidelity the Paterson Effective Schools’ Model.
6. Pilot implementation of the national Common Core Standards.
7. Pilot the district’s performance-based assessment and pay systems.
The primary approach used in these schools was and continues to be:
1. Establishing strategic direction and academic targets for the school and classes.
2. Using assessment data to identify students’ academic strengths and weaknesses.
3. Developing lesson plans and provide professional development to teachers and principals on
effective instructional practices.
4. Delivering rigorous instruction to all students.
5. Re-assessing students (interim assessments) to measure progress.
For the 2012-2013 school year, the Innovation Zone was re-conceptualized and re-organized to
include the district’s six elementary priority schools, fourteen focus elementary schools, and four focus
high schools, each of which implements the Regional Achivement Center Approach.
Regional Achievement Centers Through New Jersey’s waiver from provisions of the Elementary and Secondary Education Act
(ESEA), the New Jersey Department of Education developed a new school accountability system to
replace certain provisions of No Child Left Behind. One outcome of the waiver is the identification of
priority, focus, and reward schools in the state. A Priority School is one “that has been identified as
among the lowest-performing five percent of Title I schools in the state over the past three years, or any
non-Title I school that would otherwise have met the same criteria. A Focus School is a school that has
room for improvement in areas that are specific to the school such as low graduation rates or within-
school achievement gaps. Reward Schools are those with outstanding student achievement or growth
over the past three years. As previously mentioned, Paterson includes six priority schools and 18 focus

30
schools.
A second outcome of the waiver is the creation of Regional Achievement Centers (RAC). RACs
represent a new system of seven field-based centers that are charged with working with school districts
on making improvements in New Jersey’s Priority and Focus Schools. RAC staff partner with Priority
and Focus Schools to execute comprehensive School Improvement Plans aligned to the eight turnaround
principles that are:
• School Leadership: The principal has the ability to lead the turnaround effort
• School Climate and Culture: A climate conducive to learning and a culture of high expecta-
tions
• Effective Instruction: Teachers utilize research-based effective instruction to meet the needs of
all students
• Curriculum, Assessment, and Intervention System: Teachers have the foundational docu-
ments and instructional materials needed to teach to the rigorous college and career ready stan-
dards that have been adopted
• Effective Staffing Practices: The skills to better recruit, retain and develop effective teachers
and school leaders
• Enabling the Effective Use of Data: School-wide use of data focused on improving teaching
and learning, as well as climate and culture
• Effective Use of Time: Time is designed to better meet student needs and increase teacher col-
laboration focused on improving teaching and learning
• Effective Family and Community Engagement: Increased academically focused family and
community engagement
In addition to school improvement initiatives and strategies created and implemented by the district
during the 2012-2013 school year, the following RAC financed interventions were instituted in priority
and focus schools.
• Onsite school-based supervisors in priority and focus schools.
• Teacher mentor leaders in priority schools (language arts, mathematics, data, climate and cul-
ture).
• Teacher mentor of professional development and data analysis in focus schools.
In addition to mentor teachers, school-based supervisors will be assigned to focus and priority
elementary schools. The role of a school-based supervisor is two-fold: 1) to bring a higher level of sup-
port to principals and teachers, and 2) to bring a stronger and deeper level of pedagogy and increase

31
content knowledge of priority and focus schools’ staff.
End Social PromotionPrior to the 2011-2012 school year, district policies, procedures and expectations for promotion or
retention from one grade to the next, were not executed with fidelity. The result was “social promotion”
district-wide. This problem was especially problematic for students in grades Kindergarten through
eight.
During the 2011-12, the Superintendent declared an end to social promotion by:
• Enforcing the district’s policies and procedures on promotion and retention;
• Requiring a summer academic program to students who failed to meet performance targets
during the school year; and
• Requiring that if academic targets are not met by the end of the summer program, students would
be retained in the same grade.
The summer program includes intensive instruction in math and/or language arts. During the
summer of 2012, more than 2000 students in grades Kindergarten through eight participated in the pro-
gram and more than 95% met their targets and were promoted to the next grade.
Attendance InitiativeResearch has shown that a student’s attendance is directly correlated to his or her student achieve-
ment. Although our district’s attendance rates have been maintained at a 91-93% average over the past
few years, attendance in high school is below 90% and there are too many chronically absent children
throughout all grade levels. Recognizing that future funding will depend partly on the district’s average
daily attendance, the district has embarked on an attendance initiative which began with the establish-
ment of a committee charged with the review of the district’s practices and procedures, as well as past
attendance history and trends. The committee’s work has led to the collaboration with outside organiza-
tions on a district-wide attendance campaign. Additionally, the district’s internal attendance staffing
model is being reviewed and revised in order to more efficiently monitor and address daily student
attendance – particularly for those students who are chronically absent.
Graduation EnhancementsAmong the high impact interventions implemented across the district to accelerate the achievement
of academic and non-academic outcomes for all students, many focused specially on high schools and
high school students. The aim was not only to improve performance on the High School Proficiency

32
Assessment (HSPA), but to improve the graduation rate, Implementation, drop-out rate, college accep-
tance and admissions rates, and parent engagement. Among the strategies are:
• District driven intensive mathematics intervention for teachers and students;
• Focus on students on the cusp;
• Transcript Reviews for all seniors and their parents (all central office administrators team with
high school counselors including all supervisors, directors, assistant superintendents and the
Superintendent)
• HSPA Prep classes
o Saturday, afterschool, boot
camp, marathons, etc.
o Plato Learning
o Ipad tool intervention
o Heightened awareness and
focus (students, staff, & par-
ents)
• SAT Prep classes
• Focused learning walks
o Focal Point
o IFL
• Special Education Inclusive Programming
• Graduation enhancement strategies
o Credit recovery program
o Twilight program (night school)
NJPBSIS (Positive Behavior Support in Schools (PBSIS)The purpose of the PBSIS initiative is to build capacity to support the social-behavioral needs of all
students, including students with disabilities. NJPBSIS provides school staff with training and technical
assistance to create environments that encourage and support pro-social student behavior at the school-
wide, classroom, and individual student levels using current, research validated practices in positive
behavior support. In doing this, school staff are better prepared to positively and proactively address the
individualized behavior support needs of all students, including students with disabilities, engaging in
repeated behavior issues.
Four focus and priority schools in the Innovation Zone (Schools 5, 6, 13 and NRC) received initial

33
PBSIS training in 2012-2013, and will begin Level 2 training in 2013. These schools will have a
school-wide instructional event that teaches/reinforces the school-wide expectations, introduces the
recognition system and celebrates students and staff. The Universal Team, which consists of 6-10 des-
ignated people, including a parent, was established and developed an Office Conduct Referral Process,
which will be implemented in the 2013-2014 school year. The I&RS team will implement a function-
based problem-solving process to develop interventions for students who engage in repeated unaccept-
able behaviors. The child study teams will use the function based problem solving process to develop
behavior intervention plans for students with disabilities. Data will be collected to support on-going
interventions.
Moving forward to the 2013-14 school year, an additional 20 focus and priority schools including the
alternative high schools will begin training in the PBSIS model.
Process Redesign
American Productivity and Quality Center (APQC)“Productivity and quality improvement is a race without a finish line.” Effective school systems
have well defined, well executed processes and procedures associated with critical operational functions.
APQC, one of the world’s leading proponents of best practices and knowledge management research,
has been working with the district over the past two years in redesigning, implementing, and sustaining
processes that will provide a transformational support system for all schools and academic programs.
Previous to the 2012-2013 school year, APQC
guided the district in redesigning processes and
procedures in finance, curriculum, human resources,
assessment, and school choice. This year, APQC
worked with the district on refining processes and
procedures in key administrative areas: Central
Registration, Management Information Systems,
Human Resources, Facilities and Transportation.
Some of the outcomes of this work included:
• Savings of over $2 million in one school year;
• Shortened administrative processing timelines by days, even weeks; and
• Improved customer satisfaction.

34
Accomplishments: 2012-2013 School Year
Process & Fiscal OutcomesSince the development of Bright Futures, the district has aggressively implemented many of its strat-
egies, such as:
1. Revised teacher & administrator evaluation systems;
2. Conducted professional development to build capacity among principals and staff;
3. Re-assigned principals to accomplish a more effective “goodness of fit” to improve student
achievement;
4. Trained and continued to
implement the new Common
Core State Standards;
5. Implemented academic inter-
ventions for students per-
forming below proficient in
mathematics and/or language
arts literacy on NJASK and
HSPA;
6. Restructured elementary
schools:
a. Opened Gifted & Talented Academy (at School 28);
b. Opened Newcomers School (at School 11);
c. Opened new middle school – grades 6-8 (New Roberto Clemente);
d. Restructured School 15 from grades K-8 to a pre-K-grade 5 elementary school; and
e. Added in-district pre-K classes (Madison Avenue, School 24, St. Mary’s Early Learning
Center);
7. Created pre-kindergarten through grade 3 literacy initiative;
8. Ended social promotion; implemented mandatory summer school to advance to next grade;
9. Revised district’s Safety & Security Plan;
10. Developed and began implementing Internal & External Communications Plan.

35
11. Auditor’s Management Report (AMR) of the 2012/2013 school year resulted in no significant
findings or material weaknesses to report. Auditors commended district’s Business Office.
12. Acquired grant funding to support district initiatives:
a. 21st Century Community Learning Centers Program (2012-2017) - $2,647,900;
b. The Race-to-the-Top Phase 3 (RTTT3) to support the implementation of the revised Princi-
pal and Teacher Evaluation System - $1,271,064;
c. HRSA: School Based Health Center Capital Program for School 6 & School 15 (2012-
2014) - $500,000;
d. Lowe’s Community Improvement Grant for School 4 - $100,000;
e. Excellent Educators for New Jersey (EE4NJ) Pilot Program Principal Effectiveness Evalua-
tion System - $50,000; and
f. Optimum Lightpath Grant for PANTHER academy to purchase equipment for a digital
astronomy laboratory- $10,000.

36
Academic Results
NJASKThe district has implemented a number of strategies – from administration of Renaissance Star
Benchmark Assessments for students to professional development for teachers and principals – in order
to further accelerate student achievement across all elementary schools.
The district has witnessed growth in every demographic group over the last year. In particular
language arts and mathematics scores for our general education students Grades 3-8, are the highest they
have been in the last 3 years. Additionally, Special Education and Limited English Proficient students
have made notable improvement in every area especially in Science.
Other results include:
• The percentage of students in Grades 3-8 performing at or above proficient in language arts
increased from 35.5% in 2010-11 to 40.1% in 2012-13, from 49.1% to 52% in mathematics and
from 58.7% to 61.2% in science.

37
Percentage of Students in Grades 3-8 Proficient and Advanced Proficient in Language Arts, and Mathematics And Science
2012 2013Language Arts
2012/2013 +/-Demographic Group % Proficient & above % Proficient & above
Total Students 38.1% 40.1% +2.0%General Education 47.1% 50.0% +2.9%Special Education 10.8% 11.9% +1.1%Limited English Proficient 23.1% 21.8% -1.3%
Mathematics
2012/2013 +/-Demographic Group % Proficient & above % Proficient & above
Total Students 51.0% 52.0% +1.0%General Education 60.2% 62.4% +2.2%Special Education 21.5% 21.3% -0.2%Limited English Proficient 40.1% 38.3% -1.8%
Science
2012/2013 +/-Demographic Group % Proficient & above % Proficient & above
Total Students 63.9% 61.2% -2.7%General Education 74.5% 72.6% -1.9%Special Education 34.8% 33.3% -1.5%Limited English Proficient 47.2% 43.2% -4.0%
NJASK 2012 2013Language Arts Language Arts 2012/2013 +/-
Grade % Proficient & above % Proficient & above +/-3-8 38.1 40.1 +2.03-5 35.1 34.6 -0.56-8 41.1 45.4 +4.3
Mathematics MathematicsGrade % Proficient & above % Proficient & above +/-
3-8 51.0 52.0 +1.03-5 57.9 57.7 -0.26-8 43.9 46.4 +2.5
38
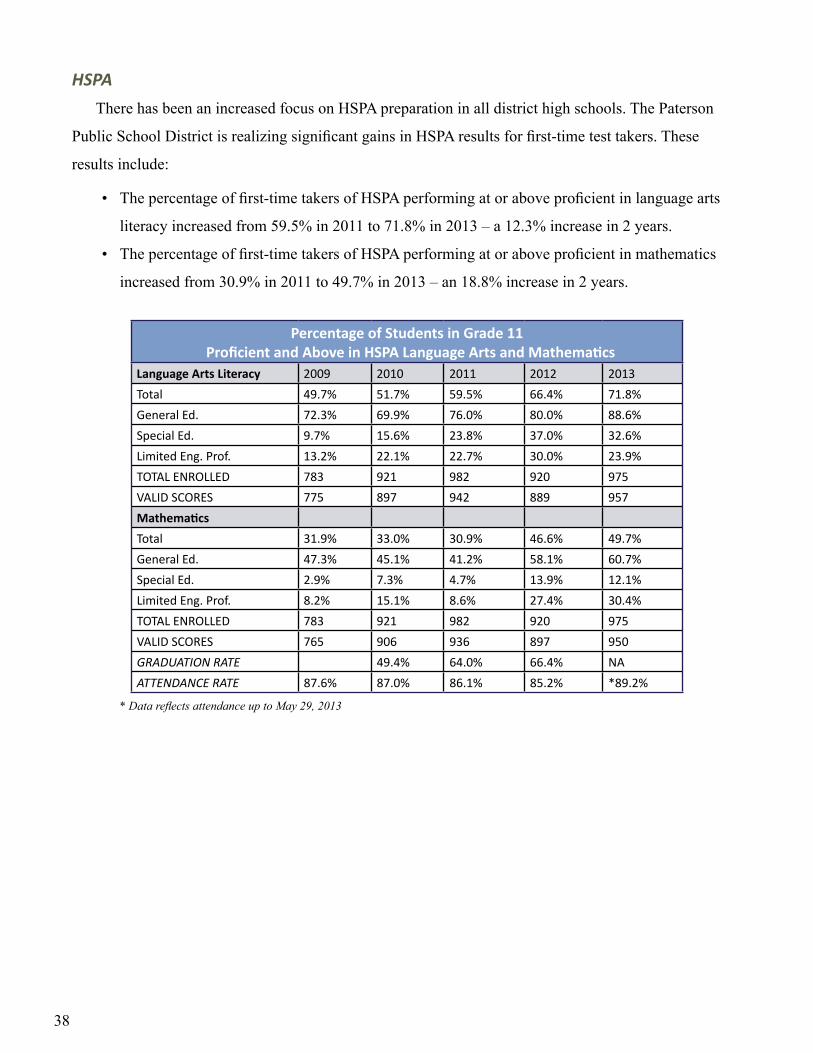
HSPAThere has been an increased focus on HSPA preparation in all district high schools. The Paterson
Public School District is realizing significant gains in HSPA results for first-time test takers. These
results include:
• The percentage of first-time takers of HSPA performing at or above proficient in language arts
literacy increased from 59.5% in 2011 to 71.8% in 2013 – a 12.3% increase in 2 years.
• The percentage of first-time takers of HSPA performing at or above proficient in mathematics
increased from 30.9% in 2011 to 49.7% in 2013 – an 18.8% increase in 2 years.
Percentage of Students in Grade 11 Proficient and Above in HSPA Language Arts and Mathematics
Language Arts Literacy 2009 2010 2011 2012 2013 Total 49.7% 51.7% 59.5% 66.4% 71.8%General Ed. 72.3% 69.9% 76.0% 80.0% 88.6%Special Ed. 9.7% 15.6% 23.8% 37.0% 32.6%Limited Eng. Prof. 13.2% 22.1% 22.7% 30.0% 23.9%TOTAL ENROLLED 783 921 982 920 975VALID SCORES 775 897 942 889 957MathematicsTotal 31.9% 33.0% 30.9% 46.6% 49.7%General Ed. 47.3% 45.1% 41.2% 58.1% 60.7%Special Ed. 2.9% 7.3% 4.7% 13.9% 12.1%Limited Eng. Prof. 8.2% 15.1% 8.6% 27.4% 30.4%TOTAL ENROLLED 783 921 982 920 975VALID SCORES 765 906 936 897 950GRADUATION RATE 49.4% 64.0% 66.4% NAATTENDANCE RATE 87.6% 87.0% 86.1% 85.2% *89.2%
*DatareflectsattendanceuptoMay29,2013

39
HSPA Grade 11 2003-2013 Language Arts and Mathematics Proficient and Above
Language Arts Literacy 2003 2004 2005 2006 2007 2008 2009 2010 2011 2012 2013 *
Total 56.9% 54.7% 53.8% 52.6% 56.3% 49.3% 49.7% 51.7% 59.5% 66.4% 71.8%General Ed. 73.3% 70.6% 70.4% 69.3% 74.0% 65.7% 72.3% 69.9% 76.0% 80.0% 88.6%Special Ed. 13.6% 6.1% 9.1% 7.3% 9.3% 8.3% 9.7% 15.6% 23.8% 37.0% 32.6%Lmtd. Eng. Prof.. 10.0% 11.0% 8.1% 11.0% 11.6% 9.0% 13.2% 22.1% 22.7% 30.0% 23.9%Total Enrolled 809 968 1020 1091 1065 841 783 921 982 920 975Valid Scores 791 958 984 1066 1039 814 775 897 942 889 957MathematicsTotal 39.9% 40.4% 47.2% 45.5% 39.7% 34.2% 31.9% 33.0% 30.9% 46.6% 49.7%General Ed. 48.5% 50.0% 58.7% 57.6% 52.4% 46.0% 47.3% 45.1% 41.2% 58.1% 60.7%Special Ed. 4.8% 9.1% 6.8% 4.5% 1.5% 1.9% 2.9% 7.3% 4.7% 13.9% 12.1%Lmtd. Eng. Prof. 30.7% 20.3% 26.7% 25.4% 16.1% 13.9% 8.2% 15.1% 8.6% 27.4% 30.4%Total Enrolled 809 968 1020 1091 1065 841 783 921 982 920 975Valid Scores 791 951 964 1064 1033 811 783 906 936 897 950
*Preliminary:2013Dataisbasedontheschools“CycleIReport”
SAT ResultsThe SAT assesses students in the areas of reading, writing, and mathematics. The district focused
more aggressively on SAT preparation in the 2012 school year and as a result the mean scores for critical
reading and writing have increased.
SAT Mean Scores2009 2010 2011 2012 2011/2012 +/-
SAT Mathematics 387 387 388 389 +1SAT Critical Reading 367 360 362 365 +3SAT Writing 362 360 358 365 +7
PSAT ResultsThe district replaced the Standard Proficiency Assessment (SPA) with PSAT in the 2011-2012 school
year for all ninth and tenth grade students. The College and Career Readiness Benchmarks are included
in PSAT reporting to help educators better understand how many and also which students are on track to
have the skills necessary for success in college.
PSAT October 2012Grade Critical Reading (CR) Score Mathematics (M) Score Writing Skills (W) Score
% Acceptable & Above % Acceptable & Above % Acceptable & Above9 76.3% 59.0% 50.3%10 77.8% 61.1% 53.3%

40
Graduation/Drop-Out RateImproving the graduation rate is a critical goal for the district. A number of initiatives were put
into place including credit recovery programs and comprehensive transcript reviews for all high school
seniors. Over the last several years the district has seen steady increases in both graduation rates and the
number of students enrolling in college.
Paterson Public Schools Graduation/Dropout Rate*Graduation
YearTotal
Students**Graduated Dropouts Transfers Other
# % # % # % # %2009 2112 964 45.60 435 20.60 470 22.25 243 11.502010 1960 987 50.36 350 17.86 400 20.41 223 11.382011 1444 881 64.0% 85 5.9% 124 8.6% 354 24.5%2012 1467 974 66.4% 141 9.6% 95 6.5% 257 17.5%2013 1538 1109 72.1% 166 10.8% 98 6.4% 165 10.7%
*The“Four-YearCohortMethod”wasusedtocalculatetheGraduation/Drop-outrates
**Totalstudentsentering9thgradeasa“cohort”
Additionally, in our continued efforts to reduce the drop-out rate we have introduced the following:
• Twilight School, for our students who due to job or other obligations, need to attend school for a
limited time; and
• Truancy bus was reinstituted in February 2012. For the 2012-13 school year, 682 students were
returned to school.
Paterson Public Schools Post-Graduation Plans2012 2013
Category Numbers Percentage Numbers PercentageTotal Students Enrolled 1226 N/A 1290 N/ATotal Received Diploma 1060 86.46% 1145 88.76%Four-Year College 287 23.41% 318 24.65%Two-Year College 598 48.78% 595 46.12%Trade/Technical/Certificated Program 96 7.83% 125 9.69%Undecided 25 2.03% 75 5.81%Military 25 2.03% 32 2.48%Employment 29 2.36% 84 6.51%

41
Comprehensive State Review
Quality Single Accountability Continuum (QSAC)In accordance with statutory and code requirements, the Office of the County Superintendent of
Schools conducted a full QSAC evaluation of the Paterson School District in the 2010 school year and
released the district’s Cycle II results in September 2011.
The district maintained a score above 80% (88%) in the area of Governance for the third consecutive
time. After completing and submitting a District Improvement Plan (DIP), the county office conducted
an Interim Review of the district’s progress in all five district performance review (DPR) areas. Listed
below are the scores for the district in each of the DPR areas since its first monitoring in 2007. The most
recent placement scores show that the district has achieved the state benchmark score of 80% or above
in four of the five District Performance Review (DPR) areas.
DPR Areas
Cycle I Placement Full Review
7/2007
Interim Review
Placement 1/2010
Interim Review
Placement 12/2010
Cycle II Placement Full Review
9/2011
Interim Review
Placement 2/2013
Instruction & Program 22% 28% 31% 33% 39%Fiscal Management 41% 45% 60% 51% 80%Operations 73% 67% 85% 70% 95%Personnel 60% 69% 90% 53% 80%Governance 11% 44% 88% 88% 86%
These latest QSAC scores reflect the commitment made by the district and the Board of Education
to improve student achievement. The scores in Fiscal Management, Operations, Personnel, and Gover-
nance signify that the district has made systemic changes that are improving the quality of education that
is being provided to our students.
42
Staff AttendanceIn the 2012-13 school year, Paterson Public School’s staff attendance rate has increased to 92.5%
exceeding last year’s rate by 2.5%.
Student AttendanceIt is the district’s goal to have a daily student attendance rate of 96% in every school. Currently,
Paterson Public Schools has a three year average daily attendance rate of 92%. The district has de-
veloped a comprehensive action plan to increase student attendance. An Attendance Taskforce was
convened in the fall of 2012, and subcommittee chairpersons were selected to review and make recom-
mendations in the areas of: accountability measures, legal interventions, incentives, policy revisions,
communications, and a citywide campaign.
Paterson Public Schools’ Average Daily AttendanceYear Elementary High School
2009-2010 93.4% 88%2010-2011 93.3% 85.1%2011-2012 93.6% 85.2%2012-2013 94.4% 89.0%

43
HSPA Results by High SchoolAcademies at Eastside: Information & Technology
2012 2013
Language Arts Literacy Language Arts Literacy 2012/ 2013 +/-Demographic Group % Proficient and Above % Proficient and Above
Total Students 47.2% 53.5% +6.3%
General Education 68.1% 87.5% +19.4%
Special Education 35.3% 11.1% -24.2%
Limited English Proficient 23.5% 10.3% -13.2%
Mathematics Mathematics 2011/ 2012 +/-Demographic Group % Proficient and Above % Proficient and Above
Total Students 36.4% 37.7% +1.3%
General Education 59.6% 60.4% +0.8%
Special Education 11.8% 12.5% +0.7%
Limited English Proficient 21.2% 6.9% -14.3%
Academies at Eastside: Government & Public Administration2012 2013
Language Arts Literacy Language Arts Literacy 2012/ 2013 +/-Demographic Group % Proficient and Above % Proficient and Above
Total Students 66.7% 96.0% +29.3%
General Education 83.3% 95.1% +11.8%
Special Education 83.3% 100.0% +16.7%
Limited English Proficient 27.3% 100.0% +72.7%
Mathematics Mathematics 2011/ 2012 +/-Demographic Group % Proficient and Above % Proficient and Above
Total Students 41.7% 71.0% +29.3%
General Education 61.1% 69.4% +8.3%
Special Education 0.0% 25.0% +25.0%
Limited English Proficient 22.7% 100.0% +77.3%
Academies at Eastside: Culinary Arts, Hospitality & Tourism2012 2013
Language Arts Literacy Language Arts Literacy 2012/ 2013 +/-Demographic Group % Proficient and Above % Proficient and Above
Total Students 59.7% 54.1% -5.6%
General Education 74.4% 76.1% +1.7%
Special Education 46.7% 33.3% -13.4%
Limited English Proficient 25.0% 13.8% -11.2%
Mathematics Mathematics 2012/ 2013 +/-Demographic Group % Proficient and Above % Proficient and Above
Total Students 38.2% 33.3% -4.9%
General Education 47.7% 33.3% -14.4%
Special Education 6.3% 6.7% +0.4%
Limited English Proficient 46.7% 48.2% +1.5%

44
HARP Academy2012 2013
Language Arts Literacy Language Arts Literacy 2012/ 2013 +/-Demographic Group % Proficient and Above % Proficient and Above
Total Students 93.8% 95.2% +1.4%
General Education 95.1% 95.2% +0.1%
Special Education 50.0% 100.0% +50.0%
Limited English Proficient 100.0% NA NA
Mathematics Mathematics 2012/ 2013 +/-Demographic Group % Proficient and Above % Proficient and Above
Total Students 78.1% 82.5% +4.4%
General Education 80.7% 83.9% +3.2%
Special Education 0.0% 0.0% 0.0%
Limited English Proficient 0.0% NA NA
PANTHER Academy
2012 2013Language Arts Literacy Language Arts Literacy
2012/ 2013 +/-Demographic Group % Proficient and Above % Proficient and Above
Total Students 88.1% 85.7% -2.4%
General Education 94.0% 88.7% -5.3%
Special Education 55.6% 33.3% -22.3%
Limited English Proficient 100.0% NA NA
Mathematics Mathematics 2012/ 2013 +/-Demographic Group % Proficient and Above % Proficient and Above
Total Students 53.4% 64.3% +10.9%
General Education 58.8% 68.0% +9.2%
Special Education 16.7% 0.0% -16.7%
Limited English Proficient 20.0% NA NA
International High School and Garrett Morgan Academy
2012 2013
Language Arts Literacy Language Arts Literacy 2012/ 2013 +/-Demographic Group % Proficient and Above % Proficient and Above
Total Students 92.2% 93.4% +1.2%
General Education 95.4% 94.9% -0.5%
Special Education 60.0% 87.5% +27.5%
Limited English Proficient 80.0% 0.0% -80.0%
Mathematics Mathematics 2011/ 2012 +/-Demographic Group % Proficient and Above % Proficient and Above
Total Students 76.9% 79.5% +2.6%
General Education 79.8% 82.7% +2.9%
Special Education 60.0% 50.0% -10.0%
Limited English Proficient 70.0% 0.0% -70.0%

45
Academies at John F. Kennedy: Architecture & Construction
2012 2013
Language Arts Literacy Language Arts Literacy 2012/ 2013 +/-Demographic Group % Proficient and Above % Proficient and Above
Total Students 41.7% 52.0% +10.3%
General Education 61.8% 83.4% +21.6%
Special Education 21.1% 27.8% +6.7%
Limited English Proficient 21.4% 12.5% -8.9%
Mathematics Mathematics 2012/ 2013 +/-Demographic Group % Proficient and Above % Proficient and Above
Total Students 30.0% 42.0% +12.0%
General Education 39.4% 62.5% +23.1%
Special Education 20.0% 22.2% +2.2%
Limited English Proficient 14.3% 25.0% +10.7%
Academies at John F. Kennedy: Business, Technology & Marketing
2012 2013
Language Arts Literacy Language Arts Literacy 2012/ 2013 +/-Demographic Group % Proficient and Above % Proficient and Above
Total Students 54.3% 46.2% -8.1%
General Education 69.6% 80.0% +10.4%
Special Education 29.4% 11.8% -17.6%
Limited English Proficient 35.7% 0.0% -35.7%
Mathematics Mathematics 2012/ 2013 +/-Demographic Group % Proficient and Above % Proficient and Above
Total Students 21.1% 20.6% -0.5%
General Education 28.3% 32.4% +4.1%
Special Education 5.6% 6.3% +0.7%
Limited English Proficient 7.1% 7.7% +0.6%
Academies at John F. Kennedy: Science, Technology, Engineering & Math
2012 2013
Language Arts Literacy Language Arts Literacy 2012/ 2013 +/-Demographic Group % Proficient and Above % Proficient and Above
Total Students 66.6% 73.9% +7.3%
General Education 81.2% 89.5% +8.3%
Special Education 22.2% 45.5% +23.3%
Limited English Proficient 26.1% 30.4% +4.3%
Mathematics Mathematics 2012/ 2013 +/-Demographic Group % Proficient and Above % Proficient and Above
Total Students 60.0% 59.1% -0.9%
General Education 71.9% 70.6% -1.3%
Special Education 20.0% 27.3% +7.3%
Limited English Proficient 36.4% 39.1% +2.7%

46
Academies at John F. Kennedy: Education and Training
2012 2013
Language Arts Literacy Language Arts Literacy 2012/ 2013 +/-Demographic Group % Proficient and Above % Proficient and Above
Total Students 57.0% 75.2% +18.2%
General Education 70.0% 90.8% +20.8%
Special Education 50.0% 43.8% -6.2%
Limited English Proficient 11.1% 34.8% +23.7%
Mathematics Mathematics 2012/ 2013 +/-Demographic Group % Proficient and Above % Proficient and Above
Total Students 23.3% 28.1% +4.8%
General Education 30.0% 35.6% +5.6%
Special Education 8.3% 0.0% -8.3%
Limited English Proficient 11.1% 17.4% +6.3%
Academy High School
2012 2013
Language Arts Literacy Language Arts Literacy 2012/ 2013 +/-Demographic Group % Proficient and Above % Proficient and Above
Total Students 53.3% 47.8% -5.5%
General Education 60.9% 80.0% +19.1%
Special Education 28.6% 9.5% -19.1%
Limited English Proficient 0.0% NA NA
Mathematics Mathematics 2012/ 2013 +/-Demographic Group % Proficient and Above % Proficient and Above
Total Students 30.0% 28.9% -1.1%
General Education 34.8% 48.0% +13.2%
Special Education 14.3% 5.0% -9.3%
Limited English Proficient 0.0% NA NA
***2012ResultsforAcademyHighSchoolincludedthefollowingAcademies:
1. Sport Business Academy
2. Public Safety Academy
***2013CycleIPreliminaryResultsforAcademyHighSchoolincludedthefollowingAcademies:
1. Sport Business Academy
2. Public Safety Academy
3.STARSAcademy
4. Out of District Placements

47
Rosa L. Parks School of Fine and Performing Arts
2012 2013
Language Arts Literacy Language Arts Literacy 2012/ 2013 +/-Demographic Group % Proficient and Above % Proficient and Above
Total Students 85.4% 90.0% +4.6%
General Education 84.6% 91.1% +6.5%
Special Education 100.0% 80.0% -20.0%
Limited English Proficient 100.0% 0.0% -100.0%
Mathematics Mathematics 2011/ 2012 +/-Demographic Group % Proficient and Above % Proficient and Above
Total Students 69.1% 52.0% -17.1%
General Education 67.3% 57.8% -9.5%
Special Education 100.0% 0.0% -100.0%
Limited English Proficient 100.0% 0.0% -100.0%
Alternative High School2012 2013
Language Arts Literacy Language Arts Literacy 2012/ 2013 +/-Demographic Group % Proficient and Above % Proficient and Above
Total Students 32.6% 29.4% -3.2%
General Education 48.0% 55.6% +7.6%
Special Education 13.3% 0.0% -13.3%
Limited English Proficient 0.0% 0.0% 0.0%
Mathematics Mathematics 2011/ 2012 +/-Demographic Group % Proficient and Above % Proficient and Above
Total Students 8.3% 31.3% +23.0%
General Education 15.4% 62.5% +47.1%
Special Education 0.0% 0.0% 0.0%
Limited English Proficient 0.0% 0.0% 0.0%
***2012and2013(CycleIPreliminaryResults)ResultsforAlternativeHighSchoolincludedthefollowingAcademies:
1. Silk City 2000 Academy
2.GreatFallsAcademy
3.YESAcademy
4. Destiny Academy

48
Going Forward: 2013-2014 District Transformation Initiatives
During the past two decades, the Paterson Public School District has been confronted with numer-
ous obstacles and challenges that have impeded the provision of a high quality education to its diverse
student population. These challenges have ranged from a culture of low expectations to low staff capac-
ity to poor parent and community involvement.
The 2013-2014 school year begins the fifth year of implementing the district’s strategic transforma-
tion plan, Bright Futures. The district has accomplished nearly all of its goals and we have realized
many significant improvements in student academic outcomes. However, our work is far from done.
We must remain focused on our vision to be the statewideleaderinurbaneducation and our mission to
prepareeachstudenttobesuccessfulintheinstitutionofhighereducationofhis/herchoosing,andin
his/herchosenprofession.
We have built a solid foundation but we must continue to realize consistent, positive outcomes. As
the district continues to move forward, we will focus on seven critical objectives:
1. Build a robust assessment system – which includes our planning for the launch of the 2014-
2015 PARCC assessments;
2. Continue the implementation and training on the Common Core State Standards;
3. Build healthy school cultures;
4. Continue our efforts toward capacity building of teachers, principals and central office staff;
5. Continue the implementation of our Teacher & Principal Evaluation System;
6. Expand our high impact interventions to include initiatives focused on student attendance, and
7. Further efforts to ensure efficient operations.
Additionally, to continue our forward momentum, we must achieve the following goals: 1) develop
strategies for ensuring that the district is fiscally solvent for the next three to five years while continuing
to meet its academic goals; 2) re-create or revise the district’s strategic plan to include priorities, goals,
and strategies for the next three to five years; and 3) create a facilities plan to address the district’s facili-
ties needs for the next five years.

49
Illustration 4: District Transformation InitiativesRobust
Assessment System
Common Core
Healthy School Culture
Capacity Building
Teacher/ Principal
Evaluation
High Impact Interventions
Efficient Operations
Star Math & ELA
Univ. of Pittsburgh IFL
Effective Schools
Univ. of Pittsburgh IFL Focal Point Innovation Zone Fiscal Cliff
Planning
PARCC Model Curriculum NJPBSIS K-3 Literacy
InitiativeLeadership
Institute RAC Five-Year Facilities Plan
Elementary School Choice
School & District
Restructuring & Re-staffing
End Social Promotion
Strategic Planning
Principals’ Autonomy
ELL Restructuring
Attendance Initiative
Special Education
Restructuring
Graduation Enhancement
NJPBSIS
Closing CommentsThe Paterson Public School district has embarked upon a major effort to transform the system from
a struggling and low performing urban district to one that is “a leader in educating New Jersey’s urban
youth.” During the past four years (2009-2013), the
district has implemented a number of transformation
strategies and initiatives to build internal capacity,
change its school and district cultures, and redesign
critical process and procedures all aimed at improving
outcomes for its students. As evidenced by increasing
test scores, graduation rates, and college application
admission rates, these and other initiatives have created
forward movement toward the accomplishment of its
mission to prepare all students for success in college
and careers. With the help of our students’ parents and
guardians, and the hard work of our highly dedicated
staff, the children of Paterson are truly on a path to a
brighter future.