Embed Size (px)
Citation preview
BOARD OF EDUCATION Board Auditorium Portland Public Schools Blanchard Education Service Center REGULAR MEETING 501 N. Dixon Street MONDAY, October 5, 2015 Portland, Oregon 97227 Note: Those wishing to speak before the School Board should sign the public comment sheet prior to the start of the meeting. No additional speakers will be accepted after the sign-in sheet is removed, but testifiers are welcome to sign up for the next meeting. While the School Board wants to hear from the public, comments must be limited to three minutes. All those testifying must abide by the Board’s Rules of Conduct for Board meetings.
Public comment related to an action item on the agenda will be heard immediately following staff presentation on
that issue. Public comment on all other matters will be heard during the “Public Comment” time.
This meeting may be taped and televised by the media.
AGENDA
1. STUDENT TESTIMONY 6:00 pm
2. PUBLIC COMMENT 6:15 pm
3. ENROLLMENT BALANCING VALUES FRAMEWORK – action item 6:35 pm
4. SMARTER BALANCED ASSESSMENT RESULTS 7:05 pm
5. SECOND READING: TAX-EXEMPT BOND POST-ISSUANCE 8:05 pm COMPLIANCE – action item
6. BUSINESS/CONSENT AGENDA 8:15 pm
7. ADJOURN 8:30 pm
Portland Public Schools Nondiscrimination Statement
Portland Public Schools recognizes the diversity and worth of all individuals and groups and their roles in society. The District is committed to equal opportunity and nondiscrimination based on race; national or ethnic origin; color; sex; religion; age; sexual orientation; gender expression or identity; pregnancy; marital status; familial status; economic status or source of income; mental or physical disability or perceived disability; or military service.
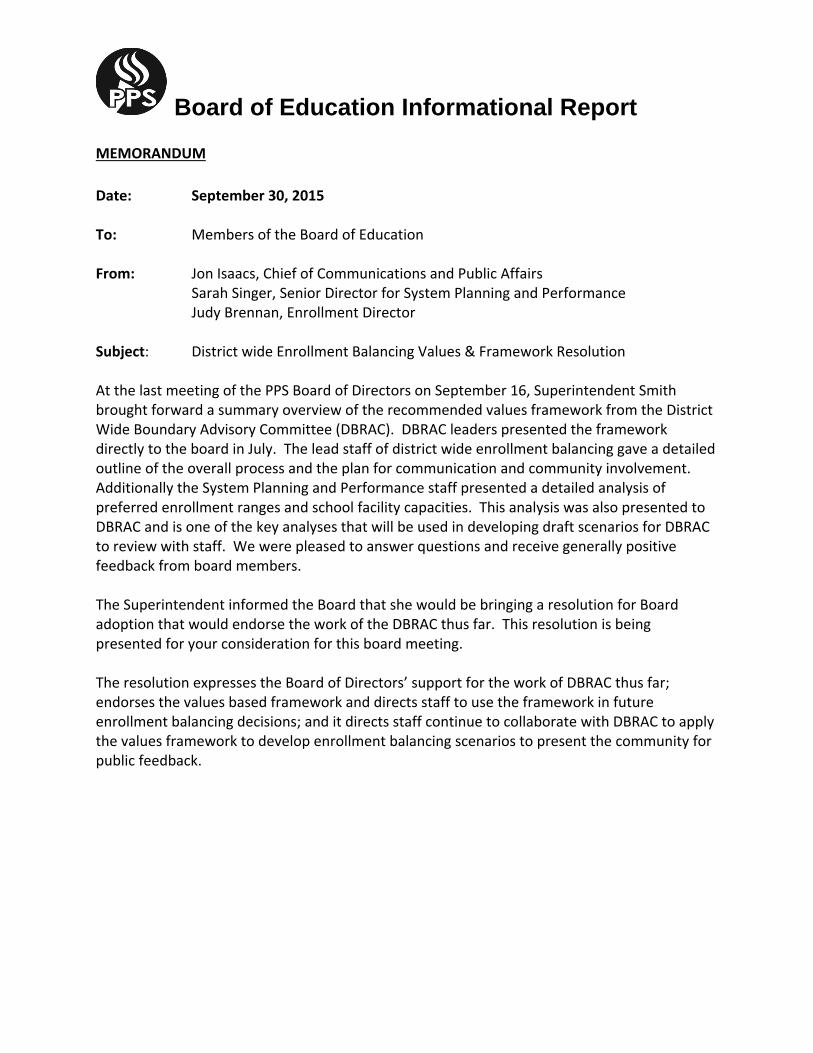
Board of Education Informational Report MEMORANDUM
Date: September 30, 2015 To: Members of the Board of Education From: Jon Isaacs, Chief of Communications and Public Affairs
Sarah Singer, Senior Director for System Planning and Performance Judy Brennan, Enrollment Director Subject: District wide Enrollment Balancing Values & Framework Resolution At the last meeting of the PPS Board of Directors on September 16, Superintendent Smith brought forward a summary overview of the recommended values framework from the District Wide Boundary Advisory Committee (DBRAC). DBRAC leaders presented the framework directly to the board in July. The lead staff of district wide enrollment balancing gave a detailed outline of the overall process and the plan for communication and community involvement. Additionally the System Planning and Performance staff presented a detailed analysis of preferred enrollment ranges and school facility capacities. This analysis was also presented to DBRAC and is one of the key analyses that will be used in developing draft scenarios for DBRAC to review with staff. We were pleased to answer questions and receive generally positive feedback from board members. The Superintendent informed the Board that she would be bringing a resolution for Board adoption that would endorse the work of the DBRAC thus far. This resolution is being presented for your consideration for this board meeting. The resolution expresses the Board of Directors’ support for the work of DBRAC thus far; endorses the values based framework and directs staff to use the framework in future enrollment balancing decisions; and it directs staff continue to collaborate with DBRAC to apply the values framework to develop enrollment balancing scenarios to present the community for public feedback.
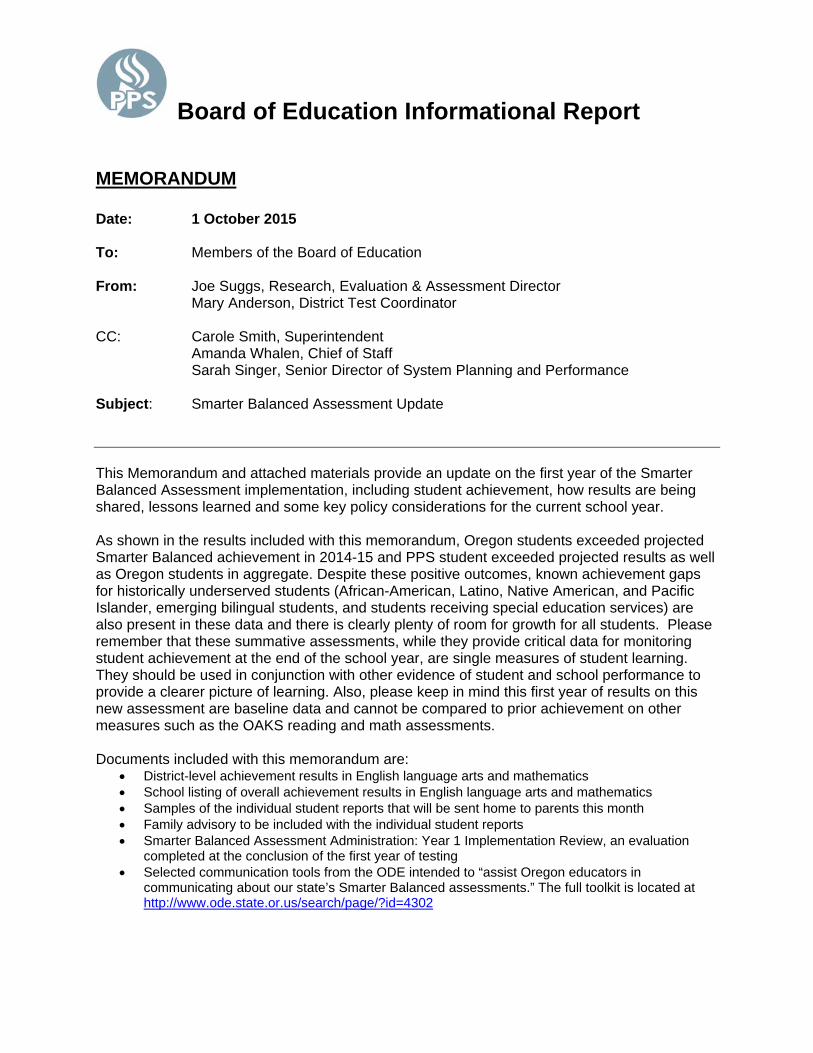
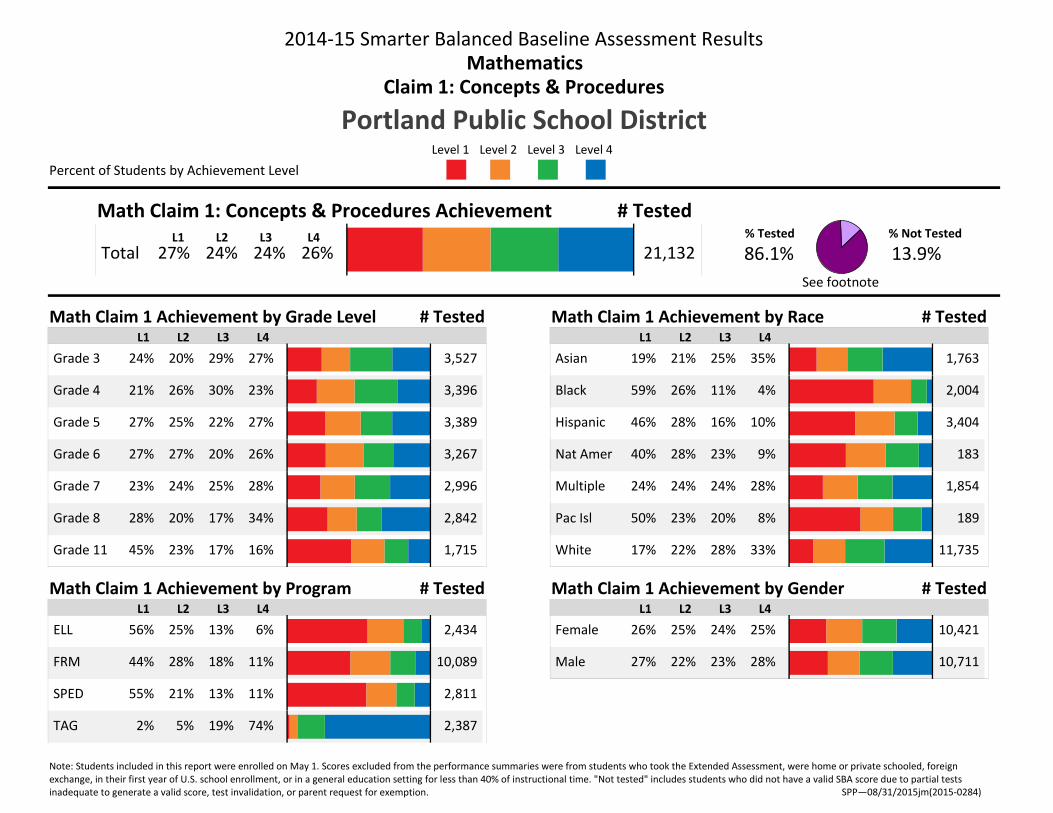
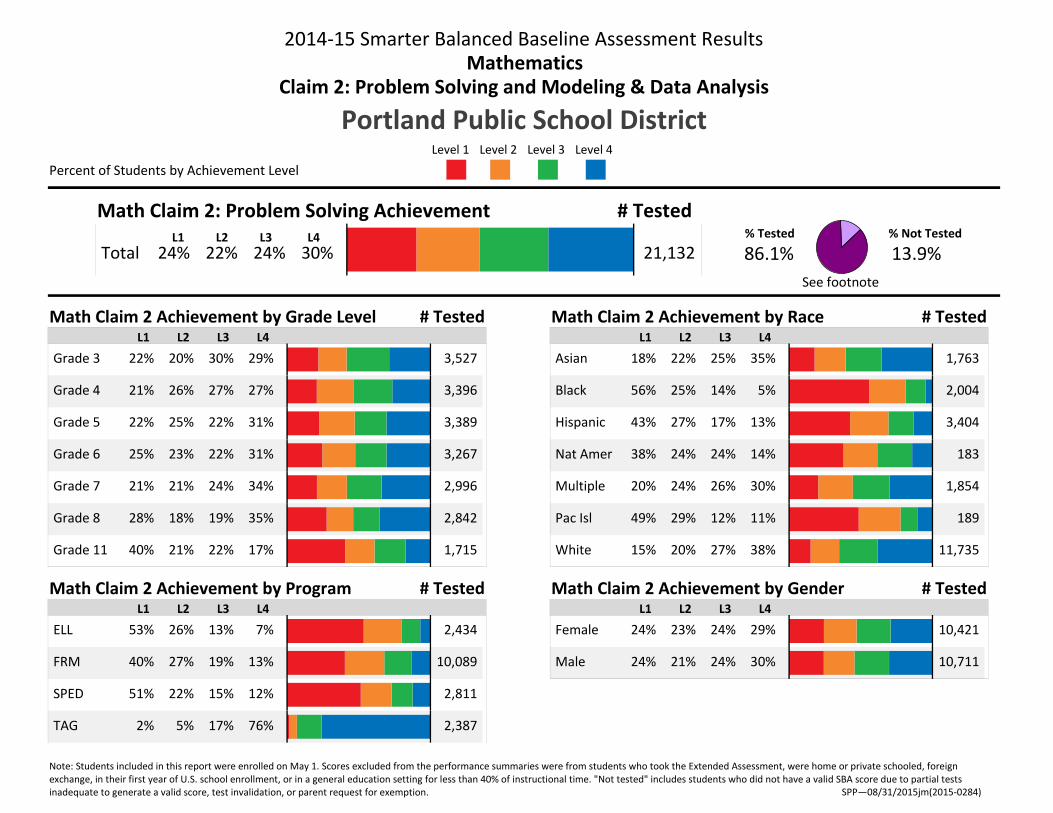
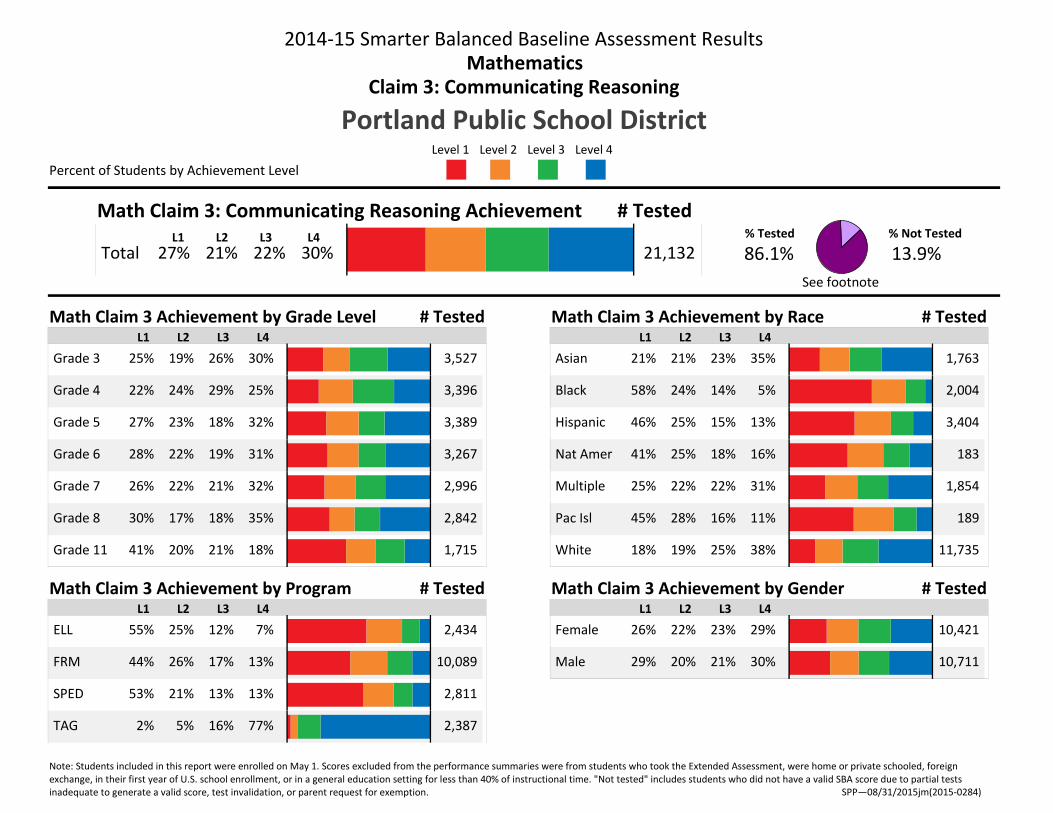
Board of Education Informational Report MEMORANDUM Date: 1 October 2015 To: Members of the Board of Education From: Joe Suggs, Research, Evaluation & Assessment Director Mary Anderson, District Test Coordinator CC: Carole Smith, Superintendent Amanda Whalen, Chief of Staff Sarah Singer, Senior Director of System Planning and Performance Subject: Smarter Balanced Assessment Update This Memorandum and attached materials provide an update on the first year of the Smarter Balanced Assessment implementation, including student achievement, how results are being shared, lessons learned and some key policy considerations for the current school year. As shown in the results included with this memorandum, Oregon students exceeded projected Smarter Balanced achievement in 2014-15 and PPS student exceeded projected results as well as Oregon students in aggregate. Despite these positive outcomes, known achievement gaps for historically underserved students (African-American, Latino, Native American, and Pacific Islander, emerging bilingual students, and students receiving special education services) are also present in these data and there is clearly plenty of room for growth for all students. Please remember that these summative assessments, while they provide critical data for monitoring student achievement at the end of the school year, are single measures of student learning. They should be used in conjunction with other evidence of student and school performance to provide a clearer picture of learning. Also, please keep in mind this first year of results on this new assessment are baseline data and cannot be compared to prior achievement on other measures such as the OAKS reading and math assessments. Documents included with this memorandum are:
District-level achievement results in English language arts and mathematics School listing of overall achievement results in English language arts and mathematics Samples of the individual student reports that will be sent home to parents this month Family advisory to be included with the individual student reports Smarter Balanced Assessment Administration: Year 1 Implementation Review, an evaluation
completed at the conclusion of the first year of testing Selected communication tools from the ODE intended to “assist Oregon educators in
communicating about our state’s Smarter Balanced assessments.” The full toolkit is located at http://www.ode.state.or.us/search/page/?id=4302

2014‐15 Smarter Balanced Baseline Assessment ResultsMathematics
Level 1 Level 2 Level 3 Level 4
Portland Public School District
Percent of Students by Achievement Level
Overall
# Tested
# Tested
# Tested
# Tested # Tested
% Tested
86.1%% Not Tested
13.9%
L1 L2 L3 L4
L1 L2 L3 L4
L1 L2 L3 L4
L1 L2 L3 L4
Math Overall Achievement
Math Overall Achievement by Grade Level
Math Overall Achievement by Program
Math Overall Achievement by Race
Math Overall Achievement by Gender
3,52720% 31% 27%Grade 3 22%
3,39626% 30% 24%Grade 4 20%
3,38925% 22% 29%Grade 5 24%
3,26725% 22% 28%Grade 6 25%
2,99624% 24% 31%Grade 7 21%
2,84219% 18% 35%Grade 8 28%
1,71523% 19% 16%Grade 11 42%
21,13225% 23% 24% 28%TotalL1 L2 L3 L4
1,76322% 26% 35%Asian 17%
2,00426% 12% 4%Black 58%
3,40429% 16% 11%Hispanic 44%
18324% 22% 13%Nat Amer 41%
1,85424% 26% 28%Multiple 22%
18926% 17% 8%Pac Isl 49%
11,73521% 28% 36%White 15%
2,43426% 12% 6%ELL 55%
10,08929% 18% 11%FRM 42%
2,81121% 13% 11%SPED 54%
2,3874% 17% 78%TAG 1%
10,42125% 24% 27%Female 24%
10,71122% 24% 29%Male 25%
See footnote
Note: Students included in this report were enrolled on May 1. Scores excluded from the performance summaries were from students who took the Extended Assessment, were home or private schooled, foreign exchange, in their first year of U.S. school enrollment, or in a general education setting for less than 40% of instructional time. "Not tested" includes students who did not have a valid SBA score due to partial tests inadequate to generate a valid score, test invalidation, or parent request for exemption. SPP—08/31/2015jm(2015‐0284)
2014‐15 Smarter Balanced Baseline Assessment ResultsMathematics
Level 1 Level 2 Level 3 Level 4
Portland Public School District
Percent of Students by Achievement Level
Claim 1: Concepts & Procedures
# Tested
# Tested
# Tested
# Tested # Tested
% Tested
86.1%% Not Tested
13.9%
L1 L2 L3 L4
L1 L2 L3 L4
L1 L2 L3 L4
L1 L2 L3 L4
Math Claim 1: Concepts & Procedures Achievement
Math Claim 1 Achievement by Grade Level
Math Claim 1 Achievement by Program
Math Claim 1 Achievement by Race
Math Claim 1 Achievement by Gender
3,52720% 29% 27%Grade 3 24%
3,39626% 30% 23%Grade 4 21%
3,38925% 22% 27%Grade 5 27%
3,26727% 20% 26%Grade 6 27%
2,99624% 25% 28%Grade 7 23%
2,84220% 17% 34%Grade 8 28%
1,71523% 17% 16%Grade 11 45%
21,13227% 24% 24% 26%TotalL1 L2 L3 L4
1,76321% 25% 35%Asian 19%
2,00426% 11% 4%Black 59%
3,40428% 16% 10%Hispanic 46%
18328% 23% 9%Nat Amer 40%
1,85424% 24% 28%Multiple 24%
18923% 20% 8%Pac Isl 50%
11,73522% 28% 33%White 17%
2,43425% 13% 6%ELL 56%
10,08928% 18% 11%FRM 44%
2,81121% 13% 11%SPED 55%
2,3875% 19% 74%TAG 2%
10,42125% 24% 25%Female 26%
10,71122% 23% 28%Male 27%
See footnote
Note: Students included in this report were enrolled on May 1. Scores excluded from the performance summaries were from students who took the Extended Assessment, were home or private schooled, foreign exchange, in their first year of U.S. school enrollment, or in a general education setting for less than 40% of instructional time. "Not tested" includes students who did not have a valid SBA score due to partial tests inadequate to generate a valid score, test invalidation, or parent request for exemption. SPP—08/31/2015jm(2015‐0284)
2014‐15 Smarter Balanced Baseline Assessment ResultsMathematics
Level 1 Level 2 Level 3 Level 4
Portland Public School District
Percent of Students by Achievement Level
Claim 2: Problem Solving and Modeling & Data Analysis
# Tested
# Tested
# Tested
# Tested # Tested
% Tested
86.1%% Not Tested
13.9%
L1 L2 L3 L4
L1 L2 L3 L4
L1 L2 L3 L4
L1 L2 L3 L4
Math Claim 2: Problem Solving Achievement
Math Claim 2 Achievement by Grade Level
Math Claim 2 Achievement by Program
Math Claim 2 Achievement by Race
Math Claim 2 Achievement by Gender
3,52720% 30% 29%Grade 3 22%
3,39626% 27% 27%Grade 4 21%
3,38925% 22% 31%Grade 5 22%
3,26723% 22% 31%Grade 6 25%
2,99621% 24% 34%Grade 7 21%
2,84218% 19% 35%Grade 8 28%
1,71521% 22% 17%Grade 11 40%
21,13224% 22% 24% 30%TotalL1 L2 L3 L4
1,76322% 25% 35%Asian 18%
2,00425% 14% 5%Black 56%
3,40427% 17% 13%Hispanic 43%
18324% 24% 14%Nat Amer 38%
1,85424% 26% 30%Multiple 20%
18929% 12% 11%Pac Isl 49%
11,73520% 27% 38%White 15%
2,43426% 13% 7%ELL 53%
10,08927% 19% 13%FRM 40%
2,81122% 15% 12%SPED 51%
2,3875% 17% 76%TAG 2%
10,42123% 24% 29%Female 24%
10,71121% 24% 30%Male 24%
See footnote
Note: Students included in this report were enrolled on May 1. Scores excluded from the performance summaries were from students who took the Extended Assessment, were home or private schooled, foreign exchange, in their first year of U.S. school enrollment, or in a general education setting for less than 40% of instructional time. "Not tested" includes students who did not have a valid SBA score due to partial tests inadequate to generate a valid score, test invalidation, or parent request for exemption. SPP—08/31/2015jm(2015‐0284)
2014‐15 Smarter Balanced Baseline Assessment ResultsMathematics
Level 1 Level 2 Level 3 Level 4
Portland Public School District
Percent of Students by Achievement Level
Claim 3: Communicating Reasoning
# Tested
# Tested
# Tested
# Tested # Tested
% Tested
86.1%% Not Tested
13.9%
L1 L2 L3 L4
L1 L2 L3 L4
L1 L2 L3 L4
L1 L2 L3 L4
Math Claim 3: Communicating Reasoning Achievement
Math Claim 3 Achievement by Grade Level
Math Claim 3 Achievement by Program
Math Claim 3 Achievement by Race
Math Claim 3 Achievement by Gender
3,52719% 26% 30%Grade 3 25%
3,39624% 29% 25%Grade 4 22%
3,38923% 18% 32%Grade 5 27%
3,26722% 19% 31%Grade 6 28%
2,99622% 21% 32%Grade 7 26%
2,84217% 18% 35%Grade 8 30%
1,71520% 21% 18%Grade 11 41%
21,13227% 21% 22% 30%TotalL1 L2 L3 L4
1,76321% 23% 35%Asian 21%
2,00424% 14% 5%Black 58%
3,40425% 15% 13%Hispanic 46%
18325% 18% 16%Nat Amer 41%
1,85422% 22% 31%Multiple 25%
18928% 16% 11%Pac Isl 45%
11,73519% 25% 38%White 18%
2,43425% 12% 7%ELL 55%
10,08926% 17% 13%FRM 44%
2,81121% 13% 13%SPED 53%
2,3875% 16% 77%TAG 2%
10,42122% 23% 29%Female 26%
10,71120% 21% 30%Male 29%
See footnote
Note: Students included in this report were enrolled on May 1. Scores excluded from the performance summaries were from students who took the Extended Assessment, were home or private schooled, foreign exchange, in their first year of U.S. school enrollment, or in a general education setting for less than 40% of instructional time. "Not tested" includes students who did not have a valid SBA score due to partial tests inadequate to generate a valid score, test invalidation, or parent request for exemption. SPP—08/31/2015jm(2015‐0284)
2014‐15 Smarter Balanced Baseline Assessment ResultsEnglish Language Arts (ELA)
Level 1 Level 2 Level 3 Level 4
Portland Public School District
Percent of Students by Achievement Level
Overall
# Tested
# Tested
# Tested
# Tested # Tested
% Tested
87.0%% Not Tested
13.0%
L1 L2 L3 L4
L1 L2 L3 L4
L1 L2 L3 L4
L1 L2 L3 L4
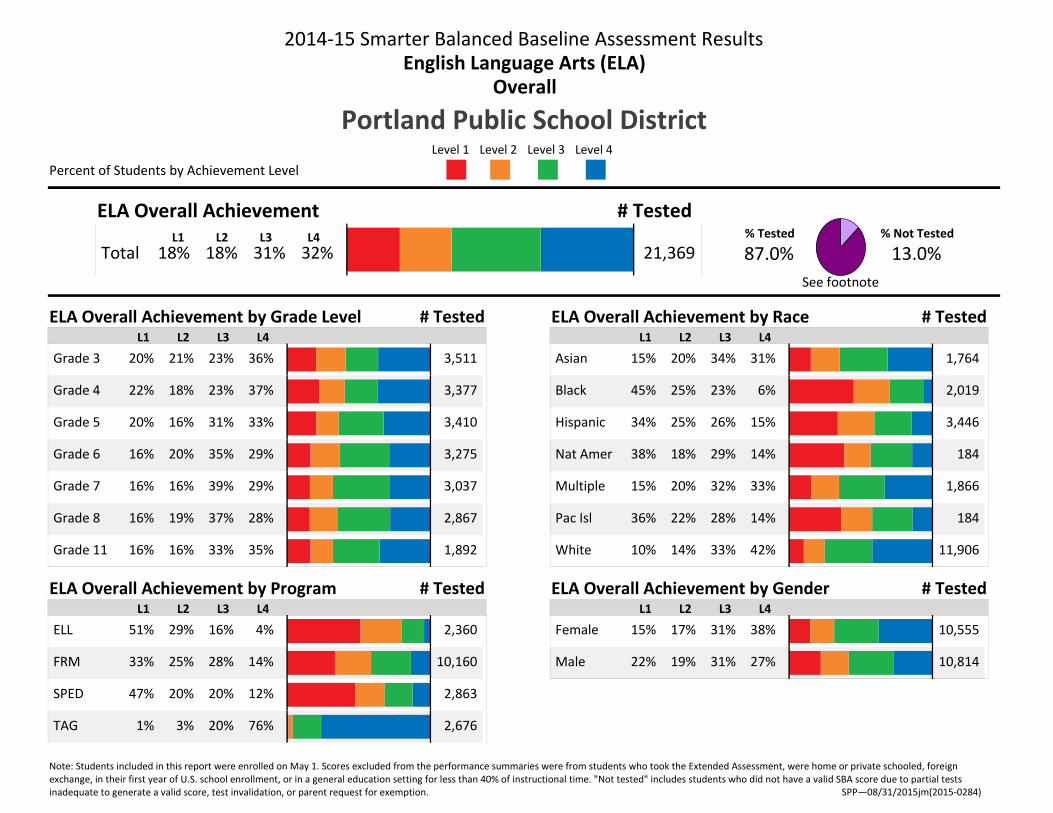
ELA Overall Achievement
ELA Overall Achievement by Grade Level
ELA Overall Achievement by Program
ELA Overall Achievement by Race
ELA Overall Achievement by Gender
3,51121% 23% 36%Grade 3 20%
3,37718% 23% 37%Grade 4 22%
3,41016% 31% 33%Grade 5 20%
3,27520% 35% 29%Grade 6 16%
3,03716% 39% 29%Grade 7 16%
2,86719% 37% 28%Grade 8 16%
1,89216% 33% 35%Grade 11 16%
21,36918% 18% 31% 32%TotalL1 L2 L3 L4
1,76420% 34% 31%Asian 15%
2,01925% 23% 6%Black 45%
3,44625% 26% 15%Hispanic 34%
18418% 29% 14%Nat Amer 38%
1,86620% 32% 33%Multiple 15%
18422% 28% 14%Pac Isl 36%
11,90614% 33% 42%White 10%
2,36029% 16% 4%ELL 51%
10,16025% 28% 14%FRM 33%
2,86320% 20% 12%SPED 47%
2,6763% 20% 76%TAG 1%
10,55517% 31% 38%Female 15%
10,81419% 31% 27%Male 22%
See footnote
Note: Students included in this report were enrolled on May 1. Scores excluded from the performance summaries were from students who took the Extended Assessment, were home or private schooled, foreign exchange, in their first year of U.S. school enrollment, or in a general education setting for less than 40% of instructional time. "Not tested" includes students who did not have a valid SBA score due to partial tests inadequate to generate a valid score, test invalidation, or parent request for exemption. SPP—08/31/2015jm(2015‐0284)

2014‐15 Smarter Balanced Baseline Assessment ResultsEnglish Language Arts (ELA)
Level 1 Level 2 Level 3 Level 4
Portland Public School District
Percent of Students by Achievement Level
Claim 1: Reading
# Tested
# Tested
# Tested
# Tested # Tested
% Tested
87.0%% Not Tested
13.0%
L1 L2 L3 L4
L1 L2 L3 L4
L1 L2 L3 L4
L1 L2 L3 L4
ELA Claim 1: Reading Achievement
ELA Claim 1 Achievement by Grade Level
ELA Claim 1 Achievement by Program
ELA Claim 1 Achievement by Race
ELA Claim 1 Achievement by Gender
3,51119% 21% 38%Grade 3 22%
3,37715% 20% 38%Grade 4 26%
3,41016% 28% 35%Grade 5 22%
3,27519% 30% 28%Grade 6 23%
3,03718% 33% 29%Grade 7 20%
2,86718% 36% 28%Grade 8 18%
1,89219% 29% 35%Grade 11 16%
21,36921% 17% 28% 33%TotalL1 L2 L3 L4
1,76420% 30% 29%Asian 21%
2,01924% 20% 9%Black 47%
3,44623% 23% 16%Hispanic 38%
18424% 18% 22%Nat Amer 36%
1,86618% 30% 33%Multiple 19%
18419% 28% 13%Pac Isl 40%
11,90614% 31% 42%White 13%
2,36024% 14% 6%ELL 56%
10,16022% 25% 16%FRM 37%
2,86320% 17% 15%SPED 47%
2,6764% 22% 72%TAG 2%
10,55516% 29% 37%Female 18%
10,81419% 27% 29%Male 25%
See footnote
Note: Students included in this report were enrolled on May 1. Scores excluded from the performance summaries were from students who took the Extended Assessment, were home or private schooled, foreign exchange, in their first year of U.S. school enrollment, or in a general education setting for less than 40% of instructional time. "Not tested" includes students who did not have a valid SBA score due to partial tests inadequate to generate a valid score, test invalidation, or parent request for exemption. SPP—08/31/2015jm(2015‐0284)
2014‐15 Smarter Balanced Baseline Assessment ResultsEnglish Language Arts (ELA)
Level 1 Level 2 Level 3 Level 4
Portland Public School District
Percent of Students by Achievement Level
Claim 2: Writing
# Tested
# Tested
# Tested
# Tested # Tested
% Tested
87.0%% Not Tested
13.0%
L1 L2 L3 L4
L1 L2 L3 L4
L1 L2 L3 L4
L1 L2 L3 L4
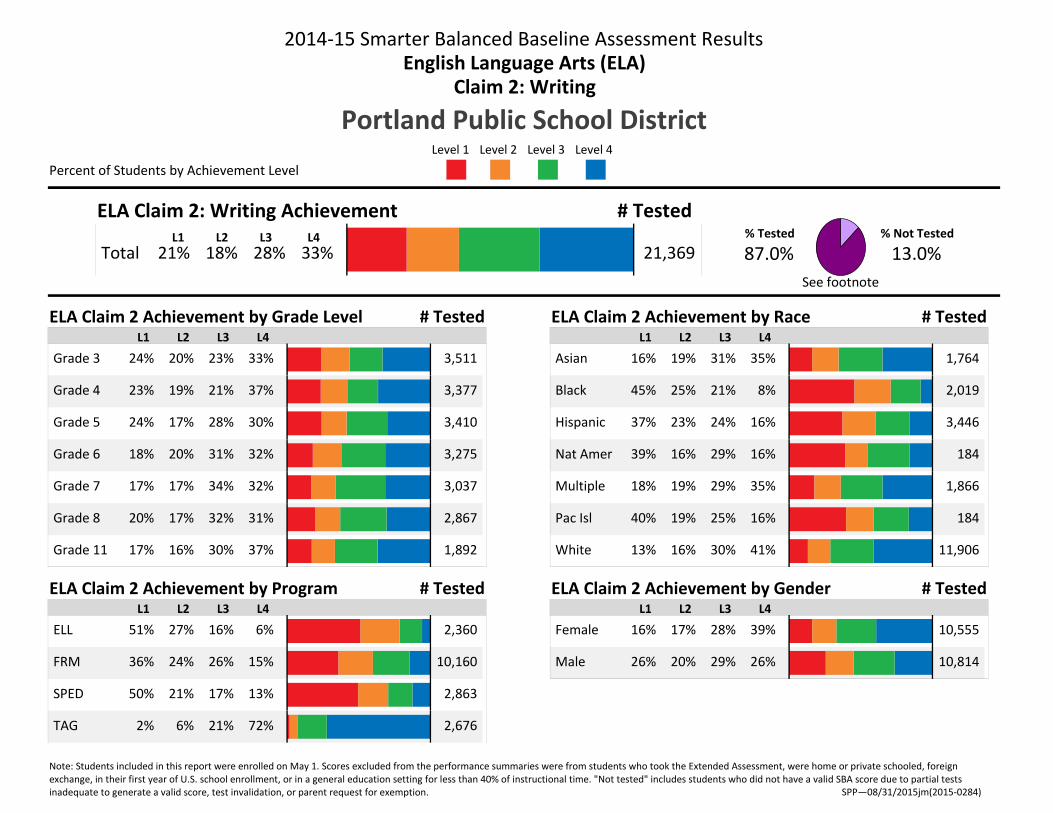
ELA Claim 2: Writing Achievement
ELA Claim 2 Achievement by Grade Level
ELA Claim 2 Achievement by Program
ELA Claim 2 Achievement by Race
ELA Claim 2 Achievement by Gender
3,51120% 23% 33%Grade 3 24%
3,37719% 21% 37%Grade 4 23%
3,41017% 28% 30%Grade 5 24%
3,27520% 31% 32%Grade 6 18%
3,03717% 34% 32%Grade 7 17%
2,86717% 32% 31%Grade 8 20%
1,89216% 30% 37%Grade 11 17%
21,36921% 18% 28% 33%TotalL1 L2 L3 L4
1,76419% 31% 35%Asian 16%
2,01925% 21% 8%Black 45%
3,44623% 24% 16%Hispanic 37%
18416% 29% 16%Nat Amer 39%
1,86619% 29% 35%Multiple 18%
18419% 25% 16%Pac Isl 40%
11,90616% 30% 41%White 13%
2,36027% 16% 6%ELL 51%
10,16024% 26% 15%FRM 36%
2,86321% 17% 13%SPED 50%
2,6766% 21% 72%TAG 2%
10,55517% 28% 39%Female 16%
10,81420% 29% 26%Male 26%
See footnote
Note: Students included in this report were enrolled on May 1. Scores excluded from the performance summaries were from students who took the Extended Assessment, were home or private schooled, foreign exchange, in their first year of U.S. school enrollment, or in a general education setting for less than 40% of instructional time. "Not tested" includes students who did not have a valid SBA score due to partial tests inadequate to generate a valid score, test invalidation, or parent request for exemption. SPP—08/31/2015jm(2015‐0284)
2014‐15 Smarter Balanced Baseline Assessment ResultsEnglish Language Arts (ELA)
Level 1 Level 2 Level 3 Level 4
Portland Public School District
Percent of Students by Achievement Level
Claim 3: Listening
# Tested
# Tested
# Tested
# Tested # Tested
% Tested
87.0%% Not Tested
13.0%
L1 L2 L3 L4
L1 L2 L3 L4
L1 L2 L3 L4
L1 L2 L3 L4
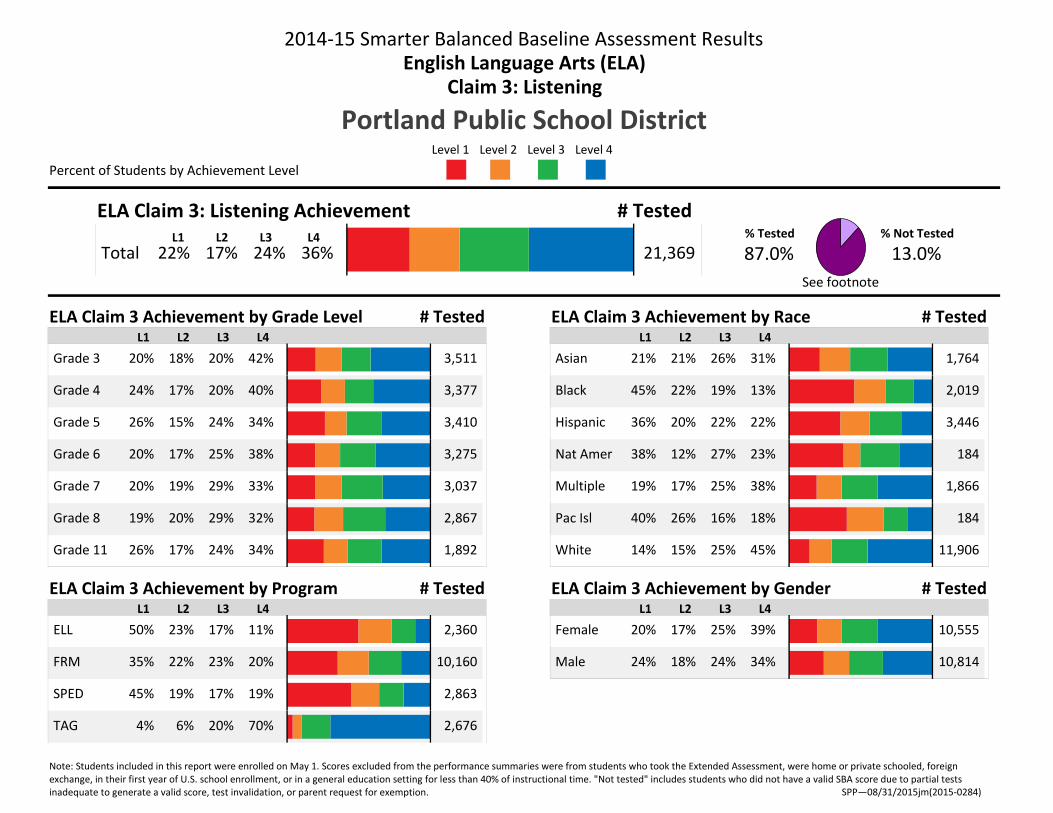
ELA Claim 3: Listening Achievement
ELA Claim 3 Achievement by Grade Level
ELA Claim 3 Achievement by Program
ELA Claim 3 Achievement by Race
ELA Claim 3 Achievement by Gender
3,51118% 20% 42%Grade 3 20%
3,37717% 20% 40%Grade 4 24%
3,41015% 24% 34%Grade 5 26%
3,27517% 25% 38%Grade 6 20%
3,03719% 29% 33%Grade 7 20%
2,86720% 29% 32%Grade 8 19%
1,89217% 24% 34%Grade 11 26%
21,36922% 17% 24% 36%TotalL1 L2 L3 L4
1,76421% 26% 31%Asian 21%
2,01922% 19% 13%Black 45%
3,44620% 22% 22%Hispanic 36%
18412% 27% 23%Nat Amer 38%
1,86617% 25% 38%Multiple 19%
18426% 16% 18%Pac Isl 40%
11,90615% 25% 45%White 14%
2,36023% 17% 11%ELL 50%
10,16022% 23% 20%FRM 35%
2,86319% 17% 19%SPED 45%
2,6766% 20% 70%TAG 4%
10,55517% 25% 39%Female 20%
10,81418% 24% 34%Male 24%
See footnote
Note: Students included in this report were enrolled on May 1. Scores excluded from the performance summaries were from students who took the Extended Assessment, were home or private schooled, foreign exchange, in their first year of U.S. school enrollment, or in a general education setting for less than 40% of instructional time. "Not tested" includes students who did not have a valid SBA score due to partial tests inadequate to generate a valid score, test invalidation, or parent request for exemption. SPP—08/31/2015jm(2015‐0284)
2014‐15 Smarter Balanced Baseline Assessment ResultsEnglish Language Arts (ELA)
Level 1 Level 2 Level 3 Level 4
Portland Public School District
Percent of Students by Achievement Level
Claim 4: Research
# Tested
# Tested
# Tested
# Tested # Tested
% Tested
87.0%% Not Tested
13.0%
L1 L2 L3 L4
L1 L2 L3 L4
L1 L2 L3 L4
L1 L2 L3 L4
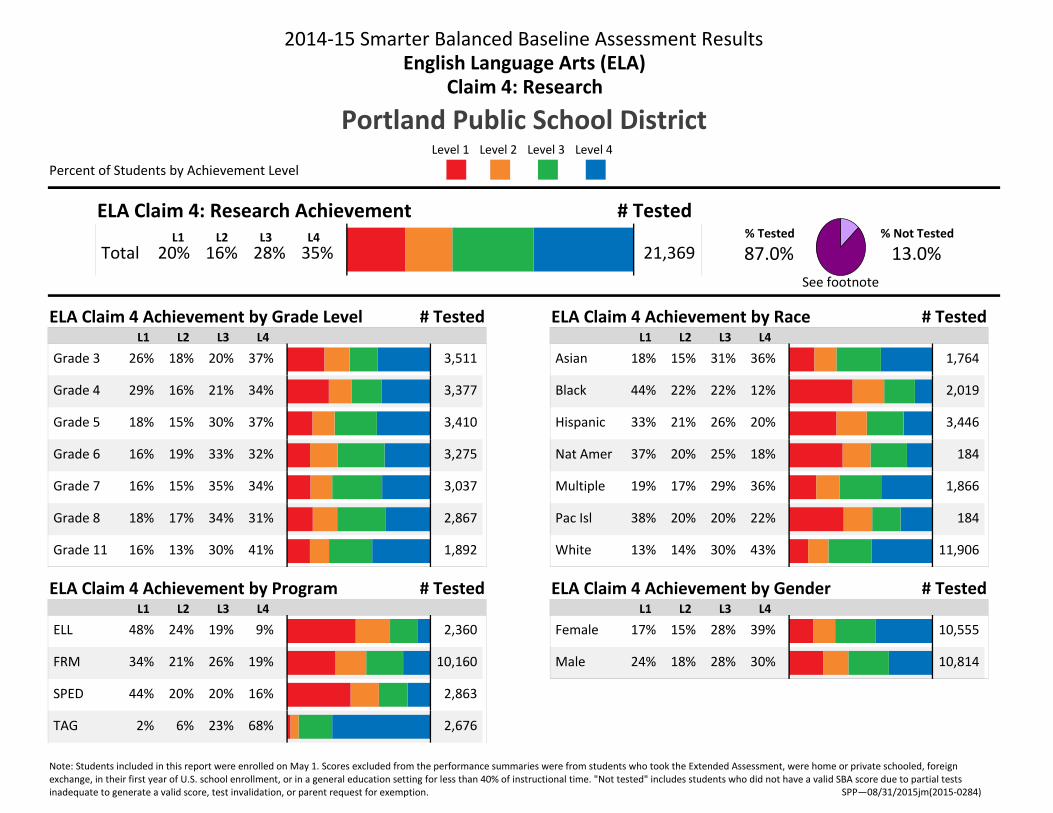
ELA Claim 4: Research Achievement
ELA Claim 4 Achievement by Grade Level
ELA Claim 4 Achievement by Program
ELA Claim 4 Achievement by Race
ELA Claim 4 Achievement by Gender
3,51118% 20% 37%Grade 3 26%
3,37716% 21% 34%Grade 4 29%
3,41015% 30% 37%Grade 5 18%
3,27519% 33% 32%Grade 6 16%
3,03715% 35% 34%Grade 7 16%
2,86717% 34% 31%Grade 8 18%
1,89213% 30% 41%Grade 11 16%
21,36920% 16% 28% 35%TotalL1 L2 L3 L4
1,76415% 31% 36%Asian 18%
2,01922% 22% 12%Black 44%
3,44621% 26% 20%Hispanic 33%
18420% 25% 18%Nat Amer 37%
1,86617% 29% 36%Multiple 19%
18420% 20% 22%Pac Isl 38%
11,90614% 30% 43%White 13%
2,36024% 19% 9%ELL 48%
10,16021% 26% 19%FRM 34%
2,86320% 20% 16%SPED 44%
2,6766% 23% 68%TAG 2%
10,55515% 28% 39%Female 17%
10,81418% 28% 30%Male 24%
See footnote
Note: Students included in this report were enrolled on May 1. Scores excluded from the performance summaries were from students who took the Extended Assessment, were home or private schooled, foreign exchange, in their first year of U.S. school enrollment, or in a general education setting for less than 40% of instructional time. "Not tested" includes students who did not have a valid SBA score due to partial tests inadequate to generate a valid score, test invalidation, or parent request for exemption. SPP—08/31/2015jm(2015‐0284)
Dear Parents/Guardians,
This report contains information and results for state assessments that your child participated in during the 2014‐15 school year. The grade level and school shown to the left are your child's current enrollment.
Following are brief descriptions of each assessment included in this report. Not every student takes all assessments shown in this report. If your child did not take a particular assessment, that is indicated in the appropriate section.
Grade SSID
School
District
2014‐15 INDIVIDUAL STUDENT TEST RESULTS
6
Portland SD 1J
Smarter Balanced English Language Arts and Mathematics Assessments
2014‐15 was the first year Oregon used a new test aligned to the Common Core State Standards. The new test, Smarter Balanced, provides information about your student's progress toward college and career readiness. Smarter Balanced scores use a new scale broken down in to Levels 1‐4. For some students, their scores may appear lower than they were on state assessments in the past. A drop in scores does not mean a student is doing worse in school. We have simply raised expectations for academic performance. For more information about the scores, please see the enclosed Family Advisory. For more information about this new assessment visit http://www.ode.state.or.us/search/page/?id=3298 and http://www.smarterbalanced.org/parents‐students/
Oregon Assessment of Knowledge and Skills (OAKS) Science Test
The content of the OAKS Science test reflects the skill expectations outlined in the Oregon Science Content Standards. The OAKS Science test is administered to students in grades 5, 8, and 11. Only students at those grade levels last year will have an OAKS Science score in this report. If a student took this test more than once the highest score is displayed in this report. For more information about OAKS Science visit http://www.ode.state.or.us/search/page/?id=1577
Extended Assessment in English Language Arts, Mathematics, and Science
Oregon's Extended Assessments are alternate assessments designed specifically for students with special needs. The decision to administer Oregon's Extended Assessment can only be made by the student's Individualized Education Plan (IEP) team. The Extended Assessments are based on alternate achievement standards with content that is reduced in depth, breadth, and complexity. In spite of the similarity in performance categories, test results from these assessments are not comparable to results achieved on the state's general assessment. For more information visit http://www.ode.state.or.us/search/results/?id=178
Student Name
SSID
Student Name
Mailing Address
City, State, Zip
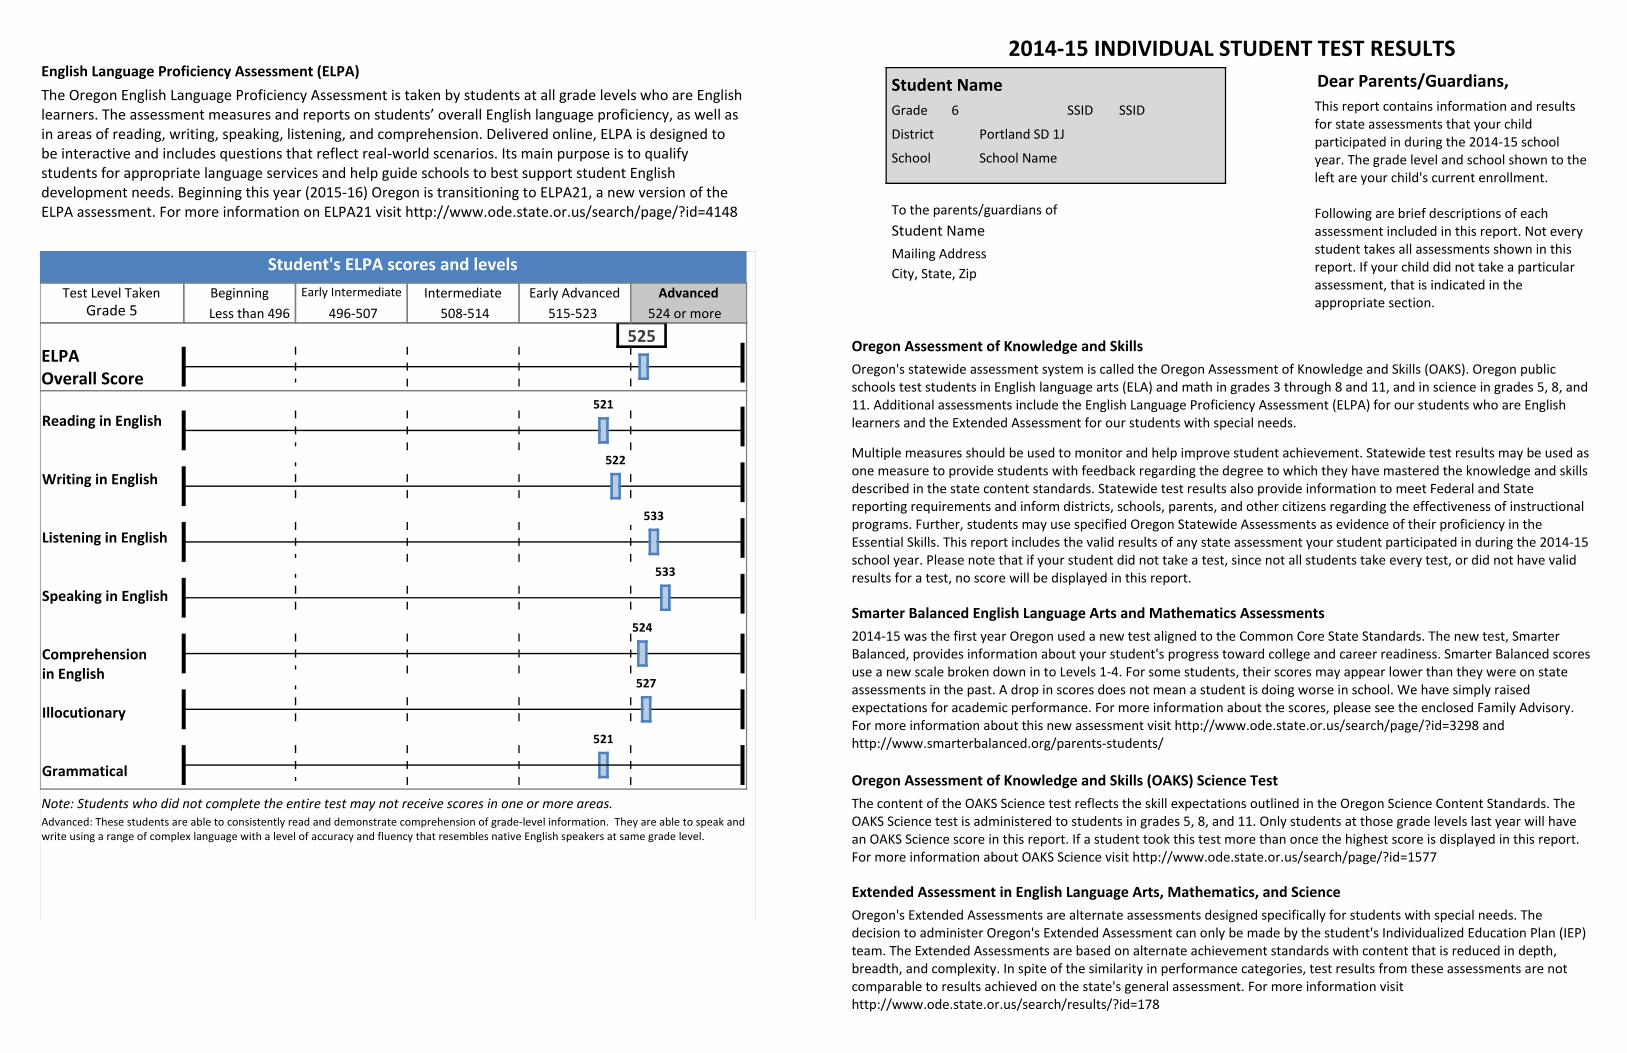
English Language Proficiency Assessment (ELPA)
The Oregon English Language Proficiency Assessment is taken by students at all grade levels who are English learners. The assessment measures and reports on students’ overall English language proficiency, as well as in areas of reading, writing, speaking, listening, and comprehension. Delivered online, ELPA is designed to be interactive and includes questions that reflect real‐world scenarios. Its main purpose is to qualify students for appropriate language services and help guide schools to best support student English development needs. Beginning this year (2015‐16) Oregon is transitioning to ELPA21, a new version of the ELPA assessment. For more information on ELPA21 visit http://www.ode.state.or.us/search/page/?id=4148
Oregon Assessment of Knowledge and Skills
Oregon's statewide assessment system is called the Oregon Assessment of Knowledge and Skills (OAKS). Oregon public schools test students in English language arts (ELA) and math in grades 3 through 8 and 11, and in science in grades 5, 8, and 11. Additional assessments include the English Language Proficiency Assessment (ELPA) for our students who are English learners and the Extended Assessment for our students with special needs.
Multiple measures should be used to monitor and help improve student achievement. Statewide test results may be used as one measure to provide students with feedback regarding the degree to which they have mastered the knowledge and skills described in the state content standards. Statewide test results also provide information to meet Federal and State reporting requirements and inform districts, schools, parents, and other citizens regarding the effectiveness of instructional programs. Further, students may use specified Oregon Statewide Assessments as evidence of their proficiency in the Essential Skills. This report includes the valid results of any state assessment your student participated in during the 2014‐15 school year. Please note that if your student did not take a test, since not all students take every test, or did not have valid results for a test, no score will be displayed in this report.
To the parents/guardians of
School Name
521
524
527
Text176 Student's ELPA scores and levels
521
Advanced: These students are able to consistently read and demonstrate comprehension of grade‐level information. They are able to speak and write using a range of complex language with a level of accuracy and fluency that resembles native English speakers at same grade level.
525
Test Level Taken Beginning Early Intermediate Intermediate Early Advanced
Reading in English
Writing in English
Listening in English
Speaking in English
Comprehensionin English
Illocutionary
Grammatical
Less than 496 496‐507 508‐514 515‐523
522
533
Grade 5
ELPAOverall Score
533
Note: Students who did not complete the entire test may not receive scores in one or more areas.
Advanced
524 or more
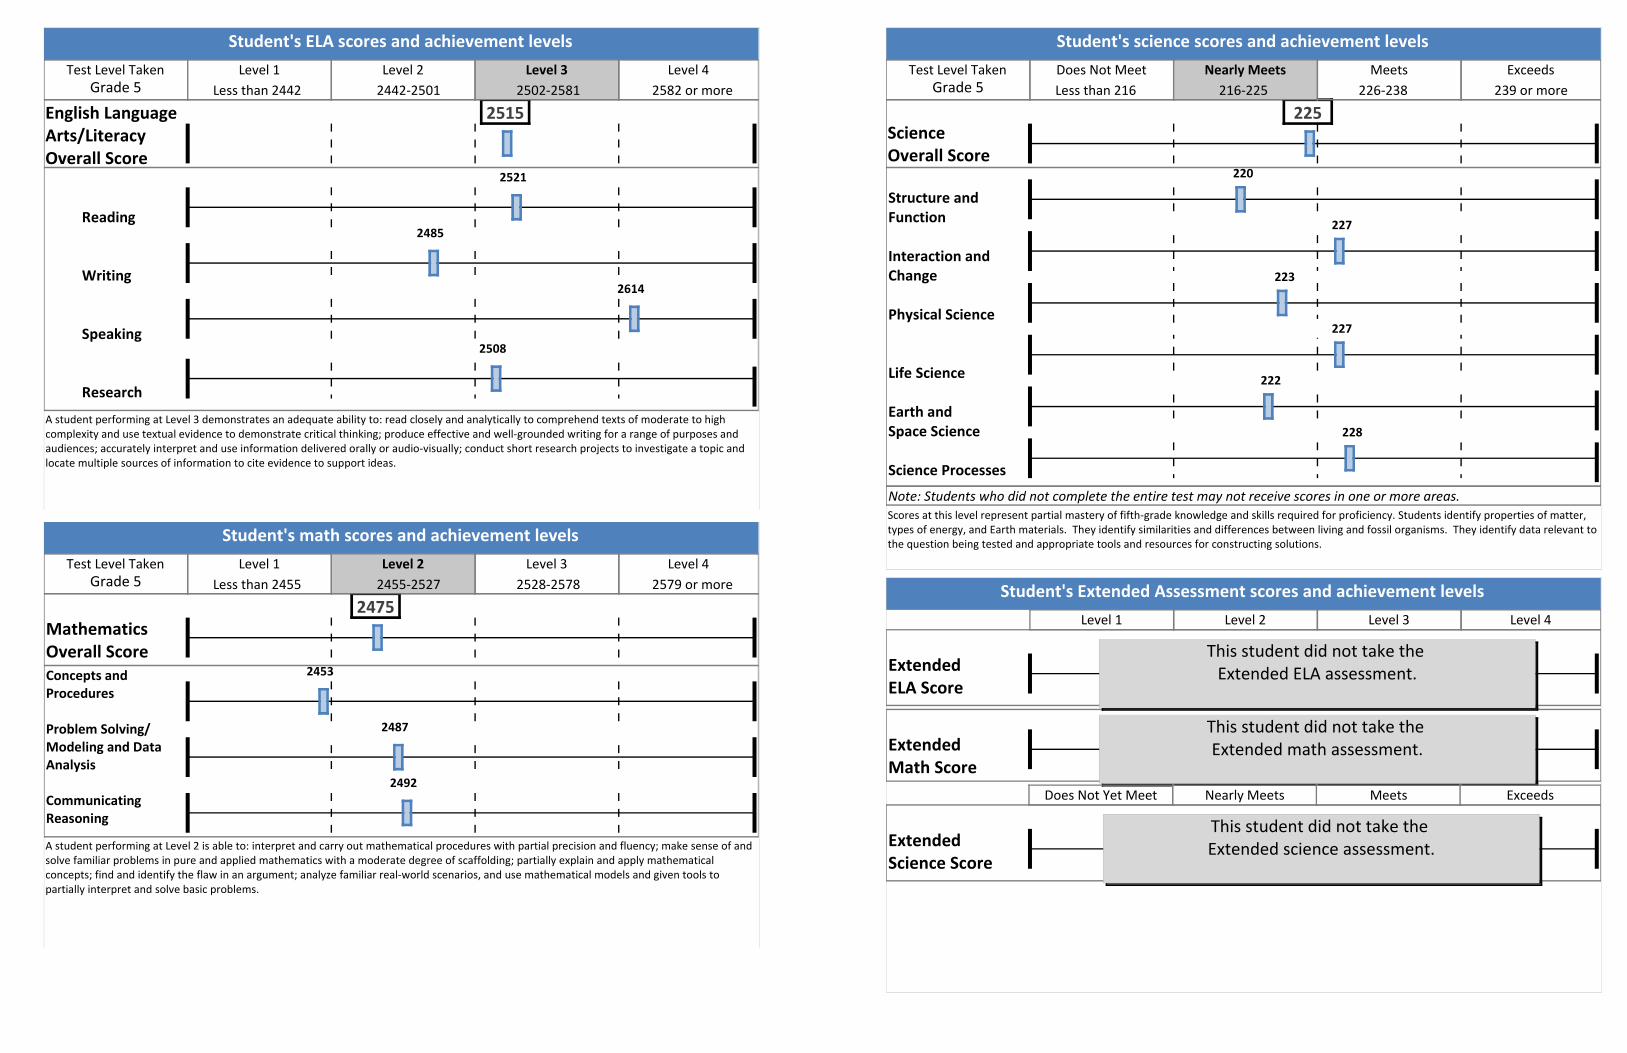
Text176 Student's ELA scores and achievement levels
2521
A student performing at Level 3 demonstrates an adequate ability to: read closely and analytically to comprehend texts of moderate to high complexity and use textual evidence to demonstrate critical thinking; produce effective and well‐grounded writing for a range of purposes and audiences; accurately interpret and use information delivered orally or audio‐visually; conduct short research projects to investigate a topic and locate multiple sources of information to cite evidence to support ideas.
2515
Test Level Taken Level 1 Level 2 Level 3 Level 4
Reading
Writing
Speaking
Research
Less than 2442 2442‐2501 2502‐2581 2582 or more
2485
2614
Grade 5
English Language Arts/LiteracyOverall Score
2508
Text176 Student's math scores and achievement levels
2453
MathematicsOverall Score
A student performing at Level 2 is able to: interpret and carry out mathematical procedures with partial precision and fluency; make sense of and solve familiar problems in pure and applied mathematics with a moderate degree of scaffolding; partially explain and apply mathematical concepts; find and identify the flaw in an argument; analyze familiar real‐world scenarios, and use mathematical models and given tools to partially interpret and solve basic problems.
2475
Test Level Taken Level 1 Level 2 Level 3 Level 4
Concepts and Procedures
Problem Solving/Modeling and Data Analysis
Communicating Reasoning
Less than 2455 2455‐2527 2528‐2578 2579 or more
2487
2492
Grade 5
222
228
Text176 Student's science scores and achievement levels
220
Scores at this level represent partial mastery of fifth‐grade knowledge and skills required for proficiency. Students identify properties of matter, types of energy, and Earth materials. They identify similarities and differences between living and fossil organisms. They identify data relevant to the question being tested and appropriate tools and resources for constructing solutions.
225
Test Level Taken Does Not Meet Nearly Meets Meets Exceeds
Structure and Function
Interaction andChange
Physical Science
Life Science
Earth andSpace Science
Science Processes
Less than 216 216‐225 226‐238 239 or more
227
223
Grade 5
ScienceOverall Score
227
Note: Students who did not complete the entire test may not receive scores in one or more areas.
Text176 Student's Extended Assessment scores and achievement levels
ExtendedMath Score
Level 1 Level 2 Level 3 Level 4
This student did not take the Extended math assessment.
ExtendedELA Score
ExtendedScience Score
This student did not take the Extended ELA assessment.
This student did not take the Extended science assessment.
Does Not Yet Meet Nearly Meets Meets Exceeds
Dear Parents/Guardians,
This report contains information and results for state assessments that your child participated in during the 2014‐15 school year. The grade level and school shown to the left are your child's current enrollment.
Following are brief descriptions of each assessment included in this report. Not every student takes all assessments shown in this report. If your child did not take a particular assessment, that is indicated in the appropriate section.
Grade SSID
School
District
2014‐15 INDIVIDUAL STUDENT TEST RESULTS
7
Portland SD 1J
Smarter Balanced English Language Arts and Mathematics Assessments
2014‐15 was the first year Oregon used a new test aligned to the Common Core State Standards. The new test, Smarter Balanced, provides information about your student's progress toward college and career readiness. Smarter Balanced scores use a new scale broken down in to Levels 1‐4. For some students, their scores may appear lower than they were on state assessments in the past. A drop in scores does not mean a student is doing worse in school. We have simply raised expectations for academic performance. For more information about the scores, please see the enclosed Family Advisory. For more information about this new assessment visit http://www.ode.state.or.us/search/page/?id=3298 and http://www.smarterbalanced.org/parents‐students/
Oregon Assessment of Knowledge and Skills (OAKS) Science Test
The content of the OAKS Science test reflects the skill expectations outlined in the Oregon Science Content Standards. The OAKS Science test is administered to students in grades 5, 8, and 11. Only students at those grade levels last year will have an OAKS Science score in this report. If a student took this test more than once the highest score is displayed in this report. For more information about OAKS Science visit http://www.ode.state.or.us/search/page/?id=1577
Extended Assessment in English Language Arts, Mathematics, and Science
Oregon's Extended Assessments are alternate assessments designed specifically for students with special needs. The decision to administer Oregon's Extended Assessment can only be made by the student's Individualized Education Plan (IEP) team. The Extended Assessments are based on alternate achievement standards with content that is reduced in depth, breadth, and complexity. In spite of the similarity in performance categories, test results from these assessments are not comparable to results achieved on the state's general assessment. For more information visit http://www.ode.state.or.us/search/results/?id=178
Student Name
SSID
Student Name
Mailing Address
City, State, Zip
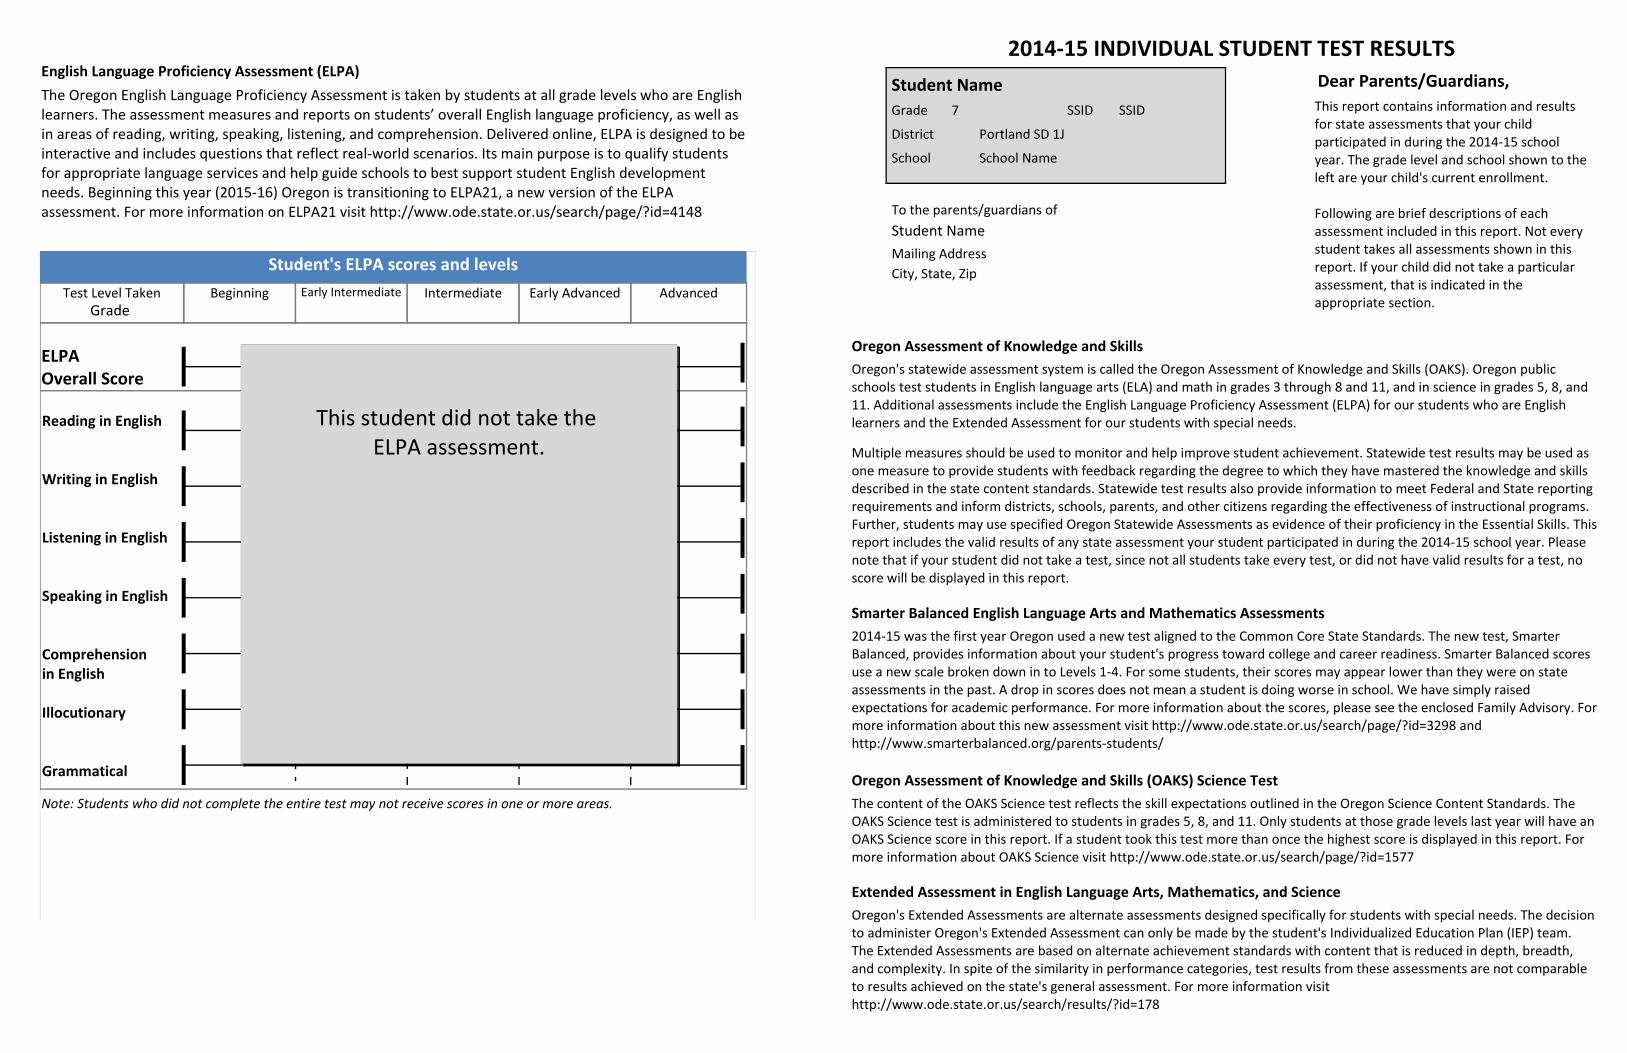
English Language Proficiency Assessment (ELPA)
The Oregon English Language Proficiency Assessment is taken by students at all grade levels who are English learners. The assessment measures and reports on students’ overall English language proficiency, as well as in areas of reading, writing, speaking, listening, and comprehension. Delivered online, ELPA is designed to be interactive and includes questions that reflect real‐world scenarios. Its main purpose is to qualify students for appropriate language services and help guide schools to best support student English development needs. Beginning this year (2015‐16) Oregon is transitioning to ELPA21, a new version of the ELPA assessment. For more information on ELPA21 visit http://www.ode.state.or.us/search/page/?id=4148
Oregon Assessment of Knowledge and Skills
Oregon's statewide assessment system is called the Oregon Assessment of Knowledge and Skills (OAKS). Oregon public schools test students in English language arts (ELA) and math in grades 3 through 8 and 11, and in science in grades 5, 8, and 11. Additional assessments include the English Language Proficiency Assessment (ELPA) for our students who are English learners and the Extended Assessment for our students with special needs.
Multiple measures should be used to monitor and help improve student achievement. Statewide test results may be used as one measure to provide students with feedback regarding the degree to which they have mastered the knowledge and skills described in the state content standards. Statewide test results also provide information to meet Federal and State reporting requirements and inform districts, schools, parents, and other citizens regarding the effectiveness of instructional programs. Further, students may use specified Oregon Statewide Assessments as evidence of their proficiency in the Essential Skills. This report includes the valid results of any state assessment your student participated in during the 2014‐15 school year. Please note that if your student did not take a test, since not all students take every test, or did not have valid results for a test, no score will be displayed in this report.
To the parents/guardians of
School Name
Text176 Student's ELPA scores and levels
Test Level Taken Beginning Early Intermediate Intermediate Early Advanced
Reading in English
Writing in English
Listening in English
Speaking in English
Comprehensionin English
Illocutionary
Grammatical
Grade
ELPAOverall Score
This student did not take the ELPA assessment.
Note: Students who did not complete the entire test may not receive scores in one or more areas.
Advanced
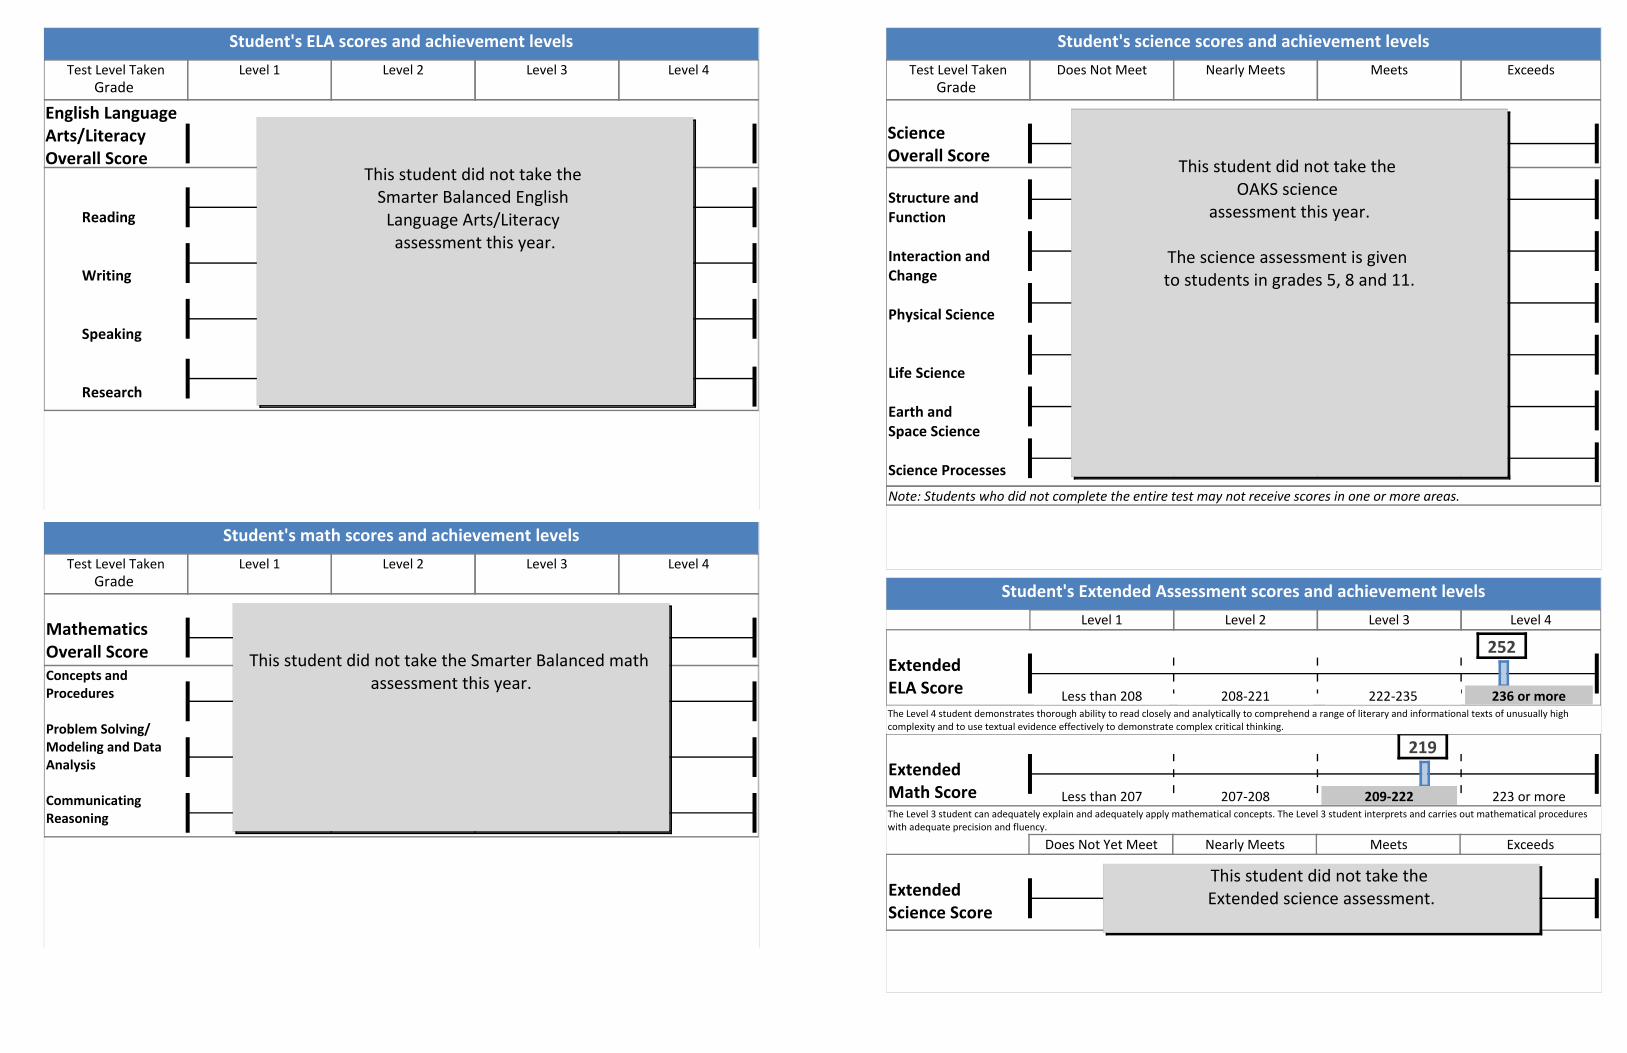
Text176 Student's ELA scores and achievement levels
Test Level Taken Level 1 Level 2 Level 3 Level 4
Reading
Writing
Speaking
Research
Grade
English Language Arts/LiteracyOverall Score
This student did not take the Smarter Balanced English Language Arts/Literacy assessment this year.
Text176 Student's math scores and achievement levels
MathematicsOverall Score
Test Level Taken Level 1 Level 2 Level 3 Level 4
Concepts and Procedures
Problem Solving/Modeling and Data Analysis
Communicating Reasoning
This student did not take the Smarter Balanced math assessment this year.
Grade
Text176 Student's science scores and achievement levels
Test Level Taken Does Not Meet Nearly Meets Meets Exceeds
Structure and Function
Interaction andChange
Physical Science
Life Science
Earth andSpace Science
Science Processes
Grade
ScienceOverall Score
This student did not take the OAKS science
assessment this year.
The science assessment is given to students in grades 5, 8 and 11.
Note: Students who did not complete the entire test may not receive scores in one or more areas.
Text176 Student's Extended Assessment scores and achievement levels
ExtendedMath ScoreThe Level 3 student can adequately explain and adequately apply mathematical concepts. The Level 3 student interprets and carries out mathematical procedures with adequate precision and fluency.
219
Level 1 Level 2 Level 3 Level 4
Less than 207 207‐208 209‐222 223 or more
ExtendedELA Score
252
Less than 208 208‐221 222‐235 236 or moreThe Level 4 student demonstrates thorough ability to read closely and analytically to comprehend a range of literary and informational texts of unusually high complexity and to use textual evidence effectively to demonstrate complex critical thinking.
ExtendedScience Score
This student did not take the Extended science assessment.
Does Not Yet Meet Nearly Meets Meets Exceeds
PORTLAND PUBLIC SCHOOLS
Smarter Balanced Assessments: Test results and what they meanLast spring, students across Oregon in grades 3 through 8 and 11 took a new state test called Smarter Balanced, which replaced the old Oregon Assessment of Knowledge and Skills (OAKS) tests in English language arts and math. Test results for each student will be mailed to their homes in October.
What are the Smarter Balanced Assessments?
The purpose of the tests is to measure how well students are mastering the new Common Core State Standards in math and language arts, which the state adopted in 2010 to better prepare students for college and career. The new tests are longer and more rigorous with both multiple choice and open-ended questions to which students apply critical thinking skills.
How did students in Oregon and in Portland Public Schools do overall on the tests?
Overall, Oregon students exceeded expectations on the test. Students in Portland Public Schools, in turn, outperformed the state. However, historic educational opportunity gaps between white students and students of color, as well as students who are learning English or receive Special Education services, persisted in the test results.
How are the tests scored?
Each student gets an overall score in math and in English language arts that falls into one of four levels (1-4). A Level 3 is “at the standard” and a Level 4 is “above the standard” for college and career readiness. Each score is then broken down into subcategories called “claims,” such as reading and writing (in language arts) and problem solving (in math), that are also placed in one of four levels. In this way, one can see how well a student did overall and also get a sense of a student’s strengths and weaknesses within the larger subject area.
What if a student does poorly on the tests?
The tests are not used to hold students back or “fail” them. The test results are one tool to help teachers and schools understand how well students are learning. In the 11th grade, students may use the tests to demonstrate that they have mastered Essential Skills in reading, math and writing that are required for graduation.
How do students who took Smarter Balanced in 11th grade know if they scored well enough to meet graduation requirements?
• Math: To meet the Essential Skills in math, students must earn a score at or above 2543 in Level 2 on the math test.
• Reading: To meet the Essential Skills in reading, students must earn a score at or above 2515 in Level 2 on the reading segment of the English language arts test.
• Writing: To meet the Essential Skills in writing, students must earn a score at or above 2583 in Level 3 in the writing segment of the English language arts test.
What if a student scores below the minimum required to pass Essential Skills?
Students must then use alternate methods to meet graduation requirements. Methods include submitting work samples to demonstrate their knowledge or earning a passing score on other tests, such as the ACT or SAT college entrance exams.
Family Advisory • Fall 2015
Portland Public Schools is an affirmative action and equal opportunity employer. 1
Why are some of the scores for passing Essential Skills lower than a Level 3, which is considered at the standard for college and career readiness?
The state set the passing scores for Essential Skills at a level equivalent to those set under the old Oregon Assessment of Knowledge and Skills (OAKS). This was done so that graduation requirements would not be raised in the first year of a new test with current high school students.
Can Smarter Balanced scores be used for college placement?
Yes. Oregon community colleges and universities can waive placement testing for entering students who score a 3 or higher on Smarter Balanced and meet the college’s standards for continued academic rigor in 12th grade.
How do overall student scores affect their school?
During this first year of the new test, state lawmakers mandated that schools will not be given a rating based on their test results. In future years, schools will be rated based on test results.
Are students required to take the tests?
The state currently requires students to take the tests unless a parent or guardian exempts the student due to a disability or religious reason. Starting Jan. 1, a new state law will allow parents/guardians to opt their student out of the Smarter Balanced tests without a reason. To exempt a student, the parent or guardian fills out a form in the student’s school office.
How many students participated in the tests?
Overall in 2014-15, 91 percent of PPS students in grades 3-8 and 11 took the tests. Broken down by grade level, between 3 and 9 percent of 3rd through 8th graders opted out of the tests and 19 percent of 11th graders did. The state requires 95 percent of students in each school and school district to take the tests to insure that students’ learning progress is measured. Oregon officials have informed school districts that federal education funding could be withheld if participation rates fall below 95 percent.
Who can I talk to if I have questions about my student’s performance?
Talk with your principal, teacher(s) or guidance counselor. Parent/teacher conferences Oct. 21-23 are good time for these discussions. If you have technical questions about the tests, please contact PPS Research & Evaluation at [email protected] or 503-916-3341.
Additional resources
Resources in English and Spanish. Search “Smarter Balanced.”
Oregon Department of Education: http://www.ode.state.or.us
National PTA: http://www.pta.org
Portland Public Schools is an affirmative action and equal opportunity employer. 2
Page 1
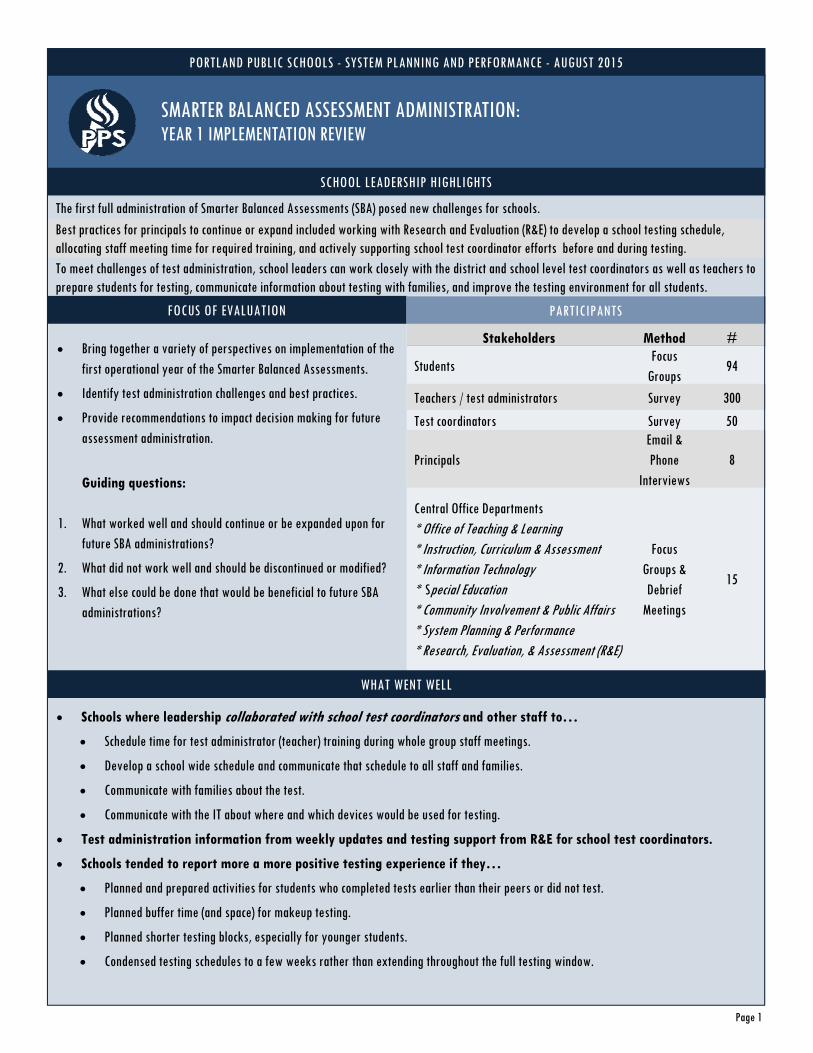
PORTLAND PUBLIC SCHOOLS - SYSTEM PLANNING AND PERFORMANCE - AUGUST 2015
SMARTER BALANCED ASSESSMENT ADMINISTRATION: YEAR 1 IMPLEMENTATION REVIEW
Bring together a variety of perspectives on implementation of the first operational year of the Smarter Balanced Assessments.
Identify test administration challenges and best practices.
Provide recommendations to impact decision making for future assessment administration.
Guiding questions:
1. What worked well and should continue or be expanded upon for future SBA administrations?
2. What did not work well and should be discontinued or modified?
3. What else could be done that would be beneficial to future SBA administrations?
Schools where leadership collaborated with school test coordinators and other staff to…
Schedule time for test administrator (teacher) training during whole group staff meetings.
Develop a school wide schedule and communicate that schedule to all staff and families.
Communicate with families about the test.
Communicate with the IT about where and which devices would be used for testing.
Test administration information from weekly updates and testing support from R&E for school test coordinators.
Schools tended to report more a more positive testing experience if they…
Planned and prepared activities for students who completed tests earlier than their peers or did not test.
Planned buffer time (and space) for makeup testing.
Planned shorter testing blocks, especially for younger students.
Condensed testing schedules to a few weeks rather than extending throughout the full testing window.
SCHOOL LEADERSHIP HIGHLIGHTS
FOCUS OF EVALUATION PARTICIPANTS
WHAT WENT WELL
Stakeholders Method #
Students Focus
Groups 94
Teachers / test administrators Survey 300
Test coordinators Survey 50
Principals Email & Phone
Interviews 8
Central Office Departments * Office of Teaching & Learning * Instruction, Curriculum & Assessment * Information Technology * Special Education * Community Involvement & Public Affairs * System Planning & Performance * Research, Evaluation, & Assessment (R&E)
Focus Groups & Debrief
Meetings
15
The first full administration of Smarter Balanced Assessments (SBA) posed new challenges for schools.
Best practices for principals to continue or expand included working with Research and Evaluation (R&E) to develop a school testing schedule, allocating staff meeting time for required training, and actively supporting school test coordinator efforts before and during testing. To meet challenges of test administration, school leaders can work closely with the district and school level test coordinators as well as teachers to prepare students for testing, communicate information about testing with families, and improve the testing environment for all students.
Page 2
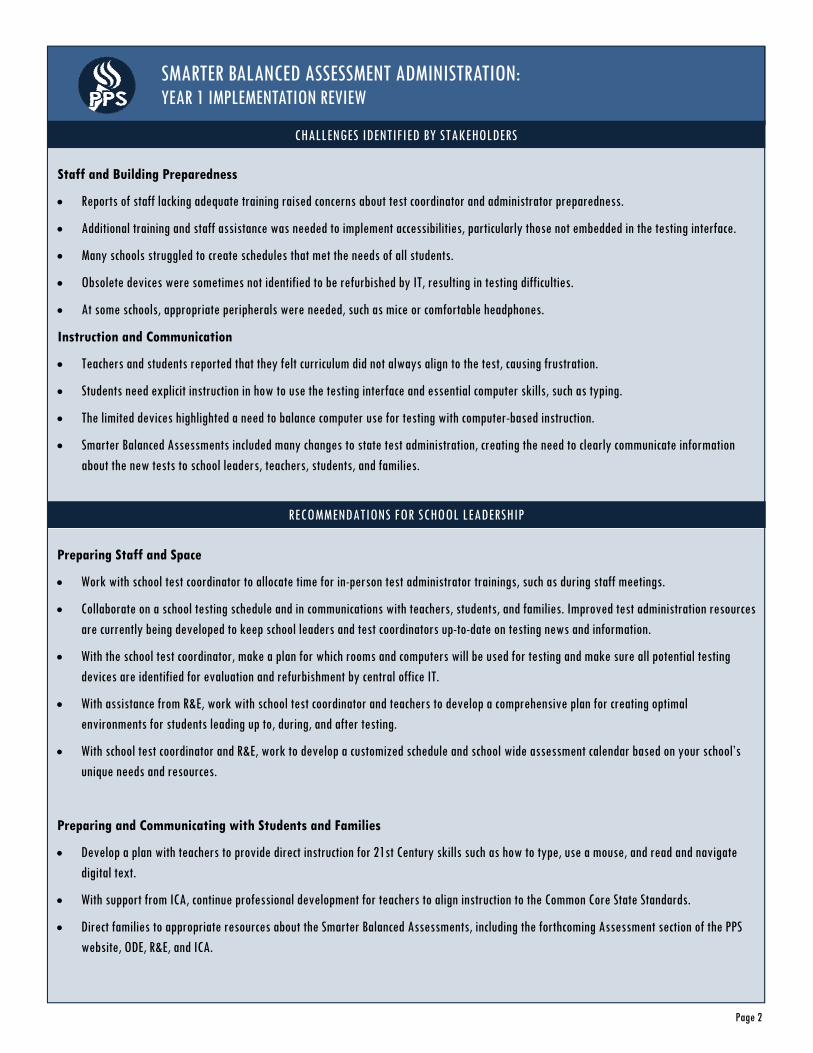
SMARTER BALANCED ASSESSMENT ADMINISTRATION: YEAR 1 IMPLEMENTATION REVIEW
Preparing Staff and Space
Work with school test coordinator to allocate time for in-person test administrator trainings, such as during staff meetings.
Collaborate on a school testing schedule and in communications with teachers, students, and families. Improved test administration resources are currently being developed to keep school leaders and test coordinators up-to-date on testing news and information.
With the school test coordinator, make a plan for which rooms and computers will be used for testing and make sure all potential testing devices are identified for evaluation and refurbishment by central office IT.
With assistance from R&E, work with school test coordinator and teachers to develop a comprehensive plan for creating optimal environments for students leading up to, during, and after testing.
With school test coordinator and R&E, work to develop a customized schedule and school wide assessment calendar based on your school’s unique needs and resources.
Preparing and Communicating with Students and Families
Develop a plan with teachers to provide direct instruction for 21st Century skills such as how to type, use a mouse, and read and navigate digital text.
With support from ICA, continue professional development for teachers to align instruction to the Common Core State Standards.
Direct families to appropriate resources about the Smarter Balanced Assessments, including the forthcoming Assessment section of the PPS website, ODE, R&E, and ICA.
CHALLENGES IDENTIFIED BY STAKEHOLDERS
RECOMMENDATIONS FOR SCHOOL LEADERSHIP
Staff and Building Preparedness
Reports of staff lacking adequate training raised concerns about test coordinator and administrator preparedness.
Additional training and staff assistance was needed to implement accessibilities, particularly those not embedded in the testing interface.
Many schools struggled to create schedules that met the needs of all students.
Obsolete devices were sometimes not identified to be refurbished by IT, resulting in testing difficulties.
At some schools, appropriate peripherals were needed, such as mice or comfortable headphones.
Instruction and Communication
Teachers and students reported that they felt curriculum did not always align to the test, causing frustration.
Students need explicit instruction in how to use the testing interface and essential computer skills, such as typing.
The limited devices highlighted a need to balance computer use for testing with computer-based instruction.
Smarter Balanced Assessments included many changes to state test administration, creating the need to clearly communicate information about the new tests to school leaders, teachers, students, and families.
SP
In
an
A
St
ac
fir
re
ba
ne
ch
Re
Th
of
pr
re
It
in
ad
co
ev
W
su
Re
Th
ad
co
Th
PP – Smarter
n 2010, the O
nd English La
ssessment Co
tandards to b
cross multiple
rst year of Sm
eview of the t
ase preparati
ewly operatio
hallenges and
eport Purpos
he purpose o
f complete SB
reparation an
ecommendat
should be no
ncluded in thi
dministration
ommon topic
vents or infor
While criticism
ummary of in
eport Audien
he stakeholde
dministrators
ontributing st
hese audienc
Balanced Ass
SYSTEM PLA
regon Depart
nguage Arts (
onsortium (SB
be used in Ore
e states in spr
marter Balanc
test impleme
ion for assess
onal assessme
d best practic
se and Intend
f this evaluat
BA administra
nd implement
ions for futur
oted that the
s study are in
n. The topics a
cs that crossed
rmation regar
m of the test c
put from stak
nce
er groups tha
s, as well as ce
takeholder gr
es are centra
sessment Adm
ANNING AND
SMARTYEAR 1
tment of Educ
(ELA) & Litera
BAC) to devel
egon. The new
ring of 2014 a
ced Assessme
ntation in Po
sment admini
ent was expe
es that emerg
ded Outcome
tion was to br
ation into a si
tation inform
re assessment
scope of this
ntended to im
as they are pr
d stakeholde
rding that asp
content, form
keholder grou
at contributed
entral office l
roups in its en
al office perso
ministration:
PERFORMAN
TER BALANIMPLEMEN
cation (ODE)
acy. Following
op an assessm
w assessment
and ready for
nt (SBA) impl
rtland Public
stration for t
cted to pose
ged from this
EVALUA
es
ring together
ngle compreh
ation from th
t administrat
study is limit
mpact decision
resented in th
r groups. Eac
pect of SBA ad
at, policies, a
ups, these top
d to the findin
leadership an
ntirety, with s
onnel, school
Year 1 Implem
NCE ‐ PORTLA
NCED ASSTATION RE
adopted the
g this adoptio
ment system
ts developed
r implementa
lementation,
Schools and g
he 2015‐16 a
new and vari
s evaluation.
ATION REP
a variety of p
hensive repo
he various sta
ion efforts w
ted to admini
n making and
he analysis of
h topic is intr
dministration
and state imp
pics are not t
ngs of this rep
nd staff. This r
supplemental
personnel, an
mentation Re
AND PUBLIC S
ESSMENTEVIEW
Common Cor
on, ODE select
based on the
by SBAC in m
tion in spring
Systems Plan
gathered a va
academic yea
ied challenge
ORT
perspectives o
rt. This repor
akeholders, cu
ithin Portland
istration of th
d efforts relati
f results sectio
roduced with
n.
posed rules an
he primary fo
port included
report is inten
l summaries g
nd families an
eview
SCHOOLS
T ADMINIS
re State Stand
ted the Smar
e new Commo
mathematics a
g of 2015. Upo
nning and Per
ariety of pers
r. The first ad
es. This report
on implemen
rt provides te
ulminating in
d Public Scho
he SBA tests.
ing to future
on of this rep
some descrip
nd regulation
ocus of this re
d students, tea
nded to be re
geared towar
nd communit
STRATION:
dards for Mat
rter Balanced
on Core State
and ELA were
on completio
rformance co
spectives from
dministration
t summarizes
ntation of the
st administra
actionable
ols.
The recomm
assessment
port were der
ption of relev
s was include
eport.
achers, schoo
ead by any of
rd specific aud
ty members.
Page 1
:
thematics
e
e piloted
on of the
onducted a
m which to
of a
s both the
first year
ation
endations
rived from
vant
ed in the
ol
the
diences.
SPP – Smarter Balanced Assessment Administration: Year 1 Implementation Review Page 2
FOCUS OF EVALUATION
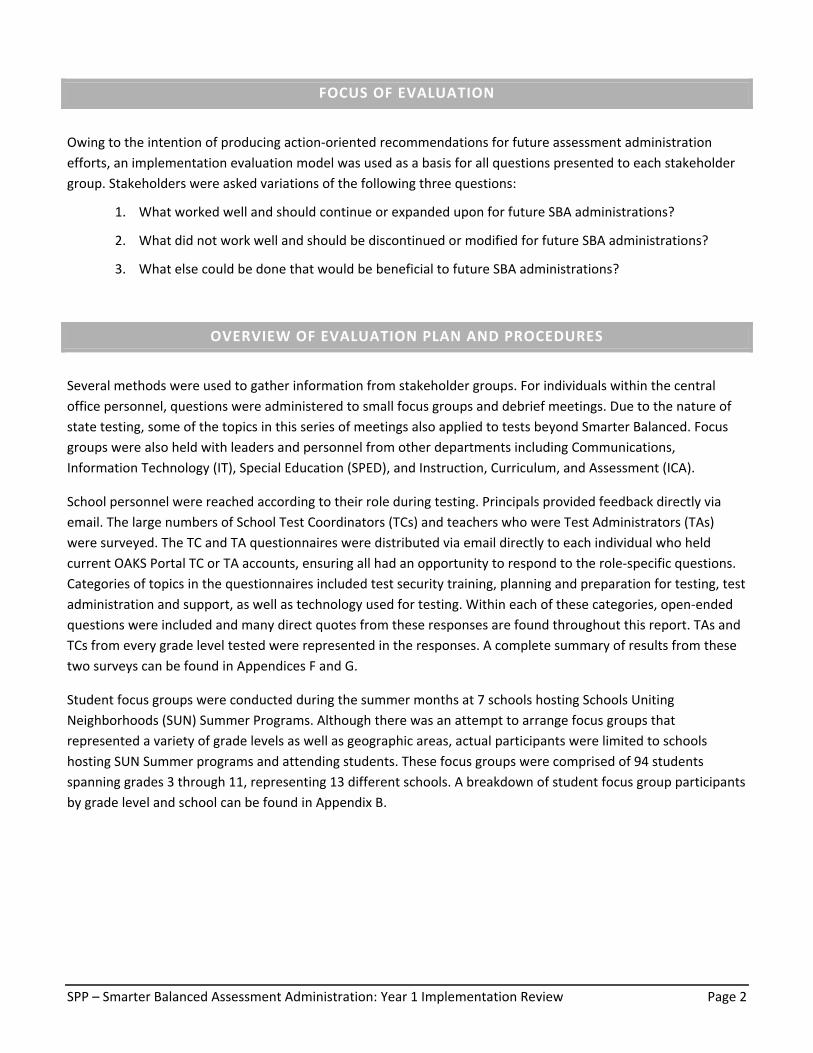
Owing to the intention of producing action‐oriented recommendations for future assessment administration
efforts, an implementation evaluation model was used as a basis for all questions presented to each stakeholder
group. Stakeholders were asked variations of the following three questions:
1. What worked well and should continue or expanded upon for future SBA administrations?
2. What did not work well and should be discontinued or modified for future SBA administrations?
3. What else could be done that would be beneficial to future SBA administrations?
OVERVIEW OF EVALUATION PLAN AND PROCEDURES
Several methods were used to gather information from stakeholder groups. For individuals within the central
office personnel, questions were administered to small focus groups and debrief meetings. Due to the nature of
state testing, some of the topics in this series of meetings also applied to tests beyond Smarter Balanced. Focus
groups were also held with leaders and personnel from other departments including Communications,
Information Technology (IT), Special Education (SPED), and Instruction, Curriculum, and Assessment (ICA).
School personnel were reached according to their role during testing. Principals provided feedback directly via
email. The large numbers of School Test Coordinators (TCs) and teachers who were Test Administrators (TAs)
were surveyed. The TC and TA questionnaires were distributed via email directly to each individual who held
current OAKS Portal TC or TA accounts, ensuring all had an opportunity to respond to the role‐specific questions.
Categories of topics in the questionnaires included test security training, planning and preparation for testing, test
administration and support, as well as technology used for testing. Within each of these categories, open‐ended
questions were included and many direct quotes from these responses are found throughout this report. TAs and
TCs from every grade level tested were represented in the responses. A complete summary of results from these
two surveys can be found in Appendices F and G.
Student focus groups were conducted during the summer months at 7 schools hosting Schools Uniting
Neighborhoods (SUN) Summer Programs. Although there was an attempt to arrange focus groups that
represented a variety of grade levels as well as geographic areas, actual participants were limited to schools
hosting SUN Summer programs and attending students. These focus groups were comprised of 94 students
spanning grades 3 through 11, representing 13 different schools. A breakdown of student focus group participants
by grade level and school can be found in Appendix B.
SPP – Smarter Balanced Assessment Administration: Year 1 Implementation Review Page 3
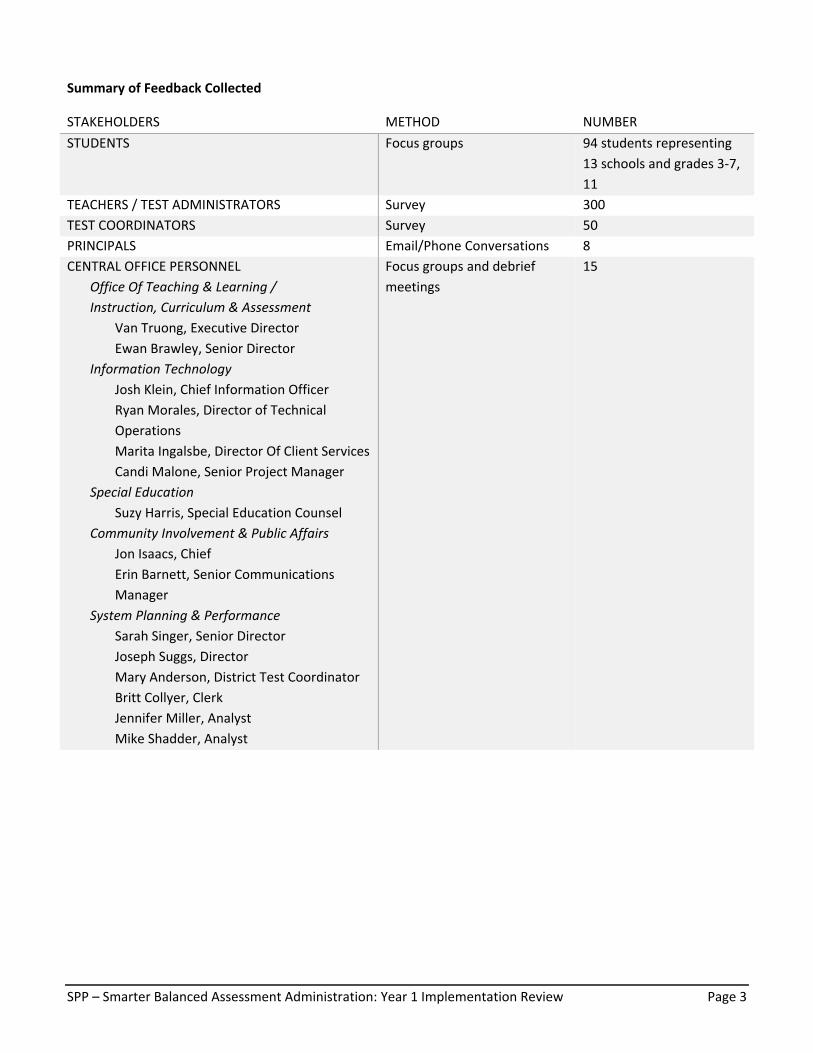
Summary of Feedback Collected
STAKEHOLDERS METHOD NUMBER
STUDENTS Focus groups 94 students representing
13 schools and grades 3‐7,
11
TEACHERS / TEST ADMINISTRATORS Survey 300
TEST COORDINATORS Survey 50
PRINCIPALS Email/Phone Conversations 8
CENTRAL OFFICE PERSONNEL
Office Of Teaching & Learning / Instruction, Curriculum & Assessment
Van Truong, Executive Director
Ewan Brawley, Senior Director
Information Technology Josh Klein, Chief Information Officer
Ryan Morales, Director of Technical
Operations
Marita Ingalsbe, Director Of Client Services
Candi Malone, Senior Project Manager
Special Education Suzy Harris, Special Education Counsel
Community Involvement & Public Affairs Jon Isaacs, Chief
Erin Barnett, Senior Communications
Manager
System Planning & Performance Sarah Singer, Senior Director
Joseph Suggs, Director
Mary Anderson, District Test Coordinator
Britt Collyer, Clerk
Jennifer Miller, Analyst
Mike Shadder, Analyst
Focus groups and debrief
meetings
15
SPP – Smarter Balanced Assessment Administration: Year 1 Implementation Review Page 4
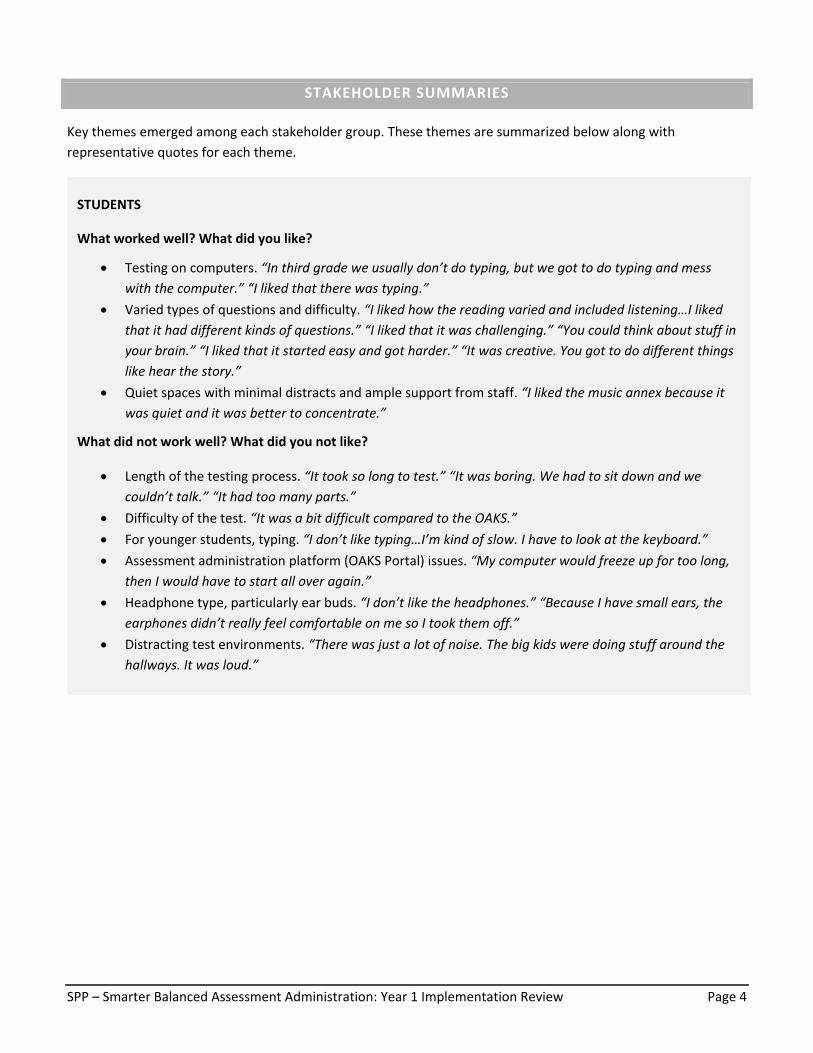
STAKEHOLDER SUMMARIES
Key themes emerged among each stakeholder group. These themes are summarized below along with
representative quotes for each theme.
STUDENTS
What worked well? What did you like?
Testing on computers. “In third grade we usually don’t do typing, but we got to do typing and mess with the computer.” “I liked that there was typing.”
Varied types of questions and difficulty. “I liked how the reading varied and included listening…I liked that it had different kinds of questions.” “I liked that it was challenging.” “You could think about stuff in your brain.” “I liked that it started easy and got harder.” “It was creative. You got to do different things like hear the story.”
Quiet spaces with minimal distracts and ample support from staff. “I liked the music annex because it was quiet and it was better to concentrate.”
What did not work well? What did you not like?
Length of the testing process. “It took so long to test.” “It was boring. We had to sit down and we couldn’t talk.” “It had too many parts.”
Difficulty of the test. “It was a bit difficult compared to the OAKS.” For younger students, typing. “I don’t like typing…I’m kind of slow. I have to look at the keyboard.” Assessment administration platform (OAKS Portal) issues. “My computer would freeze up for too long,
then I would have to start all over again.” Headphone type, particularly ear buds. “I don’t like the headphones.” “Because I have small ears, the
earphones didn’t really feel comfortable on me so I took them off.” Distracting test environments. “There was just a lot of noise. The big kids were doing stuff around the
hallways. It was loud.”
SPP – Smarter Balanced Assessment Administration: Year 1 Implementation Review Page 5
TEACHERS / TEST ADMINISTRATORS
What worked well?
Some TAs viewed the difficulty of tests as a positive: “I think difficult tests are great for public school students.”
What did not work well?
Amount of time spent on tests. “I also am resentful that I lost 10 class periods to a test that was so completely flawed‐ that's 10 hours of time.” “Waste of time.”
Difficulty level of tests. “The directions, computer interactions and time required to take these tests was developmentally inappropriate for third grade.” “Academically successful students were frustrated and puzzled by many of the test questions.”
Curriculum not preparing students for the tests. “It seemed like the content of the Math test does not align well with the Bridges curriculum.” “We should be administering tests that align with our district curriculum!”
Need for instruction of computer skills, such as typing. “They should be getting typing instruction at a very early age, before they learn sloppy hunt and peck habits.”
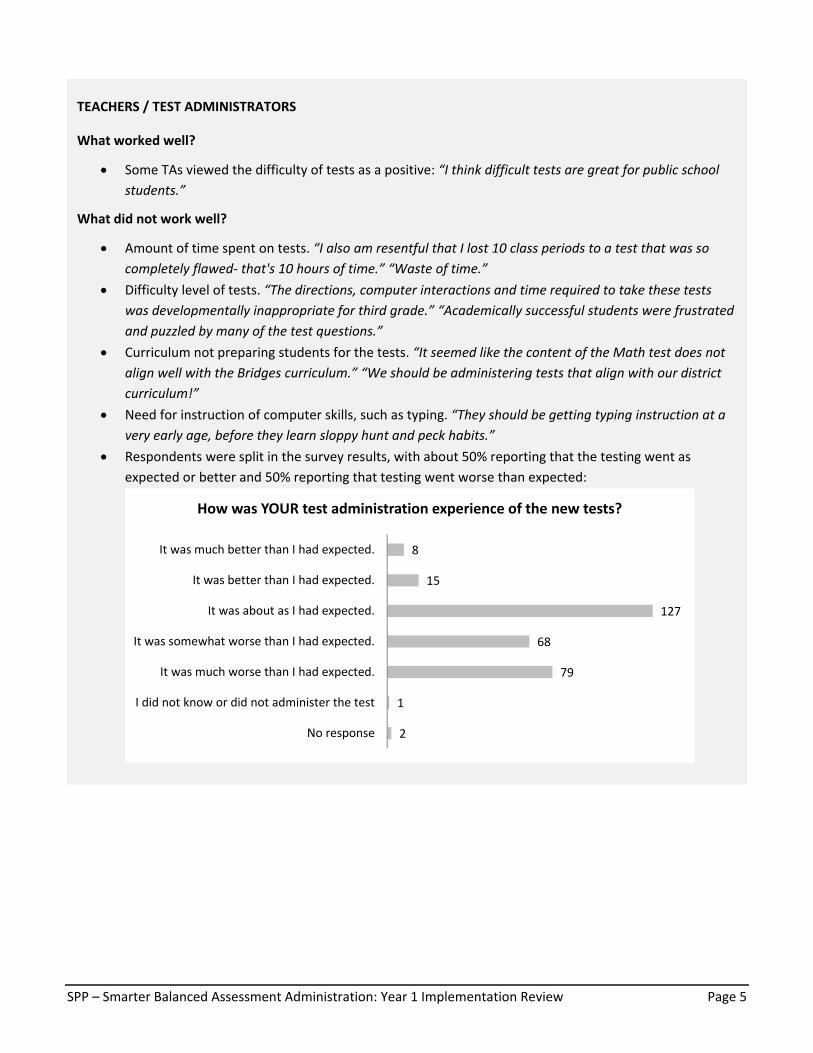
Respondents were split in the survey results, with about 50% reporting that the testing went as
expected or better and 50% reporting that testing went worse than expected:
8
15
127
68
79
1
2
It was much better than I had expected.
It was better than I had expected.
It was about as I had expected.
It was somewhat worse than I had expected.
It was much worse than I had expected.
I did not know or did not administer the test
No response
How was YOUR test administration experience of the new tests?
SPP – Smarter Balanced Assessment Administration: Year 1 Implementation Review Page 6
TEST COORDINATORS
What worked well?
Communication of central office assessment administration support. “[The District Test Coordinator] was extremely responsive and helped along the way.” “Weekly emails with updates and information were very helpful.”
Scheduling support. “I loved being able to sit down with [the District Test Coordinator] and make a schedule.”
Having additional devices. “It was extremely helpful to get the cart of Chromebooks, especially when our teachers also needed to complete spring benchmark assessments.”
What did not work well?
Need for modified version of ODE created informational resources. “Translate the accessibility manual. Make some quick reference charts.” “A scripted outline in order to train the TAs.”
Need for additional computers, peripherals, and technical support. “Tech couldn’t solve most of the problems and I was left to deal with them myself.” “Schools should be sure they have mice. Especially in elementary.”
TCs were in a difficult position due to political situation. “It sometimes felt like we were the ‘bad guys’ because we were sharing info that was not readily accepted or appreciated.” “Teachers and parents who were philosophically/politically opposed to testing made the whole season pretty unbearable.”
PRINCPALS
What worked well?
Communication of central office assessment administration support. “[The District Test Coordinator] did an excellent job this year of communicating the necessary information and we found the SBAC process to be not much more challenging than OAKS.” “Thank you for [the District Test Coordinator’s] guidance and support with launching SB here.”
What did not work well?
Need for instruction of computer skills, such as typing. “I think one huge disadvantage for students in terms of typing out their essay on the computer was the time taken up from actually doing the typing particularly for our 3rd grade students.”
Time spent documenting and managing non‐testing students. “The process which is probably not very changeable is how to manage the Opt‐out numbers. Because I had to sign off on each one, it came to me to be the funnel for collecting and then sending [forms] off to [the central office]: very time consuming.” “Scheduling/supervision [was an] issue of what to do with almost 100 kids who weren’t testing.”
SPP – Smarter Balanced Assessment Administration: Year 1 Implementation Review Page 7
TEST ADMINISTRATION TRAINING & RESOURCES
Administration of all state mandated testing is formally described by the annually released Oregon Test
Administration Manual (TAM) developed by the ODE Office of Learning. The TAM outlines policies and procedures
for all Oregon statewide assessments, as well as some nationally administered assessments. This manual is
intended to ensure both test reliability and validity by promoting standardized test administration across the state
so that testing environments are similar for all students. This manual, in conjunction with the Oregon
Accessibilities Manual (OAM) which describes the regulations for supports to students during testing, are the two
primary resources for policy and procedures for all statewide assessments. These two manuals are also the basis
for all required trainings for those coordinating and administering state tests.
As in previous years of testing, state testing administration and security training requirements included reading
both the TAM and OAM. Starting in the 2014‐15 academic year, training requirements included viewing specific
ODE‐created modules and participating in a facilitated question and answer session. Owing to this change toward
specific required training modules, as well as internal PPS changes, TCs and TAs were expected to access the ODE
modules directly from the ODE website. These expectations and materials addressed all state testing, in addition
to the SBA tests. Test Coordinators were provided a question and answer session with the District Test
Coordinator (DTC). In turn, TAs were to participate in a question and answer session facilitated by their school
Test Coordinators after reviewing the manuals and modules. Upon completion, the Assurance of Test Security
form was to be signed and submitted to the Research, Evaluation, and Assessment Department (R&E) as proof of
training completion and for OAKS Portal accounts to be created.
CENTRAL OFFICE PERSONNEL
What worked well?
Testing implementation proceeded despite significant challenges, such as learning curve with new
test, and the number of families opting their student out of testing.
Leadership from central office assessment administration support, specifically the District Test
Coordinator.
SBA as part of process changes, such as IT device inventory and working with Special Education to
standardize language for IEPs.
What did not work well?
Timelines for implementing the new test were short, requiring quick turnaround; more planning time
would have been beneficial.
On a highly charged topic, central office personnel need more clarity about the messaging that is
expected by district leadership.
Data entry was a significant burden, such as entering accessibilities into the Test Information and
Distribution Engine (TIDE) and parent request for exemption (opt out) forms.
SPP – Smarter Balanced Assessment Administration: Year 1 Implementation Review Page 8
Test administration and security training expectations were communicated directly to TCs during their in‐person
TC trainings. The Office of Teaching and Learning also communicated to principals specifying the need to set aside
staff meeting time to complete the training requirements with teachers. These training requirements covered all
state assessments, not only the SBA tests. Additional information was presented to all school leaders specific to
the SBA tests but was not considered a required training for test administration.
CHALLENGES FOR TEST COORDINATORS
Test coordinators identified the long, difficult‐to‐understand ODE manuals and lack of awareness about existing
resources as key issues.
ODE‐created resources and manuals must be easy to use and provide depth for specific questions.
Striking a balance between detail and user‐friendly informational materials is difficult and may necessitate
the creation of supplemental materials in order to clarify official manuals.
Many TCs viewed existing training manuals as long and unclear. The following are representative of
statements made by many TCs in the questionnaire responses:
“The extensive size of the training manuals made troubleshooting difficult to navigate.”
“Translate the accessibility manual. Make some quick reference charts.”
“Please make the manual easier to read, especially a simpler manual for the TAs (teachers) who don’t have much time to read them.”
Specific issues and questions arose during testing that required detailed information that could only be
obtained by consulting manuals. The availability of “quick guides” may be needed to provide answers to
common questions, as well as to direct TCs to the appropriate places in ODE‐provided materials for the
information they need.
TC use of offered supports varied.
Not all TCs were aware of the resources available for testing, such as test login cards (pre‐printed cards
with student specific login information), until after they were no longer useful, as illustrated by comments
from one TC: “I had already prepared cards by the time the district cards came. I would have liked to know they were coming earlier and saved myself the trouble.”
CHALLENGES FOR TEST ADMINISTRATORS
From TC and TA feedback, training materials and tracking of participation emerged as a major concern.
Implementation of required test security training varied by school.
In order to implement the tests smoothly and according to ODE test security requirements, TAs were
required to view ODE created online training modules as well as participate in a question and answer
session. Multiple TCs reported concerns about tracking participation and completion of these training
requirements when TAs viewed the training modules in their own time, as opposed to as a group during
staff meetings.
TAs reported that ODE online training materials were not engaging, which may have limited the training
module effectiveness.
SPP – Smarter Balanced Assessment Administration: Year 1 Implementation Review Page 9
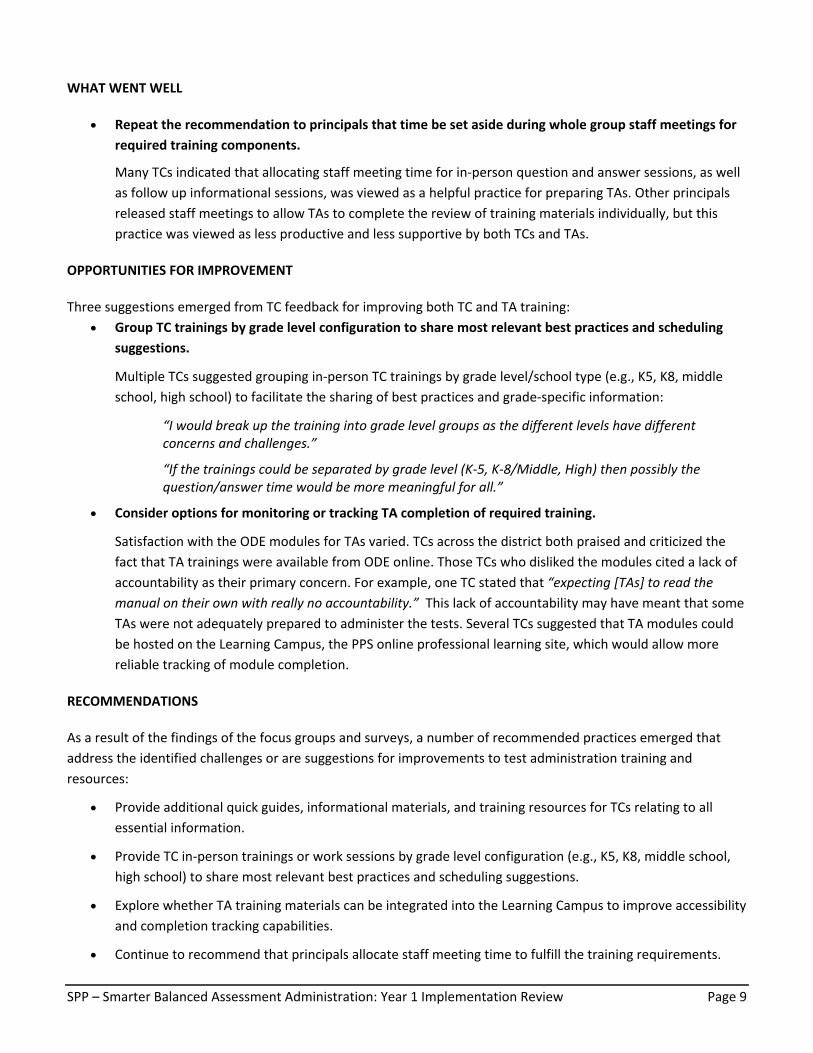
WHAT WENT WELL
Repeat the recommendation to principals that time be set aside during whole group staff meetings for
required training components.
Many TCs indicated that allocating staff meeting time for in‐person question and answer sessions, as well
as follow up informational sessions, was viewed as a helpful practice for preparing TAs. Other principals
released staff meetings to allow TAs to complete the review of training materials individually, but this
practice was viewed as less productive and less supportive by both TCs and TAs.
OPPORTUNITIES FOR IMPROVEMENT
Three suggestions emerged from TC feedback for improving both TC and TA training:
Group TC trainings by grade level configuration to share most relevant best practices and scheduling
suggestions.
Multiple TCs suggested grouping in‐person TC trainings by grade level/school type (e.g., K5, K8, middle
school, high school) to facilitate the sharing of best practices and grade‐specific information:
“I would break up the training into grade level groups as the different levels have different concerns and challenges.”
“If the trainings could be separated by grade level (K‐5, K‐8/Middle, High) then possibly the question/answer time would be more meaningful for all.”
Consider options for monitoring or tracking TA completion of required training.
Satisfaction with the ODE modules for TAs varied. TCs across the district both praised and criticized the
fact that TA trainings were available from ODE online. Those TCs who disliked the modules cited a lack of
accountability as their primary concern. For example, one TC stated that “expecting [TAs] to read the manual on their own with really no accountability.” This lack of accountability may have meant that some
TAs were not adequately prepared to administer the tests. Several TCs suggested that TA modules could
be hosted on the Learning Campus, the PPS online professional learning site, which would allow more
reliable tracking of module completion.
RECOMMENDATIONS
As a result of the findings of the focus groups and surveys, a number of recommended practices emerged that
address the identified challenges or are suggestions for improvements to test administration training and
resources:
Provide additional quick guides, informational materials, and training resources for TCs relating to all
essential information.
Provide TC in‐person trainings or work sessions by grade level configuration (e.g., K5, K8, middle school,
high school) to share most relevant best practices and scheduling suggestions.
Explore whether TA training materials can be integrated into the Learning Campus to improve accessibility
and completion tracking capabilities.
Continue to recommend that principals allocate staff meeting time to fulfill the training requirements.
SPP – Smarter Balanced Assessment Administration: Year 1 Implementation Review Page 10
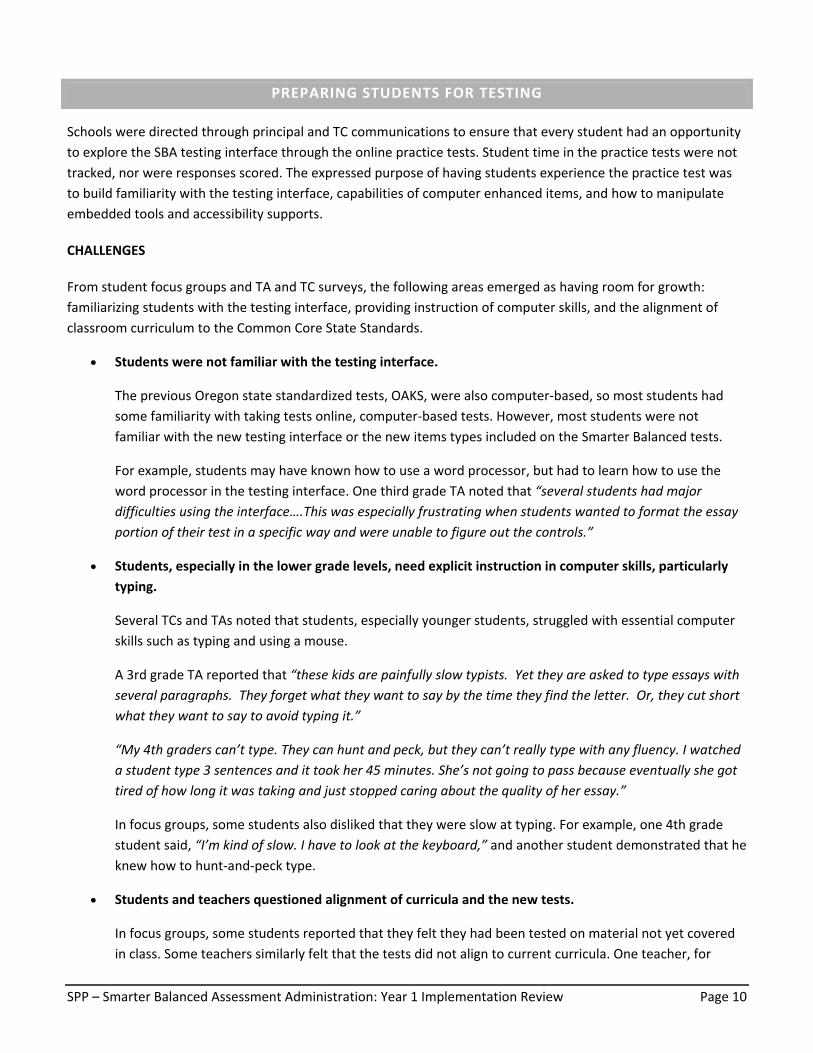
PREPARING STUDENTS FOR TESTING
Schools were directed through principal and TC communications to ensure that every student had an opportunity
to explore the SBA testing interface through the online practice tests. Student time in the practice tests were not
tracked, nor were responses scored. The expressed purpose of having students experience the practice test was
to build familiarity with the testing interface, capabilities of computer enhanced items, and how to manipulate
embedded tools and accessibility supports.
CHALLENGES
From student focus groups and TA and TC surveys, the following areas emerged as having room for growth:
familiarizing students with the testing interface, providing instruction of computer skills, and the alignment of
classroom curriculum to the Common Core State Standards.
Students were not familiar with the testing interface.
The previous Oregon state standardized tests, OAKS, were also computer‐based, so most students had
some familiarity with taking tests online, computer‐based tests. However, most students were not
familiar with the new testing interface or the new items types included on the Smarter Balanced tests.
For example, students may have known how to use a word processor, but had to learn how to use the
word processor in the testing interface. One third grade TA noted that “several students had major difficulties using the interface….This was especially frustrating when students wanted to format the essay portion of their test in a specific way and were unable to figure out the controls.”
Students, especially in the lower grade levels, need explicit instruction in computer skills, particularly
typing.
Several TCs and TAs noted that students, especially younger students, struggled with essential computer
skills such as typing and using a mouse.
A 3rd grade TA reported that “these kids are painfully slow typists. Yet they are asked to type essays with several paragraphs. They forget what they want to say by the time they find the letter. Or, they cut short what they want to say to avoid typing it.”
“My 4th graders can’t type. They can hunt and peck, but they can’t really type with any fluency. I watched a student type 3 sentences and it took her 45 minutes. She’s not going to pass because eventually she got tired of how long it was taking and just stopped caring about the quality of her essay.”
In focus groups, some students also disliked that they were slow at typing. For example, one 4th grade
student said, “I’m kind of slow. I have to look at the keyboard,” and another student demonstrated that he
knew how to hunt‐and‐peck type.
Students and teachers questioned alignment of curricula and the new tests.
In focus groups, some students reported that they felt they had been tested on material not yet covered
in class. Some teachers similarly felt that the tests did not align to current curricula. One teacher, for
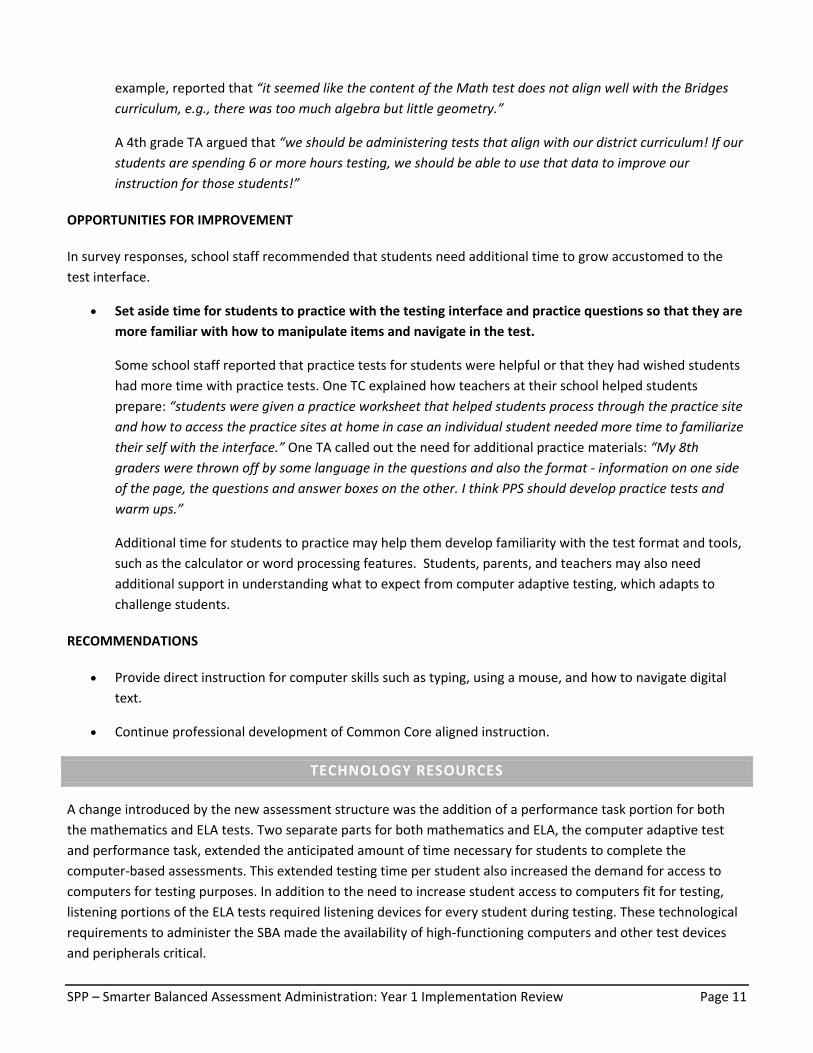
SPP – Smarter Balanced Assessment Administration: Year 1 Implementation Review Page 11
example, reported that “it seemed like the content of the Math test does not align well with the Bridges curriculum, e.g., there was too much algebra but little geometry.”
A 4th grade TA argued that “we should be administering tests that align with our district curriculum! If our students are spending 6 or more hours testing, we should be able to use that data to improve our instruction for those students!”
OPPORTUNITIES FOR IMPROVEMENT
In survey responses, school staff recommended that students need additional time to grow accustomed to the
test interface.
Set aside time for students to practice with the testing interface and practice questions so that they are
more familiar with how to manipulate items and navigate in the test.
Some school staff reported that practice tests for students were helpful or that they had wished students
had more time with practice tests. One TC explained how teachers at their school helped students
prepare: “students were given a practice worksheet that helped students process through the practice site and how to access the practice sites at home in case an individual student needed more time to familiarize their self with the interface.” One TA called out the need for additional practice materials: “My 8th graders were thrown off by some language in the questions and also the format ‐ information on one side of the page, the questions and answer boxes on the other. I think PPS should develop practice tests and warm ups.”
Additional time for students to practice may help them develop familiarity with the test format and tools,
such as the calculator or word processing features. Students, parents, and teachers may also need
additional support in understanding what to expect from computer adaptive testing, which adapts to
challenge students.
RECOMMENDATIONS
Provide direct instruction for computer skills such as typing, using a mouse, and how to navigate digital
text.
Continue professional development of Common Core aligned instruction.
TECHNOLOGY RESOURCES
A change introduced by the new assessment structure was the addition of a performance task portion for both
the mathematics and ELA tests. Two separate parts for both mathematics and ELA, the computer adaptive test
and performance task, extended the anticipated amount of time necessary for students to complete the
computer‐based assessments. This extended testing time per student also increased the demand for access to
computers for testing purposes. In addition to the need to increase student access to computers fit for testing,
listening portions of the ELA tests required listening devices for every student during testing. These technological
requirements to administer the SBA made the availability of high‐functioning computers and other test devices
and peripherals critical.
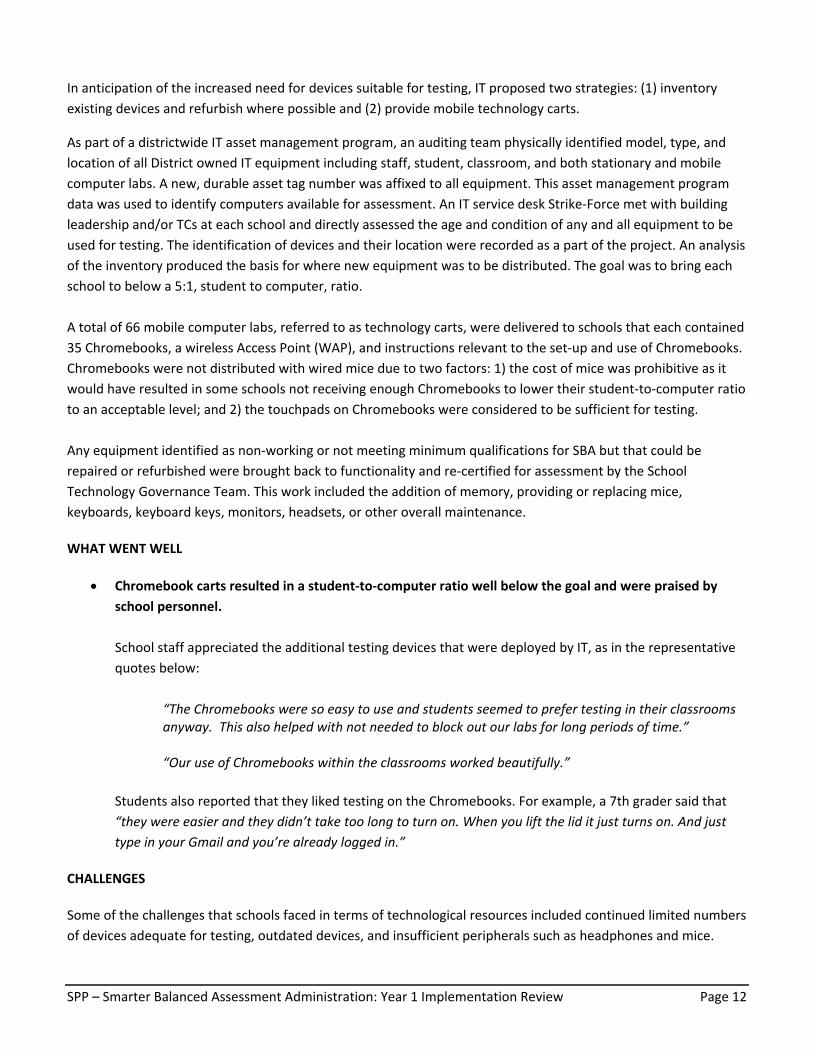
SPP – Smarter Balanced Assessment Administration: Year 1 Implementation Review Page 12
In anticipation of the increased need for devices suitable for testing, IT proposed two strategies: (1) inventory
existing devices and refurbish where possible and (2) provide mobile technology carts.
As part of a districtwide IT asset management program, an auditing team physically identified model, type, and
location of all District owned IT equipment including staff, student, classroom, and both stationary and mobile
computer labs. A new, durable asset tag number was affixed to all equipment. This asset management program
data was used to identify computers available for assessment. An IT service desk Strike‐Force met with building
leadership and/or TCs at each school and directly assessed the age and condition of any and all equipment to be
used for testing. The identification of devices and their location were recorded as a part of the project. An analysis
of the inventory produced the basis for where new equipment was to be distributed. The goal was to bring each
school to below a 5:1, student to computer, ratio.
A total of 66 mobile computer labs, referred to as technology carts, were delivered to schools that each contained
35 Chromebooks, a wireless Access Point (WAP), and instructions relevant to the set‐up and use of Chromebooks.
Chromebooks were not distributed with wired mice due to two factors: 1) the cost of mice was prohibitive as it
would have resulted in some schools not receiving enough Chromebooks to lower their student‐to‐computer ratio
to an acceptable level; and 2) the touchpads on Chromebooks were considered to be sufficient for testing.
Any equipment identified as non‐working or not meeting minimum qualifications for SBA but that could be
repaired or refurbished were brought back to functionality and re‐certified for assessment by the School
Technology Governance Team. This work included the addition of memory, providing or replacing mice,
keyboards, keyboard keys, monitors, headsets, or other overall maintenance.
WHAT WENT WELL
Chromebook carts resulted in a student‐to‐computer ratio well below the goal and were praised by
school personnel.
School staff appreciated the additional testing devices that were deployed by IT, as in the representative
quotes below:
“The Chromebooks were so easy to use and students seemed to prefer testing in their classrooms anyway. This also helped with not needed to block out our labs for long periods of time.” “Our use of Chromebooks within the classrooms worked beautifully.”
Students also reported that they liked testing on the Chromebooks. For example, a 7th grader said that
“they were easier and they didn’t take too long to turn on. When you lift the lid it just turns on. And just type in your Gmail and you’re already logged in.”
CHALLENGES
Some of the challenges that schools faced in terms of technological resources included continued limited numbers
of devices adequate for testing, outdated devices, and insufficient peripherals such as headphones and mice.
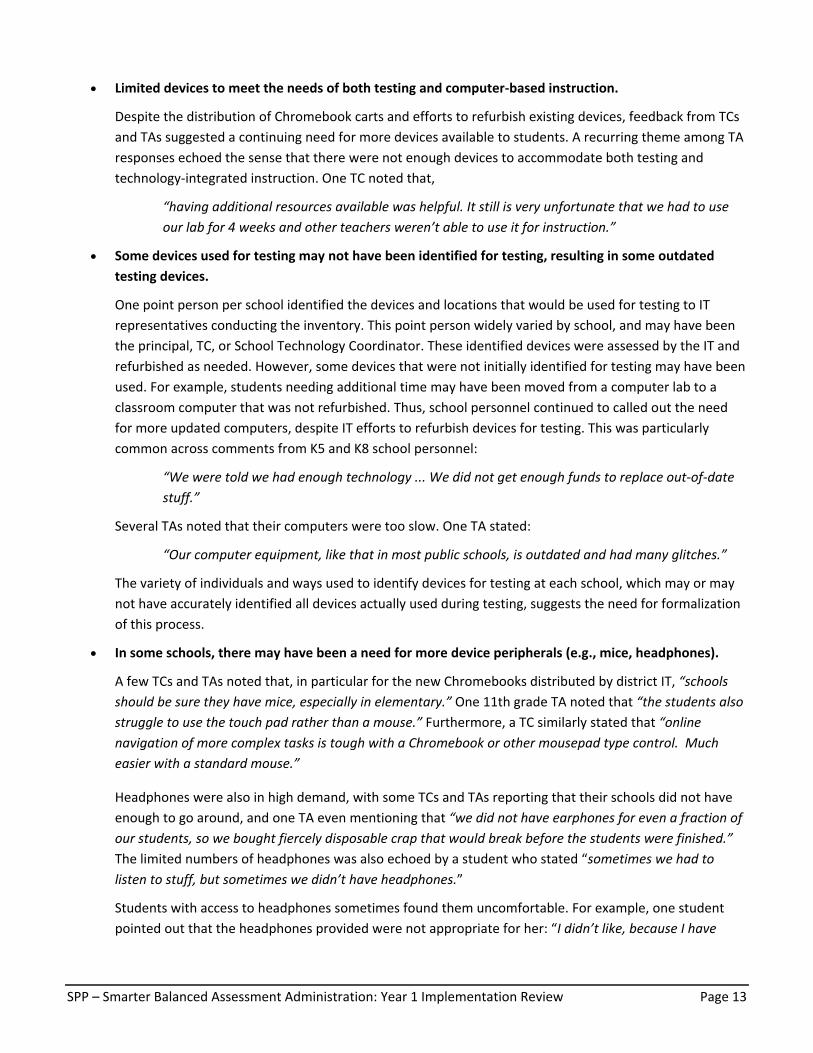
SPP – Smarter Balanced Assessment Administration: Year 1 Implementation Review Page 13
Limited devices to meet the needs of both testing and computer‐based instruction.
Despite the distribution of Chromebook carts and efforts to refurbish existing devices, feedback from TCs
and TAs suggested a continuing need for more devices available to students. A recurring theme among TA
responses echoed the sense that there were not enough devices to accommodate both testing and
technology‐integrated instruction. One TC noted that,
“having additional resources available was helpful. It still is very unfortunate that we had to use our lab for 4 weeks and other teachers weren’t able to use it for instruction.”
Some devices used for testing may not have been identified for testing, resulting in some outdated
testing devices.
One point person per school identified the devices and locations that would be used for testing to IT
representatives conducting the inventory. This point person widely varied by school, and may have been
the principal, TC, or School Technology Coordinator. These identified devices were assessed by the IT and
refurbished as needed. However, some devices that were not initially identified for testing may have been
used. For example, students needing additional time may have been moved from a computer lab to a
classroom computer that was not refurbished. Thus, school personnel continued to called out the need
for more updated computers, despite IT efforts to refurbish devices for testing. This was particularly
common across comments from K5 and K8 school personnel:
“We were told we had enough technology ... We did not get enough funds to replace out‐of‐date stuff.”
Several TAs noted that their computers were too slow. One TA stated:
“Our computer equipment, like that in most public schools, is outdated and had many glitches.”
The variety of individuals and ways used to identify devices for testing at each school, which may or may
not have accurately identified all devices actually used during testing, suggests the need for formalization
of this process.
In some schools, there may have been a need for more device peripherals (e.g., mice, headphones).
A few TCs and TAs noted that, in particular for the new Chromebooks distributed by district IT, “schools should be sure they have mice, especially in elementary.” One 11th grade TA noted that “the students also struggle to use the touch pad rather than a mouse.” Furthermore, a TC similarly stated that “online navigation of more complex tasks is tough with a Chromebook or other mousepad type control. Much easier with a standard mouse.”
Headphones were also in high demand, with some TCs and TAs reporting that their schools did not have
enough to go around, and one TA even mentioning that “we did not have earphones for even a fraction of our students, so we bought fiercely disposable crap that would break before the students were finished.” The limited numbers of headphones was also echoed by a student who stated “sometimes we had to listen to stuff, but sometimes we didn’t have headphones.”
Students with access to headphones sometimes found them uncomfortable. For example, one student
pointed out that the headphones provided were not appropriate for her: “I didn’t like, because I have
SPP – Smarter Balanced Assessment Administration: Year 1 Implementation Review Page 14
small ears, the [earbud] earphones didn’t really feel comfortable on me so I took them off. Then I’d have to put them back on.”
RECOMMENDATIONS
Consider investigating peripheral needs at each school and how to best distribute needed equipment
from the central office.
Continue IT efforts to inventory and refurbish existing devices.
Fund the IT request to fund the sustainability/refresh initiative including a budget for mice and headsets,
as well as explore options for an annual budget line item for replacing items as needed.
Establish school testing teams, with would include the TC, principal, and School Technology Coordinator,
who would collaboratively plan for testing, including the identification of all devices that will be used for
testing.
TESTING SCHEDULES AND ADMINISTRATION
Creating a testing schedule has been a part of the expectations for School Test Coordinators. A testing schedule is
necessary to ensure that every student who is expected to test has adequate access to computers and any other
necessary resources. Scheduling demands the coordination of facilities, teachers, support instructional staff, and
administrators. A comprehensive testing schedule not only coordinates who tests where and at what time, but
also addresses the special cases that make each school schedule unique. Some schools did not formally plan every
aspect of the testing schedule, such as accommodations impacting the testing environment for students receiving
Special Education services. While it is common for some alterations to plans after testing begins, large
adjustments were made in most schools to accommodate unanticipated aspects of administering the new tests.
CHALLENGES
For test coordinators, scheduling issues were frequently reported as a burden. Common themes that emerged
from their feedback included the need for more guidance in the complex task of balancing the schedule with
other tests, school constraints, and instructional time.
Need for more guidance around scheduling SBA around other concurrent tests, such as the SAT, ACT,
Advanced Placement, and other classroom assessments.
Especially for high schools, scheduling these tests was reported as a challenge. Smarter Balanced testing
windows coincided with other assessments, including English Language Proficiency Assessments,
Advanced Placement (AP), International Baccalaureate tests (IB), SAT, and ACT. In addition, many schools
also tested close to the end of the quarter when classroom assessments were also taking place. For
example, one TC noted that “scheduling for high school test takers was difficult in regards to making the transition from their daily activities less stressful. It is not a good experience for students to have SBAC, IB, ACT, and final exams all thrust at them in the final five weeks of school.” Another TC suggested that test dates be moved so that the ACT and SBA did not occur during at the same time.
In 2015‐16, the Smarter Balanced window for high school testing has been adjusted by ODE to allow for
earlier testing at high school to alleviate some timing conflicts with other tests.
SPP – Smarter Balanced Assessment Administration: Year 1 Implementation Review Page 15
Scheduling K‐8, middle, and high school students for testing was complex.
Complex scheduling needs were also reported by middle school and K‐8 test coordinators. One TC
reported that scheduling the six testing grades at a K‐8 was challenging: “it was so difficult at a K‐8 getting everyone tested. Make up testing was difficult.” Another TC reported that for test expiration dates “it got very confusing to track for a K‐8.”
Test schedules interfered with instructional time.
Several teachers mentioned that they struggled to balance the needs of testing students, some of whom
needed more time than planned, with the needs of students who had completed or opted out of testing.
A fifth grade TA, for example, reported that “one student tested during 17 or 18 sessions. At least four students needed at least 12 sessions. During this time, other students could work on various projects and assignments, but I could not introduce new material. That is not the best use of class time.”
Other teachers mentioned that the duration of the testing period, which for some schools took place over
a few weeks and for others over multiple months, was stressful and impacted their lesson plan
scheduling: “The whole testing period took too long, it took away a lot of instruction time and testing sessions clashed with school activities.”
Schools needed additional support in making test administration choices that would create secure,
welcoming testing environments to meet the needs of all students.
Some of the most striking parts of the testing experience for students were the result of test
administration choices that were made within buildings. Students in focus groups varied in their
preference for testing space, with some students preferring classrooms and others preferring computer
labs. However, student preference tended toward quiet, less distracting spaces with more room to work
and a lower student‐to‐TA ratio. These desired aspects were consistent in student responses of where
they liked to test the best, regardless if they were describing a classroom with laptops or a stationary
computer lab. The following representative quotes from students illustrate this finding:
“I liked the classroom because it was more quiet. You could sit somewhere without someone else next to you. There was more room in the classroom.”
“I liked the computer lab better because there were more people to help because there were more teachers in the room.”
“I liked the music annex because it was quiet and it was better to concentrate.”
“There was just a lot of noise because our classroom was upstairs. The big kids were doing stuff around the hallways. It was loud.”
Guidance from TAs, such as requiring students to type in a way that was unfamiliar to them or to use
scratch paper in specific ways, made lasting impressions on students’ view of the tests:
“The thing that I don’t like about it is how when you’re trying to type with one finger and your teacher is like you have to type with two fingers like type with two fingers instead of one.”
“Our teacher said we had to write it on paper first. I wanted to just type it in the computer ‐ it would go faster.”
SPP – Smarter Balanced Assessment Administration: Year 1 Implementation Review Page 16
Decisions made about the pre‐ and post‐test environment also affected students. Students in one focus
group reported that they were only able to bring one book to read after finishing their tests: “you should be able to do something other than read, because if you are bored of that book, and that’s the only book you have, you could do something else like math games ‐ do something else on the computer.”
Students must also be prepared for what to expect during testing. Another student expressed frustration
caused by an unexpected testing procedures: “We were practicing our test, so I was writing, and I gave it to my teacher and she put it in the shredder, and then when I came back I had to start all over again . . . I didn’t like it because it’s my work.”
Addressing the needs of all learners equitably was not always anticipated.
Scheduling for students who needed more time was mentioned as a challenge by several TCs and TAs. TCs
reported that underserved populations may have been disproportionately affected by the need to
schedule additional testing time, such as in these representative quotes when asked what did not go well
in the testing schedule:
“The amount of time that it took English language learners to take the test at the elementary level was horrific. These students took an average of 4 hours per test.”
“Addressing the needs of students who were exempt and those students who don’t regularly attend school.”
“Dealing with students who are chronically absent. I am still testing some of those students.”
Performance task window of 10 calendar days was too short.
TCs described the performance task scheduling as difficult, noting that the 10‐day testing window “was not realistic for an elementary school student taking their first ever computerized test to be able to complete the test in 10 calendar days. Students that were on field trips, or absent only one day ran the possibility of having their test timeout.” Another TC reported that “the 10 day expiration of the [performance task] tests was also challenging and we did not take that into consideration when initially scheduling testing.”
For 2015‐16, the Performance Task window has been extended to 20 days.
WHAT WENT WELL
Planning and preparing activities ahead of testing for students who complete tests earlier than their
peers and for students who are not testing.
Some TCs and TAs reported challenges managing students who finished tests earlier than their peers.
Other TCs reported having success with planned alternative student activities for these early finishers:
“We scheduled a 6 week term for all of our 11th graders. We did need to have some other activities for those students who finished early.”
Schools will also need to consider how these planned activities meet student instructional needs. This
may be a heightened consideration for the 2015‐16 SBA administration owing to the Oregon legislature
passing of House Bill 2655, the Student Assessment Bill of Rights. This bill requires that “[s]chool districts
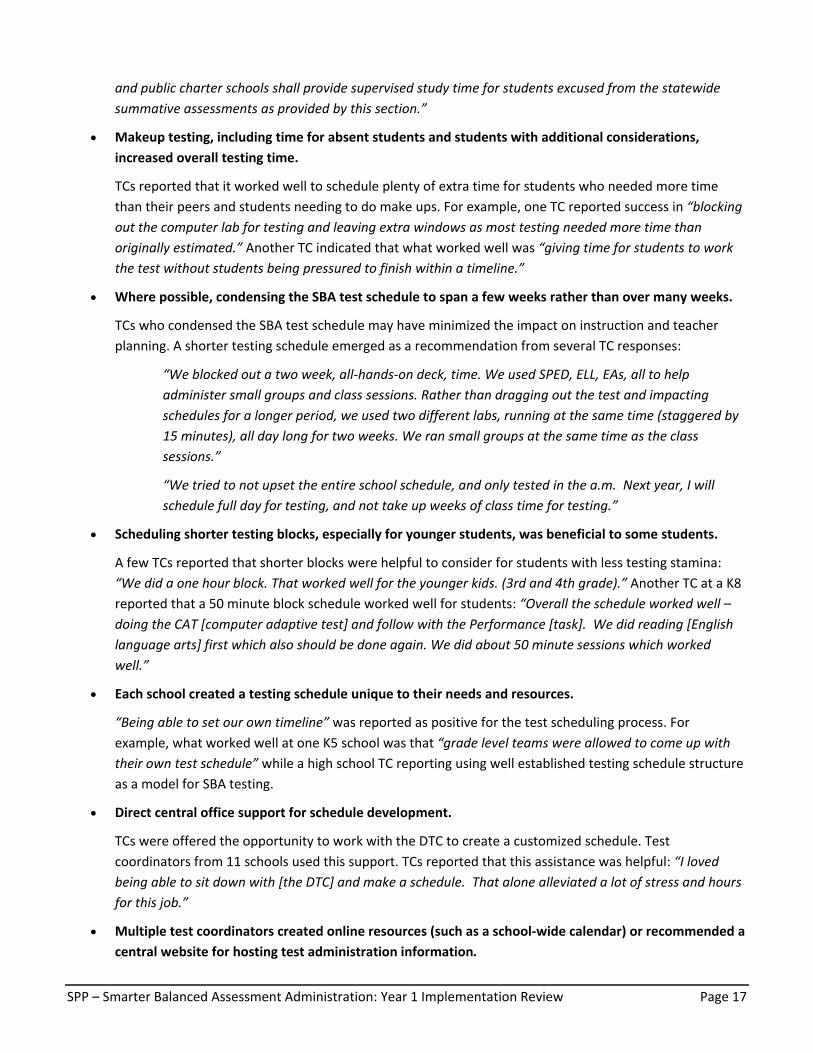
SPP – Smarter Balanced Assessment Administration: Year 1 Implementation Review Page 17
and public charter schools shall provide supervised study time for students excused from the statewide summative assessments as provided by this section.”
Makeup testing, including time for absent students and students with additional considerations,
increased overall testing time.
TCs reported that it worked well to schedule plenty of extra time for students who needed more time
than their peers and students needing to do make ups. For example, one TC reported success in “blocking out the computer lab for testing and leaving extra windows as most testing needed more time than originally estimated.” Another TC indicated that what worked well was “giving time for students to work the test without students being pressured to finish within a timeline.”
Where possible, condensing the SBA test schedule to span a few weeks rather than over many weeks.
TCs who condensed the SBA test schedule may have minimized the impact on instruction and teacher
planning. A shorter testing schedule emerged as a recommendation from several TC responses:
“We blocked out a two week, all‐hands‐on deck, time. We used SPED, ELL, EAs, all to help administer small groups and class sessions. Rather than dragging out the test and impacting schedules for a longer period, we used two different labs, running at the same time (staggered by 15 minutes), all day long for two weeks. We ran small groups at the same time as the class sessions.”
“We tried to not upset the entire school schedule, and only tested in the a.m. Next year, I will schedule full day for testing, and not take up weeks of class time for testing.”
Scheduling shorter testing blocks, especially for younger students, was beneficial to some students.
A few TCs reported that shorter blocks were helpful to consider for students with less testing stamina:
“We did a one hour block. That worked well for the younger kids. (3rd and 4th grade).” Another TC at a K8 reported that a 50 minute block schedule worked well for students: “Overall the schedule worked well – doing the CAT [computer adaptive test] and follow with the Performance [task]. We did reading [English language arts] first which also should be done again. We did about 50 minute sessions which worked well.”
Each school created a testing schedule unique to their needs and resources.
“Being able to set our own timeline” was reported as positive for the test scheduling process. For example, what worked well at one K5 school was that “grade level teams were allowed to come up with their own test schedule” while a high school TC reporting using well established testing schedule structure as a model for SBA testing.
Direct central office support for schedule development.
TCs were offered the opportunity to work with the DTC to create a customized schedule. Test
coordinators from 11 schools used this support. TCs reported that this assistance was helpful: “I loved being able to sit down with [the DTC] and make a schedule. That alone alleviated a lot of stress and hours for this job.”
Multiple test coordinators created online resources (such as a school‐wide calendar) or recommended a
central website for hosting test administration information.
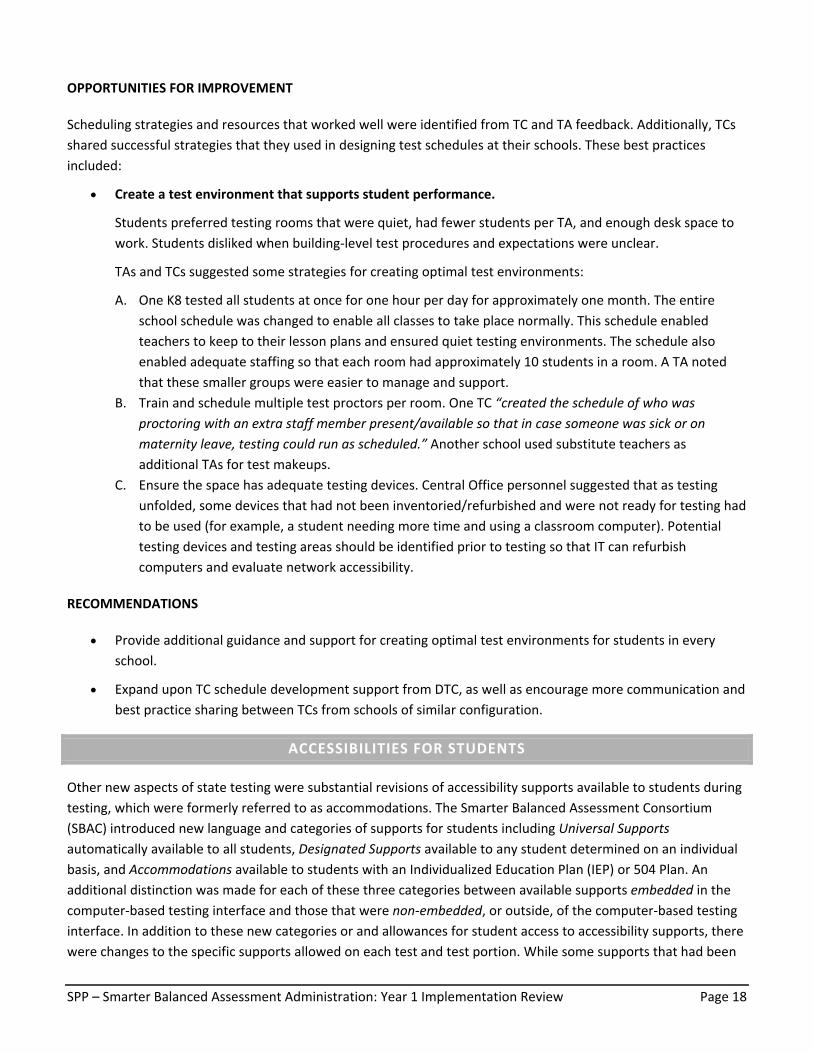
SPP – Smarter Balanced Assessment Administration: Year 1 Implementation Review Page 18
OPPORTUNITIES FOR IMPROVEMENT
Scheduling strategies and resources that worked well were identified from TC and TA feedback. Additionally, TCs
shared successful strategies that they used in designing test schedules at their schools. These best practices
included:
Create a test environment that supports student performance.
Students preferred testing rooms that were quiet, had fewer students per TA, and enough desk space to
work. Students disliked when building‐level test procedures and expectations were unclear.
TAs and TCs suggested some strategies for creating optimal test environments:
A. One K8 tested all students at once for one hour per day for approximately one month. The entire
school schedule was changed to enable all classes to take place normally. This schedule enabled
teachers to keep to their lesson plans and ensured quiet testing environments. The schedule also
enabled adequate staffing so that each room had approximately 10 students in a room. A TA noted
that these smaller groups were easier to manage and support.
B. Train and schedule multiple test proctors per room. One TC “created the schedule of who was proctoring with an extra staff member present/available so that in case someone was sick or on maternity leave, testing could run as scheduled.” Another school used substitute teachers as additional TAs for test makeups.
C. Ensure the space has adequate testing devices. Central Office personnel suggested that as testing
unfolded, some devices that had not been inventoried/refurbished and were not ready for testing had
to be used (for example, a student needing more time and using a classroom computer). Potential
testing devices and testing areas should be identified prior to testing so that IT can refurbish
computers and evaluate network accessibility.
RECOMMENDATIONS
Provide additional guidance and support for creating optimal test environments for students in every
school.
Expand upon TC schedule development support from DTC, as well as encourage more communication and
best practice sharing between TCs from schools of similar configuration.
ACCESSIBILITIES FOR STUDENTS
Other new aspects of state testing were substantial revisions of accessibility supports available to students during
testing, which were formerly referred to as accommodations. The Smarter Balanced Assessment Consortium
(SBAC) introduced new language and categories of supports for students including Universal Supports automatically available to all students, Designated Supports available to any student determined on an individual
basis, and Accommodations available to students with an Individualized Education Plan (IEP) or 504 Plan. An additional distinction was made for each of these three categories between available supports embedded in the computer‐based testing interface and those that were non‐embedded, or outside, of the computer‐based testing
interface. In addition to these new categories or and allowances for student access to accessibility supports, there
were changes to the specific supports allowed on each test and test portion. While some supports that had been
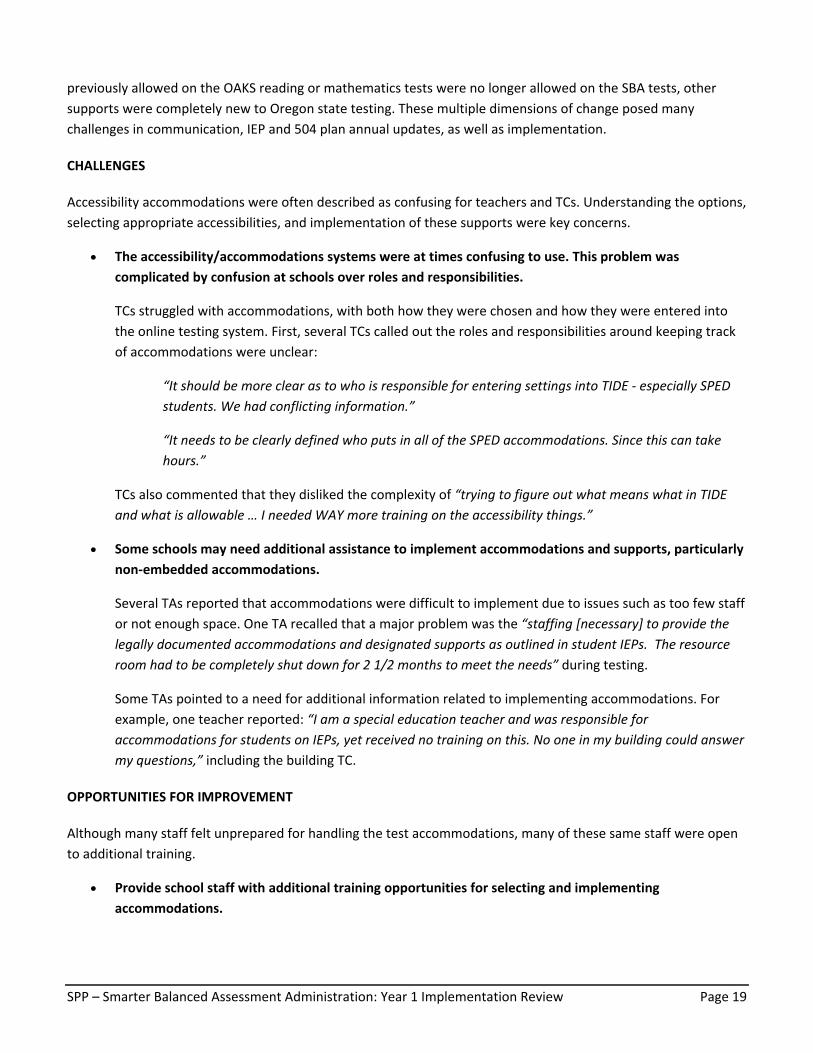
SPP – Smarter Balanced Assessment Administration: Year 1 Implementation Review Page 19
previously allowed on the OAKS reading or mathematics tests were no longer allowed on the SBA tests, other
supports were completely new to Oregon state testing. These multiple dimensions of change posed many
challenges in communication, IEP and 504 plan annual updates, as well as implementation.
CHALLENGES
Accessibility accommodations were often described as confusing for teachers and TCs. Understanding the options,
selecting appropriate accessibilities, and implementation of these supports were key concerns.
The accessibility/accommodations systems were at times confusing to use. This problem was
complicated by confusion at schools over roles and responsibilities.
TCs struggled with accommodations, with both how they were chosen and how they were entered into
the online testing system. First, several TCs called out the roles and responsibilities around keeping track
of accommodations were unclear:
“It should be more clear as to who is responsible for entering settings into TIDE ‐ especially SPED students. We had conflicting information.”
“It needs to be clearly defined who puts in all of the SPED accommodations. Since this can take hours.”
TCs also commented that they disliked the complexity of “trying to figure out what means what in TIDE and what is allowable … I needed WAY more training on the accessibility things.”
Some schools may need additional assistance to implement accommodations and supports, particularly
non‐embedded accommodations.
Several TAs reported that accommodations were difficult to implement due to issues such as too few staff
or not enough space. One TA recalled that a major problem was the “staffing [necessary] to provide the legally documented accommodations and designated supports as outlined in student IEPs. The resource room had to be completely shut down for 2 1/2 months to meet the needs” during testing.
Some TAs pointed to a need for additional information related to implementing accommodations. For
example, one teacher reported: “I am a special education teacher and was responsible for accommodations for students on IEPs, yet received no training on this. No one in my building could answer my questions,” including the building TC.
OPPORTUNITIES FOR IMPROVEMENT
Although many staff felt unprepared for handling the test accommodations, many of these same staff were open
to additional training.
Provide school staff with additional training opportunities for selecting and implementing
accommodations.
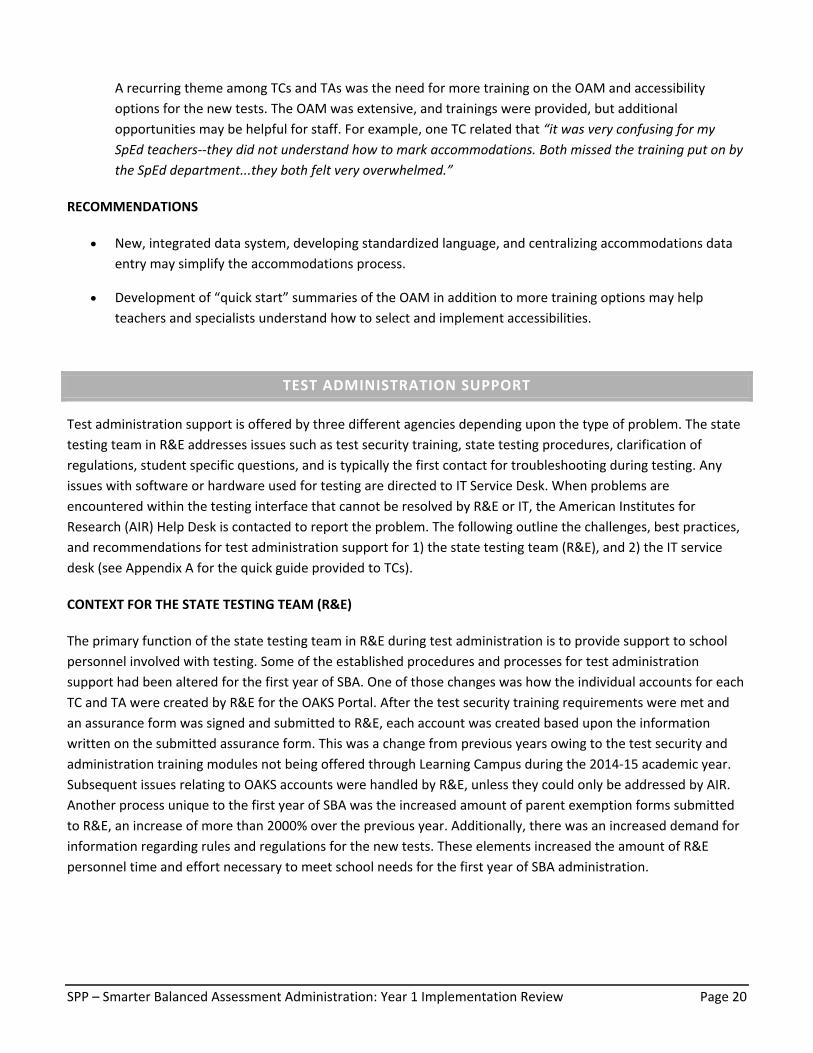
SPP – Smarter Balanced Assessment Administration: Year 1 Implementation Review Page 20
A recurring theme among TCs and TAs was the need for more training on the OAM and accessibility
options for the new tests. The OAM was extensive, and trainings were provided, but additional
opportunities may be helpful for staff. For example, one TC related that “it was very confusing for my SpEd teachers‐‐they did not understand how to mark accommodations. Both missed the training put on by the SpEd department...they both felt very overwhelmed.”
RECOMMENDATIONS
New, integrated data system, developing standardized language, and centralizing accommodations data
entry may simplify the accommodations process.
Development of “quick start” summaries of the OAM in addition to more training options may help
teachers and specialists understand how to select and implement accessibilities.
TEST ADMINISTRATION SUPPORT
Test administration support is offered by three different agencies depending upon the type of problem. The state
testing team in R&E addresses issues such as test security training, state testing procedures, clarification of
regulations, student specific questions, and is typically the first contact for troubleshooting during testing. Any
issues with software or hardware used for testing are directed to IT Service Desk. When problems are
encountered within the testing interface that cannot be resolved by R&E or IT, the American Institutes for
Research (AIR) Help Desk is contacted to report the problem. The following outline the challenges, best practices,
and recommendations for test administration support for 1) the state testing team (R&E), and 2) the IT service
desk (see Appendix A for the quick guide provided to TCs).
CONTEXT FOR THE STATE TESTING TEAM (R&E)
The primary function of the state testing team in R&E during test administration is to provide support to school
personnel involved with testing. Some of the established procedures and processes for test administration
support had been altered for the first year of SBA. One of those changes was how the individual accounts for each
TC and TA were created by R&E for the OAKS Portal. After the test security training requirements were met and
an assurance form was signed and submitted to R&E, each account was created based upon the information
written on the submitted assurance form. This was a change from previous years owing to the test security and
administration training modules not being offered through Learning Campus during the 2014‐15 academic year.
Subsequent issues relating to OAKS accounts were handled by R&E, unless they could only be addressed by AIR.
Another process unique to the first year of SBA was the increased amount of parent exemption forms submitted
to R&E, an increase of more than 2000% over the previous year. Additionally, there was an increased demand for
information regarding rules and regulations for the new tests. These elements increased the amount of R&E
personnel time and effort necessary to meet school needs for the first year of SBA administration.
SPP – Smarter Balanced Assessment Administration: Year 1 Implementation Review Page 21
CHALLENGES FOR THE STATE TESTING TEAM (R&E)
Managing paperwork and data entry (e.g., for student exemptions and assurance forms) was time‐
consuming at both the school and central office levels.
Student exemptions, also known as “opt outs,” posed a burden for both school and central testing
administration. School sites had to manage paperwork, and a central office assessment clerk had to enter
exemption information into two databases, one for the testing interface and the other for internal
tracking. Additionally, parents and schools submitted forms through a variety of means, including post,
PONY, email, fax, and in person. These forms were often submitted to a variety of individuals at the
schools and departments at the central office, which made identifying and eliminating duplicates a time
consuming process.
Additionally, collecting and recording assurance of test security form information was logistically difficult
because of the amount of paperwork involved. TCs also felt this burden, and one suggested moving digital
assurance forms if possible.
WHAT WENT WELL
Test coordinators identified several helpful practices that enabled them to manage testing implementation at
their schools. These practices included ongoing information and resource sharing directly from central office
personnel and the creation of school‐wide central assessment calendars to share with all school staff.
Continue to provide regular update emails to TCs.
The majority of TCs reported that ongoing communication from the DTC with updates, frequently asked
questions, deadlines, and solutions to common issues were very helpful. For example, one TC stated:
“[the DTC’s] weekly emails with updates and information were very helpful in digesting all the new information and deadlines. This on‐going training is very helpful in addition to any formal trainings.”
Maintain R&E state testing email and phone support.
TCs reported that receiving quick responses via email and phone from central office staff, primarily the
DTC, was vital. There was nearly universal praise for responsiveness of DTC from central office and school
personnel. One TC statement captured this feedback well: “The [DTC] was so fast at returning calls or oftentimes was available to actually answer the calls right in the moment of stress. She was kind and patient and I really appreciated her support.”
Improvements could still have been made to decrease response time. One TC suggested that “Sometimes it took too long to get a response. The most beneficial support is quick answers to questions that pop‐up. You should either have a designated hotline or email that guarantees a rapid response, especially when you get close‐to and in the testing window.” Support from additional R&E as well as System Planning &
Performance staff may enable quicker response times.
SPP – Smarter Balanced Assessment Administration: Year 1 Implementation Review Page 22
OPPORTUNITIES FOR IMPROVEMENT
Schools may create a shared assessment calendar (e.g., via Google Calendar) for school as a reference
for staff and families.
Specific testing dates vary by school. Sharing these dates with teachers and families online via a master
calendar went well at multiple schools because it enabled better communication between the TC and
teachers and helped teachers plan their lessons around testing. A public assessment calendar may also
assist families in planning and preparing for testing.
Make TCs aware of existing resources and material, such as test cards or one‐on‐one support.
The practice of creating test cards with names and IDs of students was reported by TCs as helpful.
However, because some resources were created as testing needs arose, not all TCs or TAs knew about all
available central office supports, including test cards: “I had already prepared cards by the time the district cards came. I would have liked to know they were coming earlier and saved myself the trouble.” A comprehensive guide to available resources (including those developed during the rollout this year) will
be made available to TCs. Additionally, direct support was offered to TCs, but not all schools took
advantage of the offer. Incorporating one‐on‐one support as a part of the TC expectations may build
better communication and TC use of available resources.
RECOMMENDATIONS FOR THE STATE TESTING TEAM
Create a district‐wide assessment calendar for next school year as a resource for schools and families, and
encourage school specific testing dates to be widely communicated to their family community.
Continue and expand upon support and communication efforts from the R&E State Testing Team.
CONTEXT FOR THE IT SERVICE DESK
Support offered to schools by IT was expanded for this first year of SBA due to the deployment of new technology
carts, refurbishing existing devices, and providing listening devices for the SBA ELA tests. IT pushed out the OAKS
Portal Secure Browser updated for the 2015 state testing, which automatically installed the browser on all PPS‐
managed devices. The technology carts deployed contained Chromebooks already configured for testing. In
addition, posters describing how to set up new equipment carts for testing were affixed to each cart. A guide for
using Chromebooks was distributed with each new cart. This guide included how to load the browser and how to
use the keyboard, shortcuts, and track pad. IT Support email and phone queues were triaged by Service Desk
Level 1 staff during testing to ensure that any school lab or SBA‐related ticket was immediately escalated to the
field technician for that school. Resolution of these tickets was made a priority for field technicians and in‐school
site support. The IT Service Desk often fielded calls and emails reporting technical problems encountered during
testing. The DTC was also a regular attendee of IT Service Desk team meetings to maintain communication
regarding support to schools, common problems, and updates to the testing platform from AIR.
SPP – Smarter Balanced Assessment Administration: Year 1 Implementation Review Page 23
IT was a pivotal factor impacting the testing experience for staff and students. Some of the challenges that
students, TAs, and TCs identified included IT issues (both hardware and software related), TCs feeling
underprepared for handling IT issues, and the need for more onsite IT support.
CHALLENGES FOR THE IT SERVICE DESK
OAKS portal issues affected the testing experience for students and staff.
Students from several different grades reported technical issues with the testing interface or computers
that negatively affected their testing experience. For example, one 11th grade student reported: “I liked how I could type instead of writing by hand, but the word processor was kind of bad. When I tried to delete more than a few words, it would ask you, ‘Are you sure you want to delete this much?’ Then my computer would freeze up for too long. Then I would have to start all over again because it would just freeze up sometimes.”
TCs and TAs reported similar issues with the test freezing. A TC from a K5, for example, reported that “we had keyboards freezing up which required closing the browser and having to login again. This was highly disruptive to students as they were composing answers at the time the keyboards stopped working.”
Some TCs felt that they had to take on IT troubleshooting responsibilities for which they needed more
support to handle.
Feedback indicated the need for better communication about existing IT supports. Several TCs wanted
additional IT troubleshooting support. A TC from a K‐5 reported that “tech couldn’t solve most of the problems and I was left to deal with them myself.” Similarly, a TC from a K‐8 felt that the “tech side needs to be more supported. Expecting the TC to also handle all of the Tech side and teach all day is not logical.”
Schools with in‐building IT staff reported that these staff played a key role in test implementation,
whereas other TCs reported that they did not have adequate onsite access to technical support.
A high school TC praised their in‐building tech support: “Our Tech department was fantastic at maintaining and building the labs needed for test participants. She moved Chromebooks from classrooms to temporary test labs to compensate for lack of lab space.” Similarly, a TC from a K‐5 stated, “ [I] worked with our part‐time person to solve all technical matters or dealt with them directly myself.”
Schools without this support felt the need for additional in‐person assistance during testing. For example,
a TC from a K‐8 suggested that “someone from IT should go to each school to make sure the computers are updated and ready for testing.” An TC from an alternative program state there was the need for “a better system of accountability in place for IT. Have IT assigned and regularly checking in at school sites on a monthly or weekly basis so that support can be just in time and on‐going which currently does NOT happen.” Communicating with TCs about existing IT field support may be one way to address this issue.
SPP – Smarter Balanced Assessment Administration: Year 1 Implementation Review Page 24
WHAT WENT WELL
Prioritization of SBA IT Service Desk tickets for quicker response.
IT representatives believed that the prioritization of SBA related Service Desk tickets positively impacted
response time. Although there is no way to gauge the impact of this practice directly, those directly
involved reported that it made responding to and tracking tickets more efficient within the IT Service
Desk.
The PPS IT decision to discourage use of tablets for testing (except for certain accommodations)
prevented support issues.
Many technical problems that were reported by AIR and other districts across Oregon that used tablets
for testing were avoided in PPS owing to the IT decision to not support that type of device for testing.
Additionally, tablets at schools were free to be used for instructional purposes during testing.
District Test Coordinator attendance at IT Service Desk meetings facilitated communication.
The DTC attended weekly IT Service Desk meetings, during which common SBA‐related technology issues
were discussed and solutions provided. The DTC could then communicate these common problems and
solutions to school TCs as well as share updates with the IT Service Desk members.
RECOMMENDATIONS FOR THE IT SERVICE DESK
Leverage existing systems and resources for IT support and consider how to connect school staff with the
IT support available to them.
Develop IT guides for TCs that include common issues, solutions, and who to contact for additional
support.
COMMUNICATIONS
Effective dissemination of SBA administration processes and regulation information was a priority, but
administration information was not the only communication consideration for the first year of SBA
administration. National and local press attention on Common Core State Standards aligned assessments and the
parental right to exempt their child from testing brought state testing processes into public focus. The impact of
political consideration of the SBA tests at the district and school levels resulted in new communication challenges
that led to multiple cross‐departmental actions. Frequently Asked Questions documents were created by R&E,
ICA, and IT addressing common questions. Parent informational materials were collaboratively created by R&E
and Communications departments to address anticipated concerns about the new tests. Presentations to school
staff and Parent/Teacher Associations (PTAs) were led by representatives from R&E to address school personnel
and family questions in person. The materials from the public informational presentations were made available to
TCs for their use with school colleagues. Despite these efforts, the political debate over SBA had a direct impact
on administration efforts at schools.
SPP – Smarter Balanced Assessment Administration: Year 1 Implementation Review Page 25
CHALLENGES
Addressing informational needs and managing communication within a larger political context were key
communication challenges that emerged from focus groups and survey data.
The political context of Smarter Balanced was a challenge to navigate while communicating SBA
operational administration information with school personnel and families.
Owing to SBA emerging as a highly charged topic embedded within a larger political context, some TCs
expressed the feeling that their role in implementing the operational aspects of testing at their schools
placed them in an awkward position with their teacher colleagues. This conflict of test procedures and
politics was expressed by many TCs directly to the DTC throughout testing as well as in survey responses.
Indicative of this sentiment, a TC stated that “teachers and parents who were philosophically/politically opposed to testing made the whole season pretty unbearable.” One TC suggested that it would have been helpful to have “more communication coming from BESC and less for [TCs] to share. It sometimes felt like we were the ‘bad guys’ because we were sharing info that was not readily accepted or appreciated. Overall, teachers were very negative throughout this entire testing year.”
Asymmetric information and prevalence of misinformation led to confusion about testing procedures
and the consequences of test outcomes.
Some TCs reported that they wanted additional support in communicating with their schools about the
test. Some TCs suggested a centralized source for testing information, such as a website, accessible to all
TCs to retrieve and post new information. For example, one TC suggested that “maybe teachers should have been informed about the test requirements at the District level. It is a little hard to ‘sell’ the test and reassure teachers about the test.”
Many TAs expressed a variety of requests and concerns indicating a need for additional information
related to the test content and use of the results. One teacher mentioned that “there are no standards” related to Smarter Balanced, despite the tests being aligned to the Common Core State Standards.
Another expressed concern that test results would have an effect on teacher evaluations: “Judging whole schools and teachers based on this one test is unacceptable and unfair. I’d like there not to be a punitive measure, under the guise of accountability, for ‘failing’ tests.” Many of these comments indicated
asymmetric understanding of the tests and the intended, appropriate use of results. Confusion over issues
such as these suggests the need for more communication about basic facts and answers to common
questions.
OPPORTUNITIES FOR IMPROVEMENT
Earlier in the process, determine the unified PPS stance on SBA.
In the first year of implementation, communication efforts were planned in advance but were drastically
revised in response to feedback from the Board, PAT leadership, and other district leadership. As a result,
there was less time to create new or adjust existing informational materials for families and schools. To
SPP – Smarter Balanced Assessment Administration: Year 1 Implementation Review Page 26
better serve the communication needs of our communities, stakeholders must develop a unified PPS
communication approach to SBA for future administrations.
Work with school administrators to better support TCs, TAS, and teachers during the testing process.
TCs who felt supported by their school administrators generally reported a positive testing experience at
their schools. For example, at one high school, it was helpful to have “an administrator really familiar with the process” who was “able to discuss all of this with parents who had questions and/or comments on the SBAC testing as it was happening.” Support and communication with school administrators was helpful in
terms of allocating enough time to train TAs. Several TCs mentioned that their principals enabled a
smooth process by providing additional time during staff meetings to address SBA administration
questions from TAs and staff.
Although many TCs reported that their administrators were instrumental in implementing the tests, lack
of support from some school administrators was a challenge at some schools. A TC suggestion to garner
more support from the school administration was “informing the principals of the importance of the testing schedule so that more assistance and leadership would convey the value and importance to the staff.”
RECOMMENDATIONS
Begin communication planning earlier in the academic year and explore more ways to disseminate
consistent messages and information about SBA.
Create a centralized testing website for communicating with schools and families.
RECOMMENDATIONS
The following section summarizes the recommendations from this report and discusses efforts that are currently
underway to address some of the challenges that emerged as a result of this investigation.
CLARITY AND USABILITY OF TRAINING MATERIALS
1. Create quick reference guides and summaries of relevant portions of the TAM, OAM, and user guides that
address frequently asked questions by TCs and TAs.
Development of “quick start” summaries of the OAM in addition to trainings may help teachers and
specialists understand how to select and implement accommodations. These materials would need to
include both easy‐to‐use quick summaries that direct TCs to specific sections of the TAM so that they can
easily seek out information. TA versions of the TAM and OAM that address specific test, or test portion,
they are to administer would also be helpful.
One of the most frequent requests from TAs and TCs was a “translation” of the OAM into a condensed,
simplified format. Such a resource could be integrated into training for school staff. Central office special
SPP – Smarter Balanced Assessment Administration: Year 1 Implementation Review Page 27
education staff may also explore options for creating a simplified tool or guidelines for teachers to assign
accommodations to students.
Currently, work has begun to prepare and provide TCs with additional scripts, informational materials,
and training resources relating to all essential test administration information. To this end, each TC this
year will receive a binder containing resources including TA training materials, quick reference guides, and
room to add school‐specific information for testing schedule planning.
2. Develop IT guides for TCs that include common issues, solutions, and who to contact for additional support.
Multiple tiers of technical support were available during testing, including R&E, central office IT, and AIR
software support. However, knowing who to contact for help on a specific problem depended on an
understanding of which tier of support could address which technical issues. More training on how to
seek support, as well as how to handle some of the most frequent IT issues, could better support TCs
during testing.
3. Provide TCs a single online location that houses supplemental informational materials as well as
announcements of supports accessible to every TC.
Useful information was provided in the weekly email updates written by the DTC, but that information
was not archived in a searchable format. Updates are currently planned for the R&E state assessment and
test administration pages to provide a single online source of information for TCs and TAs.
4. Group TCs during required face‐to‐face trainings and/or optional working sessions with TCs from schools
with like grade configurations.
Grouping in‐person TC trainings by grade level/school configuration will better facilitate sharing best
practices and addressing grade‐specific problems. This format would encourage a more action‐oriented
and productive face‐to‐face training. A work session was arranged during the first year administration for
high school TCs for this purpose, and those who participated found it to be very helpful. Currently, the
2015‐16 required TC training will be offered multiple times with sessions designed for school
configurations of K‐5, K‐8, 6‐8, and high school.
AVAILABILITY OF FUNCTIONING TECHNOLOGY
5. Consider investigating peripheral needs at each school and how to best invest in and distribute equipment.
IT was provided funds from the Board in Resolution 3 in May 2015 to begin refreshing all high school labs
and libraries. The IT department is working closely with principals and site technology staff to plan and
execute this program; however, funding was not sufficient to increase device counts at these locations.
Thus, in the 2015‐16 school year, high schools will test using the same student‐to‐computer ratio as in
2014‐15.
Requests to remediate issues at all K‐8, middle, and elementary school labs and libraries was requested
for fiscal year 2015‐16; however, this request was not approved by the Board. At this time, no funding
exists to further replace, refurbish, or repair equipment. All school‐based technology funding requests
SPP – Smarter Balanced Assessment Administration: Year 1 Implementation Review Page 28
were not approved. Students will test using the same equipment as the 2014‐15 testing administration.
All schools were certified in 2014‐15 as having a 5:1 student‐to‐device ratio with the devices that were
certified by IT; however, much of the equipment schools used in 2014‐15 was not certified and has gone
beyond end‐of‐life/end‐of‐service.
R&E has purchased additional earbuds, as well as over‐the‐head earphones for younger students, to
distribute to schools for 2015‐16 testing. R&E will continue to assess the need for additional testing
listening devices. Furthermore, if SBAC incorporates speaking items into future versions of the tests, this
will require full headsets with microphones for testing. In this case, the central office will need to develop
a plan for how to provide high‐quality headsets to schools that meet the needs of students at every grade
level.
Students may be more comfortable testing on laptops if they have access to mice. Mice, rather than the
Chromebook touch pads, may be easier for students to use to manipulate onscreen objects, which are
common in the technology enhanced items on the SBA tests. Providing at least one set of headphones
and one mouse per Chromebook may be a way to ensure there are adequate peripherals for each device.
These technological needs should be considered during future budget allocations. Note that additional
budget funding from Fall balancing or other resolutions, although helpful in long‐term project work, is
made available for expenditure in January through February, which is insufficient time for the IT
department and their vendor partners to purchase, configure, and deliver replacement or additional
equipment. Remediation of testing equipment condition and availability would ideally occur with the
fiscal cycle to allow viable time for these projects to support the SBA Spring testing window. Although
changes to the student‐to‐device ratio for 2015‐16 testing is not possible, future budget allocations could
improve the ratio for subsequent testing years.
6. Continue IT efforts to inventory and refurbish existing devices.
This year marked the first year of IT Strikeforce, which involved central IT staff visiting schools and
conducting an inventory of functional and non‐functional technologies. Given that aging or broken
technology is an ongoing issue within the district, a second iteration of this process should occur next
year. Some TCs and TAs reported that they still had issues with obsolete technology or did not know that
IT had evaluated all of their computers. One solution may be to develop a better process for
communication between TCs and IT staff.
The continued need for additional devices is within a larger contextual need for sustained and sustainable
instructional technology planning. For subsequent years, funding commitments for an IT sustainability
plan will be crucial.
SUPPORT FOR SCHOOLS IN DEVELOPING SCHEDULES, TEST ENVIRONMENTS, AND PREPARING STUDENTS
7. Provide additional support for creating optimal test environments in schools.
Based on suggestions and best practices from TCs and TAs, develop informational resources on specific,
actionable items for creating testing spaces.
SPP – Smarter Balanced Assessment Administration: Year 1 Implementation Review Page 29
8. Continue to provide schedule development support for schools.
TCs faced multiple challenges in developing test schedules, including unfamiliarity with the new test,
space and staffing constraints, the need to maintain instructional time, and other concerns specific to
their schools. Support from central office, including one‐on‐one schedule development with the DTC,
were reported as helpful in this process. Best practices for scheduling collected in this report can also be
disseminated to TCs as capacity to create test schedules is developed among experienced TCs.
9. New, integrated data system, developing standardized language, and centralizing accommodations data
entry may simplify the process for identifying and enabling accessibilities.
In 2014‐15, PPS used the Oregon Special Education System (OR SPED) to keep electronic records of IEPs
and accommodations. These accommodations would also have to be entered into the TIDE system by
SPED teachers, TCs, and the DTC. In 2015‐16, because the accommodations field accepted text,
nonstandard and unpermitted accommodations could be entered. PPS is implementing the Special
Education (SE) module to Synergy, their electronic student information system. The change to a new
system provides an opportunity for:
Centralizing IEP/accommodations data entry by data clerks.
Training for teachers and data entry clerks on standardized IEP/accommodations language that aligns
to the Oregon Accessibility Manual.
Exploring Synergy SE module capabilities such as standardizing accommodations fields with restricted
fields (such as dropdown menus).
10. Provide direct instruction for 21st Century skills such as how to type, use a mouse, and read and navigate
digital text.
Students, TAs, and TCs suggested that many students particularly those in lower grades, were not fully
prepared to use the computer adaptive tests. Preparing students to test should also include computer
skills instruction.
11. Continue professional development of Common Core aligned instruction.
Feedback from students and TAs suggested that SBA included material that had not been covered in
classrooms. This suggests that efforts should continue to align instruction and curriculum to the Common
Core State Standards.
12. Create a district‐wide assessment calendar for next school year as a resource for schools and families.
Portland Public Schools is currently restructuring their website and developing new content to provide a
central assessment calendar.
SPP – Smarter Balanced Assessment Administration: Year 1 Implementation Review Page 30
TIMELY TECHNICAL SUPPORT DURING TESTING
13. Continue support and communication efforts from Central Office.
Weekly updates should continue with the added feature of archiving them in a way that is searchable by
TCs. Cross‐train for school support during testing from additional R&E and System Planning &
Performance staff to increase consistency as well as reduce waiting for responses to questions.
14. Leverage existing systems/resources for IT support and consider how to connect school staff with the IT
support available to them.
Technical needs during testing put pressure on IT Service Desk staff as well as TCs and school
administrators. On demand IT support was requested. For example, one TC suggested a dedicated
“testing‐only” IT Service Desk line. Multiple schools indicated that they would have preferred more in
person rather than remote IT support. In‐person IT support does exist for schools, but the need for
additional communication and training on how to access these supports has been widely requested by
school personnel.
15. Continue R&E/IT Service Desk meetings during testing.
The District Test Coordinator attendance at IT Service Desk meetings facilitated communication between
R&E and IT as testing proceeded.
TRANSPARENCY OF COMMUNICATION EFFORTS
16. Begin communications planning earlier in the academic year and explore more ways to disseminate
information regarding SBA.
Many common questions, concerns, and misconceptions were identified over the course of the first year
of implementation. The collaborative cross‐departmental communication efforts including
Communications, R&E, and ICA should continue and plan to address these information needs during
future test administrations. This should include preparing content in anticipation of frequently asked
questions and developing strategies for delivering that information in user‐friendly ways. This could also
include more centralized information and messaging disseminated directly from the District to school staff
and families.
17. Create a centralized testing website for communicating with schools and families.
Updates are currently planned for the R&E state assessment and test administration pages to provide a
single online source of information for TCs and TAs to address the need for a centralized testing resource
relevant to school personnel.
Currently, work is underway to develop a parent‐oriented assessment website intended to provide
essential information about all tests administered across PPS, including Smarter Balanced. Information
planned to be posted on these public pages include a testing calendar for the 2015‐16 school year, basic
information about each test, general facts about how test scores are used in PPS, and how to interpret
individual student test scores.
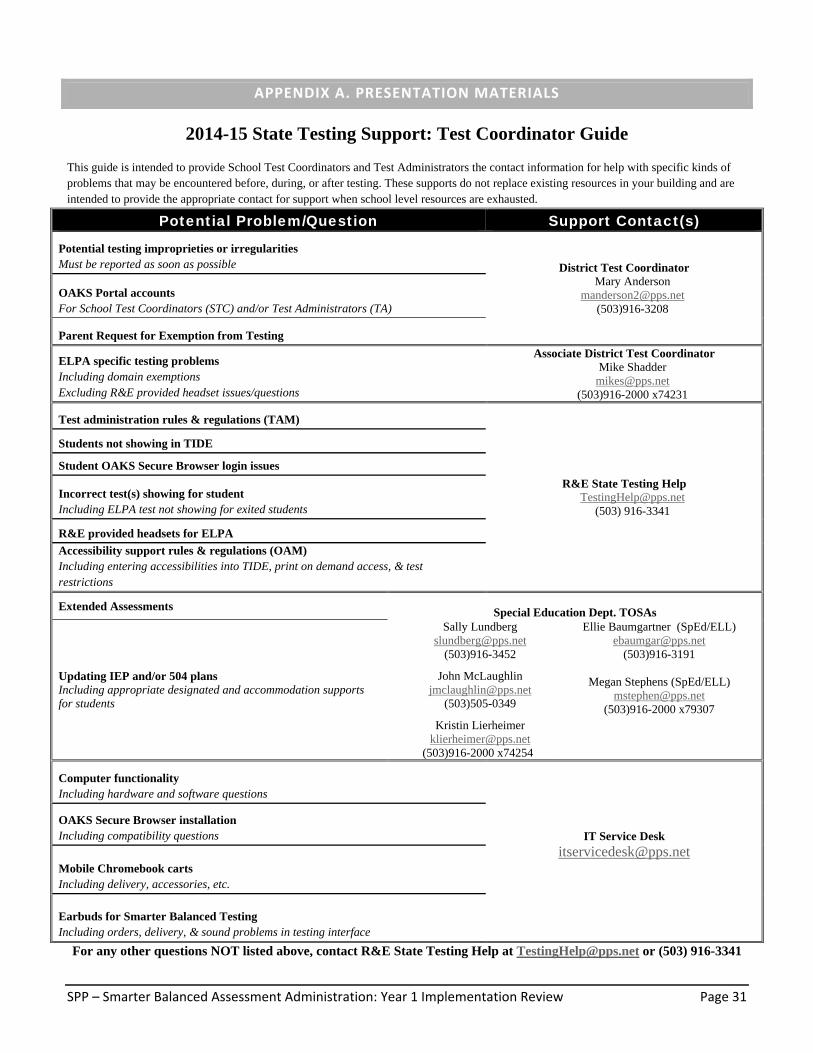
SPP – Smarter Balanced Assessment Administration: Year 1 Implementation Review Page 31
APPENDIX A. PRESENTATION MATERIALS
2014-15 State Testing Support: Test Coordinator Guide
This guide is intended to provide School Test Coordinators and Test Administrators the contact information for help with specific kinds of problems that may be encountered before, during, or after testing. These supports do not replace existing resources in your building and are intended to provide the appropriate contact for support when school level resources are exhausted.
Potential Problem/Question Support Contact(s)
Potential testing improprieties or irregularities Must be reported as soon as possible District Test Coordinator
Mary Anderson [email protected]
(503)916-3208 OAKS Portal accounts For School Test Coordinators (STC) and/or Test Administrators (TA)
Parent Request for Exemption from Testing
ELPA specific testing problems Including domain exemptions Excluding R&E provided headset issues/questions
Associate District Test Coordinator Mike Shadder
[email protected] (503)916-2000 x74231
Test administration rules & regulations (TAM)
R&E State Testing Help [email protected]
(503) 916-3341
Students not showing in TIDE
Student OAKS Secure Browser login issues
Incorrect test(s) showing for student Including ELPA test not showing for exited students
R&E provided headsets for ELPA
Accessibility support rules & regulations (OAM) Including entering accessibilities into TIDE, print on demand access, & test restrictions
Extended Assessments Special Education Dept. TOSAs
Updating IEP and/or 504 plans Including appropriate designated and accommodation supports for students
Sally Lundberg [email protected]
(503)916-3452
John McLaughlin [email protected]
(503)505-0349
Kristin Lierheimer [email protected]
(503)916-2000 x74254
Ellie Baumgartner (SpEd/ELL) [email protected]
(503)916-3191
Megan Stephens (SpEd/ELL) [email protected]
(503)916-2000 x79307
Computer functionality Including hardware and software questions
IT Service Desk [email protected]
OAKS Secure Browser installation Including compatibility questions
Mobile Chromebook carts Including delivery, accessories, etc.
Earbuds for Smarter Balanced Testing Including orders, delivery, & sound problems in testing interface
For any other questions NOT listed above, contact R&E State Testing Help at [email protected] or (503) 916-3341
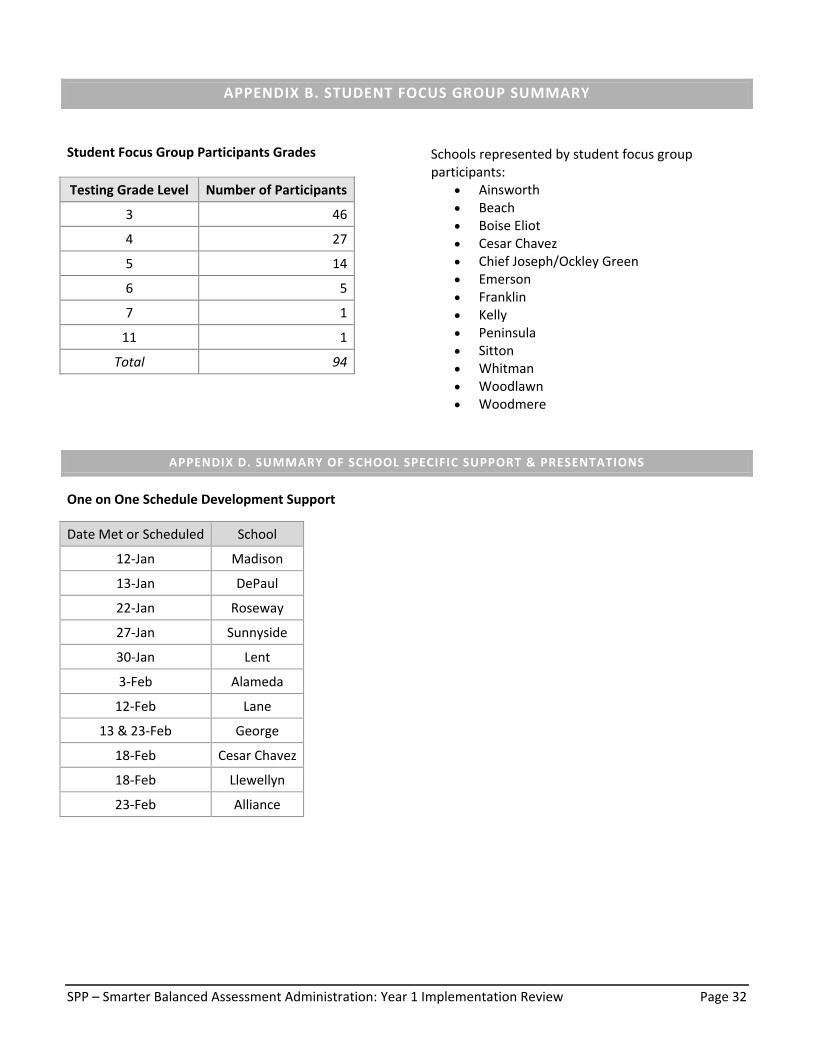
SPP – Smarter Balanced Assessment Administration: Year 1 Implementation Review Page 32
APPENDIX B. STUDENT FOCUS GROUP SUMMARY
Student Focus Group Participants Grades
Testing Grade Level Number of Participants
3 46
4 27
5 14
6 5
7 1
11 1
Total 94
Schools represented by student focus group participants:
Ainsworth Beach Boise Eliot Cesar Chavez Chief Joseph/Ockley Green Emerson Franklin Kelly Peninsula Sitton Whitman Woodlawn Woodmere
APPENDIX D. SUMMARY OF SCHOOL SPECIFIC SUPPORT & PRESENTATIONS
One on One Schedule Development Support
Date Met or Scheduled School
12‐Jan Madison
13‐Jan DePaul
22‐Jan Roseway
27‐Jan Sunnyside
30‐Jan Lent
3‐Feb Alameda
12‐Feb Lane
13 & 23‐Feb George
18‐Feb Cesar Chavez
18‐Feb Llewellyn
23‐Feb Alliance
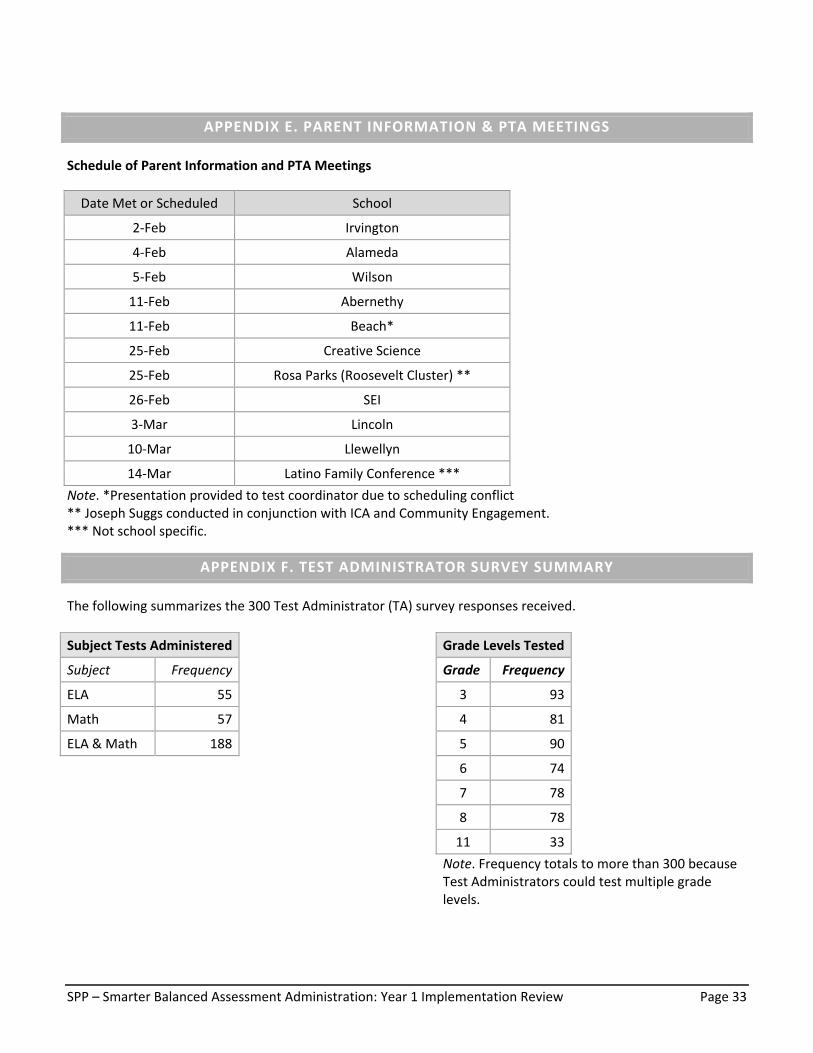
SPP – Smarter Balanced Assessment Administration: Year 1 Implementation Review Page 33
APPENDIX E. PARENT INFORMATION & PTA MEETINGS
Schedule of Parent Information and PTA Meetings
Date Met or Scheduled School
2‐Feb Irvington
4‐Feb Alameda
5‐Feb Wilson
11‐Feb Abernethy
11‐Feb Beach*
25‐Feb Creative Science
25‐Feb Rosa Parks (Roosevelt Cluster) **
26‐Feb SEI
3‐Mar Lincoln
10‐Mar Llewellyn
14‐Mar Latino Family Conference ***
Note. *Presentation provided to test coordinator due to scheduling conflict ** Joseph Suggs conducted in conjunction with ICA and Community Engagement. *** Not school specific.
APPENDIX F. TEST ADMINISTRATOR SURVEY SUMMARY
The following summarizes the 300 Test Administrator (TA) survey responses received.
Subject Tests Administered
Subject Frequency
ELA 55
Math 57
ELA & Math 188
Grade Levels Tested
Grade Frequency
3 93
4 81
5 90
6 74
7 78
8 78
11 33
Note. Frequency totals to more than 300 because Test Administrators could test multiple grade levels.
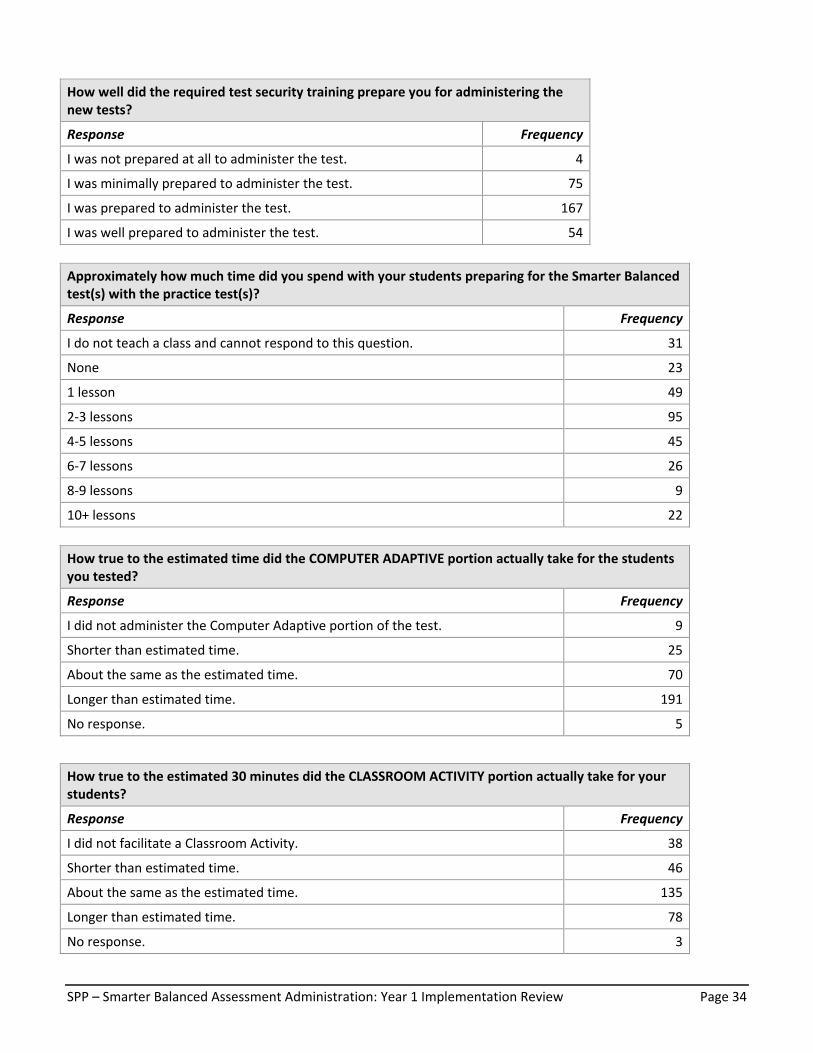
SPP – Smarter Balanced Assessment Administration: Year 1 Implementation Review Page 34
How well did the required test security training prepare you for administering the new tests?
Response Frequency
I was not prepared at all to administer the test. 4
I was minimally prepared to administer the test. 75
I was prepared to administer the test. 167
I was well prepared to administer the test. 54
Approximately how much time did you spend with your students preparing for the Smarter Balanced test(s) with the practice test(s)?
Response Frequency
I do not teach a class and cannot respond to this question. 31
None 23
1 lesson 49
2‐3 lessons 95
4‐5 lessons 45
6‐7 lessons 26
8‐9 lessons 9
10+ lessons 22
How true to the estimated time did the COMPUTER ADAPTIVE portion actually take for the students you tested?
Response Frequency
I did not administer the Computer Adaptive portion of the test. 9
Shorter than estimated time. 25
About the same as the estimated time. 70
Longer than estimated time. 191
No response. 5
How true to the estimated 30 minutes did the CLASSROOM ACTIVITY portion actually take for your students?
Response Frequency
I did not facilitate a Classroom Activity. 38
Shorter than estimated time. 46
About the same as the estimated time. 135
Longer than estimated time. 78
No response. 3
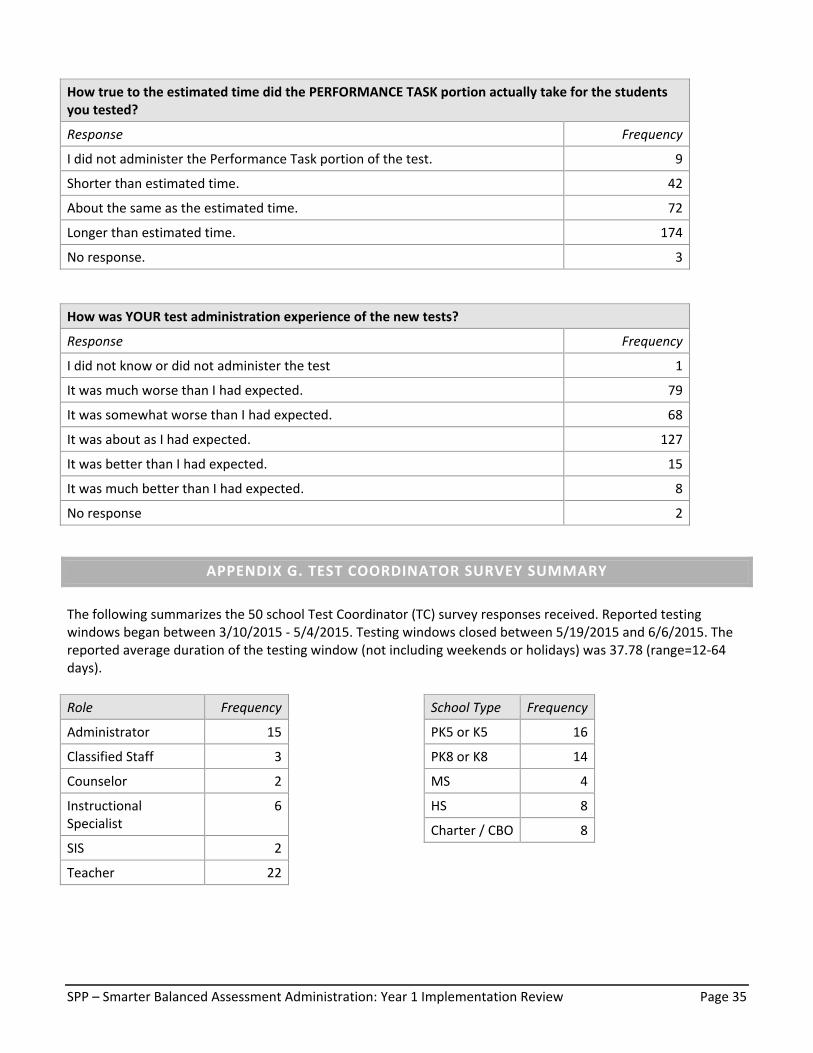
SPP – Smarter Balanced Assessment Administration: Year 1 Implementation Review Page 35
How true to the estimated time did the PERFORMANCE TASK portion actually take for the students you tested?
Response Frequency
I did not administer the Performance Task portion of the test. 9
Shorter than estimated time. 42
About the same as the estimated time. 72
Longer than estimated time. 174
No response. 3
How was YOUR test administration experience of the new tests?
Response Frequency
I did not know or did not administer the test 1
It was much worse than I had expected. 79
It was somewhat worse than I had expected. 68
It was about as I had expected. 127
It was better than I had expected. 15
It was much better than I had expected. 8
No response 2
APPENDIX G. TEST COORDINATOR SURVEY SUMMARY
The following summarizes the 50 school Test Coordinator (TC) survey responses received. Reported testing windows began between 3/10/2015 ‐ 5/4/2015. Testing windows closed between 5/19/2015 and 6/6/2015. The reported average duration of the testing window (not including weekends or holidays) was 37.78 (range=12‐64 days).
Role Frequency
Administrator 15
Classified Staff 3
Counselor 2
Instructional Specialist
6
SIS 2
Teacher 22
School Type Frequency
PK5 or K5 16
PK8 or K8 14
MS 4
HS 8
Charter / CBO 8
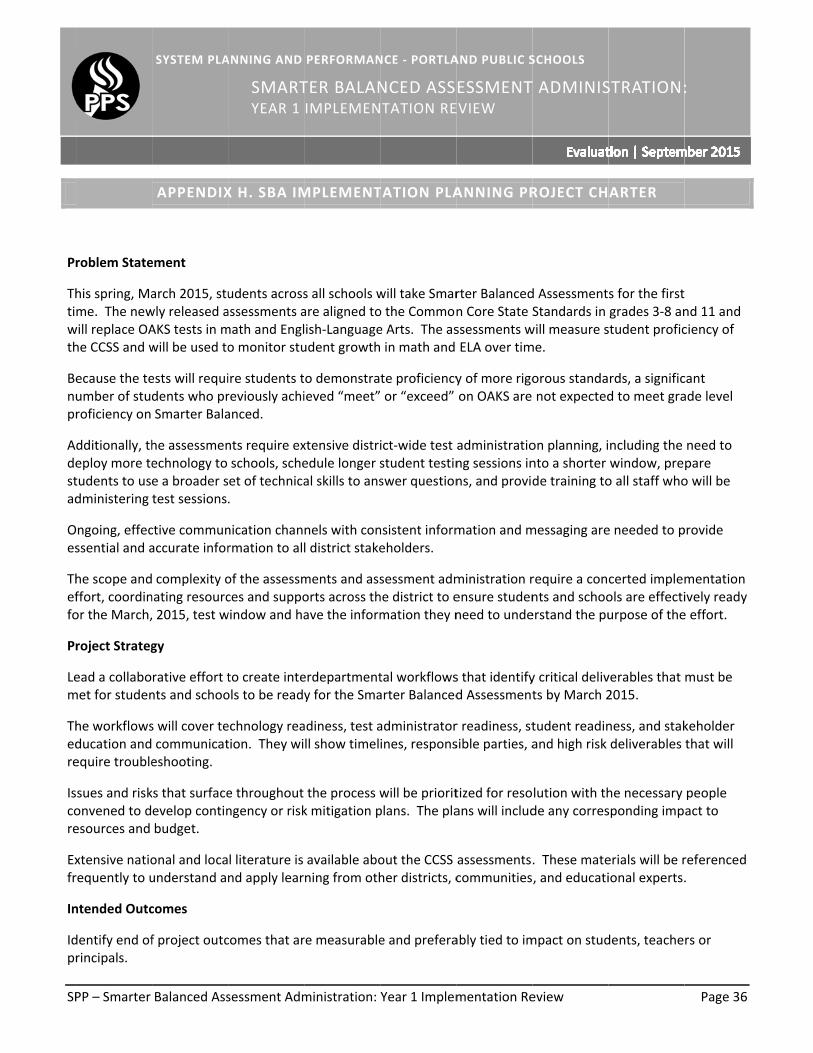
SP
Pr
Thtiwth
Benupr
Adestad
Oes
Theffo
Pr
Lem
Thedre
Iscore
Exfr
In
Idpr
PP – Smarter
roblem State
his spring, Mame. The new
will replace OAhe CCSS and w
ecause the teumber of studroficiency on
dditionally, theploy more tetudents to usdministering
Ongoing, effecssential and a
he scope andffort, coordinor the March,
roject Strateg
ead a collabomet for studen
he workflowsducation andequire trouble
sues and riskonvened to desources and
xtensive natiorequently to u
ntended Outc
dentify end ofrincipals.
Balanced Ass
SYSTEM PLA
APPENDIX
ement
arch 2015, stuwly released aAKS tests in mwill be used to
ests will requidents who prSmarter Bala
he assessmenechnology to e a broader stest sessions
ctive communaccurate infor
complexity onating resourc 2015, test w
gy
rative effort tnts and schoo
s will cover te communicateshooting.
ks that surfaceevelop continbudget.
onal and locaunderstand a
comes
f project outc
sessment Adm
ANNING AND
SMARTYEAR 1
X H. SBA IM
udents acrossassessments amath and Englo monitor stu
ire students treviously achianced.
nts require exschools, scheet of technica.
nication chanrmation to all
of the assessmces and suppowindow and ha
to create inteols to be ready
echnology reation. They wi
e throughout ngency or risk
l literature is nd apply lear
comes that ar
ministration:
PERFORMAN
TER BALANIMPLEMEN
MPLEMENT
s all schools ware aligned toish‐Languageudent growth
o demonstraieved “meet”
xtensive distriedule longer sal skills to ans
nels with conl district stake
ments and assorts across thave the inform
erdepartmenty for the Sma
adiness, test all show timel
the process wk mitigation p
available aboning from oth
re measurable
Year 1 Implem
NCE ‐ PORTLA
NCED ASSTATION RE
TATION PLA
will take Smaro the Commone Arts. The as in math and
te proficiency or “exceed”
ict‐wide test student testinswer question
nsistent informeholders.
sessment admhe district to emation they n
tal workflowsarter Balanced
administratorines, respons
will be prioritplans. The pla
out the CCSS her districts, c
e and prefera
mentation Re
AND PUBLIC S
ESSMENTEVIEW
ANNING PR
rter Balancedn Core State Sssessments wELA over tim
y of more rigoon OAKS are
administrationg sessions inns, and provid
mation and m
ministration rensure studenneed to unde
s that identifyd Assessment
r readiness, stsible parties, a
tized for resoans will includ
assessmentscommunities
ably tied to im
eview
SCHOOLS
T ADMINIS
ROJECT CH
d AssessmentStandards in
will measure sme.
orous standa not expected
on planning, into a shorter de training to
messaging are
require a connts and schooerstand the pu
y critical delivts by March 2
tudent readinand high risk
lution with thde any corres
. These mate, and educati
mpact on stud
STRATION:
ARTER
s for the firstgrades 3‐8 anstudent profic
rds, a significd to meet gra
ncluding the window, preo all staff who
e needed to p
certed implemols are effectiurpose of the
verables that 2015.
ness, and stakdeliverables
he necessary sponding imp
erials will be rional experts.
dents, teache
Page 36
:
nd 11 and ciency of
cant ade level
need to pare o will be
provide
mentation ively ready e effort.
must be
keholder that will
people act to
referenced .
rs or
SPP – Smarter Balanced Assessment Administration: Year 1 Implementation Review Page 37
The outcomes will be as follows: A detailed interdepartmental project plan that reflects deliverables, responsible parties, timelines, and
risk status. Those responsible for the deliverables clearly understand their roles and what steps they need to take to complete the project.
Contingency or risk mitigations plans are in place for deliverables that are or were identified as “at risk”. District leaders know the issues and risks associated with the implementation of the new assessments and
what steps are necessary to mitigate or resolve those issues.
Out‐of‐Scope Work
This work will NOT include: The instructional application of the Smarter Balanced Assessments, which is managed through OTL. Final project implementation. Although much of the implementation work is underway and tracked, final
implementation will be done the by respective departments and coordinated by R&E.
Deliverables
Interim Interdepartmental workflows that cover technology and facility readiness, test administrator readiness,
and stakeholder education and communication. The workflows are collaborative, working documents, and once key dates and deliverables are identified, they will be used to develop a project plan.
Final A detailed interdepartmental project plan that reflects deliverables, responsible parties, timelines, and
risk status. The project plan will include any contingency and risk mitigation plans in place or in process.
Project Schedule
December– Technology Readiness Workflow (Draft) December – Test Administrator Readiness Workflow (Draft) December – Stakeholder Education and Communication Workflow (internal PPS stakeholders only) (Draft) December – Identify risk areas and develop contingency and risk mitigation plan January – Identify key dates and deliverables for education and communication with external PPS stakeholders 01/17 – Initial draft of project plan 01/19‐02/13 ‐ Monitor project plan; continue risk mitigation planning as needed
Budget & Resource Requirements
Actual Costs Additional time to compensate test coordinators Project coordination and management to roll out the new assessment ($12k)
Opportunity Costs (use of existing resources but these resources now are directed toward SBAC implementation as opposed to something else).
2 staff meetings to allow teachers to read training materials Training targeted to principals at January leadership Additional Test Coordinator Training for preparing for test administration Family engagement staff to hold workshops for parents Communications staff to produce materials to help families understand Smarter Balanced IT to expedite ordering of devices
SPP – Smarter Balanced Assessment Administration: Year 1 Implementation Review Page 38
*Note‐ there are also costs with securing technology. However, this technology would have been purchased with or without the Smarter Balanced Assessment.
Critical Success Factors
The knowledge, expertise, availability, and engagement of others across the district to develop an effective project plan is essential to the success of this project. The critical departments for project planning are R&E, ICA, Communications, IT, School Family Partnerships, SPED, and ESL.
Access to forums and/or engagement from key people who can bridge information and plans with the schools to ensure that the proposed work will meet their needs.
The SBAC Steering Committee will be important to provide overall project leadership and decision making, especially in the area of contingency planning and risk mitigation.
Constraints & Risks
The timeline is tight for the amount of work that needs to be done to ensure students and schools are ready to begin testing in March, 2015. Resources must be prioritized in order to complete the work and resolve issues as they arise.
Extensive misinformation as well as pushback on Smarter Balanced Assessments from multiple district and external stakeholders could lead to a large number of requests for exemption.
Project Management Structure
Executive Sponsor: Sarah Singer
Project Manager: Jill Vogt
Project Team: Joe Suggs, Mary Anderson
Steering Committee: Antonio Lopez, Melissa Goff, Van Truong, Ewan Brawley, Marita Ingalsbe, Sascha Perrins, Amanda Whalen, Sarah Singer, Joe Suggs, Erin Barnett, Josh Klein
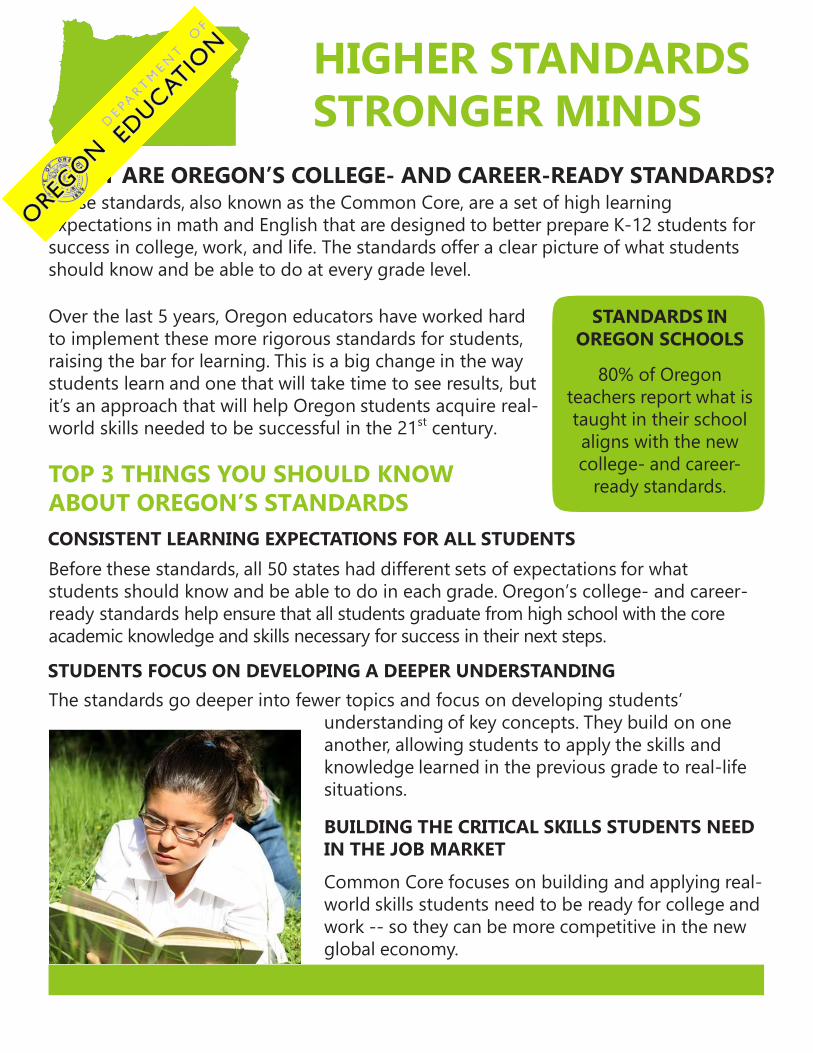
HIGHER STANDARDS
STRONGER MINDS
WHAT ARE OREGON’S COLLEGE- AND CAREER-READY STANDARDS? These standards, also known as the Common Core, are a set of high learning
expectations in math and English that are designed to better prepare K-12 students for
success in college, work, and life. The standards offer a clear picture of what students
should know and be able to do at every grade level.
Over the last 5 years, Oregon educators have worked hard
to implement these more rigorous standards for students,
raising the bar for learning. This is a big change in the way
students learn and one that will take time to see results, but
it’s an approach that will help Oregon students acquire real-
world skills needed to be successful in the 21st century.
TOP 3 THINGS YOU SHOULD KNOW
ABOUT OREGON’S STANDARDS
STANDARDS IN
OREGON SCHOOLS
80% of Oregon
teachers report what is
taught in their school
aligns with the new
college- and career-
ready standards.
CONSISTENT LEARNING EXPECTATIONS FOR ALL STUDENTS
Before these standards, all 50 states had different sets of expectations for what
students should know and be able to do in each grade. Oregon’s college- and career-
ready standards help ensure that all students graduate from high school with the core
academic knowledge and skills necessary for success in their next steps.
STUDENTS FOCUS ON DEVELOPING A DEEPER UNDERSTANDING
The standards go deeper into fewer topics and focus on developing students’
understanding of key concepts. They build on one
another, allowing students to apply the skills and
knowledge learned in the previous grade to real-life
situations.
BUILDING THE CRITICAL SKILLS STUDENTS NEED
IN THE JOB MARKET
Common Core focuses on building and applying real-
world skills students need to be ready for college and
work -- so they can be more competitive in the new
global economy.
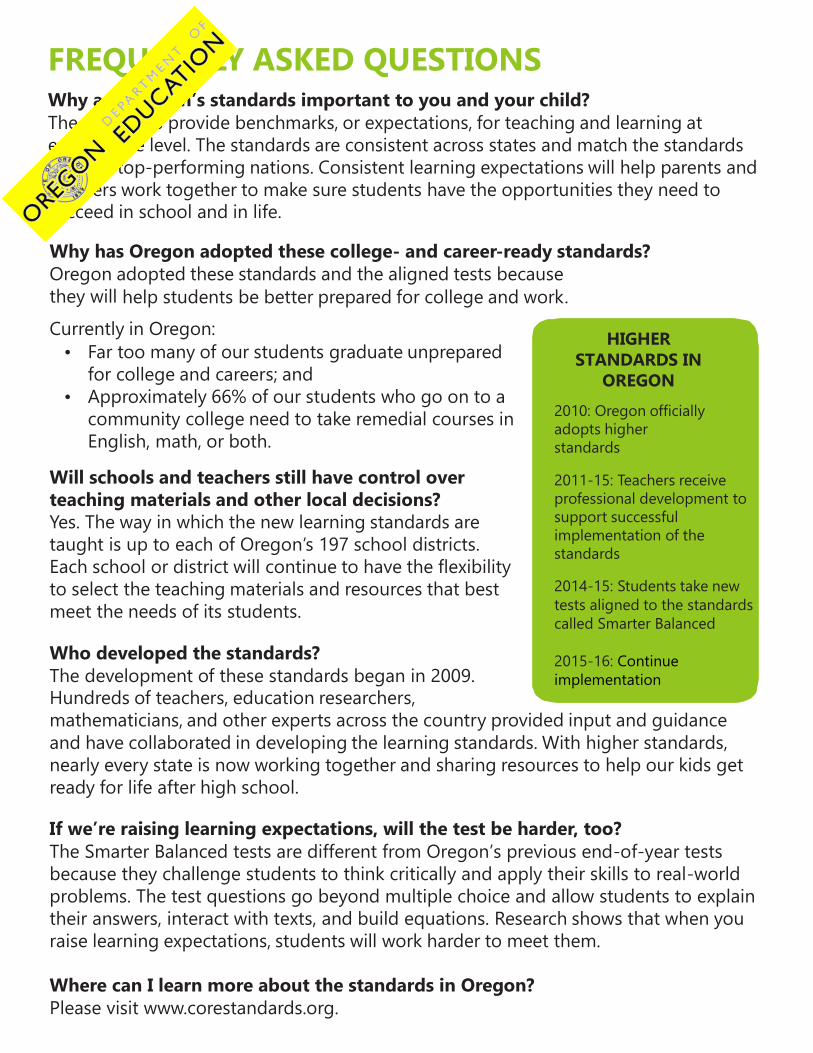
FREQUENTLY ASKED QUESTIONS
Why are Oregon’s standards important to you and your child?
The standards provide benchmarks, or expectations, for teaching and learning at
every grade level. The standards are consistent across states and match the standards
used by top-performing nations. Consistent learning expectations will help parents and
teachers work together to make sure students have the opportunities they need to
succeed in school and in life.
Why has Oregon adopted these college- and career-ready standards?
Oregon adopted these standards and the aligned tests because
they will help students be better prepared for college and work.
Currently in Oregon:
• Far too many of our students graduate unprepared
for college and careers; and
• Approximately 66% of our students who go on to a
community college need to take remedial courses in
English, math, or both.
Will schools and teachers still have control over
teaching materials and other local decisions?
Yes. The way in which the new learning standards are
taught is up to each of Oregon’s 197 school districts.
Each school or district will continue to have the flexibility
to select the teaching materials and resources that best
meet the needs of its students.
Who developed the standards?
The development of these standards began in 2009.
Hundreds of teachers, education researchers,
HIGHER
STANDARDS IN
OREGON
2010: Oregon officially
adopts higher
standards
2011-15: Teachers receive
professional development to
support successful
implementation of the
standards
2014-15: Students take new
tests aligned to the standards
called Smarter Balanced
2015-16: Continue
implementation
mathematicians, and other experts across the country provided input and guidance
and have collaborated in developing the learning standards. With higher standards,
nearly every state is now working together and sharing resources to help our kids get
ready for life after high school.
If we’re raising learning expectations, will the test be harder, too?
The Smarter Balanced tests are different from Oregon’s previous end-of-year tests
because they challenge students to think critically and apply their skills to real-world
problems. The test questions go beyond multiple choice and allow students to explain
their answers, interact with texts, and build equations. Research shows that when you
raise learning expectations, students will work harder to meet them.
Where can I learn more about the standards in Oregon?
Please visit www.corestandards.org.
5 Quick Facts About Oregon’s New State Tests Smarter Balanced tests are better than our previous state tests: Aligned to Oregon’s new standards, the Smarter Balanced tests tell us where students are
on their PATH TO COLLEGE- AND CAREER-READINESS, and are more challenging than our previous, multiple-choice only tests.
Initial scores on Smarter Balanced tests may look like students are doing worse than in
previous years. In reality, the scores represent an increase in expectations rather than a decrease in students’ abilities, as we have set a new baseline for educators, students, and parents reflecting the demands of life after high school.
Smarter Balanced test questions are tested and proven: OVER 4.5 MILLION STUDENTS across the country piloted and field tested Smarter
Balanced test questions to ensure their accuracy and fairness. In Oregon, 24,000+ students took the Field Test in the spring of 2014. The test designers are using what they learned from the field test to improve the actual test.
Teachers from Oregon were involved in the development of these new tests: More than 3,000 K-12 teachers and higher education faculty from Smarter Balanced
member states worked together to develop the tests.
More than 500 TEACHERS IN OREGON helped develop test questions, create teaching resources, and set achievement levels.
Smarter Balanced tests maximize student learning where it matters most—in the classroom: In the past, students took state tests multiple times each year. Smarter Balanced tests
will be given ONE TIME AT THE END OF THE SCHOOL YEAR to ensure students have had the maximum amount of learning time prior to testing.
Students’ personally identifiable information will be protected: Consistent with previous tests, Smarter Balanced will ADHERE TO ALL FEDERAL AND
STATE PRIVACY LAWS to make sure students’ personally identifiable information is not unlawfully stored or shared.
Only questions related to academic content and skills will be on the tests. Personal questions about religion and family income are not part of the tests.
Sample Key Messages about Participation Participation Matters
Federal law requires all students to be tested. Before this law was put into place, student participation did not reflect diverse student populations. Often, the students who were left out were the students most in need of support.
Oregon schools risk losing $344 million in federal funds if our participation drops too low. In addition to the financial risk, there is also a very real impact on our district improvement efforts.
Not having information on our students’ academic progress limits our ability to accurately identify where
students are struggling, where they are excelling, and whether we are fulfilling the goal of narrowing achievement gaps.
The end‐of‐year tests offer critically important information to parents who want to help their student improve and teachers who want to ensure they are tailoring their instruction to meet the needs of all students.
While the annual assessment is just one measure, it is an honest and important measure of how kids are performing academically.
It is critical for parents, teachers, and school and state leaders to receive meaningful information at least once a year on how each student in Oregon is performing and how schools are working to ensure all students are making progress.
We cannot accomplish our goals if fewer than 95 percent of students take the test. Instead, we will be left with an incomplete and inaccurate picture of how students are performing across the state as well as how each local school is working to meet students’ needs.
In particular, the drop in participation will limit our ability to identify and address achievement and opportunity gaps for our students in poverty, students of color, and students with disabilities.
Test Results Offer Valuable Feedback
State test results provide clear, meaningful, and relevant feedback to students, parents, and educators on how prepared kids are for college and career so they can be successful in a globally‐competitive world.
The results identify students’ strengths and areas for improvement.
No student, parent, or teacher should be discouraged by the scores, which will never be used to determine
whether a student moves on to the next grade or graduates. Rather, results will provide an opportunity to focus
on the needs of the student and support teachers and schools in their work.
Students who earn a Level 3 or 4 on the tests may use this to fulfill the Essential Skills requirement in order to
graduate from high school.
Students who earn a Level 3 or 4 on the tests and meet senior coursework requirements may also be able to
forgo college placement testing and move directly into credit bearing courses in higher ed.
Higher Standards, Quality Instruction, & Better Tests
Raising the Bar for all Oregon students Students and teachers are rising to the challenge of higher standards and their hard work is
paying off. More students met Oregon’s college- and career-ready standard on new state tests than originally projected.
The online tests ask students to engage in new ways through interactive questions, multi-step problems, and student writing. These types of tests take longer than purely multiple choice tests, but they also provide more accurate information on student learning and are designed to be more engaging than previous state tests.
Students who receive a 3 or 4 on the test (on a 4-point scale) are considered on track to graduate high school college and career-ready. Scores in English and math will be more detailed and able to highlight student’s strengths and areas for improvement.
Test results will provide important feedback to students, parents, and educators. While they are only one measure of students’ academic success, this information allows educators to address learning gaps early and better prepare students for success.
This year represents a new baseline for our state, and we expect the percent meeting to increase in the coming years. In the past, when Oregon raised expectations, there was an initial drop in scores followed by an increase as students and teachers rose to the challenge of higher standards.
The transition to higher standards and new tests will require patience and persistence. Our educators will continue to focus on implementation of the standards and high-quality instruction.
Working to close the achievement gap is a top priority for Oregon. The standards and tests promote equity by ensuring all students, especially historically underserved students, are offered access to high-level content. No student will be held back a grade or kept from graduating based on the results of the tests.
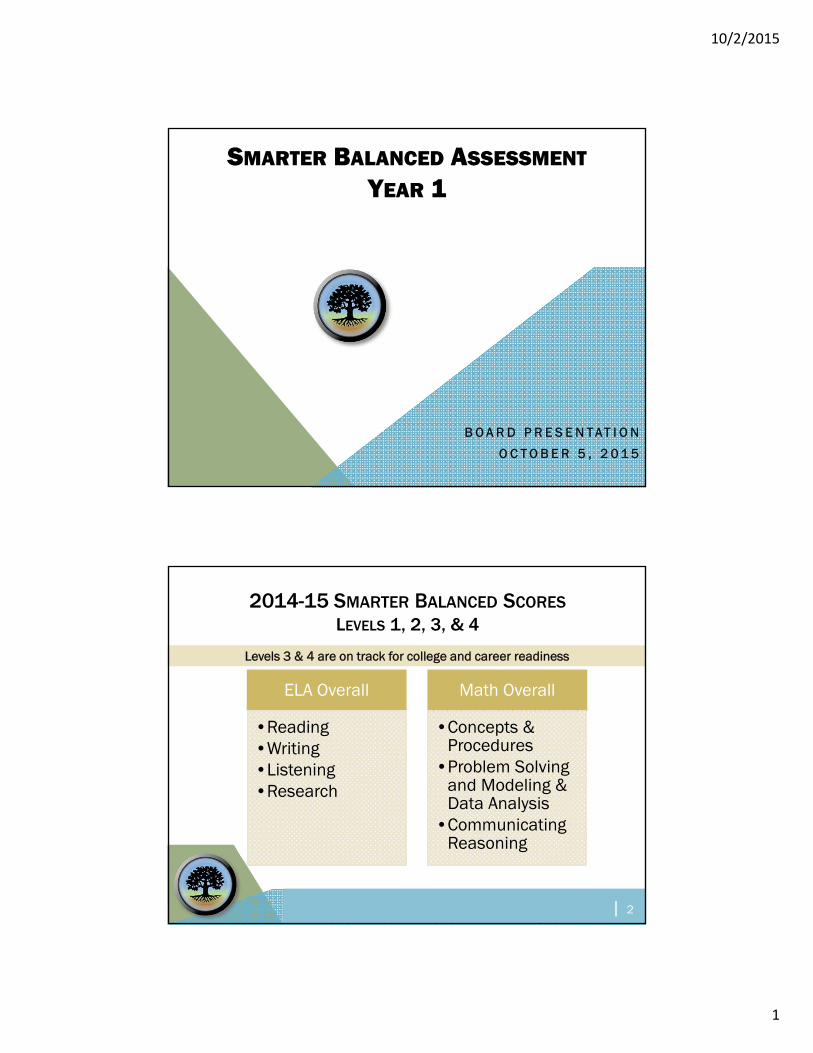
10/2/2015
1
SMARTER BALANCED ASSESSMENTYEAR 1
B O A R D P R E S E N T A T I O N
O C T O B E R 5 , 2 0 1 5
Oregon Assessment of Knowledge and SkillsEnglish Language Arts, English Language Proficiency, Mathematics, Science, Social Sciences
2014-15 SMARTER BALANCED SCORESLEVELS 1, 2, 3, & 4
Levels 3 & 4 are on track for college and career readiness
ELA Overall
•Reading•Writing•Listening•Research
Math Overall
•Concepts & Procedures
•Problem Solving and Modeling & Data Analysis
•Communicating Reasoning
| 2
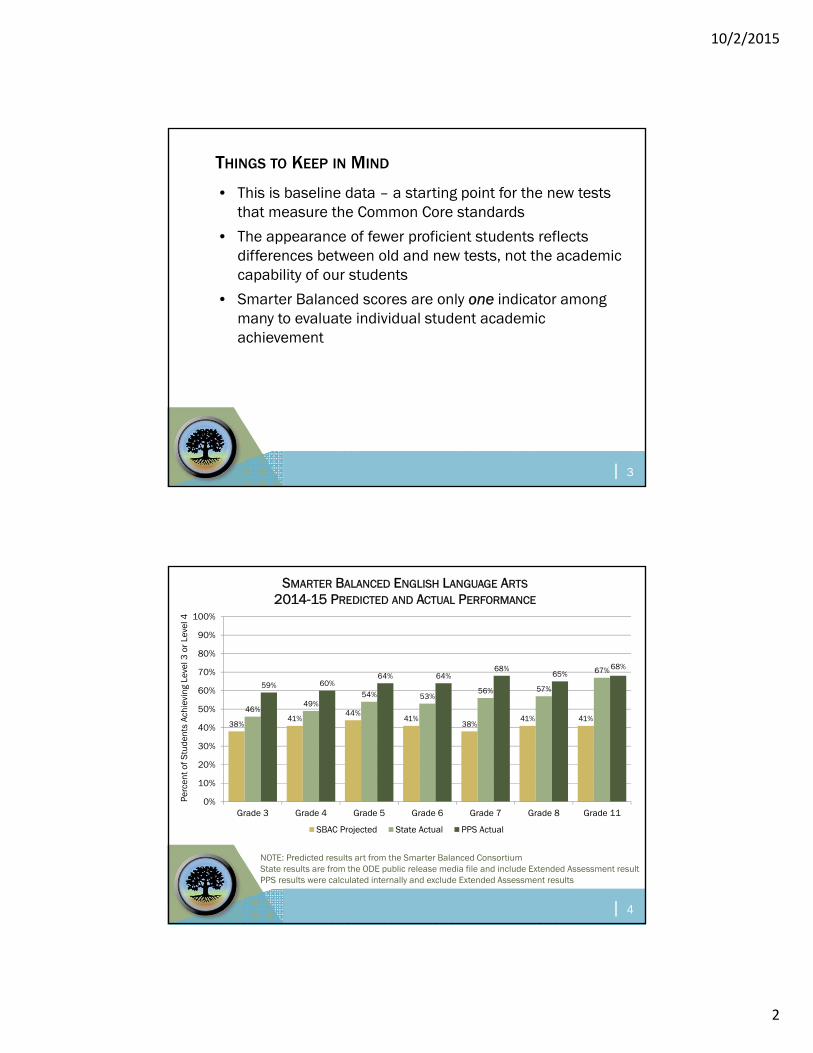
10/2/2015
2
Oregon Assessment of Knowledge and SkillsEnglish Language Arts, English Language Proficiency, Mathematics, Science, Social Sciences
THINGS TO KEEP IN MIND
• This is baseline data – a starting point for the new tests that measure the Common Core standards
• The appearance of fewer proficient students reflects differences between old and new tests, not the academic capability of our students
• Smarter Balanced scores are only one indicator among many to evaluate individual student academic achievement
| 3
Oregon Assessment of Knowledge and SkillsEnglish Language Arts, English Language Proficiency, Mathematics, Science, Social Sciences
NOTE: Predicted results art from the Smarter Balanced ConsortiumState results are from the ODE public release media file and include Extended Assessment resultPPS results were calculated internally and exclude Extended Assessment results
38%41%
44%41%
38%41% 41%
46%49%
54% 53%56% 57%
67%
59% 60%64% 64%
68%65%
68%
0%
10%
20%
30%
40%
50%
60%
70%
80%
90%
100%
Grade 3 Grade 4 Grade 5 Grade 6 Grade 7 Grade 8 Grade 11
Perc
ent o
f Stu
dent
s Ac
hiev
ing
Leve
l 3 o
r Lev
el 4
SMARTER BALANCED ENGLISH LANGUAGE ARTS2014-15 PREDICTED AND ACTUAL PERFORMANCE
SBAC Projected State Actual PPS Actual
| 4
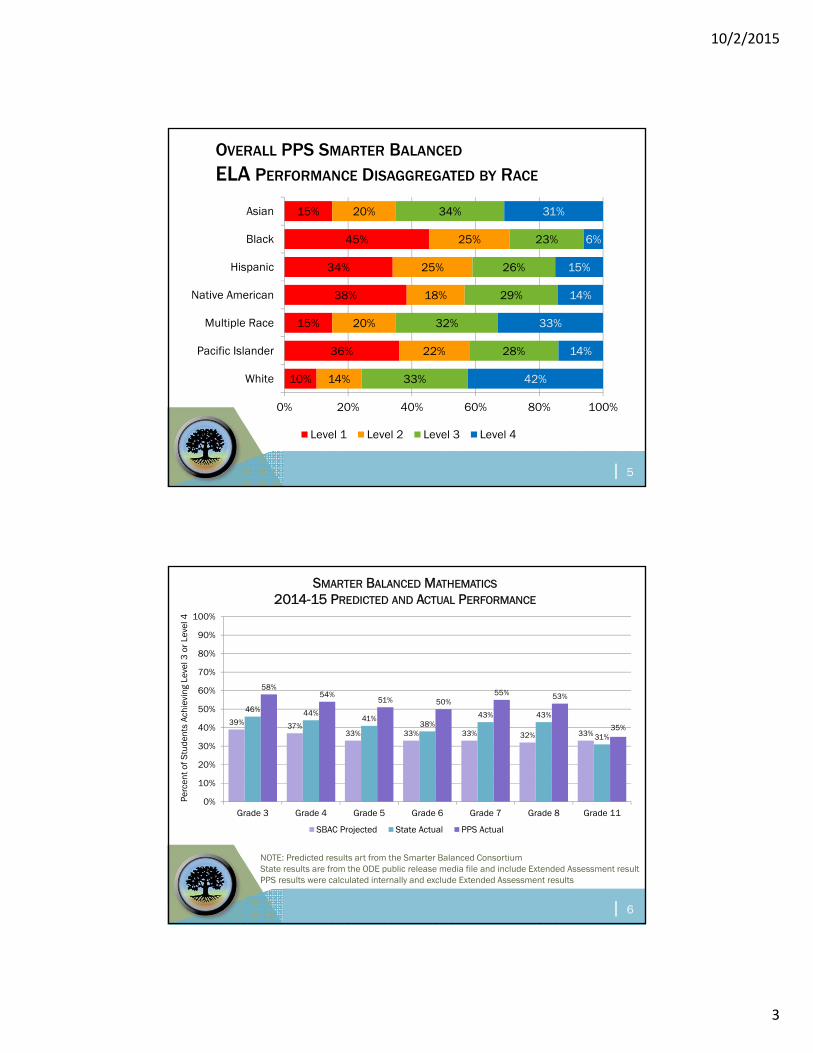
10/2/2015
3
Oregon Assessment of Knowledge and SkillsEnglish Language Arts, English Language Proficiency, Mathematics, Science, Social Sciences
OVERALL PPS SMARTER BALANCED
ELA PERFORMANCE DISAGGREGATED BY RACE
10%
36%
15%
38%
34%
45%
15%
14%
22%
20%
18%
25%
25%
20%
33%
28%
32%
29%
26%
23%
34%
42%
14%
33%
14%
15%
6%
31%
0% 20% 40% 60% 80% 100%
White
Pacific Islander
Multiple Race
Native American
Hispanic
Black
Asian
Level 1 Level 2 Level 3 Level 4
| 5
Oregon Assessment of Knowledge and SkillsEnglish Language Arts, English Language Proficiency, Mathematics, Science, Social Sciences
NOTE: Predicted results art from the Smarter Balanced ConsortiumState results are from the ODE public release media file and include Extended Assessment resultPPS results were calculated internally and exclude Extended Assessment results
39% 37%33% 33% 33% 32% 33%
46% 44%41%
38%43% 43%
31%
58%54%
51% 50%55% 53%
35%
0%
10%
20%
30%
40%
50%
60%
70%
80%
90%
100%
Grade 3 Grade 4 Grade 5 Grade 6 Grade 7 Grade 8 Grade 11
Perc
ent o
f Stu
dent
s Ac
hiev
ing
Leve
l 3 o
r Lev
el 4
SMARTER BALANCED MATHEMATICS2014-15 PREDICTED AND ACTUAL PERFORMANCE
SBAC Projected State Actual PPS Actual
| 6
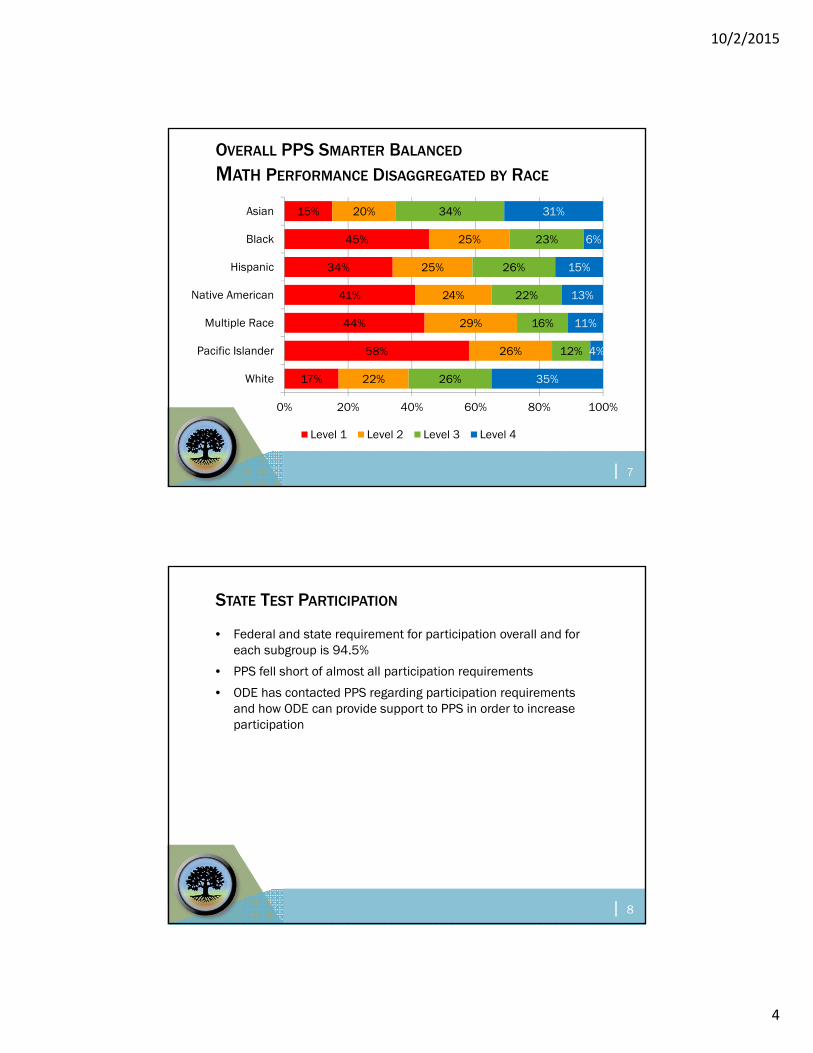
10/2/2015
4
Oregon Assessment of Knowledge and SkillsEnglish Language Arts, English Language Proficiency, Mathematics, Science, Social Sciences
OVERALL PPS SMARTER BALANCED
MATH PERFORMANCE DISAGGREGATED BY RACE
17%
58%
44%
41%
34%
45%
15%
22%
26%
29%
24%
25%
25%
20%
26%
12%
16%
22%
26%
23%
34%
35%
4%
11%
13%
15%
6%
31%
0% 20% 40% 60% 80% 100%
White
Pacific Islander
Multiple Race
Native American
Hispanic
Black
Asian
Level 1 Level 2 Level 3 Level 4
| 7
Oregon Assessment of Knowledge and SkillsEnglish Language Arts, English Language Proficiency, Mathematics, Science, Social Sciences
STATE TEST PARTICIPATION
• Federal and state requirement for participation overall and for each subgroup is 94.5%
• PPS fell short of almost all participation requirements
• ODE has contacted PPS regarding participation requirements and how ODE can provide support to PPS in order to increase participation
| 8
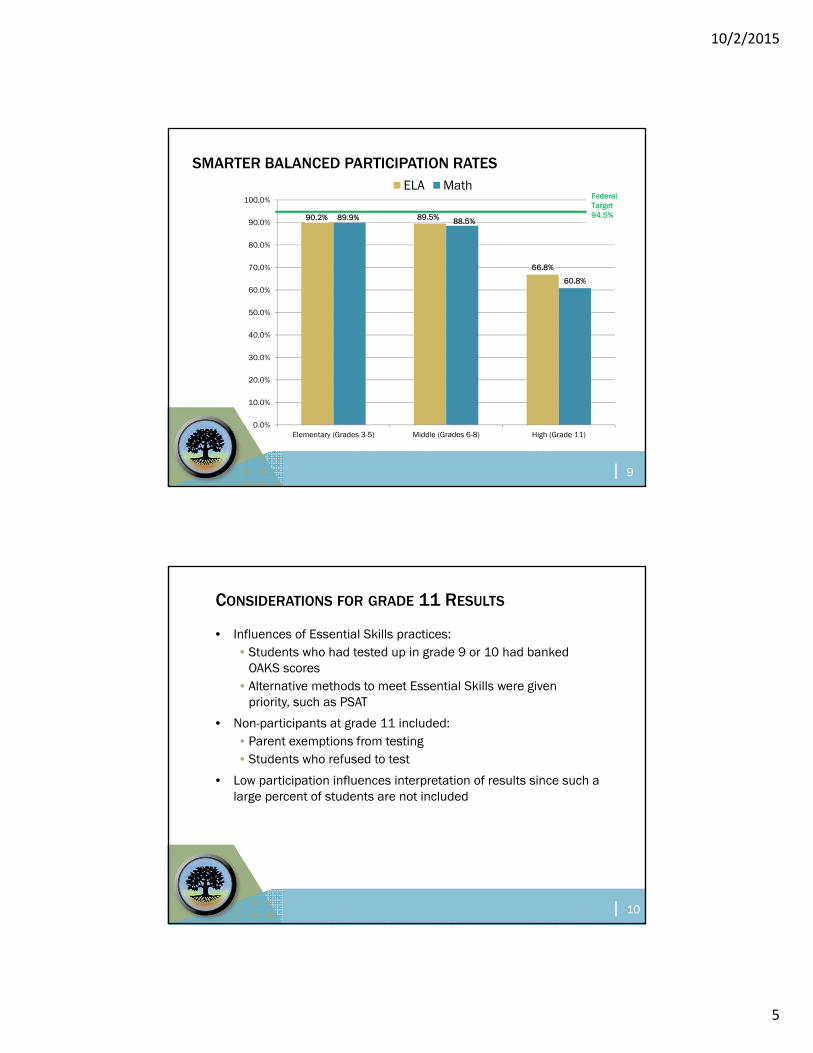
10/2/2015
5
Oregon Assessment of Knowledge and SkillsEnglish Language Arts, English Language Proficiency, Mathematics, Science, Social Sciences
SMARTER BALANCED PARTICIPATION RATES
90.2% 89.5%
66.8%
89.9% 88.5%
60.8%
0.0%
10.0%
20.0%
30.0%
40.0%
50.0%
60.0%
70.0%
80.0%
90.0%
100.0%
Elementary (Grades 3-5) Middle (Grades 6-8) High (Grade 11)
ELA MathFederal Target 94.5%
| 9
Oregon Assessment of Knowledge and SkillsEnglish Language Arts, English Language Proficiency, Mathematics, Science, Social Sciences
CONSIDERATIONS FOR GRADE 11 RESULTS
• Influences of Essential Skills practices:• Students who had tested up in grade 9 or 10 had banked
OAKS scores• Alternative methods to meet Essential Skills were given
priority, such as PSAT
• Non-participants at grade 11 included:• Parent exemptions from testing• Students who refused to test
• Low participation influences interpretation of results since such a large percent of students are not included
| 10
10/2/2015
6
BASELINE RESULTS
| 11
Oregon Assessment of Knowledge and SkillsEnglish Language Arts, English Language Proficiency, Mathematics, Science, Social Sciences
PPS BASELINE REPORTS: WHAT THEY DISPLAY
Based on May 1 enrollment
Scores excluded from the performance summaries were students who:
• took the Extended Assessment
• were home or private schooled
• were foreign exchange
• were in their first year of U.S. school enrollment
• were in a general education setting for less than 40% of instructional time, such as self-contained Special Education classrooms
"Not tested" includes students who did not have a valid SBA result due to:
• partial tests inadequate to generate a valid score
• test invalidation
• parent request for exemption
| 12
http://www.pps.k12.or.us/departments/research-evaluation/10693.htm
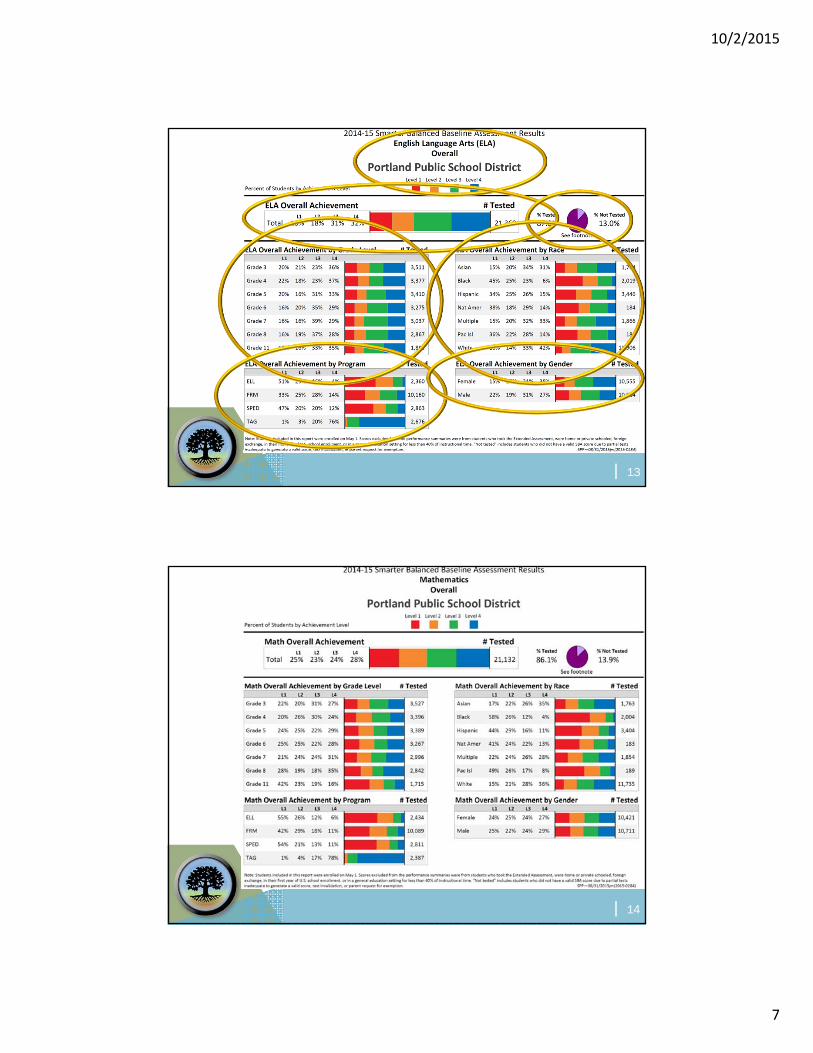
10/2/2015
7
Oregon Assessment of Knowledge and SkillsEnglish Language Arts, English Language Proficiency, Mathematics, Science, Social Sciences | 13
Oregon Assessment of Knowledge and SkillsEnglish Language Arts, English Language Proficiency, Mathematics, Science, Social Sciences | 14
10/2/2015
8
POLICY UPDATES
| 15
Oregon Assessment of Knowledge and SkillsEnglish Language Arts, English Language Proficiency, Mathematics, Science, Social Sciences
ESSENTIAL SKILLS CUT SCORES
• Adopted September 17 by Oregon State Board
• Communications of new cut scores:• PPS Admin Connect • Family Advisory• Directly to high school leaders, including Multiple Pathways
• Results and Essential skills status is now showing in Synergy and Administrator’s Dashboard
Math: Overall Mathematics score at or above 2543, the same as the cut score for Level 2
Reading: Claim score at or above 2515, falls within the lower Level 2
Writing: Claim score at or above 2583, same as cut score for Level 3
| 16
10/2/2015
9
Oregon Assessment of Knowledge and SkillsEnglish Language Arts, English Language Proficiency, Mathematics, Science, Social Sciences
HOUSE BILL 2655: STUDENT ASSESSMENT BILL OF RIGHTS
• Requires ODE to develop notice about statewide summative assessments that schools/districts must provide to parents/guardians
• Requires ODE to develop a statewide form for parents to refuse testing, which will include:• Explanation of the right to refuse testing• Explanation of the purpose and value of state assessments• Guidelines for submission of form
• ODE is interpreting HB 2655 to only apply to Smarter Balanced Assessments and materials are expected to be released by ODE November 9, 2015
• Current state restrictions for parent requests for exemption from testing are in effect until HB 2655 takes effect on January 1, 2016
• Beginning January 1, 2016 the new exemption process will apply to Smarter Balanced Assessments and the current exemption process will still apply to other state required assessments
| 17
LESSONS LEARNED FROM YEAR 1 ADMINISTRATION
| 18
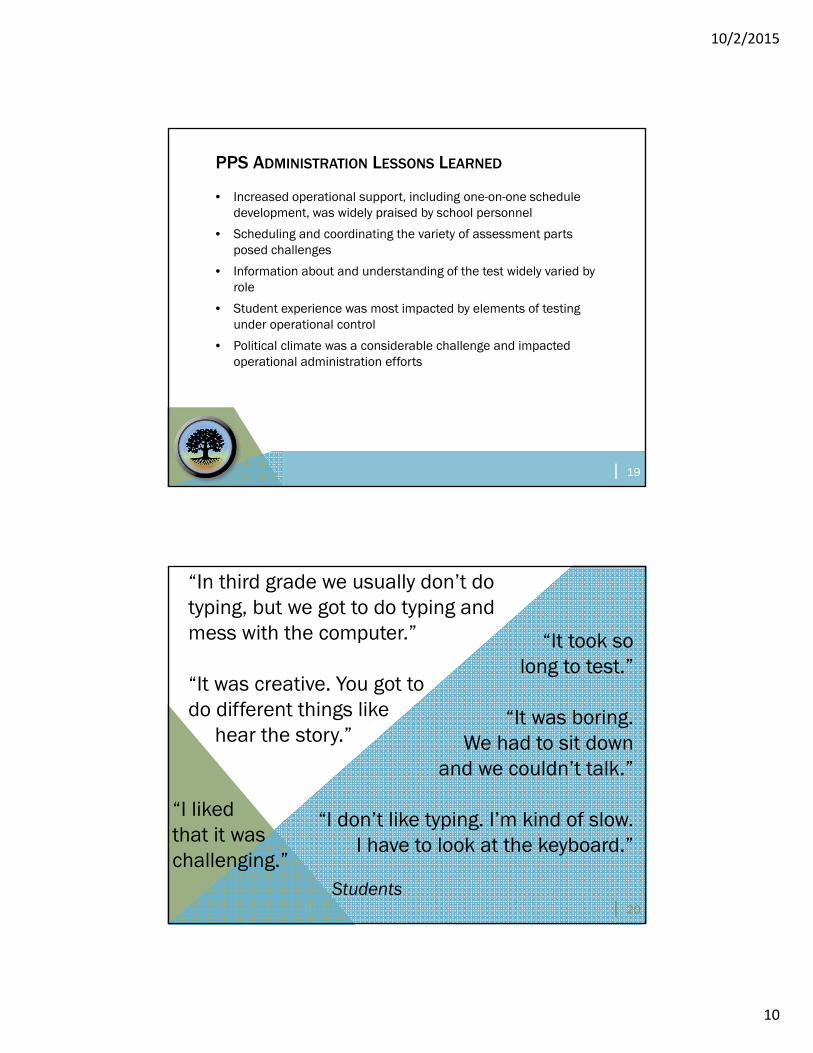
10/2/2015
10
Oregon Assessment of Knowledge and SkillsEnglish Language Arts, English Language Proficiency, Mathematics, Science, Social Sciences
PPS ADMINISTRATION LESSONS LEARNED
• Increased operational support, including one-on-one schedule development, was widely praised by school personnel
• Scheduling and coordinating the variety of assessment parts posed challenges
• Information about and understanding of the test widely varied by role
• Student experience was most impacted by elements of testing under operational control
• Political climate was a considerable challenge and impacted operational administration efforts
| 19
“In third grade we usually don’t do typing, but we got to do typing and mess with the computer.”
“It was creative. You got to do different things like
hear the story.”
Students
“It took so long to test.”
“It was boring. We had to sit down
and we couldn’t talk.”
“I don’t like typing. I’m kind of slow. I have to look at the keyboard.”
“I liked that it was challenging.”
| 20
10/2/2015
11
2015-16 COMMUNICATIONS
| 21
Oregon Assessment of Knowledge and SkillsEnglish Language Arts, English Language Proficiency, Mathematics, Science, Social Sciences
• Individual student reports of state assessment results will be mailed to homes the week of October 12, 2015
• The reports have been redesigned to:• Display results similarly to ODE report design • Include all state tests
| 22
INDIVIDUAL STUDENT REPORT (ISR)
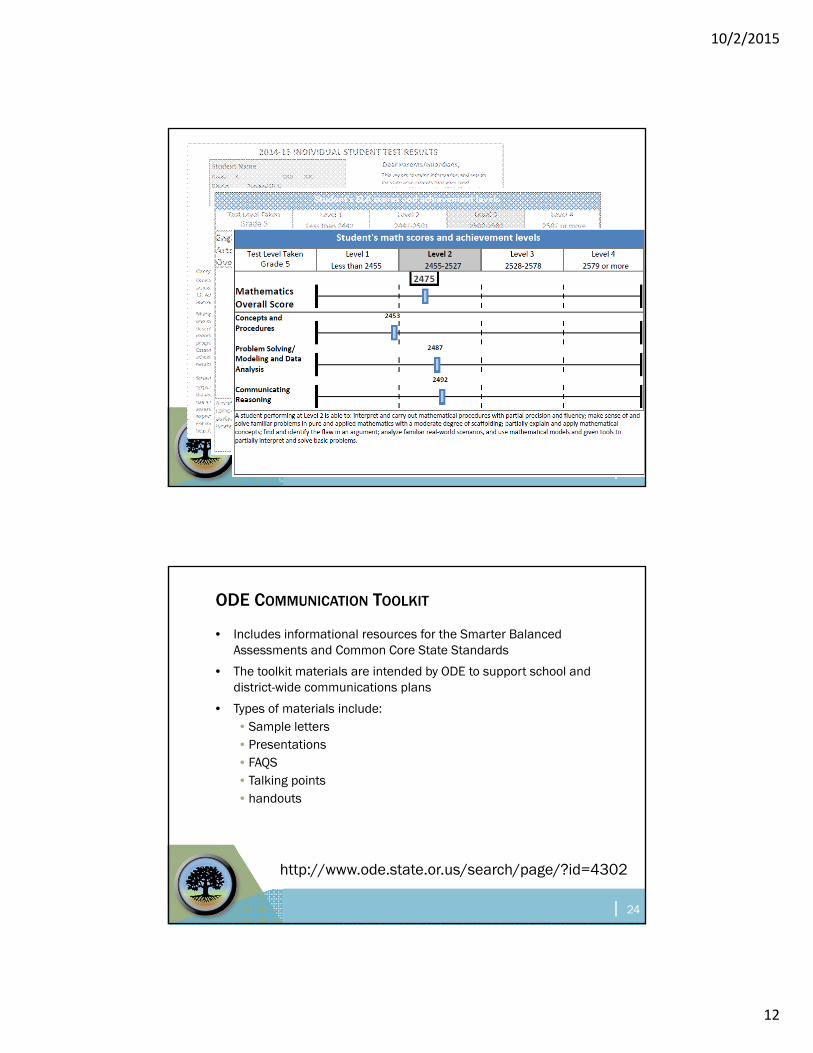
10/2/2015
12
Oregon Assessment of Knowledge and SkillsEnglish Language Arts, English Language Proficiency, Mathematics, Science, Social Sciences
• Individual student reports of state assessment results will be mailed to homes the week of October 12, 2015
• The reports have been redesigned to:• Display results similarly to ODE report design • Include all state tests
| 23
INDIVIDUAL STUDENT REPORT (ISR)
Oregon Assessment of Knowledge and SkillsEnglish Language Arts, English Language Proficiency, Mathematics, Science, Social Sciences
• Includes informational resources for the Smarter Balanced Assessments and Common Core State Standards
• The toolkit materials are intended by ODE to support school and district-wide communications plans
• Types of materials include:• Sample letters• Presentations• FAQS • Talking points• handouts
| 24
http://www.ode.state.or.us/search/page/?id=4302
ODE COMMUNICATION TOOLKIT
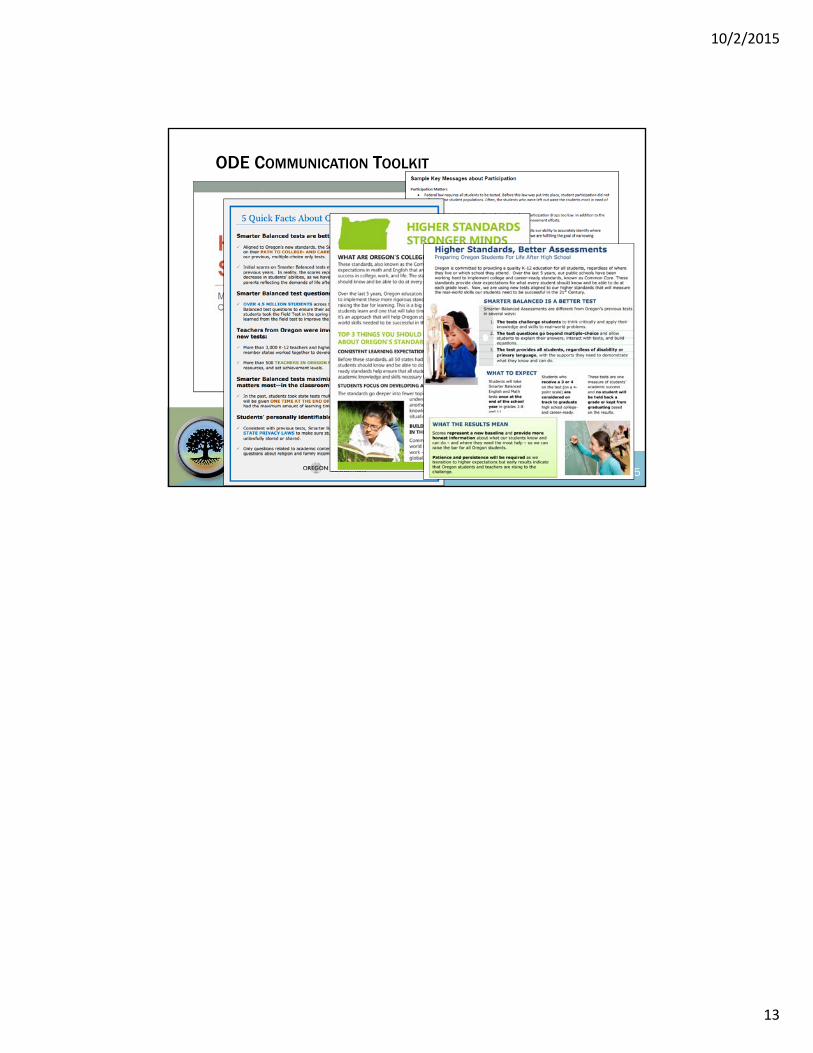
10/2/2015
13
Oregon Assessment of Knowledge and SkillsEnglish Language Arts, English Language Proficiency, Mathematics, Science, Social Sciences
• Includes informational resources for the Smarter Balanced Assessments and Common Core State Standards
• The toolkit materials are intended by ODE to support school and district-wide communications plans
• Types of materials include:• Sample letters• Presentations• FAQS • Talking points• handouts
| 25
http://www.ode.state.or.us/search/page/?id=4302
ODE COMMUNICATION TOOLKIT
Board of Education Informational Report MEMORANDUM Date: October 1, 2015 To: Members of the Board of Education From: Yousef Awwad, Chief Financial Officer Subject: Revision to Board Policy 8.10.040-P: Tax-Exempt Bond Post-Issuance
Compliance & Continuing Disclosure Policy At your meeting on Monday, October 5, 2015 you are scheduled to vote to approve the revision of this policy. The first reading of the revised policy was on September 1, 2015. Board Policy 8.10.040-P addresses Tax-Exempt Bond Post-Issuance Compliance & Continuing Disclosure. The policy was adopted in April 2013 in preparation for the first issuance of bonds under the November 2012 $485 million capital improvement bond authorization. The policy, as adopted, explicitly addressed the requirements of the federal tax code. This revision will add the explicit reference to requirements of the Securities and Exchange Commission rules. Before the first reading of the revised policy on September 1, this policy revision was reviewed with the board’s Business and Operations Committee, which unanimously recommended approval.
BOARD POLICY
Tax-Exempt Bond Post-Issuance Compliance & Continuing Disclosure Policy
8.10.040-P
Page 1
Federal Tax Law Policy:
It is the policy of the Portland Public School District (“the District”) to comply with applicable
requirements of federal tax law necessary to preserve the tax status of interest on tax-exempt obligations
issued by the District. This Policy is designed to set forth compliance procedures so that the District utilizes
the proceeds of all tax-exempt issues of bonds, certificates of participation, bond anticipation notes, and tax
and revenue anticipation notes (collectively referred to as “Bonds”) in accordance with applicable federal tax
requirements, and complies with all other applicable federal requirements with respect to outstanding Bonds.
To comply with applicable federal tax requirements, the District must confirm that the requirements are
met at the time each Bond issue is issued and throughout the term of the Bonds (until maturity or redemption).
Generally, compliance should include retention of records relating to the expenditure of the proceeds of each
Bond issue, the investment of the proceeds of each Bond issue, and any allocations made with respect to the
use of the proceeds of each Bond issue, sufficient to establish compliance with applicable federal tax
requirements, including records related to periods before the Bonds are issued (e.g., in the case of
reimbursement of prior expenditures) until six (6) years after the final maturity or redemption date of any issue
of Bonds.
The Board directs the Superintendent to establish written procedures on the requirements to monitor
compliance with the arbitrage, yield restriction, and rebate requirements of Internal Revenue Code Section
148.
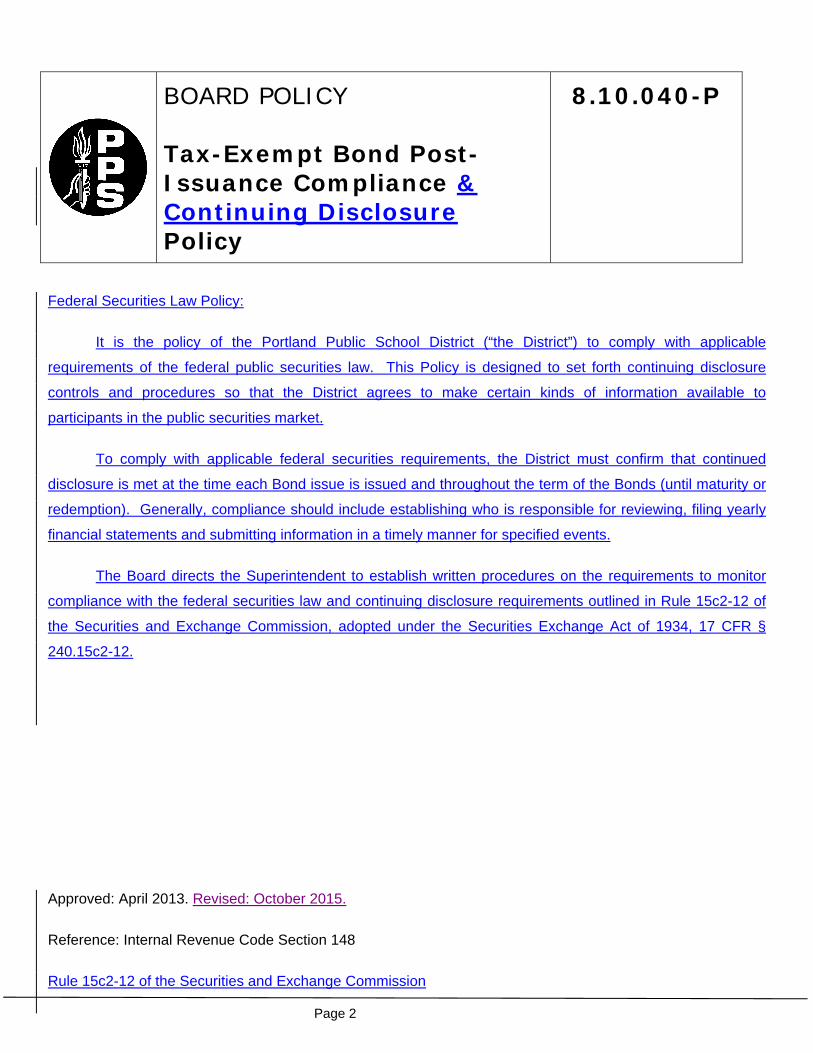
BOARD POLICY
Tax-Exempt Bond Post-Issuance Compliance & Continuing Disclosure Policy
8.10.040-P
Page 2
Federal Securities Law Policy:
It is the policy of the Portland Public School District (“the District”) to comply with applicable
requirements of the federal public securities law. This Policy is designed to set forth continuing disclosure
controls and procedures so that the District agrees to make certain kinds of information available to
participants in the public securities market.
To comply with applicable federal securities requirements, the District must confirm that continued
disclosure is met at the time each Bond issue is issued and throughout the term of the Bonds (until maturity or
redemption). Generally, compliance should include establishing who is responsible for reviewing, filing yearly
financial statements and submitting information in a timely manner for specified events.
The Board directs the Superintendent to establish written procedures on the requirements to monitor
compliance with the federal securities law and continuing disclosure requirements outlined in Rule 15c2-12 of
the Securities and Exchange Commission, adopted under the Securities Exchange Act of 1934, 17 CFR §
240.15c2-12.
Approved: April 2013. Revised: October 2015.
Reference: Internal Revenue Code Section 148
Rule 15c2-12 of the Securities and Exchange Commission
BOARD POLICY
Tax-Exempt Bond Post-Issuance Compliance & Continuing Disclosure Policy
8.10.040-P
Page 1
Federal Tax Law Policy:
It is the policy of the Portland Public School District (“the District”) to comply with applicable
requirements of federal tax law necessary to preserve the tax status of interest on tax-exempt obligations
issued by the District. This Policy is designed to set forth compliance procedures so that the District utilizes
the proceeds of all tax-exempt issues of bonds, certificates of participation, bond anticipation notes, and tax
and revenue anticipation notes (collectively referred to as “Bonds”) in accordance with applicable federal tax
requirements, and complies with all other applicable federal requirements with respect to outstanding Bonds.
To comply with applicable federal tax requirements, the District must confirm that the requirements are
met at the time each Bond issue is issued and throughout the term of the Bonds (until maturity or redemption).
Generally, compliance should include retention of records relating to the expenditure of the proceeds of each
Bond issue, the investment of the proceeds of each Bond issue, and any allocations made with respect to the
use of the proceeds of each Bond issue, sufficient to establish compliance with applicable federal tax
requirements, including records related to periods before the Bonds are issued (e.g., in the case of
reimbursement of prior expenditures) until six (6) years after the final maturity or redemption date of any issue
of Bonds.
The Board directs the Superintendent to establish written procedures on the requirements to monitor
compliance with the arbitrage, yield restriction, and rebate requirements of Internal Revenue Code Section
148.
BOARD POLICY
Tax-Exempt Bond Post-Issuance Compliance & Continuing Disclosure Policy
8.10.040-P
Page 2
Federal Securities Law Policy:
It is the policy of the Portland Public School District (“the District”) to comply with applicable
requirements of the federal public securities law. This Policy is designed to set forth continuing disclosure
controls and procedures so that the District agrees to make certain kinds of information available to
participants in the public securities market.
To comply with applicable federal securities requirements, the District must confirm that continued
disclosure is met at the time each Bond issue is issued and throughout the term of the Bonds (until maturity or
redemption). Generally, compliance should include establishing who is responsible for reviewing, filing yearly
financial statements and submitting information in a timely manner for specified events.
The Board directs the Superintendent to establish written procedures on the requirements to monitor
compliance with the federal securities law and continuing disclosure requirements outlined in Rule 15c2-12 of
the Securities and Exchange Commission, adopted under the Securities Exchange Act of 1934, 17 CFR §
240.15c2-12.
Approved: April 2013. Revised: October 2015.
Reference: Internal Revenue Code Section 148
Rule 15c2-12 of the Securities and Exchange Commission
1
BOARD OF EDUCATION SCHOOL DISTRICT NO. 1J, MULTNOMAH COUNTY, OREGON
INDEX TO THE AGENDA
October 5, 2015
Board Action Number Page
Purchases, Bids, Contracts
5147 Revenue Contracts that Exceed $25,000 Limit for Delegation of Authority ............................... 3 5148 Expenditure Contracts that Exceed $150,000 for Delegation of Authority ................................ 4
Other Matters Requiring Board Approval
5149 Values and Policy Framework for District-Wide Enrollment Balancing ...................................... 7 5150 Revision of Tax-Exempt Bond Post-Issuance Compliance and Continuing Disclosure Policy ........................................................................................................................ 8 5151 Minutes ...................................................................................................................................... 8

2
Purchases, Bids, Contracts
The Superintendent RECOMMENDS adoption of the following items:
Numbers 5147 and 5148
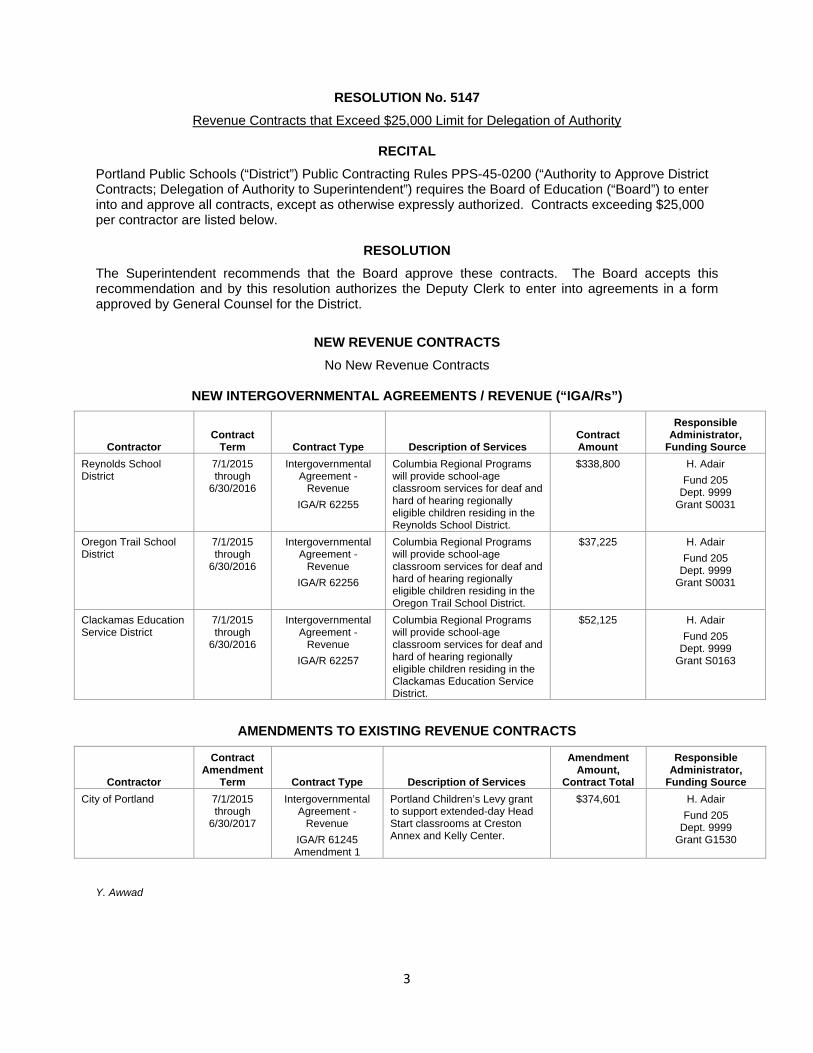
3
RESOLUTION No. 5147
Revenue Contracts that Exceed $25,000 Limit for Delegation of Authority
RECITAL
Portland Public Schools (“District”) Public Contracting Rules PPS-45-0200 (“Authority to Approve District Contracts; Delegation of Authority to Superintendent”) requires the Board of Education (“Board”) to enter into and approve all contracts, except as otherwise expressly authorized. Contracts exceeding $25,000 per contractor are listed below.
RESOLUTION
The Superintendent recommends that the Board approve these contracts. The Board accepts this recommendation and by this resolution authorizes the Deputy Clerk to enter into agreements in a form approved by General Counsel for the District.
NEW REVENUE CONTRACTS
No New Revenue Contracts
NEW INTERGOVERNMENTAL AGREEMENTS / REVENUE (“IGA/Rs”)
Contractor Contract
Term Contract Type Description of Services Contract Amount
Responsible Administrator,
Funding Source
Reynolds School District
7/1/2015 through
6/30/2016
Intergovernmental Agreement -
Revenue
IGA/R 62255
Columbia Regional Programs will provide school-age classroom services for deaf and hard of hearing regionally eligible children residing in the Reynolds School District.
$338,800 H. Adair
Fund 205 Dept. 9999
Grant S0031
Oregon Trail School District
7/1/2015 through
6/30/2016
Intergovernmental Agreement -
Revenue
IGA/R 62256
Columbia Regional Programs will provide school-age classroom services for deaf and hard of hearing regionally eligible children residing in the Oregon Trail School District.
$37,225 H. Adair
Fund 205 Dept. 9999
Grant S0031
Clackamas Education Service District
7/1/2015 through
6/30/2016
Intergovernmental Agreement -
Revenue
IGA/R 62257
Columbia Regional Programs will provide school-age classroom services for deaf and hard of hearing regionally eligible children residing in the Clackamas Education Service District.
$52,125 H. Adair
Fund 205 Dept. 9999
Grant S0163
AMENDMENTS TO EXISTING REVENUE CONTRACTS
Contractor
Contract Amendment
Term Contract Type Description of Services
Amendment Amount,
Contract Total
Responsible Administrator,
Funding Source
City of Portland 7/1/2015 through
6/30/2017
Intergovernmental Agreement -
Revenue
IGA/R 61245 Amendment 1
Portland Children’s Levy grant to support extended-day Head Start classrooms at Creston Annex and Kelly Center.
$374,601 H. Adair
Fund 205 Dept. 9999
Grant G1530
Y. Awwad
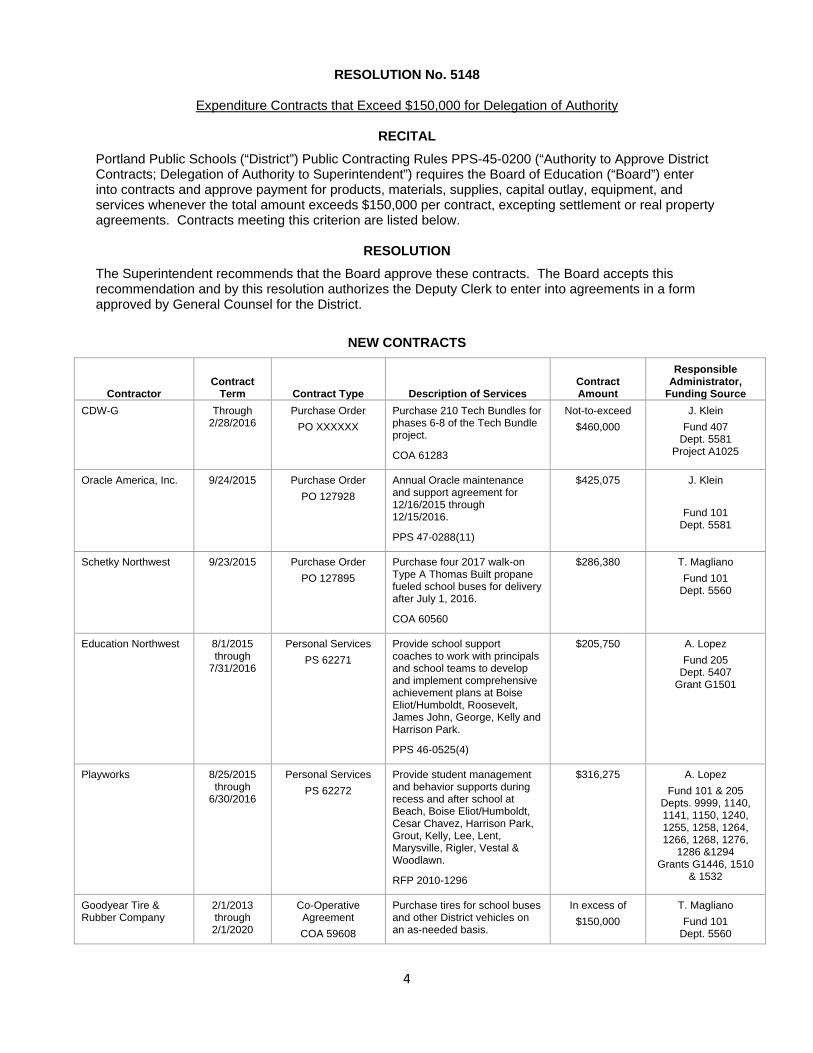
4
RESOLUTION No. 5148
Expenditure Contracts that Exceed $150,000 for Delegation of Authority
RECITAL
Portland Public Schools (“District”) Public Contracting Rules PPS-45-0200 (“Authority to Approve District Contracts; Delegation of Authority to Superintendent”) requires the Board of Education (“Board”) enter into contracts and approve payment for products, materials, supplies, capital outlay, equipment, and services whenever the total amount exceeds $150,000 per contract, excepting settlement or real property agreements. Contracts meeting this criterion are listed below.
RESOLUTION
The Superintendent recommends that the Board approve these contracts. The Board accepts this recommendation and by this resolution authorizes the Deputy Clerk to enter into agreements in a form approved by General Counsel for the District.
NEW CONTRACTS
Contractor Contract
Term Contract Type Description of Services Contract Amount
Responsible Administrator,
Funding Source
CDW-G Through 2/28/2016
Purchase Order
PO XXXXXX
Purchase 210 Tech Bundles for phases 6-8 of the Tech Bundle project.
COA 61283
Not-to-exceed
$460,000
J. Klein
Fund 407 Dept. 5581
Project A1025
Oracle America, Inc. 9/24/2015 Purchase Order
PO 127928
Annual Oracle maintenance and support agreement for 12/16/2015 through 12/15/2016.
PPS 47-0288(11)
$425,075 J. Klein
Fund 101 Dept. 5581
Schetky Northwest 9/23/2015 Purchase Order
PO 127895
Purchase four 2017 walk-on Type A Thomas Built propane fueled school buses for delivery after July 1, 2016.
COA 60560
$286,380 T. Magliano
Fund 101 Dept. 5560
Education Northwest 8/1/2015 through
7/31/2016
Personal Services
PS 62271
Provide school support coaches to work with principals and school teams to develop and implement comprehensive achievement plans at Boise Eliot/Humboldt, Roosevelt, James John, George, Kelly and Harrison Park.
PPS 46-0525(4)
$205,750 A. Lopez
Fund 205 Dept. 5407
Grant G1501
Playworks 8/25/2015 through
6/30/2016
Personal Services
PS 62272
Provide student management and behavior supports during recess and after school at Beach, Boise Eliot/Humboldt, Cesar Chavez, Harrison Park, Grout, Kelly, Lee, Lent, Marysville, Rigler, Vestal & Woodlawn.
RFP 2010-1296
$316,275 A. Lopez
Fund 101 & 205 Depts. 9999, 1140, 1141, 1150, 1240, 1255, 1258, 1264, 1266, 1268, 1276,
1286 &1294 Grants G1446, 1510
& 1532
Goodyear Tire & Rubber Company
2/1/2013 through 2/1/2020
Co-Operative Agreement
COA 59608
Purchase tires for school buses and other District vehicles on an as-needed basis.
In excess of
$150,000
T. Magliano
Fund 101 Dept. 5560
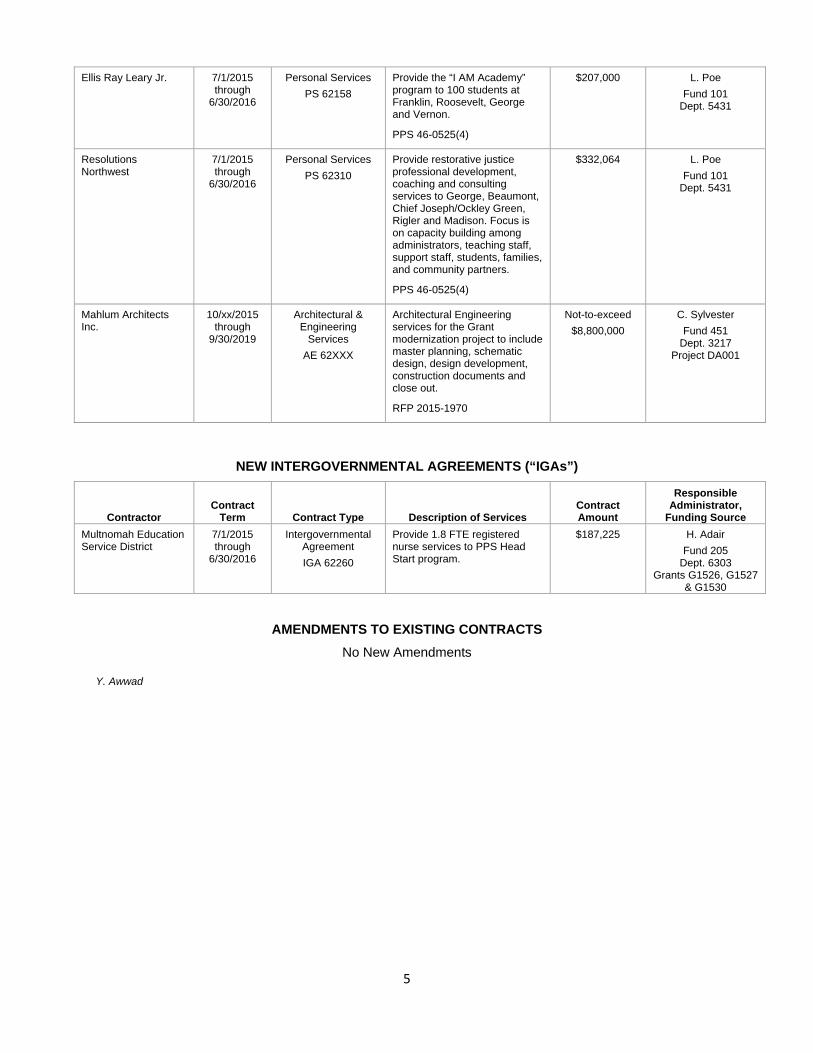
5
Ellis Ray Leary Jr. 7/1/2015 through
6/30/2016
Personal Services
PS 62158
Provide the “I AM Academy” program to 100 students at Franklin, Roosevelt, George and Vernon.
PPS 46-0525(4)
$207,000 L. Poe
Fund 101 Dept. 5431
Resolutions Northwest
7/1/2015 through
6/30/2016
Personal Services
PS 62310
Provide restorative justice professional development, coaching and consulting services to George, Beaumont, Chief Joseph/Ockley Green, Rigler and Madison. Focus is on capacity building among administrators, teaching staff, support staff, students, families, and community partners.
PPS 46-0525(4)
$332,064 L. Poe
Fund 101 Dept. 5431
Mahlum Architects Inc.
10/xx/2015 through
9/30/2019
Architectural & Engineering
Services
AE 62XXX
Architectural Engineering services for the Grant modernization project to include master planning, schematic design, design development, construction documents and close out.
RFP 2015-1970
Not-to-exceed
$8,800,000
C. Sylvester
Fund 451 Dept. 3217
Project DA001
NEW INTERGOVERNMENTAL AGREEMENTS (“IGAs”)
Contractor Contract
Term Contract Type Description of Services Contract Amount
Responsible Administrator,
Funding Source
Multnomah Education Service District
7/1/2015 through
6/30/2016
Intergovernmental Agreement
IGA 62260
Provide 1.8 FTE registered nurse services to PPS Head Start program.
$187,225 H. Adair
Fund 205 Dept. 6303
Grants G1526, G1527 & G1530
AMENDMENTS TO EXISTING CONTRACTS
No New Amendments
Y. Awwad

6
Other Matters Requiring Board Approval
The Superintendent RECOMMENDS adoption of the following items:
Numbers 5149 through 5151
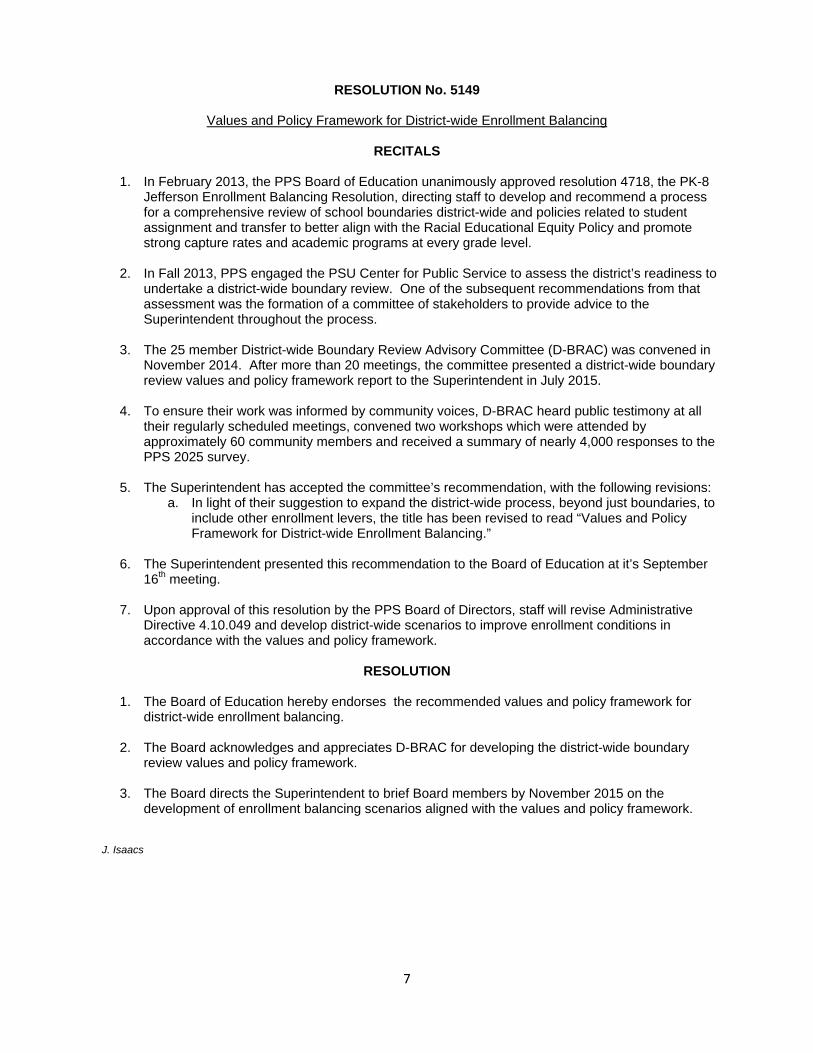
7
RESOLUTION No. 5149
Values and Policy Framework for District-wide Enrollment Balancing
RECITALS
1. In February 2013, the PPS Board of Education unanimously approved resolution 4718, the PK-8
Jefferson Enrollment Balancing Resolution, directing staff to develop and recommend a process for a comprehensive review of school boundaries district-wide and policies related to student assignment and transfer to better align with the Racial Educational Equity Policy and promote strong capture rates and academic programs at every grade level.
2. In Fall 2013, PPS engaged the PSU Center for Public Service to assess the district’s readiness to undertake a district-wide boundary review. One of the subsequent recommendations from that assessment was the formation of a committee of stakeholders to provide advice to the Superintendent throughout the process.
3. The 25 member District-wide Boundary Review Advisory Committee (D-BRAC) was convened in November 2014. After more than 20 meetings, the committee presented a district-wide boundary review values and policy framework report to the Superintendent in July 2015.
4. To ensure their work was informed by community voices, D-BRAC heard public testimony at all their regularly scheduled meetings, convened two workshops which were attended by approximately 60 community members and received a summary of nearly 4,000 responses to the PPS 2025 survey.
5. The Superintendent has accepted the committee’s recommendation, with the following revisions: a. In light of their suggestion to expand the district-wide process, beyond just boundaries, to
include other enrollment levers, the title has been revised to read “Values and Policy Framework for District-wide Enrollment Balancing.”
6. The Superintendent presented this recommendation to the Board of Education at it’s September 16th meeting.
7. Upon approval of this resolution by the PPS Board of Directors, staff will revise Administrative Directive 4.10.049 and develop district-wide scenarios to improve enrollment conditions in accordance with the values and policy framework.
RESOLUTION
1. The Board of Education hereby endorses the recommended values and policy framework for district-wide enrollment balancing.
2. The Board acknowledges and appreciates D-BRAC for developing the district-wide boundary review values and policy framework.
3. The Board directs the Superintendent to brief Board members by November 2015 on the development of enrollment balancing scenarios aligned with the values and policy framework.
J. Isaacs
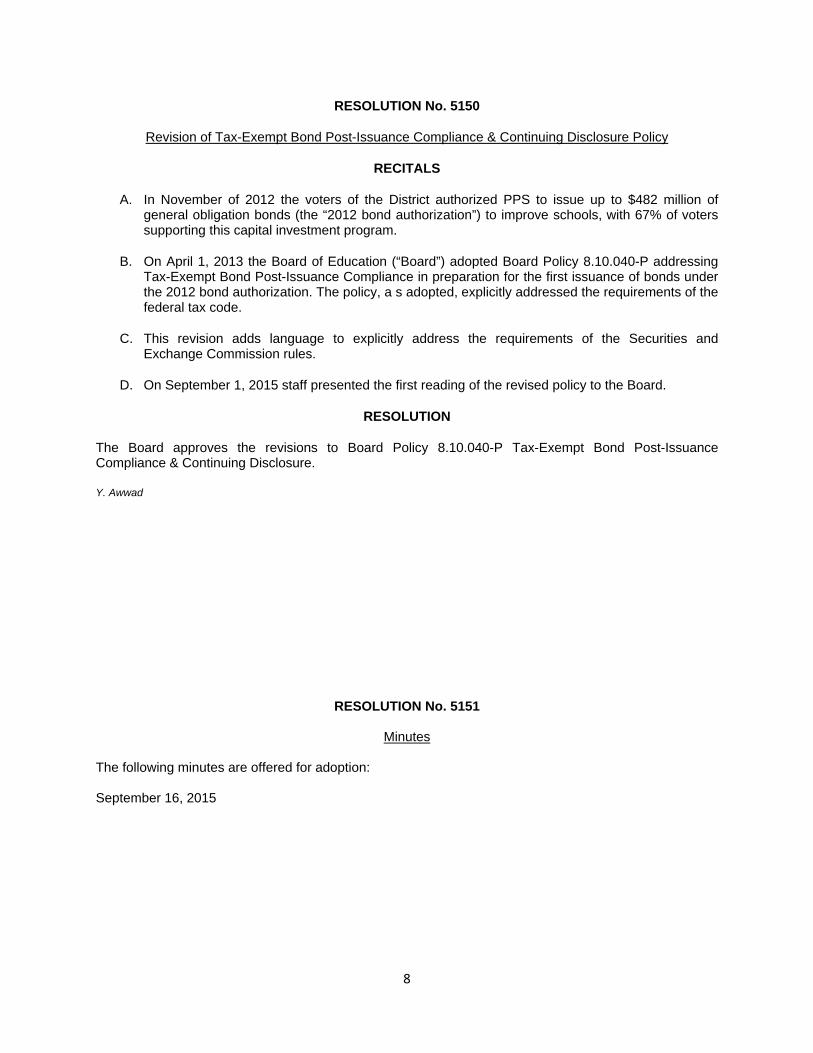
8
RESOLUTION No. 5150
Revision of Tax-Exempt Bond Post-Issuance Compliance & Continuing Disclosure Policy
RECITALS
A. In November of 2012 the voters of the District authorized PPS to issue up to $482 million of general obligation bonds (the “2012 bond authorization”) to improve schools, with 67% of voters supporting this capital investment program.
B. On April 1, 2013 the Board of Education (“Board”) adopted Board Policy 8.10.040-P addressing Tax-Exempt Bond Post-Issuance Compliance in preparation for the first issuance of bonds under the 2012 bond authorization. The policy, a s adopted, explicitly addressed the requirements of the federal tax code.
C. This revision adds language to explicitly address the requirements of the Securities and Exchange Commission rules.
D. On September 1, 2015 staff presented the first reading of the revised policy to the Board.
RESOLUTION
The Board approves the revisions to Board Policy 8.10.040-P Tax-Exempt Bond Post-Issuance Compliance & Continuing Disclosure.
Y. Awwad
RESOLUTION No. 5151
Minutes
The following minutes are offered for adoption: September 16, 2015
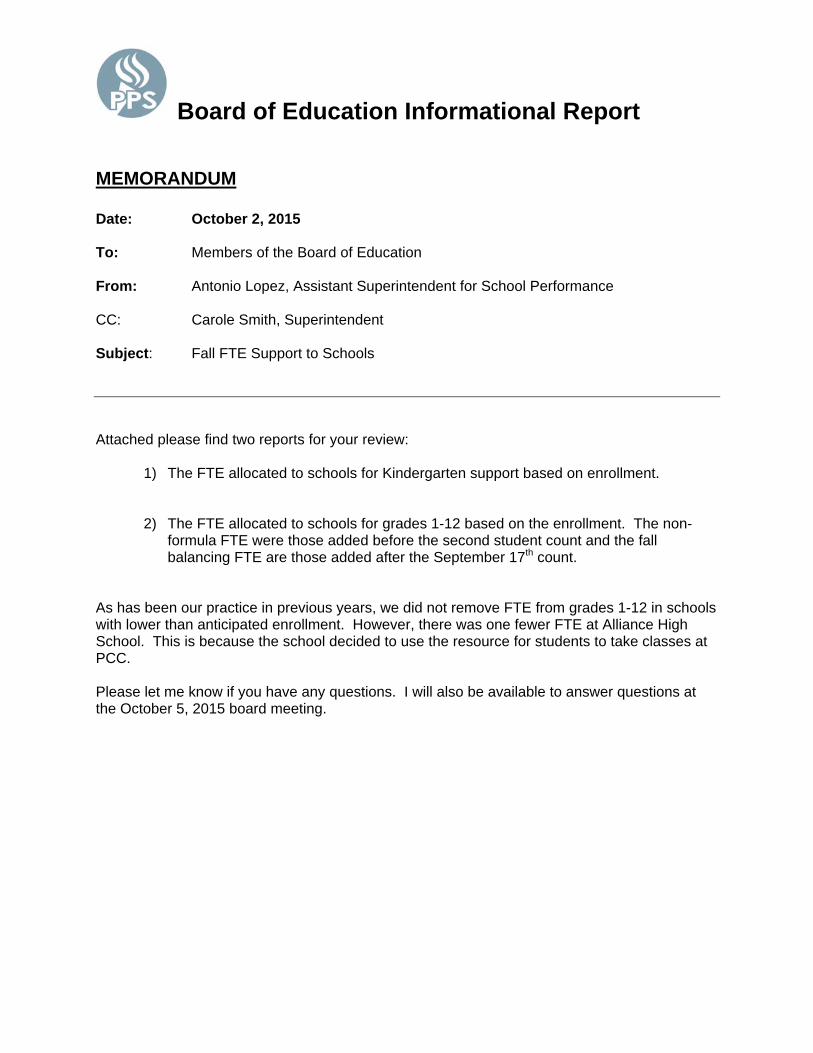
Board of Education Informational Report MEMORANDUM Date: October 2, 2015 To: Members of the Board of Education From: Antonio Lopez, Assistant Superintendent for School Performance CC: Carole Smith, Superintendent Subject: Fall FTE Support to Schools Attached please find two reports for your review:
1) The FTE allocated to schools for Kindergarten support based on enrollment.
2) The FTE allocated to schools for grades 1-12 based on the enrollment. The non-formula FTE were those added before the second student count and the fall balancing FTE are those added after the September 17th count.
As has been our practice in previous years, we did not remove FTE from grades 1-12 in schools with lower than anticipated enrollment. However, there was one fewer FTE at Alliance High School. This is because the school decided to use the resource for students to take classes at PCC. Please let me know if you have any questions. I will also be available to answer questions at the October 5, 2015 board meeting.
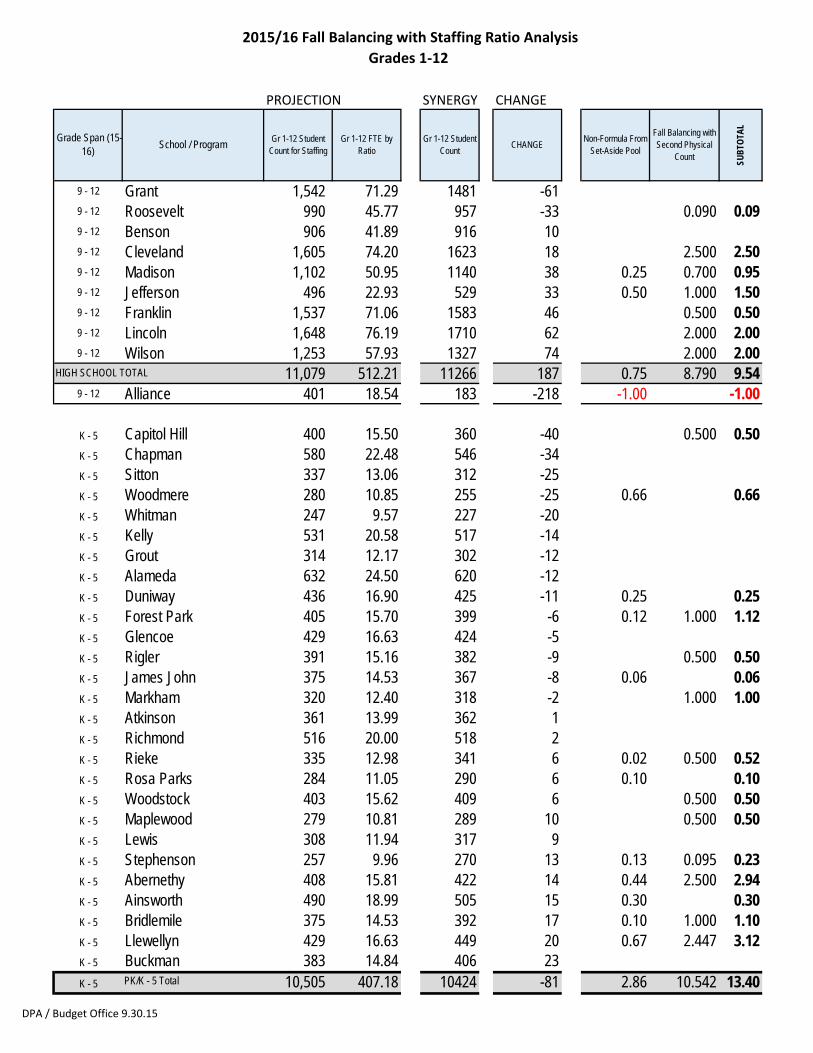
2015/16 Fall Balancing with Staffing Ratio AnalysisGrades 1-12
DPA / Budget Office 9.30.15
PROJECTION SYNERGY CHANGE
9 - 12 Grant 1,542 71.29 1481 -619 - 12 Roosevelt 990 45.77 957 -33 0.090 0.099 - 12 Benson 906 41.89 916 109 - 12 Cleveland 1,605 74.20 1623 18 2.500 2.509 - 12 Madison 1,102 50.95 1140 38 0.25 0.700 0.959 - 12 Jefferson 496 22.93 529 33 0.50 1.000 1.509 - 12 Franklin 1,537 71.06 1583 46 0.500 0.509 - 12 Lincoln 1,648 76.19 1710 62 2.000 2.009 - 12 Wilson 1,253 57.93 1327 74 2.000 2.00
11,079 512.21 11266 187 0.75 8.790 9.549 - 12 Alliance 401 18.54 183 -218 -1.00 -1.00
K - 5 Capitol Hill 400 15.50 360 -40 0.500 0.50K - 5 Chapman 580 22.48 546 -34K - 5 Sitton 337 13.06 312 -25K - 5 Woodmere 280 10.85 255 -25 0.66 0.66K - 5 Whitman 247 9.57 227 -20K - 5 Kelly 531 20.58 517 -14K - 5 Grout 314 12.17 302 -12K - 5 Alameda 632 24.50 620 -12K - 5 Duniway 436 16.90 425 -11 0.25 0.25K - 5 Forest Park 405 15.70 399 -6 0.12 1.000 1.12K - 5 Glencoe 429 16.63 424 -5K - 5 Rigler 391 15.16 382 -9 0.500 0.50K - 5 James John 375 14.53 367 -8 0.06 0.06K - 5 Markham 320 12.40 318 -2 1.000 1.00K - 5 Atkinson 361 13.99 362 1K - 5 Richmond 516 20.00 518 2K - 5 Rieke 335 12.98 341 6 0.02 0.500 0.52K - 5 Rosa Parks 284 11.05 290 6 0.10 0.10K - 5 Woodstock 403 15.62 409 6 0.500 0.50K - 5 Maplewood 279 10.81 289 10 0.500 0.50K - 5 Lewis 308 11.94 317 9K - 5 Stephenson 257 9.96 270 13 0.13 0.095 0.23K - 5 Abernethy 408 15.81 422 14 0.44 2.500 2.94K - 5 Ainsworth 490 18.99 505 15 0.30 0.30K - 5 Bridlemile 375 14.53 392 17 0.10 1.000 1.10K - 5 Llewellyn 429 16.63 449 20 0.67 2.447 3.12K - 5 Buckman 383 14.84 406 23K - 5 PK/K - 5 Total 10,505 407.18 10424 -81 2.86 10.542 13.40
HIGH SCHOOL TOTAL
Gr 1-12 Student Count
Grade Span (15-16) School / Program Gr 1-12 Student
Count for Staffing
SUBT
OTALFall Balancing with
Second Physical Count
Non-Formula From Set-Aside Pool
Gr 1-12 FTE by Ratio CHANGE
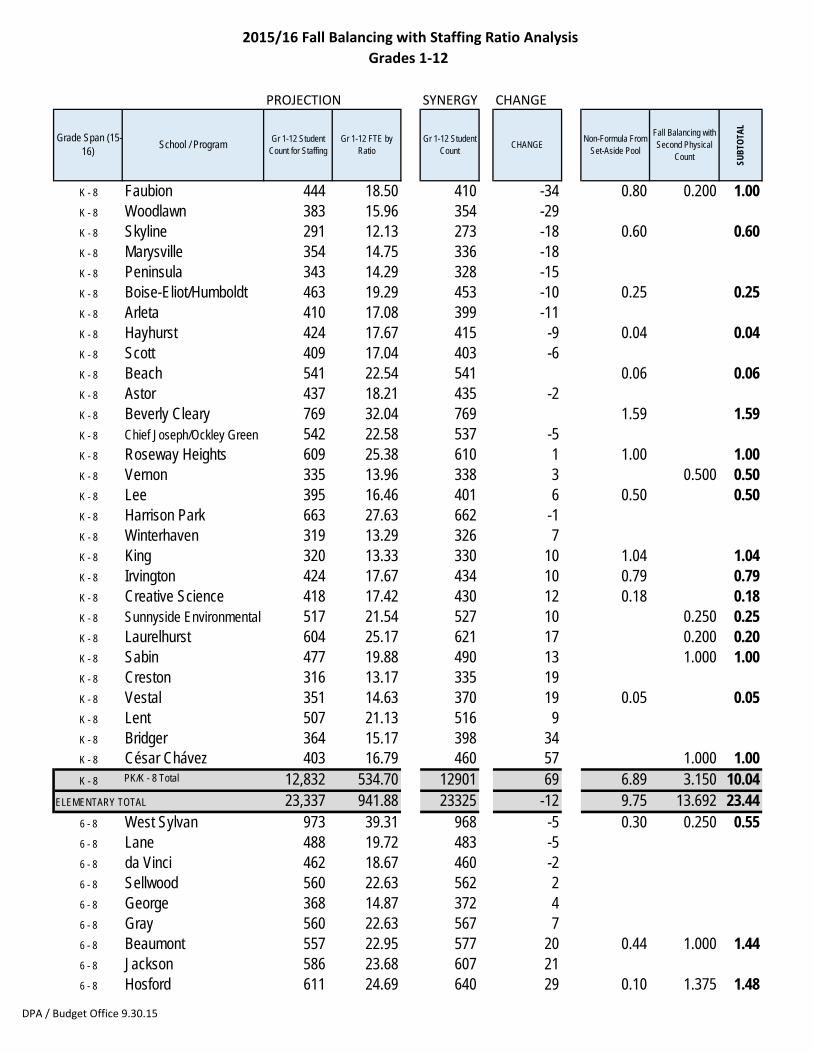
2015/16 Fall Balancing with Staffing Ratio AnalysisGrades 1-12
DPA / Budget Office 9.30.15
PROJECTION SYNERGY CHANGE
Gr 1-12 Student Count
Grade Span (15-16) School / Program Gr 1-12 Student
Count for Staffing
SUBT
OTALFall Balancing with
Second Physical Count
Non-Formula From Set-Aside Pool
Gr 1-12 FTE by Ratio CHANGE
K - 8 Faubion 444 18.50 410 -34 0.80 0.200 1.00K - 8 Woodlawn 383 15.96 354 -29K - 8 Skyline 291 12.13 273 -18 0.60 0.60K - 8 Marysville 354 14.75 336 -18K - 8 Peninsula 343 14.29 328 -15K - 8 Boise-Eliot/Humboldt 463 19.29 453 -10 0.25 0.25K - 8 Arleta 410 17.08 399 -11K - 8 Hayhurst 424 17.67 415 -9 0.04 0.04K - 8 Scott 409 17.04 403 -6K - 8 Beach 541 22.54 541 0.06 0.06K - 8 Astor 437 18.21 435 -2K - 8 Beverly Cleary 769 32.04 769 1.59 1.59K - 8 Chief Joseph/Ockley Green 542 22.58 537 -5K - 8 Roseway Heights 609 25.38 610 1 1.00 1.00K - 8 Vernon 335 13.96 338 3 0.500 0.50K - 8 Lee 395 16.46 401 6 0.50 0.50K - 8 Harrison Park 663 27.63 662 -1K - 8 Winterhaven 319 13.29 326 7K - 8 King 320 13.33 330 10 1.04 1.04K - 8 Irvington 424 17.67 434 10 0.79 0.79K - 8 Creative Science 418 17.42 430 12 0.18 0.18K - 8 Sunnyside Environmental 517 21.54 527 10 0.250 0.25K - 8 Laurelhurst 604 25.17 621 17 0.200 0.20K - 8 Sabin 477 19.88 490 13 1.000 1.00K - 8 Creston 316 13.17 335 19K - 8 Vestal 351 14.63 370 19 0.05 0.05K - 8 Lent 507 21.13 516 9K - 8 Bridger 364 15.17 398 34K - 8 César Chávez 403 16.79 460 57 1.000 1.00K - 8 PK/K - 8 Total 12,832 534.70 12901 69 6.89 3.150 10.04
ELEMENTARY TOTAL 23,337 941.88 23325 -12 9.75 13.692 23.446 - 8 West Sylvan 973 39.31 968 -5 0.30 0.250 0.556 - 8 Lane 488 19.72 483 -56 - 8 da Vinci 462 18.67 460 -26 - 8 Sellwood 560 22.63 562 26 - 8 George 368 14.87 372 46 - 8 Gray 560 22.63 567 76 - 8 Beaumont 557 22.95 577 20 0.44 1.000 1.446 - 8 Jackson 586 23.68 607 216 - 8 Hosford 611 24.69 640 29 0.10 1.375 1.48
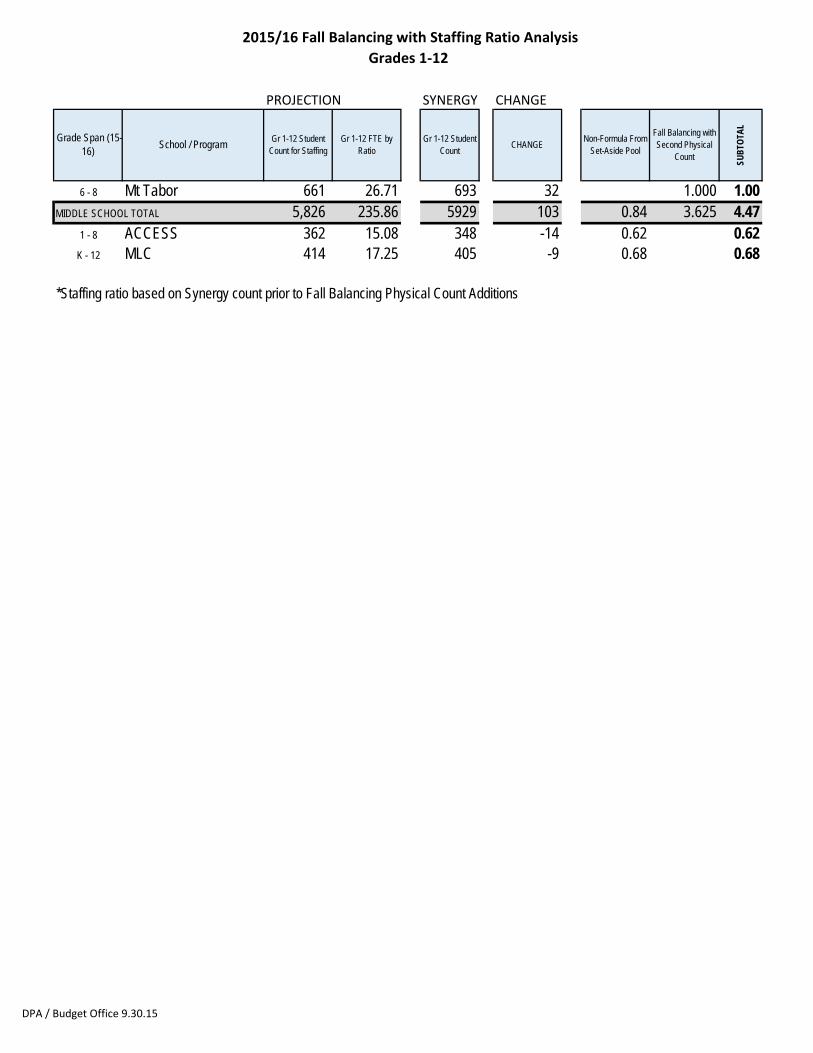
2015/16 Fall Balancing with Staffing Ratio AnalysisGrades 1-12
DPA / Budget Office 9.30.15
PROJECTION SYNERGY CHANGE
Gr 1-12 Student Count
Grade Span (15-16) School / Program Gr 1-12 Student
Count for Staffing
SUBT
OTALFall Balancing with
Second Physical Count
Non-Formula From Set-Aside Pool
Gr 1-12 FTE by Ratio CHANGE
6 - 8 Mt Tabor 661 26.71 693 32 1.000 1.00MIDDLE SCHOOL TOTAL 5,826 235.86 5929 103 0.84 3.625 4.47
1 - 8 ACCESS 362 15.08 348 -14 0.62 0.62K - 12 MLC 414 17.25 405 -9 0.68 0.68
*Staffing ratio based on Synergy count prior to Fall Balancing Physical Count Additions
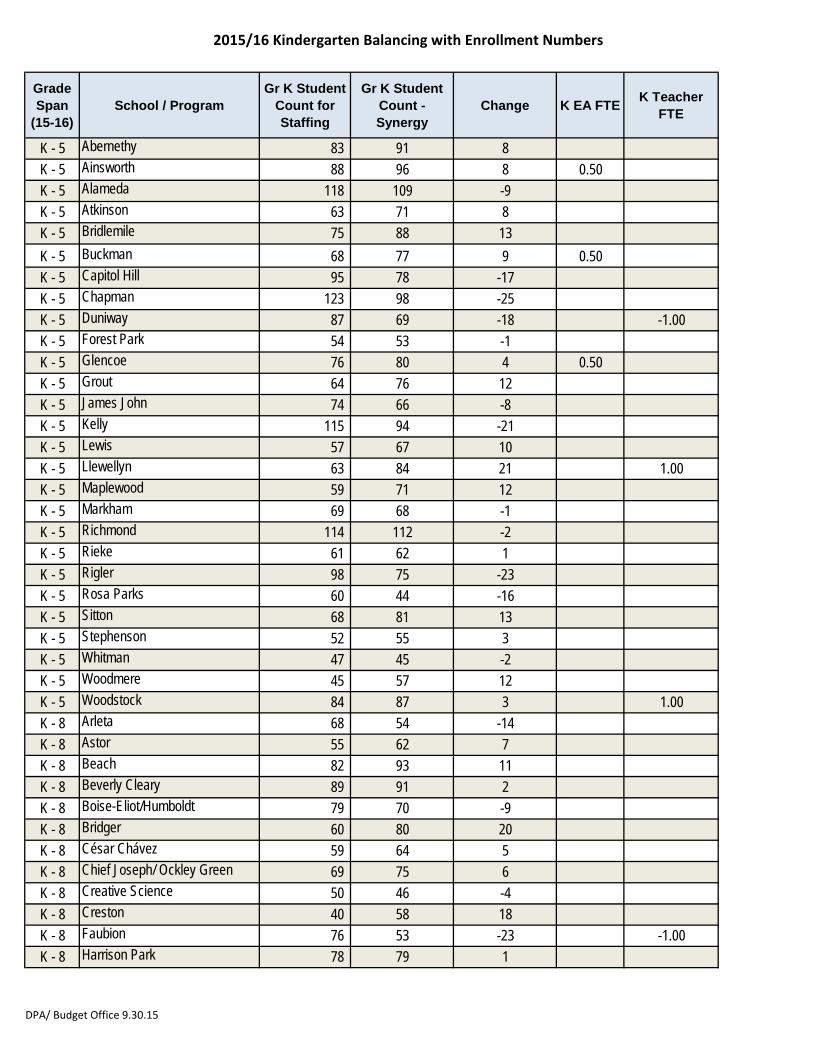
2015/16 Kindergarten Balancing with Enrollment Numbers
Grade Span
(15-16)School / Program
Gr K Student Count for Staffing
Gr K Student Count - Synergy
Change K EA FTEK Teacher
FTE
K - 5 Abernethy 83 91 8K - 5 Ainsworth 88 96 8 0.50K - 5 Alameda 118 109 -9K - 5 Atkinson 63 71 8K - 5 Bridlemile 75 88 13K - 5 Buckman 68 77 9 0.50K - 5 Capitol Hill 95 78 -17K - 5 Chapman 123 98 -25K - 5 Duniway 87 69 -18 -1.00K - 5 Forest Park 54 53 -1K - 5 Glencoe 76 80 4 0.50K - 5 Grout 64 76 12K - 5 James John 74 66 -8K - 5 Kelly 115 94 -21K - 5 Lewis 57 67 10K - 5 Llewellyn 63 84 21 1.00K - 5 Maplewood 59 71 12K - 5 Markham 69 68 -1K - 5 Richmond 114 112 -2K - 5 Rieke 61 62 1K - 5 Rigler 98 75 -23K - 5 Rosa Parks 60 44 -16K - 5 Sitton 68 81 13K - 5 Stephenson 52 55 3K - 5 Whitman 47 45 -2K - 5 Woodmere 45 57 12K - 5 Woodstock 84 87 3 1.00K - 8 Arleta 68 54 -14K - 8 Astor 55 62 7K - 8 Beach 82 93 11K - 8 Beverly Cleary 89 91 2K - 8 Boise-Eliot/Humboldt 79 70 -9K - 8 Bridger 60 80 20K - 8 César Chávez 59 64 5K - 8 Chief Joseph/ Ockley Green 69 75 6K - 8 Creative Science 50 46 -4K - 8 Creston 40 58 18K - 8 Faubion 76 53 -23 -1.00K - 8 Harrison Park 78 79 1
DPA/ Budget Office 9.30.15
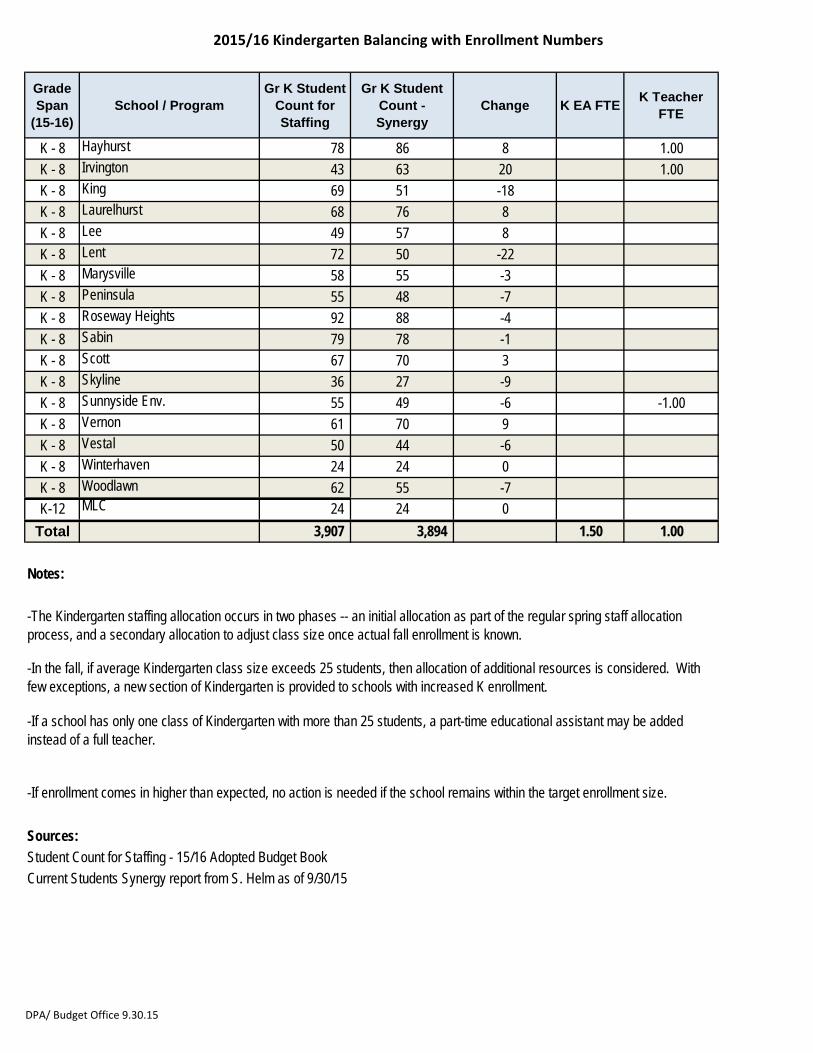
2015/16 Kindergarten Balancing with Enrollment Numbers
Grade Span
(15-16)School / Program
Gr K Student Count for Staffing
Gr K Student Count - Synergy
Change K EA FTEK Teacher
FTE
K - 8 Hayhurst 78 86 8 1.00K - 8 Irvington 43 63 20 1.00K - 8 King 69 51 -18K - 8 Laurelhurst 68 76 8K - 8 Lee 49 57 8K - 8 Lent 72 50 -22K - 8 Marysville 58 55 -3K - 8 Peninsula 55 48 -7K - 8 Roseway Heights 92 88 -4K - 8 Sabin 79 78 -1K - 8 Scott 67 70 3K - 8 Skyline 36 27 -9K - 8 Sunnyside Env. 55 49 -6 -1.00K - 8 Vernon 61 70 9K - 8 Vestal 50 44 -6K - 8 Winterhaven 24 24 0K - 8 Woodlawn 62 55 -7K-12 MLC 24 24 0
Total 3,907 3,894 1.50 1.00
Notes:
Sources:Student Count for Staffing - 15/16 Adopted Budget BookCurrent Students Synergy report from S. Helm as of 9/30/15
-The Kindergarten staffing allocation occurs in two phases -- an initial allocation as part of the regular spring staff allocation process, and a secondary allocation to adjust class size once actual fall enrollment is known.
-In the fall, if average Kindergarten class size exceeds 25 students, then allocation of additional resources is considered. With few exceptions, a new section of Kindergarten is provided to schools with increased K enrollment.
-If a school has only one class of Kindergarten with more than 25 students, a part-time educational assistant may be added instead of a full teacher.
-If enrollment comes in higher than expected, no action is needed if the school remains within the target enrollment size.
DPA/ Budget Office 9.30.15