Embed Size (px)
Citation preview

BOARD OF TRUSTEES
MEETING
February 23, 2017
6:00 p.m.
1

Belmont College
District Board of Trustees Meeting
February 23, 2017
6:00 p.m.
AGENDA
CALL TO ORDER Mrs. Elizabeth Gates, Chair
ROLL CALL Kristy Kosky
PLEDGE OF ALLEGIANCE
INTRODUCTION OF VISITORS Mrs. Elizabeth Gates, Chair
APPROVAL OF AGENDA Mrs. Elizabeth Gates, Chair
APPROVAL OF MINUTES Mrs. Elizabeth Gates, Chair A
CONSENT AGENDA
Administrative Items B
1. Audit Report FY15/16 B-1 2. Then and Now B-2
Monitoring Activities C
1. January 2017 Financial Report C-1
2. Semester Enrollment Report – Spring 2017 C-2
REPORTS & PRESENTATIONS N/A
PRESIDENT’S REPORT Dr. Paul Gasparro
UPCOMING EVENTS/MEETINGS Spring Graduation
May 5, 2017, 7:00 p.m., OUE Campus
COMMENTS FROM THE CHAIR Mrs. Elizabeth Gates, Chair
COMMENTS FROM
THE COLLEGE COMMUNITY
NEXT REGULAR MEETING March 23, 2017
Belmont College Board Room
*Workshop 5:00 p.m.
*Meeting 6:00 p.m.
EXECUTIVE SESSION Personnel
Campus Safety
ADJOURNMENT 2

TAB A MINUTES
3

TAB A-1 MINUTES January 2017
4

5
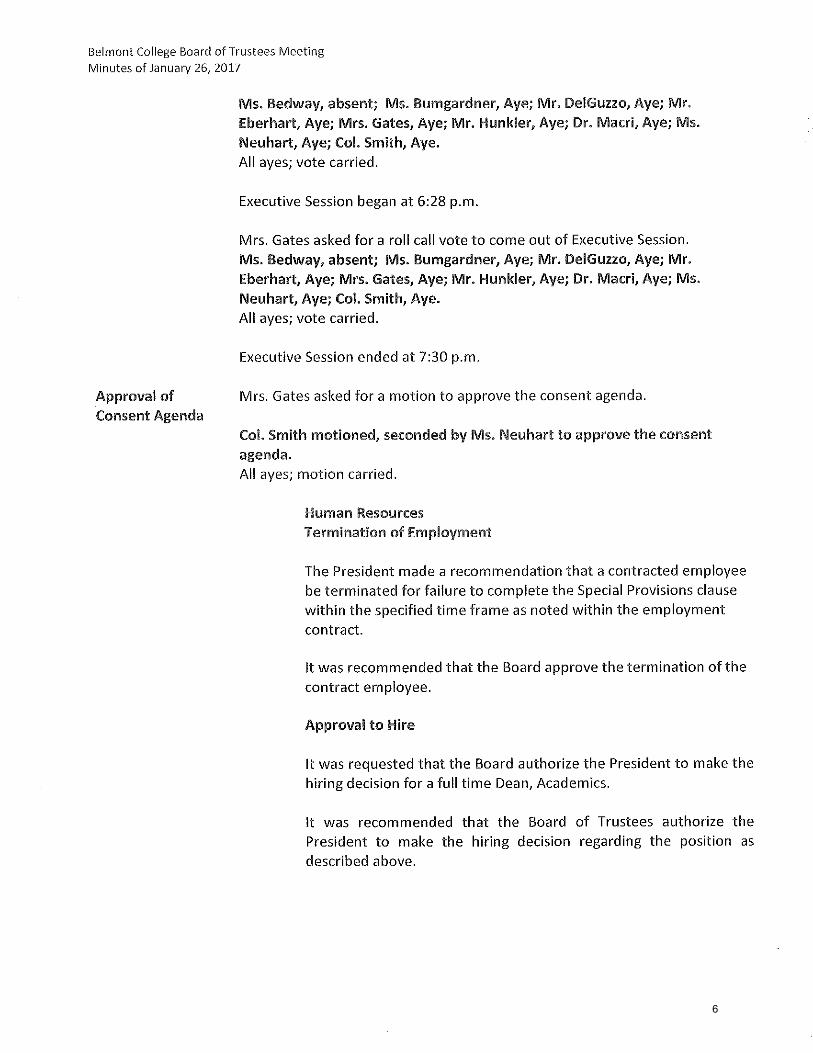
6

7

8

9

10

11

12

13

14

15

16

17
18
19

20

21

22

CONSENT
AGENDA
23

TAB B CONSENT AGENDA
Administrative Items
24
TAB B-1 CONSENT AGENDA
Administrative Items
Audit Report FY15/16
25
AGENDA ITEM B-1: AUDIT REPORT FY15/16 BOARD OF TRUSTEES MEETING DATE: FEBRUARY 23, 2017
John S. Koucoumaris, Vice President Administrative Affairs, will review the 2015/2016 Audited Financial Statements along
with Derek Conrad CPA, Senior Manager with Rea & Associates, Inc.
RECOMMENDATION: It is recommended that the Board accept the Audited Financial Statements for the 2015/2016
fiscal year.
SUBMITTED BY: John S. Koucoumaris, Vice President Administrative Affairs
26

Belmont CollegeBelmont County, Ohio
Audited Financial Statements
For the Fiscal Year EndedJune 30, 2016
27

BELMONT COLLEGE BELMONT COUNTY, OHIO
TABLE OF CONTENTS
TITLE PAGE Independent Auditor’s Report ................................................................................................. 1-3 Management’s Discussion and Analysis .................................................................................. 4-14 Basic Financial Statements: Statement of Net Position .................................................................................................. 15 Statement of Revenues, Expenses and Changes in Net Position ...................................... 16 Statement of Cash Flows ............................................................................................. …. 17 Notes to the Financial Statements ............................................................................................ 18-40 Required Supplementary Information: Schedule of the College’s Proportionate Share of the Net Pension Liability……………... ....... 41 Schedule of College Contributions ....................................................................................... 42-43 Independent Auditor’s Report on Internal Control Over Financial Reporting and on Compliance and Other Matters Based on an Audit of Financial Statements Performed in Accordance with Government Auditing Standards ......................................... 44-45 Independent Auditor’s Report on Compliance for Each Major Federal Program and Report on Internal Control over Compliance Required by the Uniform Guidance........................................................................................ 46-47 Schedule of Expenditures of Federal Awards .......................................................................... 48 Notes to the Schedule of Expenditures of Federal Awards ...................................................... 49 Schedule of Findings and Questioned Costs ............................................................................ 50
28

1
November 22, 2016 Board of Trustees Belmont College 68094 Hammond Road St. Clairsville, Ohio 43950
Independent Auditor's Report Report on the Financial Statements
We have audited the accompanying financial statements of Belmont College, Belmont County, Ohio, (the College) and the discretely presented component unit, as of and for the year ended June 30, 2016, and the related notes to the financial statements, which collectively comprise the College's basic financial statements as listed in the table of contents. Management's Responsibility for the Financial Statements
Management is responsible for the preparation and fair presentation of these financial statements in accordance with accounting principles generally accepted in the United States of America; this includes the design, implementation, and maintenance of internal control relevant to the preparation and fair presentation of financial statements that are free from material misstatement, whether due to fraud or error. Auditor's Responsibility Our responsibility is to express opinions on these financial statements based on our audit. We conducted our audit in accordance with auditing standards generally accepted in the United States of America and the standards applicable to financial audits contained in Government Auditing Standards, issued by the Comptroller General of the United States. Those standards require that we plan and perform the audit to obtain reasonable assurance about whether the financial statements are free from material misstatement. An audit involves performing procedures to obtain audit evidence about the amounts and disclosures in the financial statements. The procedures selected depend on the auditor's judgment, including the assessment of the risks of material misstatement of the financial statements, whether due to fraud or error. In making those risk assessments, the auditor considers internal control relevant to the College's preparation and fair presentation of the financial statements in order to design audit procedures that are appropriate in the circumstances, but not for the purpose of expressing an opinion on the effectiveness of the College's internal control. Accordingly, we express no such opinion. An audit also includes evaluating the appropriateness of accounting policies used and the reasonableness of significant accounting estimates made by management, as well as evaluating the overall presentation of the financial statements. We believe that the audit evidence we have obtained is sufficient and appropriate to provide a basis for our audit opinions.
29

2
Board of Trustees Belmont College Independent Auditor’s Report Page 2 of 3 Opinions In our opinion, the financial statements referred to above present fairly, in all material respects, the respective financial position of the College, and the discretely presented component unit, as of June 30, 2016, and the respective changes in financial position and cash flows thereof for the year then ended in accordance with accounting principles generally accepted in the United States of America.
Other Matters
Required Supplementary Information
Accounting principles generally accepted in the United States of America require that the Management’s Discussion and Analysis, Schedule of the College’s Proportionate Share of the Net Pension Liability, and Schedule of College Contributions on pages 4-14, 41 and 42-43, respectively, be presented to supplement the basic financial statements. Such information, although not a part of the basic financial statements, is required by the Governmental Accounting Standards Board who considers it to be an essential part of financial reporting for placing the basic financial statements in an appropriate operational, economic, or historical context. We have applied certain limited procedures to the required supplementary information in accordance with auditing standards generally accepted in the United States of America, which consisted of inquiries of management about the methods of preparing the information and comparing the information for consistency with management’s responses to our inquiries, the basic financial statements, and other knowledge we obtained during our audit of the basic financial statements. We do not express an opinion or provide any assurance on the information because the limited procedures do not provide us with sufficient evidence to express an opinion or provide any assurance. Other Information
Our audit was conducted for the purpose of forming opinions on the financial statements that collectively comprise the College's basic financial statements. The Schedule of Expenditures of Federal Awards, as required by Title 2 U.S. Code of Federal Regulations (CFR) Part 200, Uniform Administrative Requirements, Cost Principles, and Audit Requirements for Federal Awards (Uniform Guidance), is presented for purposes of additional analysis and is not a required part of the basic financial statements. The Schedule of Expenditures of Federal Awards is the responsibility of management and was derived from and relates directly to the underlying accounting and other records used to prepare the basic financial statements. Such information has been subjected to the auditing procedures applied in the audit of the basic financial statements and certain additional procedures, including comparing and reconciling such information directly to the underlying accounting and other records used to prepare the basic financial statements or to the basic financial statements themselves, and other additional procedures in accordance with auditing standards generally accepted in the United States of America. In our opinion, the Schedule of Expenditures of Federal Awards is fairly stated, in all material respects, in relation to the basic financial statements as a whole.
30

3
Board of Trustees Belmont College Independent Auditor’s Report Page 3 of 3 Other Reporting Required by Government Auditing Standards In accordance with Government Auditing Standards, we have also issued our report dated November 22, 2016 on our consideration of the College's internal control over financial reporting and on our tests of its compliance with certain provisions of laws, regulations, contracts, and grant agreements and other matters. The purpose of that report is to describe the scope of our testing of internal control over financial reporting and compliance and the results of that testing, and not to provide an opinion on internal control over financial reporting or on compliance. That report is an integral part of an audit performed in accordance with Government Auditing Standards in considering College's internal control over financial reporting and compliance.
New Philadelphia, Ohio
31

Belmont College Belmont County, Ohio
Management Discussion and Analysis For the Year Ended June 30, 2016
UNAUDITED
4
The discussion and analysis of Belmont College’s financial statements provides an overview of the College’s financial activities for the year ending June 30, 2016, with comparative information from fiscal year 2015. Management has prepared the financial statements and the related footnote disclosures along with the discussion and analysis. Responsibility for the completeness and fairness of this information rests with the preparers. The discussion and analysis contains financial activities of Belmont College. About Belmont College Belmont College is a two year college offering programs in business, engineering, allied health, and public service technologies. The College was chartered in 1971, allowing it to serve the three county areas of Belmont, Harrison, and Monroe Counties. Belmont College is governed by a board of nine trustees. The Governor of Ohio appoints three members, and six members are elected by a caucus of the boards of education of the school districts in the three counties served by the College. Financial Highlights Belmont College’s financial position, as a whole, improved during the fiscal year ending June 30, 2016. Its combined net position increased $740,119 from the previous year. The following chart provides a graphic breakdown of revenues by category for the fiscal year ending June 30, 2016:
In the fiscal year ending June 30, 2016, revenues and other support exceeded expenses, creating the increase in net position of $740,119 (compared to a $5,373,192 increase last year).
Operating Revenues
38%
Nonoperating Revenues
62%
TOTAL REVENUES
32

Belmont College Belmont County, Ohio
Management Discussion and Analysis For the Year Ended June 30, 2016
UNAUDITED
5
Using the Annual Report This annual report consists of three basic financial statements, prepared in accordance with Governmental Accounting Standards Board (GASB) Statement No. 35, Basic Financial Statements – and Management’s Discussion and Analysis – for Public Colleges and Universities (GASB 35). The Statement of Net Position; the Statement of Revenues, Expenses, and Changes in Net Position; and the Statement of Cash Flows, in a format similar to that used by corporations, provide information on the College as a whole and present a long-term view of the College’s finances. The following activities are included in the College’s basic financial statements:
• Primary Institution (College): Most of the programs and services generally associated with a university fall into this category, including instruction, research, public service, and support services.
• Component Unit (Foundation): The Foundation is a legally separate, tax-exempt organization supporting the College, is considered a component unit of the College, and is discretely presented in the College’s financial statements.
The Statement of Net Position and the Statement of Revenues, Expenses, and Changes in Net Position One of the most important questions asked about the College’s finances is, “Is Belmont College as a whole better off or worse off as a result of the year’s activities?” One key to answering this question is the financial statements of the College. The Statement of Net Position and the Statement of Revenues, Expenses, and Changes in Net Position report information on the College as a whole and on its activities in a way that helps answer this question. When revenues and other support exceed expenses, the result is an increase in net position. When the reverse occurs, the result is a decrease in net position. The relationship between revenues and expenses may be thought of as Belmont College’s operating results. These two statements report Belmont College’s net position and changes in them. Belmont College’s net position amount (the difference between assets, deferred outflows, liabilities and deferred inflows) is one way to measure the College’s financial health, or financial position. Over time, increases or decreases in the College’s net position are one indicator of whether its financial health is improving. However, several non-financial factors are relevant as well, such as the trend and quality of applicants, freshman class size, student retention, building condition, and campus safety, to assess the overall health of the College. The Statement of Net Position includes all assets, deferred outflows, liabilities and deferred inflows. It is prepared under the accrual basis of accounting, whereby revenues and assets are recognized when the service is provided and expenses and liabilities are recognized when others provide the service, regardless of when cash is exchanged. The Statement of Revenues, Expenses and Changes in Net Position presents the revenues earned and expenses incurred during the year. Activities are reported as either operating or nonoperating. GASB 35 requires state appropriations to be classified as nonoperating revenues. Accordingly, the College will generate a net operating loss prior to the addition of nonoperating revenues. The utilization of long-lived assets, referred to as capital assets, is reflected in the financial statements as depreciation, which amortizes the cost of an asset over its expected useful life.
33

Belmont College Belmont County, Ohio
Management Discussion and Analysis For the Year Ended June 30, 2016
UNAUDITED
6
Another important factor to consider when evaluating financial viability is the College’s ability to meet financial obligations as they become due. The Statement of Cash Flows presents information related to cash inflows and outflows, summarized by operating, capital, financing and investing activities. These statements include all assets, deferred outflows, liabilities and deferred inflows using the accrual basis of accounting, which is similar to the accounting used by most private-sector institutions. All of the current year’s revenues and expenses are taken into account regardless of when cash is received or paid. The Notes to the Financial Statements provide additional details on the numbers in the financial statements. In addition to the Summary of Significant Accounting Policies, the report includes notes on capital assets, long-term debt, and operating expenses by natural classification.
Condensed Financial Information Statement of Net Position
2016 2015
AssetsCurrent Assets $ 13,265,630 $ 14,194,490 Capital assets, net of accumulated depreciation 14,824,044 13,886,714Other noncurrent assets 153,075 156,694Total assets 28,242,749 28,237,898
Deferred Outflows of ResourcesTotal deferred inflows of resoureces 1,258,799 891,597
LiabilitiesCurrent Liabilities 1,379,215 1,822,618Noncurrent Liabilities 13,542,448 14,212,190Total liabilities 14,921,663 16,034,808
Total deferred inflows of resoureces 3,298,215 2,553,136
Net PositionNet Investment in Capital Assets 14,293,639 12,865,776Restricted Nonexpendable 56,510 56,510 Expendable 3,822,262 4,448,854Unrestricted (6,890,741) (6,829,589)Total Net Position $ 11,281,670 $ 10,541,551
In 2015, the College adopted GASB Statement 68, Accounting and Financial Reporting for Pensions—an Amendment of GASB Statement 27, which significantly revises accounting for pension costs and liabilities. For reasons discussed below, many end users of this financial statement will gain a clearer understanding of the College’s actual financial condition by adding deferred inflows related to pension and the net pension liability to the reported net position and subtracting deferred outflows related to pension.
34

Belmont College Belmont County, Ohio
Management Discussion and Analysis For the Year Ended June 30, 2016
UNAUDITED
7
Governmental Accounting Standards Board standards are national and apply to all government financial reports prepared in accordance with generally accepted accounting principles. When accounting for pension costs, GASB 27 focused on a funding approach. This approach limited pension costs to contributions annually required by law, which may or may not be sufficient to fully fund each plan’s net pension liability. GASB 68 takes an earnings approach to pension accounting; however, the nature of Ohio’s statewide pension systems and state law governing those systems requires additional explanation in order to properly understand the information presented in these statements. Under the new standards required by GASB 68, the net pension liability equals the College’s proportionate share of each plan’s collective:
1. Present value of estimated future pension benefits attributable to active and inactive employees’ past service
2. Minus plan assets available to pay these benefits GASB notes that pension obligations, whether funded or unfunded, are part of the “employment exchange” – that is, the employee is trading his or her labor in exchange for wages, benefits, and the promise of a future pension. GASB noted that the unfunded portion of this pension promise is a present obligation of the government, part of a bargained-for benefit to the employee, and should accordingly be reported by the government as a liability since they received the benefit of the exchange. However, the College is not responsible for certain key factors affecting the balance of this liability. In Ohio, the employee shares the obligation of funding pension benefits with the employer. Both employer and employee contribution rates are capped by State statute. A change in these caps requires action of both Houses of the General Assembly and approval of the Governor. Benefit provisions are also determined by State statute. The employee enters the employment exchange with the knowledge that the employer’s promise is limited not by contract but by law. The employer enters the exchange also knowing that there is a specific, legal limit to its contribution to the pension system. In Ohio, there is no legal means to enforce the unfunded liability of the pension system as against the public employer. State law operates to mitigate/lessen the moral obligation of the public employer to the employee, because all parties enter the employment exchange with notice as to the law. The pension system is responsible for the administration of the plan. Most long-term liabilities have set repayment schedules or, in the case of compensated absences (i.e. sick and vacation leave), are satisfied through paid time-off or termination payments. There is no repayment schedule for the net pension liability. As explained above, changes in pension benefits, contribution rates, and return on investments affect the balance of the net pension liability, but are outside the control of the local government. In the event that contributions, investment returns, and other changes are insufficient to keep up with required pension payments, State statute does not assign/identify the responsible party for the unfunded portion. Due to the unique nature of how the net pension liability is satisfied, this liability is separately identified within the long-term liability section of the statement of net position. In accordance with GASB 68, the College’s statements prepared on an accrual basis of accounting include an annual pension expense for their proportionate share of each plan’s change in net pension liability not accounted for as deferred inflows/outflows of resources. The College is also reporting a net pension liability and deferred inflows/outflows of resources related to pension on the accrual basis of accounting.
35
Belmont College Belmont County, Ohio
Management Discussion and Analysis For the Year Ended June 30, 2016
UNAUDITED
8
A review of the College’s statement of net position at June 30, 2016 shows that the College continues to build a strong financial foundation. Assets: As of June 30, 2016, the College’s total assets amount to $28,242,749. Investment in capital assets totaled $14,824,044, or 52 percent, of total assets. Cash and cash equivalents represented $977,704, or 3 percent, of total assets. Investments represented $10,814,866, or 38 percent of total assets. Liabilities and deferred inflows of resources: At June 30, 2016, total liabilities and deferred inflows of resources amounted to $18,219,878. Current liabilities represented $1,379,215 or 8 percent, net pension liabilities totaled $13,464,780 or 74 percent, other long-term liabilities totaled $77,668 or .4% and deferred inflows of resources totaled $3,298,215 or 18% of total liabilities and deferred inflows of resources. Net Position: Net position at June 30, 2016 totaled $11,281,670. Net investment in capital assets totaled $14,293,639, restricted net position totaled $3,878,772 and unrestricted net position totaled ($6,890,741).
This space intentionally left blank
36

Belmont College Belmont County, Ohio
Management Discussion and Analysis For the Year Ended June 30, 2016
UNAUDITED
9
Statement of Revenues, Expenses, and Changes in Net Position
2016 2015 Change
Operating Revenues:Tuition and fees 3,825,894$ 3,263,785$ 562,109$ Grants and contracts 243,799 195,171 48,628Auxiliary services 772,422 863,719 (91,297)Other 80,145 127,628 (47,483)
Total operating revenues 4,922,260 4,450,303 471,957
Operating Expenses: Education and General 10,394,121 11,058,562 (664,441)
Depreciation 991,719 536,201 455,518Auxiliary enterprises 723,958 785,576 (61,618)
Total operating expenses 12,109,798 12,380,339 (270,541)Operating Loss (7,187,538) (7,930,036) 742,498
Nonoperating Revenues (Expenses):State appropriations 5,036,546 5,133,594 (97,048)Interest and Fiscal Charges (29,230) 0 (29,230)Other nonoperating revenues 2,082,646 2,844,371 (761,725)
Net nonoperating revenues (expenses) 7,089,962 7,977,965 (888,003)
Income (loss) before other revenues (97,576) 47,929 (145,505)
Capital appropriations 337,695 317,986 19,709Capital grants and gifts 500,000 5,007,277 (4,507,277)
Increase in net position 740,119 5,373,192 (4,633,073)
NET POSITION, beginning of year 10,541,551 5,168,359 5,373,192
NET POSITION, end of year 11,281,670$ 10,541,551$ 740,119$
37

Belmont College Belmont County, Ohio
Management Discussion and Analysis For the Year Ended June 30, 2016
UNAUDITED
10
Total operating revenues were $4,922,260 for the year ended June 30, 2016. The most significant sources of operating revenue for the College are net tuition and fees which comprise 77 percent of total operating revenues and auxiliary enterprises, which is the bookstore and it comprises 16 percent of total operating revenues. There are other significant recurring sources of revenues essential to the operation of the College, including state appropriations, federal Pell grants, and investment income, which are considered nonoperating revenues as defined by GASB 35. The College’s state appropriations for the year ended June 30, 2016, amounted to $5,036,546 and Pell grant awards amounted to $1,963,383.
Tuition and Fees77%
Sales and Services16%
Grants and Contracts
5%
Other Sources2%
OPERATING REVENUES - FISCAL YEAR 2016
38

Belmont College Belmont County, Ohio
Management Discussion and Analysis For the Year Ended June 30, 2016
UNAUDITED
11
Instructional35%
Public Service1%
Academic Support6%
Student Services4%
Institutional Support27%
Operation and Maintenance of Plant
7%
Depreciation8%
Scholarships and Grants
6%
Auxiliary Enterprises6%
OPERATING EXPENSES - FISCAL YEAR 2016
Operating expenses, including $991,719 of depreciation, totaled $12,109,798. As depicted in the chart above, the majority of the College’s operating funds are expended directly for the primary mission of the College – instruction (35 percent), scholarships and grants (6 percent), institutional support (27 percent), and academic support (6 percent). One of the College’s core values is to provide students’ access to the College with the opportunity to succeed. The College’s continued investment in student financial aid programs and student support services reflects this commitment.
39

Belmont College Belmont County, Ohio
Management Discussion and Analysis For the Year Ended June 30, 2016
UNAUDITED
12
The Statement of Cash Flows Another way to assess the financial health of an institution is to look at the Statement of Cash Flows. Its primary purpose is to provide relevant information about the cash receipts and cash payments of an entity during a period. The Statement of Cash Flows also helps user access:
• an entity’s ability to generate future net cash flows
• its ability to meet its obligations as they come due
• its need for external financing
2016 2015 ChangeCash provided by (used by): Operating activities (6,121,193)$ (7,870,274)$ 1,749,081$ Noncapital financing activities 7,026,202 7,706,905 (680,703) Capital and related financing activities (1,611,116) (1,887,760) 276,644 Investing activities 185,660 3,062,729 (2,877,069) Net increase (decrease) in cash (520,447) 1,011,600 (1,532,047)
Cash, beginning of year 1,498,151 486,551 1,011,600
Cash, end of year 977,704$ 1,498,151$ (520,447)$
Statement of Cash Flows
Major cash sources of funds included in operating activities are student tuition and fees of $3,806,788, grants and contracts of $249,553 and auxiliary services of $754,903. The largest cash payments for operating activities were to employees for wages and benefits. The largest cash receipts in the noncapital financing activities group are federal grants and the operating appropriation from the State of Ohio.
40

Belmont College Belmont County, Ohio
Management Discussion and Analysis For the Year Ended June 30, 2016
UNAUDITED
13
Capital and Debt Administration Capital Assets At June 30, 2016, the College had $14,824,044 invested in capital assets, net of accumulated depreciation of $8,667,785. Depreciation charges totaled $991,719 for the current fiscal year. Details of these assets for the two years are shown below:
2016 2015 ChangeCapital AssetsLand and land improvements 434,744$ 503,869$ (69,125)$ Construction in Progress 0 7,474,580 (7,474,580)Buildings and improvements 12,685,743 5,369,207 7,316,536Machinery and equipment 1,619,686 439,294 1,180,392Vehicles 62,734 76,553 (13,819)Library books and materials 21,137 23,211 (2,074)
Totals 14,824,044$ 13,886,714$ 937,330$
More detailed information about the College’s capital assets is presented in Note 7 to the financial statements. Debt The College had no debt outstanding at June 30, 2016. Economic Factors that Will Affect the Future Belmont College is committed to providing the highest quality academic opportunities possible, while simultaneously ensuring students have access to affordable higher education. As a political subdivision of the State of Ohio, the College receives a portion of its revenue through state support for higher education, also referred to as “state share of instruction.” State funds significantly help to keep tuition rates low. As of the first day of classes on August 22, 2016, the number of students enrolled for the fall term has climbed 11.92 percent compared to the same time-period last year. This enrollment growth follows a recent spring 2016 headcount enrollment increase of 7.36 percent and establishes an increase for two consecutive years. The College has begun implementing a ‘BeConnected’ initiative which provides an iPad to every student, faculty member and the majority of staff members. The purpose of BeConnected is to encourage completion and retention, as well as to enhance the way Belmont College teaches and prepares students for the technology-driven careers that await them. The initiative also supports the Belmont’s Sustainability Program, as it greatly reduces the need/cost for books, printing and paper supplies.
41

Belmont College Belmont County, Ohio
Management Discussion and Analysis For the Year Ended June 30, 2016
UNAUDITED
14
In the fall of 2015, Belmont College opened the new Health Sciences Center, accommodating all Allied Health programs including: Associate Degree Nursing (ADN), Licensed Practical Nursing (LPN), and Medical Assisting Technologies. The new building houses state-of-the-art classroom and science labs for biology, anatomy, and chemistry that enhances the learning environment and provides opportunities for students to nurture collaboration and creativity. With the addition of this facility, Belmont College hopes to continue to strengthen enrollment in the health sciences sector. In addition to the new Health Sciences Center, the Board of Trustees recently approved a plan to undertake extensive renovations to the Main Campus Building, which was built in 1971. Some of these updates include: a new bookstore and student lounge area, renovated restrooms and mechanical systems. Belmont College is conscientious of the financial implications regarding enrollment decline. While a recent climb in enrollment has occurred, the college is prepared in case enrollment falls again. As a result, Belmont has implemented a strategy combining calculated risk and budget adjustments to stabilize and enhance revenue where possible, and to compensate for revenue reduction where necessary. The overall financial health of Belmont College is strong, having more than adequate cash flow and reserves. Though the business of higher education is rapidly changing, Belmont College is strategically positioned to adapt to the emerging paradigms. Contacting the College’s Financial Management This financial report is designed to provide the Ohio Department of Education, our citizens, taxpayers, and investors and creditors with a general overview of the College’s finances and to show the College’s accountability for the money it received. If you have questions about this report, or need additional financial information, contact John S. Koucoumaris, Vice President of Administrative Affairs, at Belmont College, 68094 Hammond Road, St. Clairsville, Ohio 43950.
42

BELMONT COLLEGEBELMONT COUNTY, OHIOSTATEMENT OF NET POSITIONFor the Fiscal Year Ended June 30, 2016
Component UnitBelmont College
Belmont College FoundationASSETSCurrent Assets: Cash and cash equivalents 967,835$ 78,576$ Investments 10,671,660 392,518 Interest receivable 50,232 0 Accounts receivable, net 1,463,490 0 Supplies inventory, at cost 112,413 0 Total current assets 13,265,630 471,094 Noncurrent Assets: Restricted cash and cash equivalents 9,869 0 Restricted investments 143,206 306,779 Capital assets, non-depreciable 276,000 0 Capital assets, net of accumulated depreciation 14,548,044 0 Total noncurrent assets 14,977,119 306,779 TOTAL ASSETS 28,242,749 777,873
DEFERRED OUTFLOWS OF RESOURCESPension: STRS 1,038,319 0 SERS 220,480 0 TOTAL DEFERRED OUTFLOWS OF RESOURCES 1,258,799 0
LIABILITIESCurrent Liabilities: Contracts payable 134,630 0 Accrued liabilities 329,758 11,825 Accrued vacation/sick leave 263,211 0 Capital lease 374,302 0 Deferred fees income 277,314 0 Total current liabilities 1,379,215 11,825 Noncurrent Liabilities: Accrued vacation/sick leave 56,195 0 Capital lease 21,473 0 Net Pension Liabilities (see notes) 13,464,780 0 Total noncurrent liabilities 13,542,448 0 TOTAL LIABILITIES 14,921,663 11,825
DEFERRED INFLOWS OF RESOURCESPension: STRS 2,673,205 0 SERS 625,010 0 Total deferred inflows of resources 3,298,215 0
NET POSITIONNet Investment in Capital Assets 14,293,639 0 Restricted: Nonexpendable: Scholarships 56,510 320,756 Expendable: Scholarships 133,305 176,598 Instructional Department uses 989,345 0 Capital projects 2,699,612 0 Unrestricted (6,890,741) 268,695 TOTAL NET POSITION 11,281,670$ 766,049$
The accompanying notes are in integral part of these financial statements.
1543

BELMONT COLLEGEBELMONT COUNTY, OHIOSTATEMENT OF REVENUES, EXPENSES, AND CHANGES IN NET POSITIONFor the Fiscal Year Ended June 30, 2016
Component UnitBelmont College
Belmont College FoundationREVENUE:Operating Revenues: Student tuition and fees (net of scholarship allowances of $413,923 & $1,355,771) 3,825,894$ 0$ State grants and contracts 90,737 0 Federal grants and contracts 153,062 0 Private gifts and contracts 0 112,858 Auxiliary Enterprises: Sales and services 772,422 0 Other sources 80,145 0 Total revenues 4,922,260 112,858
EXPENSES:Operating Expenses: Educational and General: Instructional 4,190,158 0 Public service 66,249 0 Academic support 744,097 0 Student services 507,156 0 Institutional support 3,261,812 584,800 Operation and maintenance of plant 885,377 0 Depreciation 991,719 0 Scholarships and grants 739,272 37,349 Total Educational and General 11,385,840 622,149
Auxiliary Enterprises 723,958 0 Total Expenses 12,109,798 622,149
Operating Loss (7,187,538) (509,291)
NONOPERATING REVENUES (EXPENSES): State appropriations 5,036,546 0 Federal Grants & Contracts 1,963,383 0 Gifts 26,273 0 Investment income 92,990 22,590 Interest and Fiscal Charges (29,230) 0 Unrealized gain on Investments 0 (2,322) Net nonoperating revenues (expenses) 7,089,962 20,268
Income before other revenues, expenses, gains or losses (97,576) (489,023)
Capital appropriations 337,695 0 Capital grants and gifts 500,000 0 Total other revenues 837,695 0
Increase in Net Position 740,119 (489,023)
Net Position, Beginning of Year 10,541,551 1,255,072
Net Position, End of Year 11,281,670$ 766,049$
The accompanying notes are in integral part of these financial statements.
1644

BELMONT COLLEGESTATEMENT OF CASH FLOWSFor the Fiscal Year Ended June 30, 2016
Component UnitBelmont College
Belmont College FoundationINCREASE (DECREASE) IN CASH AND CASH EQUIVALENTSCash Flows from Operating Activities: Tuition and fees 3,806,788$ 0$ Grants and contracts 249,553 125,730 Payments to suppliers (2,101,406) (89,470) Payments for utilities (317,637) 0 Payments to employees (6,347,916) 0 Payments for benefits (1,506,351) 0 Payments for scholarships and grants (739,272) (537,349) Auxiliary Enterprises: Book Store 754,903 0 Other receipts 80,145 0 Net cash used by operating activities (6,121,193) (501,089)
Cash Flows from Non-Capital and Related Financing Activities: State appropriations 5,036,546 0 Federal Grants (Pell Grant - Non Operating) 1,963,383 0 Gifts and grants 26,273 0 Net cash provided by non-capital and related financing activities 7,026,202 0
Cash Flows from Capital and Related Financing Activities: Purchase of capital assets (2,214,005) 0 Principal Paid on Leases (205,576) 0 Interest paid on leases (29,230) 0 Capital Grants 500,000 0 Capital Appropriations 337,695 0 Net cash used by capital and related financing activities (1,611,116) 0
Cash Flows from Investing Activities: Interest on investments 153,972 20,268 Proceeds from sales and maturities of investments 121,838 364,381 Purchase of investments (90,150) 0 Net cash used by investing activities 185,660 384,649
Net decrease in cash and cash equivalents (520,447) (116,440)
Cash and Cash Equivalents, beginning of year 1,498,151 195,016
Cash and Cash Equivalents, end of year 977,704 78,576
RECONCILIATION OF OPERATING LOSS TO NET CASHPROVIDED (USED) BY OPERATING ACTIVITIES:Operating loss (7,187,538) (509,291) Adjustments to reconcile operating loss to netcash provided (used) by operating activities: Depreciation 991,719 0 (Increase)/Decrease in Assets and Deferred Outflows of Resources: Receivables, net (20,344) 12,872 Inventories (6,969) 0 Deferred Outflows STRS 11,556 0 Deferred Outflows SERS (378,758) 0 Increase/(Decrease) in Liabilities and Deferred Inflows of Resources: Accrued liabilities 363,224 (4,670) Net Pension Liabilities (705,353) 0 Deferred Inflows - STRS 136,027 0 Deferred Inflows - SERS 609,052 0 Compensated absences 56,847 0 Deferred revenue 9,344 0
Net cash used by operating activities (6,121,193)$ (501,089)$
NONCASH TRANSACTIONS: During fiscal year 2016 the College entered into capital leases amounting to $601,351 for technology equipment. At June 30, 2016, the College purchased $134,630 in capital assets on account. At June 30, 2015, the College purchased $1,020,938 in capital assets on account.
The accompanying notes are in integral part of these financial statements.
1745

BELMONT COLLEGE BELMONT COUNTY, OHIO
NOTES TO THE FINANCIAL STATEMENTS FOR THE FISCAL YEAR ENDED JUNE 30, 2016
18
NOTE 1 - DESCRIPTION OF THE REPORTING ENTITY Belmont College is a body politic and corporate established for the purpose of exercising the rights and privileges conveyed to it by the constitution and the laws of the State of Ohio. Belmont College is a technical college as defined by Section 3357.01 of the Ohio Revised Code. The College operates under an appointed Board of Trustees. Management believes the financial statements included in this report represent all of the funds of the College over which the College has the ability to exercise direct operating control. Belmont College Foundation (Foundation) is a legally separate, tax-exempt organization supporting the College. The Foundation acts primarily as a fundraising organization to supplement the resources that are available to the College in support of its programs. Although the College does not control the timing or amount of receipts from the Foundation, the majority of resources, or incomes thereon, that the Founda-tion holds and invests, are restricted to the activities of the College by donors. Based upon the provisions in Governmental Accounting Standards Board (GASB) Statement No. 14 – Reporting Entity and subse-quent amendments in GASB Statement No. 39, the Foundation is considered a component unit of the College and is discretely presented in the College’s financial statements. NOTE 2 – SUMMARY OF SIGNIFICANT ACCOUNTING POLICIES A. Basis of Presentation The accompanying financial statements are presented in accordance with accounting principles generally accepted in the United States of America as prescribed by the Government Accounting Standards Board (GASB). Pursuant to the provisions of GASB Statement No. 34, Basic Financial Statements – and Management’s Discussion and Analysis – for State and Local Governments, as amended by GASB Statement No. 35, Basic Financial Statements – and Management’s Discussion and Analysis – For Public Colleges and Universities the full scope of the College’s activities is considered to be a single business-type activity (BTA) and accordingly, is reported within a single column in the basic financial statements. B. Basis of Accounting The financial statements of the College have been prepared using the economic resource measurement focus and the accrual basis of accounting. Under the accrual basis, revenues are recognized when earned, and expenses are recorded when an obligation has been incurred. Grants and similar items are recognized as revenue as soon as all eligibility requirements imposed by the provider have been met. In accordance with GASB Statement No. 20, Accounting and Financial Reporting for Proprietary Funds and Other Governmental Entities That Use Proprietary Fund Accounting, the College is required to follow all applicable GASB pronouncements.
46

BELMONT COLLEGE BELMONT COUNTY, OHIO
NOTES TO THE FINANCIAL STATEMENTS FOR THE FISCAL YEAR ENDED JUNE 30, 2016
19
NOTE 2 – SUMMARY OF SIGNIFICANT ACCOUNTING POLICIES (Continued) C. Cash and Cash Equivalents This classification appears on the Statement of Net Position and the Statement of Cash Flows and in-cludes petty cash, cash on deposit with private bank accounts and savings accounts. For purposes of the statement of cash flows and for presentation of the statement of net position, investments with original maturities of three months or less at the time they are purchased by the College are considered to be cash and cash equivalents. Investments with an initial maturity of more than three months are reported as investments. D. Investments Investments, when purchased, are stated at cost and, if received through gift, at market value at the date of gift if a market value is available; otherwise, they are stated at an appraisal or nominal value. The College has invested in certificates of deposit during the fiscal year. E. Receivables Receivables consist of tuition and fees and charges to students and charges for auxiliary enterprises’ sales and services. Receivables also include amounts due from the Federal government, state and local governments, and private sources in connections with reimbursements of allowable expenditures made pursuant to contracts and grants, and pledges that are verifiable, measurable, and expected to be collected and available for expenditures for which the resource provider’s conditions have been satisfied. Receiva-bles are recorded net of estimated uncollectible amounts. F. Allowance for Doubtful Accounts The allowance for doubtful accounts is determined by management based on the College’s historical losses, specific student circumstances and general economic conditions. Periodically, management reviews accounts receivable and records an allowance for specific students based on current circumstanc-es and charges off the receivable against the allowance when all attempts to collect the receivable have failed. G. Inventories Inventories, consisting of expendable supplies and merchandise for resale, are stated at the lower of cost or market value using the first-in, first-out method. H. Capital Assets Capital assets are stated at cost at date of acquisition or fair market value at date of donation in the case of gifts. The College capitalizes assets that have a value or cost in excess of $5,000 at the date of acquisition and an expected useful life of one or more years. Library books are significant in the aggregate and are therefore also capitalized.
47
BELMONT COLLEGE BELMONT COUNTY, OHIO
NOTES TO THE FINANCIAL STATEMENTS FOR THE FISCAL YEAR ENDED JUNE 30, 2016
20
NOTE 2 – SUMMARY OF SIGNIFICANT ACCOUNTING POLICIES (Continued) Depreciation is computed using the straight-line method over the estimated useful lives of the assets, generally 10 to 50 years for buildings, 5 to 15 years for land improvements, 3 to 15 years for equipment, 10 years for vehicles and 5 years for library books and materials. I. Restricted Assets Restricted assets represent assets whose use is restricted by external parties or by law through constitu-tional provisions or enabling legislation. J. Noncurrent Long-Term Liabilities Noncurrent long-term liabilities include compensated absences, capital leases and net pension liabilities which will not be paid within the next fiscal year. K. Compensated Absences The College has adopted GASB No. 16. Vacation leave and other compensated absences with similar characteristics should be accrued as a liability as the benefits are earned by the employees if both of these conditions are met: a. The employee’s right to receive compensation is attributable to services already rendered. b. It is probable that the employer will compensate the employees for the benefits through paid
time off or some other means, such as cash payments at termination or retirement. A liability sick leave and other compensated absences with similar characteristics (hereinafter referred to as “sick leave”) should be accrued using one of the following termination approaches: a. The sick leave liability generally would be an estimate based on governmental entity’s past
experience of making termination payments for sick leave, adjusted for the effects of changes in its termination payment policy and other current factors. This approach is known as the termination payment method.
b. The sick leave liability would be an accrual for those employees expected to become eligible in the near future based on assumptions concerning the probability that individual employees or classes or groups of employees will become eligible to receive termination benefits. This accumulation should be reduced to the maximum amount allowed as a termination benefit. This approach is known as the vesting method.
For sick leave liability, the College uses the vesting method. The College posts a liability for any em-ployee within five years of retirement. These accumulations are reduced to the maximum amount allowed as a termination payment.
48

BELMONT COLLEGE BELMONT COUNTY, OHIO
NOTES TO THE FINANCIAL STATEMENTS FOR THE FISCAL YEAR ENDED JUNE 30, 2016
21
NOTE 2 – SUMMARY OF SIGNIFICANT ACCOUNTING POLICIES (Continued) L. Deferred Outflows/Inflows of Resources In addition to assets, the statements of financial position will sometimes report a separate section for deferred outflows of resources. Deferred outflows of resources represent a consumption of net position that applies to a future period and will not be recognized as an outflow of resources (expense/expenditure) until then. For the College, deferred outflows of resources are reported on the statement of net position for pension. The deferred outflows of resources related to pension are explained in Note 11. In addition to liabilities, the statements of financial position report a separate section for deferred inflows of resources. Deferred inflows of resources represent an acquisition of net position that applies to a future period and will not be recognized until that time. For the College, deferred inflows of resources are for pension related inflows. Deferred inflows of resources related to pension are reported on the statement of net position and are explained in Note 11. M. Pensions For purposes of measuring the net pension liability, deferred outflows of resources and deferred inflows of resources related to pensions, and pension expense, information about the fiduciary net position of the pension plans and additions to/deductions from their fiduciary net positon have been determined on the same basis as they are reported by the pension systems. For this purpose, benefit payments (including refunds of employee contributions) are recognized when due and payable in accordance with the benefit terms. The pension systems report investments at fair value. N. Net Position The College’s net position is classified as follows:
Net Investment in Capital Assets – This represents the College’s total investment in capital assets, net of accumulated depreciation and outstanding debt obligations related to those capital assets.
Restricted Net Position – Nonexpendable – Nonexpendable restricted net position includes en-dowments and similar type assets whose use is limited by donors or other outside sources and as a condition of the gift, the principal is to be maintained in perpetuity.
Restricted Net Position – Expendable – Expendable restricted net position includes resources in
which the College is legally or contractually obligated to spend the resources in accordance with re-strictions imposed by external parties.
Unrestricted Net Position – Unrestricted net position includes resources derived from student tui-tion and fees, sales and services, unrestricted gifts, and interest income.
Restricted and unrestricted resources are tracked using a fund accounting system and are spent in
accordance with established fund authorities. Fund authorities provide rules for the fund activity and are separately established for restricted and unrestricted activities. When both restricted and unrestricted funds are available for expenditure, the decision for funding is transactional based within the departmental management system in place at the College.
49

BELMONT COLLEGE BELMONT COUNTY, OHIO
NOTES TO THE FINANCIAL STATEMENTS FOR THE FISCAL YEAR ENDED JUNE 30, 2016
22
NOTE 2 – SUMMARY OF SIGNIFICANT ACCOUNTING POLICIES (Continued) O. Scholarship Allowances Student tuition and fees revenue and certain other revenues from College charges are reported net of scholarship allowances in the accompanying Statement of Revenues, Expenses, and Changes in Net Position. The scholarship allowance is the difference between the actual charge for goods and services provided by the College and the amount that is paid by students or by third parties on the students’ behalf. Student financial assistance grants, such as Pell grants, and other federal, state or nongovernmental programs, are recorded as either operating or non-operating revenues in the accompanying Statement of Revenues, Expenses, and Changes in Net Position. To the extent that revenues from these programs are used to satisfy tuition, fees, and other charges, the College has recorded a scholarship allowance discount. P. Operating Activity The College defines operating activities, as reported on the statement of revenues, expenses, and changes in net position, as those that generally results from exchange transactions, such as payments received for providing goods and services and payments made for services and goods received. Nearly all of the College’s expenses are from exchange transactions. Certain significant revenues relied upon for opera-tions, such as state appropriations, grants, contracts and investments income, are recorded as non-operating revenues, in accordance with GASB Statement No. 35. In addition, the GASB Implementation Guide has indicated PELL grants should be considered non-operating revenues beginning in fiscal year 2009. Q. Budgetary Process Annually, the Business Office develops a balanced budget for the College based on projected expendi-tures from department directors and anticipated revenue, including tuition and fees and the subsidy from the Ohio Board of Regents. The board of trustees approves the budget. R. Income Taxes Income taxes have not been provided on the general operations of the College because, as a state institu-tion, its income is exempt from Federal income taxes under Section 115 of the Internal Revenue Code. S. Use of Estimates Management of the College has made estimates and assumptions relating to the reporting of assets and liabilities to prepare these financial statements in conformity with accounting principles generally accepted in the United States of America. Actual results could differ from those estimates.
50

BELMONT COLLEGE BELMONT COUNTY, OHIO
NOTES TO THE FINANCIAL STATEMENTS FOR THE FISCAL YEAR ENDED JUNE 30, 2016
23
NOTE 2 – SUMMARY OF SIGNIFICANT ACCOUNTING POLICIES (Continued) T. Implementation of New Accounting Policies For the fiscal year ended June 30, 2016, the College has implemented Governmental Accounting Stand-ards Board (GASB) Statement No. 72, Fair Value Measurement and Application, GASB Statement No. 73, Accounting and Financial Reporting for Pensions and Related Assets That Are Not within the Scope of GASB Statement 68, and Amendments to Certain Provisions of GASB Statements 67 and 68, GASB Statement No. 76, The Hierarchy of Generally Accepted Accounting Principles for State and Local Governments and GASB Statement No. 79, Certain External Investment Pools and Pool Participants. GASB Statement No. 72 clarifies the definition of fair value for financial reporting purposes, establishes general principles for measuring fair value, provides additional fair value application guidance, and enhances disclosures about fair value measurements. The implementation of GASB Statement No. 72 did not have an effect on the financial statements of the College. GASB Statement No. 73 establishes requirements for defined benefit pensions that are not within the scope of GASB Statement No. 68 as well as for the assets accumulated for purposes of providing those pensions. In addition, it establishes requirements for defined contribution pensions that are not within the scope of Statement 68. It also clarifies the application of certain provisions of GASB Statements 67 and 68. The implementation of GASB Statement No. 73 did not have an effect on the financial statements of the College. GASB Statement No. 76 reduces the GAAP hierarchy to two categories of authoritative GAAP and addresses the use of authoritative and nonauthoritative literature in the event that the accounting treatment for a transaction or other event is not specified within a source of authoritative GAAP. The implementa-tion of GASB Statement No. 76 did not have an effect on the financial statements of the College. GASB Statement No. 79 addresses accounting and financial reporting for certain external investment pools and pool participants. Specifically, it establishes criteria for an external investment pool to qualify for making the election to measure all of its investments at amortized cost for financial reporting purpos-es. The implementation of GASB Statement No. 79 did not have an effect on the financial statements of the College. NOTE 3 – STATE SUPPORT The College is a state-assisted institution of higher education which receives a student-based subsidy from the State of Ohio. This subsidy is determined annually based on a formula devised by the Ohio Board of Regents. In addition to the student subsidies, the State of Ohio provides the funding for the construction of major plant facilities on the College’s campus. The funding is obtained from the issuance of special obligation bonds issued by the Ohio Public Facilities Commission (OPFC), which precedes in turn causes, the construction of subsequent lease of the facility to the Ohio Board of Regents. Upon completion of a facility, the Board of Regents turns over control to the College, which capitalizes the cost thereof. Neither the obligation for special obligation bonds issued by OPFC, nor the annual debt service charges for principal and interest on the bonds are reflected in the College’s financial statements. These costs are currently being funded through appropriations to the Board of Regents by the General Assembly.
51

BELMONT COLLEGE BELMONT COUNTY, OHIO
NOTES TO THE FINANCIAL STATEMENTS FOR THE FISCAL YEAR ENDED JUNE 30, 2016
24
NOTE 3 – STATE SUPPORT (Continued) The facilities are not pledged as collateral for the special obligation bonds. Instead, the bonds are supported by a pledge of monies in the Higher Education Bond Service Fund established in the custody of the Treasurer of State. If sufficient monies are not available from this fund, a pledge exists to assess a special student fee uniformly applicable to students in the state-assisted institutions of higher education throughout the state. A. Construction in progress for any portion of the facilities being financed by state agencies for
use by the College should be recorded on the College’s books of account until such time as the facility is completed.
B. Outstanding debt issued by OPFC is not included on the College’s balance sheet. In addition,
the appropriations by the General Assembly to the Board of Regents for payment of debt ser-vice are not reflected as appropriation revenue received by the College, and the related debt service payments are not recorded in the College’s accounts.
NOTE 4 – DEPOSITS AND INVESTMENTS State statutes classify monies held by the College into three categories. Active deposits are public deposits necessary to meet current demand on the treasury. Such monies must be maintained either as cash in the College treasury, in commercial accounts payable or withdrawable on demand, including negotiable order of withdrawal (NOW) accounts, or in money market deposit ac-counts. Inactive deposits are public deposits the Board of Trustees has identified as not required for use within the current two year period of designation of depositories. Inactive deposits must either by evidenced by certificates of deposit maturing not later than the end of the current period of designation or depositories, or by savings or deposit accounts including, but not limited to, passbook accounts. Interim deposits are deposits of interim monies. Interim monies are those monies which are not needed for immediate use but which will be needed before the end of the current period of designation of deposi-tories. Interim deposits must be evidenced by time certificates of deposit maturing not more than one year from the date of deposit or by savings accounts including passbook accounts. Interim monies may be deposited or invested in the following securities: 1. United States Treasury Notes, Bills, Bonds, or any other obligation or security issued by the
United States Treasury or any other obligation guaranteed as to principal and interest by the United States;
2. Bonds, notes, debentures, or any other obligations or securities issued by any federal gov-
ernment agency or instrumentality, including but not limited to, the Federal National Mort-gage Association, Federal Home Loan Bank, Federal Farm Credit Bank, Federal Home Loan Mortgage Corporation, Government National Mortgage Association, and Student Loan Mar-keting Association. All federal agency securities shall be direct issuances of federal govern-ment agencies or instrumentalities;
52

BELMONT COLLEGE BELMONT COUNTY, OHIO
NOTES TO THE FINANCIAL STATEMENTS FOR THE FISCAL YEAR ENDED JUNE 30, 2016
25
NOTE 4 – DEPOSITS AND INVESTMENTS (Continued) 3. Written repurchase agreements in the securities listed above provided that the market value of
the securities subject to the repurchase agreement must exceed the principal value of the agreement by at least two percent and be marked to market daily, and that the term of the agreement must not exceed thirty days;
4. Bond and other obligations of the State of Ohio. 5. Time certificates of deposit or savings or deposit accounts including, but not limited to, pass-
book accounts;
6. No-load money market mutual funds consisting exclusively of obligations described in divi-sion (1) or (2) and repurchase agreements secured by such obligations, provided that invest-ments in securities described in this division are made only through eligible institutions;
7. The State Treasurer’s investment pool (STAROhio and Star Plus); 8. Certain bankers’ acceptances and commercial paper notes for a period not to exceed one
hundred and eighty days in an amount not to exceed twenty-five percent of the interim mon-ies available for investment at any one time.
Protection of the College’s deposits is provided by the Federal Deposit Insurance Corporation (FDIC), by eligible securities pledged by the financial institution as security for repayment, by surety company bonds deposited with the treasurer by the financial institution or by a single collateral pool established by the financial institution to secure the repayment of all public monies deposited with the institution. Investments in stripped principal or interest obligations reverse repurchase agreements and derivatives are prohibited. The issuance of taxable notes for the purpose of arbitrage, the use of leverage and short selling are also prohibited. An investment must mature within five years from the date of purchase unless matched to a specific obligation or debt of the College, and must be purchased with the expectation that it will be held to maturity. Investments may only be made through specified dealers and institutions. Payment for investments may be made only upon delivery of the securities representing the investments to the treasurer or qualified trustee or, if the securities are not represented by a certificate, upon receipt of confirmation of transfer from the custodian. According to State law, public depositories must give security for all public funds on deposit. These institutions may either specifically collateralize individual accounts in lieu of amounts insured by FDIC, or may pledge a pool of government securities valued at least 105 percent of the total value of public monies on deposit at the institution. Repurchase agreements must be secured by the specific government securities upon which the repurchase agreements are based. These securities must be obligations of or guaranteed by the United States and mature or be redeemable within 5 years of the date of the related repurchase agreement. State law does not require security for public deposits and investments to be maintained in the College’s name. During 2016, the College and public depositories complied with the provisions of these statutes.
53

BELMONT COLLEGE BELMONT COUNTY, OHIO
NOTES TO THE FINANCIAL STATEMENTS FOR THE FISCAL YEAR ENDED JUNE 30, 2016
26
NOTE 4 – DEPOSITS AND INVESTMENTS (Continued) Cash on Hand: At year end, the College had $915 in undeposited cash on hand, which is included in the statement of net position of the College as part of cash and cash equivalents. Custodial Credit Risk - Deposits: Custodial credit risk is the risk that, in the event of a bank failure, the College’s deposits may not be returned. All deposits are collateralized with eligible securities in amounts equal to at least 105% of the carrying value of the deposits. Such collateral, as permitted by the Ohio Revised Code, is held in single financial institution collateral pools at Federal Reserve Banks, or at member banks of the Federal Reserve System, in the name of the respective depository bank and pledged as collateral against all of the public deposits it holds or as specific collateral held at the Federal Reserve Bank in the name of the College. At fiscal year-end, the carrying amount of the College’s deposits was $11,791,655. Based on the criteria described in GASB Statement No. 40, “Deposits and Investment Risk Disclosures,” as of June 30, 2016, none of the College’s bank balance of $11,991,316 was exposed to custodial risk as discussed above. Investments: As of June 30, 2016, the College had no investments as defined by GASB Statement No.40.
NOTE 5 - RECEIVABLES Receivables at June 30, 2016 were as follows: NOTE 6 – DONOR RESTRICTED ENDOWMENTS If a donor has not provided specific instructions, state law permits the Board to authorize for expenditure the new appreciation (realized and unrealized) of the investments of endowment funds. When administer-ing its power to spend net appreciation, the Board is required to consider the College’s “long- and short-term needs, present and anticipated financial requirements, expected total return on its investments, price-level trends, and general economic conditions.” Any net appreciation that is spent is required to be spent for the purposes for which the endowment was established. All expenditures must be approved by the Board. At June 30, 2016, there was no net appreciation on donor restricted assets available to be spent.
AllowanceGross for Doubtful Net
Receivables Accounts ReceivablesCurrent Receivables:
Students 1,864,814$ (689,959)$ 1,174,855$ Interest 50,232 0 50,232
Intergovernmental - 0 - Other 288,635 0 288,635
Total Current Receivables 2,203,681$ (689,959)$ 1,513,722$
54
BELMONT COLLEGE BELMONT COUNTY, OHIO
NOTES TO THE FINANCIAL STATEMENTS FOR THE FISCAL YEAR ENDED JUNE 30, 2016
27
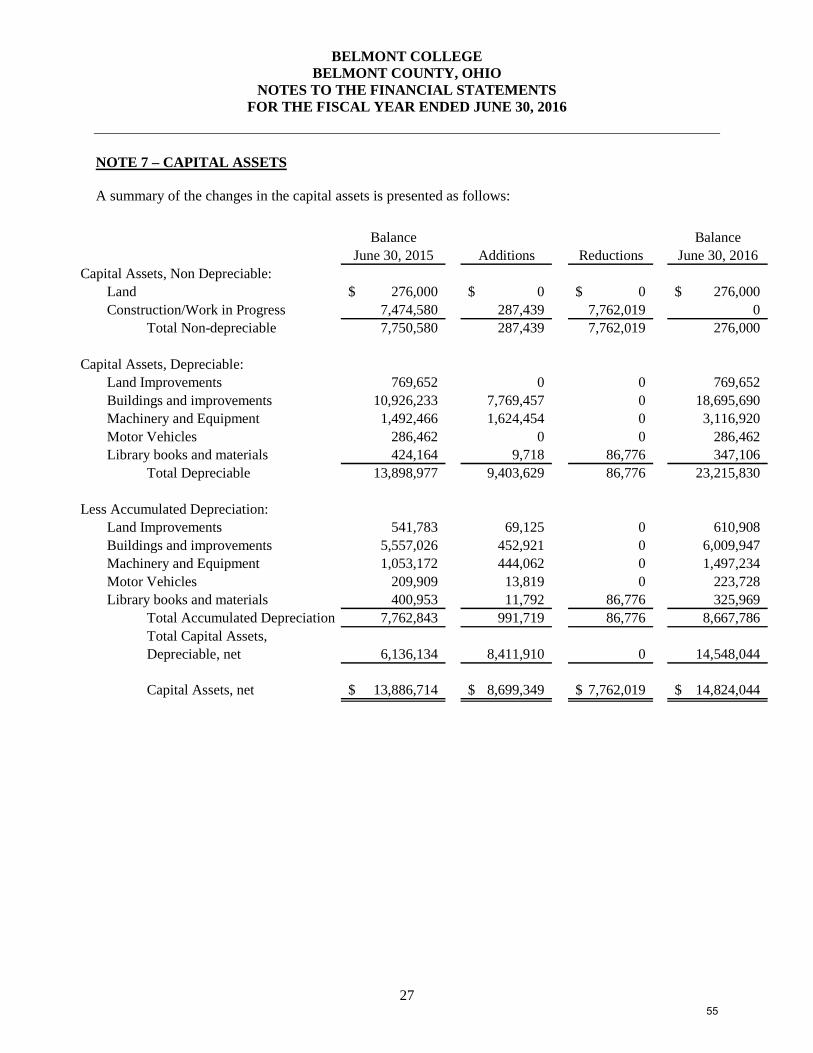
NOTE 7 – CAPITAL ASSETS A summary of the changes in the capital assets is presented as follows:
Balance BalanceJune 30, 2015 Additions Reductions June 30, 2016
Capital Assets, Non Depreciable:Land 276,000$ 0$ 0$ 276,000$ Construction/Work in Progress 7,474,580 287,439 7,762,019 0
Total Non-depreciable 7,750,580 287,439 7,762,019 276,000
Capital Assets, Depreciable:Land Improvements 769,652 0 0 769,652Buildings and improvements 10,926,233 7,769,457 0 18,695,690Machinery and Equipment 1,492,466 1,624,454 0 3,116,920Motor Vehicles 286,462 0 0 286,462Library books and materials 424,164 9,718 86,776 347,106
Total Depreciable 13,898,977 9,403,629 86,776 23,215,830
Less Accumulated Depreciation:Land Improvements 541,783 69,125 0 610,908Buildings and improvements 5,557,026 452,921 0 6,009,947Machinery and Equipment 1,053,172 444,062 0 1,497,234Motor Vehicles 209,909 13,819 0 223,728Library books and materials 400,953 11,792 86,776 325,969
Total Accumulated Depreciation 7,762,843 991,719 86,776 8,667,786Total Capital Assets,Depreciable, net 6,136,134 8,411,910 0 14,548,044
Capital Assets, net 13,886,714$ 8,699,349$ 7,762,019$ 14,824,044$
55

BELMONT COLLEGE BELMONT COUNTY, OHIO
NOTES TO THE FINANCIAL STATEMENTS FOR THE FISCAL YEAR ENDED JUNE 30, 2016
28
NOTE 8 – LONG-TERM LIABILITIES A summary of changes in long-term liabilities is as follows:
NOTE 9 – CAPITAL LEASES In fiscal year 2016 the College entered into two capital leases for IPAD’s. These lease obligations meet the criteria of a capital lease and have been recorded as capital assets on the statement of net position. The assets acquired by the leases were capitalized in the amount of $601,351, which was equal to the present value of the future minimum lease payments at the time of acquisition. A corresponding liability was recorded and is reduced for each required principal payment. The following is a schedule of the future long-term minimum lease payments required under the capital leases and the present value of the minimum lease payments as of June 30, 2016: Fiscal year ending June 30, 2017 $445,636 Fiscal year ending June 30, 2018 23,978 Total Payments 469,614 Less amount representing interest 73,839 Present value of minimum lease payments $395,775
Balance Balance CurrentJuly 1, 2015 Additions Reductions June 30, 2016 Portion
Net Pension Liability:SERS 3,012,779$ 0$ 218,560$ 2,794,219 0$ STRS 11,157,354 0 486,793 10,670,561 0 Total Net Pension Liability 14,170,133 0 705,353 13,464,780 0
Capital Lease Payable 0 601,351 205,576 395,775 374,302 Compensated Absences 262,559 56,847 0 319,406 263,211
Total Long-Term Liabilities 14,432,692$ 658,198$ 910,929$ 14,179,961$ 637,513$
56

BELMONT COLLEGE BELMONT COUNTY, OHIO
NOTES TO THE FINANCIAL STATEMENTS FOR THE FISCAL YEAR ENDED JUNE 30, 2016
29
NOTE 10 – OPERATING EXPENSES BY FUNCTION AND NATURAL CLASS
Salaries Scholarships Supplies andand and Other
Benefits Fellowships Utilities Services Depreciation TotalInstruction & depart- mental research 3,996,604$ 0$ 0$ 193,554$ 0$ 4,190,158$ Public service 35,315 0 0 30,934 0 66,249 Academic support 602,213 0 0 141,884 0 744,097 Student services 485,798 0 0 21,358 0 507,156 Institutional support 1,895,035 0 0 1,366,777 0 3,261,812 Operations and maintenance 458,312 0 317,637 109,428 0 885,377 Scholarships & grants 0 739,272 0 0 0 739,272 Auxiliary enterprises 111,291 0 0 612,667 0 723,958 Depreciation 0 0 0 0 991,719 991,719
Totals 7,584,568$ 739,272$ 317,637$ 2,476,602$ 991,719$ 12,109,798$
NOTE 11 – DEFINED BENEFIT PENSION PLANS Net Pension Liability
The net pension liability reported on the statement of net position represents a liability to employees for pensions. Pensions are a component of exchange transactions-–between an employer and its employees—of salaries and benefits for employee services. Pensions are provided to an employee—on a deferred-payment basis—as part of the total compensation package offered by an employer for employee services each financial period. The obligation to sacrifice resources for pensions is a present obligation because it was created as a result of employment exchanges that already have occurred.
The net pension liability represents Belmont College proportionate share of each pension plan’s collective actuarial present value of projected benefit payments attributable to past periods of service, net of each pension plan’s fiduciary net position. The net pension liability calculation is dependent on critical long-term variables, including estimated average life expectancies, earnings on investments, cost of living adjustments and others. While these estimates use the best information available, unknowable future events require adjusting this estimate annually.
Ohio Revised Code limits Belmont College’s obligation for this liability to annually required payments. The Belmont College cannot control benefit terms or the manner in which pensions are financed; howev-er, the Belmont College does receive the benefit of employees’ services in exchange for compensation including pension.
57

BELMONT COLLEGE BELMONT COUNTY, OHIO
NOTES TO THE FINANCIAL STATEMENTS FOR THE FISCAL YEAR ENDED JUNE 30, 2016
30
NOTE 11 – DEFINED BENEFIT PENSION PLANS (Continued) GASB 68 assumes the liability is solely the obligation of the employer, because (1) they benefit from employee services; and (2) State statute requires all funding to come from these employers. All contribu-tions to date have come solely from these employers (which also includes costs paid in the form of withholdings from employees). State statute requires the pension plans to amortize unfunded liabilities within 30 years. If the amortization period exceeds 30 years, each pension plan’s board must propose corrective action to the State legislature. Any resulting legislative change to benefits or funding could significantly affect the net pension liability. Resulting adjustments to the net pension liability would be effective when the changes are legally enforceable.
The proportionate share of each plan’s unfunded benefits is presented as a long-term net pension liability on the accrual basis of accounting. Any liability for the contractually-required pension contribution outstanding at the end of the year is included in accrued liabilities on the accrual basis of accounting. Plan Description - School Employees Retirement System (SERS) Plan Description – The College’s non-teaching employees participate in SERS, a cost-sharing multiple-employer defined benefit pension plan administered by SERS. SERS provides retirement, disability and survivor benefits, annual cost-of-living adjustments, and death benefits to plan members and beneficiar-ies. Authority to establish and amend benefits is provided by Ohio Revised Code Chapter 3309. SERS issues a publicly available, stand-alone financial report that includes financial statements, required supplementary information and detailed information about SERS’ fiduciary net position. That report can be obtained by visiting the SERS website at www.ohsers.org under Employers/Audit Resources. Age and service requirements for retirement are as follows:
Eligible to Eligible to
Retire on or before Retire on or afterAugust 1, 2017 * August 1, 2017
Full Benefits Any age with 30 years of service credit Age 67 with 10 years of service credit; orAge 57 with 30 years of service credit
Actuarially Reduced Benefits Age 60 with 5 years of service credit Age 62 with 10 years of service credit; orAge 55 with 25 years of service credit Age 60 with 25 years of service credit
* Members with 25 years of service credit as of August 1, 2017, will be included in this plan. Annual retirement benefits are calculated based on final average salary multiplied by a percentage that varies based on year of service; 2.2 percent for the first thirty years of service and 2.5 percent for years of service credit over 30. Final average salary is the average of the highest three years of salary. One year after an effective benefit date, a benefit recipient is entitled to a three percent cost-of-living adjustment (COLA). This same COLA is added each year to the base benefit amount on the anniversary date of the benefit.
58

BELMONT COLLEGE BELMONT COUNTY, OHIO
NOTES TO THE FINANCIAL STATEMENTS FOR THE FISCAL YEAR ENDED JUNE 30, 2016
31
NOTE 11 – DEFINED BENEFIT PENSION PLANS (Continued) Funding Policy – Plan members are required to contribute 10 percent of their annual covered salary and the College is required to contribute 14 percent of annual covered payroll. The contribution requirements of plan members and employers are established and may be amended by the SERS’ Retirement Board up to statutory maximum amounts of 10 percent for plan members and 14 percent for employers. The Retirement Board, acting with the advice of the actuary, allocates the employer contribution rate among four of the System’s funds (Pension Trust Fund, Death Benefit Fund, Medicare B Fund, and Health Care Fund). For the fiscal year ended June 30, 2016, the allocation to pension, death benefits, and Medicare B was 14 percent. SERS did not allocate any employer contributions to the Health Care Fund for fiscal year 2016. The College’s contractually required contributions to SERS for fiscal years ended June 30 2016, 2015, and 2014 were $172,087, $206,391, and $254,975 respectively; equal to the required contributions for each year. Plan Description - State Teachers Retirement System (STRS) Plan Description – The College’s licensed teachers and other faculty members participate in STRS Ohio, a cost-sharing multiple-employer public employee retirement system administered by STRS. STRS provides retirement and disability benefits to members and death and survivor benefits to beneficiaries. STRS issues a stand-alone financial report that includes financial statements, required supplementary information and detailed information about STRS’ fiduciary net position. That report can be obtained by writing to STRS, 275 E. Broad St., Columbus, OH 43215-3771, by calling (888) 227-7877, or by visiting the STRS Web site at www.strsoh.org. New members have a choice of three retirement plans; a Defined Benefit (DB) Plan, a Defined Contribu-tion (DC) Plan and a Combined Plan. Benefits are established by Ohio Revised Code Chapter 3307. The DB plan offers an annual retirement allowance based on final average salary multiplied by a percentage that varies based on years of service. Effective August 1, 2015, the calculation will be 2.2 percent of final average salary for the five highest years of earnings multiplied by all years of service. With certain exceptions, the basic benefit is increased each year by two percent of the original base benefit. For members retiring August 1, 2013, or later, the first two percent is paid on the fifth anniversary of the retirement benefit. Members are eligible to retire at age 60 with five years of qualifying service credit, or age 55 with 25 years of service, or 30 years of service regardless of age. Age and service requirements for retirement will increase effective August 1, 2015, and will continue to increase periodically until they reach age 60 with 35 years of service or age 65 with five years of service on August 1, 2026. The DC Plan allows members to place all their member contributions and 9.5 percent of the 14 percent employer contributions into an investment account. Investment allocation decisions are determined by the member. The remaining 4.5 percent of the 14 percent employer rate is allocated to the defined benefit unfunded liability. A member is eligible to receive a retirement benefit at age 50 and termination of employment. The member may elect to receive a lifetime monthly annuity or a lump sum withdrawal.
59

BELMONT COLLEGE BELMONT COUNTY, OHIO
NOTES TO THE FINANCIAL STATEMENTS FOR THE FISCAL YEAR ENDED JUNE 30, 2016
32
NOTE 11 – DEFINED BENEFIT PENSION PLANS (Continued) The Combined Plan offers features of both the DB Plan and the DC Plan. In the Combined Plan, member contributions are allocated among investment choices by the member, and employer contributions are used to fund the defined benefit payment at a reduced level from the regular DB Plan. The defined benefit portion of the Combined Plan payment is payable to a member on or after age 60 with five years of services. The defined contribution portion of the account may be taken as a lump sum payment or converted to a lifetime monthly annuity at age 50. New members who choose the DC plan or Combined Plan will have another opportunity to reselect a permanent plan during their fifth year of membership. Members may remain in the same plan or transfer to another STRS plan. The optional annuitization of a member’s defined contribution account or the defined contribution portion of a member’s Combined Plan account to a lifetime benefit results in STRS bearing the risk of investment gain or loss on the account. STRS has therefore included all three plan options as one defined benefit plan for GASB 68 reporting purposes. A DB or Combined Plan member with five or more years of credited service who is determined to be disabled may qualify for a disability benefit. Eligible survivors of members who die before service retirement may qualify for monthly benefits. New members on or after July 1, 2013, must have at least ten years of qualifying service credit that apply for disability benefits. Members in the DC Plan who become disabled are entitled only to their account balance. If a member of the DC Plan dies before retirement benefits begin, the member’s designated beneficiary is entitled to receive the member’s account balance. Funding Policy – Employer and member contribution rates are established by the State Teachers Retire-ment Board and limited by Chapter 3307 of the Ohio Revised Code. The statutory maximum employee contribution rate was increased one percent July 1, 2014, and will be increased one percent each year until it reaches 14 percent on July 1, 2016. For the fiscal year ended June 30, 2016, plan members were required to contribute 13 percent of their annual covered salary. The Belmont College was required to contribute 14 percent; the entire 14 percent was the portion used to fund pension obligations. The fiscal year 2016 contribution rates were equal to the statutory maximum rates. The College’s contractually required contribution to STRS for fiscal years ended June 30 2016, 2015, and 2014 were $539,123, $552,147, and $648,923 respectively; 100% has been contributed for each fiscal year.
60

BELMONT COLLEGE BELMONT COUNTY, OHIO
NOTES TO THE FINANCIAL STATEMENTS FOR THE FISCAL YEAR ENDED JUNE 30, 2016
33
NOTE 11 – DEFINED BENEFIT PENSION PLANS (Continued) Pension Liabilities, Pension Expense, and Deferred Outflows of Resources and Deferred Inflows of Resources Related to Pensions The net pension liability was measured as of June 30, 2015, and the total pension liability used to calcu-late the net pension liability was determined by an actuarial valuation as of that date. The Belmont College’s proportion of the net pension liability was based on the Belmont College’s share of contribu-tions to the pension plan relative to the contributions of all participating entities. Following is infor-mation related to the proportionate share and pension expense:
STRS SERS TotalProportionate Share of the Net Pension Liability $10,670,561 $2,794,219 $13,464,780Proportion of the Net Pension Liability 0.0003860959% 0.0004896900%Pension Expense $282,624 $101,107 $383,731
At June 30, 2016, the College reported deferred outflows of resources and deferred inflows of resources related to pensions from the following sources:
STRS SERS TotalDeferred Outflows of ResourcesDifferences between expected and actual experience $499,196 $48,393 $547,589College contributions subsequent to the measurement date 539,123 172,087 711,210
Total Deferred Outflows of Resources $1,038,319 $220,480 $1,258,799
Deferred Inflows of ResourcesNet difference between projected and actual earnings on pension plan investments $1,012,476 $157,642 $1,170,118Changes in proportion and differences between College's contributions and proportionate share of contributions 1,660,729 467,368 2,128,097
Total Deferred Inflows of Resources $2,673,205 $625,010 $3,298,215
61

BELMONT COLLEGE BELMONT COUNTY, OHIO
NOTES TO THE FINANCIAL STATEMENTS FOR THE FISCAL YEAR ENDED JUNE 30, 2016
34
NOTE 11 – DEFINED BENEFIT PENSION PLANS (Continued) $711,210 reported as deferred outflows of resources related to pension resulting from the College contri-butions subsequent to the measurement date will be recognized as a reduction of the net pension liability in the year ending June 30, 2017. Other amounts reported as deferred outflows of resources and deferred inflows of resources related to pension will be recognized in pension expense as follows:
STRS SERS TotalFiscal Year Ending June 30:
2017 ($665,798) ($203,480) ($869,278)2018 ($665,798) ($203,480) ($869,278)2019 ($665,797) ($203,736) ($869,533)2020 ($176,616) $34,080 ($142,536)Total ($2,174,009) ($576,616) ($2,750,625)
Actuarial Assumptions - SERS SERS’ total pension liability was determined by their actuaries in accordance with GASB Statement No. 67, as part of their annual actuarial valuation for each defined benefit retirement plan. Actuarial valua-tions of an ongoing plan involve estimates of the value of reported amounts (e.g., salaries, credited service) and assumptions about the probability of occurrence of events far into the future (e.g., mortality, disabilities, retirements, employment termination). Actuarially determined amounts are subject to continual review and potential modifications, as actual results are compared with past expectations and new estimates are made about the future. Projections of benefits for financial reporting purposes are based on the substantive plan (the plan as understood by the employers and plan members) and include the types of benefits provided at the time of each valuation and the historical pattern of sharing benefit costs between the employers and plan mem-bers to that point. The projection of benefits for financial reporting purposes does not explicitly incorpo-rate the potential effects of legal or contractual funding limitations. Actuarial calculations reflect a long-term perspective. For a newly hired employee, actuarial calculations will take into account the employee’s entire career with the employer and also take into consideration the benefits, if any, paid to the employee after termination of employment until the death of the employee and any applicable contingent annuitant. In many cases actuarial calculations reflect several decades of service with the employer and the payment of benefits after termination. Key methods and assumptions used in calculating the total pension liability in the latest actuarial valua-tion, prepared as of June 30, 2015, are presented below:
Wage Inflation 3.25 percentFuture Salary Increases, including inflation 4.00 percent to 22 percentCOLA or Ad Hoc COLA 3 percentInvestment Rate of Return 7.75 percent net of investments expense, including inflationActuarial Cost Method Entry Age Normal
62

BELMONT COLLEGE BELMONT COUNTY, OHIO
NOTES TO THE FINANCIAL STATEMENTS FOR THE FISCAL YEAR ENDED JUNE 30, 2016
35
NOTE 11 – DEFINED BENEFIT PENSION PLANS (Continued) For post-retirement mortality, the table used in evaluating allowances to be paid is the 1994 Group Annuity Mortality Table set back one year for both men and women. Special mortality tables are used for the period after disability retirement. The most recent experience study was completed June 30, 2010. The long-term return expectation for the Pension Plan Investments has been determined using a building-block approach and assumes a time horizon, as defined in SERS’ Statement of Investment Policy. A forecasted rate of inflation serves as the baseline for the return expectation. Various real return premiums over the baseline inflation rate have been established for each asset class. The long-term expected nominal rate of return has been determined by calculating a weighted averaged of the expected real return premiums for each asset class, adding the projected inflation rate, and adding the expected return from rebalancing uncorrelated asset classes. The target allocation and best estimates of arithmetic real rates of return for each major assets class are summarized in the following table:
Target Long Term Expected Asset Class Allocation Real Rate of Return
Cash 1.00 % 0.00% US Stocks 22.50 5.00 Non-US Stocks 22.50 5.50 Fixed Income 19.00 1.50 Private Equity 10.00 10.00 Real Assets 10.00 5.00 Multi-Asset Strategies 15.00 7.50
100% Discount Rate The total pension liability was calculated using the discount rate of 7.75 percent. The projection of cash flows used to determine the discount rate assumed the contributions from employers and from the members would be computed based on contribution requirements as stipulated by State statute. Projected inflows from investment earning were calculated using the long-term assumed invest-ment rate of return (7.75 percent). Based on those assumptions, the plan’s fiduciary net position was projected to be available to make all future benefit payments of current plan members. Therefore, the long-term expected rate of return on pension plan investments was applied to all periods of projected benefits to determine the total pension liability.
63

BELMONT COLLEGE BELMONT COUNTY, OHIO
NOTES TO THE FINANCIAL STATEMENTS FOR THE FISCAL YEAR ENDED JUNE 30, 2016
36
NOTE 11 – DEFINED BENEFIT PENSION PLANS (Continued) Sensitivity of the College’s Proportionate Share of the Net Pension Liability to Changes in the Dis-count Rate Net pension liability is sensitive to changes in the discount rate, and to illustrate the potential impact the following table presents the net pension liability calculated using the discount rate of 7.75 percent, as well as what each plan’s net pension liability would be if it were calculated using a discount rate that is one percentage point lower (6.75 percent), or one percentage point higher (8.75 percent) than the current rate.
Current1% Decrease Discount Rate 1% Increase
(6.75%) (7.75%) (8.75%)College's proportionate share of the net pension liability $3,874,577 $2,794,219 $1,884,468
Actuarial Assumptions - STRS The total pension liability in the June 30, 2014, actuarial valuation was determined using the following actuarial assumptions, applied to all periods included in the measurement:
Inflation 2.75 percent Projected salary increases 2.75 percent at age 70 to 12.25 percent at age 20 Investment Rate of Return 7.75 percent, net of investment expenses Cost-of-Living Adjustments (COLA)
2 percent simple applied as follows: for members retiring before August 1, 2013, 2 percent per year; for members retiring August 1, 2013, or later, 2 percent COLA paid on fifth anniversary of retirement date.
Mortality rates were based on the RP-2000 Combined Mortality Table (Projection 2022—Scale AA) for Males and Females. Males’ ages are set-back two years through age 89 and no set-back for age 90 and above. Females younger than age 80 are set back four years, one year set back from age 80 through 89 and not set back from age 90 and above. Actuarial assumptions used in the June 30, 2015, valuation are based on the results of an actuarial experience study, effective July 1, 2012. The 10 year expected real rate of return on pension plan investments was determined by STRS’ invest-ment consultant by developing best estimates of expected future real rates of return for each major asset class. The target allocation and best estimates of geometric real rates of return for each major asset class are summarized as follows:
Target Long Term Expected Asset Class Allocation Real Rate of Return Domestic Equity 31.00 % 8.00 % International Equity 26.00 7.85 Alternatives 14.00 8.00 Fixed Income 18.00 3.75 Real Estate 10.00 6.75 Liquidity Reserves 1.00 3.00 Total 100.00 %
64
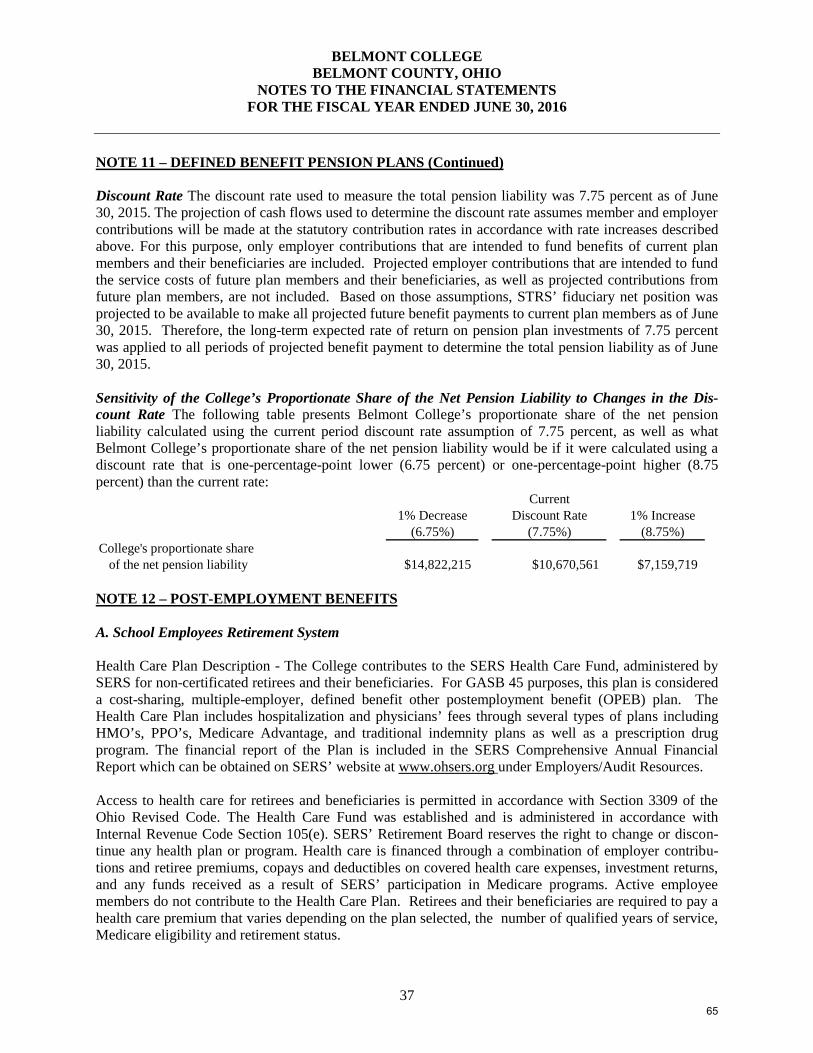
BELMONT COLLEGE BELMONT COUNTY, OHIO
NOTES TO THE FINANCIAL STATEMENTS FOR THE FISCAL YEAR ENDED JUNE 30, 2016
37
NOTE 11 – DEFINED BENEFIT PENSION PLANS (Continued) Discount Rate The discount rate used to measure the total pension liability was 7.75 percent as of June 30, 2015. The projection of cash flows used to determine the discount rate assumes member and employer contributions will be made at the statutory contribution rates in accordance with rate increases described above. For this purpose, only employer contributions that are intended to fund benefits of current plan members and their beneficiaries are included. Projected employer contributions that are intended to fund the service costs of future plan members and their beneficiaries, as well as projected contributions from future plan members, are not included. Based on those assumptions, STRS’ fiduciary net position was projected to be available to make all projected future benefit payments to current plan members as of June 30, 2015. Therefore, the long-term expected rate of return on pension plan investments of 7.75 percent was applied to all periods of projected benefit payment to determine the total pension liability as of June 30, 2015. Sensitivity of the College’s Proportionate Share of the Net Pension Liability to Changes in the Dis-count Rate The following table presents Belmont College’s proportionate share of the net pension liability calculated using the current period discount rate assumption of 7.75 percent, as well as what Belmont College’s proportionate share of the net pension liability would be if it were calculated using a discount rate that is one-percentage-point lower (6.75 percent) or one-percentage-point higher (8.75 percent) than the current rate:
Current1% Decrease Discount Rate 1% Increase
(6.75%) (7.75%) (8.75%)College's proportionate share of the net pension liability $14,822,215 $10,670,561 $7,159,719
NOTE 12 – POST-EMPLOYMENT BENEFITS A. School Employees Retirement System Health Care Plan Description - The College contributes to the SERS Health Care Fund, administered by SERS for non-certificated retirees and their beneficiaries. For GASB 45 purposes, this plan is considered a cost-sharing, multiple-employer, defined benefit other postemployment benefit (OPEB) plan. The Health Care Plan includes hospitalization and physicians’ fees through several types of plans including HMO’s, PPO’s, Medicare Advantage, and traditional indemnity plans as well as a prescription drug program. The financial report of the Plan is included in the SERS Comprehensive Annual Financial Report which can be obtained on SERS’ website at www.ohsers.org under Employers/Audit Resources. Access to health care for retirees and beneficiaries is permitted in accordance with Section 3309 of the Ohio Revised Code. The Health Care Fund was established and is administered in accordance with Internal Revenue Code Section 105(e). SERS’ Retirement Board reserves the right to change or discon-tinue any health plan or program. Health care is financed through a combination of employer contribu-tions and retiree premiums, copays and deductibles on covered health care expenses, investment returns, and any funds received as a result of SERS’ participation in Medicare programs. Active employee members do not contribute to the Health Care Plan. Retirees and their beneficiaries are required to pay a health care premium that varies depending on the plan selected, the number of qualified years of service, Medicare eligibility and retirement status.
65

BELMONT COLLEGE BELMONT COUNTY, OHIO
NOTES TO THE FINANCIAL STATEMENTS FOR THE FISCAL YEAR ENDED JUNE 30, 2016
38
NOTE 12 – POST-EMPLOYMENT BENEFITS (Continued) Funding Policy - State statute permits SERS to fund the health care benefits through employer contribu-tions. Each year, after the allocation for statutorily required basic benefits, the Retirement Board allocates the remainder of the employer contribution of 14 percent of covered payroll to the Health Care Fund. In addition, employers pay a surcharge for employees earning less than an actuarially determined minimum compensation amount, pro-rated according to service credit earned. For fiscal year 2016, this amount was $23,000. Statutes provide that no employer shall pay a health care surcharge greater than 2 percent of that employer’s SERS-covered payroll; nor may SERS collect in aggregate more than 1.5 percent of the total statewide SERS-covered payroll for the health care surcharge. The College’s contributions for health care (including surcharge) for the fiscal years ended June 30, 2016, 2015, and 2014 were $16,425, $35,297 and $30,069, respectively. The full amount has been contributed for fiscal years 2016, 2015 and 2014. B. State Teachers Retirement System Plan Description – The College participates in the cost-sharing multiple-employer defined benefit Health Plan administered by the State Teachers Retirement System of Ohio (STRS) for eligible retirees who participated in the defined benefit or combined pension plans offered by STRS. Ohio law authorizes STRS to offer this plan. Benefits include hospitalization, physicians’ fees, prescription drugs and reimbursement of monthly Medicare Part B premiums. The Plan is included in the report of STRS which can be obtained by visiting www.strsoh.org or by calling (888) 227-7877. Funding Policy – Ohio Revised Code Chapter 3307 authorizes STRS Ohio to offer the Plan and gives the Retirement Board authority over how much, if any, of the health care costs will be absorbed by STRS. Active employee members do not contribute to the Health Care Plan. All benefit recipients, for the most recent year, pay a monthly premium. Under Ohio law, funding for post-employment health care may be deducted from employer contributions. For fiscal year 2016, STRS did not allocate any employer contributions to post-employment health care. The College’s contributions for health care for the fiscal years ended June 30, 2016, 2015, and 2014 were $0, $0, and $46,352, respectively. The full amount has been contributed for fiscal years 2016, 2015 and 2014. NOTE 13– RISK MANAGEMENT The College is exposed to various risks of loss related to torts; theft of, damage to, and destruction of assets; errors and omissions; injuries to employees; and natural disasters. During fiscal year 2016, the College contracted with Marsh USA Inc.as part of the OACC insurance consortium. Commercial property insurance is contracted with Lexington Insurance Company (AIG). The policy includes a $10,000 deductible. Professional and general liability is protected by Catlin Indemnity Company (Wright Specialty) with a $1,000,000 single occurrence limit, $3,000,000 annual aggregate limit and no deductible. Vehicles are also covered by Catlin Indemnity Company (Wright Specialty) and hold a $500 deductible for compre-hensive and collision. Automobile liability has a $1,000,000 combined single limit of liability, with no annual aggregate. An excess liability policy contracted with United Educators provides an additional $10,000,000 in excess of the $1,000,000 limits over all other liability coverage.
66

BELMONT COLLEGE BELMONT COUNTY, OHIO
NOTES TO THE FINANCIAL STATEMENTS FOR THE FISCAL YEAR ENDED JUNE 30, 2016
39
NOTE 13– RISK MANAGEMENT (Continued) Ancillary coverage for cyber liability breach response is provided by Illinois National Insurance Compa-ny with a $1,000,000 single occurrence limit and a $25,000 deductible. Settled claims have not exceeded this commercial coverage in any of the past three years. There have been no significant reductions in insurance coverage from last year. The College pays the State Workers’ Compensation System a premium based on a rate per $100 of salaries. This rate is calculated based on accident history and administrative costs. NOTE 14– CONTRACTUAL COMMITMENTS As of June 30, 2016, the College has commitments with the following companies for various construction projects.
Amount Paid AmountContract as of Remaining
Contractor Amount June 30, 2016 on ContractsHealth Sciences Center:Ruscilli Construction Company, Inc. - Construction Manager 6,885,436$ 6,750,806$ 134,630$
NOTE 15– CONTINGENCIES The College received financial assistance from federal and state agencies in the form of grants. The expenditure of funds received under these programs generally requires compliance with terms and a condition specified in the grant agreements and is subject to audit by the grantor agencies. Any disal-lowed claims resulting from such audits could become a liability of the College. However, in the opinion of management, any such disallowed claims will not have a material adverse effect on the overall finan-cial position of the College at June 30, 2016. NOTE 16– COMPONENT UNIT DISCLOSURES The Belmont College Foundation (Foundation) is a legally separate, tax-exempt component unit of Belmont College (College). The accompanying financial statements of the Foundation have been prepared in accordance with pronouncements of the Financial Accounting Standards Board. As such, certain revenue recognition criteria and presentation features are different from GASB revenue recognition criteria and presentation features. No modifications have been made to the Foundation’s financial information in the College’s financial reporting entity for these differences. Contributions to the Foundation are recognized and reported as revenue at fair value upon the earlier of the period in which a pledge becomes unconditional or the period in which the contribution is received. Contributions with donor-imposed restrictions are reported as temporarily or permanently restricted support while contributions without donor-imposed restrictions are reported as unrestricted support.
67

BELMONT COLLEGE BELMONT COUNTY, OHIO
NOTES TO THE FINANCIAL STATEMENTS FOR THE FISCAL YEAR ENDED JUNE 30, 2016
40
NOTE 16– COMPONENT UNIT DISCLOSURES (Continued) Equity in Pooled Cash and Cash Equivalents and Investments: Deposits - Custodial credit risk is the risk of the inability to recover the value of deposits, investments, or collateral securities in the possession of an outside party in the event of a depository financial institution or counterparty failure to a transaction. The Foundation has not established a policy for deposits at this time. As of June 30, 2016, the carrying amount of the Foundation’s deposits was $78,576 and this bank balance was covered by FDIC. Investments – Foundation investments are stated at fair value with changes in market value being recog-nized as gains and losses during the period in which they occur. The following summarizes the fair value of investments of the Foundation as of June 30, 2016:
FairInvestment Type ValueCash and Money Market Funds 59,461$ Equities 311,062Fixed Income 328,774
Total 699,297$
Support Provided to the College: During the year ended June 30, 2016 the Foundation provided $537,349 to or on behalf of the College for scholarships and other purposes. NOTE 17– SUBSEQUENT EVENT On September 22, 2016, the Board of Trustees approved funding in an amount not to exceed $7,910,000 for the fiscal year 2017 main building improvement project. The planned project consists of planning and design fees, construction costs as well as furniture and fixtures for extensive renovations at the College’s main building. These planned renovations consist of a new bookstore, new student lounge area, renovated restrooms and upgrades to mechanical systems. The planned source of funding for the project is $5,291,073 from local resources and $2,618,927 from State appropriations.
68

2015 2014 2013
State Teachers Retirement System (STRS)
College's Proportion of the Net Pension Liability 0.03860959% 0.04587075% 0.04587075%
College's Proportionate Share of the Net Pension Liability 10,670,561$ 11,157,354$ 13,290,567$
College's Covered-Employee Payroll 3,943,907$ 4,991,715$ 5,530,862$
College's Proportionate Share of the Net Pension Liabilityas a Percentage of its Covered-Employee Payroll 270.56% 223.52% 240.30%
Plan Fiduciary Net Position as a Percentage of the Total Pension Liability 72.10% 74.70% 69.30%
School Employees Retirement System (SERS)
College's Proportion of the Net Pension Liability 0.04896900% 0.05953000% 0.05953000%
College's Proportionate Share of the Net Pension Liability 2,794,219$ 3,012,779$ 3,540,058$
College's Covered-Employee Payroll 1,565,941$ 1,839,646$ 1,997,637$
College's Proportionate Share of the Net Pension Liabilityas a Percentage of its Covered-Employee Payroll 178.44% 163.77% 177.21%
Plan Fiduciary Net Position as a Percentage of the Total Pension Liability 69.16% 71.70% 65.52%
(1) Information prior to 2013 is not available.
Note: The amounts presented for each fiscal year were determined as of the measurement date.
Belmont CollegeBelmont County, Ohio
Required Supplementary InformationSchedule of the College's Proportionate Share of the Net Pension Liability
Last Three Fiscal Years (1)
41 69

2016 2015 2014 2013State Teachers Retirement System (STRS)
Contractually Required Contribution 539,123$ 552,147$ 648,923$ 719,012$
Contributions in Relation to the Contractually Required Contribution (539,123) (552,147) (648,923) (719,012)
Contribution Deficiency (Excess) 0$ 0$ 0$ 0$
College's Covered-Employee Payroll 3,850,879$ 3,943,907$ 4,991,715$ 5,530,862$
Contributions as a Percentage of Covered-Employee Payroll 14.00% 14.00% 13.00% 13.00%
School Employees Retirement System (SERS)
Contractually Required Contribution 172,087$ 206,391$ 254,975$ 276,473$
Contributions in Relation to the Contractually Required Contribution (172,087) (206,391) (254,975) (276,473)
Contribution Deficiency (Excess) 0$ 0$ 0$ 0$
College's Covered-Employee Payroll 1,229,193$ 1,565,941$ 1,839,646$ 1,997,637$
Contributions as a Percentage of Covered-Employee Payroll 14.00% 13.18% 13.86% 13.84%
n/a - Information prior to 2008 is not available.
Belmont CollegeBelmont County, Ohio
Required Supplementary InformationSchedule of College Contributions
Last Ten Fiscal Years
42 70
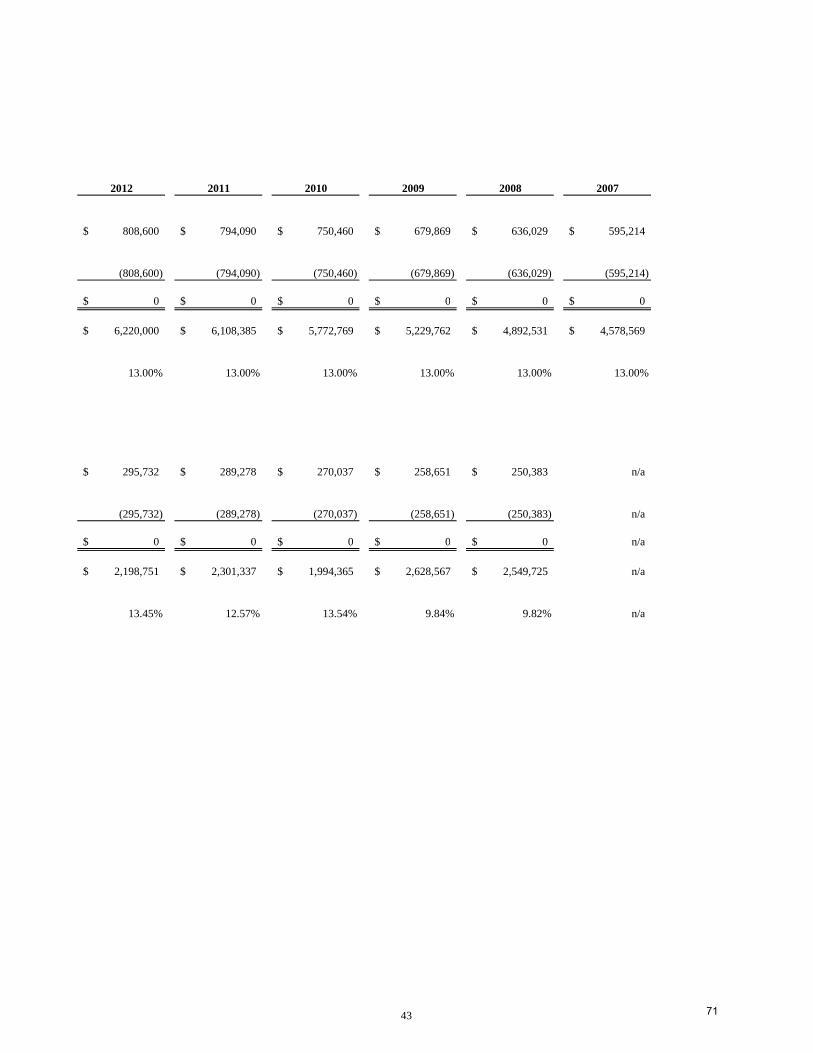
2012 2011 2010 2009 2008 2007
808,600$ 794,090$ 750,460$ 679,869$ 636,029$ 595,214$
(808,600) (794,090) (750,460) (679,869) (636,029) (595,214)
0$ 0$ 0$ 0$ 0$ 0$
6,220,000$ 6,108,385$ 5,772,769$ 5,229,762$ 4,892,531$ 4,578,569$
13.00% 13.00% 13.00% 13.00% 13.00% 13.00%
295,732$ 289,278$ 270,037$ 258,651$ 250,383$ n/a
(295,732) (289,278) (270,037) (258,651) (250,383) n/a
0$ 0$ 0$ 0$ 0$ n/a
2,198,751$ 2,301,337$ 1,994,365$ 2,628,567$ 2,549,725$ n/a
13.45% 12.57% 13.54% 9.84% 9.82% n/a
43 71
44
November 22, 2016 Board of Trustees Belmont College 68094 Hammond Road St. Clairsville, OH 43950
Independent Auditor’s Report on Internal Control over Financial Reporting and on Compliance and Other Matters Based on an Audit of Financial Statements Performed in Accordance with
Government Auditing Standards
We have audited, in accordance with the auditing standards generally accepted in the United States of America and the standards applicable to financial audits contained in Government Auditing Standards issued by the Comptroller General of the United States, the financial statements of Belmont College, Belmont County, Ohio (the “College”) and the discretely presented component unit, as of and for the year ended June 30, 2016, and the related notes to the financial statements, which collectively comprise the College’s basic financial statements, and have issued our report thereon dated November 22, 2016.
Internal Control over Financial Reporting
In planning and performing our audit of the financial statements, we considered the College's internal control over financial reporting (internal control) to determine the audit procedures that are appropriate in the circumstances for the purpose of expressing our opinions on the financial statements, but not for the purpose of expressing an opinion on the effectiveness of the College’s internal control. Accordingly, we do not express an opinion on the effectiveness of the College’s internal control. A deficiency in internal control exists when the design or operation of a control does not allow management or employees, in the normal course of performing their assigned functions, to prevent, or detect and correct, misstatements on a timely basis. A material weakness is a deficiency, or a combination of deficiencies, in internal control, such that there is a reasonable possibility that a material misstatement of the entity’s financial statements will not be prevented, or detected and corrected on a timely basis. A significant deficiency is a deficiency, or a combination of deficiencies, in internal control that is less severe than a material weakness, yet important enough to merit attention by those charged with governance. Our consideration of internal control was for the limited purpose described in the first paragraph of this section and was not designed to identify all deficiencies in internal control that might be material weaknesses or significant deficiencies. Given these limitations, during our audit we did not identify any deficiencies in internal control that we consider to be material weaknesses. However, material weaknesses may exist that have not been identified.
72

45
Belmont College Independent Auditor’s Report on Internal Control over Financial Reporting and on
Compliance and Other Matters Based on an Audit of Financial Statements Performed in Accordance with Government Auditing Standards Page 2 of 2 Compliance and Other Matters As part of obtaining reasonable assurance about whether the College's financial statements are free from material misstatement, we performed tests of its compliance with certain provisions of laws, regulations, contracts, and grant agreements, noncompliance with which could have a direct and material effect on the determination of financial statement amounts. However, providing an opinion on compliance with those provisions was not an objective of our audit, and accordingly, we do not express such an opinion. The results of our tests disclosed no instances of noncompliance or other matters that are required to be reported under Government Auditing Standards. Purpose of this Report The purpose of this report is solely to describe the scope of our testing of internal control and compliance and the results of that testing, and not to provide an opinion on the effectiveness of the entity’s internal control or on compliance. This report is an integral part of an audit performed in accordance with Government Auditing Standards in considering the entity’s internal control and compliance. Accordingly, this communication is not suitable for any other purpose.
New Philadelphia, Ohio
73
46
November 22, 2016 Board of Trustees Belmont College 68094 Hammond Road St. Clairsville, OH 43950
Independent Auditor’s Report on Compliance for Each Major Federal Program and Report on Internal Control Over Compliance Required by the Uniform Guidance
Report on Compliance for Each Major Federal Program
We have audited Belmont College’s, Belmont County, Ohio (the College) compliance with the types of compliance requirements described in the OMB Compliance Supplement that could have a direct and material effect on each of the College’s major federal programs for the year ended June 30, 2016. The College’s major federal programs are identified in the summary of auditor’s results section of the accompanying schedule of findings and questioned costs.
Management’s Responsibility Management is responsible for compliance with federal statutes, regulations, and the terms and conditions of its federal awards applicable to its federal programs. Auditor’s Responsibility Our responsibility is to express an opinion on compliance for each of College's major federal programs based on our audit of the types of compliance requirements referred to above. We conducted our audit of compliance in accordance with auditing standards generally accepted in the United States of America; the standards applicable to financial audits contained in Government Auditing Standards, issued by the Comptroller General of the United States; and the audit requirements of Title 2 U.S. Code of Federal Regulations Part 200, Uniform Administrative Requirements, Cost Principles, and Audit Requirements for Federal Awards (Uniform Guidance). Those standards and the Uniform Guidance require that we plan and perform the audit to obtain reasonable assurance about whether noncompliance with the types of compliance requirements referred to above that could have a direct and material effect on a major federal program occurred. An audit includes examining, on a test basis, evidence about College's compliance with those requirements and performing such other procedures as we considered necessary in the circumstances. We believe that our audit provides a reasonable basis for our opinion on compliance for each major federal program. However, our audit does not provide a legal determination of College's compliance. Opinion on Each Major Federal Program
In our opinion, Belmont College, Belmont County, Ohio complied, in all material respects, with the types of compliance requirements referred to above that could have a direct and material effect on each of its major federal programs for the year ended June 30, 2016.
74

47
Belmont College Independent Auditor’s Report on Compliance for Each Major Federal Program and Report on Internal Control Over Compliance Required by the Uniform Guidance Page 2 of 2 Report on Internal Control over Compliance Management of the College is responsible for establishing and maintaining effective internal control over compliance with the types of compliance requirements referred to above. In planning and performing our audit of compliance, we considered the College's internal control over compliance with the types of requirements that could have a direct and material effect on each major federal program to determine the auditing procedures that are appropriate in the circumstances for the purpose of expressing an opinion on compliance for each major federal program and to test and report on internal control over compliance in accordance with the Uniform Guidance, but not for the purpose of expressing an opinion on the effectiveness of internal control over compliance. Accordingly, we do not express an opinion on the effectiveness of College's internal control over compliance. A deficiency in internal control over compliance exists when the design or operation of a control over compliance does not allow management or employees, in the normal course of performing their assigned functions, to prevent, or detect and correct, noncompliance with a type of compliance requirement of a federal program on a timely basis. A material weakness in internal control over compliance is a deficiency, or combination of deficiencies, in internal control over compliance, such that there is a reasonable possibility that material noncompliance with a type of compliance requirement of a federal program will not be prevented, or detected and corrected, on a timely basis. A significant deficiency in internal control over compliance is a deficiency, or a combination of deficiencies, in internal control over compliance with a type of compliance requirement of a federal program that is less severe than a material weakness in internal control over compliance, yet important enough to merit attention by those charged with governance. Our consideration of internal control over compliance was for the limited purpose described in the first paragraph of this section and was not designed to identify all deficiencies in internal control over compliance that might be material weaknesses or significant deficiencies. We did not identify any deficiencies in internal control over compliance that we consider to be material weaknesses. However, material weaknesses may exist that have not been identified. The purpose of this report on internal control over compliance is solely to describe the scope of our testing of internal control over compliance and the results of that testing based on the requirements of the Uniform Guidance. Accordingly, this report is not suitable for any other purpose.
New Philadelphia, Ohio
75
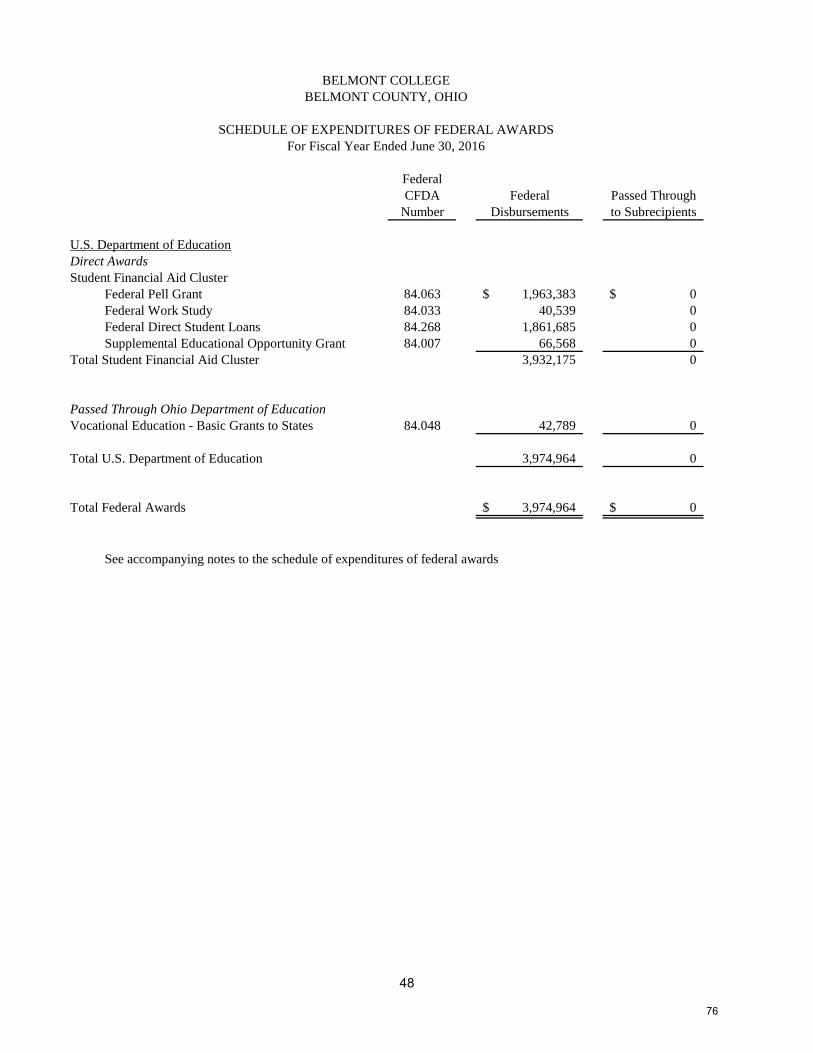
FederalCFDA Federal Passed Through
Number Disbursements to Subrecipients
U.S. Department of EducationDirect AwardsStudent Financial Aid Cluster
Federal Pell Grant 84.063 1,963,383$ 0$ Federal Work Study 84.033 40,539 0 Federal Direct Student Loans 84.268 1,861,685 0 Supplemental Educational Opportunity Grant 84.007 66,568 0
Total Student Financial Aid Cluster 3,932,175 0
Passed Through Ohio Department of EducationVocational Education - Basic Grants to States 84.048 42,789 0
Total U.S. Department of Education 3,974,964 0
Total Federal Awards 3,974,964$ 0$
See accompanying notes to the schedule of expenditures of federal awards
BELMONT COLLEGEBELMONT COUNTY, OHIO
SCHEDULE OF EXPENDITURES OF FEDERAL AWARDSFor Fiscal Year Ended June 30, 2016
48
76

BELMONT COLLEGE BELMONT COUNTY, OHIO
NOTES TO THE SCHEDULE OF EXPENDITURES OF FEDERAL AWARDS 2 CFR 200.510(B)(6)
For Fiscal Year Ended June 30, 2016
49
NOTE 1: BASIS OF PRESENTATION The accompanying schedule of expenditures of federal awards includes federal grant activity of Belmont College (the College) under programs of the federal government for the year ended June 30, 2016. The information on this Schedule is prepared in accordance with the requirements of Title 2 U.S. Code of Federal Regulations Part 200, Uniform Administrative Requirements, Cost Principles, and Audit Requirements for Federal Awards (Uniform Guidance). Because the Schedule presents only a selected portion of the operations of the College, it is not intended to and does not present the financial position, changes in net position, or cash flows of the College. NOTE 2 – SUMMARY OF SIGNIFICANT ACCOUNTING POLICIES Expenditures reported on the Schedule are reported on the cash basis of accounting. Such expenditures are recognized following the cost principles contained in Title 2 U.S. Code of Federal Regulations Part 200, Uniform Administrative Requirements, Cost Principles, and Audit Requirements for Federal Awards, wherein certain types of expenditures may or may not be allowable or may be limited as to reimbursement. The College has elected not to use the 10-percent de minimis indirect cost rate as allowed under the Uniform Guidance. NOTE 3: FEDERAL DIRECT LOAN PROGRAM The College participates in the William D. Ford Federal Direct Loan Program. The College originates the loans which are then funded through the U.S. Department of Education. Federal Subsidized Loans $ 761,385 Federal Unsubsidized Loans 1,099,722 Plus Loans 578 Total Federal Direct Student Loans $1,861,685
77
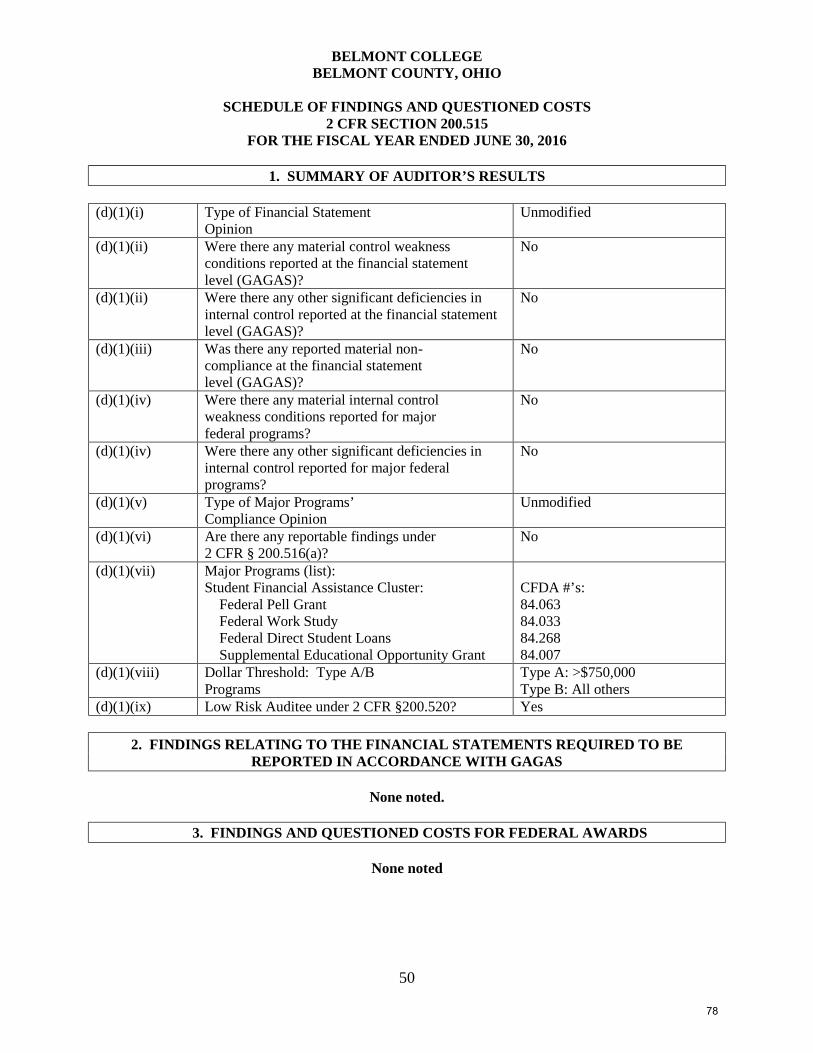
50
BELMONT COLLEGE BELMONT COUNTY, OHIO
SCHEDULE OF FINDINGS AND QUESTIONED COSTS
2 CFR SECTION 200.515 FOR THE FISCAL YEAR ENDED JUNE 30, 2016
1. SUMMARY OF AUDITOR’S RESULTS
(d)(1)(i) Type of Financial Statement
Opinion Unmodified
(d)(1)(ii) Were there any material control weakness conditions reported at the financial statement level (GAGAS)?
No
(d)(1)(ii) Were there any other significant deficiencies in internal control reported at the financial statement level (GAGAS)?
No
(d)(1)(iii) Was there any reported material non- compliance at the financial statement level (GAGAS)?
No
(d)(1)(iv) Were there any material internal control weakness conditions reported for major federal programs?
No
(d)(1)(iv) Were there any other significant deficiencies in internal control reported for major federal programs?
No
(d)(1)(v) Type of Major Programs’ Compliance Opinion
Unmodified
(d)(1)(vi) Are there any reportable findings under 2 CFR § 200.516(a)?
No
(d)(1)(vii) Major Programs (list): Student Financial Assistance Cluster: Federal Pell Grant Federal Work Study Federal Direct Student Loans Supplemental Educational Opportunity Grant
CFDA #’s: 84.063 84.033 84.268 84.007
(d)(1)(viii) Dollar Threshold: Type A/B Programs
Type A: >$750,000 Type B: All others
(d)(1)(ix) Low Risk Auditee under 2 CFR §200.520? Yes
2. FINDINGS RELATING TO THE FINANCIAL STATEMENTS REQUIRED TO BE REPORTED IN ACCORDANCE WITH GAGAS
None noted.
3. FINDINGS AND QUESTIONED COSTS FOR FEDERAL AWARDS
None noted
78

TAB B-2 CONSENT AGENDA
Administrative Items
Then and Now
79

AGENDA ITEM B-2: AUTHORIZATION FOR PAYMENT OF THEN AND NOW PURCHASE BOARD OF TRUSTEES MEETING DATE: FEBRUARY 23, 2017
As required in ORC 5705.41(D) and noted in Rea & Associates Management Letter dated December 21, 2013, Board of
Trustee authorization is required for payment of any invoice exceeding three thousand dollars that does not have prior
approval through the purchase order process. Therefore, the Administration is seeking “Then and Now” payment
authorization to the following vendor(s) as noted below:
Vendor Description Amount
OARNET
Invoice Number 143496 Content Café 2 Dated 9/14/2016 Invoice Number 143536 Univ Press Scholarship Online Dated 9/19/2016 Invoice Number 144216, Ebso Expanded Pack Dated 11/29/2016 Belmont Purchase Requisition Dated 12/16/2016
$4,319.65
AAT Trucking LLC Harrison County Center Parking Lot
Invoice Number 126 Gravel including hauling and spreading Dated 1/25/2017 Belmont Purchase Requisition Dated 02/07/2017
$4,399.89
RECOMMENDATION: Recommend the Board authorize payments to OARNET for $4,319.65 for Invoice Numbers 143496,
143536, and 144216; and to AAT Trucking LLC for $4,399.89 for Invoice Number 126.
SUBMITTED BY: John S. Koucoumaris, Vice President Administrative Affairs
80

TAB C CONSENT AGENDA
Monitoring Activities
81

TAB C-1 CONSENT AGENDA
Monitoring Activities
January 2017 Financial Report
82
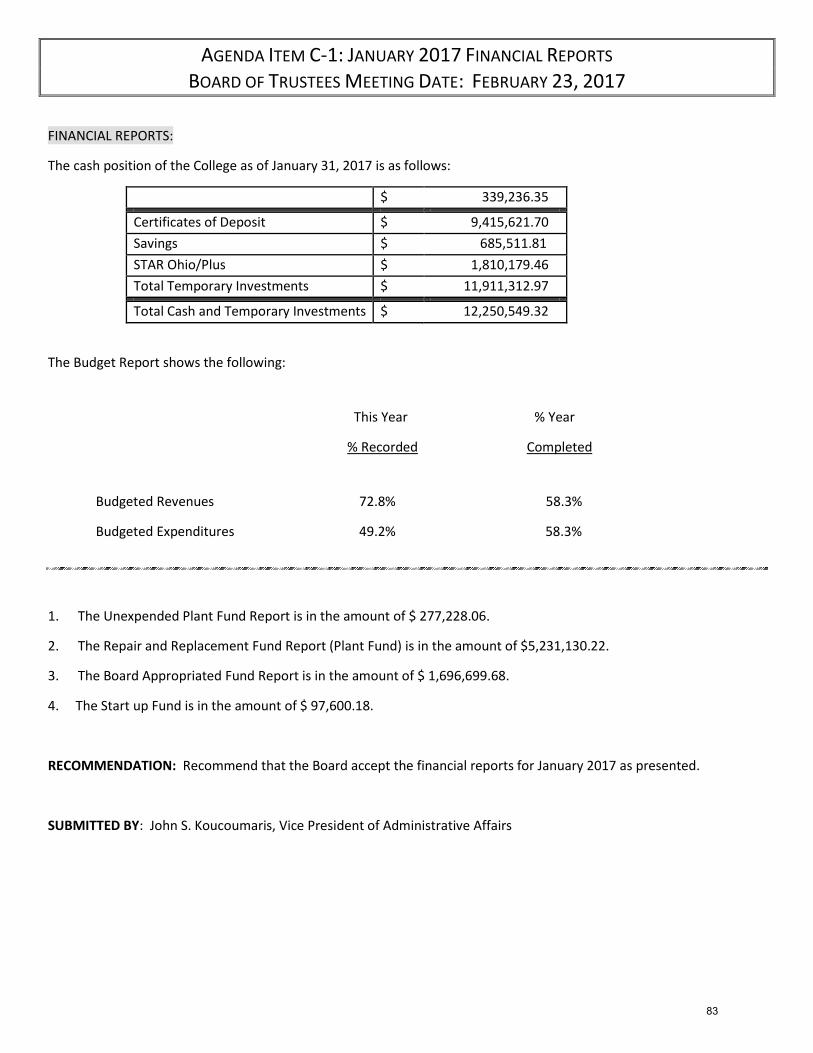
AGENDA ITEM C-1: JANUARY 2017 FINANCIAL REPORTS BOARD OF TRUSTEES MEETING DATE: FEBRUARY 23, 2017
FINANCIAL REPORTS:
The cash position of the College as of January 31, 2017 is as follows:
Checking Account
$ 339,236.35
Certificates of Deposit $ 9,415,621.70
Savings $ 685,511.81
STAR Ohio/Plus $ 1,810,179.46
Total Temporary Investments $ 11,911,312.97
03.40
Total Cash and Temporary Investments $ 12,250,549.32
The Budget Report shows the following:
This Year % Year
% Recorded Completed
Budgeted Revenues 72.8% 58.3%
Budgeted Expenditures 49.2% 58.3%
1. The Unexpended Plant Fund Report is in the amount of $ 277,228.06.
2. The Repair and Replacement Fund Report (Plant Fund) is in the amount of $5,231,130.22.
3. The Board Appropriated Fund Report is in the amount of $ 1,696,699.68.
4. The Start up Fund is in the amount of $ 97,600.18.
RECOMMENDATION: Recommend that the Board accept the financial reports for January 2017 as presented.
SUBMITTED BY: John S. Koucoumaris, Vice President of Administrative Affairs
83
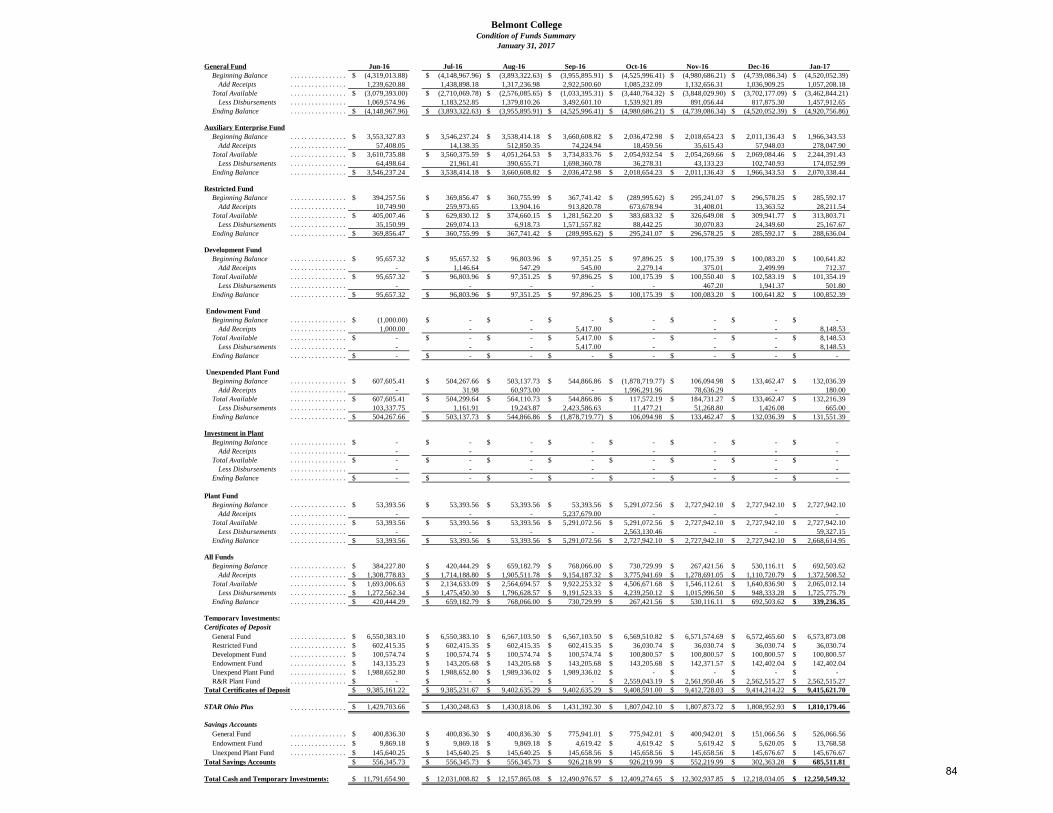
Belmont CollegeCondition of Funds Summary
January 31, 2017
General Fund Jun-16 Jul-16 Aug-16 Sep-16 Oct-16 Nov-16 Dec-16 Jan-17
Beginning Balance . . . . . . . . . . . . . . . . . . . . . . . . . . . . . . . (4,319,013.88)$ (4,148,967.96)$ (3,893,322.63)$ (3,955,895.91)$ (4,525,996.41)$ (4,980,686.21)$ (4,739,086.34)$ (4,520,052.39)$
Add Receipts . . . . . . . . . . . . . . . . . . . . . . . . . . . . . . . 1,239,620.88 1,438,898.18 1,317,236.98 2,922,500.60 1,085,232.09 1,132,656.31 1,036,909.25 1,057,208.18
Total Available . . . . . . . . . . . . . . . . . . . . . . . . . . . . . . . (3,079,393.00)$ (2,710,069.78)$ (2,576,085.65)$ (1,033,395.31)$ (3,440,764.32)$ (3,848,029.90)$ (3,702,177.09)$ (3,462,844.21)$
Less Disbursements . . . . . . . . . . . . . . . . . . . . . . . . . . . . . . . 1,069,574.96 1,183,252.85 1,379,810.26 3,492,601.10 1,539,921.89 891,056.44 817,875.30 1,457,912.65
Ending Balance . . . . . . . . . . . . . . . . . . . . . . . . . . . . . . . (4,148,967.96)$ (3,893,322.63)$ (3,955,895.91)$ (4,525,996.41)$ (4,980,686.21)$ (4,739,086.34)$ (4,520,052.39)$ (4,920,756.86)$
Auxiliary Enterprise Fund
Beginning Balance . . . . . . . . . . . . . . . . . . . . . . . . . . . . . . . 3,553,327.83$ 3,546,237.24$ 3,538,414.18$ 3,660,608.82$ 2,036,472.98$ 2,018,654.23$ 2,011,136.43$ 1,966,343.53$
Add Receipts . . . . . . . . . . . . . . . . . . . . . . . . . . . . . . . 57,408.05 14,138.35 512,850.35 74,224.94 18,459.56 35,615.43 57,948.03 278,047.90
Total Available . . . . . . . . . . . . . . . . . . . . . . . . . . . . . . . 3,610,735.88$ 3,560,375.59$ 4,051,264.53$ 3,734,833.76$ 2,054,932.54$ 2,054,269.66$ 2,069,084.46$ 2,244,391.43$
Less Disbursements . . . . . . . . . . . . . . . . . . . . . . . . . . . . . . . 64,498.64 21,961.41 390,655.71 1,698,360.78 36,278.31 43,133.23 102,740.93 174,052.99
Ending Balance . . . . . . . . . . . . . . . . . . . . . . . . . . . . . . . 3,546,237.24$ 3,538,414.18$ 3,660,608.82$ 2,036,472.98$ 2,018,654.23$ 2,011,136.43$ 1,966,343.53$ 2,070,338.44$
Restricted Fund
Beginning Balance . . . . . . . . . . . . . . . . . . . . . . . . . . . . . . . 394,257.56$ 369,856.47$ 360,755.99$ 367,741.42$ (289,995.62)$ 295,241.07$ 296,578.25$ 285,592.17$
Add Receipts . . . . . . . . . . . . . . . . . . . . . . . . . . . . . . . 10,749.90 259,973.65 13,904.16 913,820.78 673,678.94 31,408.01 13,363.52 28,211.54
Total Available . . . . . . . . . . . . . . . . . . . . . . . . . . . . . . . 405,007.46$ 629,830.12$ 374,660.15$ 1,281,562.20$ 383,683.32$ 326,649.08$ 309,941.77$ 313,803.71$
Less Disbursements . . . . . . . . . . . . . . . . . . . . . . . . . . . . . . . 35,150.99 269,074.13 6,918.73 1,571,557.82 88,442.25 30,070.83 24,349.60 25,167.67
Ending Balance . . . . . . . . . . . . . . . . . . . . . . . . . . . . . . . 369,856.47$ 360,755.99$ 367,741.42$ (289,995.62)$ 295,241.07$ 296,578.25$ 285,592.17$ 288,636.04$
Development Fund
Beginning Balance . . . . . . . . . . . . . . . . . . . . . . . . . . . . . . . 95,657.32$ 95,657.32$ 96,803.96$ 97,351.25$ 97,896.25$ 100,175.39$ 100,083.20$ 100,641.82$
Add Receipts . . . . . . . . . . . . . . . . . . . . . . . . . . . . . . . - 1,146.64 547.29 545.00 2,279.14 375.01 2,499.99 712.37
Total Available . . . . . . . . . . . . . . . . . . . . . . . . . . . . . . . 95,657.32$ 96,803.96$ 97,351.25$ 97,896.25$ 100,175.39$ 100,550.40$ 102,583.19$ 101,354.19$
Less Disbursements . . . . . . . . . . . . . . . . . . . . . . . . . . . . . . . - - - - - 467.20 1,941.37 501.80
Ending Balance . . . . . . . . . . . . . . . . . . . . . . . . . . . . . . . 95,657.32$ 96,803.96$ 97,351.25$ 97,896.25$ 100,175.39$ 100,083.20$ 100,641.82$ 100,852.39$
Endowment Fund
Beginning Balance . . . . . . . . . . . . . . . . . . . . . . . . . . . . . . . (1,000.00)$ -$ -$ -$ -$ -$ -$ -$
Add Receipts . . . . . . . . . . . . . . . . . . . . . . . . . . . . . . . 1,000.00 - - 5,417.00 - - - 8,148.53
Total Available . . . . . . . . . . . . . . . . . . . . . . . . . . . . . . . -$ -$ -$ 5,417.00$ -$ -$ -$ 8,148.53$
Less Disbursements . . . . . . . . . . . . . . . . . . . . . . . . . . . . . . . - - - 5,417.00 - - - 8,148.53
Ending Balance . . . . . . . . . . . . . . . . . . . . . . . . . . . . . . . -$ -$ -$ -$ -$ -$ -$ -$
Unexpended Plant Fund
Beginning Balance . . . . . . . . . . . . . . . . . . . . . . . . . . . . . . . 607,605.41$ 504,267.66$ 503,137.73$ 544,866.86$ (1,878,719.77)$ 106,094.98$ 133,462.47$ 132,036.39$
Add Receipts . . . . . . . . . . . . . . . . . . . . . . . . . . . . . . . - 31.98 60,973.00 - 1,996,291.96 78,636.29 - 180.00
Total Available . . . . . . . . . . . . . . . . . . . . . . . . . . . . . . . 607,605.41$ 504,299.64$ 564,110.73$ 544,866.86$ 117,572.19$ 184,731.27$ 133,462.47$ 132,216.39$
Less Disbursements . . . . . . . . . . . . . . . . . . . . . . . . . . . . . . . 103,337.75 1,161.91 19,243.87 2,423,586.63 11,477.21 51,268.80 1,426.08 665.00
Ending Balance . . . . . . . . . . . . . . . . . . . . . . . . . . . . . . . 504,267.66$ 503,137.73$ 544,866.86$ (1,878,719.77)$ 106,094.98$ 133,462.47$ 132,036.39$ 131,551.39$
Investment in Plant
Beginning Balance . . . . . . . . . . . . . . . . . . . . . . . . . . . . . . . -$ -$ -$ -$ -$ -$ -$ -$
Add Receipts . . . . . . . . . . . . . . . . . . . . . . . . . . . . . . . - - - - - - - -
Total Available . . . . . . . . . . . . . . . . . . . . . . . . . . . . . . . -$ -$ -$ -$ -$ -$ -$ -$
Less Disbursements . . . . . . . . . . . . . . . . . . . . . . . . . . . . . . . - - - - - - - -
Ending Balance . . . . . . . . . . . . . . . . . . . . . . . . . . . . . . . -$ -$ -$ -$ -$ -$ -$ -$
Plant Fund
Beginning Balance . . . . . . . . . . . . . . . . . . . . . . . . . . . . . . . 53,393.56$ 53,393.56$ 53,393.56$ 53,393.56$ 5,291,072.56$ 2,727,942.10$ 2,727,942.10$ 2,727,942.10$
Add Receipts . . . . . . . . . . . . . . . . . . . . . . . . . . . . . . . - - - 5,237,679.00 - - - -
Total Available . . . . . . . . . . . . . . . . . . . . . . . . . . . . . . . 53,393.56$ 53,393.56$ 53,393.56$ 5,291,072.56$ 5,291,072.56$ 2,727,942.10$ 2,727,942.10$ 2,727,942.10$
Less Disbursements . . . . . . . . . . . . . . . . . . . . . . . . . . . . . . . - - - - 2,563,130.46 - - 59,327.15
Ending Balance . . . . . . . . . . . . . . . . . . . . . . . . . . . . . . . 53,393.56$ 53,393.56$ 53,393.56$ 5,291,072.56$ 2,727,942.10$ 2,727,942.10$ 2,727,942.10$ 2,668,614.95$
All Funds
Beginning Balance . . . . . . . . . . . . . . . . . . . . . . . . . . . . . . . 384,227.80$ 420,444.29$ 659,182.79$ 768,066.00$ 730,729.99$ 267,421.56$ 530,116.11$ 692,503.62$
Add Receipts . . . . . . . . . . . . . . . . . . . . . . . . . . . . . . . 1,308,778.83$ 1,714,188.80$ 1,905,511.78$ 9,154,187.32$ 3,775,941.69$ 1,278,691.05$ 1,110,720.79$ 1,372,508.52$
Total Available . . . . . . . . . . . . . . . . . . . . . . . . . . . . . . . 1,693,006.63$ 2,134,633.09$ 2,564,694.57$ 9,922,253.32$ 4,506,671.68$ 1,546,112.61$ 1,640,836.90$ 2,065,012.14$
Less Disbursements . . . . . . . . . . . . . . . . . . . . . . . . . . . . . . . 1,272,562.34$ 1,475,450.30$ 1,796,628.57$ 9,191,523.33$ 4,239,250.12$ 1,015,996.50$ 948,333.28$ 1,725,775.79$
Ending Balance . . . . . . . . . . . . . . . . . . . . . . . . . . . . . . . 420,444.29$ 659,182.79$ 768,066.00$ 730,729.99$ 267,421.56$ 530,116.11$ 692,503.62$ 339,236.35$
Temporary Investments:
Certificates of Deposit
General Fund . . . . . . . . . . . . . . . . . . . . . . . . . . . . . . . 6,550,383.10$ 6,550,383.10$ 6,567,103.50$ 6,567,103.50$ 6,569,510.82$ 6,571,574.69$ 6,572,465.60$ 6,573,873.08$
Restricted Fund . . . . . . . . . . . . . . . . . . . . . . . . . . . . . . . 602,415.35$ 602,415.35$ 602,415.35$ 602,415.35$ 36,030.74$ 36,030.74$ 36,030.74$ 36,030.74$
Development Fund . . . . . . . . . . . . . . . . . . . . . . . . . . . . . . . 100,574.74$ 100,574.74$ 100,574.74$ 100,574.74$ 100,800.57$ 100,800.57$ 100,800.57$ 100,800.57$
Endowment Fund . . . . . . . . . . . . . . . . . . . . . . . . . . . . . . . 143,135.23$ 143,205.68$ 143,205.68$ 143,205.68$ 143,205.68$ 142,371.57$ 142,402.04$ 142,402.04$
Unexpend Plant Fund . . . . . . . . . . . . . . . . . . . . . . . . . . . . . . . 1,988,652.80$ 1,988,652.80$ 1,989,336.02$ 1,989,336.02$ -$ -$ -$ -$
R&R Plant Fund . . . . . . . . . . . . . . . . . . . . . . . . . . . . . . . -$ -$ -$ -$ 2,559,043.19$ 2,561,950.46$ 2,562,515.27$ 2,562,515.27$
Total Certificates of Deposit 9,385,161.22$ 9,385,231.67$ 9,402,635.29$ 9,402,635.29$ 9,408,591.00$ 9,412,728.03$ 9,414,214.22$ 9,415,621.70$
STAR Ohio Plus . . . . . . . . . . . . . . . . . . . . . . . . . . . . . . . 1,429,703.66$ 1,430,248.63$ 1,430,818.06$ 1,431,392.30$ 1,807,042.10$ 1,807,873.72$ 1,808,952.93$ 1,810,179.46$
Savings Accounts
General Fund . . . . . . . . . . . . . . . . . . . . . . . . . . . . . . . 400,836.30$ 400,836.30$ 400,836.30$ 775,941.01$ 775,942.01$ 400,942.01$ 151,066.56$ 526,066.56$
Endowment Fund . . . . . . . . . . . . . . . . . . . . . . . . . . . . . . . 9,869.18$ 9,869.18$ 9,869.18$ 4,619.42$ 4,619.42$ 5,619.42$ 5,620.05$ 13,768.58$
Unexpend Plant Fund . . . . . . . . . . . . . . . . . . . . . . . . . . . . . . . 145,640.25$ 145,640.25$ 145,640.25$ 145,658.56$ 145,658.56$ 145,658.56$ 145,676.67$ 145,676.67$
Total Savings Accounts 556,345.73$ 556,345.73$ 556,345.73$ 926,218.99$ 926,219.99$ 552,219.99$ 302,363.28$ 685,511.81$
Total Cash and Temporary Investments: 11,791,654.90$ 12,031,008.82$ 12,157,865.08$ 12,490,976.57$ 12,409,274.65$ 12,302,937.85$ 12,218,034.05$ 12,250,549.32$ 84

Belmont CollegeRevenue and Expenditures
for the Month Ending
January 31, 2017
(General Fund)
2015-2016
Final Actual % of Final Original Actual % of Budget
Actual to Date Actual Budget to Date to Date
REVENUE
Board of Regents $5,036,546 $3,044,964 60.5% $4,860,823 $2,836,681 58.4%
State Dept of Educ $0 $0 0.0% $0 $0 0.0%
Tuition $2,763,723 $2,600,592 94.1% $2,595,208 $2,601,366 100.2%
Other Student Fees $2,831,865 $2,112,500 74.6% $2,541,805 $1,914,601 75.3%
Sales and Service $0 $0 0.0% $0 $0 0.0%
Miscellaneous $133,956 $25,735 19.2% $127,750 $14,689 11.5%
TOTAL REVENUE $10,766,090 $7,783,790 72.3% $10,125,586 $7,367,338 72.8%
EXPENDITURES
Instructional $4,356,401 $2,286,689 52.5% $4,073,770 $2,038,712 50.0%
Public Services 4,832 $0 0.0% 6,732 0 0.0%
Academic Support 681,445 $368,904 54.1% 898,719 415,908 46.3%
Student Services 530,272 $300,527 56.7% 632,209 284,031 44.9%
Institutional Support 3,015,303 $1,500,543 49.8% 3,084,774 1,539,586 49.9%
Oper/Maint Plant 998,934 $615,921 61.7% 1,210,382 588,240 48.6%
Financial Aid 413,923 $248,184 60.0% 467,000 239,695 51.3%
TOTAL EXPENDITURES $10,001,110 $5,320,768 53.2% $10,373,586 $5,106,173 49.2%
DIFFERENCE $764,980 $2,463,022 ($248,000) $2,261,165
BOARD APPROPRIATIONS
Budget Stabilization Funds 248,000
-
7/12 = 58.3%
2016-2017
85

Belmont CollegeSalaries, Benefits, Operating Expenses
for the Month Ending
January 31, 2017
(General Fund)
Salaries Benefits Operations TOTAL
Budget YTD Budget YTD Budget YTD Budget YTD
Actual Actual Pct Actual Actual Pct Actual Actual Pct Actual Actual Pct
Instruction 16-17 3,178,766 1,562,665 49.2% 651,501 366,572 56.3% 243,503 109,475 45.0% 4,073,770 2,038,712 50.0%
15-16 3,519,423 1,837,226 52.2% 643,424 357,802 55.6% 193,554 91,662 47.4% 4,356,401 2,286,689 52.5%
14-15 2,990,713 1,624,975 54.3% 652,806 371,559 56.9% 183,682 101,167 55.1% 3,827,201 2,097,701 54.8%
13-14 2,781,988 1,488,170 53.5% 710,218 405,436 57.1% 174,804 80,946 46.3% 3,667,010 1,974,552 53.8%
12-13 3,021,897 1,741,911 57.6% 784,706 466,866 59.5% 168,883 88,546 52.4% 3,975,486 2,297,323 57.8%
11-12 3,634,413 1,881,751 51.8% 942,468 516,739 54.8% 191,438 111,469 58.2% 4,768,319 2,509,960 52.6%
Public Service 16-17 1,500 - 0.0% 232 - 0.0% 5,000 - 0.0% 6,732 - 0.0%
15-16 1,500 - 0.0% 242 - 0.0% 3,090 - 0.0% 4,832 - 0.0%
14-15 - - 0.0% - - 0.0% 2,477 7 0.3% 2,477 7 0.3%
13-14 3,000 - 0.0% 495 - 0.0% 2,488 - 0.0% 5,983 - 0.0%
12-13 6,000 - 0.0% 1,612 - 0.0% 4,573 11 0.2% 12,185 11 0.1%
11-12 6,000 - 0.0% 1,669 - 0.0% 7,124 894 12.6% 14,793 894 6.0%
Academic Support 16-17 579,772 265,613 45.8% 164,556 85,911 52.2% 154,391 64,385 41.7% 898,719 415,908 46.3%
15-16 469,538 262,800 56.0% 147,716 84,213 57.0% 64,191 21,891 34.1% 681,445 368,904 54.1%
14-15 917,493 544,963 59.4% 282,352 174,364 61.8% 137,780 29,464 21.4% 1,337,625 748,790 56.0%
13-14 1,085,979 640,721 59.0% 345,853 208,929 60.4% 149,577 15,788 10.6% 1,581,409 865,439 54.7%
12-13 1,091,200 646,965 59.3% 347,899 209,485 60.2% 152,044 41,927 27.6% 1,591,143 898,378 56.5%
11-12 1,173,564 676,298 57.6% 381,606 224,701 58.9% 205,287 67,425 32.8% 1,760,457 968,424 55.0%
Student Services 16-17 411,285 202,972 49.4% 161,832 69,122 42.7% 59,092 11,938 20.2% 632,209 284,031 44.9%
15-16 384,475 222,744 57.9% 125,159 68,814 55.0% 20,638 8,969 43.5% 530,272 300,527 56.7%
14-15 395,583 227,621 57.5% 119,656 71,620 59.9% 23,652 9,308 39.4% 538,891 308,550 57.3%
13-14 432,573 267,012 61.7% 158,772 102,284 64.4% 23,327 9,656 41.4% 614,672 378,953 61.7%
12-13 690,449 412,804 59.8% 262,538 159,664 60.8% 46,078 22,659 49.2% 999,066 595,127 59.6%
11-12 690,724 398,194 57.6% 252,436 142,552 56.5% 57,733 31,107 53.9% 1,000,893 571,853 57.1%
Inst'l Support 16-17 1,439,401 812,368 56.4% 431,023 241,178 56.0% 1,214,350 486,040 40.0% 3,084,774 1,539,586 49.9%
15-16 1,503,843 800,079 53.2% 417,533 245,882 58.9% 1,093,927 454,582 41.6% 3,015,303 1,500,543 49.8%
14-15 1,431,544 885,895 61.9% 485,497 295,283 60.8% 1,049,090 420,423 40.1% 2,966,131 1,601,601 54.0%
13-14 1,733,111 977,516 56.4% 543,104 325,719 60.0% 932,428 445,775 47.8% 3,208,643 1,749,010 54.5%
12-13 1,769,771 1,015,438 57.4% 575,262 346,376 60.2% 1,179,370 479,083 40.6% 3,524,403 1,840,897 52.2%
11-12 1,752,986 1,002,829 57.2% 588,373 342,864 58.3% 1,101,384 563,808 51.2% 3,442,743 1,909,501 55.5%
Oper/Maint Plant 16-17 430,670 220,457 51.2% 146,162 64,688 44.3% 633,550 303,096 47.8% 1,210,382 588,240 48.6%
15-16 362,126 209,780 57.9% 115,919 66,006 56.9% 520,890 340,136 65.3% 998,934 615,921 61.7%
14-15 338,622 202,523 59.8% 122,216 77,011 63.0% 563,743 343,914 61.0% 1,024,581 623,447 60.8%
13-14 397,193 235,278 59.2% 147,708 87,664 59.3% 494,965 283,687 57.3% 1,039,866 606,629 58.3%
12-13 404,647 237,577 58.7% 155,084 90,421 58.3% 561,969 350,677 62.4% 1,121,700 678,674 60.5%
11-12 414,311 233,350 56.3% 154,508 88,976 57.6% 550,119 330,968 60.2% 1,118,938 653,294 58.4%
Financial Aid 16-17 467,000 239,695 51.3% 467,000 239,695 51.3%
15-16 413,923 248,184 60.0% 413,923 248,184 60.0%
14-15 410,506 214,361 52.2% 410,506 214,361 52.2%
13-14 547,866 321,311 58.6% 547,866 321,311 58.6%
12-13 490,383 278,654 56.8% 490,383 278,654 56.8%
11-12 522,518 334,080 63.9% 522,518 334,080 63.9%
TOTAL 16-17 6,041,394 3,064,074 50.7% 1,555,306 827,470 53.2% 2,776,886 1,214,629 43.7% 10,373,586 5,106,173 49.2%
15-16 6,240,905 3,332,629 53.4% 1,449,993 822,716 56.7% 2,310,213 1,165,423 50.4% 10,001,110 5,320,768 53.2%
14-15 6,073,955 3,485,977 57.4% 1,662,527 989,836 59.5% 2,370,930 1,118,644 47.2% 10,107,413 5,594,457 55.4%
13-14 6,433,844 3,608,697 56.1% 1,906,150 1,130,033 59.3% 2,325,455 1,157,164 49.8% 10,665,450 5,895,894 55.3%
12-13 6,983,964 4,054,695 58.1% 2,127,101 1,272,812 59.8% 2,603,300 1,261,557 48.5% 11,714,367 6,589,063 56.2%
11-12 7,671,998 4,192,421 54.6% 2,321,060 1,315,832 56.7% 2,635,603 1,439,753 54.6% 12,628,661 6,948,006 55.0%
86
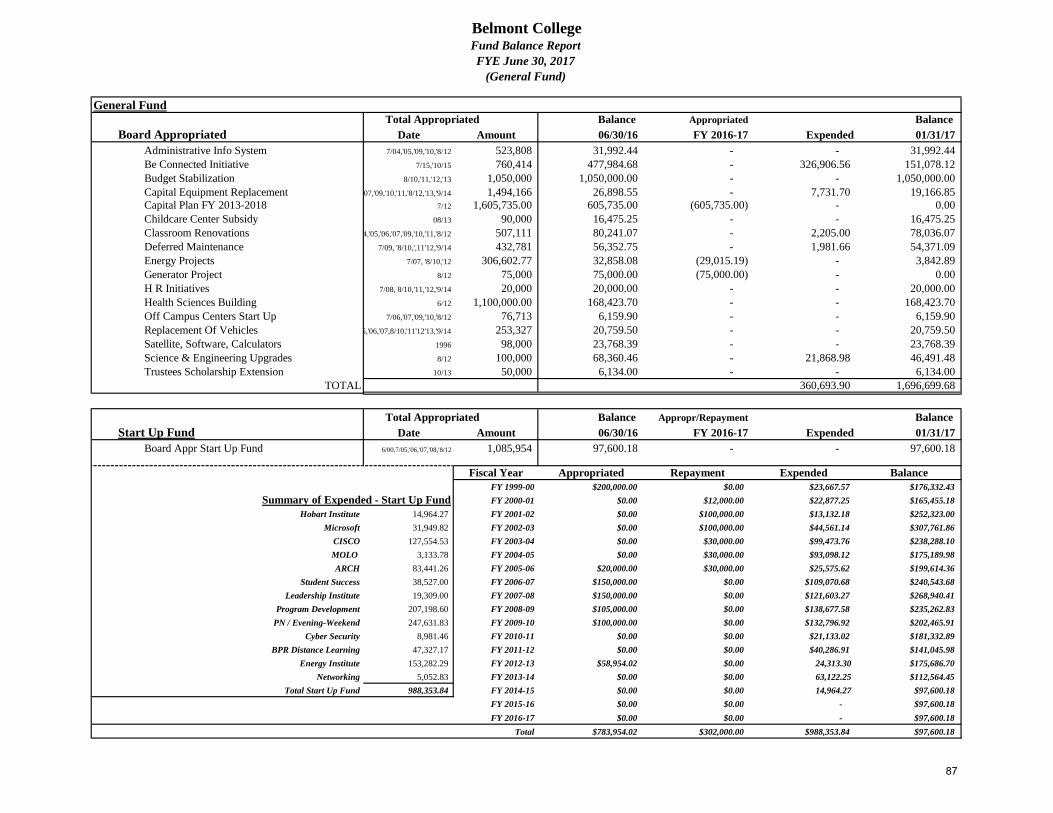
Belmont CollegeFund Balance Report
FYE June 30, 2017
(General Fund)
General Fund
Total Appropriated Balance Appropriated Balance
Board Appropriated Date Amount 06/30/16 FY 2016-17 Expended 01/31/17
Administrative Info System 7/04,'05,'09,'10,'8/12 523,808 31,992.44 - - 31,992.44
Be Connected Initiative 7/15,'10/15 760,414 477,984.68 - 326,906.56 151,078.12
Budget Stabilization 8/10,'11,'12,'13 1,050,000 1,050,000.00 - - 1,050,000.00
Capital Equipment Replacement 7/04,'05,'06,'07,'09,'10,'11,'8/12,'13,'9/14 1,494,166 26,898.55 - 7,731.70 19,166.85
Capital Plan FY 2013-2018 7/12 1,605,735.00 605,735.00 (605,735.00) - 0.00
Childcare Center Subsidy 08/13 90,000 16,475.25 - - 16,475.25
Classroom Renovations 7/04,'05,'06,'07,'09,'10,'11,'8/12 507,111 80,241.07 - 2,205.00 78,036.07
Deferred Maintenance 7/09, '8/10,',11'12,'9/14 432,781 56,352.75 - 1,981.66 54,371.09
Energy Projects 7/07, '8/10,'12 306,602.77 32,858.08 (29,015.19) - 3,842.89
Generator Project 8/12 75,000 75,000.00 (75,000.00) - 0.00
H R Initiatives 7/08, 8/10,'11,'12,'9/14 20,000 20,000.00 - - 20,000.00
Health Sciences Building 6/12 1,100,000.00 168,423.70 - - 168,423.70
Off Campus Centers Start Up 7/06,'07,'09,'10,'8/12 76,713 6,159.90 - - 6,159.90
Replacement Of Vehicles 7/05,'06,'07,8/10,'11'12'13,'9/14 253,327 20,759.50 - - 20,759.50
Satellite, Software, Calculators 1996 98,000 23,768.39 - - 23,768.39
Science & Engineering Upgrades 8/12 100,000 68,360.46 - 21,868.98 46,491.48
Trustees Scholarship Extension 10/13 50,000 6,134.00 - - 6,134.00
TOTAL 360,693.90 1,696,699.68
Total Appropriated Balance Appropr/Repayment Balance
Start Up Fund Date Amount 06/30/16 FY 2016-17 Expended 01/31/17
Board Appr Start Up Fund 6/00,7/05,'06,'07,'08,'8/12 1,085,954 97,600.18 - - 97,600.18
Fiscal Year Appropriated Repayment Expended Balance
FY 1999-00 $200,000.00 $0.00 $23,667.57 $176,332.43
Summary of Expended - Start Up Fund FY 2000-01 $0.00 $12,000.00 $22,877.25 $165,455.18
Hobart Institute 14,964.27 FY 2001-02 $0.00 $100,000.00 $13,132.18 $252,323.00
Microsoft 31,949.82 FY 2002-03 $0.00 $100,000.00 $44,561.14 $307,761.86
CISCO 127,554.53 FY 2003-04 $0.00 $30,000.00 $99,473.76 $238,288.10
MOLO 3,133.78 FY 2004-05 $0.00 $30,000.00 $93,098.12 $175,189.98
ARCH 83,441.26 FY 2005-06 $20,000.00 $30,000.00 $25,575.62 $199,614.36
Student Success 38,527.00 FY 2006-07 $150,000.00 $0.00 $109,070.68 $240,543.68
Leadership Institute 19,309.00 FY 2007-08 $150,000.00 $0.00 $121,603.27 $268,940.41
Program Development 207,198.60 FY 2008-09 $105,000.00 $0.00 $138,677.58 $235,262.83
PN / Evening-Weekend 247,631.83 FY 2009-10 $100,000.00 $0.00 $132,796.92 $202,465.91
Cyber Security 8,981.46 FY 2010-11 $0.00 $0.00 $21,133.02 $181,332.89
BPR Distance Learning 47,327.17 FY 2011-12 $0.00 $0.00 $40,286.91 $141,045.98
Energy Institute 153,282.29 FY 2012-13 $58,954.02 $0.00 24,313.30 $175,686.70
Networking 5,052.83 FY 2013-14 $0.00 $0.00 63,122.25 $112,564.45
Total Start Up Fund 988,353.84 FY 2014-15 $0.00 $0.00 14,964.27 $97,600.18
FY 2015-16 $0.00 $0.00 - $97,600.18
FY 2016-17 $0.00 $0.00 - $97,600.18
Total $783,954.02 $302,000.00 $988,353.84 $97,600.18
87

Belmont CollegeFund Balance Report
FYE June 30, 2017
(Unexpended Plant Fund)
Unexpended--Plant Fund
Total Appropriated Balance Appropriated Balance
Board Appropriated Date Amount 06/30/16 FY 2016-17 Expended 01/31/17
Health Science Center 01/14 1,500,000 8,710.97 - - 8,710.97
Main Renovations Phase 1 01/14 404,507 54,766.44 - 20,754.46 34,011.98
Main Renovations Phase 2 01/14, 9/16 760,142 617,566.55 (538,487.98) 74,195.04 4,883.53
NC Parking Lots & Drives 01/14, 9/16 50,000 50,000.00 (50,000.00) - 0.00
NC Renovations Phase 1 01/14, 9/16 350,000 350,000.00 (250,000.00) - 100,000.00
Main Roof Replacement 01/14, 9/16 301,197 301,197.00 (301,197.00) - 0.00
Polaris Retrofit 01/14, 9/16 63,796 63,796.00 (63,796.00) - 0.00
TOTAL APPROPRIATED 3,429,642 1,446,036.96 (1,203,480.98) 94,949.50 147,606.48
UnAppropriated Income
Capital Component of the Operating Subsidy 129,621.58 1,192,523.75 (1,192,523.75) - 129,621.58
TOTAL 2,638,560.71 (2,396,004.73) 94,949.50 277,228.06
Repair & Replacement Plant Fund
Total Appropriated Balance Appropriated Balance
Board Appropriated Date Amount 06/30/16 FY 2016-17 Expended 01/31/17
FY17 Main Building Improvements 9/16 5,291,073 0.00 5,291,072.56 59,327.15 5,231,745.41
Replacement of Roofs 6/87,9/16 62,000 27,144.63 (27,144.63) - 0.00
Outdoor Recreation Area 3/90,9/16 40,000 26,248.93 (26,248.93) - 0.00
TOTAL 5,393,073 53,393.56 5,237,679.00 59,327.15 5,231,745.41
Income
Investment Income - Certificates of Deposit (615.19) - - - (615.19)
TOTAL 53,393.56 5,237,679.00 59,327.15 5,231,130.22
88
TAB C-2 CONSENT AGENDA
Monitoring Activities
Semester Enrollment Report
Spring 2017
89
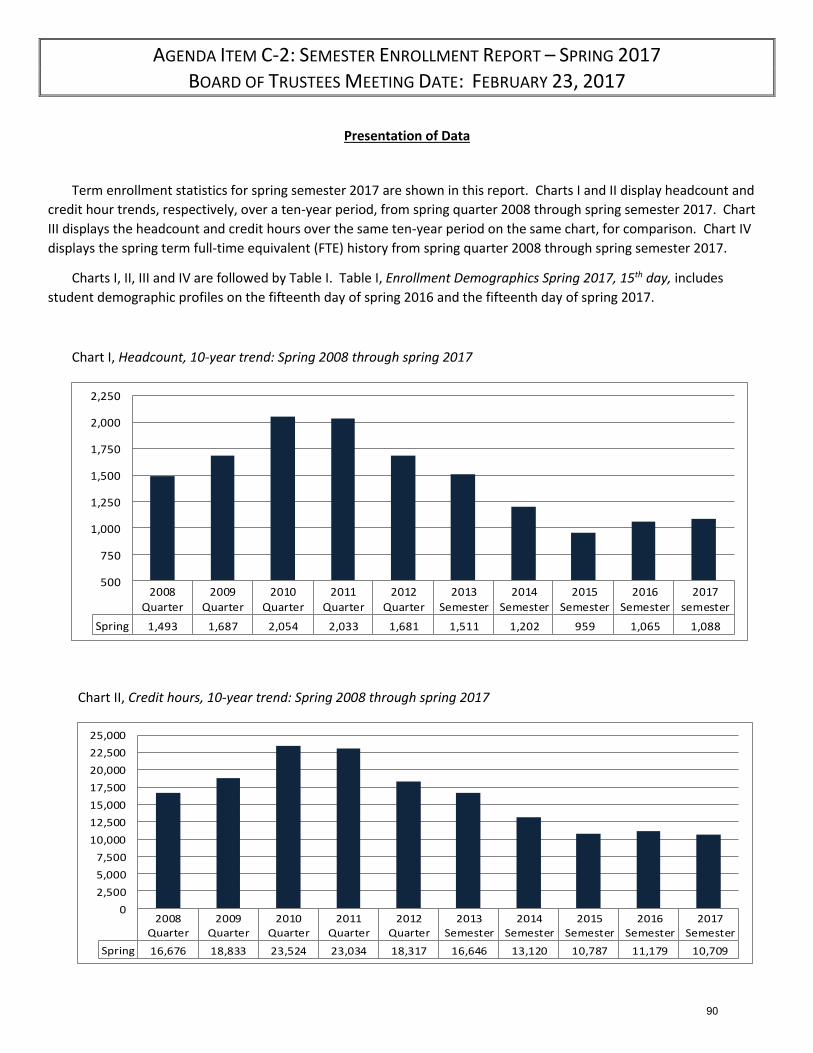
AGENDA ITEM C-2: SEMESTER ENROLLMENT REPORT – SPRING 2017 BOARD OF TRUSTEES MEETING DATE: FEBRUARY 23, 2017
Presentation of Data
Term enrollment statistics for spring semester 2017 are shown in this report. Charts I and II display headcount and
credit hour trends, respectively, over a ten-year period, from spring quarter 2008 through spring semester 2017. Chart
III displays the headcount and credit hours over the same ten-year period on the same chart, for comparison. Chart IV
displays the spring term full-time equivalent (FTE) history from spring quarter 2008 through spring semester 2017.
Charts I, II, III and IV are followed by Table I. Table I, Enrollment Demographics Spring 2017, 15th day, includes
student demographic profiles on the fifteenth day of spring 2016 and the fifteenth day of spring 2017.
Chart I, Headcount, 10-year trend: Spring 2008 through spring 2017
2008
Quarter2009
Quarter2010
Quarter2011
Quarter2012
Quarter2013
Semester2014
Semester2015
Semester2016
Semester2017
semester
Spring 1,493 1,687 2,054 2,033 1,681 1,511 1,202 959 1,065 1,088
500
750
1,000
1,250
1,500
1,750
2,000
2,250
Chart II, Credit hours, 10-year trend: Spring 2008 through spring 2017
2008
Quarter2009
Quarter2010
Quarter2011
Quarter2012
Quarter2013
Semester2014
Semester2015
Semester2016
Semester2017
Semester
Spring 16,676 18,833 23,524 23,034 18,317 16,646 13,120 10,787 11,179 10,709
0
2,500
5,000
7,500
10,000
12,500
15,000
17,500
20,000
22,500
25,000
90

Chart III, Headcount compared to Credit hours, 10-year trend: Spring 2008 through spring 2017
Chart IV, Spring full-time equivalent (FTE) history: Spring 2008 through spring 2017
2008
Quarter
2009
Quarter
2010
Quarter
2011
Quarter
2012
Quarter
2013
Semester
2014
Semester
2015
Semester
2016
Semester
2017
Semester
Spring FTEs 1,111.70 1,255.53 1,568.23 1,535.57 1,221.13 1,109.70 875 719.13 745.23 713.90
-
200
400
600
800
1,000
1,200
1,400
1,600
1,800
Data Highlights
Compared to spring term 2016, there is an increase in headcount of 2.16% or 23 heads in spring term 2017 on the fifteenth day.
Compared to spring term 2016, there is a decrease in credit hours of -4.2% or -470 credit hours in spring term 2017 on the fifteenth day.
Compared to fall term 2016, the headcount in spring term 2017 decreased -9.48% or by -114 heads. This is in contrast to a decrease in headcount from fall term 2015 to spring term 2016 of approximately -.93% or -10 heads.
Compared to fall term 2016, the credit hours in spring term 2017 have decreased -12.4% or -1517 credit hours. This is in contrast to a decrease in credit hours from fall term 2015 to spring term 2016 of approximately -4.47% or -476 credit hours.
2008Quarter
2009Quarter
2010Quarter
2011Quarter
2012Quarter
2013Semester
2014Semester
2015Semester
2016Semester
2017Semester
Headcount 1,493 1,687 2,054 2,033 1,681 1,511 1,202 959 1,065 1,088
Cr. Hours 16,676 18,833 23,524 23,034 18,317 16,646 13,120 10,787 11,179 10,709
16,676
18,833
23,524 23,034
18,31716,646
13,120
10,787 11,179 10,709
0
5,000
10,000
15,000
20,000
25,000
91

The fall term 2016 to spring term 2017 headcount and credit hour comparison rates imply less retention of students from fall to spring in the current year compared to the previous year.
Since the fifteenth day of the spring term 2017, there may be an increase in headcount and credit hours due to flexibly scheduled classes.
As shown in Table I, the average credit hours per student enrolled for spring semester 2017 decreased from 10.5 in spring 2016 to 9.84 per student in spring 2017. This is due to the increase in College Credit Plus students who take classes part-time. Overall, there are more students taking less credit hours.
92

93

Data Highlights
Demographic profiles for students enrolled on the fifteenth day of spring 2016 and spring 2017 are provided in
Table 1. The overall enrollment changes are reflected in the two columns on the right in the table, Net Change 2016
to 2017 and % Change Spring 2016 to Spring 2017.
A change in the profiles can be seen in the Full-Time/Part-Time Status category in the Part-Time Students. In
spring 2016 the Part-Time Students made up 51.36% of the student body or 547 heads. In the spring of 2017 Part-
Time students made up 57.26% of the student body or 623 heads. This is a 13.89% increase in part-time students in
spring, 2017. This change is most likely due to the College Credit Plus initiative.
Another shift in demographics is within the student Age categories. The number of students Enrolled in High
School and College and Under 18, increased 33.1%, from 174 heads in the spring of 2016 to 225 heads in the spring
of 2017. The College Credit Plus Program has successfully grown the high school headcount at the college.
The student population age 18-24 is growing at a rate of 3.8% or 19 students from 2016 to 2017. The student
population age 25-30 is growing at a rate of 1.4% or 2 students from 2016 to 2017. However, as evidenced by the
trend seen in students 31 years and older, we are continuing to lose this adult population.
Belmont College lost 31 students from the five contiguous West Virginia counties in the spring of 2017,
compared to the spring of 2016.
Analysis, Conclusions and Targets for Improvement
1. It is recommended that the College Credit Plus (CCP) students adhere to the 15 and 30 credit hour guidedpathways designed for them and that lead to an Associate of Arts or an Associate of Science Degree. In this waystudents stay on sequence and may be able to take more credit hours per term.
2. It is also recommended that the College monitor the transition rate of CCP students from high school to BelmontCollege.
3. Target the growth of enrollment among adults age 31 and older. This cohort has a declining base.4. Target recruitment from the West Virginia contiguous counties.5. Track new students and apply high impact retention support strategies from the point of admission to increase
retention not only from term to term, but from fall-to-fall to rebuild the continuing student base. Provideindividualized and personalized student advising across the curriculum.
6. Continue the work of the Student Success Leadership Team (SSLI) on guided pathways, and implement thenewly revised College Completion Plan and its metrics. Target any access groups we are not retaining with extrasupport strategies.
7. Investigate automatically conferring degrees and certificates to enhance retention, among other things.8. Increase the number of transfer students who complete an associate degree before transferring to a four-year
institution.9. Track yield and conversion rates, and develop strategies to maximize the rates.
94