Embed Size (px)
Citation preview

Board of Trustees Presentation
2014 Student Success Scorecard Report and District 2010-2016
Strategic Plan Metrics
Presented byMallory NewellAugust 25, 2014

STUDENT INFORMATIONStudents 27,521GENDER ETHNICITY/RACEFemale 53.0% White 37.2%Male 45.9% Asian 23.8%Unknown 1.1% Hispanic 20.9%AGE Unknown 6.2%Less than 20 years old 22.1% Two or more Races 4.3%20 to 24 years old 31.6% African American 3.6%25 to 49 years old 27.7% Filipino 3.1%40 or more years old 18.4% Pacific Islander 0.7%Unknown 0.1% American Indian/Indian Native 0.2%
STUDENT INFORMATIONStudents 37,043GENDER ETHNICITY/RACEFemale 48.9% Asian 38.4%Male 50.4% White 23.9%Unknown 0.7% Hispanic 21.5%AGE Filipino 5.0%Less than 20 years old 30.1% Two or more Races 4.5%20 to 24 years old 33.7% African American 3.6%25 to 49 years old 24.3% Unknown 2.4%40 or more years old 11.9% Pacific Islander 0.5%Unknown 0.0% American Indian/Indian Native 0.3%
De Anza
Foothill

Cohort Size 440 100% 576 100% 1,016 100%Female 196 45% 259 45% 455 45%Male 244 55% 317 55% 561 55%Under age 20 375 85% 482 84% 857 84%Age 20 to 24 42 10% 42 7% 84 8%Age 25 to 39 17 4% 28 5% 45 4%Age 40+ 6 1% 24 4% 30 3%African American 6 1% 46 8% 52 5%Asian 176 40% 87 15% 263 26%Filipino 11 3% 15 3% 26 3%Latino 28 6% 121 21% 149 15%Native American 1 <1% 4 <1% 5 <1%Pacific Islander 1 <1% 21 4% 22 2%White 173 39% 226 39% 399 39%Unknown Ethnicity 44 10% 56 10% 100 10%
OverallPrepared Unprepared
Cohort Size 968 100% 2,066 100% 3,034 100%Female 447 46% 934 45% 1,381 46%Male 521 54% 1,132 55% 1,653 54%Under age 20 849 88% 1,824 88% 2,673 88%Age 20 to 24 86 9% 146 7% 232 8%Age 25 to 39 26 3% 70 3% 96 3%Age 40+ 7 <1% 26 1% 33 1%African American 10 1% 95 5% 105 3%Asian 583 60% 798 39% 1,381 46%Filipino 26 3% 159 8% 185 6%Latino 48 5% 378 18% 426 14%Native American 5 <1% 15 <1% 20 <1%Pacific Islander 1 <1% 22 1% 23 1%White 211 22% 430 21% 641 21%Unknown Ethnicity 84 9% 169 8% 253 8%
OverallPrepared Unprepared
De Anza
Foothill
68% Unprepared
57% Unprepared
Cohort Definition: Completion, Persistence and 30 Unit Completion
First time students with intent to complete.Students who took a credit course for the first time, who completed 6 units in their first 3 years and attempted a Math or English course in their first 3 years.

Student Stories

2003-04 to 2008-09
2004-05 to 2009-10
2005-06 to 2010-11
2006-07 to 2011-12
2007-08 to 2012-13
0%
10%
20%
30%
40%
50%
60%
70%
80%
90%
100%
63%67%
47%48%
78%
84%
56%59%
48%45%
69%
74%
Overall Statewide - Overall Prepared Unprepared Targeted Not Targeted
Completion – De Anza
Statewide - Overall
Overall
Prepared
Targeted Ethnicity
Not Targeted Ethnicity
Unprepared
Definition: Percentage of degree, certificate and/or transfer-seeking students starting first time, tracked for six years, who completed a degree, certificate or transfer-prepared.
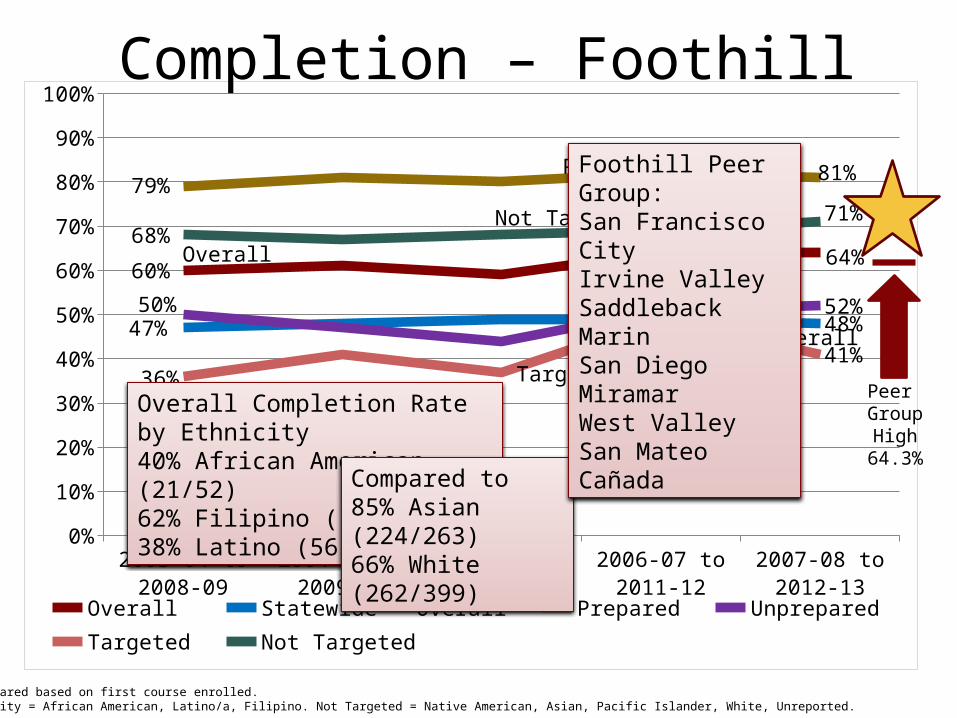
District Metric: Each college will achieve 75% or the highest score within the peer group.
Prepared/Unprepared based on first course enrolled. Targeted Ethnicity = African American, Latino/a, Filipino. Not Targeted = Native American, Asian, Pacific Islander, White, Unreported.
Overall Completion Rate by Ethnicity39% African American (41/105)50% Filipino (93/185)44% Latino (189/426)
Compared to82% Asian (1,126/1,381)61% White (391/641)
De Anza Peer Group:San Diego MesaLas PositasOrange CoastOhloneDiablo ValleySanta Barbara CityL.A. PierceMoorparkCuestaGolden WestPasadena CityPalomarMira CostaFullertonFolsom LakeSkylineGlendaleCypress Sierra
Peer GroupHigh
66.9%
2003-04 to 2008-09
2004-05 to 2009-10
2005-06 to 2010-11
2006-07 to 2011-12
2007-08 to 2012-13
0%
10%
20%
30%
40%
50%
60%
70%
80%
90%
100%
60%64%
47% 48%
79%81%
50% 52%
36%41%
68%71%
Overall Statewide - Overall Prepared Unprepared Targeted Not Targeted
Completion – Foothill
Statewide - Overall
Overall
Prepared
Targeted Ethnicity
Not Targeted Ethnicity
Unprepared
Prepared/Unprepared based on first course enrolled. Targeted Ethnicity = African American, Latino/a, Filipino. Not Targeted = Native American, Asian, Pacific Islander, White, Unreported.
Peer GroupHigh
64.3%
Overall Completion Rate by Ethnicity40% African American (21/52)62% Filipino (16/26)38% Latino (56/149) Compared to
85% Asian (224/263)66% White (262/399)
Foothill Peer Group:San Francisco CityIrvine ValleySaddlebackMarinSan Diego MiramarWest ValleySan MateoCañada
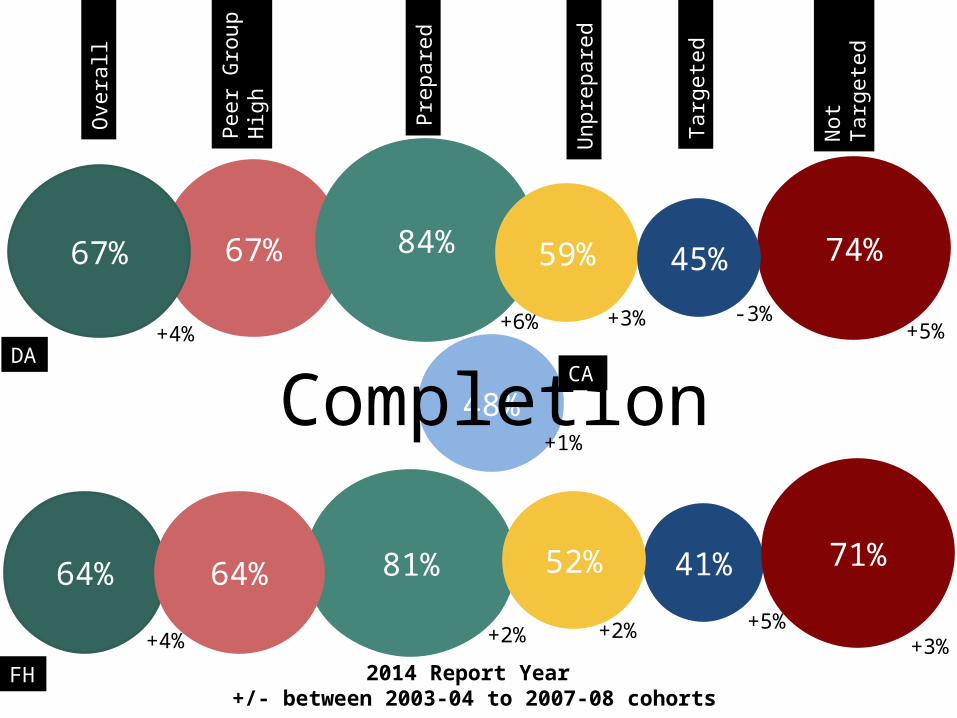
2014 Report Year +/- between 2003-04 to 2007-08 cohorts
Overa
ll
Pre
pare
d
Peer
Gro
up
Hig
h
Unpre
pare
d
Not
Targ
ete
d
Targ
ete
d
74%67%67%
+4%
84%
+6%
59%
+3%
45%
-3%+5%
DA
48%+1%
CA
Completion
FH
+2%
81%
+2%+5%
41%
+4%
64% 64%71%
+3%
52%

Persistence – De Anza
2003-04 to 2008-09
2004-05 to 2009-10
2005-06 to 2010-11
2006-07 to 2011-12
2007-08 to 2012-13
0%
10%
20%
30%
40%
50%
60%
70%
80%
90%
100%
69%72%71%71%69% 70%69% 73%67%69%69%72%
Overall Statewide - Overall Prepared Unprepared Targeted Not Targeted
Statewide - Overall
Overall Prepared Targeted Ethnicity
Not Targeted Ethnicity
UnpreparedDefinition: Percentage of degree, certificate and/or transfer-seeking first time students tracked for six years who enrolled in four consecutive terms.
District Metric: No gap between groups.
Prepared/Unprepared based on first course enrolled. Targeted Ethnicity = African American, Latino/a, Filipino. Not Targeted = Native American, Asian, Pacific Islander, White, Unreported.
Overall Persistence Rate by Ethnicity64% African American (67/105)81% Filipino (149/185)66% Latino (281/426)
Compared to75% Asian (1,041/1,381)68% White (434/641)
Peer GroupHigh
83.1%
Persistence Gap (compared to White)African Americans = 4%Filipino = No gapLatino = 2%

Persistence – Foothill
2003-04 to 2008-09
2004-05 to 2009-10
2005-06 to 2010-11
2006-07 to 2011-12
2007-08 to 2012-13
0%
10%
20%
30%
40%
50%
60%
70%
80%
90%
100%
63% 68%71%71%
65%73%
62% 65%62% 62%63% 70%
Overall Statewide - Overall Prepared Unprepared Targeted Not Targeted
Statewide - Overall
Overall
Prepared
Targeted EthnicityNot Targeted EthnicityUnprepared
Prepared/Unprepared based on first course enrolled. Targeted Ethnicity = African American, Latino/a, Filipino. Not Targeted = Native American, Asian, Pacific Islander, White, Unreported.
Overall Persistence Rate by Ethnicity64% African American (33/52)73% Filipino (19/26)59% Latino (88/149) Compared to
78% Asian (204/263)69% White (274/399)
Peer GroupHigh
78.1%
Persistence Gap:African American = 5%Filipino = No gapLatino = 10%

30 Unit Completion – De Anza
2003-04 to 2008-09
2004-05 to 2009-10
2005-06 to 2010-11
2006-07 to 2011-12
2007-08 to 2012-13
0%
10%
20%
30%
40%
50%
60%
70%
80%
90%
100%
75% 78%
65%67%
72% 73%76% 80%
71%72%
77%80%
Overall Statewide - Overall Prepared Unprepared Targeted Not Targeted
Statewide - Overall
OverallPrepared
Targeted Ethnicity
Not Targeted EthnicityUnprepared
Prepared/Unprepared based on first course enrolled. Targeted Ethnicity = African American, Latino/a, Filipino. Not Targeted = Native American, Asian, Pacific Islander, White, Unreported.
Definition: Percentage of degree, certificate and/or transfer-seeking first time students, tracked for six years who achieved at least 30 units.
Overall 30 Unit Completion Rate by Ethnicity70% African American (73/105)85% Filipino (158/185)67% Latino (285/426)
Compared to82% Asian (1,133/1,381)78% White (499/641)
Peer GroupHigh
78.1%

30 Unit Completion – Foothill
2003-04 to 2008-09
2004-05 to 2009-10
2005-06 to 2010-11
2006-07 to 2011-12
2007-08 to 2012-13
0%
10%
20%
30%
40%
50%
60%
70%
80%
90%
100%
72%72%
65%67%
69% 70%72%
70%65%
64%
74% 74%
Overall Statewide - Overall Prepared Unprepared Targeted Not Targeted
Statewide - OverallOverall Prepared
Targeted Ethnicity
Not Targeted Ethnicity
Unprepared
Prepared/Unprepared based on first course enrolled. Targeted Ethnicity = African American, Latino/a, Filipino. Not Targeted = Native American, Asian, Pacific Islander, White, Unreported.
30 Unit Completion Rate by Ethnicity71% African American (37/52)77% Filipino (20/26)59% Latino (88/149)
Compared to79% Asian (207/263)74% White (294/399)
Peer GroupHigh
74.6%

2003-04 to 2008-09
2004-05 to 2009-10
2005-06 to 2010-11
2006-07 to 2011-12
2007-08 to 2012-13
0%
10%
20%
30%
40%
50%
60%
70%
80%
90%
70%72%
41%44%
65%60%
73%78%
Overall Statewide - Overall Targeted Not Targeted
Basic Skills English – De Anza
Statewide - Overall
Overall
Targeted Ethnicity
Not Targeted Ethnicity
Definition: Percentage of students who started 1-4 levels below transfer level English tracked for six years, who complete college level English.
District Metric: Each college will achieve 85% or the highest score within the peer group.
Prepared/Unprepared based on first course enrolled. Targeted Ethnicity = African American, Latino/a, Filipino. Not Targeted = Native American, Asian, Pacific Islander, White, Unreported.
Overall Rate by Ethnicity51% African American (50/98)75% Filipino (123/164)57% Latino (214/377) Compared to
84% Asian (632/757)71% White (245/345)
Peer GroupHigh
72.1%

2003-04 to 2008-09
2004-05 to 2009-10
2005-06 to 2010-11
2006-07 to 2011-12
2007-08 to 2012-13
0%
10%
20%
30%
40%
50%
60%
70%
80%
90%
100%
60%55%
41% 44%
53%47%
64%60%
Overall Statewide - Overall Targeted Not Targeted
Basic Skills English – Foothill
Statewide - Overall
OverallTargeted Ethnicity
Not Targeted Ethnicity
Prepared/Unprepared based on first course enrolled. Targeted Ethnicity = African American, Latino/a, Filipino. Not Targeted = Native American, Asian, Pacific Islander, White, Unreported.
Overall Rate by Ethnicity52% African American (31/60)32% Filipino (8/25)48% Latino (84/177)
Compared to70% Asian (56/80)63% White (157/248)
Peer GroupHigh
62.4%

2003-04 to 2008-09
2004-05 to 2009-10
2005-06 to 2010-11
2006-07 to 2011-12
2007-08 to 2012-13
0%
10%
20%
30%
40%
50%
60%
70%
80%
90%
100%
45%
54%
28% 31%
38%44%
49%
60%
Overall Statewide - Overall Targeted Not Targeted
Basic Skills Math – De Anza
Statewide - Overall
OverallTargeted Ethnicity
Not Targeted Ethnicity
Definition: Percentage of students who started 2-4 levels below transfer level math tracked for six years, who complete 1 level below college level math.
Prepared/Unprepared based on first course enrolled. Targeted Ethnicity = African American, Latino/a, Filipino. Not Targeted = Native American, Asian, Pacific Islander, White, Unreported.
Overall Rate by Ethnicity44% African American (57/129)53% Filipino (101/190)41% Latino (196/483)
Compared to69% Asian (317/462)55% White (297/542)
Peer GroupHigh
53.5%

2003-04 to 2008-09
2004-05 to 2009-10
2005-06 to 2010-11
2006-07 to 2011-12
2007-08 to 2012-13
0%
10%
20%
30%
40%
50%
60%
70%
50% 50%
28%31%
41%38%
54%58%
Overall Statewide - Overall Targeted Not Targeted
Basic Skills Math – Foothill
Statewide - Overall
Overall
Targeted Ethnicity
Not Targeted Ethnicity
Prepared/Unprepared based on first course enrolled. Targeted Ethnicity = African American, Latino/a, Filipino. Not Targeted = Native American, Asian, Pacific Islander, White, Unreported.
Overall Rate by Ethnicity38% African American (18/47)35% Filipino (7/20)39% Latino (57/148)
Compared to60% Asian (25/42)60% White (141/237)
Peer GroupHigh50%

2003-04 to 2008-09
2004-05 to 2009-10
2005-06 to 2010-11
2006-07 to 2011-12
2007-08 to 2012-13
0%
10%
20%
30%
40%
50%
60%
70%
80%
90%
100%
37%
46%
23%27%
23% 20%
40%
49%
Overall Statewide - Overall Targeted Not Targeted
Basic Skills ESL – De Anza
Statewide - OverallOverall
Targeted Ethnicity
Not Targeted Ethnicity
Definition: Percentage of students who started at any level below transfer level ESL tracked for six years, who complete ESL series or college level English.
Prepared/Unprepared based on first course enrolled. Targeted Ethnicity = African American, Latino/a, Filipino. Not Targeted = Native American, Asian, Pacific Islander, White, Unreported.
Overall Rate by Ethnicity29% African American (7/24)50% Filipino (5/10)13% Latino (9/70) Compared to
52% Asian (332/644)36% White (37/104)
Peer GroupHigh
65.4%

2003-04 to 2008-09
2004-05 to 2009-10
2005-06 to 2010-11
2006-07 to 2011-12
2007-08 to 2012-13
0%
10%
20%
30%
40%
50%
60%
70%
80%
90%
100%
37%41%
23%27%
21%16%
52% 55%
Overall Statewide - Overall Targeted Not Targeted
Basic Skills ESL – Foothill
Statewide - Overall
Overall
Targeted Ethnicity
Not Targeted Ethnicity
Prepared/Unprepared based on first course enrolled. Targeted Ethnicity = African American, Latino/a, Filipino. Not Targeted = Native American, Asian, Pacific Islander, White, Unreported
Overall Rate by Ethnicity33% African American (<10)0% Filipino (0)16% Latino (18/114)
Compared to61% Asian (82/135)46% White (27/59)
Peer GroupHigh
58.3%

2003-04 to 2008-09
2004-05 to 2009-10
2005-06 to 2010-11
2006-07 to 2011-12
2007-08 to 2012-13
0%
10%
20%
30%
40%
50%
60%
70%
80%
90%
100%
54%
61%54% 54%56%
59%55%
62%
Overall Statewide - Overall Targeted Not Targeted
CTE Completion– De Anza
Statewide - OverallOverall
Targeted Ethnicity
Not Targeted EthnicityDefinition: Students who complete a CTE course for the first time and complete more than 8 units in 3 years in a single discipline who, within 6 years, complete a degree, certificate or transfer-prepared.
District Metric: Each college will achieve 90% or the highest rate within the peer group.
Prepared/Unprepared based on first course enrolled. Targeted Ethnicity = African American, Latino/a, Filipino. Not Targeted = Native American, Asian, Pacific Islander, White, Unreported.
Overall Rate by Ethnicity61% African American (77/126)64% Filipino (93/146)56% Latino (267/479) Compared to
66% Asian (894/1,342)57% White (459/803)
Peer GroupHigh
68.8%

2003-04 to 2008-09
2004-05 to 2009-10
2005-06 to 2010-11
2006-07 to 2011-12
2007-08 to 2012-13
0%
10%
20%
30%
40%
50%
60%
70%
80%
90%
100%
50%44%
54% 54%55%
41%49% 45%
Overall Statewide - Overall Targeted Not Targeted
CTE Completion– Foothill
Statewide - OverallOverall
Targeted Ethnicity
Not Targeted Ethnicity
Prepared/Unprepared based on first course enrolled. Targeted Ethnicity = African American, Latino/a, Filipino. Not Targeted = Native American, Asian, Pacific Islander, White, Unreported.
Overall CTE Completion Rate by Ethnicity44% African American (27/61)52% Filipino (33/63)38% Latino (95/253)
Compared to52% Asian (292/563)41% White (342/835)
Peer GroupHigh
55.2%

Status inMeasure College Peer Avg Peer Low Peer High State Peer GroupCompletion (Overall) 66.9% 54.8% 46.7% 66.9% 48.1% HighestCompletion (Prepared) 83.9% 73.0% 66.6% 83.9% 70.2% HighestCompletion (Unprepared) 59.0% 45.4% 38.8% 59.0% 40.5% HIghestMath Completion 53.5% 37.2% 30.1% 53.5% 30.6% HighestEnglish Completion 72.1% 52.9% 39.8% 72.1% 43.6% HighestAttainment of 30 units 78.0% 70.6% 58.8% 78.1% 66.5% HighestESL Completion 45.8% 30.3% 1.8% 65.4% 27.1% Above AverageCTE Completion 61.0% 58.8% 46.0% 68.8% 53.9% Above AveragePersistence (Overall) 71.5% 73.8% 68.1% 83.1% 70.5% Below AveragePersistence (Prepared) 68.9% 73.9% 57.9% 84.1% 71.9% Below AveragePersistence (Unprepared) 72.7% 73.5% 66.3% 83.9% 70.1% Below Average
Status inMeasure College Peer Avg Peer Low Peer High State Peer GroupCompletion (Overall) 64.3% 56.3% 49.2% 64.3% 48.1% HighestCompletion (Prepared) 80.5% 74.3% 67.4% 80.5% 70.2% HighestMath Completion 50.0% 36.9% 26.6% 50.0% 30.6% HighestCompletion (Unprepared) 51.9% 47.3% 37.9% 54.3% 40.5% Above AveragePersistence (Prepared) 72.7% 70.3% 60.2% 78.0% 71.9% Above AverageAttainment of 30 units 71.9% 69.8% 61.1% 74.6% 66.5% Above AverageEnglish Completion 55.3% 52.0% 45.4% 62.4% 43.6% Above AverageESL Completion 41.4% 26.4% 11.4% 58.3% 27.1% Above AveragePersistence (Overall) 68.4% 71.9% 64.9% 78.1% 70.5% Below AverageCTE Completion 44.1% 49.9% 43.1% 55.2% 53.9% Below AveragePersistence (Unprepared) 65.1% 72.4% 65.1% 78.1% 70.1% Lowest
DA
FH
0%
10%
20%
30%
40%
50%
60%
70%
80%
90%
100%
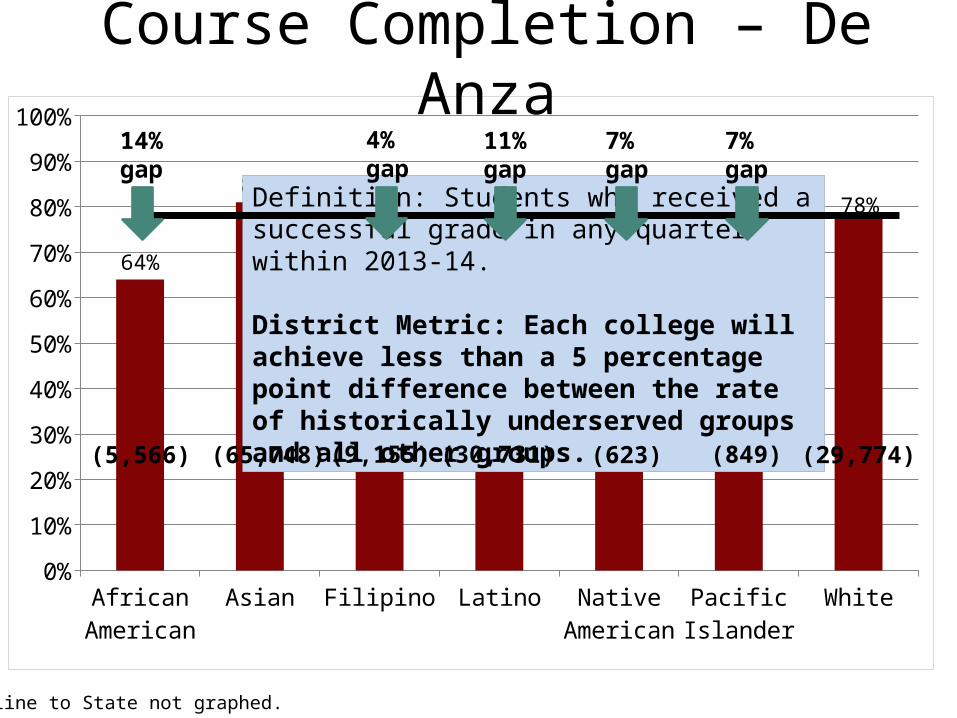
64%
81%
74%
67%71% 71%
78%
Course Completion – De Anza
Definition: Students who received a successful grade in any quarter within 2013-14.
District Metric: Each college will achieve less than a 5 percentage point difference between the rate of historically underserved groups and all other groups.
7% gap
11% gap
4% gap
7% gap
14% gap
(5,566) (30,731) (623) (849) (29,774)(9,155)(65,748)
Decline to State not graphed.

0%
10%
20%
30%
40%
50%
60%
70%
80%
90%
100%
57%
80%
73%
66%70%
65%
78%
Course Completion – Foothill
(3,163) (13,608) (474) (921) (24,824)(3,737)(21,552)
Decline to State not graphed.
13% gap
12% gap
8% gap
21% gap
5% gap
FHDA0%
10%
20%
30%
40%
50%
60%
70%
80%
90%
100%
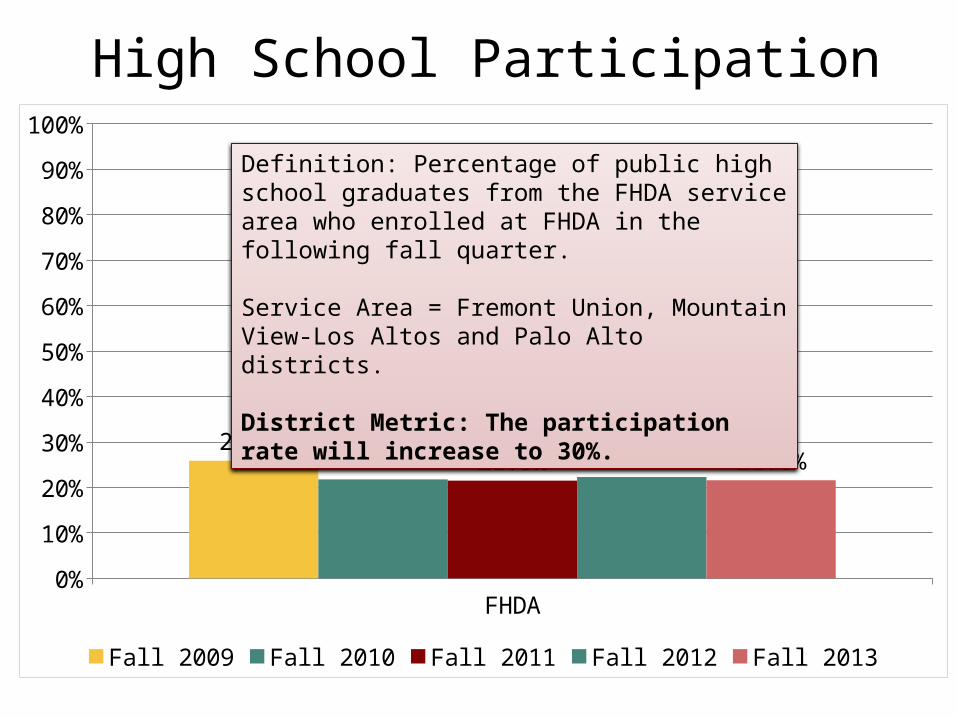
25.9%21.8% 21.5% 22.3% 21.6%
Fall 2009 Fall 2010 Fall 2011 Fall 2012 Fall 2013
High School Participation
Definition: Percentage of public high school graduates from the FHDA service area who enrolled at FHDA in the following fall quarter.
Service Area = Fremont Union, Mountain View-Los Altos and Palo Alto districts.
District Metric: The participation rate will increase to 30%.

Questions or Comments
24