Embed Size (px)
Citation preview
Board of Trustees Presentation
Trends in Student Enrollment and Demographics
Foothill-De Anza
Institutional Research & Planning
Spring 2015
Outline
Part I: The data – EnrollmentWhat are the trends?
What is (should be) our current reality?
Part II: How to think about dataPerspective on improvement strategies
What’s the problem with outcome rates?
Data Resources
FHDA Research Website
Factbook
Fast Facts
Strategic Planning Documents
College Institutional Research Websites
Completed Research Projects
Program Review
Active Division
CCCCOStudent Success Scorecard
Data Mart
Outline
Part I: The data – EnrollmentWhat are the trends?
What is (should be) our current reality?
Part II: How to think about dataPerspective on improvement strategies
What’s the problem with outcome rates?
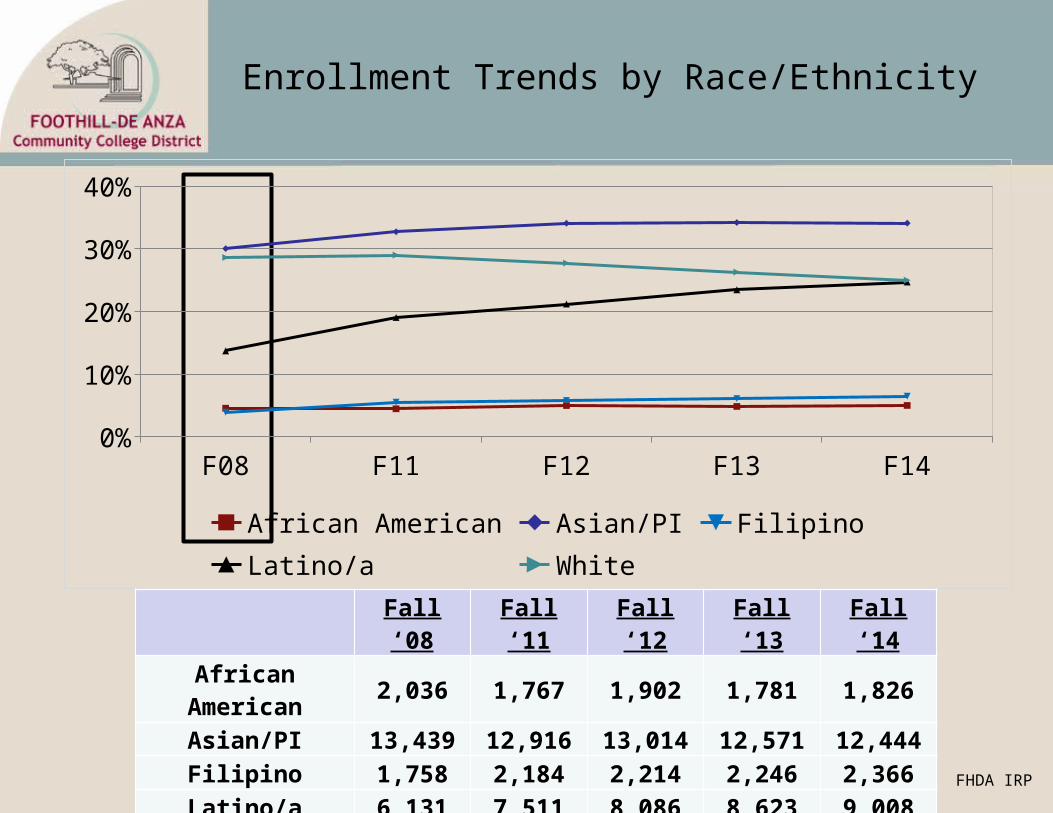
Enrollment Trends by Race/Ethnicity
F08 F11 F12 F13 F140%5%
10%15%20%25%30%35%40%
African American Asian/PI FilipinoLatino/a White
Fall ‘08 Fall ‘11 Fall ‘12 Fall ‘13 Fall ‘14African American 2,036 1,767 1,902 1,781 1,826
Asian/PI 13,439 12,916 13,014 12,571 12,444Filipino 1,758 2,184 2,214 2,246 2,366Latino/a 6,131 7,511 8,086 8,623 9,008White 12,807 11,446 10,587 9,664 9,120Total 44,762 39,482 38,204 36,774 36,507 FHDA IRP
Enrollment Trends by Gender & FT/PT
F08 F11 F12 F13 F1447.0%
48.0%
49.0%
50.0%
51.0%
Male Female
F08 F11 F12 F13 F140%
20%
40%
60%
80%
Full-time Part-time
Fall ‘08
Fall ‘11
Fall ‘12
Fall ‘13
Fall ‘14
Full-time 14,031 14,921 15,574 15,990 16,222
Part-time 30,731 24,561 22,630 20,784 20,285
Fall ‘08
Fall ‘11
Fall ‘12
Fall ‘13
Fall ‘14
Male 22,089 19,451 18,551 18,109 18,089
Female 22,645 19,724 19,371 18,430 18,160
Unrecorded 28 307 282 235 258
FHDA IRPFHDA IRP
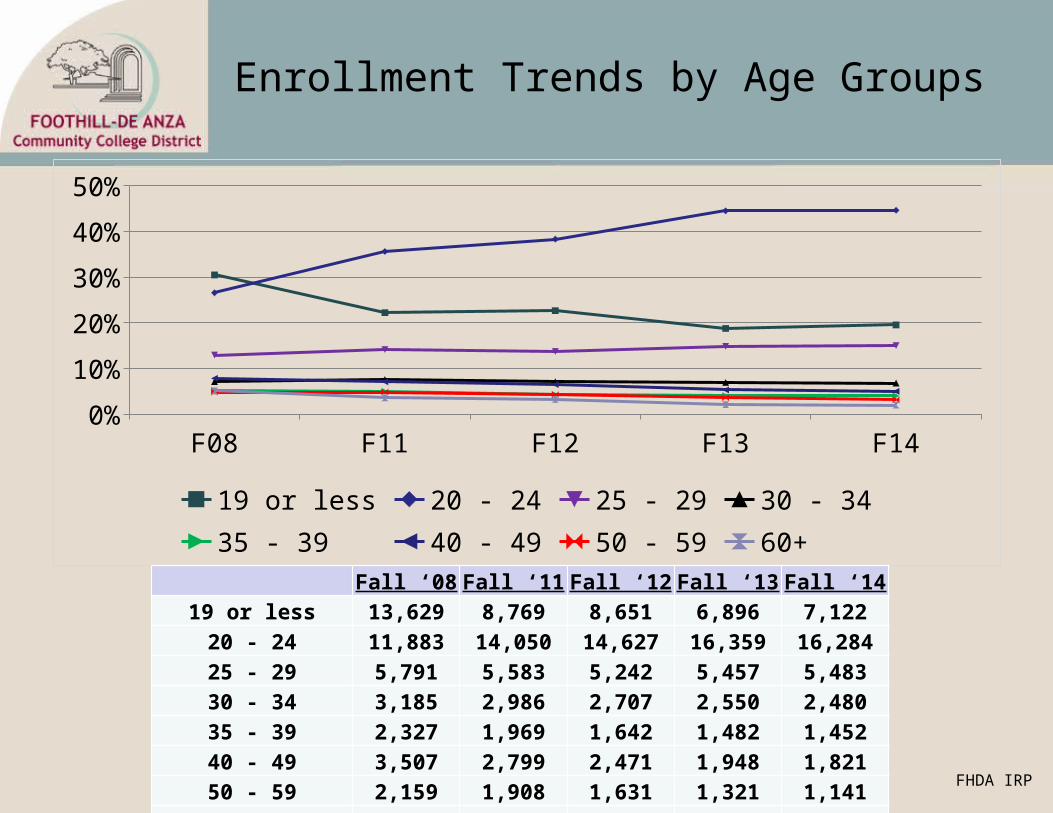
Enrollment Trends by Age Groups
F08 F11 F12 F13 F140%
10%
20%
30%
40%
50%
19 or less 20 - 24 25 - 29 30 - 3435 - 39 40 - 49 50 - 59 60+
Fall ‘08 Fall ‘11 Fall ‘12 Fall ‘13 Fall ‘1419 or less 13,629 8,769 8,651 6,896 7,122
20 - 24 11,883 14,050 14,627 16,359 16,28425 - 29 5,791 5,583 5,242 5,457 5,48330 - 34 3,185 2,986 2,707 2,550 2,48035 - 39 2,327 1,969 1,642 1,482 1,45240 - 49 3,507 2,799 2,471 1,948 1,82150 - 59 2,159 1,908 1,631 1,321 1,141
60+ 2,271 1,409 1,229 761 724FHDA IRP
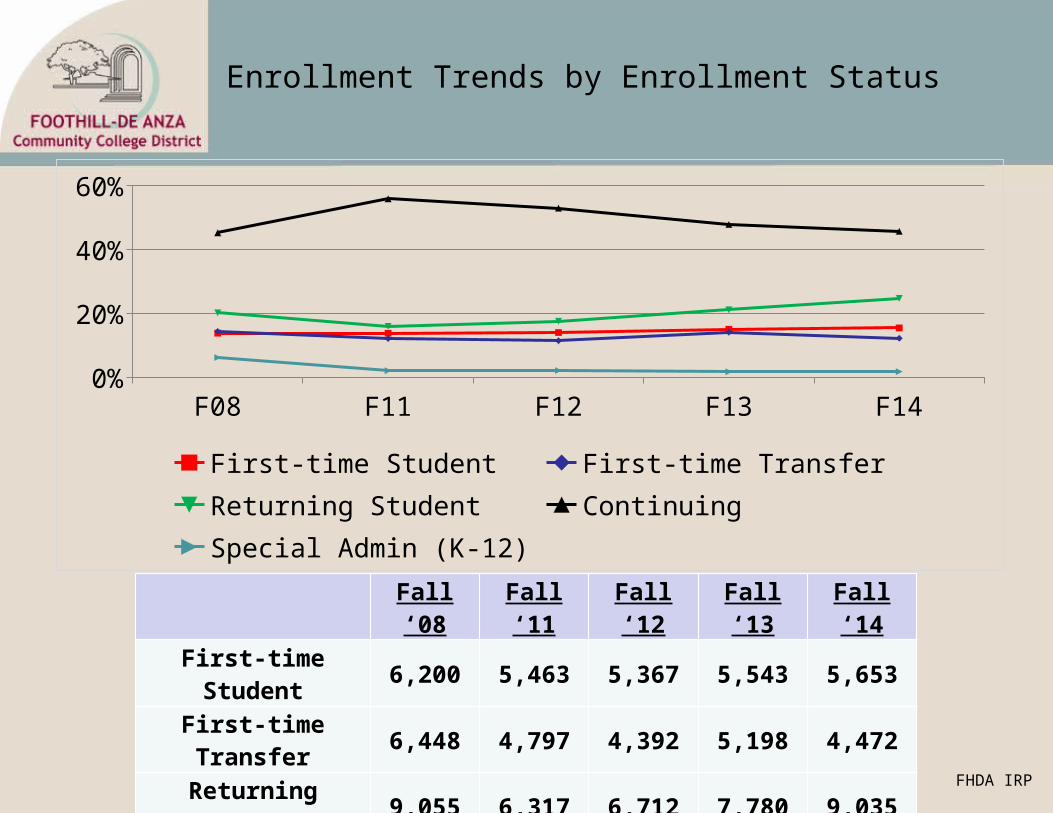
Enrollment Trends by Enrollment Status
F08 F11 F12 F13 F140%
10%
20%
30%
40%
50%
60%
First-time Student First-time Transfer Returning StudentContinuing Special Admin (K-12)
Fall ‘08 Fall ‘11 Fall ‘12 Fall ‘13 Fall ‘14
First-time Student 6,200 5,463 5,367 5,543 5,653
First-time Transfer 6,448 4,797 4,392 5,198 4,472
Returning Student 9,055 6,317 6,712 7,780 9,035
Continuing 20,262 22,070 20,236 17,597 16,689
Special Admin (K-12) 2,787 832 825 654 658FHDA IRP
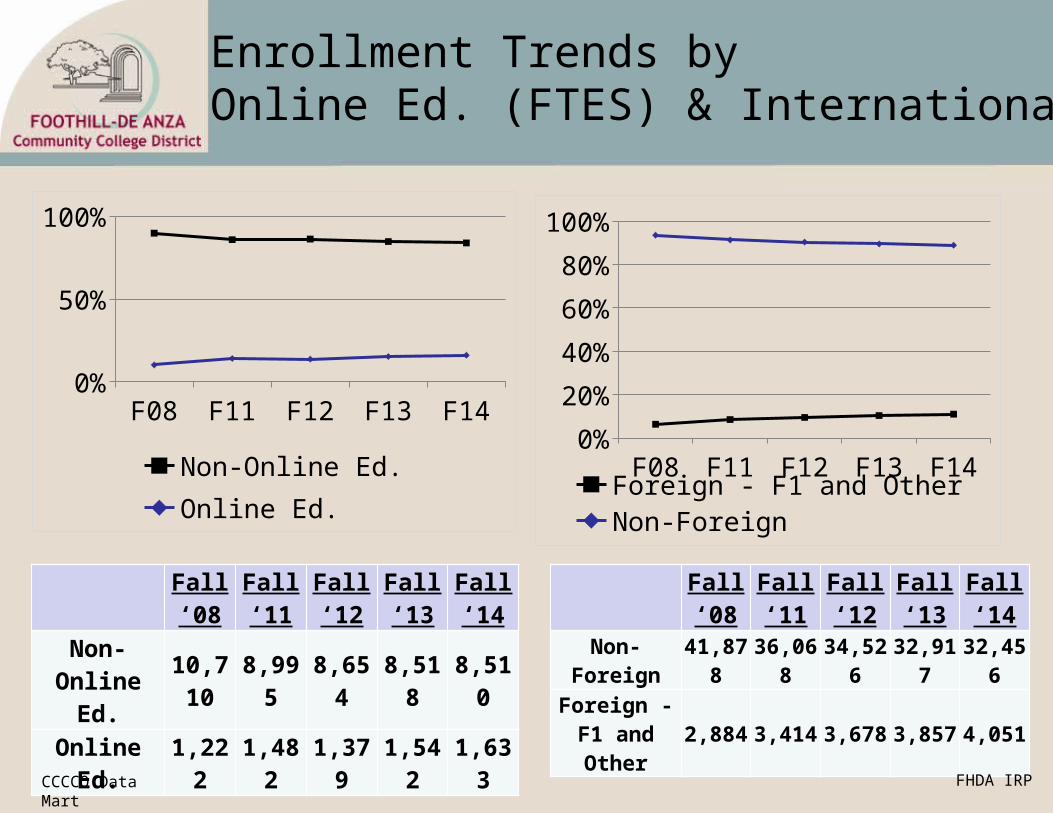
Enrollment Trends by Online Ed. (FTES) & International
Fall ‘08
Fall ‘11
Fall ‘12
Fall ‘13
Fall ‘14
Non-Foreign 41,878 36,068 34,526 32,917 32,456
Foreign - F1 and Other
2,884 3,414 3,678 3,857 4,051
Fall ‘08
Fall ‘11
Fall ‘12
Fall ‘13
Fall ‘14
Non-Online Ed.
10,710 8,995 8,654 8,518 8,510
Online Ed. 1,222 1,482 1,379 1,542 1,633
F08 F11 F12 F13 F140%
20%
40%
60%
80%
100%
Foreign - F1 and OtherNon-Foreign
F08 F11 F12 F13 F140%
20%
40%
60%
80%
100%
Non-Online Ed. Online Ed.
FHDA IRPCCCCO Data Mart

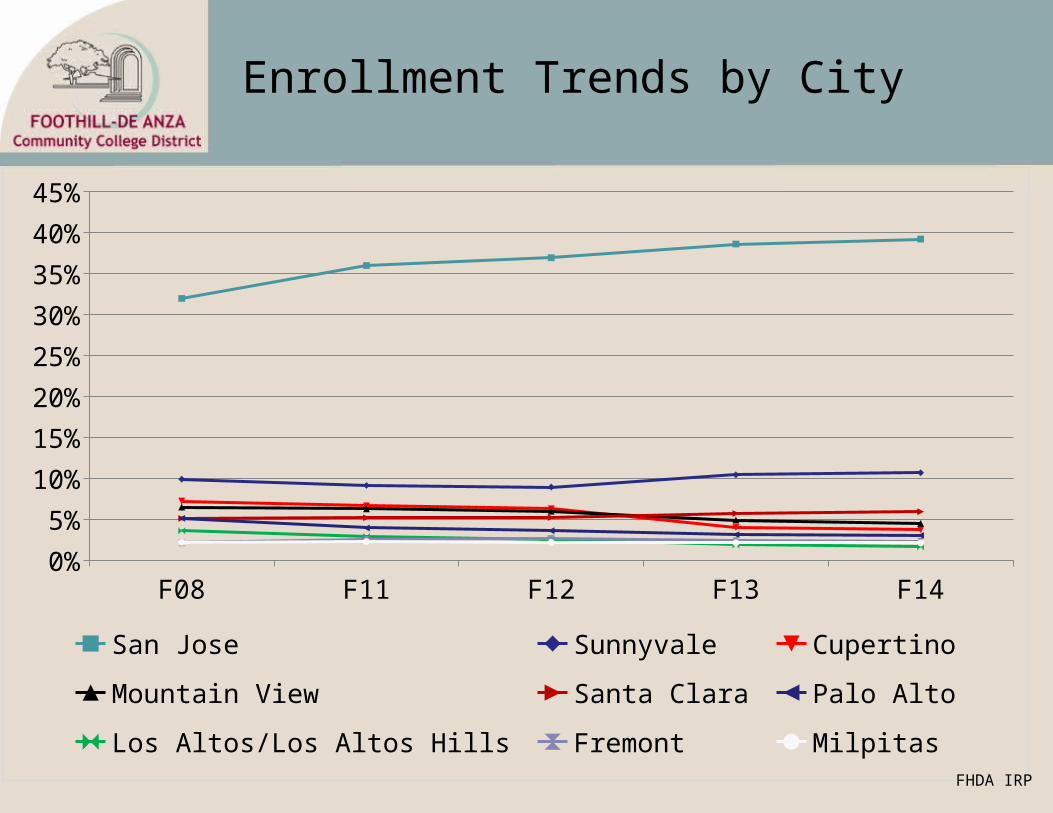
Enrollment Trends by City
F08 F11 F12 F13 F140%
10%
20%
30%
40%
50%
San Jose Sunnyvale Cupertino Mountain ViewSanta Clara Palo Alto Los Altos/Los Altos Hills FremontMilpitas
F08 F11 F12 F13 F14San Jose 14,316 14,210 14,113 14,203 14,321Sunnyvale 4,436 3,613 3,421 3,839 3,905Cupertino 3,238 2,627 2,408 1,479 1,361Mountain View 2,915 2,486 2,294 1,808 1,648Santa Clara 2,294 2,050 2,001 2,102 2,170Palo Alto 2,298 1,561 1,382 1,155 1,108Los Altos/Los Altos Hills 1,616 1,153 996 693 606Fremont 960 1,012 1,022 883 849Milpitas 984 907 836 792 774Other 11,705 9,863 9,731 9,820 9,765 FHDA IRP
Enrollment Trends by City
F08 F11 F12 F13 F140%
5%
10%
15%
20%
25%
30%
35%
40%
45%
San Jose Sunnyvale Cupertino Mountain View
Santa Clara Palo Alto Los Altos/Los Altos Hills Fremont
MilpitasFHDA IRP
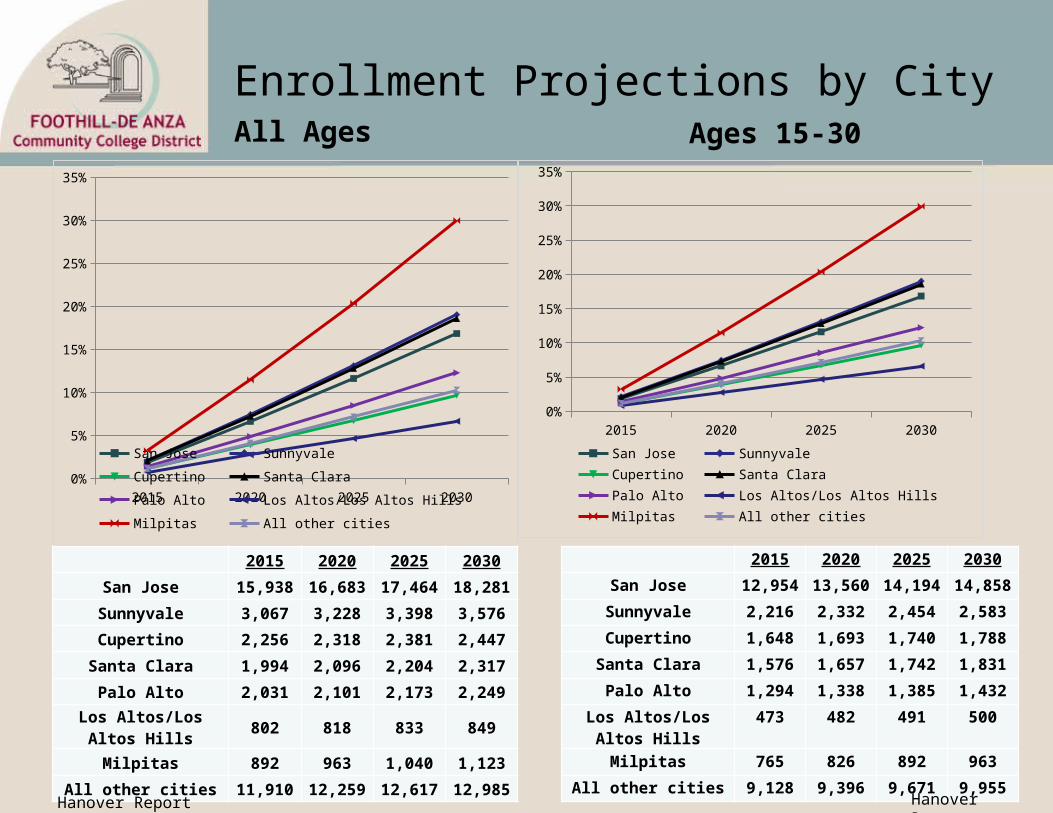
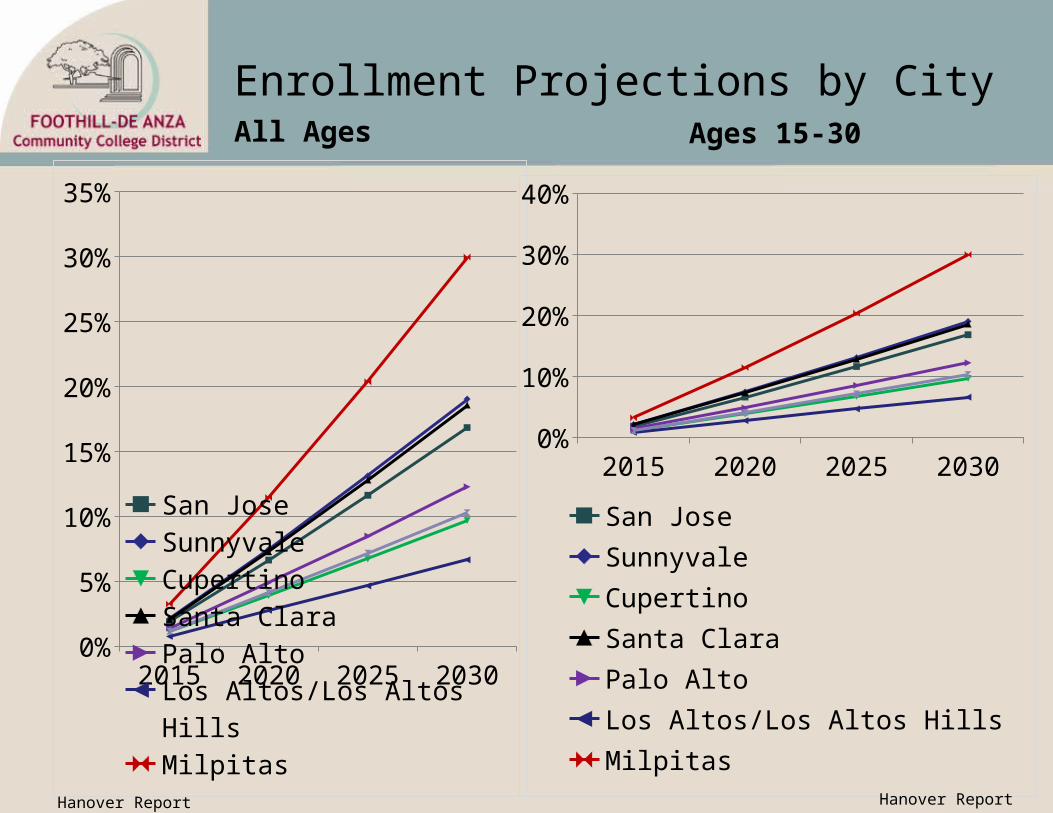
Enrollment Projections by CityAll Ages
2015 2020 2025 20300%
5%
10%
15%
20%
25%
30%
35%
San Jose Sunnyvale Cupertino
Santa Clara Palo Alto Los Altos/Los Altos Hills
Milpitas All other cities
Ages 15-30
2015 2020 2025 20300%
5%
10%
15%
20%
25%
30%
35%
San Jose Sunnyvale Cupertino
Santa Clara Palo Alto Los Altos/Los Altos Hills
Milpitas All other cities
2015 2020 2025 2030
San Jose 15,938 16,683 17,464 18,281
Sunnyvale 3,067 3,228 3,398 3,576
Cupertino 2,256 2,318 2,381 2,447
Santa Clara 1,994 2,096 2,204 2,317
Palo Alto 2,031 2,101 2,173 2,249
Los Altos/Los Altos Hills 802 818 833 849
Milpitas 892 963 1,040 1,123
All other cities 11,910 12,259 12,617 12,985
2015 2020 2025 2030
San Jose 12,954 13,560 14,194 14,858
Sunnyvale 2,216 2,332 2,454 2,583
Cupertino 1,648 1,693 1,740 1,788
Santa Clara 1,576 1,657 1,742 1,831
Palo Alto 1,294 1,338 1,385 1,432
Los Altos/Los Altos Hills 473 482 491 500
Milpitas 765 826 892 963
All other cities 9,128 9,396 9,671 9,955
Hanover ReportHanover Report
Enrollment Projections by CityAll Ages
2015 2020 2025 20300%
5%
10%
15%
20%
25%
30%
35%
San JoseSunnyvaleCupertinoSanta ClaraPalo AltoLos Altos/Los Altos HillsMilpitasAll other cities
Ages 15-30
2015 2020 2025 20300%5%
10%15%20%25%30%35%
San JoseSunnyvaleCupertinoSanta ClaraPalo AltoLos Altos/Los Altos HillsMilpitasAll other cities
Hanover Report Hanover Report
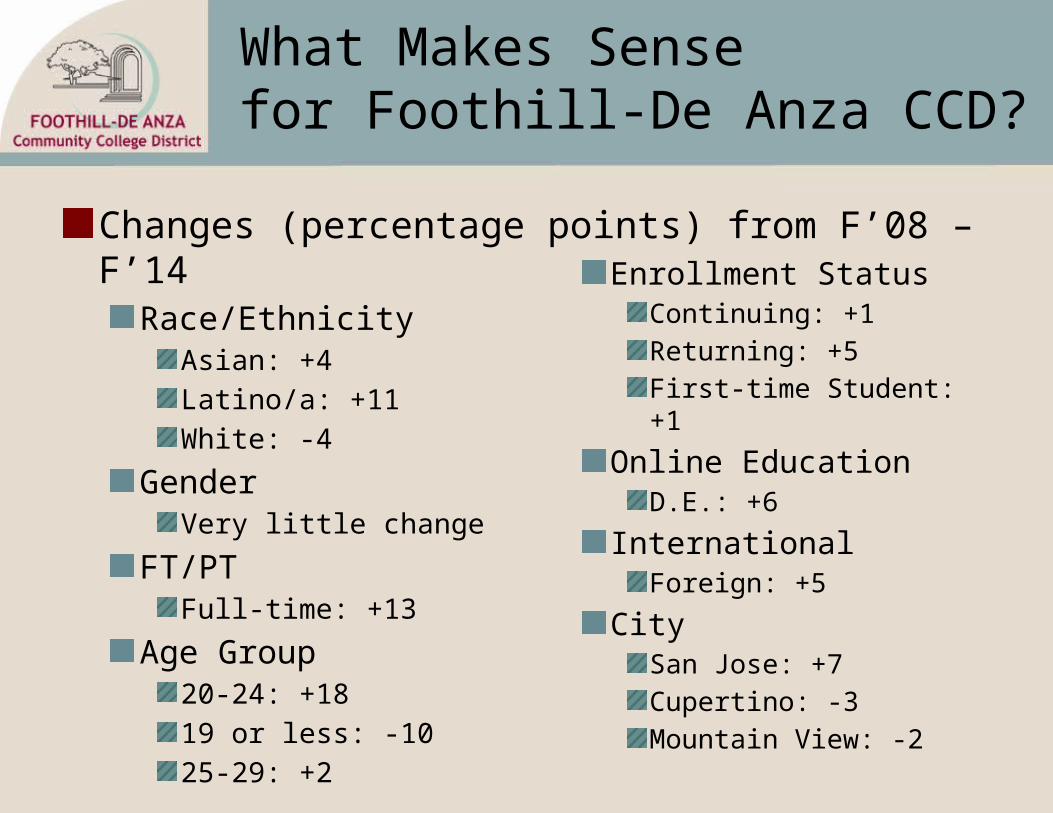
What Makes Sensefor Foothill-De Anza CCD?
Changes (percentage points) from F’08 – F’14Race/Ethnicity
Asian: +4
Latino/a: +11
White: -4
GenderVery little change
FT/PTFull-time: +13
Age Group20-24: +18
19 or less: -10
25-29: +2
Enrollment StatusContinuing: +1
Returning: +5
First-time Student: +1
Online EducationD.E.: +6
InternationalForeign: +5
CitySan Jose: +7
Cupertino: -3
Mountain View: -2
Outline
Part I: The data – EnrollmentWhat are the trends?
What is (should be) our current reality?
Part II: How to think about dataPerspective on improvement strategies
What’s the problem with outcome rates?

YOU’VE SEEN THE DATA: WHAT’S THE NEXT STEP?
HOW DO WE THINK ABOUT THE DATA?
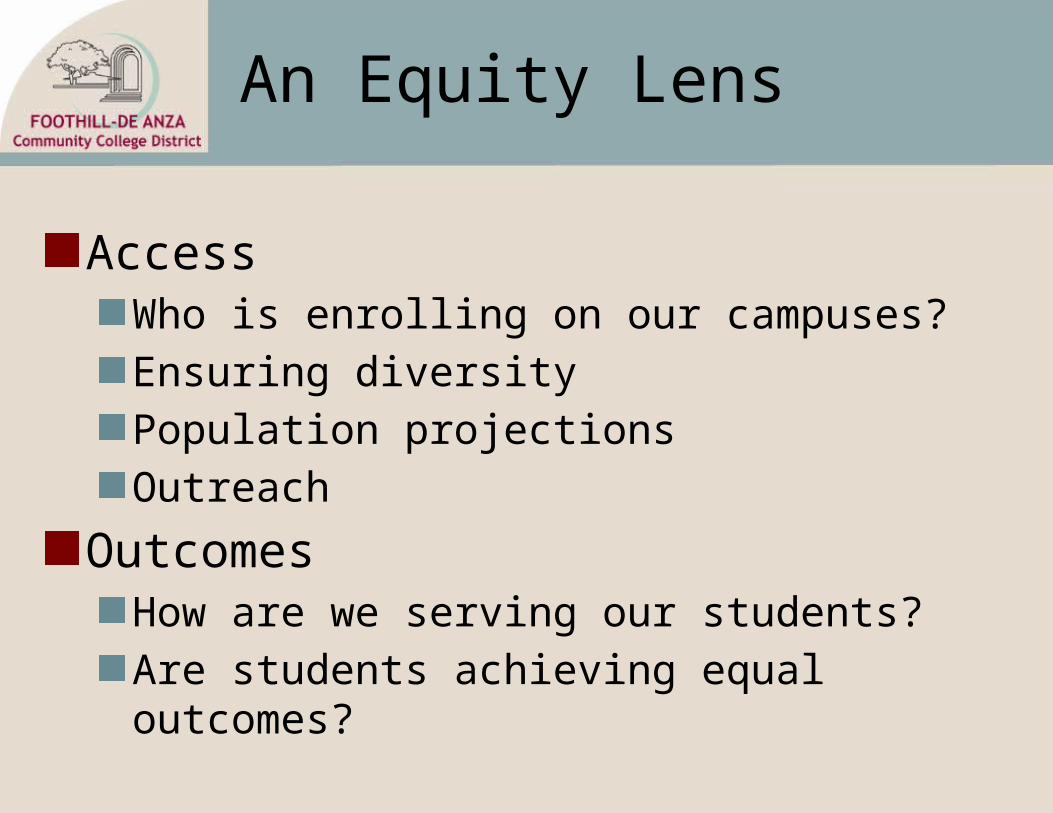
An Equity Lens
AccessWho is enrolling on our campuses?
Ensuring diversity
Population projections
Outreach
OutcomesHow are we serving our students?
Are students achieving equal outcomes?
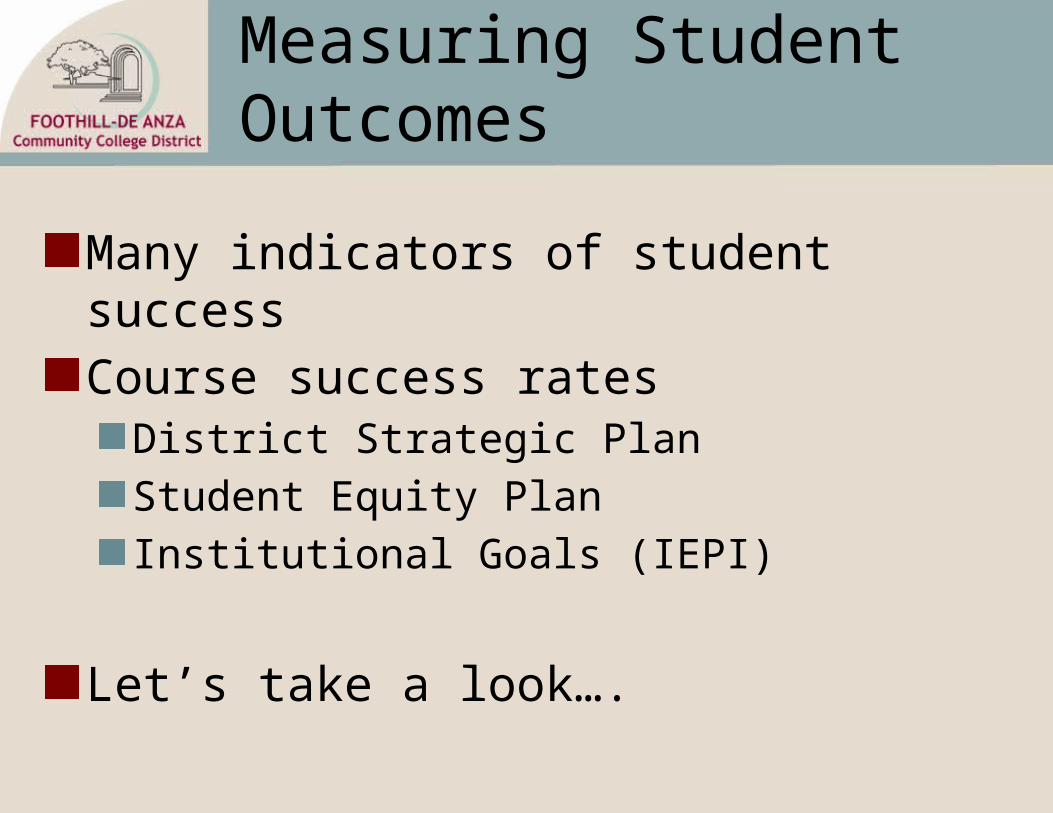
Measuring Student Outcomes
Many indicators of student success
Course success rates District Strategic Plan
Student Equity Plan
Institutional Goals (IEPI)
Let’s take a look….
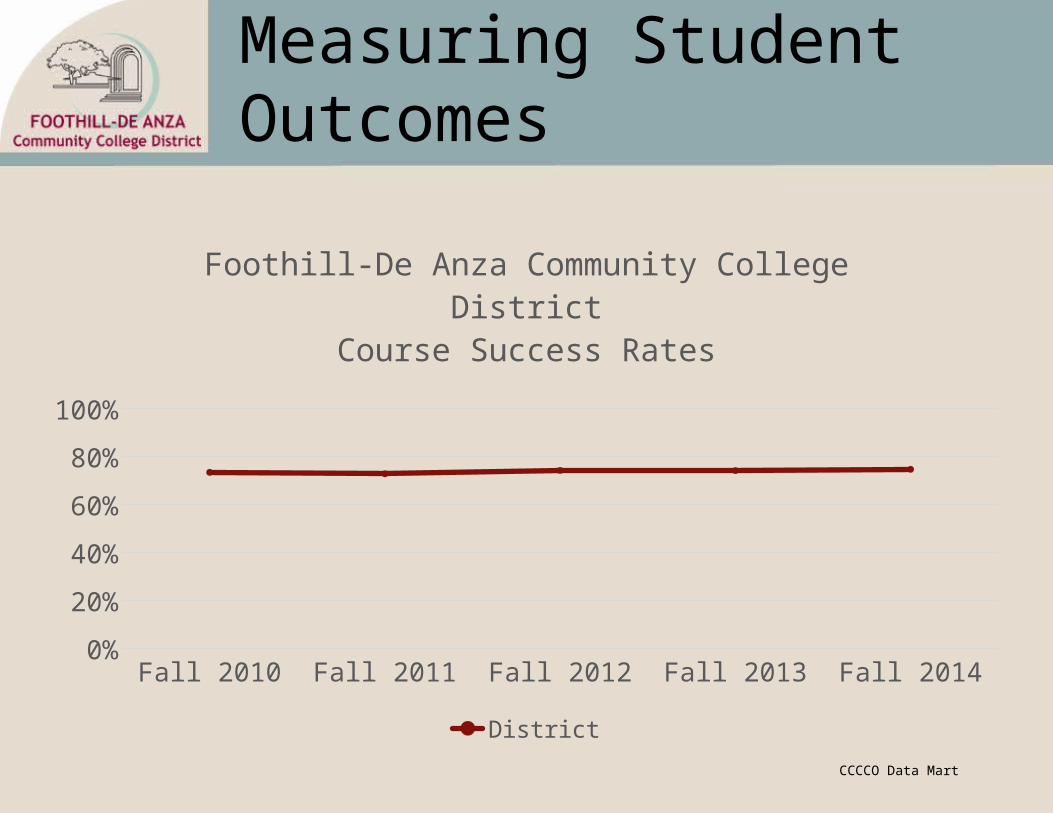
Measuring Student Outcomes
Fall 2010 Fall 2011 Fall 2012 Fall 2013 Fall 20140%
10%20%30%40%50%60%70%80%90%
100%
Foothill-De Anza Community College DistrictCourse Success Rates
District
CCCCO Data Mart
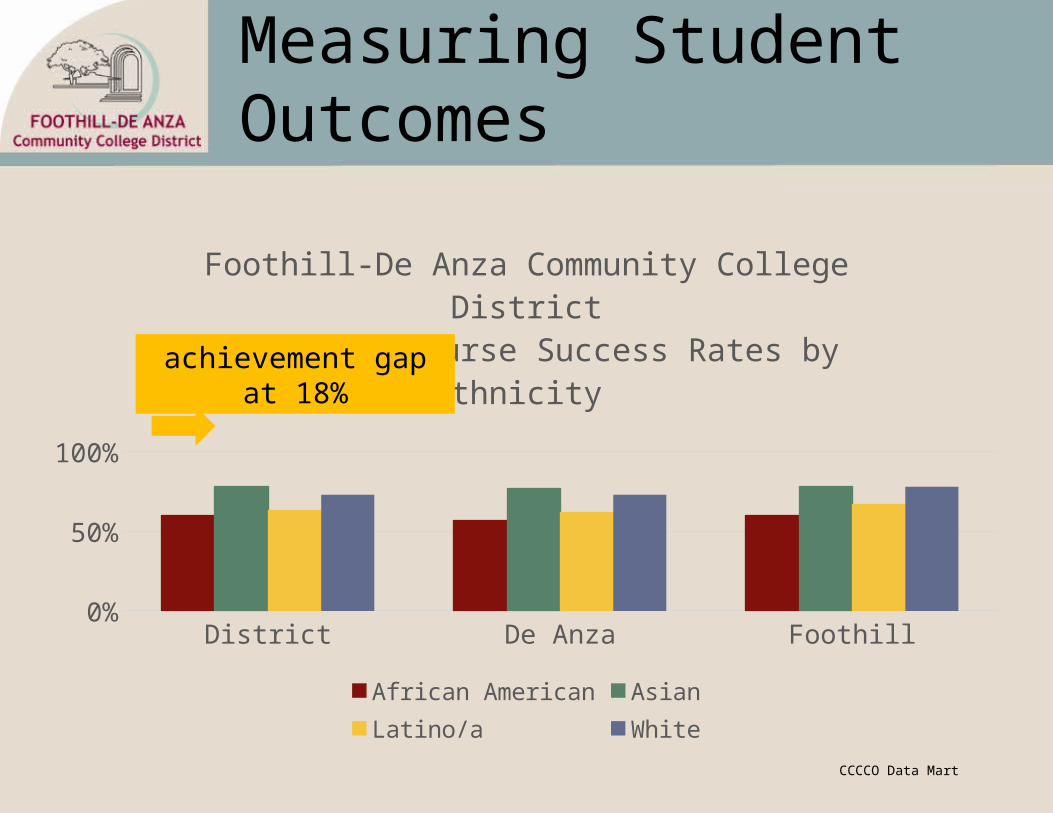
Measuring Student Outcomes
District De Anza Foothill0%
10%20%30%40%50%60%70%80%90%
100%
Foothill-De Anza Community College DistrictFall 2014 Course Success Rates by Ethnicity
African American Asian Latino/a White
achievement gap at 18%
CCCCO Data Mart
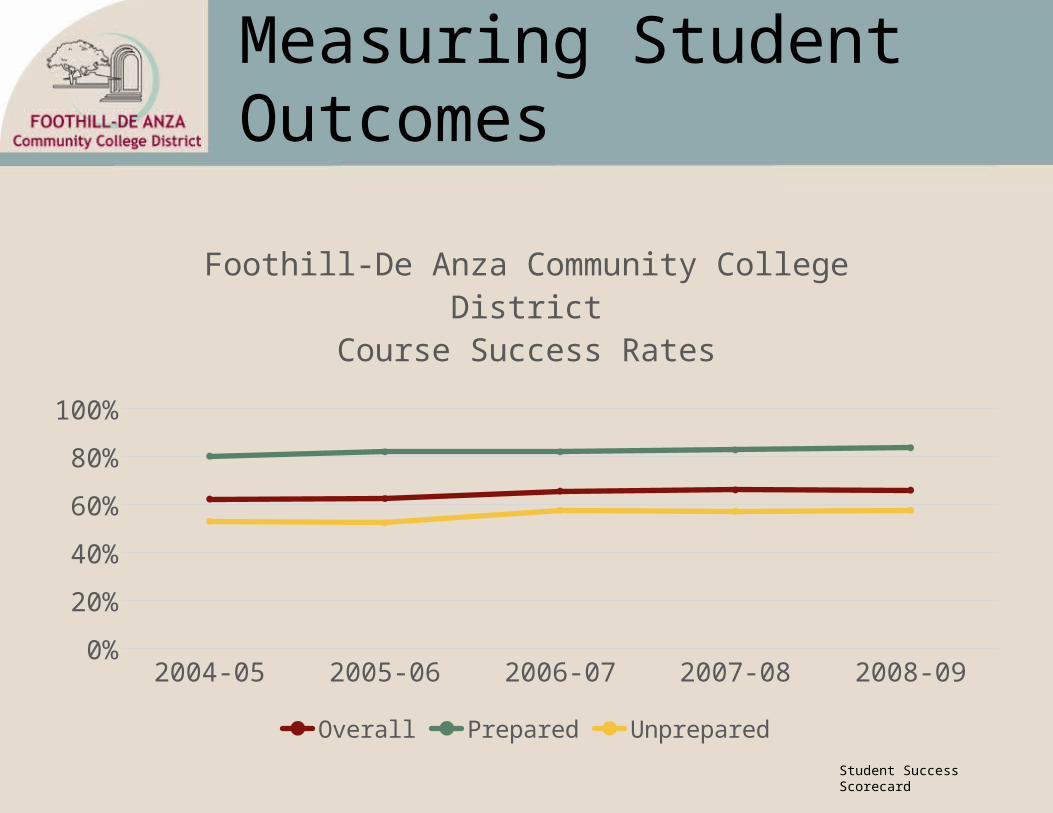
Measuring Student Outcomes
2004-05 2005-06 2006-07 2007-08 2008-090%
10%20%30%40%50%60%70%80%90%
100%
Foothill-De Anza Community College DistrictCourse Success Rates
Overall Prepared Unprepared
Student Success Scorecard
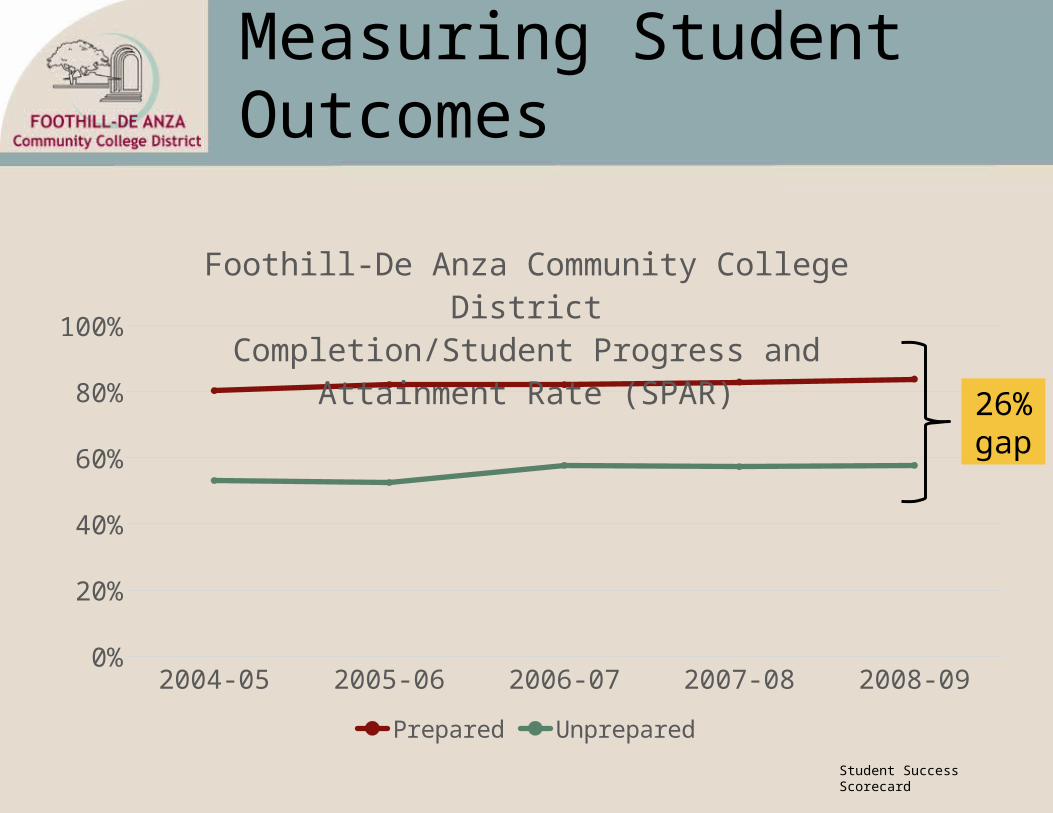
2004-05 2005-06 2006-07 2007-08 2008-090%
10%20%30%40%50%60%70%80%90%
100%
Foothill-De Anza Community College DistrictCompletion/Student Progress and Attainment Rate (SPAR)
Prepared Unprepared
Measuring Student Outcomes
26% gap
Student Success Scorecard
HOW DO WE IMPROVE THE TREND?HOW DO WE MAKE DATA
ACTIONABLE?
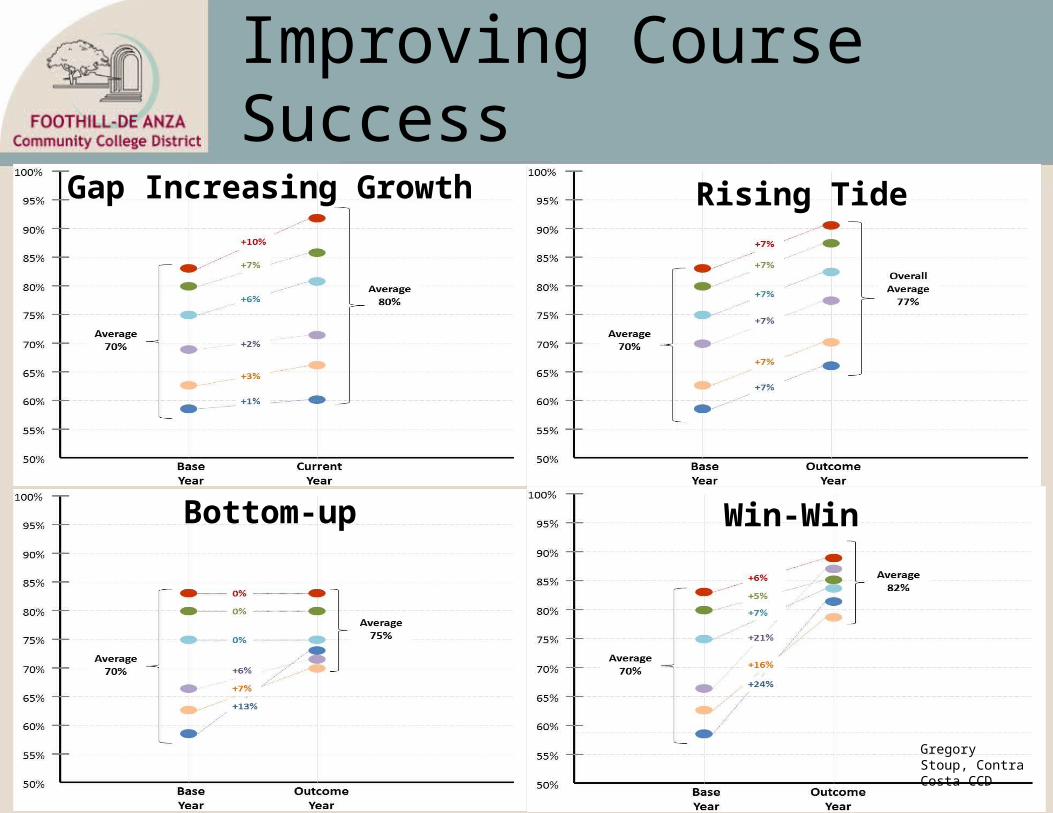
Improving Course Success
Gap Increasing Growth Rising Tide
Bottom-up Win-Win
Gregory Stoup, Contra Costa CCD
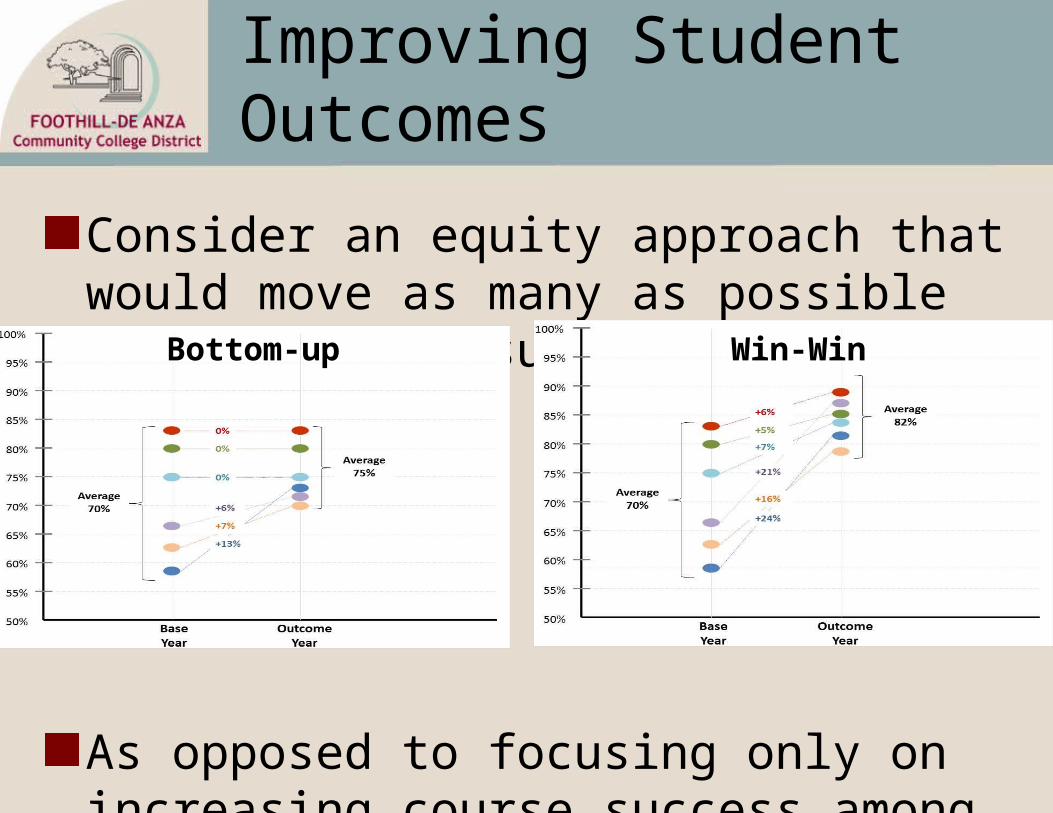
Improving Student Outcomes
Consider an equity approach that would move as many as possible toward course success
As opposed to focusing only on increasing course success among specific groups
Win-WinBottom-up

STUDENT OUTCOMES - RATES
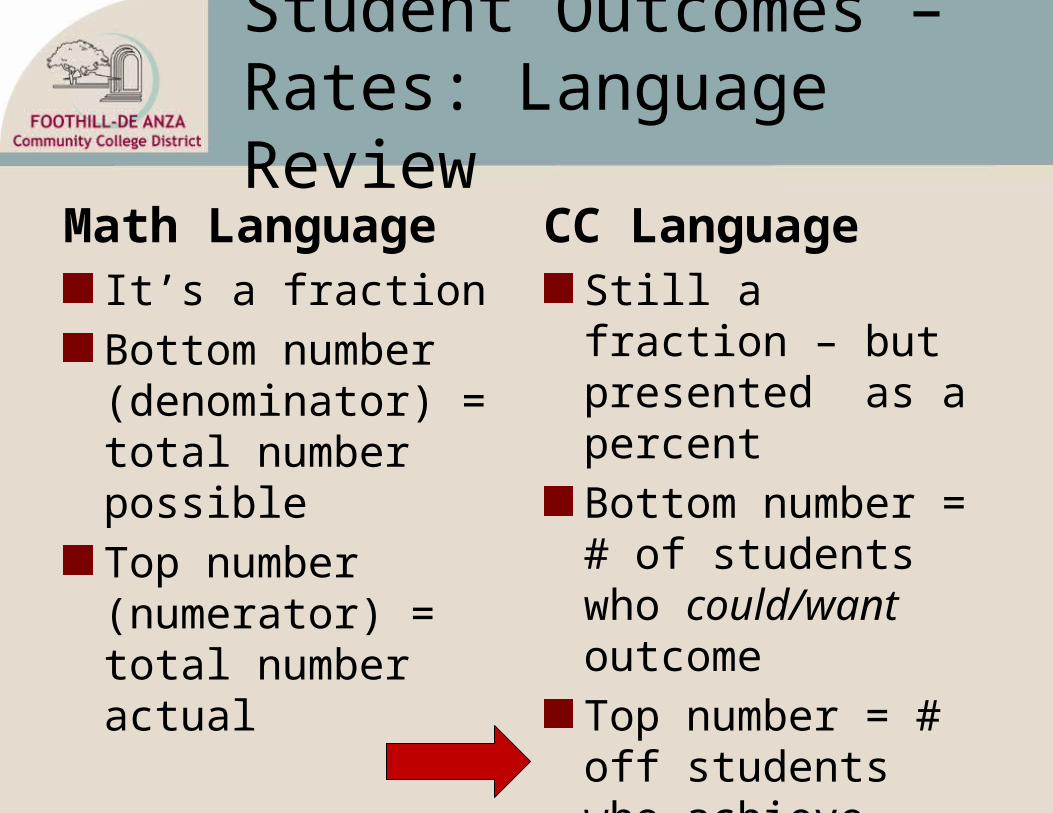
Student Outcomes – Rates: Language Review
Math LanguageIt’s a fraction
Bottom number (denominator) = total number possible
Top number (numerator) = total number actual
CC LanguageStill a fraction – but presented as a percent
Bottom number = # of students who could/want outcome
Top number = # off students who achieve outcome
Percent of students who achieve outcome.
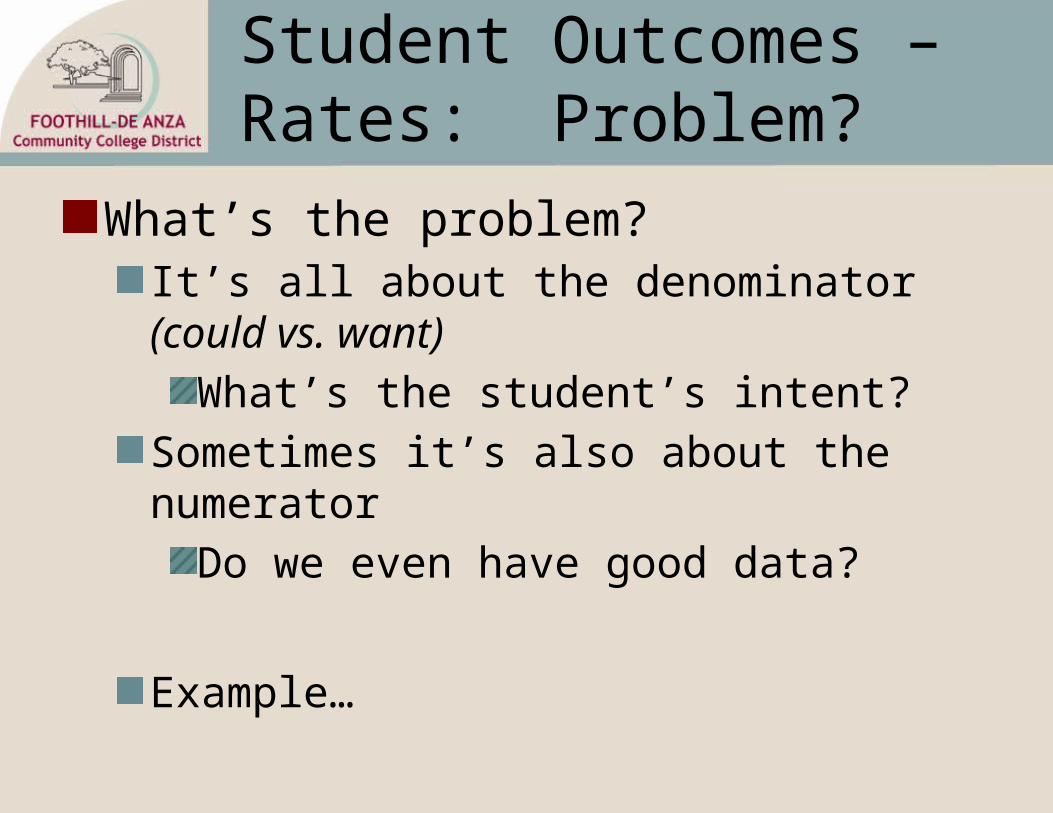
Student Outcomes – Rates: Problem?
What’s the problem?It’s all about the denominator (could vs. want)
What’s the student’s intent?
Sometimes it’s also about the numerator
Do we even have good data?
Example…
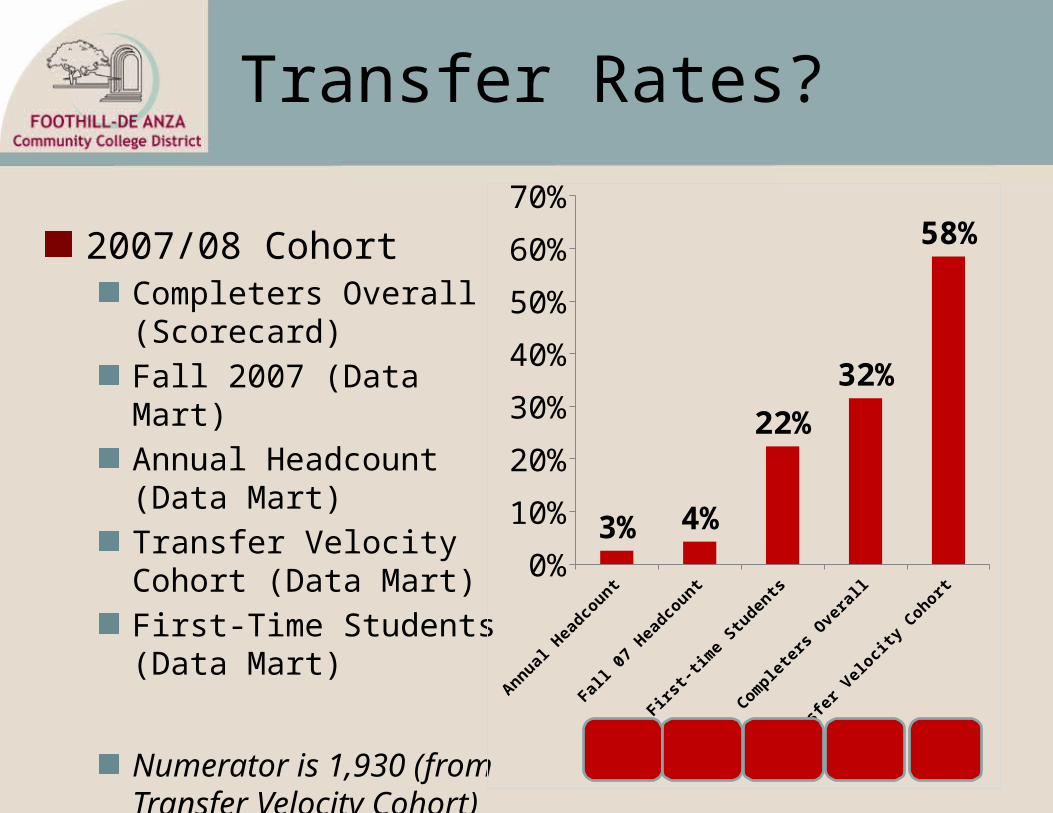
Transfer Rates?
2007/08 CohortCompleters Overall (Scorecard)
Fall 2007 (Data Mart)
Annual Headcount (Data Mart)
Transfer Velocity Cohort (Data Mart)
First-Time Students (Data Mart)
Numerator is 1,930 (from Transfer Velocity Cohort)
Annual Headcount
Fall 07 Headcount
First-time Students
Completers Overall
Transfer Velocity Cohort
0%
10%
20%
30%
40%
50%
60%
70%
3% 4%
22%
32%
58%
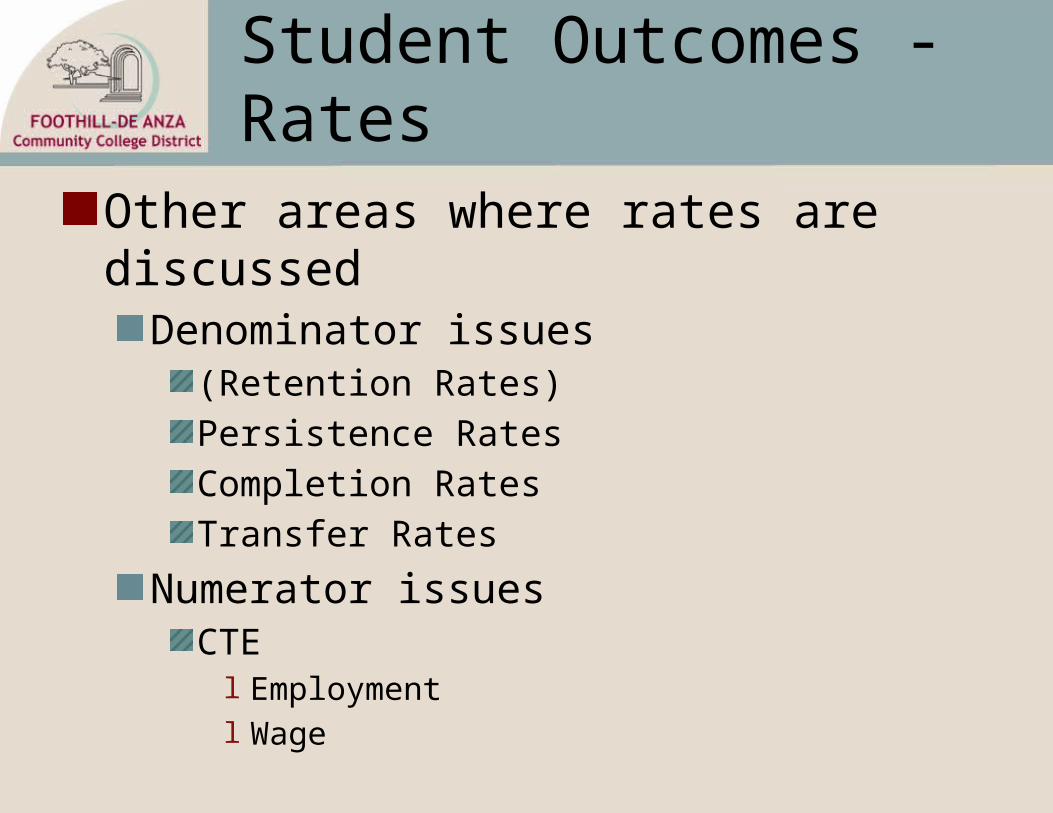
Student Outcomes - Rates
Other areas where rates are discussedDenominator issues
(Retention Rates)
Persistence Rates
Completion Rates
Transfer Rates
Numerator issuesCTEl Employmentl Wage
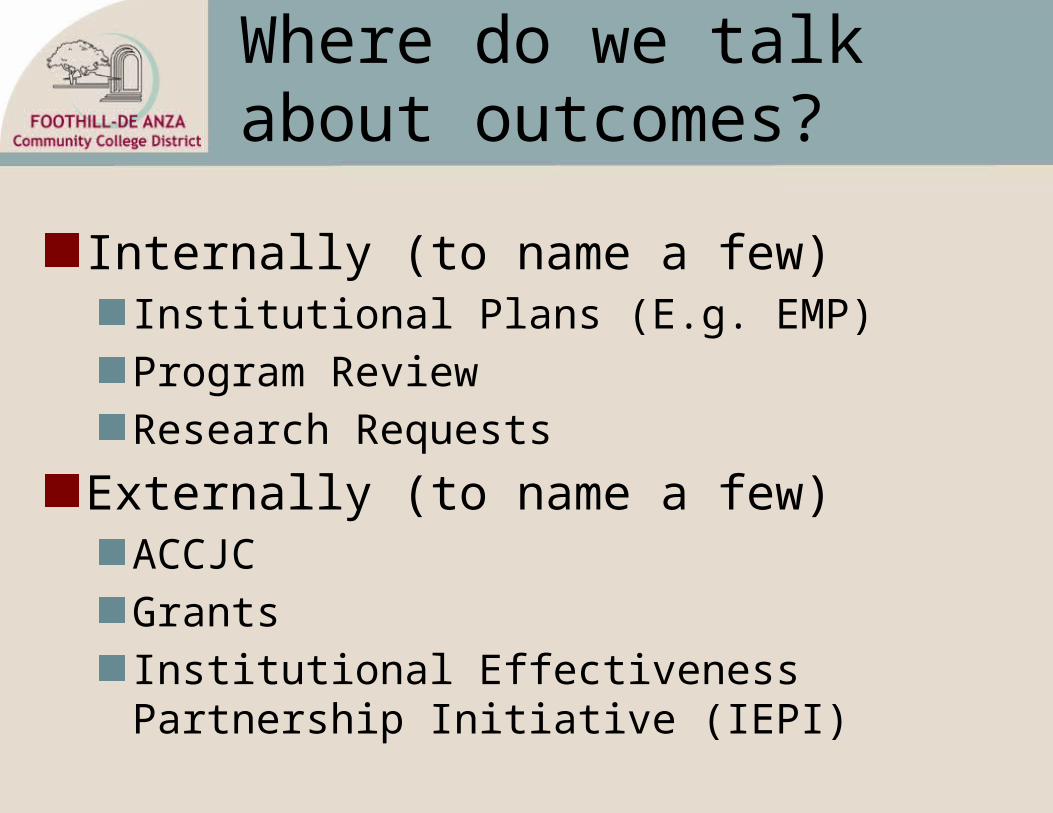
Where do we talk about outcomes?
Internally (to name a few)Institutional Plans (E.g. EMP)
Program Review
Research Requests
Externally (to name a few)ACCJC
Grants
Institutional Effectiveness Partnership Initiative (IEPI)

Questions?
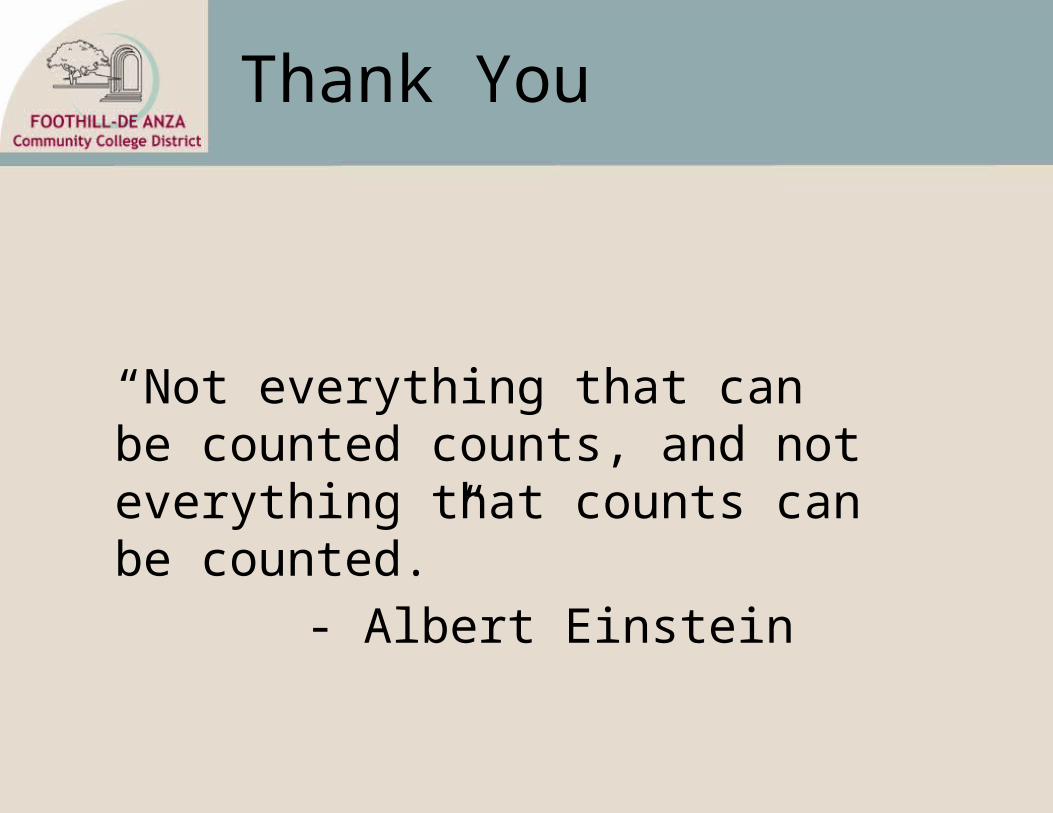
Thank You
“Not everything that can be counted counts, and not everything that counts can be counted.”
- Albert Einstein