Embed Size (px)
Citation preview
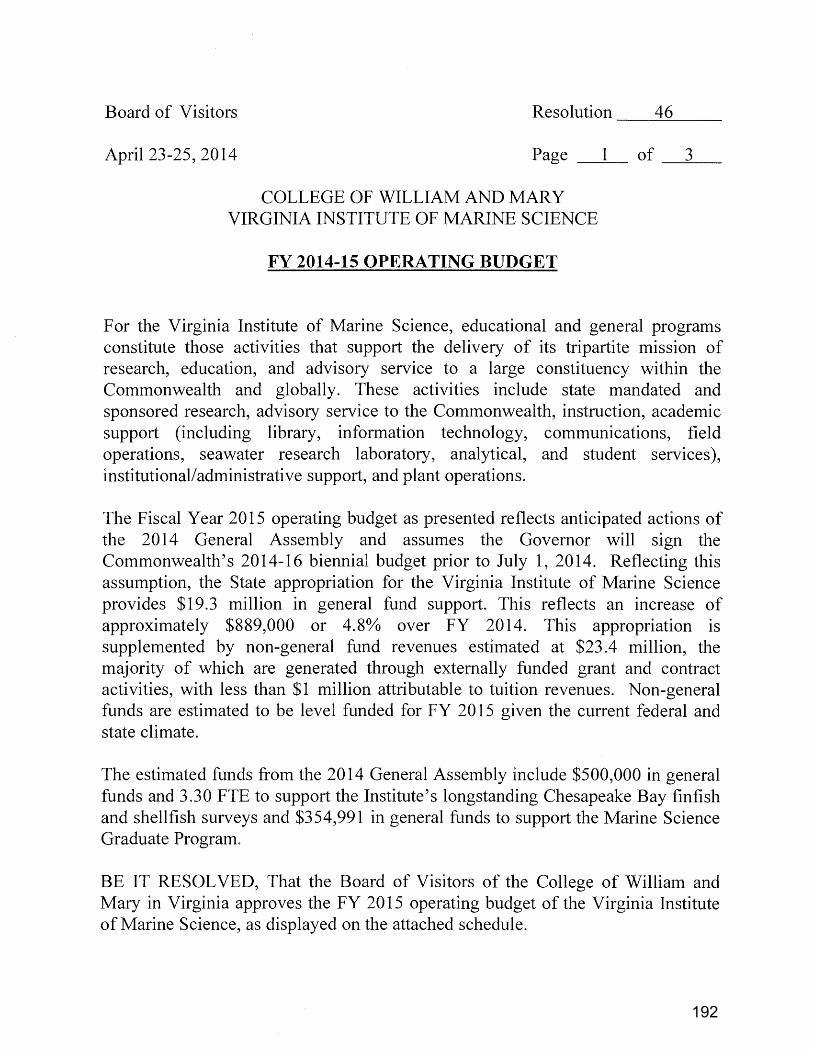
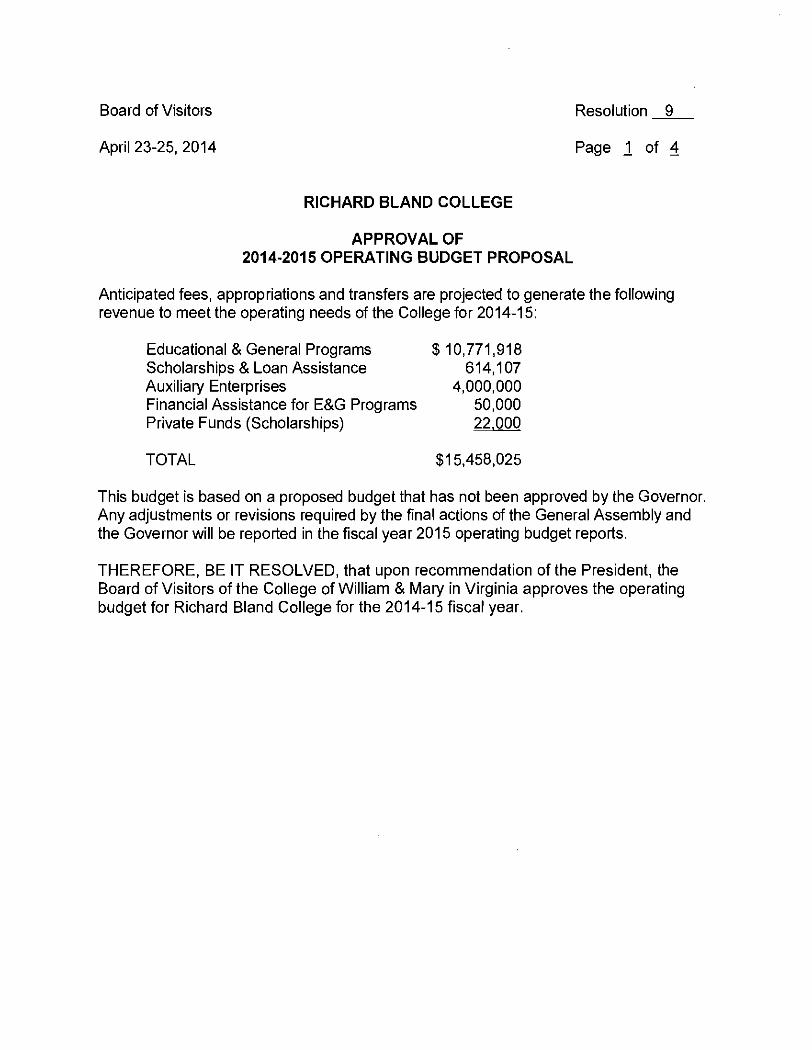
BOARD OF VISITORS OF THE COLLEGE
OF WILLIAM AND MARY IN VIRGINIA
COMMITTEE MEETINGS Board Rooms - Blow Memorial Hall
April 23 - 25, 2014


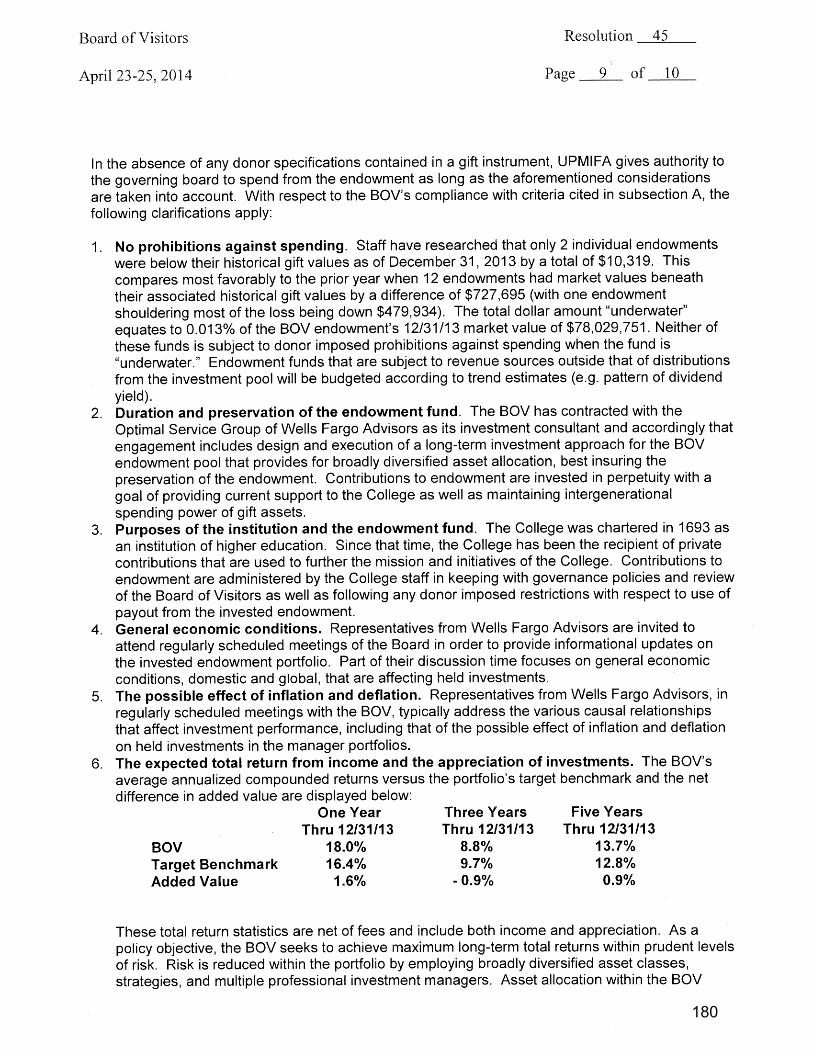
5
Rich
ard
Blan
d Co
llege
Site
Con
cept
Pla
n
0 20
0
400
Fee
t
2
2
2 2
2
2
3
3
4
4
5 6 7 8 9 10
11 12 13 14 15 16 17
6 7
8 9
10
1112
13
14
15
16
17
17
17
17
17
A
B
B
C
C
D
D
E
E
F
F
G H
H
I
I
J
J
18G
atew
ay S
igna
ge
19Ve
rtic
al E
lem
ent/
Scul
ptur
e
20Tr
ail
20
20
18
19 18
19
KW
ater
Tow
er
KM
aze
Hal
l
1819
G
2
LCe
nter
for S
tude
nt A
!airs
(CSA
)
21Sp
orts
Sto
rage
21
L
Roun
d-a-
bout
1
1
1
1
1
Park
ing
- 1,7
00 C
ars
Ove
rall
Bus S
top
Out
door
Am
phith
eate
r
New
Fie
ld H
ouse
Acad
emic
Res
ourc
e an
d In
nova
tion
Cent
erFu
ture
Aca
dem
ic
Build
ing
(Pla
ceho
lder
)
PRO
POSE
D
Agric
ultu
re B
uild
ing/
Barn
Futu
re P
addo
ck
Futu
re F
ence
d Pa
stur
e
New
Res
iden
ce H
alls
New
Trac
k an
d Fi
eld
w/G
rand
stan
dPr
actic
e Fi
elds
Bask
etba
ll Co
urts
Volle
ybal
l Cou
rt
Rope
s/Ch
alle
nge
Cour
se
Stor
mw
ater
Man
agem
ent
EXIS
TIN
GLi
brar
y/D
inin
g/Lo
unge
- Re
nova
tion
AM
cNee
r Hal
l Sci
ence
& Te
chno
logy
Bui
ldin
g
Erns
t Hal
l
Stat
esm
an H
all -
Gym
Patr
iot/
Free
dom
Hal
l - R
esid
ence
Pede
stria
n N
ode
Hum
aniti
es/S
ocia
l Sci
ence
/Sta
! O
"ce
Bui
ldin
g
Soft
ball
Fiel
d
Tenn
is Co
urts
Bask
etba
ll Co
urt
Wet
land
W
Futu
re A
cade
mic
Expa
nsio
n
Peca
nG
rove
1
Johnson Road (State Route 608)
Cars
on D
rive
(Sta
te R
oute
677
)
Halifax Road (State Route 604)
Imag
ery
Sour
ce: E
sri,
Dig
italG
lobe
, Geo
Eye,
i-cu
bed,
USD
A, U
SGS,
AEX
, G
etm
appi
ng, A
erog
rid, I
GN
, IG
P, sw
issto
po, a
nd th
e G
IS U
ser C
omm
unity
.
Janu
ary
2014
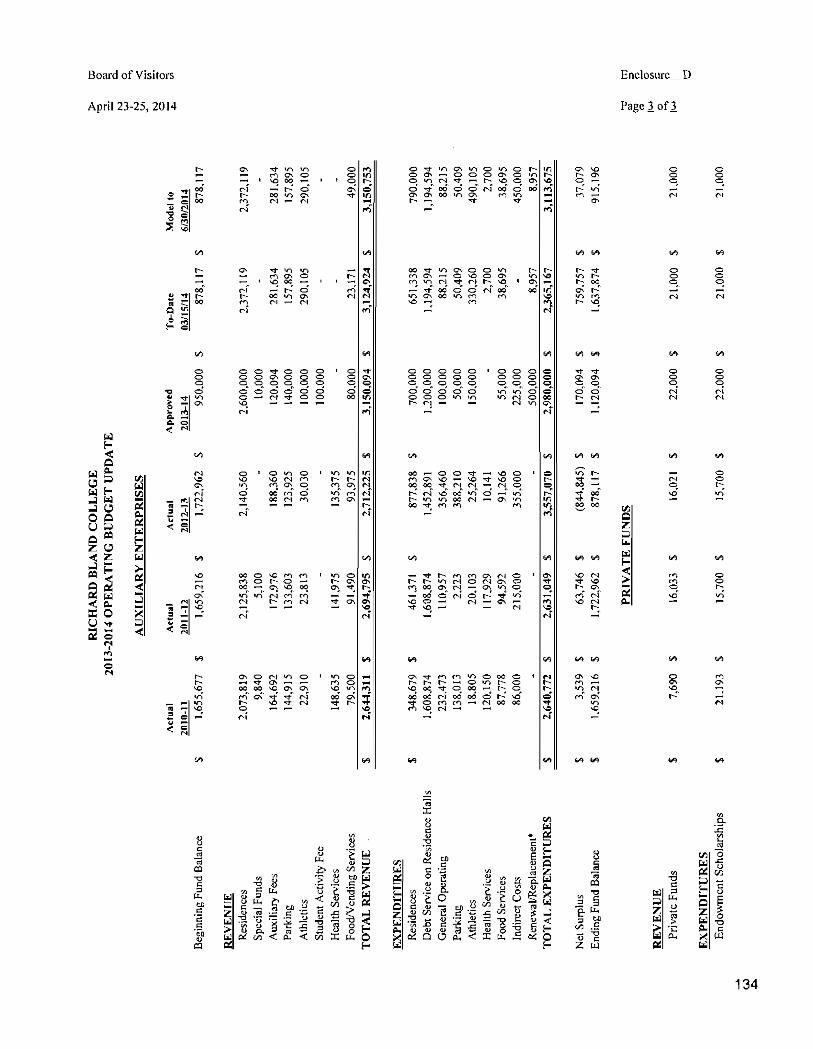
Board of Visitors April 23-25, 2014
Resolution 12 Page 3 of 3
123

137
139
140
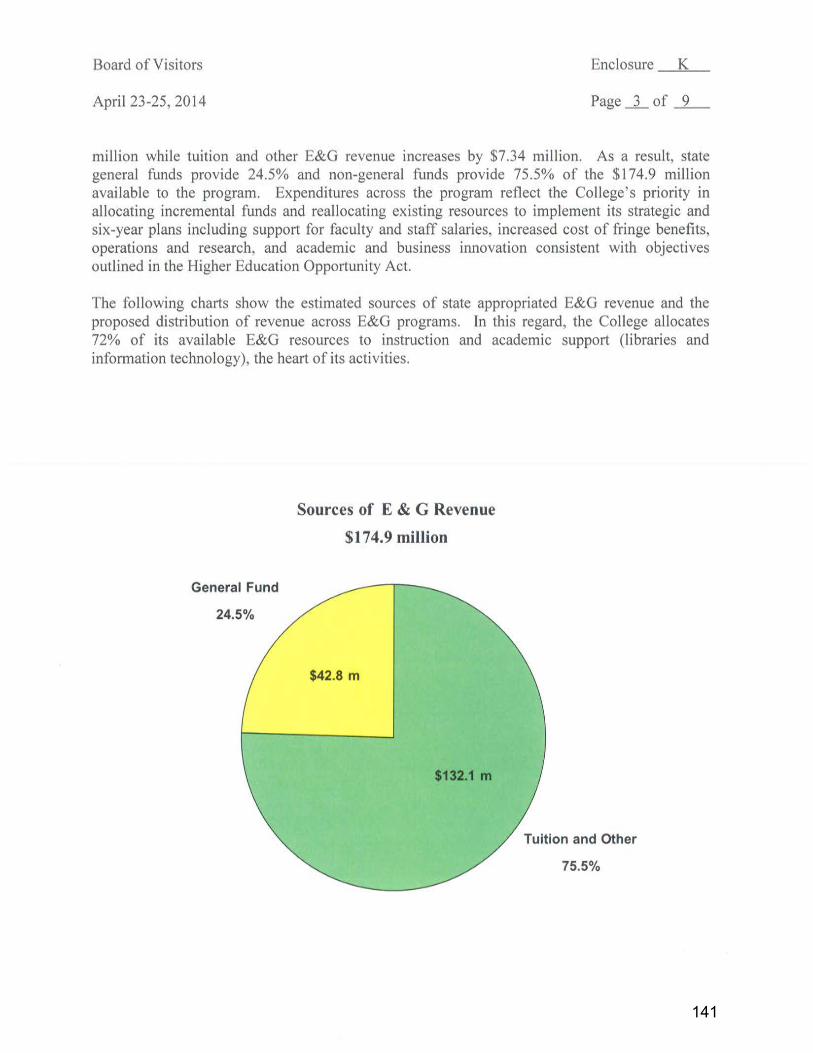
141
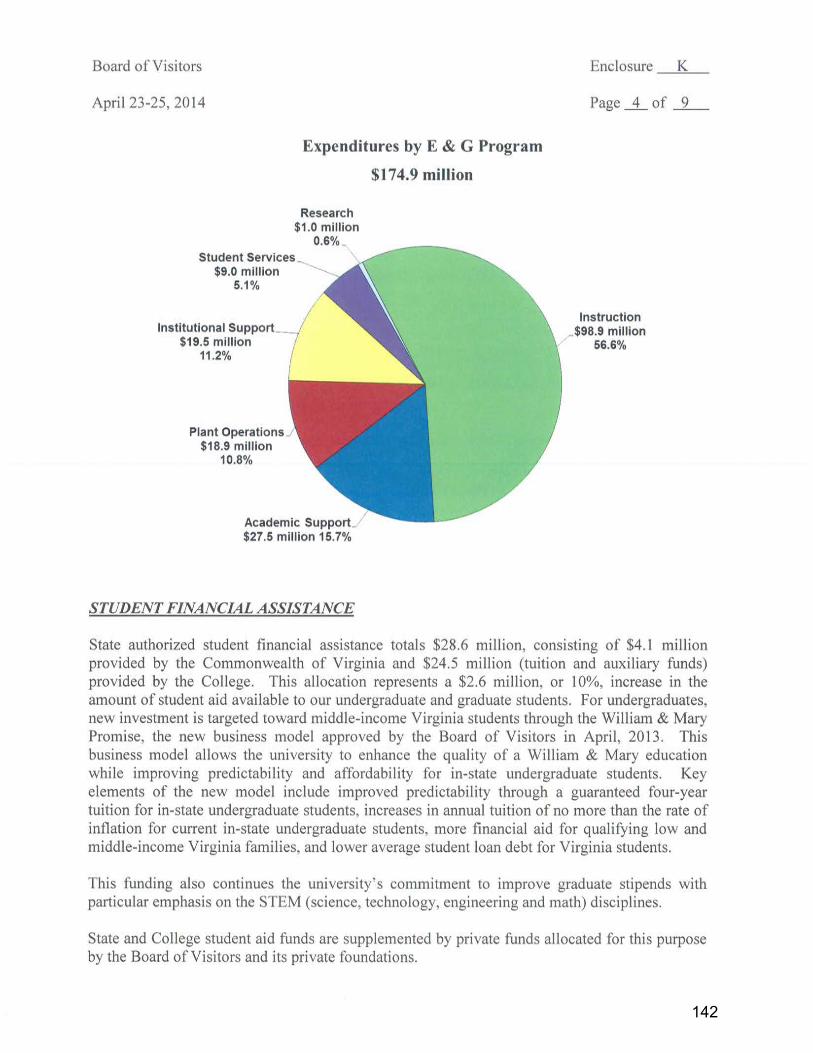
142
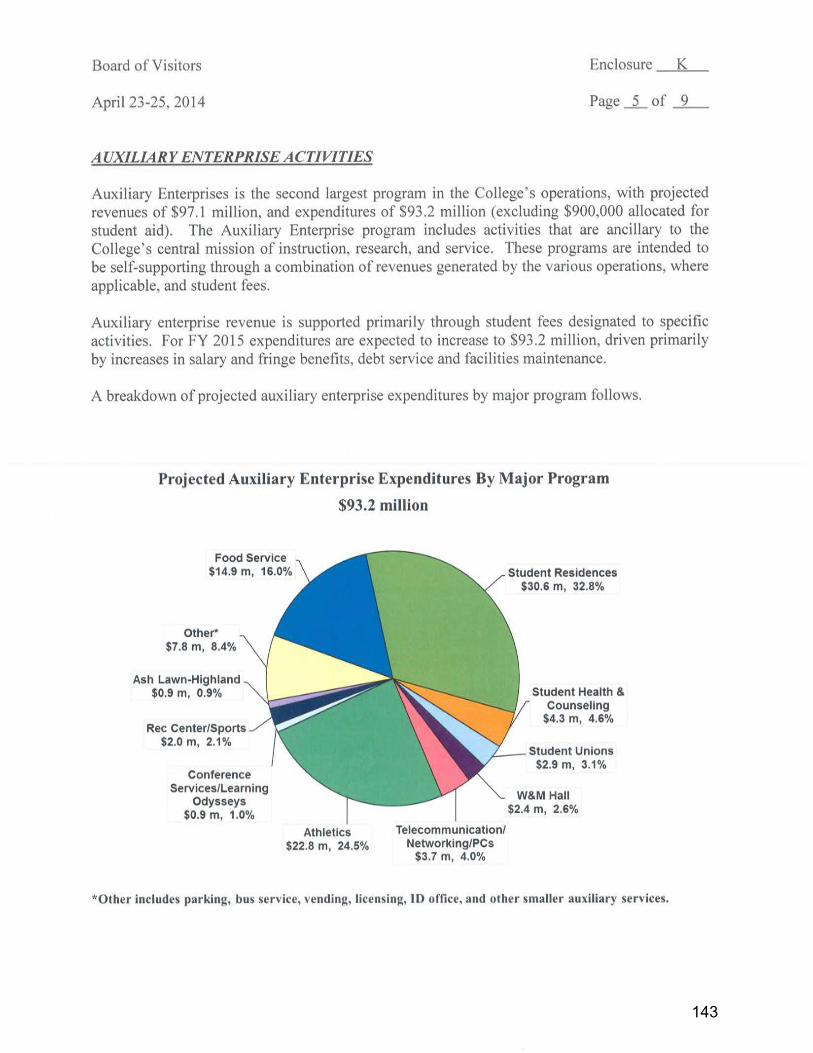
143
144
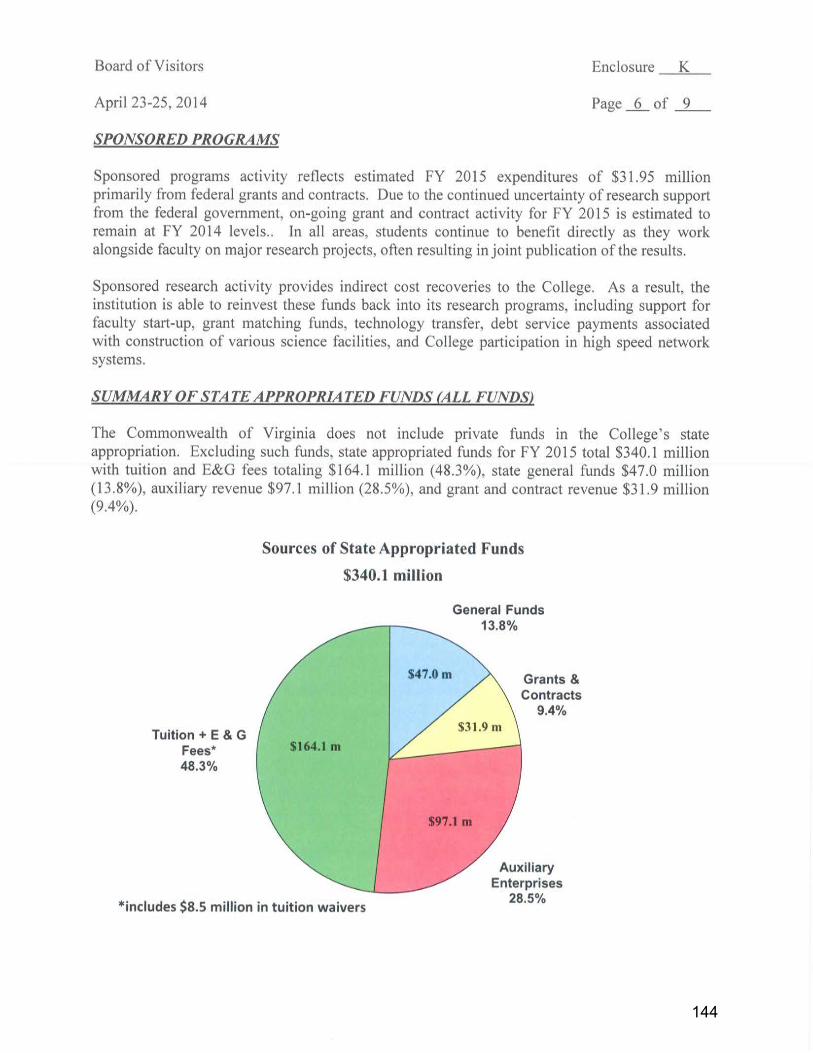
145
146
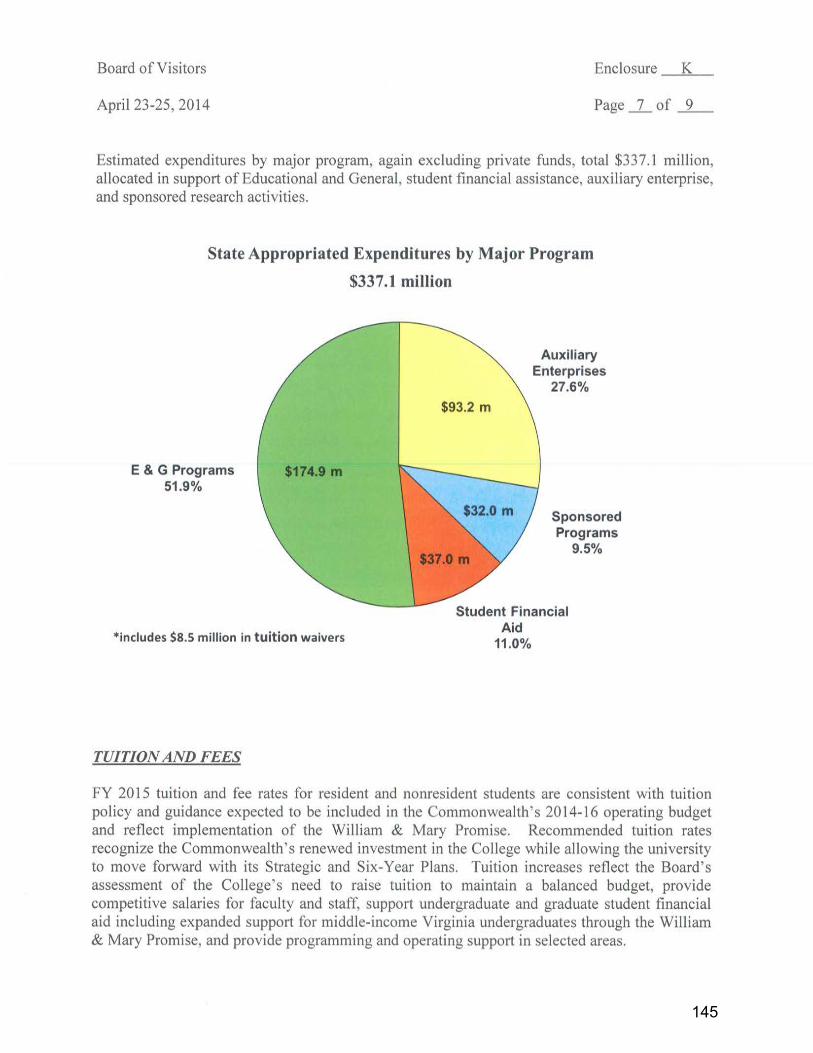
147
148
149
150
151
152
153

154
155

156
157
158
159

160
161
162
163
164
165
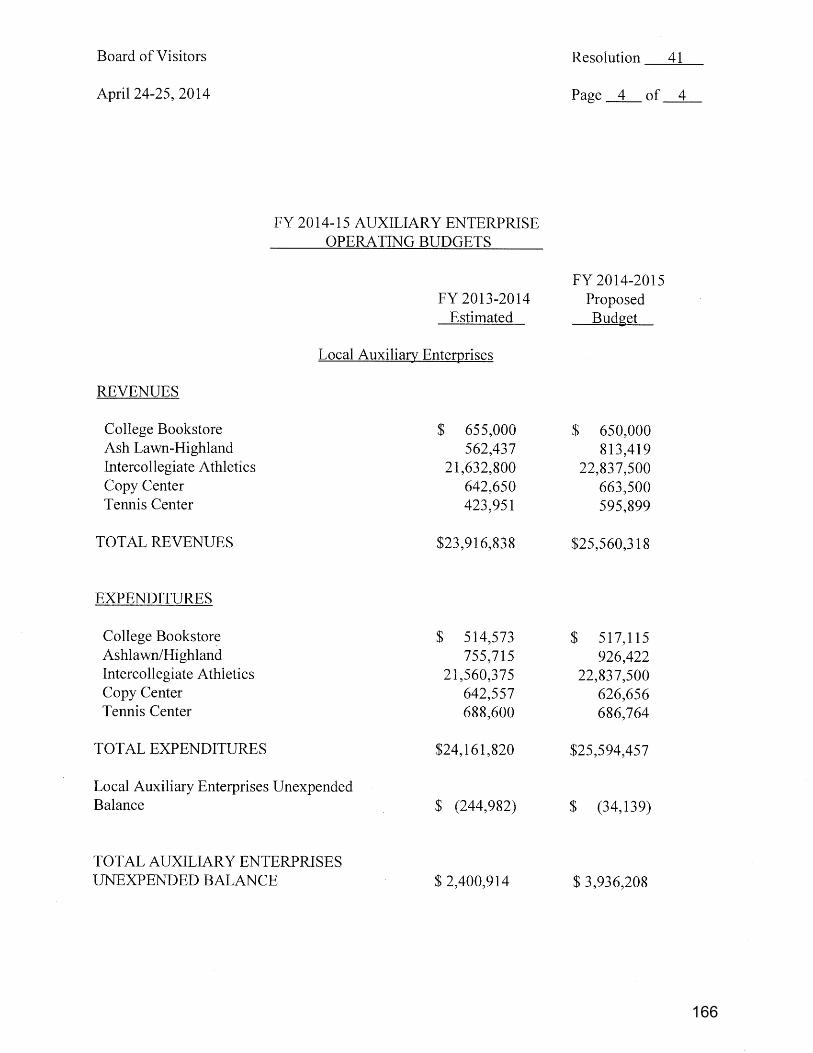
166
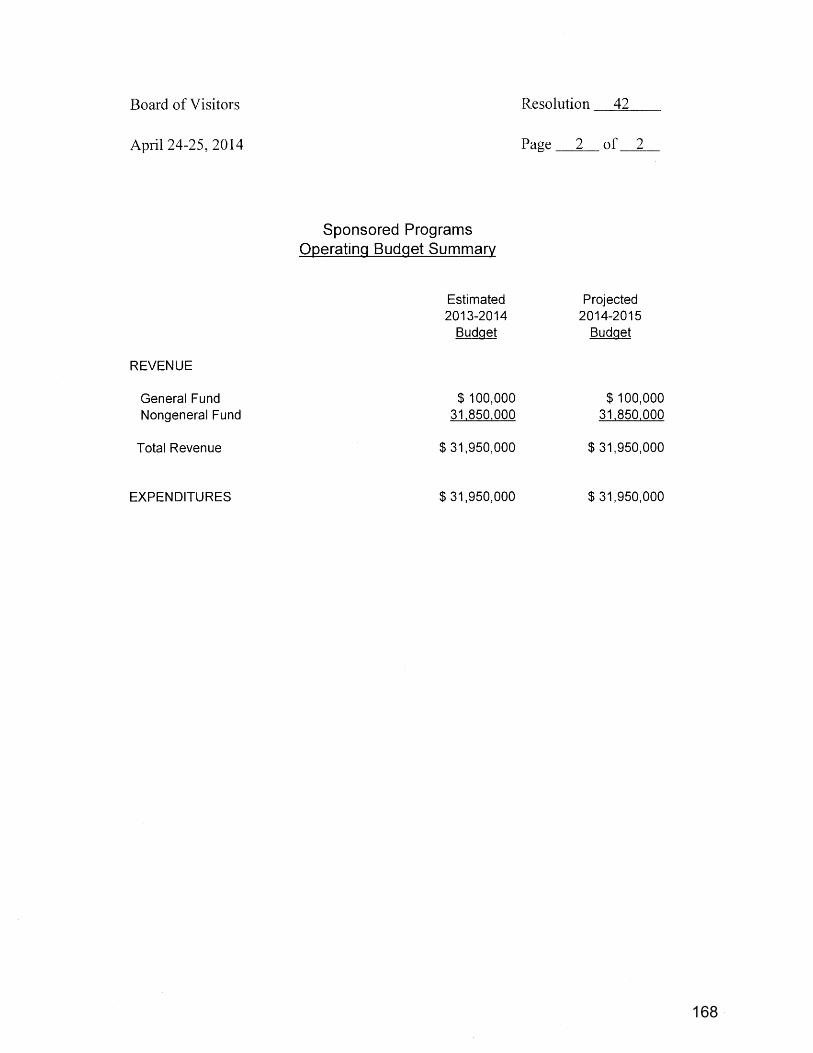
167
168
169

170
171
172
173
174

175
176
177
178
179
180
181
182
183
184
185
186
187
188
189
190
191
192
193
194
195

Early Investment Portfolio Evaluation ForPeriods Ending March 31, 2014:
Board of Visitors Endowment
Wells Fargo Advisors is the trade name under which Wells Fargo & Company provides brokerage services through two registered broker/dealers: Wells Fargo Advisors, LLC, member NYSE/SIPC, and Wells Fargo & Company Financial Network, Inc., member NASD/SIPC. Each broker/dealer is a separate non-bank affiliate of Wells Fargo & Company.
THE
OPTIMAL SERVICE GROUP
of Wells Fargo Advisors
Enclosure N
Information contained within this report is designed solely for the use by The College of William & Mary BOV Endowment, including itsOfficers, Investment Committee, and administrative staff. Distribution without the express written consent of Wells Fargo is strictly prohibited.
THE
OPTIMAL SERVICE GROUP
of Wells Fargo Advisors
Portfolio Evaluation March 31, 2014 Page 2
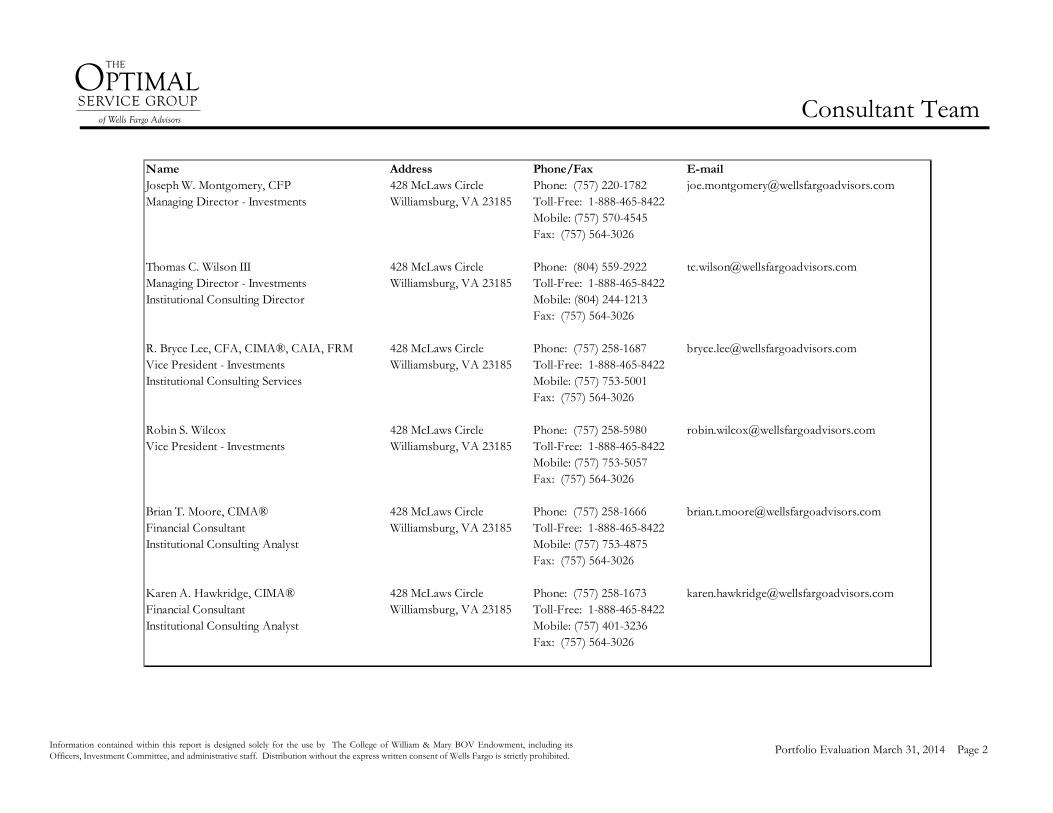
Consultant Team
Name Address Phone/Fax E-mailJoseph W. Montgomery, CFP 428 McLaws Circle Phone: (757) 220-1782 [email protected] Director - Investments Williamsburg, VA 23185 Toll-Free: 1-888-465-8422
Mobile: (757) 570-4545Fax: (757) 564-3026
Thomas C. Wilson III 428 McLaws Circle Phone: (804) 559-2922 [email protected] Director - Investments Williamsburg, VA 23185 Toll-Free: 1-888-465-8422Institutional Consulting Director Mobile: (804) 244-1213
Fax: (757) 564-3026
R. Bryce Lee, CFA, CIMA®, CAIA, FRM 428 McLaws Circle Phone: (757) 258-1687 [email protected] President - Investments Williamsburg, VA 23185 Toll-Free: 1-888-465-8422Institutional Consulting Services Mobile: (757) 753-5001
Fax: (757) 564-3026
Robin S. Wilcox 428 McLaws Circle Phone: (757) 258-5980 [email protected] President - Investments Williamsburg, VA 23185 Toll-Free: 1-888-465-8422
Mobile: (757) 753-5057Fax: (757) 564-3026
Brian T. Moore, CIMA® 428 McLaws Circle Phone: (757) 258-1666 [email protected] Consultant Williamsburg, VA 23185 Toll-Free: 1-888-465-8422Institutional Consulting Analyst Mobile: (757) 753-4875
Fax: (757) 564-3026
Karen A. Hawkridge, CIMA® 428 McLaws Circle Phone: (757) 258-1673 [email protected] Consultant Williamsburg, VA 23185 Toll-Free: 1-888-465-8422Institutional Consulting Analyst Mobile: (757) 401-3236
Fax: (757) 564-3026
Information contained within this report is designed solely for the use by The College of William & Mary BOV Endowment, including itsOfficers, Investment Committee, and administrative staff. Distribution without the express written consent of Wells Fargo is strictly prohibited.
THE
OPTIMAL SERVICE GROUP
of Wells Fargo Advisors
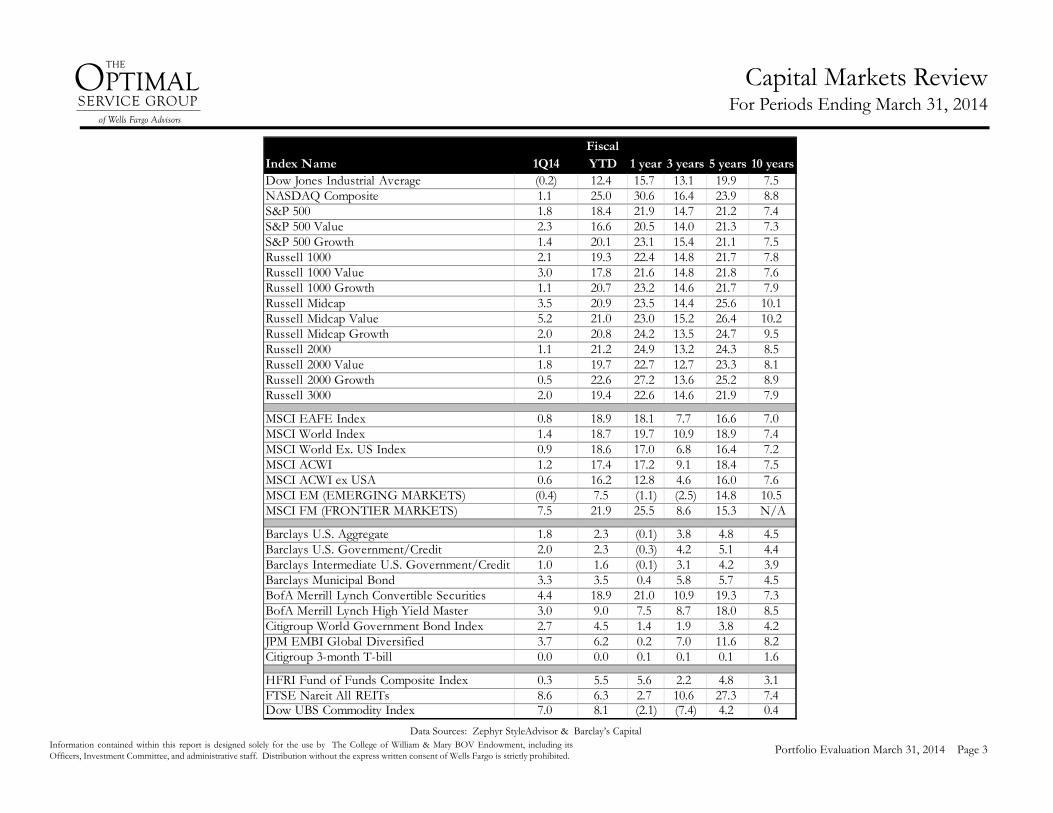
Portfolio Evaluation March 31, 2014 Page 3Data Sources: Zephyr StyleAdvisor & Barclay’s Capital
Capital Markets ReviewFor Periods Ending March 31, 2014
Index Name 1Q14Fiscal YTD 1 year 3 years 5 years 10 years
Dow Jones Industrial Average (0.2) 12.4 15.7 13.1 19.9 7.5NASDAQ Composite 1.1 25.0 30.6 16.4 23.9 8.8S&P 500 1.8 18.4 21.9 14.7 21.2 7.4S&P 500 Value 2.3 16.6 20.5 14.0 21.3 7.3S&P 500 Growth 1.4 20.1 23.1 15.4 21.1 7.5Russell 1000 2.1 19.3 22.4 14.8 21.7 7.8Russell 1000 Value 3.0 17.8 21.6 14.8 21.8 7.6Russell 1000 Growth 1.1 20.7 23.2 14.6 21.7 7.9Russell Midcap 3.5 20.9 23.5 14.4 25.6 10.1Russell Midcap Value 5.2 21.0 23.0 15.2 26.4 10.2Russell Midcap Growth 2.0 20.8 24.2 13.5 24.7 9.5Russell 2000 1.1 21.2 24.9 13.2 24.3 8.5Russell 2000 Value 1.8 19.7 22.7 12.7 23.3 8.1Russell 2000 Growth 0.5 22.6 27.2 13.6 25.2 8.9Russell 3000 2.0 19.4 22.6 14.6 21.9 7.9
MSCI EAFE Index 0.8 18.9 18.1 7.7 16.6 7.0MSCI World Index 1.4 18.7 19.7 10.9 18.9 7.4MSCI World Ex. US Index 0.9 18.6 17.0 6.8 16.4 7.2MSCI ACWI 1.2 17.4 17.2 9.1 18.4 7.5MSCI ACWI ex USA 0.6 16.2 12.8 4.6 16.0 7.6MSCI EM (EMERGING MARKETS) (0.4) 7.5 (1.1) (2.5) 14.8 10.5MSCI FM (FRONTIER MARKETS) 7.5 21.9 25.5 8.6 15.3 N/A
Barclays U.S. Aggregate 1.8 2.3 (0.1) 3.8 4.8 4.5Barclays U.S. Government/Credit 2.0 2.3 (0.3) 4.2 5.1 4.4Barclays Intermediate U.S. Government/Credit 1.0 1.6 (0.1) 3.1 4.2 3.9Barclays Municipal Bond 3.3 3.5 0.4 5.8 5.7 4.5BofA Merrill Lynch Convertible Securities 4.4 18.9 21.0 10.9 19.3 7.3BofA Merrill Lynch High Yield Master 3.0 9.0 7.5 8.7 18.0 8.5Citigroup World Government Bond Index 2.7 4.5 1.4 1.9 3.8 4.2JPM EMBI Global Diversified 3.7 6.2 0.2 7.0 11.6 8.2Citigroup 3-month T-bill 0.0 0.0 0.1 0.1 0.1 1.6
HFRI Fund of Funds Composite Index 0.3 5.5 5.6 2.2 4.8 3.1FTSE Nareit All REITs 8.6 6.3 2.7 10.6 27.3 7.4Dow UBS Commodity Index 7.0 8.1 (2.1) (7.4) 4.2 0.4

Information contained within this report is designed solely for the use by The College of William & Mary BOV Endowment, including itsOfficers, Investment Committee, and administrative staff. Distribution without the express written consent of Wells Fargo is strictly prohibited.
THE
OPTIMAL SERVICE GROUP
of Wells Fargo Advisors
Portfolio Evaluation March 31, 2014 Page 4
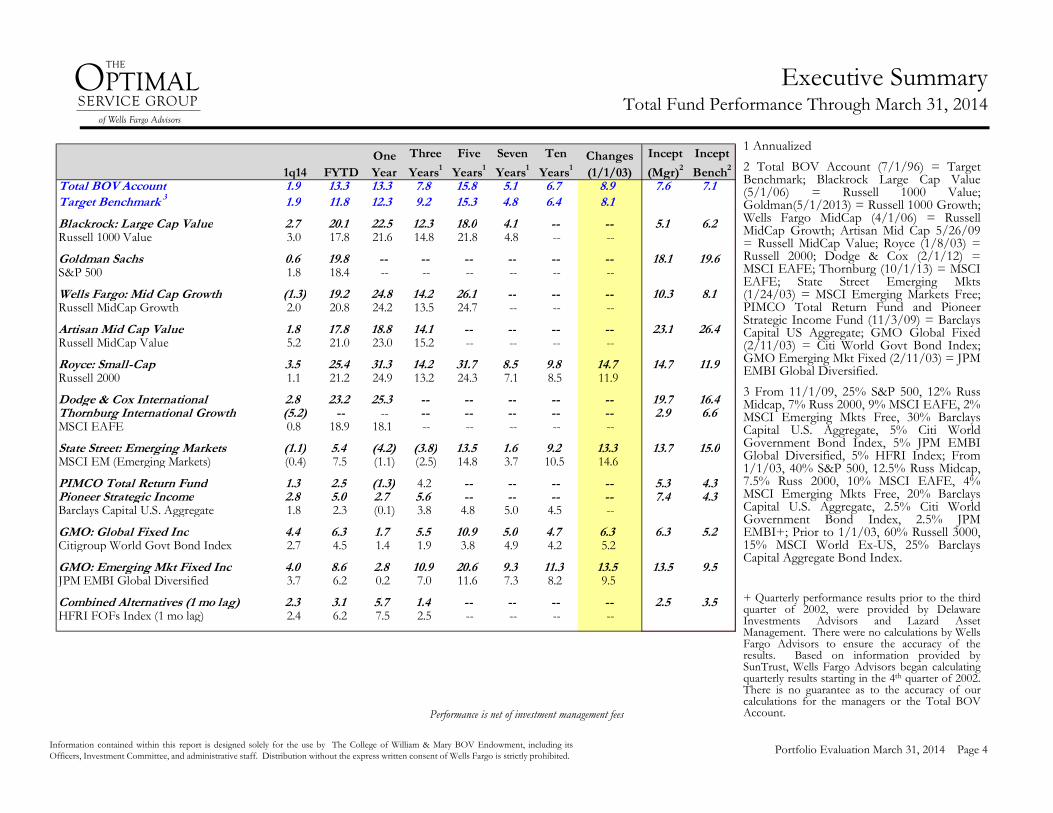
Executive SummaryTotal Fund Performance Through March 31, 2014
1 Annualized2 Total BOV Account (7/1/96) = TargetBenchmark; Blackrock Large Cap Value(5/1/06) = Russell 1000 Value;Goldman(5/1/2013) = Russell 1000 Growth;Wells Fargo MidCap (4/1/06) = RussellMidCap Growth; Artisan Mid Cap 5/26/09= Russell MidCap Value; Royce (1/8/03) =Russell 2000; Dodge & Cox (2/1/12) =MSCI EAFE; Thornburg (10/1/13) = MSCIEAFE; State Street Emerging Mkts(1/24/03) = MSCI Emerging Markets Free;PIMCO Total Return Fund and PioneerStrategic Income Fund (11/3/09) = BarclaysCapital US Aggregate; GMO Global Fixed(2/11/03) = Citi World Govt Bond Index;GMO Emerging Mkt Fixed (2/11/03) = JPMEMBI Global Diversified.3 From 11/1/09, 25% S&P 500, 12% RussMidcap, 7% Russ 2000, 9% MSCI EAFE, 2%MSCI Emerging Mkts Free, 30% BarclaysCapital U.S. Aggregate, 5% Citi WorldGovernment Bond Index, 5% JPM EMBIGlobal Diversified, 5% HFRI Index; From1/1/03, 40% S&P 500, 12.5% Russ Midcap,7.5% Russ 2000, 10% MSCI EAFE, 4%MSCI Emerging Mkts Free, 20% BarclaysCapital U.S. Aggregate, 2.5% Citi WorldGovernment Bond Index, 2.5% JPMEMBI+; Prior to 1/1/03, 60% Russell 3000,15% MSCI World Ex-US, 25% BarclaysCapital Aggregate Bond Index.
+ Quarterly performance results prior to the thirdquarter of 2002, were provided by DelawareInvestments Advisors and Lazard AssetManagement. There were no calculations by WellsFargo Advisors to ensure the accuracy of theresults. Based on information provided bySunTrust, Wells Fargo Advisors began calculatingquarterly results starting in the 4th quarter of 2002.There is no guarantee as to the accuracy of ourcalculations for the managers or the Total BOVAccount.Performance is net of investment management fees
1q14 FYTDOne Year
Three
Years1
Five
Years1
Seven
Years1
Ten
Years1Changes (1/1/03)
Incept
(Mgr)2
Incept
Bench2
Total BOV Account 1.9 13.3 13.3 7.8 15.8 5.1 6.7 8.9 7.6 7.1Target Benchmark 3 1.9 11.8 12.3 9.2 15.3 4.8 6.4 8.1
Blackrock: Large Cap Value 2.7 20.1 22.5 12.3 18.0 4.1 -- -- 5.1 6.2Russell 1000 Value 3.0 17.8 21.6 14.8 21.8 4.8 -- --
Goldman Sachs 0.6 19.8 -- -- -- -- -- -- 18.1 19.6S&P 500 1.8 18.4 -- -- -- -- -- --
Wells Fargo: Mid Cap Growth (1.3) 19.2 24.8 14.2 26.1 -- -- -- 10.3 8.1Russell MidCap Growth 2.0 20.8 24.2 13.5 24.7 -- -- --
Artisan Mid Cap Value 1.8 17.8 18.8 14.1 -- -- -- -- 23.1 26.4Russell MidCap Value 5.2 21.0 23.0 15.2 -- -- -- --
Royce: Small-Cap 3.5 25.4 31.3 14.2 31.7 8.5 9.8 14.7 14.7 11.9Russell 2000 1.1 21.2 24.9 13.2 24.3 7.1 8.5 11.9 Dodge & Cox International 2.8 23.2 25.3 -- -- -- -- -- 19.7 16.4Thornburg International Growth (5.2) -- -- -- -- -- -- -- 2.9 6.6MSCI EAFE 0.8 18.9 18.1 -- -- -- -- --
State Street: Emerging Markets (1.1) 5.4 (4.2) (3.8) 13.5 1.6 9.2 13.3 13.7 15.0MSCI EM (Emerging Markets) (0.4) 7.5 (1.1) (2.5) 14.8 3.7 10.5 14.6
PIMCO Total Return Fund 1.3 2.5 (1.3) 4.2 -- -- -- -- 5.3 4.3Pioneer Strategic Income 2.8 5.0 2.7 5.6 -- -- -- -- 7.4 4.3Barclays Capital U.S. Aggregate 1.8 2.3 (0.1) 3.8 4.8 5.0 4.5 --
GMO: Global Fixed Inc 4.4 6.3 1.7 5.5 10.9 5.0 4.7 6.3 6.3 5.2Citigroup World Govt Bond Index 2.7 4.5 1.4 1.9 3.8 4.9 4.2 5.2
GMO: Emerging Mkt Fixed Inc 4.0 8.6 2.8 10.9 20.6 9.3 11.3 13.5 13.5 9.5JPM EMBI Global Diversified 3.7 6.2 0.2 7.0 11.6 7.3 8.2 9.5
Combined Alternatives (1 mo lag) 2.3 3.1 5.7 1.4 -- -- -- -- 2.5 3.5HFRI FOFs Index (1 mo lag) 2.4 6.2 7.5 2.5 -- -- -- --
Information contained within this report is designed solely for the use by The College of William & Mary BOV Endowment, including itsOfficers, Investment Committee, and administrative staff. Distribution without the express written consent of Wells Fargo is strictly prohibited.
THE
OPTIMAL SERVICE GROUP
of Wells Fargo Advisors
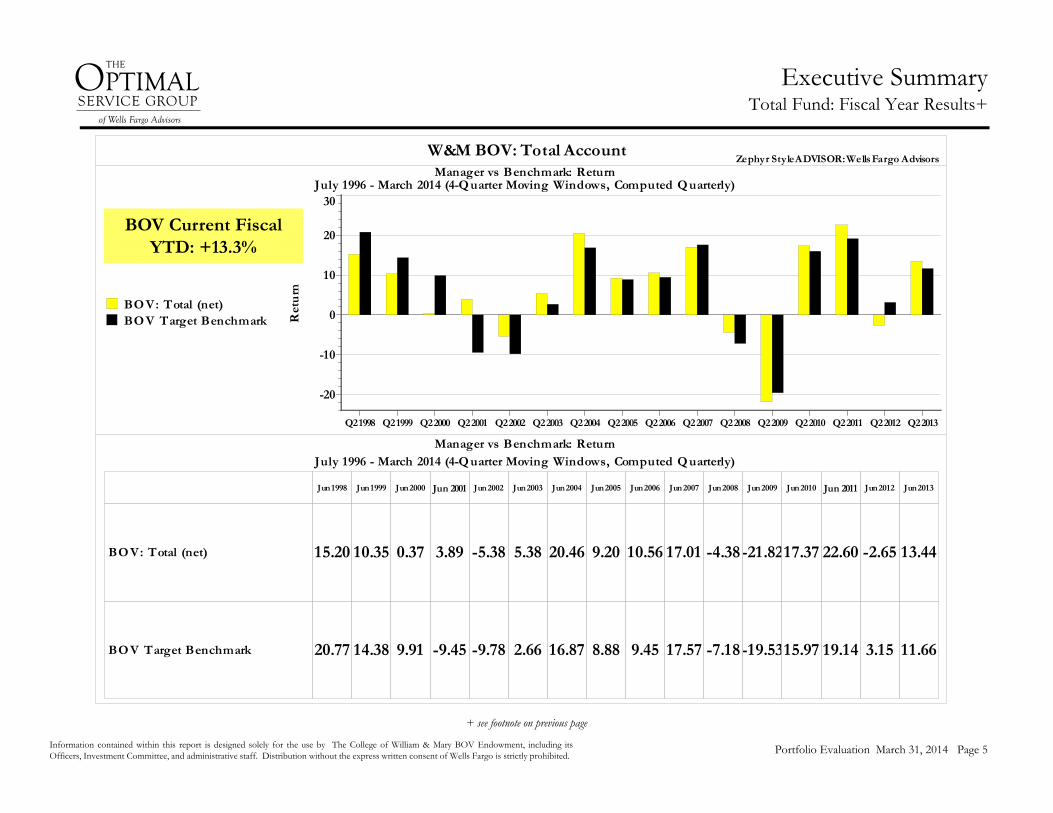
W&M BOV: Total AccountZephyr StyleADVISOR: Wells Fargo Advisors
Manager vs Benchmark: ReturnJuly 1996 - March 2014 (4-Q uarter Moving Windows, Computed Q uarterly)
Ret
urn
-20
-10
0
10
20
30
Q2 1998 Q2 1999 Q2 2000 Q2 2001 Q2 2002 Q2 2003 Q2 2004 Q2 2005 Q2 2006 Q2 2007 Q2 2008 Q2 2009 Q2 2010 Q2 2011 Q2 2012 Q2 2013
BO V: Total (net)BO V Target Benchmark
Manager vs Benchmark: Return
July 1996 - March 2014 (4-Q uarter Moving Windows, Computed Q uarterly)
BO V: Total (net)
BO V Target Benchmark
Jun 1998 Jun 1999 Jun 2000 Jun 2001 Jun 2002 Jun 2003 Jun 2004 Jun 2005 Jun 2006 Jun 2007 Jun 2008 Jun 2009 Jun 2010 Jun 2011 Jun 2012 Jun 2013
15.20 10.35 0.37 3.89 -5.38 5.38 20.46 9.20 10.56 17.01 -4.38-21.8217.37 22.60 -2.65 13.44
20.77 14.38 9.91 -9.45 -9.78 2.66 16.87 8.88 9.45 17.57 -7.18-19.5315.97 19.14 3.15 11.66
Portfolio Evaluation March 31, 2014 Page 5
Executive Summary Total Fund: Fiscal Year Results+
+ see footnote on previous page
BOV Current Fiscal YTD: +13.3%
Information contained within this report is designed solely for the use by The College of William & Mary BOV Endowment, including itsOfficers, Investment Committee, and administrative staff. Distribution without the express written consent of Wells Fargo is strictly prohibited.
THE
OPTIMAL SERVICE GROUP
of Wells Fargo Advisors
Portfolio Evaluation March 31 2014 Page 6
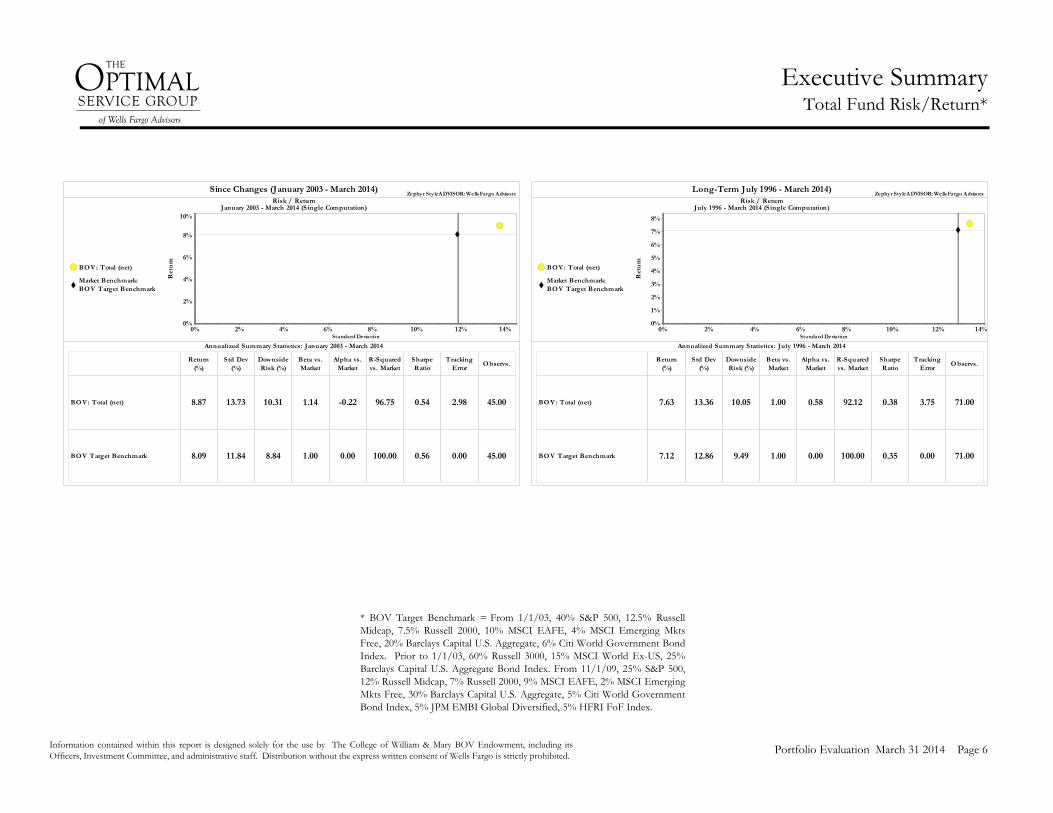
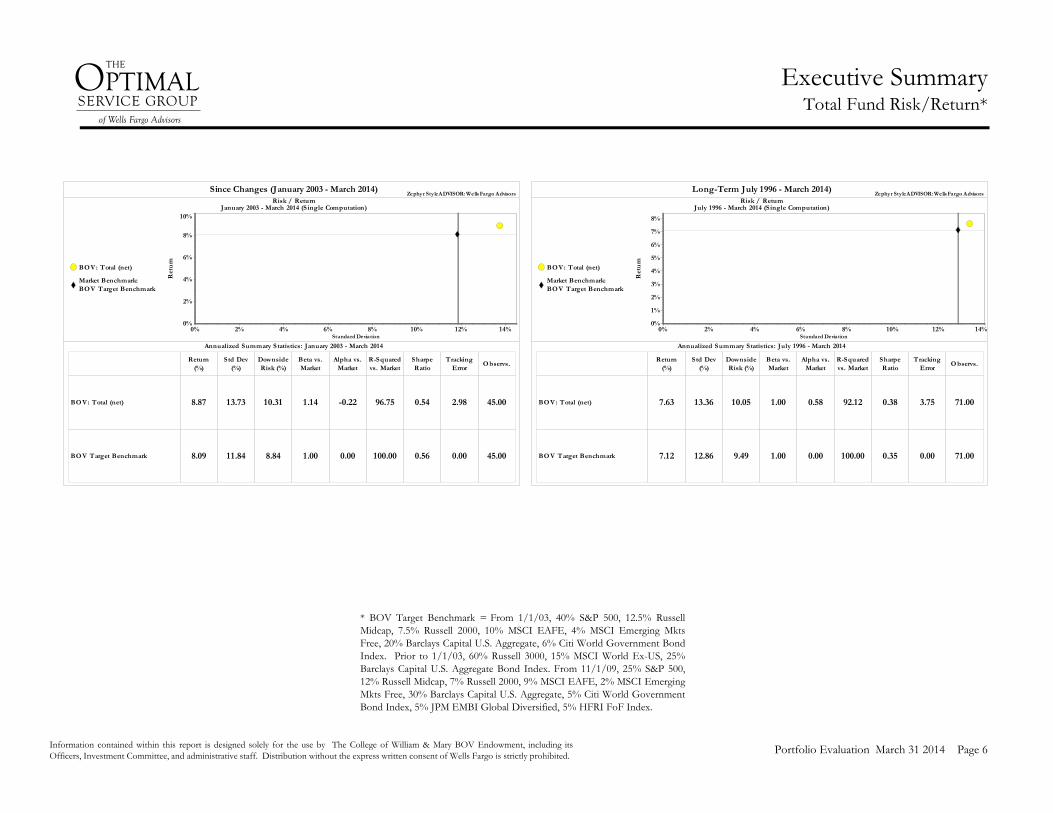
* BOV Target Benchmark = From 1/1/03, 40% S&P 500, 12.5% RussellMidcap, 7.5% Russell 2000, 10% MSCI EAFE, 4% MSCI Emerging MktsFree, 20% Barclays Capital U.S. Aggregate, 6% Citi World Government BondIndex. Prior to 1/1/03, 60% Russell 3000, 15% MSCI World Ex-US, 25%Barclays Capital U.S. Aggregate Bond Index. From 11/1/09, 25% S&P 500,12% Russell Midcap, 7% Russell 2000, 9% MSCI EAFE, 2% MSCI EmergingMkts Free, 30% Barclays Capital U.S. Aggregate, 5% Citi World GovernmentBond Index, 5% JPM EMBI Global Diversified, 5% HFRI FoF Index.
Executive Summary Total Fund Risk/Return*
Since Changes (January 2003 - March 2014)Zephyr StyleADVISOR: Wells Fargo Advisors
Risk / ReturnJanuary 2003 - March 2014 (Single Computation)
Ret
urn
0%
2%
4%
6%
8%
10%
Standard Deviation0% 2% 4% 6% 8% 10% 12% 14%
BOV: Total (net)
Market Benchmark:BOV Target Benchmark
Annualized Summary Statistics: January 2003 - March 2014
BO V: Total (net)
BO V Target Benchmark
Return(%)
Std Dev(%)
DownsideRisk (%)
Beta vs.Market
Alpha vs.Market
R-Squaredvs. Market
SharpeRatio
TrackingError
O bservs.
8.87 13.73 10.31 1.14 -0.22 96.75 0.54 2.98 45.00
8.09 11.84 8.84 1.00 0.00 100.00 0.56 0.00 45.00
Long-Term July 1996 - March 2014)Zephyr StyleADVISOR: Wells Fargo Advisors
Risk / ReturnJuly 1996 - March 2014 (Single Computation)
Ret
urn
0%
1%
2%
3%
4%
5%
6%
7%
8%
Standard Deviation0% 2% 4% 6% 8% 10% 12% 14%
BOV: Total (net)
Market Benchmark:BOV Target Benchmark
Annualized Summary Statistics: July 1996 - March 2014
BO V: Total (net)
BO V Target Benchmark
Return(%)
Std Dev(%)
DownsideRisk (%)
Beta vs.Market
Alpha vs.Market
R-Squaredvs. Market
SharpeRatio
TrackingError
O bservs.
7.63 13.36 10.05 1.00 0.58 92.12 0.38 3.75 71.00
7.12 12.86 9.49 1.00 0.00 100.00 0.35 0.00 71.00
Information contained within this report is designed solely for the use by The College of William & Mary BOV Endowment, including itsOfficers, Investment Committee, and administrative staff. Distribution without the express written consent of Wells Fargo is strictly prohibited.
THE
OPTIMAL SERVICE GROUP
of Wells Fargo Advisors
Portfolio Evaluation March 31, 2014 Page 7
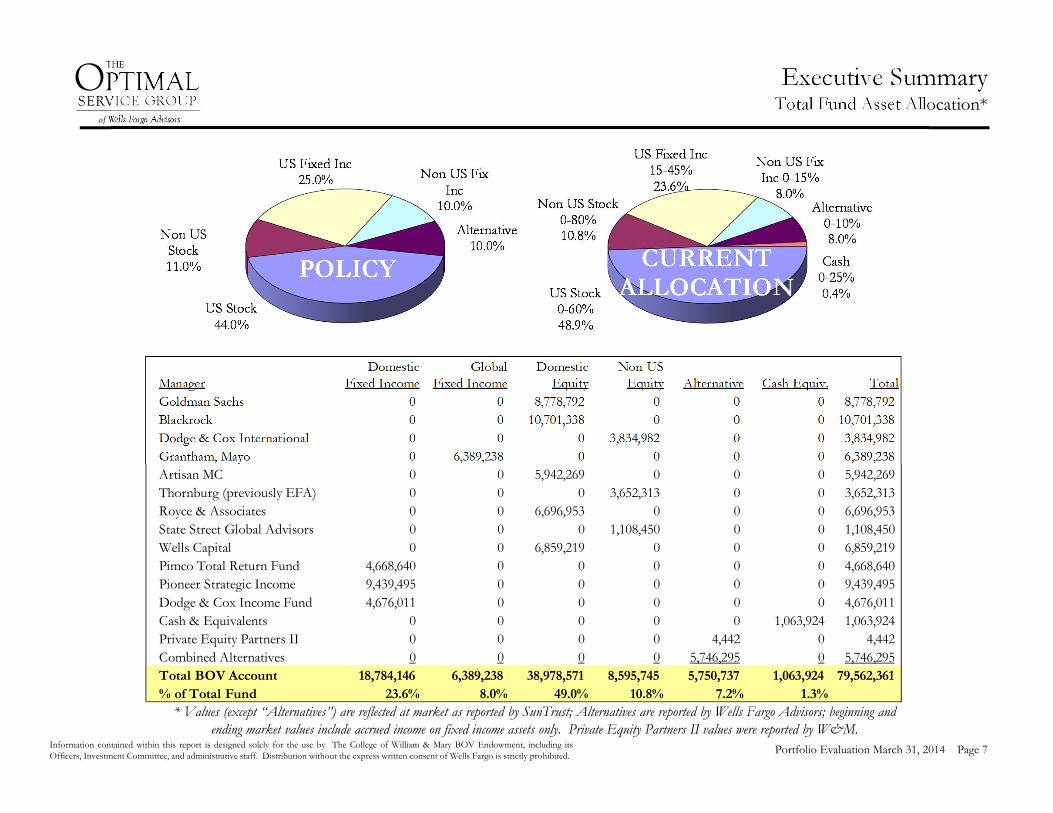
* Values (except “Alternatives”) are reflected at market as reported by SunTrust; Alternatives are reported by Wells Fargo Advisors; beginning and ending market values include accrued income on fixed income assets only. Private Equity Partners II values were reported by W&M.
Executive Summary Total Fund Asset Allocation*
Domestic Global Domestic Non-US Manager Fixed Income Fixed Income Equity Equity Alternative Cash Equiv. TotalGoldman Sachs 0 0 8,778,792 0 0 0 8,778,792Blackrock 0 0 10,701,338 0 0 0 10,701,338Dodge & Cox International 0 0 0 3,834,982 0 0 3,834,982Grantham, Mayo 0 6,389,238 0 0 0 0 6,389,238Artisan MC 0 0 5,942,269 0 0 0 5,942,269Thornburg (previously EFA) 0 0 0 3,652,313 0 0 3,652,313Royce & Associates 0 0 6,696,953 0 0 0 6,696,953State Street Global Advisors 0 0 0 1,108,450 0 0 1,108,450Wells Capital 0 0 6,859,219 0 0 0 6,859,219Pimco Total Return Fund 4,668,640 0 0 0 0 0 4,668,640Pioneer Strategic Income 9,439,495 0 0 0 0 0 9,439,495Dodge & Cox Income Fund 4,676,011 0 0 0 0 0 4,676,011Cash & Equivalents 0 0 0 0 0 1,063,924 1,063,924Private Equity Partners II 0 0 0 0 4,442 0 4,442Combined Alternatives 0 0 0 0 5,746,295 0 5,746,295Total BOV Account 18,784,146 6,389,238 38,978,571 8,595,745 5,750,737 1,063,924 79,562,361% of Total Fund 23.6% 8.0% 49.0% 10.8% 7.2% 1.3%

Information contained within this report is designed solely for the use by The College of William & Mary BOV Endowment, including itsOfficers, Investment Committee, and administrative staff. Distribution without the express written consent of Wells Fargo is strictly prohibited.
THE
OPTIMAL SERVICE GROUP
of Wells Fargo Advisors
Portfolio Evaluation March 31, 2014 Page 8
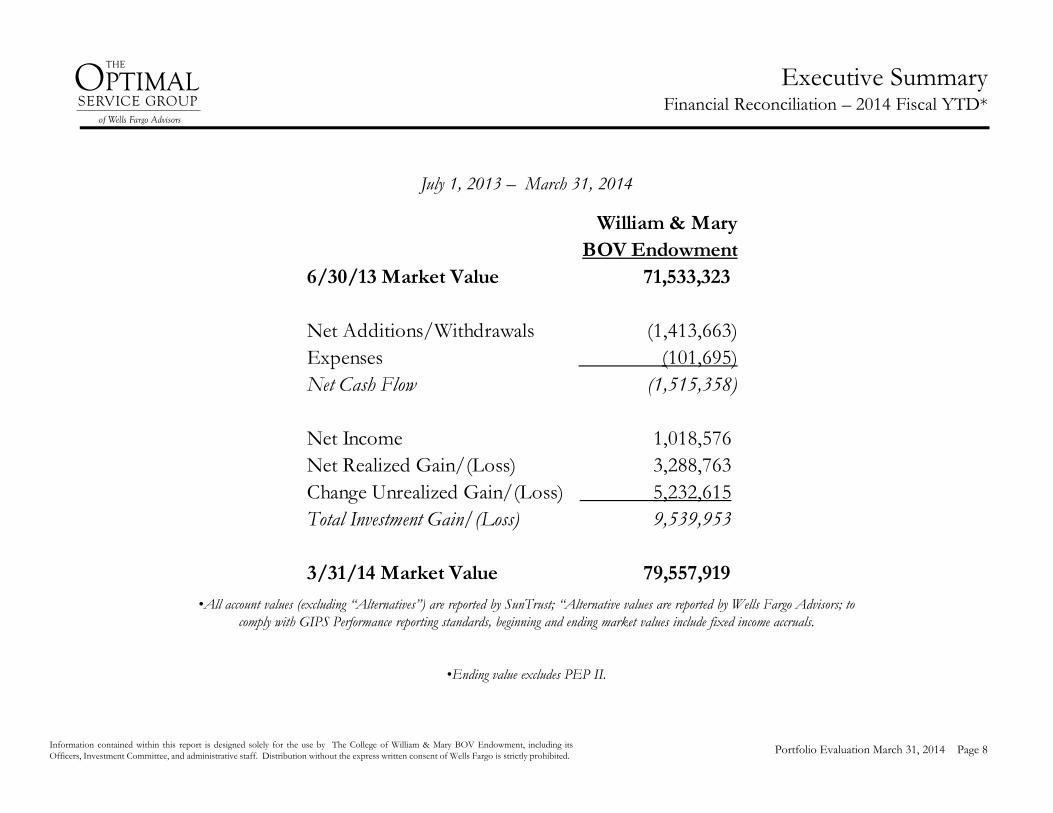
•All account values (excluding “Alternatives”) are reported by SunTrust; “Alternative values are reported by Wells Fargo Advisors; to comply with GIPS Performance reporting standards, beginning and ending market values include fixed income accruals.
•Ending value excludes PEP II.
Executive Summary Financial Reconciliation – 2014 Fiscal YTD*
July 1, 2013 – March 31, 2014
William & MaryBOV Endowment
6/30/13 Market Value 71,533,323
Net Additions/Withdrawals (1,413,663) Expenses (101,695) Net Cash Flow (1,515,358)
Net Income 1,018,576 Net Realized Gain/(Loss) 3,288,763 Change Unrealized Gain/(Loss) 5,232,615 Total Investment Gain/(Loss) 9,539,953
3/31/14 Market Value 79,557,919
Information contained within this report is designed solely for the use by The College of William & Mary BOV Endowment, including itsOfficers, Investment Committee, and administrative staff. Distribution without the express written consent of Wells Fargo is strictly prohibited.
THE
OPTIMAL SERVICE GROUP
of Wells Fargo Advisors
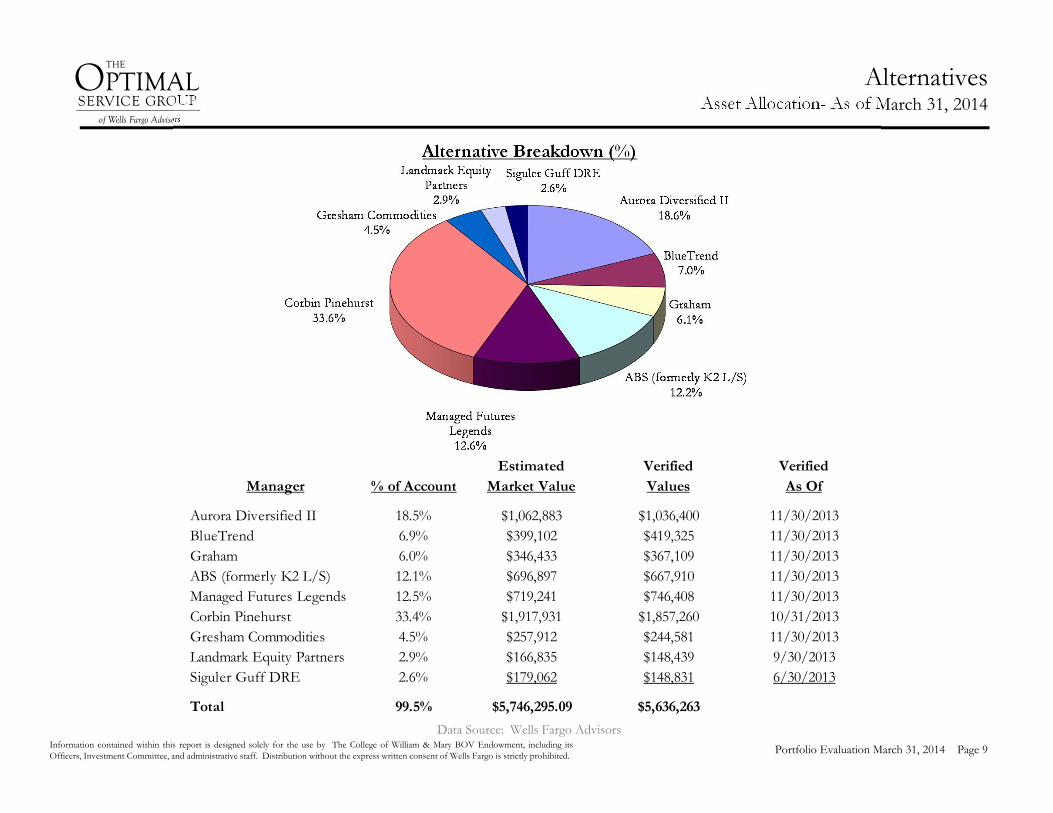
Portfolio Evaluation March 31, 2014 Page 9
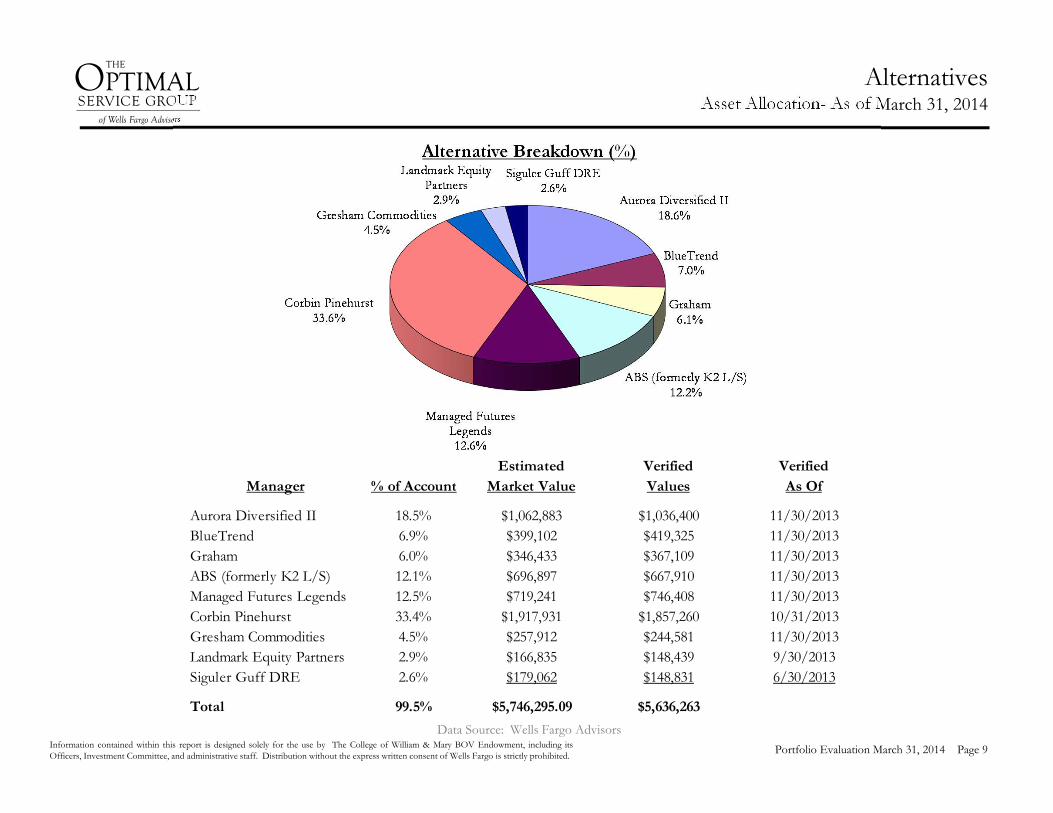
AlternativesAsset Allocation- As of March 31, 2014
Data Source: Wells Fargo Advisors
Alternative Breakdown (%)
Manager % of AccountEstimated
Market ValueVerified Values
Verified As Of
Aurora Diversified II 18.5% $1,062,883 $1,036,400 11/30/2013BlueTrend 6.9% $399,102 $419,325 11/30/2013Graham 6.0% $346,433 $367,109 11/30/2013ABS (formerly K2 L/S) 12.1% $696,897 $667,910 11/30/2013Managed Futures Legends 12.5% $719,241 $746,408 11/30/2013Corbin Pinehurst 33.4% $1,917,931 $1,857,260 10/31/2013Gresham Commodities 4.5% $257,912 $244,581 11/30/2013Landmark Equity Partners 2.9% $166,835 $148,439 9/30/2013Siguler Guff DRE 2.6% $179,062 $148,831 6/30/2013
Total 99.5% $5,746,295.09 $5,636,263
Information contained within this report is designed solely for the use by The College of William & Mary BOV Endowment, including itsOfficers, Investment Committee, and administrative staff. Distribution without the express written consent of Wells Fargo is strictly prohibited.
THE
OPTIMAL SERVICE GROUP
of Wells Fargo Advisors
Portfolio Evaluation March 31, 2014 Page 10
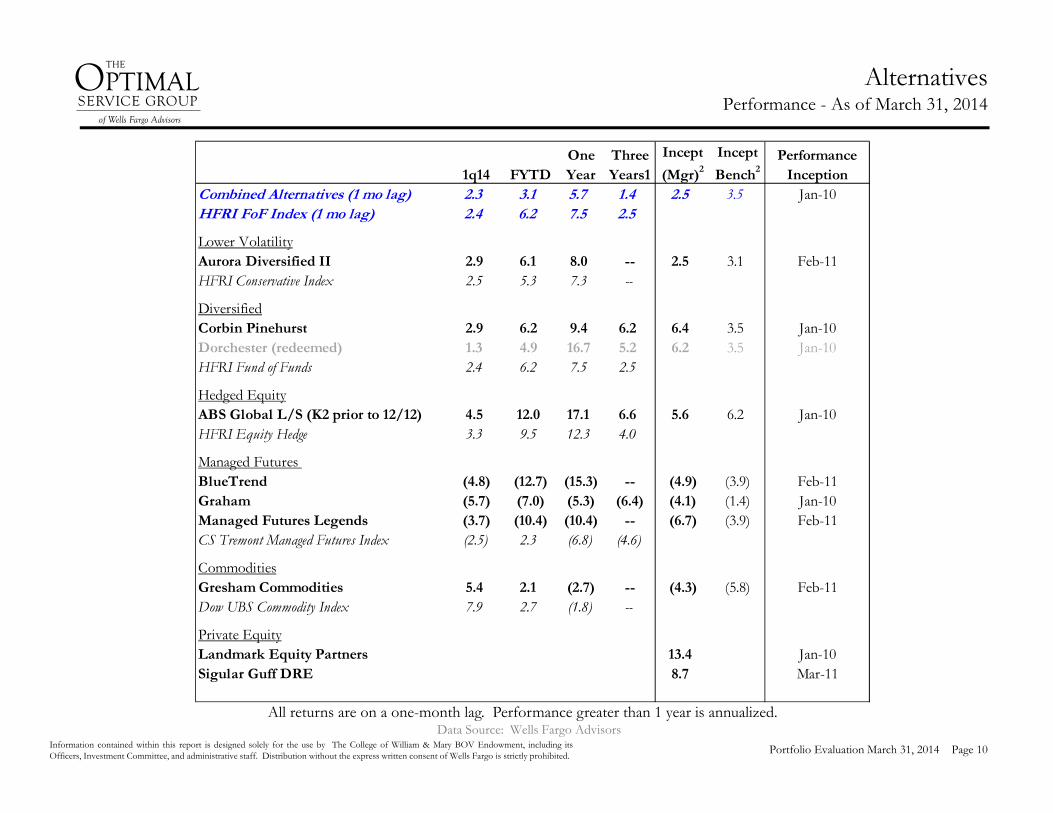
AlternativesPerformance - As of March 31, 2014
Data Source: Wells Fargo AdvisorsAll returns are on a one-month lag. Performance greater than 1 year is annualized.
1q14 FYTDOne Year
Three Years1
Incept
(Mgr)2
Incept
Bench2Performance
InceptionCombined Alternatives (1 mo lag) 2.3 3.1 5.7 1.4 2.5 3.5 Jan-10HFRI FoF Index (1 mo lag) 2.4 6.2 7.5 2.5
Lower VolatilityAurora Diversified II 2.9 6.1 8.0 -- 2.5 3.1 Feb-11HFRI Conservative Index 2.5 5.3 7.3 --
DiversifiedCorbin Pinehurst 2.9 6.2 9.4 6.2 6.4 3.5 Jan-10Dorchester (redeemed) 1.3 4.9 16.7 5.2 6.2 3.5 Jan-10HFRI Fund of Funds 2.4 6.2 7.5 2.5
Hedged EquityABS Global L/S (K2 prior to 12/12) 4.5 12.0 17.1 6.6 5.6 6.2 Jan-10HFRI Equity Hedge 3.3 9.5 12.3 4.0
Managed Futures BlueTrend (4.8) (12.7) (15.3) -- (4.9) (3.9) Feb-11Graham (5.7) (7.0) (5.3) (6.4) (4.1) (1.4) Jan-10Managed Futures Legends (3.7) (10.4) (10.4) -- (6.7) (3.9) Feb-11CS Tremont Managed Futures Index (2.5) 2.3 (6.8) (4.6)
CommoditiesGresham Commodities 5.4 2.1 (2.7) -- (4.3) (5.8) Feb-11Dow UBS Commodity Index 7.9 2.7 (1.8) --
Private EquityLandmark Equity Partners 13.4 Jan-10Sigular Guff DRE 8.7 Mar-11

THE
OPTIMAL SERVICE GROUP
of Wells Fargo Advisors
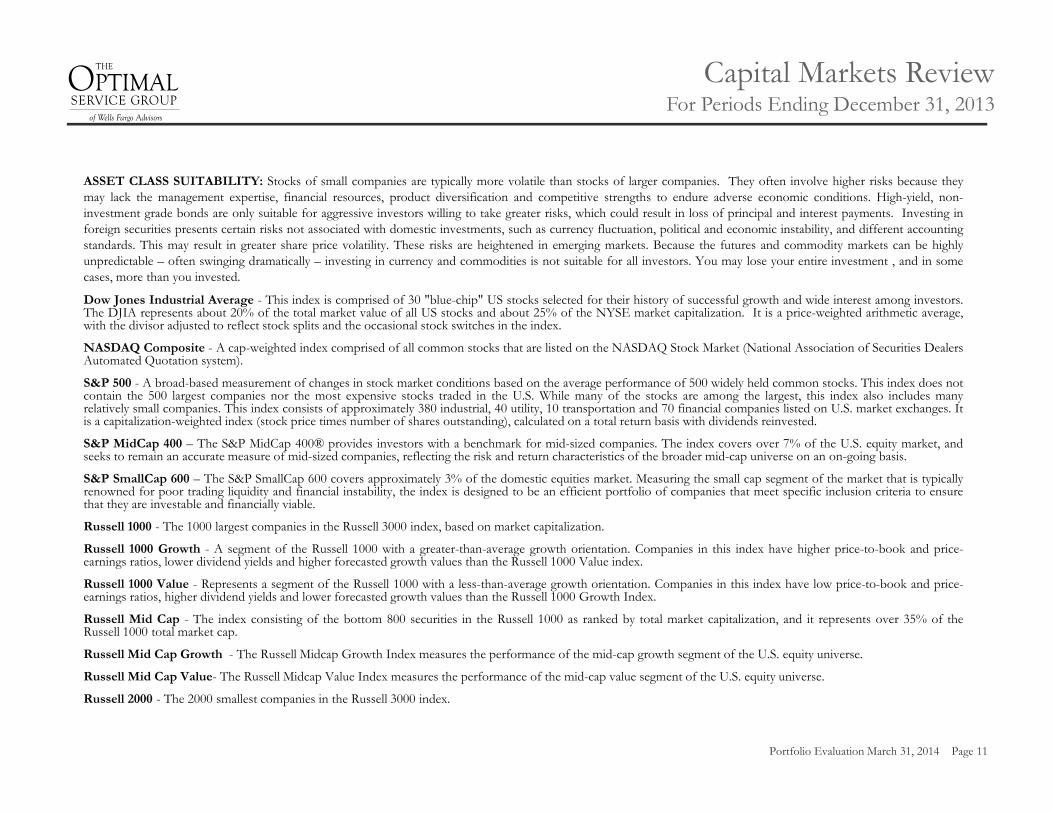
ASSET CLASS SUITABILITY: Stocks of small companies are typically more volatile than stocks of larger companies. They often involve higher risks because theymay lack the management expertise, financial resources, product diversification and competitive strengths to endure adverse economic conditions. High-yield, non-investment grade bonds are only suitable for aggressive investors willing to take greater risks, which could result in loss of principal and interest payments. Investing inforeign securities presents certain risks not associated with domestic investments, such as currency fluctuation, political and economic instability, and different accountingstandards. This may result in greater share price volatility. These risks are heightened in emerging markets. Because the futures and commodity markets can be highlyunpredictable – often swinging dramatically – investing in currency and commodities is not suitable for all investors. You may lose your entire investment , and in somecases, more than you invested.
Dow Jones Industrial Average - This index is comprised of 30 "blue-chip" US stocks selected for their history of successful growth and wide interest among investors.The DJIA represents about 20% of the total market value of all US stocks and about 25% of the NYSE market capitalization. It is a price-weighted arithmetic average,with the divisor adjusted to reflect stock splits and the occasional stock switches in the index.
NASDAQ Composite - A cap-weighted index comprised of all common stocks that are listed on the NASDAQ Stock Market (National Association of Securities DealersAutomated Quotation system).
S&P 500 - A broad-based measurement of changes in stock market conditions based on the average performance of 500 widely held common stocks. This index does notcontain the 500 largest companies nor the most expensive stocks traded in the U.S. While many of the stocks are among the largest, this index also includes manyrelatively small companies. This index consists of approximately 380 industrial, 40 utility, 10 transportation and 70 financial companies listed on U.S. market exchanges. Itis a capitalization-weighted index (stock price times number of shares outstanding), calculated on a total return basis with dividends reinvested.
S&P MidCap 400 – The S&P MidCap 400® provides investors with a benchmark for mid-sized companies. The index covers over 7% of the U.S. equity market, andseeks to remain an accurate measure of mid-sized companies, reflecting the risk and return characteristics of the broader mid-cap universe on an on-going basis.
S&P SmallCap 600 – The S&P SmallCap 600 covers approximately 3% of the domestic equities market. Measuring the small cap segment of the market that is typicallyrenowned for poor trading liquidity and financial instability, the index is designed to be an efficient portfolio of companies that meet specific inclusion criteria to ensurethat they are investable and financially viable.
Russell 1000 - The 1000 largest companies in the Russell 3000 index, based on market capitalization.
Russell 1000 Growth - A segment of the Russell 1000 with a greater-than-average growth orientation. Companies in this index have higher price-to-book and price-earnings ratios, lower dividend yields and higher forecasted growth values than the Russell 1000 Value index.
Russell 1000 Value - Represents a segment of the Russell 1000 with a less-than-average growth orientation. Companies in this index have low price-to-book and price-earnings ratios, higher dividend yields and lower forecasted growth values than the Russell 1000 Growth Index.
Russell Mid Cap - The index consisting of the bottom 800 securities in the Russell 1000 as ranked by total market capitalization, and it represents over 35% of theRussell 1000 total market cap.
Russell Mid Cap Growth - The Russell Midcap Growth Index measures the performance of the mid-cap growth segment of the U.S. equity universe.
Russell Mid Cap Value- The Russell Midcap Value Index measures the performance of the mid-cap value segment of the U.S. equity universe.
Russell 2000 - The 2000 smallest companies in the Russell 3000 index.
Capital Markets ReviewFor Periods Ending December 31, 2013
Portfolio Evaluation March 31, 2014 Page 11

THE
OPTIMAL SERVICE GROUP
of Wells Fargo Advisors
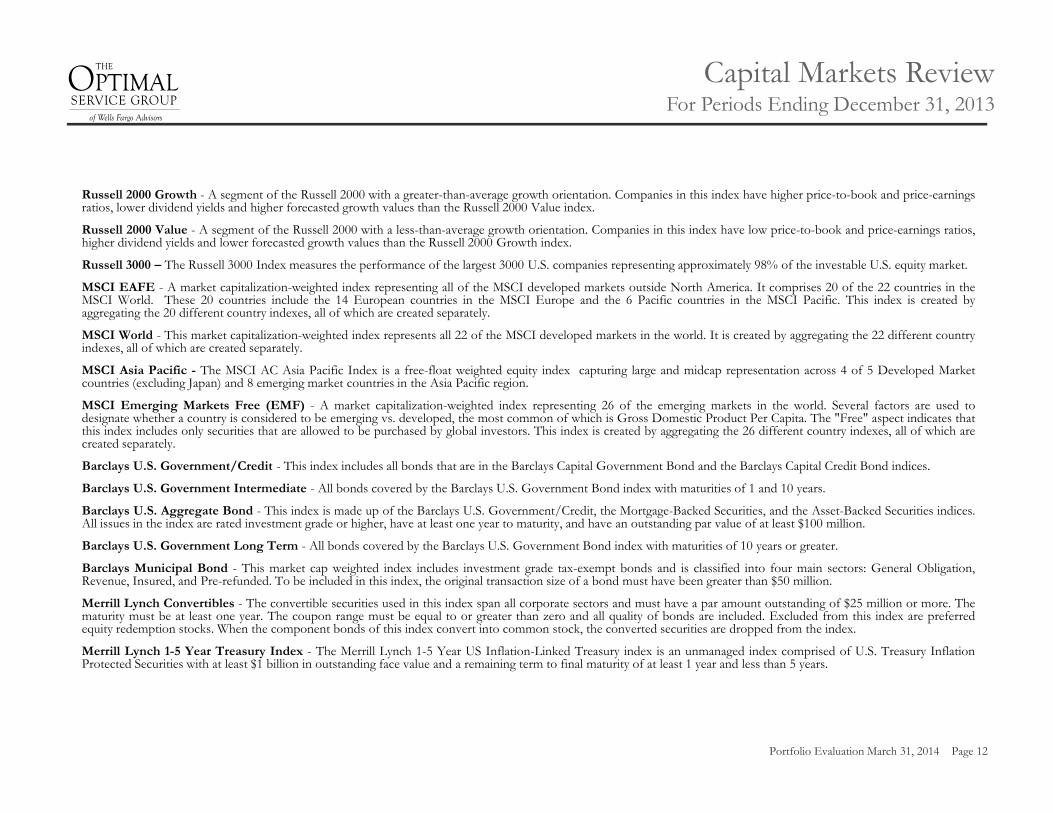
Russell 2000 Growth - A segment of the Russell 2000 with a greater-than-average growth orientation. Companies in this index have higher price-to-book and price-earningsratios, lower dividend yields and higher forecasted growth values than the Russell 2000 Value index.
Russell 2000 Value - A segment of the Russell 2000 with a less-than-average growth orientation. Companies in this index have low price-to-book and price-earnings ratios,higher dividend yields and lower forecasted growth values than the Russell 2000 Growth index.
Russell 3000 – The Russell 3000 Index measures the performance of the largest 3000 U.S. companies representing approximately 98% of the investable U.S. equity market.
MSCI EAFE - A market capitalization-weighted index representing all of the MSCI developed markets outside North America. It comprises 20 of the 22 countries in theMSCI World. These 20 countries include the 14 European countries in the MSCI Europe and the 6 Pacific countries in the MSCI Pacific. This index is created byaggregating the 20 different country indexes, all of which are created separately.
MSCI World - This market capitalization-weighted index represents all 22 of the MSCI developed markets in the world. It is created by aggregating the 22 different countryindexes, all of which are created separately.
MSCI Asia Pacific - The MSCI AC Asia Pacific Index is a free-float weighted equity index capturing large and midcap representation across 4 of 5 Developed Marketcountries (excluding Japan) and 8 emerging market countries in the Asia Pacific region.
MSCI Emerging Markets Free (EMF) - A market capitalization-weighted index representing 26 of the emerging markets in the world. Several factors are used todesignate whether a country is considered to be emerging vs. developed, the most common of which is Gross Domestic Product Per Capita. The "Free" aspect indicates thatthis index includes only securities that are allowed to be purchased by global investors. This index is created by aggregating the 26 different country indexes, all of which arecreated separately.
Barclays U.S. Government/Credit - This index includes all bonds that are in the Barclays Capital Government Bond and the Barclays Capital Credit Bond indices.
Barclays U.S. Government Intermediate - All bonds covered by the Barclays U.S. Government Bond index with maturities of 1 and 10 years.
Barclays U.S. Aggregate Bond - This index is made up of the Barclays U.S. Government/Credit, the Mortgage-Backed Securities, and the Asset-Backed Securities indices.All issues in the index are rated investment grade or higher, have at least one year to maturity, and have an outstanding par value of at least $100 million.
Barclays U.S. Government Long Term - All bonds covered by the Barclays U.S. Government Bond index with maturities of 10 years or greater.
Barclays Municipal Bond - This market cap weighted index includes investment grade tax-exempt bonds and is classified into four main sectors: General Obligation,Revenue, Insured, and Pre-refunded. To be included in this index, the original transaction size of a bond must have been greater than $50 million.
Merrill Lynch Convertibles - The convertible securities used in this index span all corporate sectors and must have a par amount outstanding of $25 million or more. Thematurity must be at least one year. The coupon range must be equal to or greater than zero and all quality of bonds are included. Excluded from this index are preferredequity redemption stocks. When the component bonds of this index convert into common stock, the converted securities are dropped from the index.
Merrill Lynch 1-5 Year Treasury Index - The Merrill Lynch 1-5 Year US Inflation-Linked Treasury index is an unmanaged index comprised of U.S. Treasury InflationProtected Securities with at least $1 billion in outstanding face value and a remaining term to final maturity of at least 1 year and less than 5 years.
Capital Markets ReviewFor Periods Ending December 31, 2013
Portfolio Evaluation March 31, 2014 Page 12

THE
OPTIMAL SERVICE GROUP
of Wells Fargo Advisors
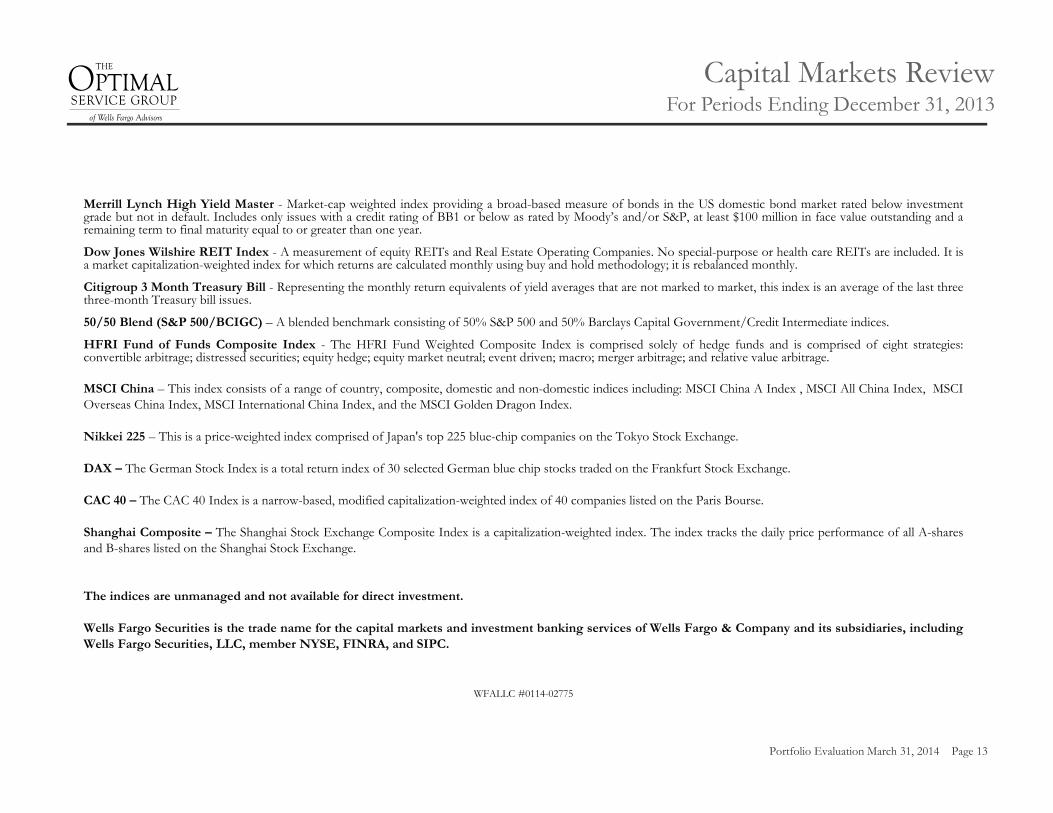
Merrill Lynch High Yield Master - Market-cap weighted index providing a broad-based measure of bonds in the US domestic bond market rated below investmentgrade but not in default. Includes only issues with a credit rating of BB1 or below as rated by Moody’s and/or S&P, at least $100 million in face value outstanding and aremaining term to final maturity equal to or greater than one year.
Dow Jones Wilshire REIT Index - A measurement of equity REITs and Real Estate Operating Companies. No special-purpose or health care REITs are included. It isa market capitalization-weighted index for which returns are calculated monthly using buy and hold methodology; it is rebalanced monthly.
Citigroup 3 Month Treasury Bill - Representing the monthly return equivalents of yield averages that are not marked to market, this index is an average of the last threethree-month Treasury bill issues.
50/50 Blend (S&P 500/BCIGC) – A blended benchmark consisting of 50% S&P 500 and 50% Barclays Capital Government/Credit Intermediate indices.
HFRI Fund of Funds Composite Index - The HFRI Fund Weighted Composite Index is comprised solely of hedge funds and is comprised of eight strategies:convertible arbitrage; distressed securities; equity hedge; equity market neutral; event driven; macro; merger arbitrage; and relative value arbitrage.
MSCI China – This index consists of a range of country, composite, domestic and non-domestic indices including: MSCI China A Index , MSCI All China Index, MSCIOverseas China Index, MSCI International China Index, and the MSCI Golden Dragon Index.
Nikkei 225 – This is a price-weighted index comprised of Japan's top 225 blue-chip companies on the Tokyo Stock Exchange.
DAX – The German Stock Index is a total return index of 30 selected German blue chip stocks traded on the Frankfurt Stock Exchange.
CAC 40 – The CAC 40 Index is a narrow-based, modified capitalization-weighted index of 40 companies listed on the Paris Bourse.
Shanghai Composite – The Shanghai Stock Exchange Composite Index is a capitalization-weighted index. The index tracks the daily price performance of all A-sharesand B-shares listed on the Shanghai Stock Exchange.
The indices are unmanaged and not available for direct investment.
Wells Fargo Securities is the trade name for the capital markets and investment banking services of Wells Fargo & Company and its subsidiaries, includingWells Fargo Securities, LLC, member NYSE, FINRA, and SIPC.
WFALLC #0114-02775
Capital Markets ReviewFor Periods Ending December 31, 2013
Portfolio Evaluation March 31, 2014 Page 13
Early Investment Portfolio Evaluation ForPeriods Ending March 31, 2014:
Board of Visitors Endowment
Wells Fargo Advisors is the trade name under which Wells Fargo & Company provides brokerage services through two registered broker/dealers: Wells Fargo Advisors, LLC, member NYSE/SIPC, and Wells Fargo & Company Financial Network, Inc., member NASD/SIPC. Each broker/dealer is a separate non-bank affiliate of Wells Fargo & Company.
THE
OPTIMAL SERVICE GROUP
of Wells Fargo Advisors
ENCLOSURE N

Information contained within this report is designed solely for the use by The College of William & Mary BOV Endowment, including itsOfficers, Investment Committee, and administrative staff. Distribution without the express written consent of Wells Fargo is strictly prohibited.
THE
OPTIMAL SERVICE GROUP
of Wells Fargo Advisors
Portfolio Evaluation March 31, 2014 Page 2
Consultant Team
Name Address Phone/Fax E-mailJoseph W. Montgomery, CFP 428 McLaws Circle Phone: (757) 220-1782 [email protected] Director - Investments Williamsburg, VA 23185 Toll-Free: 1-888-465-8422
Mobile: (757) 570-4545Fax: (757) 564-3026
Thomas C. Wilson III 428 McLaws Circle Phone: (804) 559-2922 [email protected] Director - Investments Williamsburg, VA 23185 Toll-Free: 1-888-465-8422Institutional Consulting Director Mobile: (804) 244-1213
Fax: (757) 564-3026
R. Bryce Lee, CFA, CIMA®, CAIA, FRM 428 McLaws Circle Phone: (757) 258-1687 [email protected] President - Investments Williamsburg, VA 23185 Toll-Free: 1-888-465-8422Institutional Consulting Services Mobile: (757) 753-5001
Fax: (757) 564-3026
Robin S. Wilcox 428 McLaws Circle Phone: (757) 258-5980 [email protected] President - Investments Williamsburg, VA 23185 Toll-Free: 1-888-465-8422
Mobile: (757) 753-5057Fax: (757) 564-3026
Brian T. Moore, CIMA® 428 McLaws Circle Phone: (757) 258-1666 [email protected] Consultant Williamsburg, VA 23185 Toll-Free: 1-888-465-8422Institutional Consulting Analyst Mobile: (757) 753-4875
Fax: (757) 564-3026
Karen A. Hawkridge, CIMA® 428 McLaws Circle Phone: (757) 258-1673 [email protected] Consultant Williamsburg, VA 23185 Toll-Free: 1-888-465-8422Institutional Consulting Analyst Mobile: (757) 401-3236
Fax: (757) 564-3026

Information contained within this report is designed solely for the use by The College of William & Mary BOV Endowment, including itsOfficers, Investment Committee, and administrative staff. Distribution without the express written consent of Wells Fargo is strictly prohibited.
THE
OPTIMAL SERVICE GROUP
of Wells Fargo Advisors
Portfolio Evaluation March 31, 2014 Page 3Data Sources: Zephyr StyleAdvisor & Barclay’s Capital
Capital Markets ReviewFor Periods Ending March 31, 2014
Index Name 1Q14Fiscal YTD 1 year 3 years 5 years 10 years
Dow Jones Industrial Average (0.2) 12.4 15.7 13.1 19.9 7.5NASDAQ Composite 1.1 25.0 30.6 16.4 23.9 8.8S&P 500 1.8 18.4 21.9 14.7 21.2 7.4S&P 500 Value 2.3 16.6 20.5 14.0 21.3 7.3S&P 500 Growth 1.4 20.1 23.1 15.4 21.1 7.5Russell 1000 2.1 19.3 22.4 14.8 21.7 7.8Russell 1000 Value 3.0 17.8 21.6 14.8 21.8 7.6Russell 1000 Growth 1.1 20.7 23.2 14.6 21.7 7.9Russell Midcap 3.5 20.9 23.5 14.4 25.6 10.1Russell Midcap Value 5.2 21.0 23.0 15.2 26.4 10.2Russell Midcap Growth 2.0 20.8 24.2 13.5 24.7 9.5Russell 2000 1.1 21.2 24.9 13.2 24.3 8.5Russell 2000 Value 1.8 19.7 22.7 12.7 23.3 8.1Russell 2000 Growth 0.5 22.6 27.2 13.6 25.2 8.9Russell 3000 2.0 19.4 22.6 14.6 21.9 7.9
MSCI EAFE Index 0.8 18.9 18.1 7.7 16.6 7.0MSCI World Index 1.4 18.7 19.7 10.9 18.9 7.4MSCI World Ex. US Index 0.9 18.6 17.0 6.8 16.4 7.2MSCI ACWI 1.2 17.4 17.2 9.1 18.4 7.5MSCI ACWI ex USA 0.6 16.2 12.8 4.6 16.0 7.6MSCI EM (EMERGING MARKETS) (0.4) 7.5 (1.1) (2.5) 14.8 10.5MSCI FM (FRONTIER MARKETS) 7.5 21.9 25.5 8.6 15.3 N/A
Barclays U.S. Aggregate 1.8 2.3 (0.1) 3.8 4.8 4.5Barclays U.S. Government/Credit 2.0 2.3 (0.3) 4.2 5.1 4.4Barclays Intermediate U.S. Government/Credit 1.0 1.6 (0.1) 3.1 4.2 3.9Barclays Municipal Bond 3.3 3.5 0.4 5.8 5.7 4.5BofA Merrill Lynch Convertible Securities 4.4 18.9 21.0 10.9 19.3 7.3BofA Merrill Lynch High Yield Master 3.0 9.0 7.5 8.7 18.0 8.5Citigroup World Government Bond Index 2.7 4.5 1.4 1.9 3.8 4.2JPM EMBI Global Diversified 3.7 6.2 0.2 7.0 11.6 8.2Citigroup 3-month T-bill 0.0 0.0 0.1 0.1 0.1 1.6
HFRI Fund of Funds Composite Index 0.3 5.5 5.6 2.2 4.8 3.1FTSE Nareit All REITs 8.6 6.3 2.7 10.6 27.3 7.4Dow UBS Commodity Index 7.0 8.1 (2.1) (7.4) 4.2 0.4
Information contained within this report is designed solely for the use by The College of William & Mary BOV Endowment, including itsOfficers, Investment Committee, and administrative staff. Distribution without the express written consent of Wells Fargo is strictly prohibited.
THE
OPTIMAL SERVICE GROUP
of Wells Fargo Advisors
Portfolio Evaluation March 31, 2014 Page 4
Executive SummaryTotal Fund Performance Through March 31, 2014
1 Annualized2 Total BOV Account (7/1/96) = TargetBenchmark; Blackrock Large Cap Value(5/1/06) = Russell 1000 Value;Goldman(5/1/2013) = Russell 1000 Growth;Wells Fargo MidCap (4/1/06) = RussellMidCap Growth; Artisan Mid Cap 5/26/09= Russell MidCap Value; Royce (1/8/03) =Russell 2000; Dodge & Cox (2/1/12) =MSCI EAFE; Thornburg (10/1/13) = MSCIEAFE; State Street Emerging Mkts(1/24/03) = MSCI Emerging Markets Free;PIMCO Total Return Fund and PioneerStrategic Income Fund (11/3/09) = BarclaysCapital US Aggregate; GMO Global Fixed(2/11/03) = Citi World Govt Bond Index;GMO Emerging Mkt Fixed (2/11/03) = JPMEMBI Global Diversified.3 From 11/1/09, 25% S&P 500, 12% RussMidcap, 7% Russ 2000, 9% MSCI EAFE, 2%MSCI Emerging Mkts Free, 30% BarclaysCapital U.S. Aggregate, 5% Citi WorldGovernment Bond Index, 5% JPM EMBIGlobal Diversified, 5% HFRI Index; From1/1/03, 40% S&P 500, 12.5% Russ Midcap,7.5% Russ 2000, 10% MSCI EAFE, 4%MSCI Emerging Mkts Free, 20% BarclaysCapital U.S. Aggregate, 2.5% Citi WorldGovernment Bond Index, 2.5% JPMEMBI+; Prior to 1/1/03, 60% Russell 3000,15% MSCI World Ex-US, 25% BarclaysCapital Aggregate Bond Index.
+ Quarterly performance results prior to the thirdquarter of 2002, were provided by DelawareInvestments Advisors and Lazard AssetManagement. There were no calculations by WellsFargo Advisors to ensure the accuracy of theresults. Based on information provided bySunTrust, Wells Fargo Advisors began calculatingquarterly results starting in the 4th quarter of 2002.There is no guarantee as to the accuracy of ourcalculations for the managers or the Total BOVAccount.Performance is net of investment management fees
1q14 FYTDOne Year
Three
Years1
Five
Years1
Seven
Years1
Ten
Years1Changes (1/1/03)
Incept
(Mgr)2
Incept
Bench2
Total BOV Account 1.9 13.3 13.3 7.8 15.8 5.1 6.7 8.9 7.6 7.1Target Benchmark 3 1.9 11.8 12.3 9.2 15.3 4.8 6.4 8.1
Blackrock: Large Cap Value 2.7 20.1 22.5 12.3 18.0 4.1 -- -- 5.1 6.2Russell 1000 Value 3.0 17.8 21.6 14.8 21.8 4.8 -- --
Goldman Sachs 0.6 19.8 -- -- -- -- -- -- 18.1 19.6S&P 500 1.8 18.4 -- -- -- -- -- --
Wells Fargo: Mid Cap Growth (1.3) 19.2 24.8 14.2 26.1 -- -- -- 10.3 8.1Russell MidCap Growth 2.0 20.8 24.2 13.5 24.7 -- -- --
Artisan Mid Cap Value 1.8 17.8 18.8 14.1 -- -- -- -- 23.1 26.4Russell MidCap Value 5.2 21.0 23.0 15.2 -- -- -- --
Royce: Small-Cap 3.5 25.4 31.3 14.2 31.7 8.5 9.8 14.7 14.7 11.9Russell 2000 1.1 21.2 24.9 13.2 24.3 7.1 8.5 11.9 Dodge & Cox International 2.8 23.2 25.3 -- -- -- -- -- 19.7 16.4Thornburg International Growth (5.2) -- -- -- -- -- -- -- 2.9 6.6MSCI EAFE 0.8 18.9 18.1 -- -- -- -- --
State Street: Emerging Markets (1.1) 5.4 (4.2) (3.8) 13.5 1.6 9.2 13.3 13.7 15.0MSCI EM (Emerging Markets) (0.4) 7.5 (1.1) (2.5) 14.8 3.7 10.5 14.6
PIMCO Total Return Fund 1.3 2.5 (1.3) 4.2 -- -- -- -- 5.3 4.3Pioneer Strategic Income 2.8 5.0 2.7 5.6 -- -- -- -- 7.4 4.3Barclays Capital U.S. Aggregate 1.8 2.3 (0.1) 3.8 4.8 5.0 4.5 --
GMO: Global Fixed Inc 4.4 6.3 1.7 5.5 10.9 5.0 4.7 6.3 6.3 5.2Citigroup World Govt Bond Index 2.7 4.5 1.4 1.9 3.8 4.9 4.2 5.2
GMO: Emerging Mkt Fixed Inc 4.0 8.6 2.8 10.9 20.6 9.3 11.3 13.5 13.5 9.5JPM EMBI Global Diversified 3.7 6.2 0.2 7.0 11.6 7.3 8.2 9.5
Combined Alternatives (1 mo lag) 2.3 3.1 5.7 1.4 -- -- -- -- 2.5 3.5HFRI FOFs Index (1 mo lag) 2.4 6.2 7.5 2.5 -- -- -- --

Information contained within this report is designed solely for the use by The College of William & Mary BOV Endowment, including itsOfficers, Investment Committee, and administrative staff. Distribution without the express written consent of Wells Fargo is strictly prohibited.
THE
OPTIMAL SERVICE GROUP
of Wells Fargo Advisors
W&M BOV: Total AccountZephyr StyleADVISOR: Wells Fargo Advisors
Manager vs Benchmark: ReturnJuly 1996 - March 2014 (4-Q uarter Moving Windows, Computed Q uarterly)
Ret
urn
-20
-10
0
10
20
30
Q2 1998 Q2 1999 Q2 2000 Q2 2001 Q2 2002 Q2 2003 Q2 2004 Q2 2005 Q2 2006 Q2 2007 Q2 2008 Q2 2009 Q2 2010 Q2 2011 Q2 2012 Q2 2013
BO V: Total (net)BO V Target Benchmark
Manager vs Benchmark: Return
July 1996 - March 2014 (4-Q uarter Moving Windows, Computed Q uarterly)
BO V: Total (net)
BO V Target Benchmark
Jun 1998 Jun 1999 Jun 2000 Jun 2001 Jun 2002 Jun 2003 Jun 2004 Jun 2005 Jun 2006 Jun 2007 Jun 2008 Jun 2009 Jun 2010 Jun 2011 Jun 2012 Jun 2013
15.20 10.35 0.37 3.89 -5.38 5.38 20.46 9.20 10.56 17.01 -4.38-21.8217.37 22.60 -2.65 13.44
20.77 14.38 9.91 -9.45 -9.78 2.66 16.87 8.88 9.45 17.57 -7.18-19.5315.97 19.14 3.15 11.66
Portfolio Evaluation March 31, 2014 Page 5
Executive Summary Total Fund: Fiscal Year Results+
+ see footnote on previous page
BOV Current Fiscal YTD: +13.3%
Information contained within this report is designed solely for the use by The College of William & Mary BOV Endowment, including itsOfficers, Investment Committee, and administrative staff. Distribution without the express written consent of Wells Fargo is strictly prohibited.
THE
OPTIMAL SERVICE GROUP
of Wells Fargo Advisors
Portfolio Evaluation March 31 2014 Page 6
* BOV Target Benchmark = From 1/1/03, 40% S&P 500, 12.5% RussellMidcap, 7.5% Russell 2000, 10% MSCI EAFE, 4% MSCI Emerging MktsFree, 20% Barclays Capital U.S. Aggregate, 6% Citi World Government BondIndex. Prior to 1/1/03, 60% Russell 3000, 15% MSCI World Ex-US, 25%Barclays Capital U.S. Aggregate Bond Index. From 11/1/09, 25% S&P 500,12% Russell Midcap, 7% Russell 2000, 9% MSCI EAFE, 2% MSCI EmergingMkts Free, 30% Barclays Capital U.S. Aggregate, 5% Citi World GovernmentBond Index, 5% JPM EMBI Global Diversified, 5% HFRI FoF Index.
Executive Summary Total Fund Risk/Return*
Since Changes (January 2003 - March 2014)Zephyr StyleADVISOR: Wells Fargo Advisors
Risk / ReturnJanuary 2003 - March 2014 (Single Computation)
Ret
urn
0%
2%
4%
6%
8%
10%
Standard Deviation0% 2% 4% 6% 8% 10% 12% 14%
BOV: Total (net)
Market Benchmark:BOV Target Benchmark
Annualized Summary Statistics: January 2003 - March 2014
BO V: Total (net)
BO V Target Benchmark
Return(%)
Std Dev(%)
DownsideRisk (%)
Beta vs.Market
Alpha vs.Market
R-Squaredvs. Market
SharpeRatio
TrackingError
O bservs.
8.87 13.73 10.31 1.14 -0.22 96.75 0.54 2.98 45.00
8.09 11.84 8.84 1.00 0.00 100.00 0.56 0.00 45.00
Long-Term July 1996 - March 2014)Zephyr StyleADVISOR: Wells Fargo Advisors
Risk / ReturnJuly 1996 - March 2014 (Single Computation)
Ret
urn
0%
1%
2%
3%
4%
5%
6%
7%
8%
Standard Deviation0% 2% 4% 6% 8% 10% 12% 14%
BOV: Total (net)
Market Benchmark:BOV Target Benchmark
Annualized Summary Statistics: July 1996 - March 2014
BO V: Total (net)
BO V Target Benchmark
Return(%)
Std Dev(%)
DownsideRisk (%)
Beta vs.Market
Alpha vs.Market
R-Squaredvs. Market
SharpeRatio
TrackingError
O bservs.
7.63 13.36 10.05 1.00 0.58 92.12 0.38 3.75 71.00
7.12 12.86 9.49 1.00 0.00 100.00 0.35 0.00 71.00

Information contained within this report is designed solely for the use by The College of William & Mary BOV Endowment, including itsOfficers, Investment Committee, and administrative staff. Distribution without the express written consent of Wells Fargo is strictly prohibited.
THE
OPTIMAL SERVICE GROUP
of Wells Fargo Advisors
Portfolio Evaluation March 31, 2014 Page 7
* Values (except “Alternatives”) are reflected at market as reported by SunTrust; Alternatives are reported by Wells Fargo Advisors; beginning and ending market values include accrued income on fixed income assets only. Private Equity Partners II values were reported by W&M.
Executive Summary Total Fund Asset Allocation*
Domestic Global Domestic Non-US Manager Fixed Income Fixed Income Equity Equity Alternative Cash Equiv. TotalGoldman Sachs 0 0 8,778,792 0 0 0 8,778,792Blackrock 0 0 10,701,338 0 0 0 10,701,338Dodge & Cox International 0 0 0 3,834,982 0 0 3,834,982Grantham, Mayo 0 6,389,238 0 0 0 0 6,389,238Artisan MC 0 0 5,942,269 0 0 0 5,942,269Thornburg (previously EFA) 0 0 0 3,652,313 0 0 3,652,313Royce & Associates 0 0 6,696,953 0 0 0 6,696,953State Street Global Advisors 0 0 0 1,108,450 0 0 1,108,450Wells Capital 0 0 6,859,219 0 0 0 6,859,219Pimco Total Return Fund 4,668,640 0 0 0 0 0 4,668,640Pioneer Strategic Income 9,439,495 0 0 0 0 0 9,439,495Dodge & Cox Income Fund 4,676,011 0 0 0 0 0 4,676,011Cash & Equivalents 0 0 0 0 0 1,063,924 1,063,924Private Equity Partners II 0 0 0 0 4,442 0 4,442Combined Alternatives 0 0 0 0 5,746,295 0 5,746,295Total BOV Account 18,784,146 6,389,238 38,978,571 8,595,745 5,750,737 1,063,924 79,562,361% of Total Fund 23.6% 8.0% 49.0% 10.8% 7.2% 1.3%
Information contained within this report is designed solely for the use by The College of William & Mary BOV Endowment, including itsOfficers, Investment Committee, and administrative staff. Distribution without the express written consent of Wells Fargo is strictly prohibited.
THE
OPTIMAL SERVICE GROUP
of Wells Fargo Advisors
Portfolio Evaluation March 31, 2014 Page 8
•All account values (excluding “Alternatives”) are reported by SunTrust; “Alternative values are reported by Wells Fargo Advisors; to comply with GIPS Performance reporting standards, beginning and ending market values include fixed income accruals.
•Ending value excludes PEP II.
Executive Summary Financial Reconciliation – 2014 Fiscal YTD*
July 1, 2013 – March 31, 2014
William & MaryBOV Endowment
6/30/13 Market Value 71,533,323
Net Additions/Withdrawals (1,413,663) Expenses (101,695) Net Cash Flow (1,515,358)
Net Income 1,018,576 Net Realized Gain/(Loss) 3,288,763 Change Unrealized Gain/(Loss) 5,232,615 Total Investment Gain/(Loss) 9,539,953
3/31/14 Market Value 79,557,919
Information contained within this report is designed solely for the use by The College of William & Mary BOV Endowment, including itsOfficers, Investment Committee, and administrative staff. Distribution without the express written consent of Wells Fargo is strictly prohibited.
THE
OPTIMAL SERVICE GROUP
of Wells Fargo Advisors
Portfolio Evaluation March 31, 2014 Page 9
AlternativesAsset Allocation- As of March 31, 2014
Data Source: Wells Fargo Advisors
Alternative Breakdown (%)
Manager % of AccountEstimated
Market ValueVerified Values
Verified As Of
Aurora Diversified II 18.5% $1,062,883 $1,036,400 11/30/2013BlueTrend 6.9% $399,102 $419,325 11/30/2013Graham 6.0% $346,433 $367,109 11/30/2013ABS (formerly K2 L/S) 12.1% $696,897 $667,910 11/30/2013Managed Futures Legends 12.5% $719,241 $746,408 11/30/2013Corbin Pinehurst 33.4% $1,917,931 $1,857,260 10/31/2013Gresham Commodities 4.5% $257,912 $244,581 11/30/2013Landmark Equity Partners 2.9% $166,835 $148,439 9/30/2013Siguler Guff DRE 2.6% $179,062 $148,831 6/30/2013
Total 99.5% $5,746,295.09 $5,636,263

Information contained within this report is designed solely for the use by The College of William & Mary BOV Endowment, including itsOfficers, Investment Committee, and administrative staff. Distribution without the express written consent of Wells Fargo is strictly prohibited.
THE
OPTIMAL SERVICE GROUP
of Wells Fargo Advisors
Portfolio Evaluation March 31, 2014 Page 10
AlternativesPerformance - As of March 31, 2014
Data Source: Wells Fargo AdvisorsAll returns are on a one-month lag. Performance greater than 1 year is annualized.
1q14 FYTDOne Year
Three Years1
Incept
(Mgr)2
Incept
Bench2Performance
InceptionCombined Alternatives (1 mo lag) 2.3 3.1 5.7 1.4 2.5 3.5 Jan-10HFRI FoF Index (1 mo lag) 2.4 6.2 7.5 2.5
Lower VolatilityAurora Diversified II 2.9 6.1 8.0 -- 2.5 3.1 Feb-11HFRI Conservative Index 2.5 5.3 7.3 --
DiversifiedCorbin Pinehurst 2.9 6.2 9.4 6.2 6.4 3.5 Jan-10Dorchester (redeemed) 1.3 4.9 16.7 5.2 6.2 3.5 Jan-10HFRI Fund of Funds 2.4 6.2 7.5 2.5
Hedged EquityABS Global L/S (K2 prior to 12/12) 4.5 12.0 17.1 6.6 5.6 6.2 Jan-10HFRI Equity Hedge 3.3 9.5 12.3 4.0
Managed Futures BlueTrend (4.8) (12.7) (15.3) -- (4.9) (3.9) Feb-11Graham (5.7) (7.0) (5.3) (6.4) (4.1) (1.4) Jan-10Managed Futures Legends (3.7) (10.4) (10.4) -- (6.7) (3.9) Feb-11CS Tremont Managed Futures Index (2.5) 2.3 (6.8) (4.6)
CommoditiesGresham Commodities 5.4 2.1 (2.7) -- (4.3) (5.8) Feb-11Dow UBS Commodity Index 7.9 2.7 (1.8) --
Private EquityLandmark Equity Partners 13.4 Jan-10Sigular Guff DRE 8.7 Mar-11
THE
OPTIMAL SERVICE GROUP
of Wells Fargo Advisors
ASSET CLASS SUITABILITY: Stocks of small companies are typically more volatile than stocks of larger companies. They often involve higher risks because theymay lack the management expertise, financial resources, product diversification and competitive strengths to endure adverse economic conditions. High-yield, non-investment grade bonds are only suitable for aggressive investors willing to take greater risks, which could result in loss of principal and interest payments. Investing inforeign securities presents certain risks not associated with domestic investments, such as currency fluctuation, political and economic instability, and different accountingstandards. This may result in greater share price volatility. These risks are heightened in emerging markets. Because the futures and commodity markets can be highlyunpredictable – often swinging dramatically – investing in currency and commodities is not suitable for all investors. You may lose your entire investment , and in somecases, more than you invested.
Dow Jones Industrial Average - This index is comprised of 30 "blue-chip" US stocks selected for their history of successful growth and wide interest among investors.The DJIA represents about 20% of the total market value of all US stocks and about 25% of the NYSE market capitalization. It is a price-weighted arithmetic average,with the divisor adjusted to reflect stock splits and the occasional stock switches in the index.
NASDAQ Composite - A cap-weighted index comprised of all common stocks that are listed on the NASDAQ Stock Market (National Association of Securities DealersAutomated Quotation system).
S&P 500 - A broad-based measurement of changes in stock market conditions based on the average performance of 500 widely held common stocks. This index does notcontain the 500 largest companies nor the most expensive stocks traded in the U.S. While many of the stocks are among the largest, this index also includes manyrelatively small companies. This index consists of approximately 380 industrial, 40 utility, 10 transportation and 70 financial companies listed on U.S. market exchanges. Itis a capitalization-weighted index (stock price times number of shares outstanding), calculated on a total return basis with dividends reinvested.
S&P MidCap 400 – The S&P MidCap 400® provides investors with a benchmark for mid-sized companies. The index covers over 7% of the U.S. equity market, andseeks to remain an accurate measure of mid-sized companies, reflecting the risk and return characteristics of the broader mid-cap universe on an on-going basis.
S&P SmallCap 600 – The S&P SmallCap 600 covers approximately 3% of the domestic equities market. Measuring the small cap segment of the market that is typicallyrenowned for poor trading liquidity and financial instability, the index is designed to be an efficient portfolio of companies that meet specific inclusion criteria to ensurethat they are investable and financially viable.
Russell 1000 - The 1000 largest companies in the Russell 3000 index, based on market capitalization.
Russell 1000 Growth - A segment of the Russell 1000 with a greater-than-average growth orientation. Companies in this index have higher price-to-book and price-earnings ratios, lower dividend yields and higher forecasted growth values than the Russell 1000 Value index.
Russell 1000 Value - Represents a segment of the Russell 1000 with a less-than-average growth orientation. Companies in this index have low price-to-book and price-earnings ratios, higher dividend yields and lower forecasted growth values than the Russell 1000 Growth Index.
Russell Mid Cap - The index consisting of the bottom 800 securities in the Russell 1000 as ranked by total market capitalization, and it represents over 35% of theRussell 1000 total market cap.
Russell Mid Cap Growth - The Russell Midcap Growth Index measures the performance of the mid-cap growth segment of the U.S. equity universe.
Russell Mid Cap Value- The Russell Midcap Value Index measures the performance of the mid-cap value segment of the U.S. equity universe.
Russell 2000 - The 2000 smallest companies in the Russell 3000 index.
Capital Markets ReviewFor Periods Ending December 31, 2013
Portfolio Evaluation March 31, 2014 Page 11
THE
OPTIMAL SERVICE GROUP
of Wells Fargo Advisors
Russell 2000 Growth - A segment of the Russell 2000 with a greater-than-average growth orientation. Companies in this index have higher price-to-book and price-earningsratios, lower dividend yields and higher forecasted growth values than the Russell 2000 Value index.
Russell 2000 Value - A segment of the Russell 2000 with a less-than-average growth orientation. Companies in this index have low price-to-book and price-earnings ratios,higher dividend yields and lower forecasted growth values than the Russell 2000 Growth index.
Russell 3000 – The Russell 3000 Index measures the performance of the largest 3000 U.S. companies representing approximately 98% of the investable U.S. equity market.
MSCI EAFE - A market capitalization-weighted index representing all of the MSCI developed markets outside North America. It comprises 20 of the 22 countries in theMSCI World. These 20 countries include the 14 European countries in the MSCI Europe and the 6 Pacific countries in the MSCI Pacific. This index is created byaggregating the 20 different country indexes, all of which are created separately.
MSCI World - This market capitalization-weighted index represents all 22 of the MSCI developed markets in the world. It is created by aggregating the 22 different countryindexes, all of which are created separately.
MSCI Asia Pacific - The MSCI AC Asia Pacific Index is a free-float weighted equity index capturing large and midcap representation across 4 of 5 Developed Marketcountries (excluding Japan) and 8 emerging market countries in the Asia Pacific region.
MSCI Emerging Markets Free (EMF) - A market capitalization-weighted index representing 26 of the emerging markets in the world. Several factors are used todesignate whether a country is considered to be emerging vs. developed, the most common of which is Gross Domestic Product Per Capita. The "Free" aspect indicates thatthis index includes only securities that are allowed to be purchased by global investors. This index is created by aggregating the 26 different country indexes, all of which arecreated separately.
Barclays U.S. Government/Credit - This index includes all bonds that are in the Barclays Capital Government Bond and the Barclays Capital Credit Bond indices.
Barclays U.S. Government Intermediate - All bonds covered by the Barclays U.S. Government Bond index with maturities of 1 and 10 years.
Barclays U.S. Aggregate Bond - This index is made up of the Barclays U.S. Government/Credit, the Mortgage-Backed Securities, and the Asset-Backed Securities indices.All issues in the index are rated investment grade or higher, have at least one year to maturity, and have an outstanding par value of at least $100 million.
Barclays U.S. Government Long Term - All bonds covered by the Barclays U.S. Government Bond index with maturities of 10 years or greater.
Barclays Municipal Bond - This market cap weighted index includes investment grade tax-exempt bonds and is classified into four main sectors: General Obligation,Revenue, Insured, and Pre-refunded. To be included in this index, the original transaction size of a bond must have been greater than $50 million.
Merrill Lynch Convertibles - The convertible securities used in this index span all corporate sectors and must have a par amount outstanding of $25 million or more. Thematurity must be at least one year. The coupon range must be equal to or greater than zero and all quality of bonds are included. Excluded from this index are preferredequity redemption stocks. When the component bonds of this index convert into common stock, the converted securities are dropped from the index.
Merrill Lynch 1-5 Year Treasury Index - The Merrill Lynch 1-5 Year US Inflation-Linked Treasury index is an unmanaged index comprised of U.S. Treasury InflationProtected Securities with at least $1 billion in outstanding face value and a remaining term to final maturity of at least 1 year and less than 5 years.
Capital Markets ReviewFor Periods Ending December 31, 2013
Portfolio Evaluation March 31, 2014 Page 12
THE
OPTIMAL SERVICE GROUP
of Wells Fargo Advisors
Merrill Lynch High Yield Master - Market-cap weighted index providing a broad-based measure of bonds in the US domestic bond market rated below investmentgrade but not in default. Includes only issues with a credit rating of BB1 or below as rated by Moody’s and/or S&P, at least $100 million in face value outstanding and aremaining term to final maturity equal to or greater than one year.
Dow Jones Wilshire REIT Index - A measurement of equity REITs and Real Estate Operating Companies. No special-purpose or health care REITs are included. It isa market capitalization-weighted index for which returns are calculated monthly using buy and hold methodology; it is rebalanced monthly.
Citigroup 3 Month Treasury Bill - Representing the monthly return equivalents of yield averages that are not marked to market, this index is an average of the last threethree-month Treasury bill issues.
50/50 Blend (S&P 500/BCIGC) – A blended benchmark consisting of 50% S&P 500 and 50% Barclays Capital Government/Credit Intermediate indices.
HFRI Fund of Funds Composite Index - The HFRI Fund Weighted Composite Index is comprised solely of hedge funds and is comprised of eight strategies:convertible arbitrage; distressed securities; equity hedge; equity market neutral; event driven; macro; merger arbitrage; and relative value arbitrage.
MSCI China – This index consists of a range of country, composite, domestic and non-domestic indices including: MSCI China A Index , MSCI All China Index, MSCIOverseas China Index, MSCI International China Index, and the MSCI Golden Dragon Index.
Nikkei 225 – This is a price-weighted index comprised of Japan's top 225 blue-chip companies on the Tokyo Stock Exchange.
DAX – The German Stock Index is a total return index of 30 selected German blue chip stocks traded on the Frankfurt Stock Exchange.
CAC 40 – The CAC 40 Index is a narrow-based, modified capitalization-weighted index of 40 companies listed on the Paris Bourse.
Shanghai Composite – The Shanghai Stock Exchange Composite Index is a capitalization-weighted index. The index tracks the daily price performance of all A-sharesand B-shares listed on the Shanghai Stock Exchange.
The indices are unmanaged and not available for direct investment.
Wells Fargo Securities is the trade name for the capital markets and investment banking services of Wells Fargo & Company and its subsidiaries, includingWells Fargo Securities, LLC, member NYSE, FINRA, and SIPC.
WFALLC #0114-02775
Capital Markets ReviewFor Periods Ending December 31, 2013
Portfolio Evaluation March 31, 2014 Page 13
BOARD OF VISITORS OF THE COLLEGE
OF WILLIAM AND MARY IN VIRGINIA
ANNUAL BOARD MEETING Board Room - Blow Memorial Hall
April 25, 2014


Board of Visitors Resolution 12(R) April 23-25, 2014 Page 1 of 3
RICHARD BLAND COLLEGE
2014 CAMPUS MASTER PLAN:
BUILDING COMMUNITY BY TRANSFORMING PHYSICAL SPACE
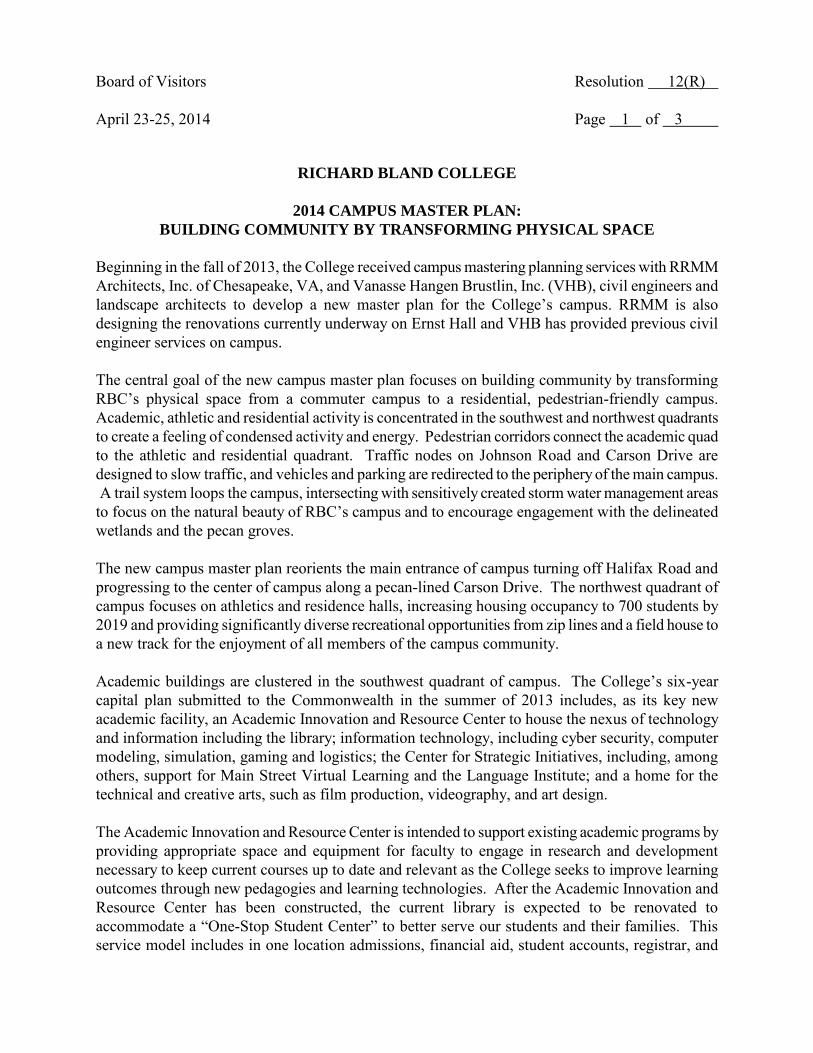
Beginning in the fall of 2013, the College received campus mastering planning services with RRMM Architects, Inc. of Chesapeake, VA, and Vanasse Hangen Brustlin, Inc. (VHB), civil engineers and landscape architects to develop a new master plan for the College’s campus. RRMM is also designing the renovations currently underway on Ernst Hall and VHB has provided previous civil engineer services on campus. The central goal of the new campus master plan focuses on building community by transforming RBC’s physical space from a commuter campus to a residential, pedestrian-friendly campus. Academic, athletic and residential activity is concentrated in the southwest and northwest quadrants to create a feeling of condensed activity and energy. Pedestrian corridors connect the academic quad to the athletic and residential quadrant. Traffic nodes on Johnson Road and Carson Drive are designed to slow traffic, and vehicles and parking are redirected to the periphery of the main campus. A trail system loops the campus, intersecting with sensitively created storm water management areas to focus on the natural beauty of RBC’s campus and to encourage engagement with the delineated wetlands and the pecan groves. The new campus master plan reorients the main entrance of campus turning off Halifax Road and progressing to the center of campus along a pecan-lined Carson Drive. The northwest quadrant of campus focuses on athletics and residence halls, increasing housing occupancy to 700 students by 2019 and providing significantly diverse recreational opportunities from zip lines and a field house to a new track for the enjoyment of all members of the campus community. Academic buildings are clustered in the southwest quadrant of campus. The College’s six-year capital plan submitted to the Commonwealth in the summer of 2013 includes, as its key new academic facility, an Academic Innovation and Resource Center to house the nexus of technology and information including the library; information technology, including cyber security, computer modeling, simulation, gaming and logistics; the Center for Strategic Initiatives, including, among others, support for Main Street Virtual Learning and the Language Institute; and a home for the technical and creative arts, such as film production, videography, and art design. The Academic Innovation and Resource Center is intended to support existing academic programs by providing appropriate space and equipment for faculty to engage in research and development necessary to keep current courses up to date and relevant as the College seeks to improve learning outcomes through new pedagogies and learning technologies. After the Academic Innovation and Resource Center has been constructed, the current library is expected to be renovated to accommodate a “One-Stop Student Center” to better serve our students and their families. This service model includes in one location admissions, financial aid, student accounts, registrar, and
Board of Visitors Resolution 12(R) April 23-25, 2014 Page 2 of 3 student support services. Linked physically to the Student Commons, it will create a full-service student center appropriately positioned in the midst of the academic, athletic and social spaces of our campus. The new campus master plan calls for the east side of campus to “go green,” improving the health of our pecan groves in the northeast quadrant, providing a focus on environmental sustainability, and developing space for new programs in agri-business, equine therapy, and the like, perhaps in collaboration with other colleges and universities. This incredibly beautiful campus holds many opportunities for future growth and programming to align with the goals of RBC-19, our current strategic plan, and to build for the future. At the February 2014 meeting, the Richard Bland College Committee of the William and Mary Board of Visitors were provided an in-depth presentation on the intentions of the new campus master plan by RRMM Architects, VHB, and Richard Bland College administrators to seek feedback to move forward with the plan. The new campus master plan has been shared with college constituents to include the Richard Bland College Foundation. BE IT RESOLVED, That the Board of Visitors hereby endorses and adopts the new campus master plan, dated January 2014, and directs the College administration to oversee implementation and ensure compliance with the plan.

5
Rich
ard
Blan
d Co
llege
Site
Con
cept
Pla
n
0 20
0
400
Fee
t
2
2
2 2
2
2
3
3
4
4
5 6 7 8 9 10
11 12 13 14 15 16 17
6 7
8 9
10
1112
13
14
15
16
17
17
17
17
17
A
B
B
C
C
D
D
E
E
F
F
G H
H
I
I
J
J
18G
atew
ay S
igna
ge
19Ve
rtic
al E
lem
ent/
Scul
ptur
e
20Tr
ail
20
20
18
19 18
19
KW
ater
Tow
er
KM
aze
Hal
l
1819
G
2
LCe
nter
for S
tude
nt A
!airs
(CSA
)
21Sp
orts
Sto
rage
21
L
Roun
d-a-
bout
1
1
1
1
1
Park
ing
- 1,7
00 C
ars
Ove
rall
Bus S
top
Out
door
Am
phith
eate
r
New
Fie
ld H
ouse
Acad
emic
Res
ourc
e an
d In
nova
tion
Cent
erFu
ture
Aca
dem
ic
Build
ing
(Pla
ceho
lder
)
PRO
POSE
D
Agric
ultu
re B
uild
ing/
Barn
Futu
re P
addo
ck
Futu
re F
ence
d Pa
stur
e
New
Res
iden
ce H
alls
New
Trac
k an
d Fi
eld
w/G
rand
stan
dPr
actic
e Fi
elds
Bask
etba
ll Co
urts
Volle
ybal
l Cou
rt
Rope
s/Ch
alle
nge
Cour
se
Stor
mw
ater
Man
agem
ent
EXIS
TIN
GLi
brar
y/D
inin
g/Lo
unge
- Re
nova
tion
AM
cNee
r Hal
l Sci
ence
& Te
chno
logy
Bui
ldin
g
Erns
t Hal
l
Stat
esm
an H
all -
Gym
Patr
iot/
Free
dom
Hal
l - R
esid
ence
Pede
stria
n N
ode
Hum
aniti
es/S
ocia
l Sci
ence
/Sta
! O
"ce
Bui
ldin
g
Soft
ball
Fiel
d
Tenn
is Co
urts
Bask
etba
ll Co
urt
Wet
land
W
Futu
re A
cade
mic
Expa
nsio
n
Peca
nG
rove
1
Johnson Road (State Route 608)
Cars
on D
rive
(Sta
te R
oute
677
)
Halifax Road (State Route 604)
Imag
ery
Sour
ce: E
sri,
Dig
italG
lobe
, Geo
Eye,
i-cu
bed,
USD
A, U
SGS,
AEX
, G
etm
appi
ng, A
erog
rid, I
GN
, IG
P, sw
issto
po, a
nd th
e G
IS U
ser C
omm
unity
.
Janu
ary
2014
Board of Visitors April 23-25, 2014
Resolution 12 Page 3 of 3


Board of Visitors Resolution 18(R) April 23-25, 2014 Page 1 of 1 COLLEGE OF WILLIAM AND MARY
DESIGNATED PROFESSORSHIPS
The following members of the Instructional Faculty of the College of William and Mary have been recommended for designated professorships.
BE IT RESOLVED, That upon recommendation of the President, the Board of Visitors of the College of William and Mary approves the designated professorships for the following members of the Faculty of the College, effective with the 2014-2015 academic year:
LIZABETH A. ALLISON, Chancellor Professor of Biology JOSHUA GERT, Francis S. Haserot Professor of Philosophy G. SCOTT GIBSON, J. Edward Zollinger Professor of Business RAJIV KOHLI, John N. Dalton Memorial Professor of Business PAUL F. MANNA, Paul R. Verkuil Associate Professor of Public Policy DEBORAH D. MORSE, Vera W. Barkley Term Professor of English CAROL SHERIFF, William E. Pullen Professor of American History KIMBERLY J. SMITH, Chancellor Professor of Business DEBORAH K. STEINBERG, CSX Professor of Marine Science EUGENE R. TRACY, Alfred Ritter Term Professor of Physics


Board of Visitors Resolution 47 April 23-25, 2014 Page 1 of 1
COLLEGE OF WILLIAM AND MARY
RESOLUTION TO APPROVE CAPITAL PROJECT:
RENOVATE ZABLE STADIUM
Whereas, in March of 2013, the College received the Governor’s request that each agency
and institution develop a Capital Outlay Plan for the 2014-2020 biennia, and the College complied with that request, resulting in the 2014-2020 Capital Outlay Six Year Plan, which was approved by the Board in April 2013, and submitted to the Department of Planning and Budget over the spring and summer of 2013; and
Whereas, the College’s Board of Visitors has the authority to approve non-general fund, non-debt capital projects in accordance with Subchapter 3, (§23.38.91 et seq.) of the Restructured Higher Education Administrative and Operations Act, Chapter 4.10 (§23-38.88 et seq.) of Title 23 of the Code of Virginia, effective July 1, 2006 (the “Act”); and
Whereas, the College’s Board of Visitors may authorize a new non-general fund capital
project regardless of the Commonwealth’s biennial calendar and process; and
Whereas, the College seeks Board authorization to create a non-general fund capital project for the renovation and improvement of Zable Stadium to address significant facility deficiencies;
THEREFORE, BE IT RESOLVED, That the Board of Visitors of The College of William and Mary in Virginia approves the creation of capital project 204-90005, Renovate Zable Stadium.
BE IT FURTHER RESOLVED, That the Board authorizes the Vice President for
Administration to take all actions necessary to initiate, implement and complete the project in accordance with the College’s restructured authority under the Act.
Board of Visitors Resolution 48 April 25, 2014 Page 1 of 1
APPOINTMENT OF FACULTY REPRESENTATIVES TO STANDING COMMITTEES OF THE BOARD OF VISITORS
WHEREAS, in April 2004 the Board of Visitors approved the appointment of a full-time faculty
member from among the former presidents of the William and Mary Faculty Assembly to the
position of a non-voting, advisory representative on the Board of Visitors; and
WHEREAS, the Board of Visitors faculty representative is invited to attend and participate in
most of the Board of Visitors committee meetings, and in 2013 was officially made a member of
the Committee on Academic Affairs; and
WHEREAS, the Rector meets on a regular basis with the President and Vice President of the
Faculty Assembly; and
WHEREAS, the Executive Committee of the Faculty Assembly has recently requested additional
faculty representation on Board standing committees, specifically Administration, Buildings and
Grounds; Athletics; Alumni Relations; and Financial Affairs; and
WHEREAS, the Rector, the President and the Provost have determined that faculty participation
and expertise on these committees would be helpful and welcome;
WHEREAS, the Faculty Assembly Executive Committee recognizes that a faculty member serving
on these committees would be a non-voting member and would be excused from closed
sessions dealing with personnel or legal matters, or any other issue as determined by the chair
of the respective committee;
THEREFORE, BE IT RESOLVED, That annually the Rector of the College, in consultation with the
President and Provost of William and Mary and the Chair of the Committee on Academic
Affairs, shall appoint a full-time faculty member, who has first been nominated by the William
and Mary Faculty Assembly Executive Committee, to the position of a non-voting, faculty
representative to the Committee on Administration, Buildings and Grounds; the Committee on
Athletics; the Committee on Alumni Relations; and the Committee on Financial Affairs, with the
understanding that no faculty member may serve on more than one committee; and
BE IT FURTHER RESOLVED, That such faculty representatives shall be eligible to serve two
consecutive one-year terms so long as they remain full-time instructional faculty members; in
the event a faculty representative is not able to complete a one-year term, the Rector, acting in
concert with the President, will appoint a replacement; and
BE IT FINALLY RESOLVED, That the Board of Visitors of the College of William and Mary hereby
approves the appointment of such faculty representatives effective with the 2014-2015
academic year.
Board of Visitors Resolution 49 April 25, 2014 Page 1 of 2
RESOLUTION ESTABLISHING THE ACADEMIC REGALIA TO BE WORN BY THE PRESIDENT
OF THE COLLEGE OF WILLIAM AND MARY IN VIRGINIA
WHEREAS, in 1990, the distinctive Board of Visitors regalia, the gift of a private donor, was first
worn. The gown is an open-front robe, patterned after those used at Oxford University, with
the gown body in dark Kelly green, dark green sleeve bars and front panels of dark green velvet
on which the William and Mary cipher – the intertwined W and M – is embroidered in gold; and
WHEREAS, in 1993, with the election of The Rt. Hon. The Baroness Thatcher as the twenty-first
chancellor, and to commemorate the tercentenary of the university, the Chancellor’s academic
regalia was redesigned and revised to be a robe of green silk damask with cape collar and panel
sleeves; trimmed with gold oak leaf lace, with the College coat of arms displayed on the cape
collar; and.
WHEREAS, the College has also adopted distinctive doctoral regalia consisting of a Kelly green
robe, with three chevrons on the sleeve piped with the appropriate color of the degree, and a
black velvet tam, which was first worn by graduates at Commencement 2002. With an open
front in the tradition of the British universities, the piping surrounding the chevrons identifies
the degree conferred. The William and Mary cipher with crown is embroidered in gold on the
front panels, which are black velvet; and
WHEREAS, as of 2009, undergraduate robes are black with a green strip on the sleeve;
undergraduate regalia consists of a robe, a cap, a tassel and a hood with colors indicating the
graduate's degree; and
WHEREAS, Presidential regalia is unique among academic vestments in that it symbolizes the
president’s rank and authority as the chief official of the institution, rather than reflecting an
individual’s academic credentials. University presidents wear their distinctive regalia when
participating in official university ceremonies and convocations. There are four velvet chevrons
on the sleeves of presidential regalia whereas standard doctor’s robes feature only three.
While past practice has been for each William & Mary president to wear the robe of his own
alma mater, several members of the Board of Visitors and members of the William & Mary
community have suggested that the President of the College of William & Mary also wear
special academic regalia; and
WHEREAS, the President’s robe is an open-front Jefferson style robe in dark green with black
velvet panels and four sleeve bars; the panels and sleeve bars are trimmed with bright gold
cord and the William & Mary cipher and crown is embroidered in goldenrod on the panels.

Board of Visitors Resolution 49 April 25, 2014 Page 2 of 2
THEREFORE, BE IT RESOLVED, That the official regalia for the President of the College shall be
worn at all official College convocations, inaugurations and special occasions at which the
President represents the College of William and Mary.
Board of Visitors Resolution 50 April 25, 2014 Page 1 of 1 APPROVAL OF CONTINUED APPOINTMENT AND AMENDED CONTRACT OF EMPLOYMENT
The Board of Visitors of The College of William and Mary in Virginia formalized the appointment of the 4th President of Richard Bland College in the form of a contract of employment adopted on April 4, 2012.
Debbie L. Sydow has served Richard Bland College as its President with honor and distinction. The Board of Visitors believes it is in the best interest of the College to ensure the continued leadership of President Sydow, and expresses its appreciation to her for outstanding service to Richard Bland and to the Commonwealth of Virginia.
THEREFORE, BE IT RESOLVED, That the Board of Visitors of the College of William and Mary hereby delegates to the Rector of the College authority to amend the contract with President Sydow dated April 24, 2012, to adjust the provisions and duration of the Agreement through June 30, 2019.