Embed Size (px)
Citation preview
Work Sessions: Families & Education Levy Update / Series 1000 Policies Discussion / Budget
Wednesday, March 25, 2015, 4:30 PM – 8:00 PM Auditorium, John Stanford Center
Agenda
1. Call to order 4:30 PM
2. Work Sessions:
A. Families & Education Levy Update - Presentation
o 2013-14 Levy Budget Plan o Levy Outcome Funding Framework o Summary of second-year implementation, results, and course
corrections for K-12 Levy investment areas: Elementary Innovation Middle School Innovation/Linkage High School Innovation
B. Series 1000 Policies Discussion 5:30 PM*
o Policy No. 1400, Meeting Conduct, Order of Business & Quorum o Policy No. 1640, Responsibilities & Authority of the Superintendent o Policy No. 1620, Board-Superintendent Relationship
i. Board Procedure 1620BP 1. Policy connection to Communications Protocol and Board
Code of Conduct o Policy No. 1310, Policy Adoption & Suspension; Manuals &
Superintendent Procedures i. Superintendent Procedure 1310SP
o Policy No. 1610, Conflicts of Interest o Policy No. 1732, Board Member Insurance
C. Budget - Presentation (slides #20-22, 25, 26 & 29 edited) 6:30 PM*
o Superintendent’s Opening Remarks o FY14-15 Operating Budget Status o State Legislative Session Status o FY15-16 Budget Development Calendar o FY15-16 Operating Budget Status
Enrollment Projection Operating Budget GAP Status
Board special meeting
2445 – 3rd
Avenue South, Seattle WA 98134
Central Planning Process Status School Funding Model Weighted Staffing Standards (WSS)
Funding Model Update o FY15-16 Capital Fund Presentation o Appendix
3. Adjourn 8:00 PM
(*times given are estimated)
Department of Education and Early LearningFamilies and Education Levy
2013-14 Annual Report
Seattle Public SchoolsMarch 25, 2015
2013-14 Families and Education Levy Annual Report Presentation1
Presentation Overview
2013-14 Families and Education Levy Annual Report Presentation2
2013-14 Levy Budget Plan
Levy Outcome Funding Framework
Summary of second-year implementation, results, and course corrections for K-12 Levy investment areas:
Elementary Innovation Middle School Innovation/Linkage High School Innovation

2013-14 Levy Budget Plan
2013-14 Families and Education Levy Annual Report Presentation3
Note: School‐ and Community‐Based Family Support funds are represented within Elementary. Summer Learning funds are represented in the Elementary, Middle, and High School areas.
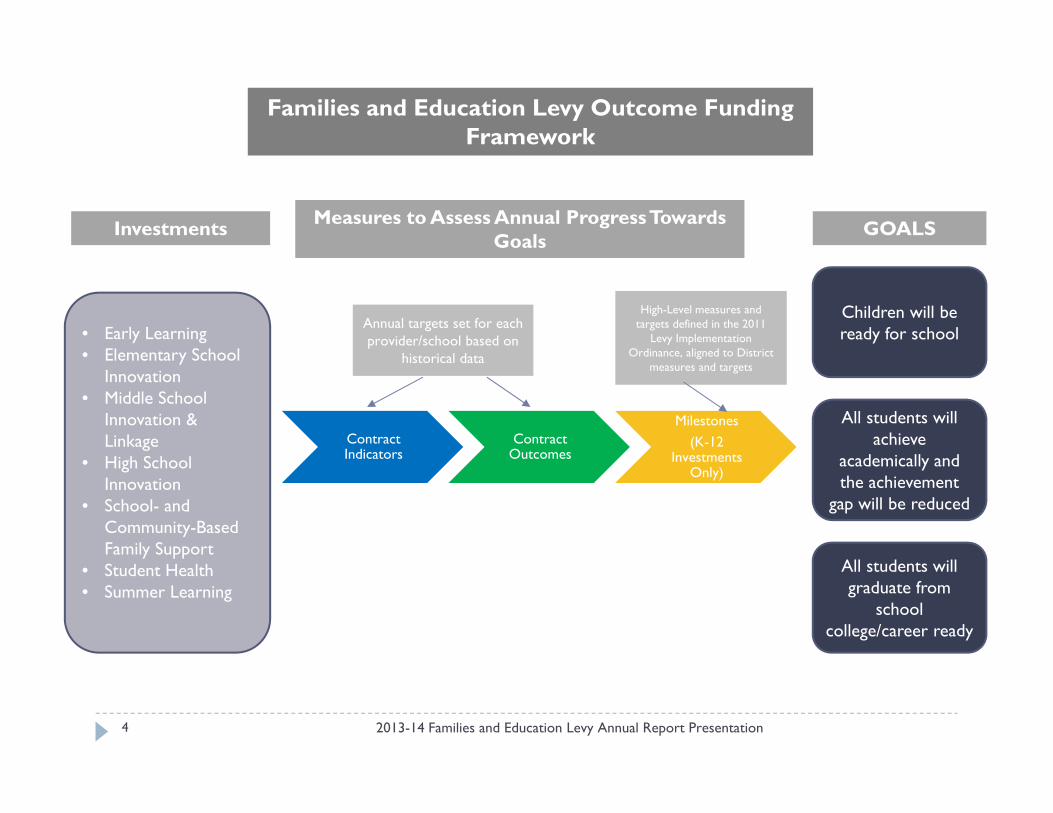
Children will be ready for school
All students will achieve
academically and the achievement
gap will be reduced
All students will graduate from
school college/career ready
• Early Learning• Elementary School
Innovation• Middle School
Innovation & Linkage
• High School Innovation
• School- and Community-Based Family Support
• Student Health• Summer Learning
GOALSMeasures to Assess Annual Progress Towards Goals
Investments
Families and Education Levy Outcome Funding Framework
2013-14 Families and Education Levy Annual Report Presentation4
Contract Indicators
Contract Outcomes
Milestones(K-12
Investments Only)
Annual targets set for each provider/school based on
historical data
High-Level measures and targets defined in the 2011
Levy Implementation Ordinance, aligned to District
measures and targets
K-12 School Investments Program Overviews
2013-14 Families and Education Levy Annual Report Presentation5
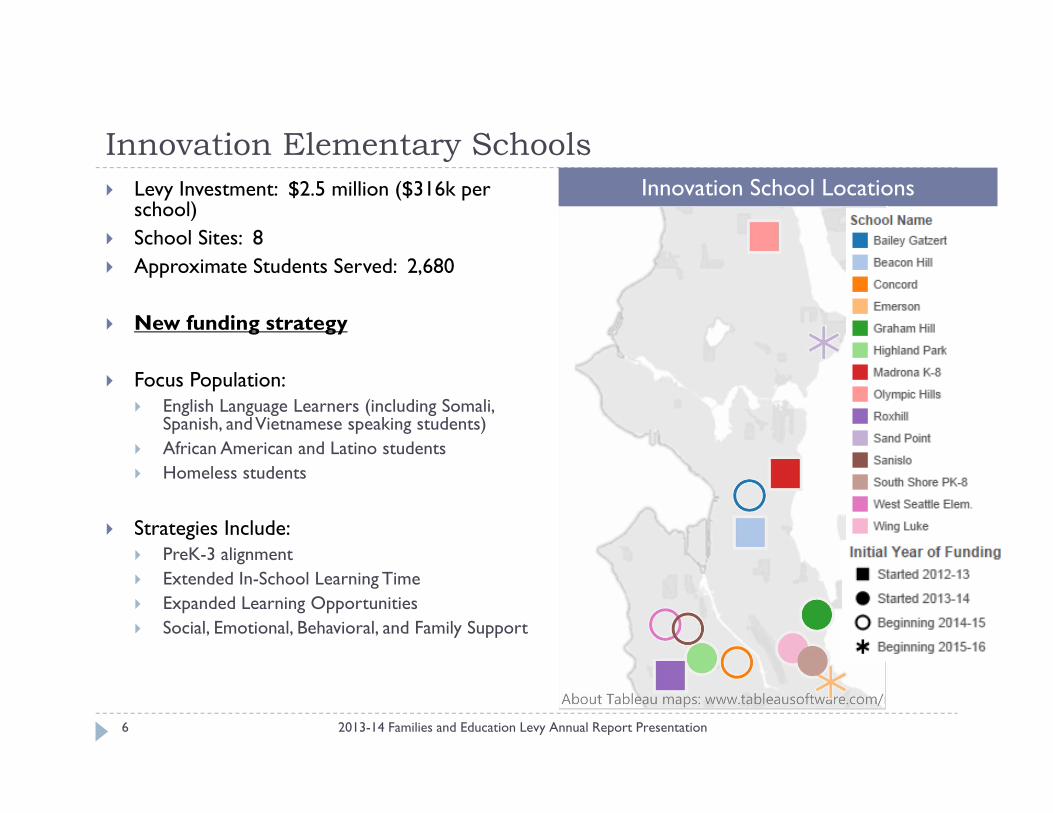
Innovation Elementary Schools
2013-14 Families and Education Levy Annual Report Presentation6
Levy Investment: $2.5 million ($316k per school)
School Sites: 8 Approximate Students Served: 2,680
New funding strategy
Focus Population: English Language Learners (including Somali,
Spanish, and Vietnamese speaking students) African American and Latino students Homeless students
Strategies Include: PreK-3 alignment Extended In-School Learning Time Expanded Learning Opportunities Social, Emotional, Behavioral, and Family Support
Innovation School Locations
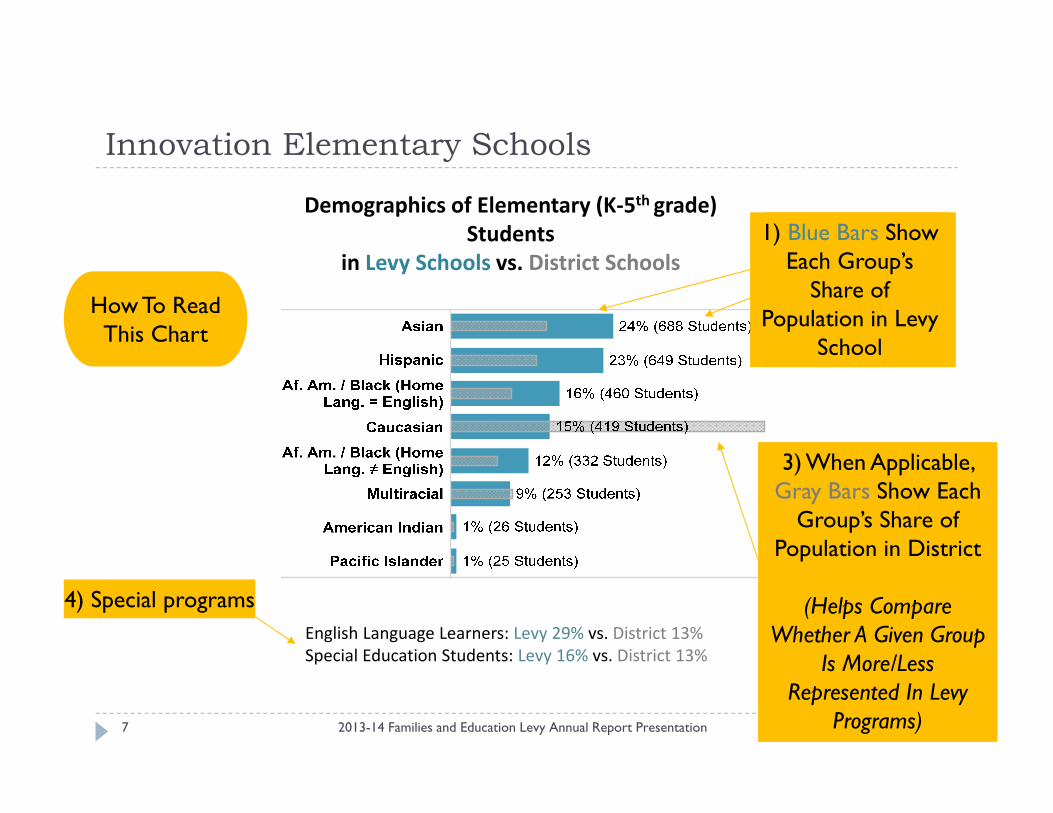
Innovation Elementary Schools
2013-14 Families and Education Levy Annual Report Presentation7
Demographics of Elementary (K‐5th grade) Students
in Levy Schools vs. District Schools
English Language Learners: Levy 29% vs. District 13%Special Education Students: Levy 16% vs. District 13%
How To Read This Chart
2) Number and Percent Describe Group’s Share of
Population in Levy School
3) When Applicable, Gray Bars Show Each
Group’s Share of Population in District
(Helps Compare Whether A Given Group
Is More/Less Represented In Levy
Programs)
4) Special programs
1) Blue Bars Show Each Group’s
Share of Population in Levy
School

Innovation Middle Schools
2013-14 Families and Education Levy Annual Report Presentation8
Levy Investment: $2.8 million ($480k to $560k per school)
School Sites: 5 Approximate Students Served: 4,390
Focus Population: Students not on grade level in math and
reading English Language Learners African American and Latino students
Strategies: Extended In-School Learning Time Expanded Learning Opportunities Social, Emotional, Behavioral, and Health
Support Family Involvement College and Career Readiness
Innovation School Locations
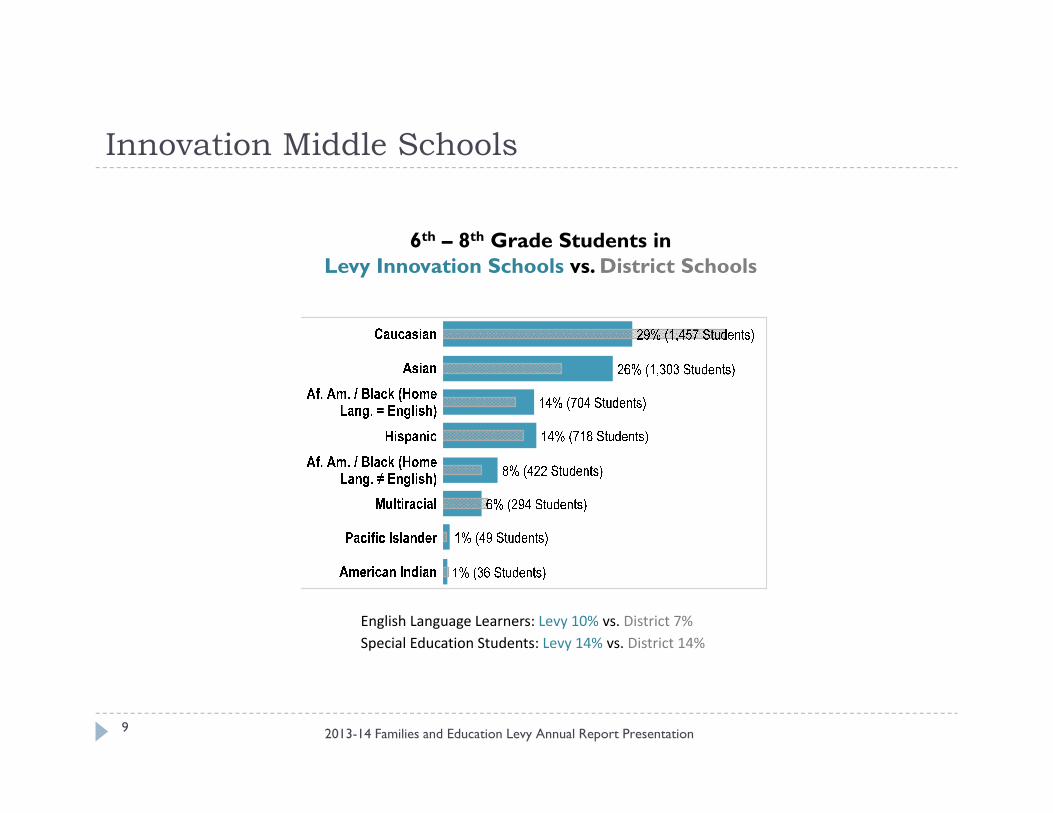
Innovation Middle Schools
2013-14 Families and Education Levy Annual Report Presentation9
6th – 8th Grade Students in Levy Innovation Schools vs. District Schools
English Language Learners: Levy 10% vs. District 7%Special Education Students: Levy 14% vs. District 14%
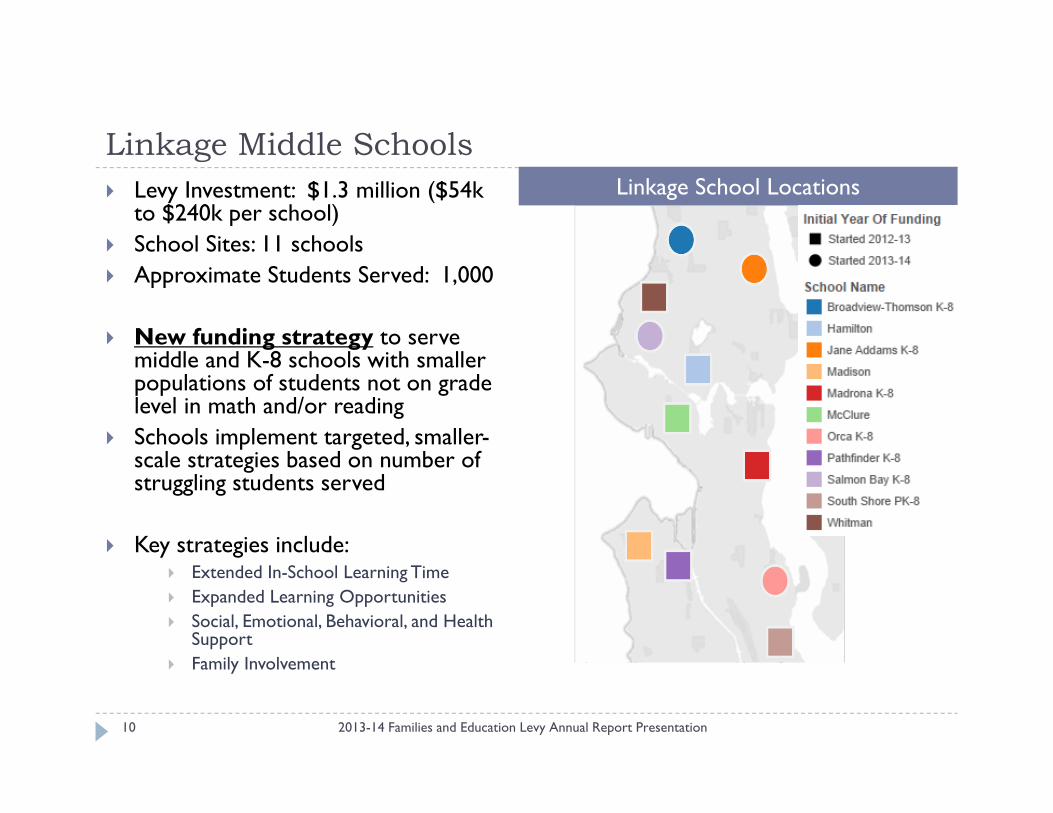
Linkage Middle Schools
2013-14 Families and Education Levy Annual Report Presentation10
Levy Investment: $1.3 million ($54k to $240k per school)
School Sites: 11 schools Approximate Students Served: 1,000
New funding strategy to serve middle and K-8 schools with smaller populations of students not on grade level in math and/or reading
Schools implement targeted, smaller-scale strategies based on number of struggling students served
Key strategies include: Extended In-School Learning Time Expanded Learning Opportunities Social, Emotional, Behavioral, and Health
Support Family Involvement
Linkage School Locations
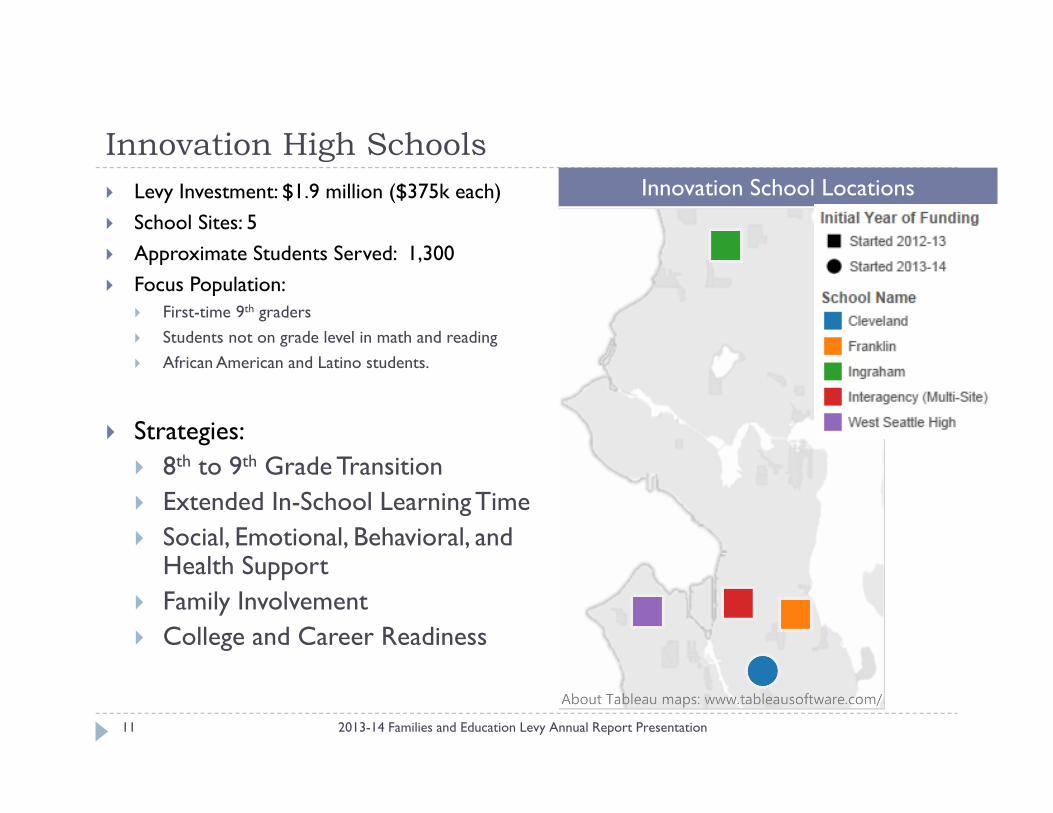
Innovation High Schools
2013-14 Families and Education Levy Annual Report Presentation11
Levy Investment: $1.9 million ($375k each) School Sites: 5 Approximate Students Served: 1,300 Focus Population:
First-time 9th graders Students not on grade level in math and reading African American and Latino students.
Strategies: 8th to 9th Grade Transition Extended In-School Learning Time Social, Emotional, Behavioral, and
Health Support Family Involvement College and Career Readiness
Innovation School Locations
Innovation High Schools
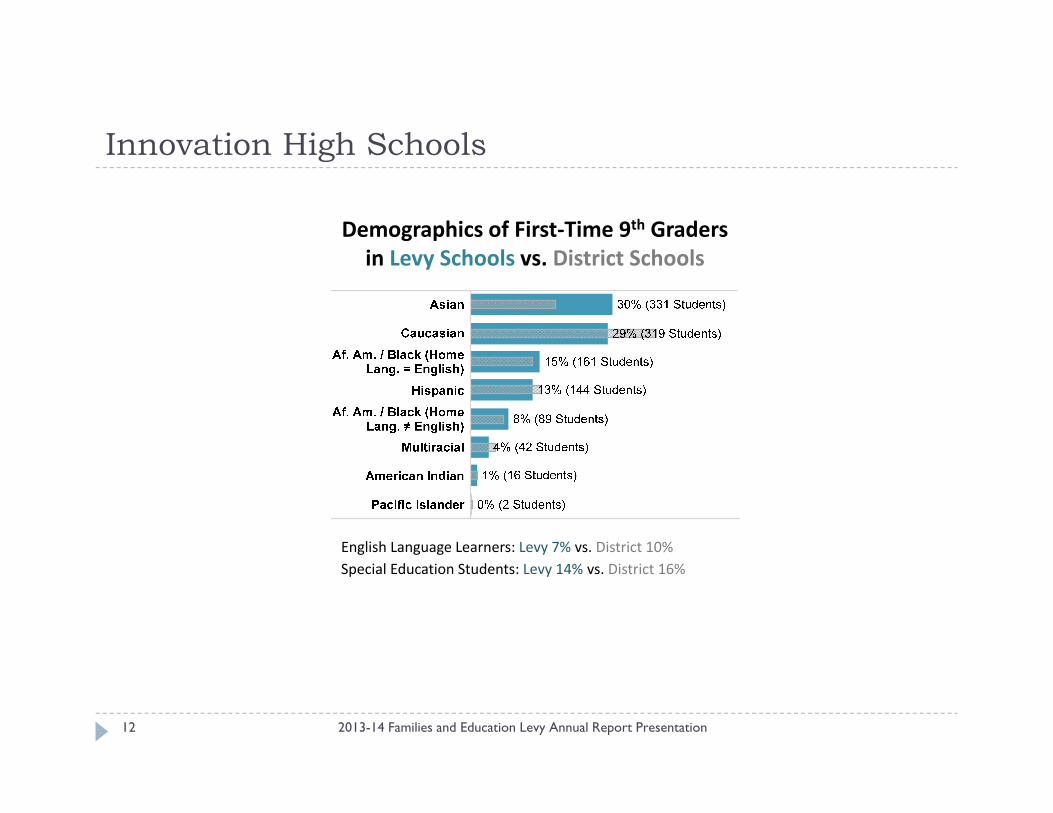
2013-14 Families and Education Levy Annual Report Presentation12
English Language Learners: Levy 7% vs. District 10%Special Education Students: Levy 14% vs. District 16%
Demographics of First‐Time 9th Gradersin Levy Schools vs. District Schools
K-12 Investment Results
2013-14 Families and Education Levy Annual Report Presentation13
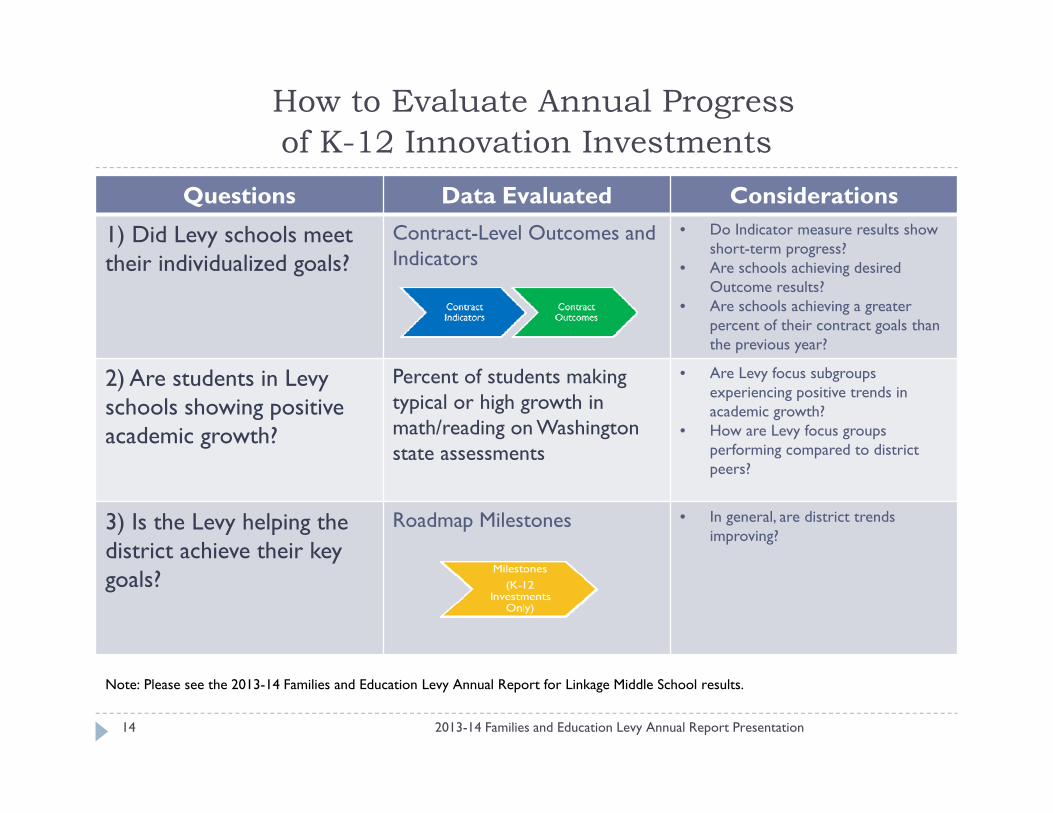
How to Evaluate Annual Progress of K-12 Innovation Investments
2013-14 Families and Education Levy Annual Report Presentation14
Questions Data Evaluated Considerations
1) Did Levy schools meet their individualized goals?
Contract-Level Outcomes and Indicators
• Do Indicator measure results show short-term progress?
• Are schools achieving desired Outcome results?
• Are schools achieving a greater percent of their contract goals than the previous year?
2) Are students in Levy schools showing positive academic growth?
Percent of students making typical or high growth in math/reading on Washington state assessments
• Are Levy focus subgroupsexperiencing positive trends in academic growth?
• How are Levy focus groups performing compared to district peers?
3) Is the Levy helping the district achieve their key goals?
Roadmap Milestones • In general, are district trends improving?
Note: Please see the 2013-14 Families and Education Levy Annual Report for Linkage Middle School results.
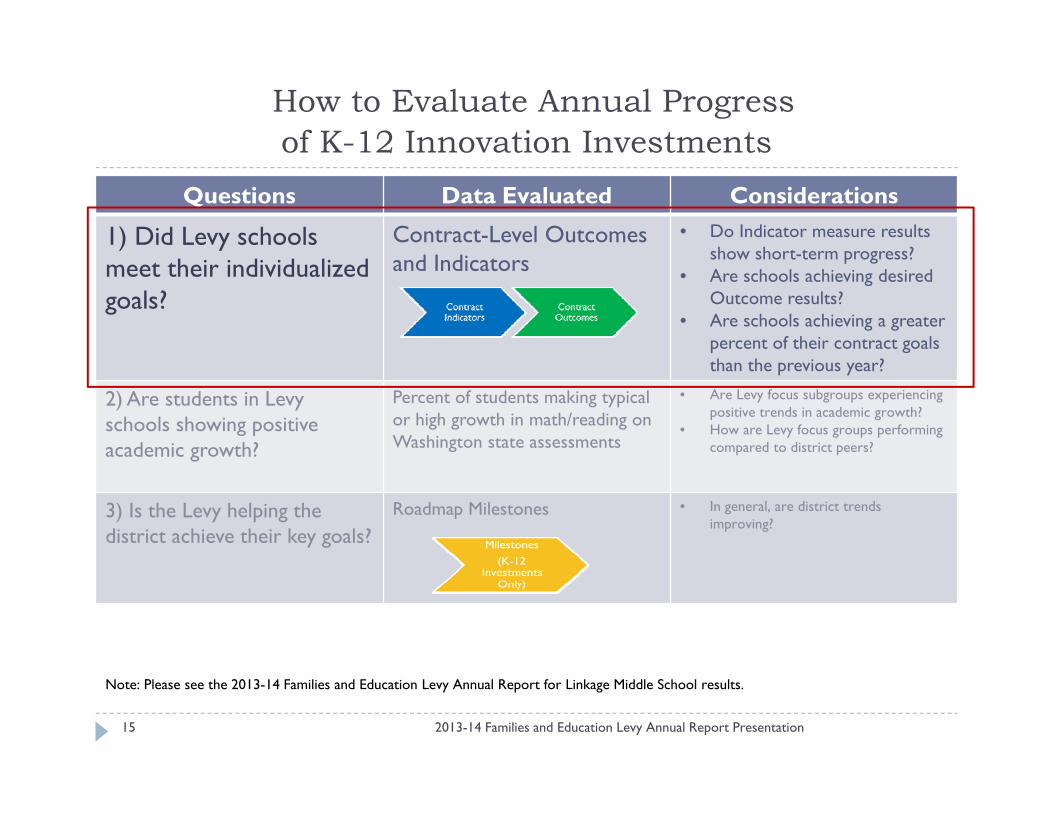
How to Evaluate Annual Progress of K-12 Innovation Investments
2013-14 Families and Education Levy Annual Report Presentation15
Questions Data Evaluated Considerations
1) Did Levy schools meet their individualizedgoals?
Contract-Level Outcomes and Indicators
• Do Indicator measure results show short-term progress?
• Are schools achieving desired Outcome results?
• Are schools achieving a greater percent of their contract goals than the previous year?
2) Are students in Levy schools showing positive academic growth?
Percent of students making typical or high growth in math/reading on Washington state assessments
• Are Levy focus subgroups experiencing positive trends in academic growth?
• How are Levy focus groups performing compared to district peers?
3) Is the Levy helping the district achieve their key goals?
Roadmap Milestones • In general, are district trends improving?
Note: Please see the 2013-14 Families and Education Levy Annual Report for Linkage Middle School results.
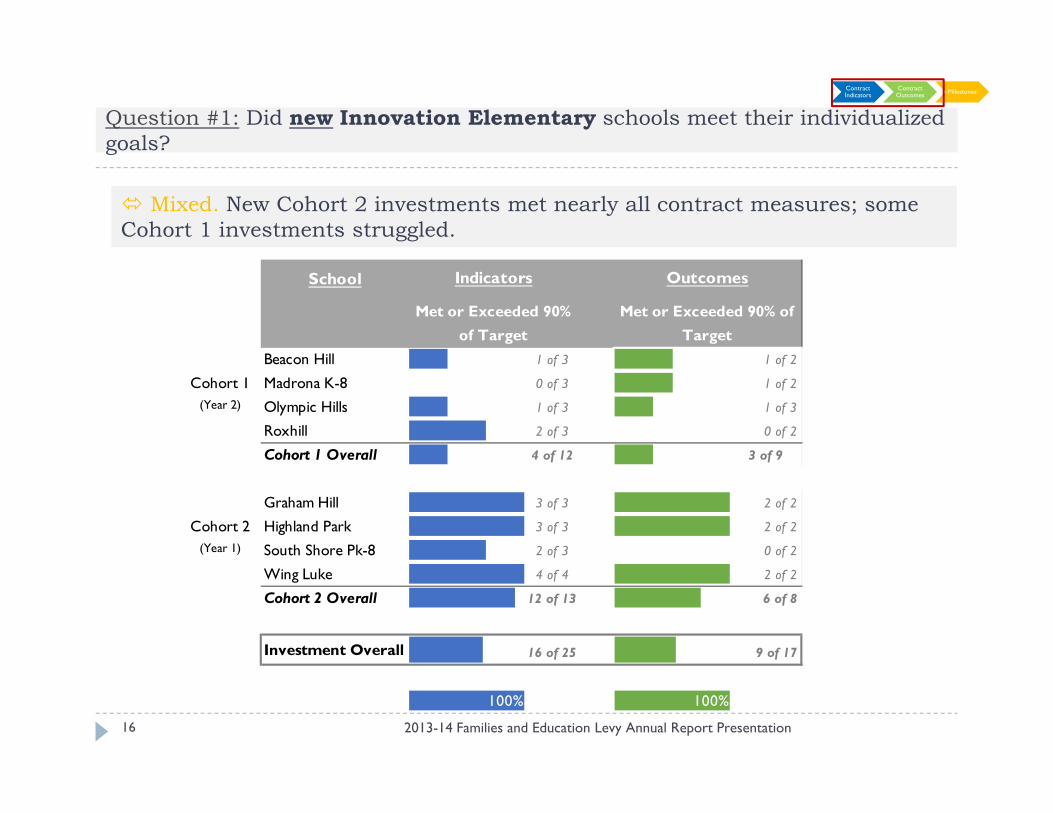
Question #1: Did new Innovation Elementary schools meet their individualized goals?
2013-14 Families and Education Levy Annual Report Presentation16
Contract Indicators
Contract Outcomes Milestones
Mixed. New Cohort 2 investments met nearly all contract measures; some Cohort 1 investments struggled.
School
Beacon Hill 33% 1 of 3 50% 1 of 2
Madrona K-8 0% 0 of 3 50% 1 of 2
Olympic Hills 33% 1 of 3 33% 1 of 3
Roxhill 67% 2 of 3 0 of 2
Cohort 1 Overall 33% 4 of 12 33% 3 of 9
Graham Hill 100% 3 of 3 100% 2 of 2
Highland Park 100% 3 of 3 100% 2 of 2
South Shore Pk-8 67% 2 of 3 0 of 2
Wing Luke 100% 4 of 4 100% 2 of 2
Cohort 2 Overall 92% 12 of 13 75% 6 of 8
Investment Overall 64% 16 of 25 53% 9 of 17
100% 100%
Outcomes
Met or Exceeded 90% of Target
Cohort 1(Year 2)
Cohort 2(Year 1)
Indicators
Met or Exceeded 90% of Target
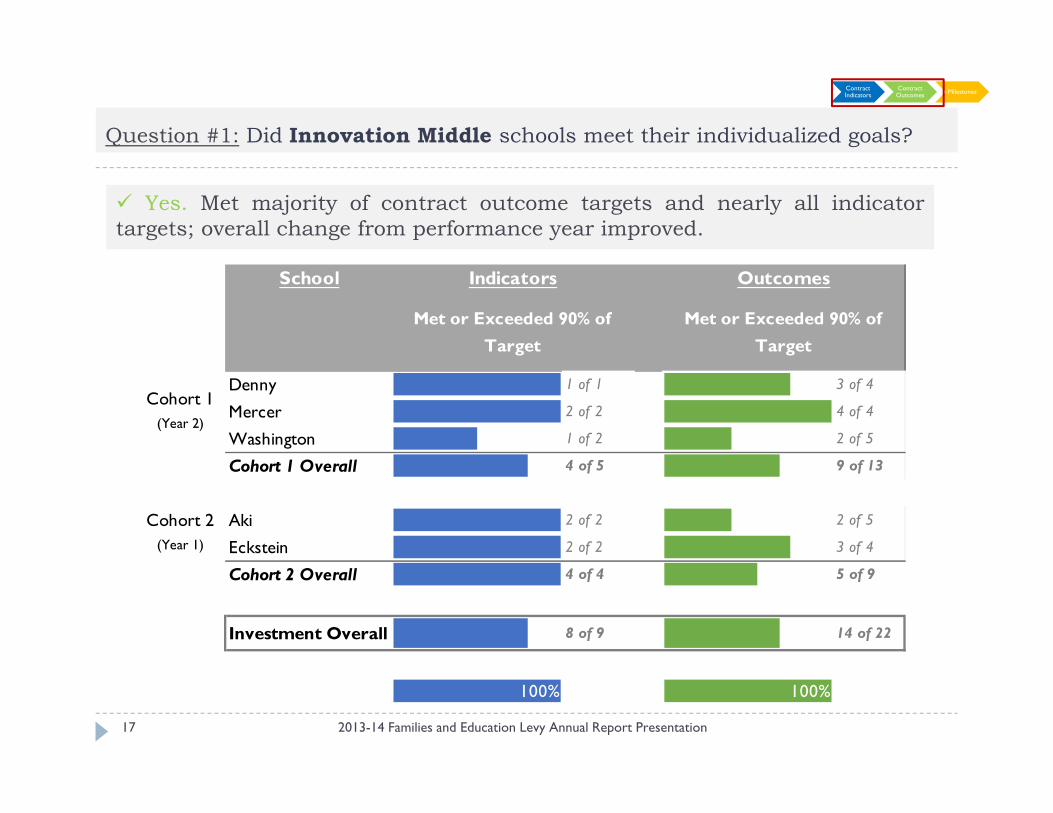
Yes. Met majority of contract outcome targets and nearly all indicatortargets; overall change from performance year improved.
2013-14 Families and Education Levy Annual Report Presentation17
Contract Indicators
Contract Outcomes Milestones
Question #1: Did Innovation Middle schools meet their individualized goals?
School
Denny 100% 1 of 1 75% 3 of 4
Mercer 100% 2 of 2 100% 4 of 4
Washington 50% 1 of 2 40% 2 of 5
Cohort 1 Overall 80% 4 of 5 69% 9 of 13
Aki 100% 2 of 2 40% 2 of 5
Eckstein 100% 2 of 2 75% 3 of 4
Cohort 2 Overall 100% 4 of 4 56% 5 of 9
Investment Overall 80% 8 of 9 69% 14 of 22
100% 100%
Indicators
Cohort 1(Year 2)
Cohort 2(Year 1)
Outcomes
Met or Exceeded 90% of Target
Met or Exceeded 90% of Target
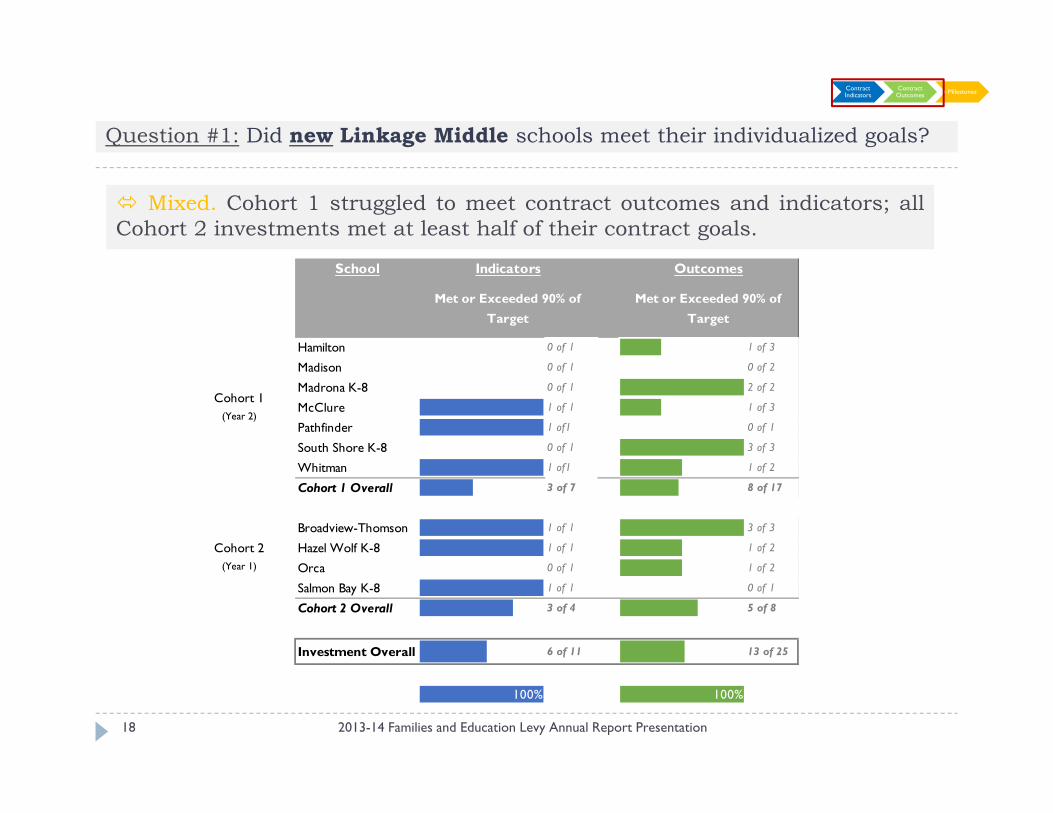
Mixed. Cohort 1 struggled to meet contract outcomes and indicators; allCohort 2 investments met at least half of their contract goals.
2013-14 Families and Education Levy Annual Report Presentation18
Contract Indicators
Contract Outcomes Milestones
Question #1: Did new Linkage Middle schools meet their individualized goals?
School
Hamilton 0% 0 of 1 33% 1 of 3
Madison 0% 0 of 1 0% 0 of 2
Madrona K-8 0% 0 of 1 100% 2 of 2
McClure 100% 1 of 1 33% 1 of 3
Pathfinder 100% 1 of1 0% 0 of 1
South Shore K-8 0% 0 of 1 100% 3 of 3
Whitman 100% 1 of1 50% 1 of 2
Cohort 1 Overall 43% 3 of 7 47% 8 of 17
Broadview-Thomson 100% 1 of 1 100% 3 of 3
Hazel Wolf K-8 100% 1 of 1 50% 1 of 2
Orca 0% 0 of 1 50% 1 of 2
Salmon Bay K-8 100% 1 of 1 0% 0 of 1
Cohort 2 Overall 75% 3 of 4 63% 5 of 8
Investment Overall 55% 6 of 11 52% 13 of 25
100% 100%
Cohort 2(Year 1)
Cohort 1(Year 2)
Indicators Outcomes
Met or Exceeded 90% of Target
Met or Exceeded 90% of Target
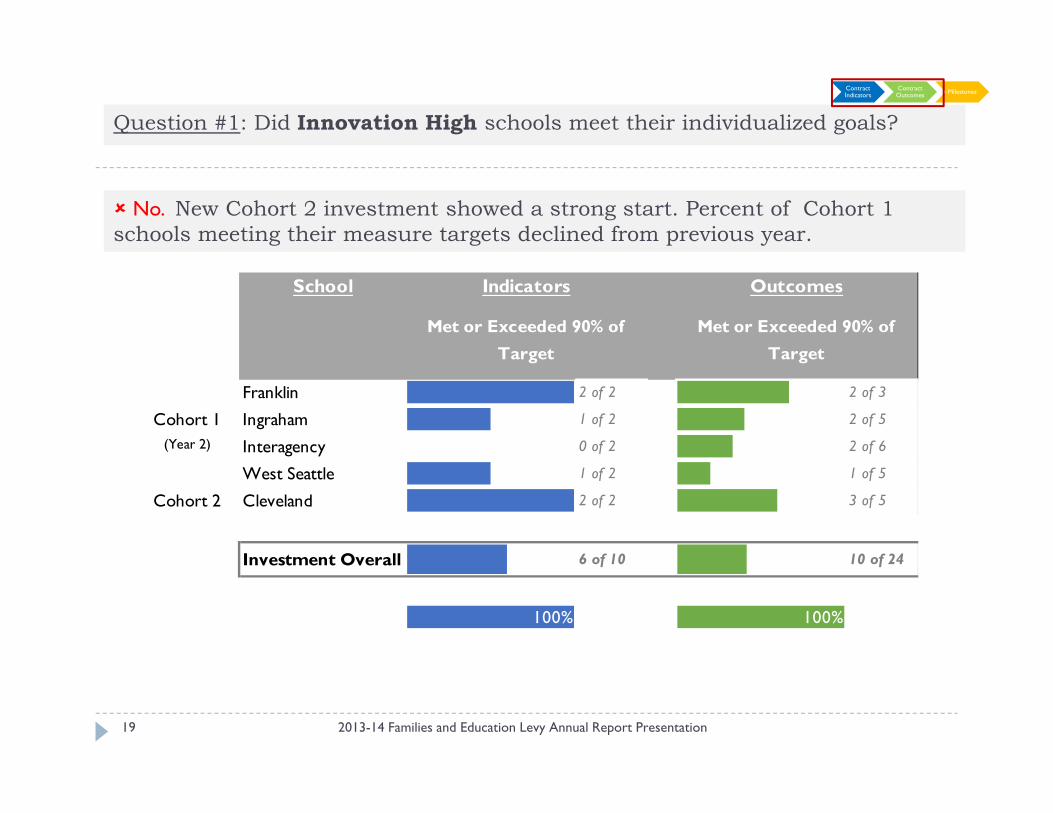
Question #1: Did Innovation High schools meet their individualized goals?
2013-14 Families and Education Levy Annual Report Presentation19
No. New Cohort 2 investment showed a strong start. Percent of Cohort 1 schools meeting their measure targets declined from previous year.
Contract Indicators
Contract Outcomes Milestones
School
Franklin 100% 2 of 2 67% 2 of 3
Ingraham 50% 1 of 2 40% 2 of 5
Interagency 0 of 2 33% 2 of 6
West Seattle 50% 1 of 2 20% 1 of 5
Cohort 2 Cleveland 100% 2 of 2 60% 3 of 5
Investment Overall 60% 6 of 10 42% 10 of 24
100% 100%
Cohort 1(Year 2)
Indicators Outcomes
Met or Exceeded 90% of Target
Met or Exceeded 90% of Target
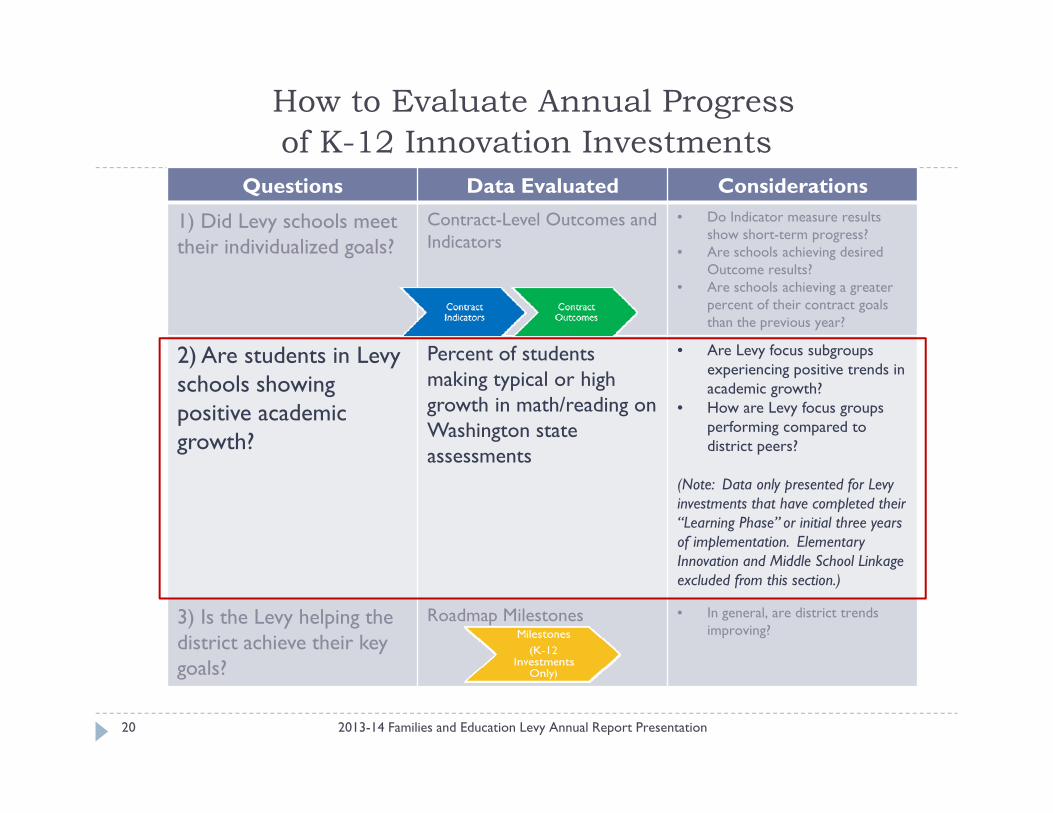
How to Evaluate Annual Progress of K-12 Innovation Investments
2013-14 Families and Education Levy Annual Report Presentation20
Questions Data Evaluated Considerations
1) Did Levy schools meet their individualized goals?
Contract-Level Outcomes and Indicators
• Do Indicator measure results show short-term progress?
• Are schools achieving desired Outcome results?
• Are schools achieving a greater percent of their contract goals than the previous year?
2) Are students in Levy schools showing positive academic growth?
Percent of studentsmaking typical or high growth in math/reading on Washington state assessments
• Are Levy focus subgroupsexperiencing positive trends in academic growth?
• How are Levy focus groups performing compared to district peers?
(Note: Data only presented for Levy investments that have completed their “Learning Phase” or initial three years of implementation. Elementary Innovation and Middle School Linkage excluded from this section.)
3) Is the Levy helping the district achieve their key goals?
Roadmap Milestones • In general, are district trends improving?
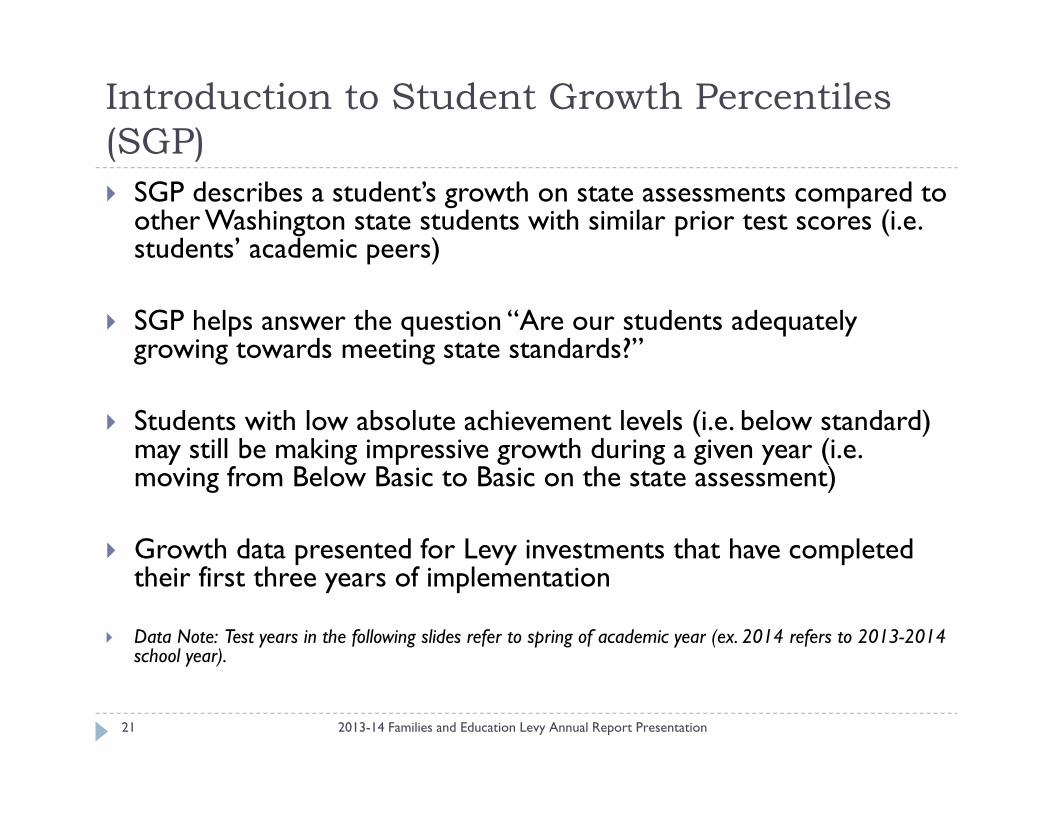
Introduction to Student Growth Percentiles (SGP)
2013-14 Families and Education Levy Annual Report Presentation21
SGP describes a student’s growth on state assessments compared to other Washington state students with similar prior test scores (i.e. students’ academic peers)
SGP helps answer the question “Are our students adequately growing towards meeting state standards?”
Students with low absolute achievement levels (i.e. below standard) may still be making impressive growth during a given year (i.e. moving from Below Basic to Basic on the state assessment)
Growth data presented for Levy investments that have completed their first three years of implementation
Data Note: Test years in the following slides refer to spring of academic year (ex. 2014 refers to 2013-2014 school year).
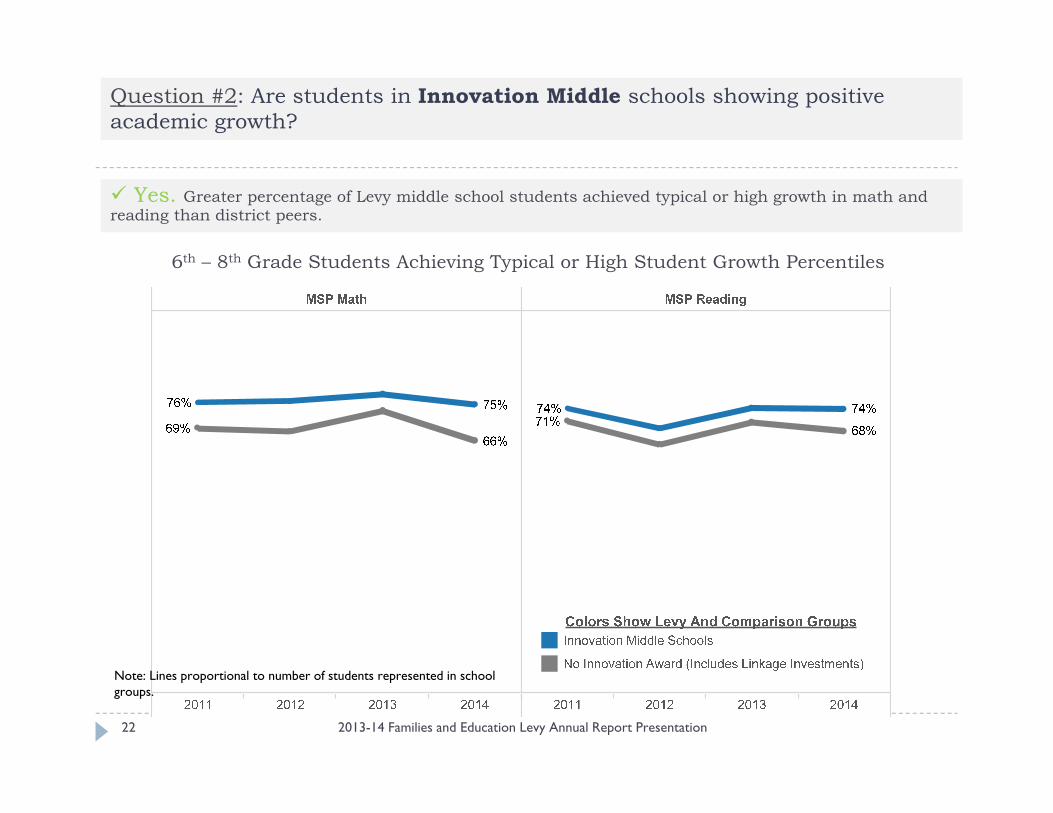
6th – 8th Grade Students Achieving Typical or High Student Growth Percentiles
Note: Lines proportional to number of students represented in school groups.
Question #2: Are students in Innovation Middle schools showing positive academic growth?
Yes. Greater percentage of Levy middle school students achieved typical or high growth in math and reading than district peers.
2013-14 Families and Education Levy Annual Report Presentation22
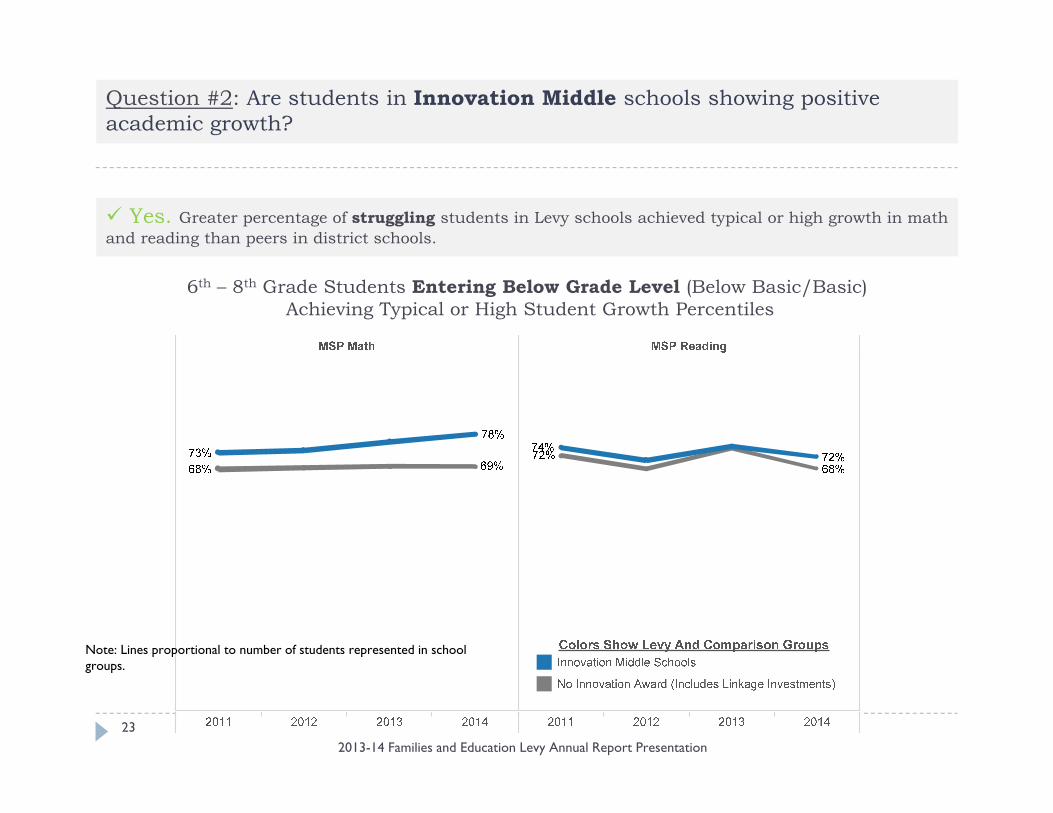
6th – 8th Grade Students Entering Below Grade Level (Below Basic/Basic)Achieving Typical or High Student Growth Percentiles
Note: Lines proportional to number of students represented in school groups.
Yes. Greater percentage of struggling students in Levy schools achieved typical or high growth in math and reading than peers in district schools.
Question #2: Are students in Innovation Middle schools showing positive academic growth?
2013-14 Families and Education Levy Annual Report Presentation23
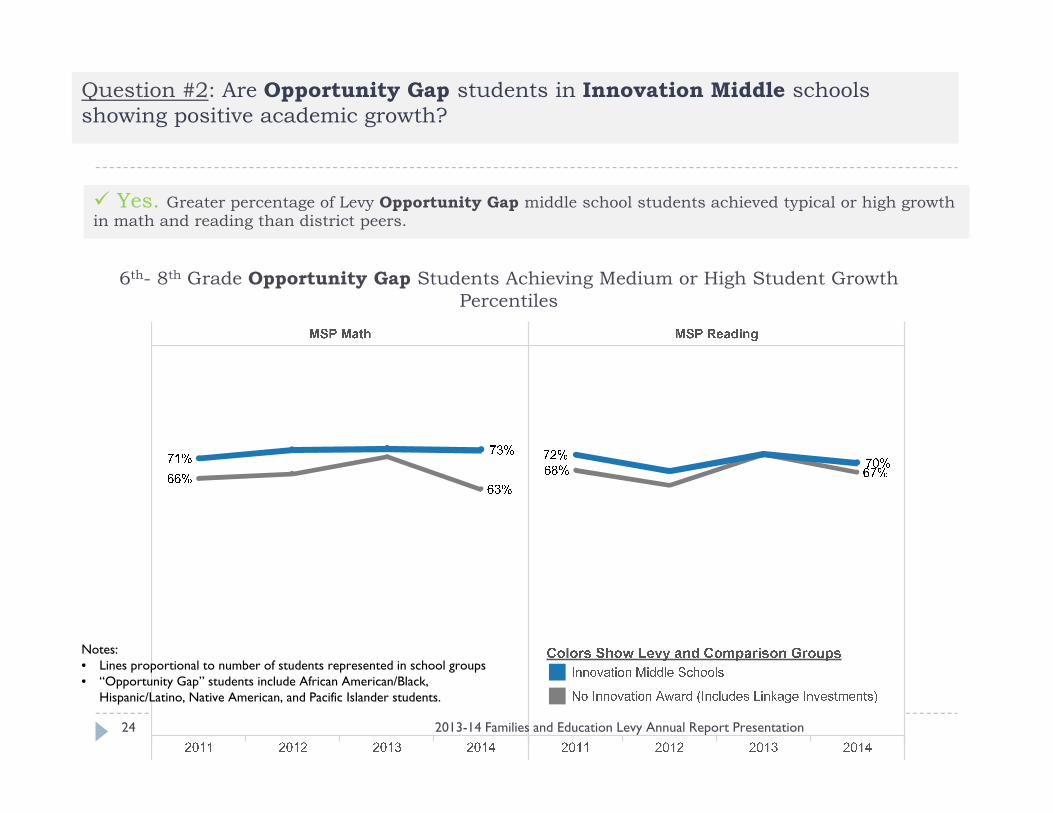
6th- 8th Grade Opportunity Gap Students Achieving Medium or High Student Growth Percentiles
Notes:• Lines proportional to number of students represented in school groups• “Opportunity Gap” students include African American/Black,
Hispanic/Latino, Native American, and Pacific Islander students.
Yes. Greater percentage of Levy Opportunity Gap middle school students achieved typical or high growth in math and reading than district peers.
Question #2: Are Opportunity Gap students in Innovation Middle schools showing positive academic growth?
24 2013-14 Families and Education Levy Annual Report Presentation
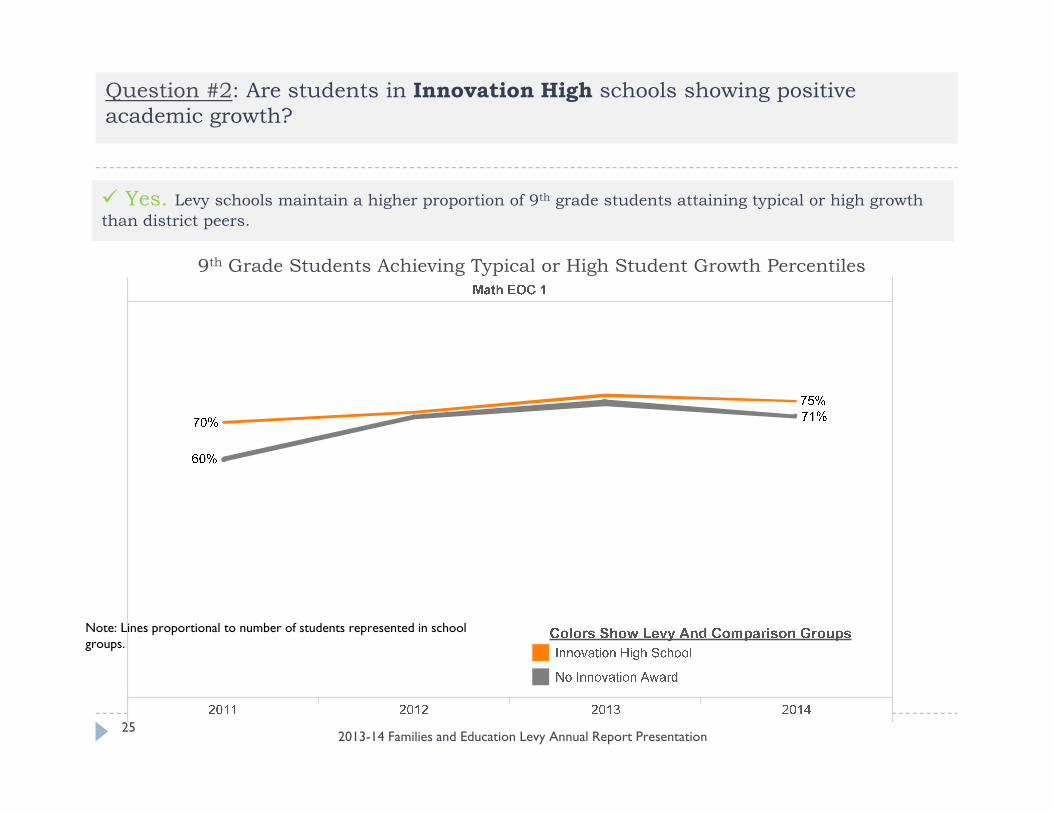
9th Grade Students Achieving Typical or High Student Growth Percentiles
Note: Lines proportional to number of students represented in school groups.
Yes. Levy schools maintain a higher proportion of 9th grade students attaining typical or high growth than district peers.
Question #2: Are students in Innovation High schools showing positive academic growth?
2013-14 Families and Education Levy Annual Report Presentation25
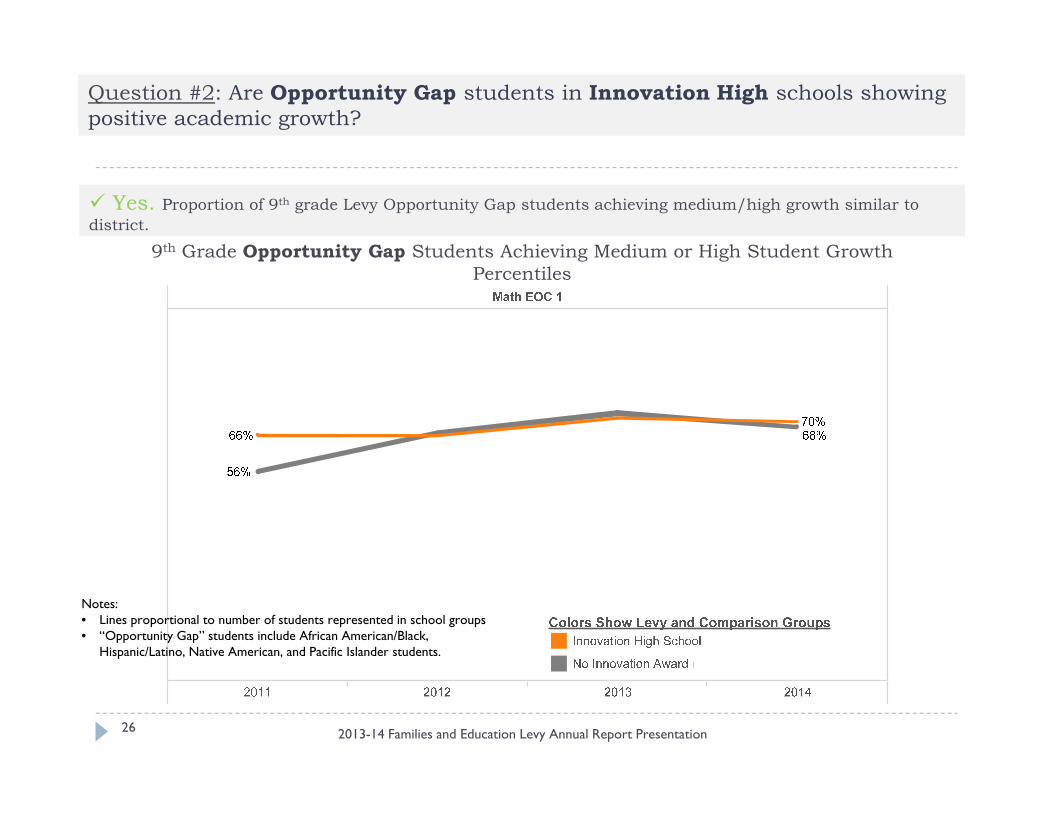
9th Grade Opportunity Gap Students Achieving Medium or High Student Growth Percentiles
Notes:• Lines proportional to number of students represented in school groups• “Opportunity Gap” students include African American/Black,
Hispanic/Latino, Native American, and Pacific Islander students.
Yes. Proportion of 9th grade Levy Opportunity Gap students achieving medium/high growth similar to district.
Question #2: Are Opportunity Gap students in Innovation High schools showing positive academic growth?
2013-14 Families and Education Levy Annual Report Presentation26
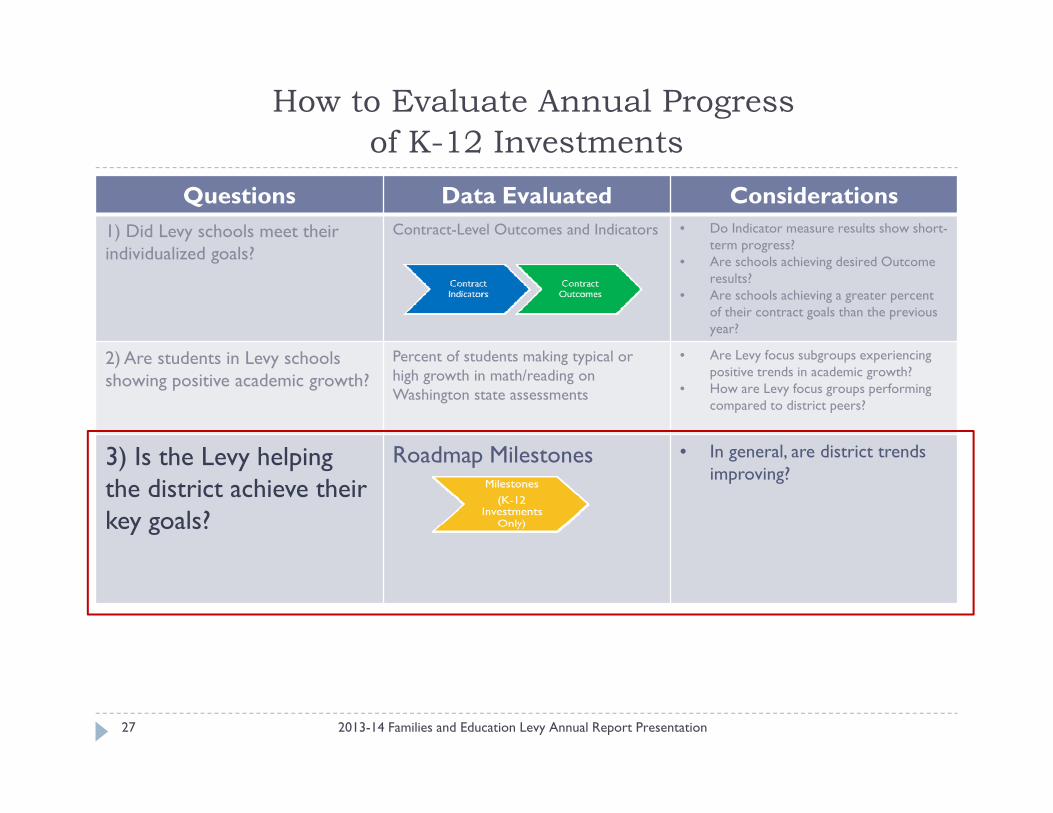
How to Evaluate Annual Progress of K-12 Investments
2013-14 Families and Education Levy Annual Report Presentation27
Questions Data Evaluated Considerations1) Did Levy schools meet their individualized goals?
Contract-Level Outcomes and Indicators • Do Indicator measure results show short-term progress?
• Are schools achieving desired Outcome results?
• Are schools achieving a greater percent of their contract goals than the previous year?
2) Are students in Levy schoolsshowing positive academic growth?
Percent of students making typical or high growth in math/reading on Washington state assessments
• Are Levy focus subgroups experiencing positive trends in academic growth?
• How are Levy focus groups performing compared to district peers?
3) Is the Levy helping the district achieve their key goals?
Roadmap Milestones • In general, are district trends improving?
Levy Efforts to Support District Goals
2013-14 Families and Education Levy Annual Report Presentation28
Coordinated math and reading professional development opportunities for schools’ instructional and leadership staff
Collaboration with community partnership organizations to improve school-community relationships and program effectiveness through data supports
Promotion of sound, standards-based gradingprinciples throughout Levy schools
Provision of custom data analysis to schools to inform strategy course corrections
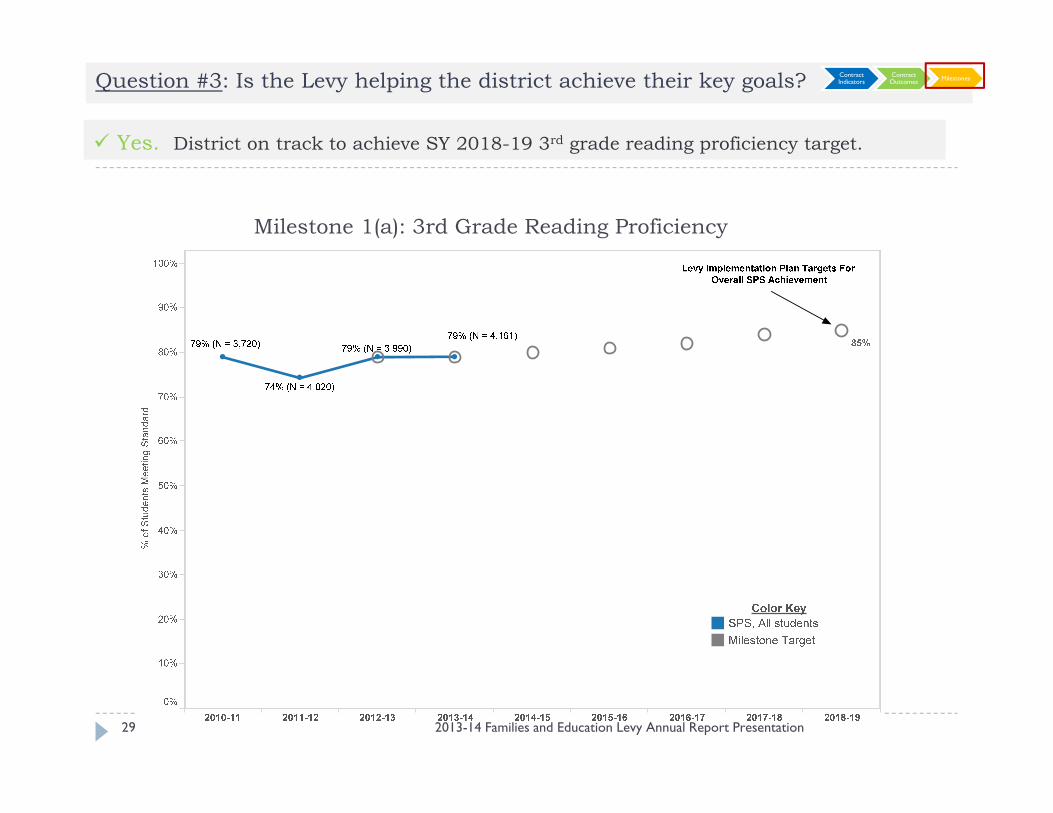
Milestone 1(a): 3rd Grade Reading Proficiency
Question #3: Is the Levy helping the district achieve their key goals?
Yes. District on track to achieve SY 2018-19 3rd grade reading proficiency target.
Contract Indicators
Contract Outcomes Milestones
2013-14 Families and Education Levy Annual Report Presentation29
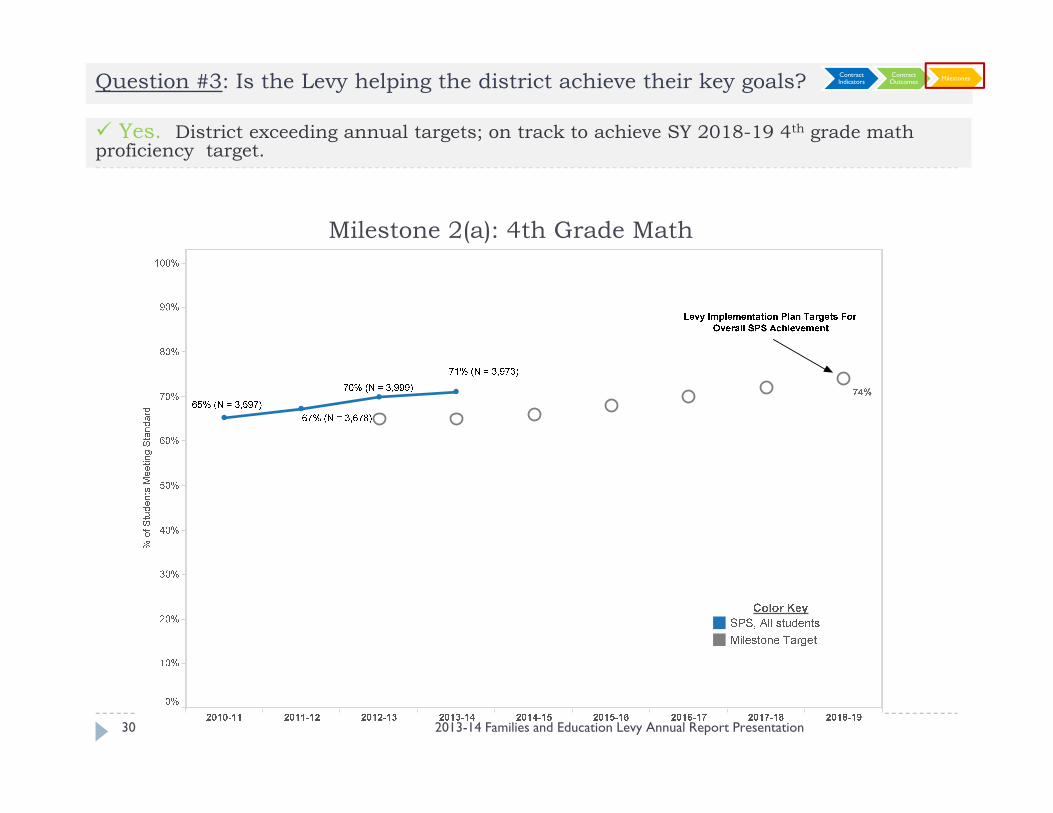
Milestone 2(a): 4th Grade Math
Yes. District exceeding annual targets; on track to achieve SY 2018-19 4th grade math proficiency target.
Question #3: Is the Levy helping the district achieve their key goals? Contract Indicators
Contract Outcomes Milestones
2013-14 Families and Education Levy Annual Report Presentation30

Milestone 3(a): 6th Grade Reading Proficiency
Yes. District on track to achieve SY 2018-19 6th grade reading proficiency target.
Question #3: Is the Levy helping the district achieve their key goals? Contract Indicators
Contract Outcomes Milestones
2013-14 Families and Education Levy Annual Report Presentation31
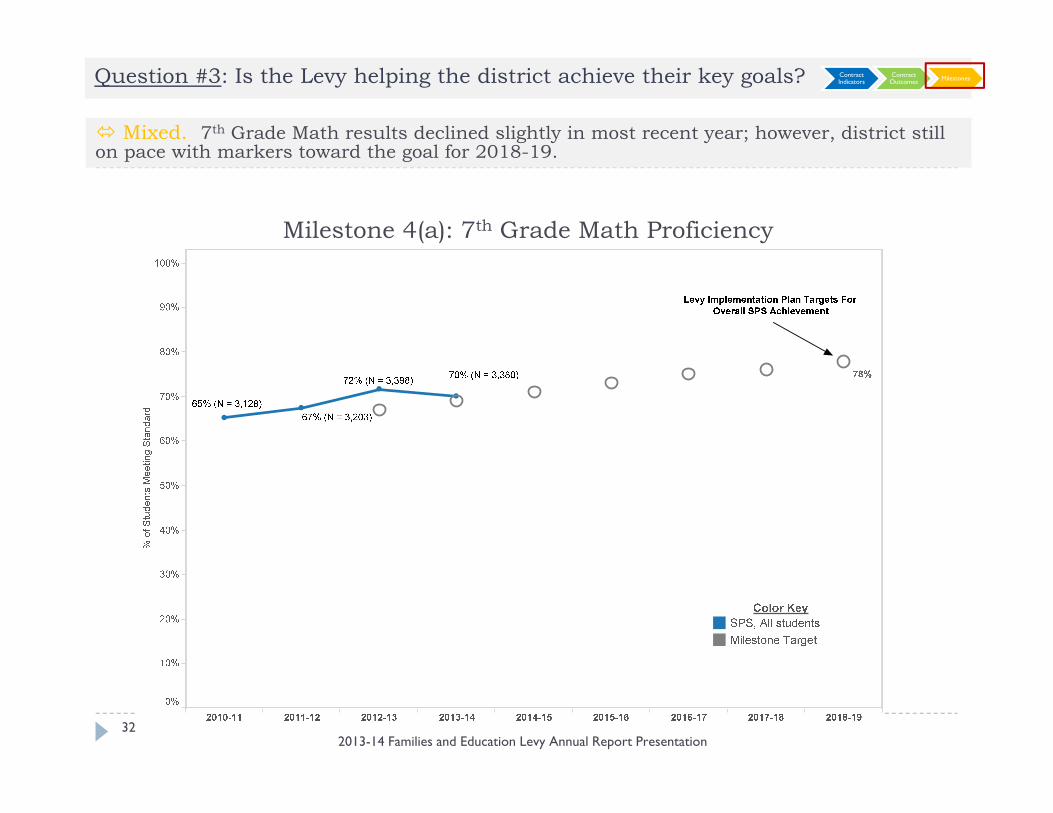
Milestone 4(a): 7th Grade Math Proficiency
Mixed. 7th Grade Math results declined slightly in most recent year; however, district still on pace with markers toward the goal for 2018-19.
Question #3: Is the Levy helping the district achieve their key goals? Contract Indicators
Contract Outcomes Milestones
2013-14 Families and Education Levy Annual Report Presentation32
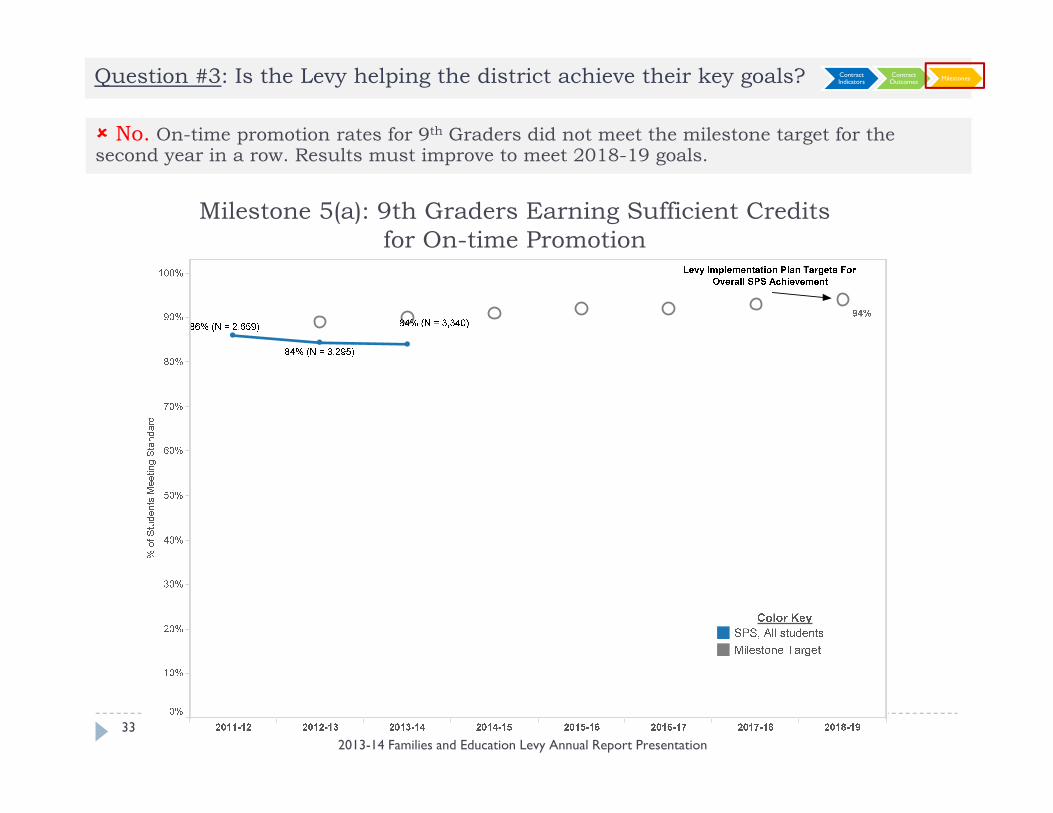
Milestone 5(a): 9th Graders Earning Sufficient Credits for On-time Promotion
No. On-time promotion rates for 9th Graders did not meet the milestone target for the second year in a row. Results must improve to meet 2018-19 goals.
Question #3: Is the Levy helping the district achieve their key goals? Contract Indicators
Contract Outcomes Milestones
2013-14 Families and Education Levy Annual Report Presentation33
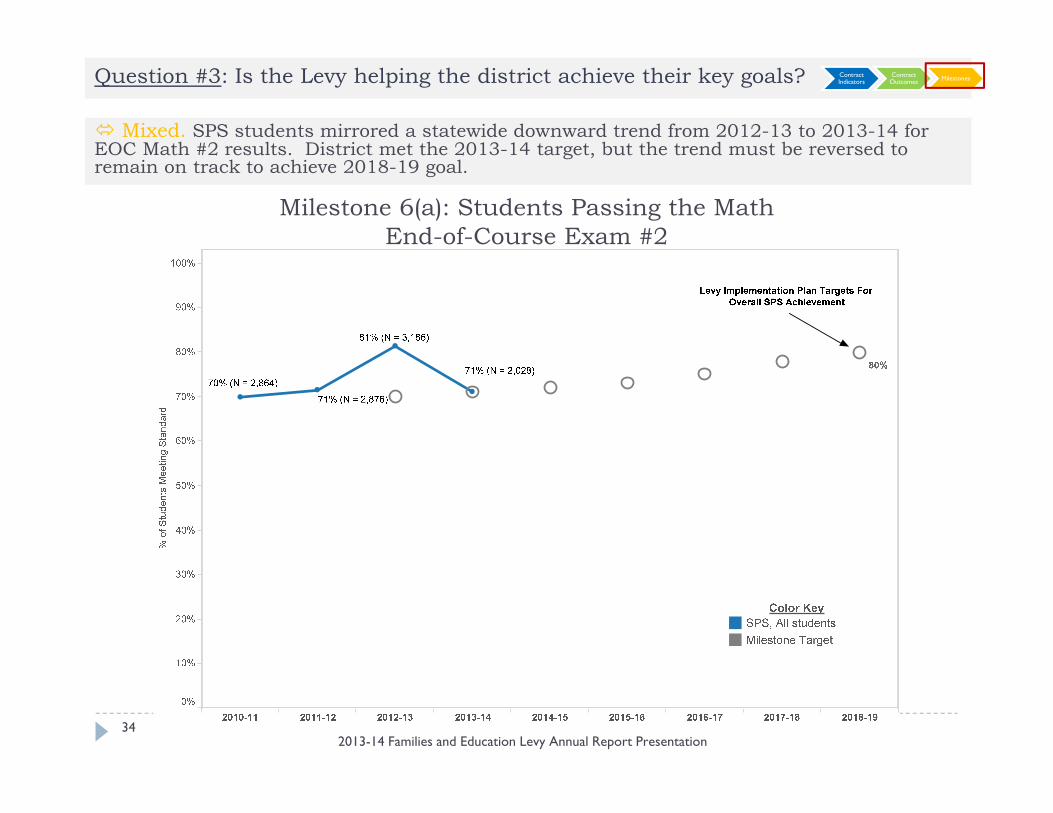
Milestone 6(a): Students Passing the Math End-of-Course Exam #2
Mixed. SPS students mirrored a statewide downward trend from 2012-13 to 2013-14 for EOC Math #2 results. District met the 2013-14 target, but the trend must be reversed to remain on track to achieve 2018-19 goal.
Question #3: Is the Levy helping the district achieve their key goals? Contract Indicators
Contract Outcomes Milestones
2013-14 Families and Education Levy Annual Report Presentation34
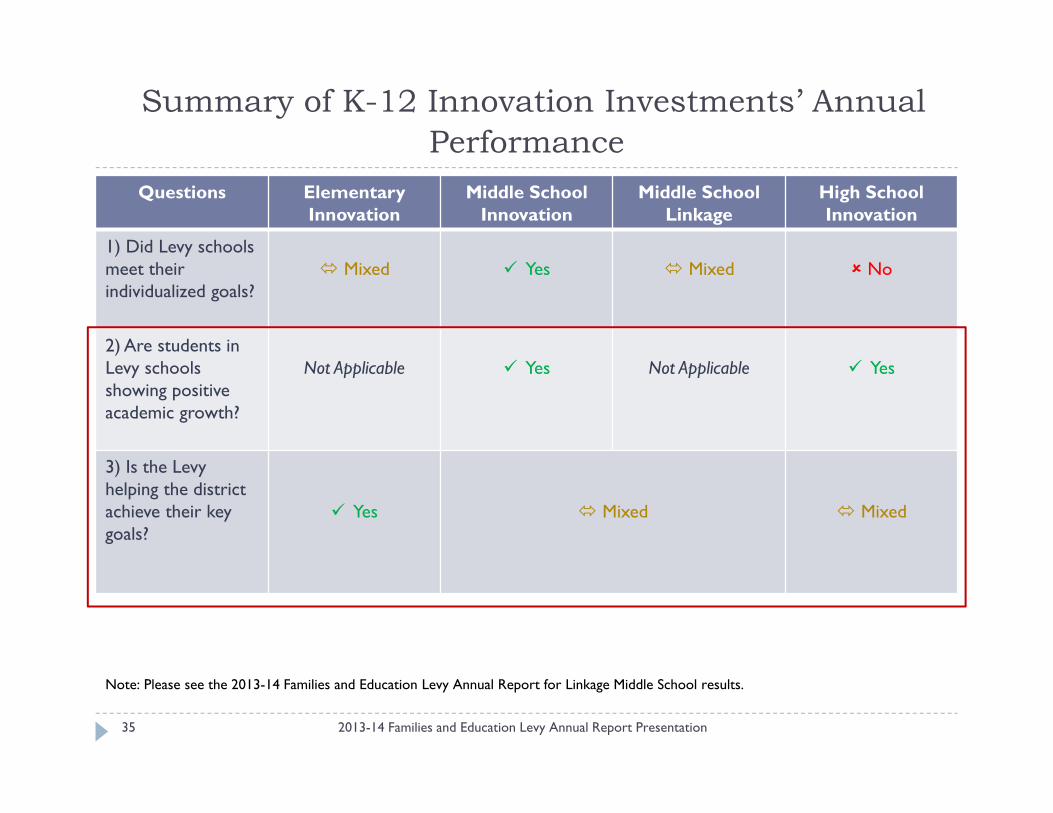
Summary of K-12 Innovation Investments’ Annual Performance
2013-14 Families and Education Levy Annual Report Presentation35
Questions Elementary Innovation
Middle School Innovation
Middle School Linkage
High School Innovation
1) Did Levy schools meet their individualized goals?
Mixed Yes Mixed No
2) Are students in Levy schoolsshowing positive academic growth?
Not Applicable Yes Not Applicable Yes
3) Is the Levy helping the district achieve their key goals?
Yes Mixed Mixed
Note: Please see the 2013-14 Families and Education Levy Annual Report for Linkage Middle School results.
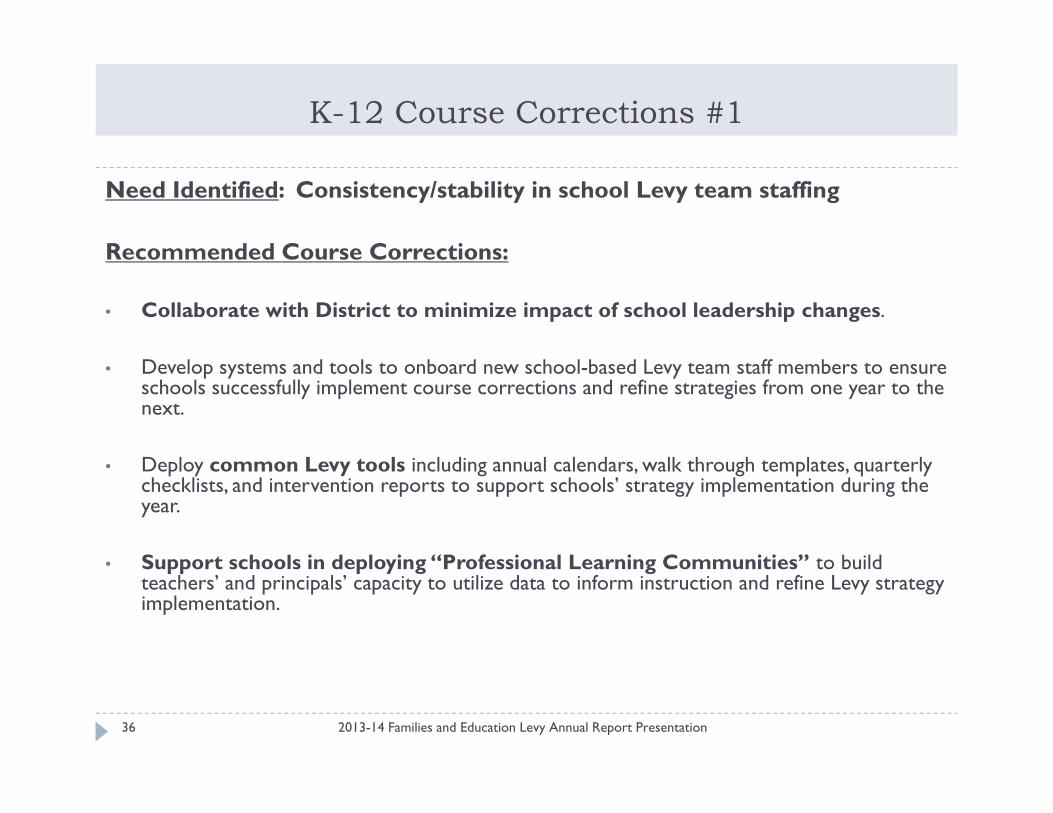
K-12 Course Corrections #1
2013-14 Families and Education Levy Annual Report Presentation36
Need Identified: Consistency/stability in school Levy team staffing
Recommended Course Corrections:
• Collaborate with District to minimize impact of school leadership changes.
• Develop systems and tools to onboard new school-based Levy team staff members to ensure schools successfully implement course corrections and refine strategies from one year to the next.
• Deploy common Levy tools including annual calendars, walk through templates, quarterly checklists, and intervention reports to support schools’ strategy implementation during the year.
• Support schools in deploying “Professional Learning Communities” to build teachers’ and principals’ capacity to utilize data to inform instruction and refine Levy strategy implementation.
K-12 Course Corrections #2
2013-14 Families and Education Levy Annual Report Presentation37
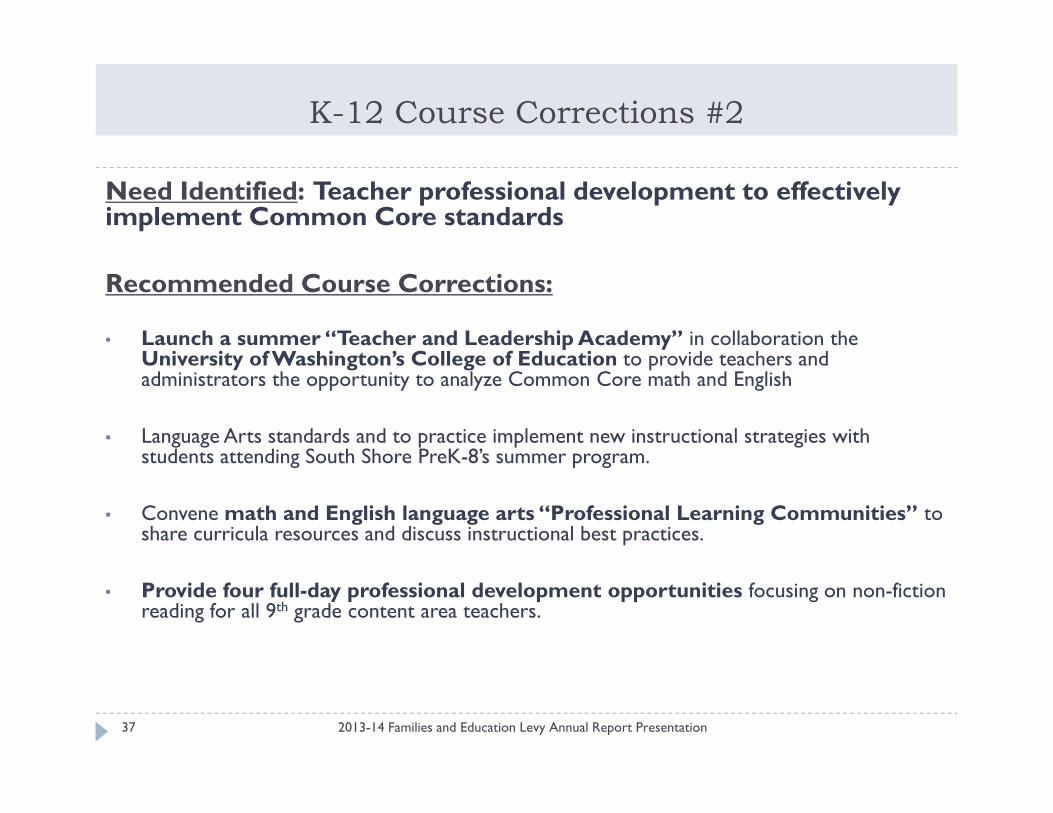
Need Identified: Teacher professional development to effectively implement Common Core standards
Recommended Course Corrections:
• Launch a summer “Teacher and Leadership Academy” in collaboration the University of Washington’s College of Education to provide teachers and administrators the opportunity to analyze Common Core math and English
• Language Arts standards and to practice implement new instructional strategies with students attending South Shore PreK-8’s summer program.
• Convene math and English language arts “Professional Learning Communities” to share curricula resources and discuss instructional best practices.
• Provide four full-day professional development opportunities focusing on non-fiction reading for all 9th grade content area teachers.
K-12 Course Corrections #3
2013-14 Families and Education Levy Annual Report Presentation38
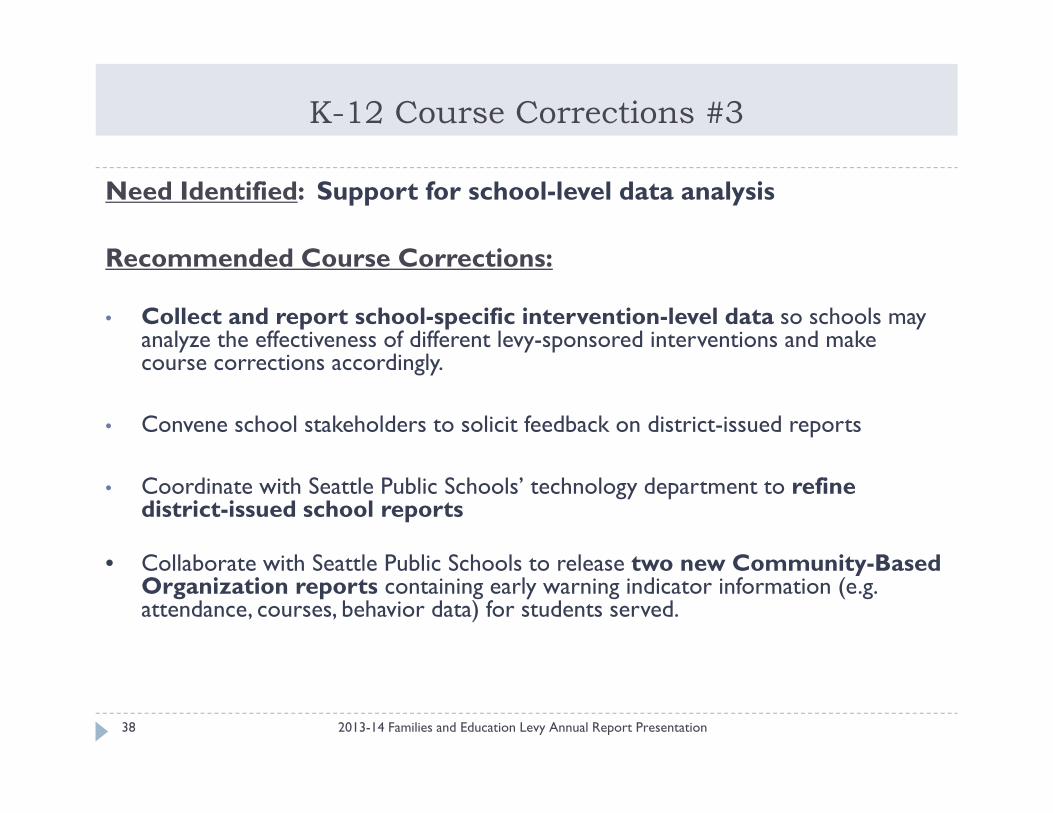
Need Identified: Support for school-level data analysis
Recommended Course Corrections:
• Collect and report school-specific intervention-level data so schools may analyze the effectiveness of different levy-sponsored interventions and make course corrections accordingly.
• Convene school stakeholders to solicit feedback on district-issued reports
• Coordinate with Seattle Public Schools’ technology department to refine district-issued school reports
• Collaborate with Seattle Public Schools to release two new Community-Based Organization reports containing early warning indicator information (e.g. attendance, courses, behavior data) for students served.
K-12 Course Corrections #4
2013-14 Families and Education Levy Annual Report Presentation39
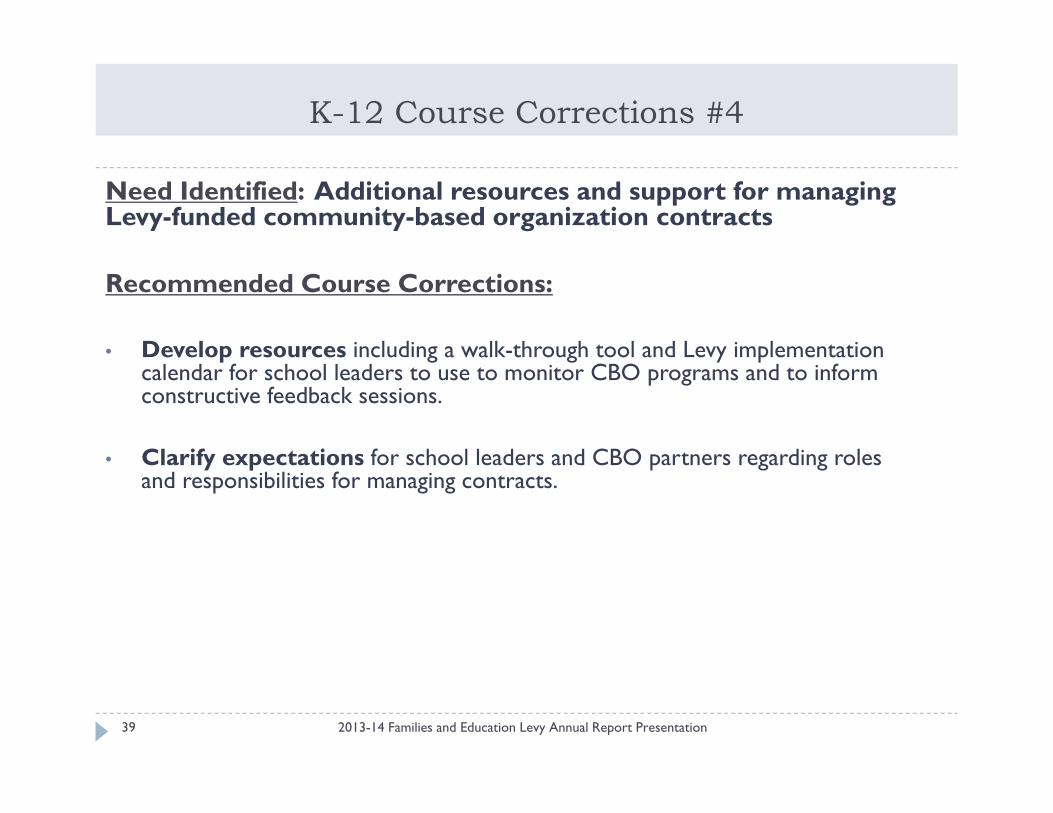
Need Identified: Additional resources and support for managing Levy-funded community-based organization contracts
Recommended Course Corrections:
• Develop resources including a walk-through tool and Levy implementation calendar for school leaders to use to monitor CBO programs and to inform constructive feedback sessions.
• Clarify expectations for school leaders and CBO partners regarding roles and responsibilities for managing contracts.
Photos by Susie Fitzhugh
Board Budget Work Session
March 25, 2015
1. Superintendent’s Opening Remarks
2. FY14-15 Operating Budget Status
3. State Legislative Session Status
4. FY15-16 Budget Development Calendar
5. FY15-16 Operating Budget Status
– Enrollment Projection
– Operating Budget GAP Status
– Central Planning Process Status
– School Funding Model (WSS) update
6. FY15-16 Capital Fund update
7. Appendix
Agenda
2
1) Superintendent’s Opening Remarks
Ensure educational excellence and equity for every student
Improve systems district-wide to support academic outcomes and meet students’ needs
Strengthen school, family and community engagement
3
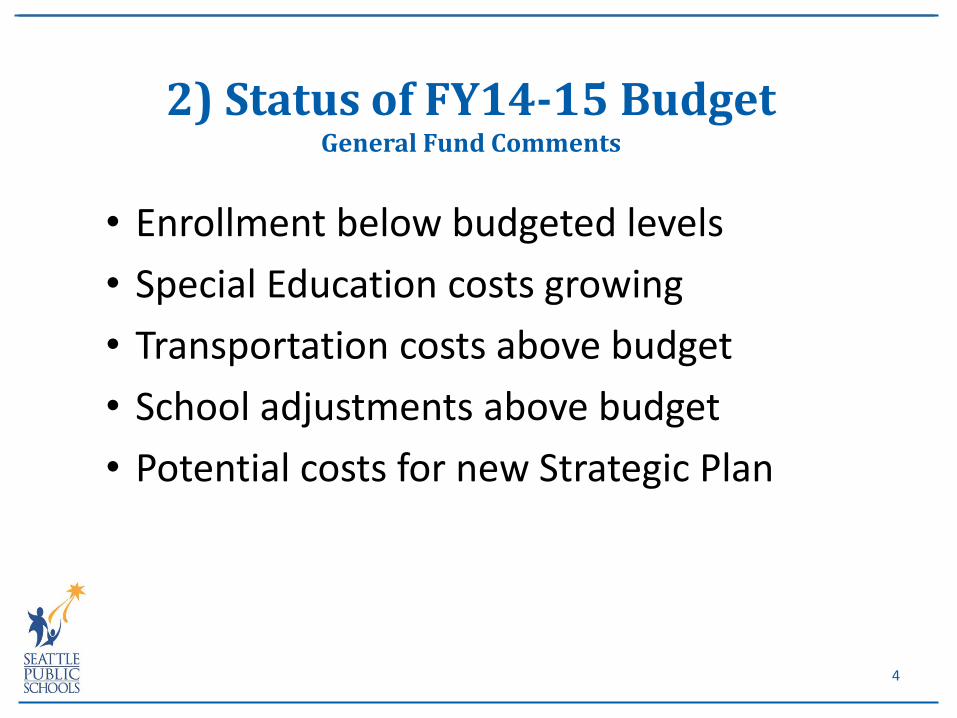
2) Status of FY14-15 Budget General Fund Comments
• Enrollment below budgeted levels
• Special Education costs growing
• Transportation costs above budget
• School adjustments above budget
• Potential costs for new Strategic Plan
4
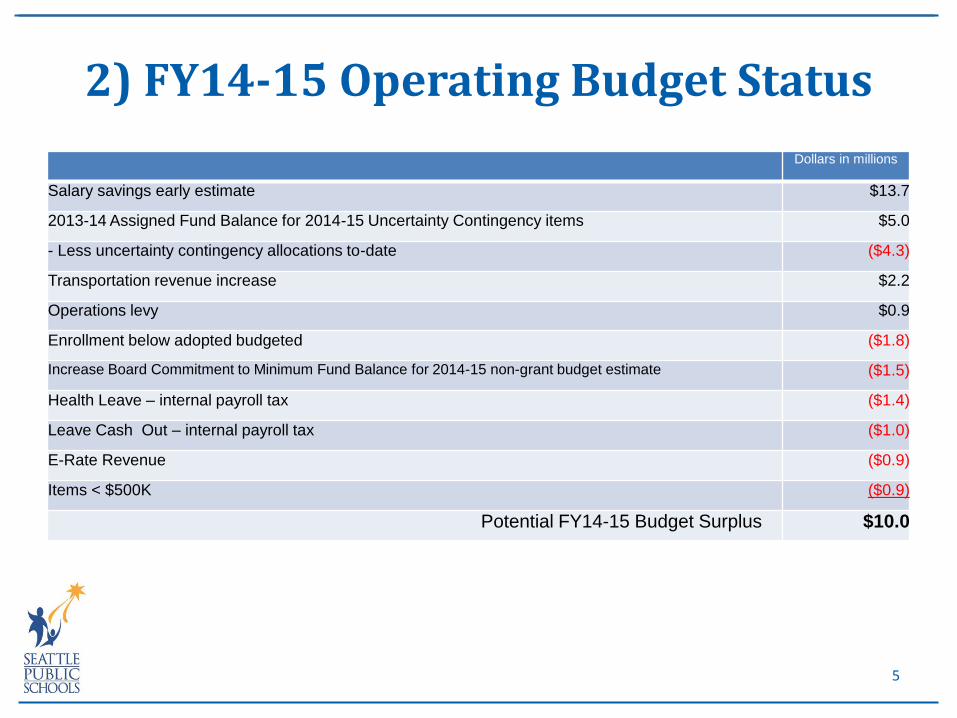
Dollars in millions
Salary savings early estimate $13.7
2013-14 Assigned Fund Balance for 2014-15 Uncertainty Contingency items $5.0
- Less uncertainty contingency allocations to-date ($4.3)
Transportation revenue increase $2.2
Operations levy $0.9
Enrollment below adopted budgeted ($1.8)
Increase Board Commitment to Minimum Fund Balance for 2014-15 non-grant budget estimate ($1.5)
Health Leave – internal payroll tax ($1.4)
Leave Cash Out – internal payroll tax ($1.0)
E-Rate Revenue ($0.9)
Items < $500K ($0.9)
Potential FY14-15 Budget Surplus $10.0
2) FY14-15 Operating Budget Status
5

3) Legislative Update: Priorities
1. Fully fund compensation
2. Class Size/Staff Allocations
3. Sustainable funding/resolve tax inequity
4. Reduce dependence on local levy
State Budget Monitoring Milestones:
SPS Budget Staff Plan – October 2014
Governor’s Budget (2) – December 2014
House Budget – Late March 2015
• Senate Budget – Early April 2015
• Final Action – April 2015 (likely June 2015)
Key State Budget Drivers: - Class Size/Staff Allocation - Full Day Kindergarten - MSOCs - Pupil Transportation - COLA - Pension - Medical - Operating Levy Base Inflator - Other
6
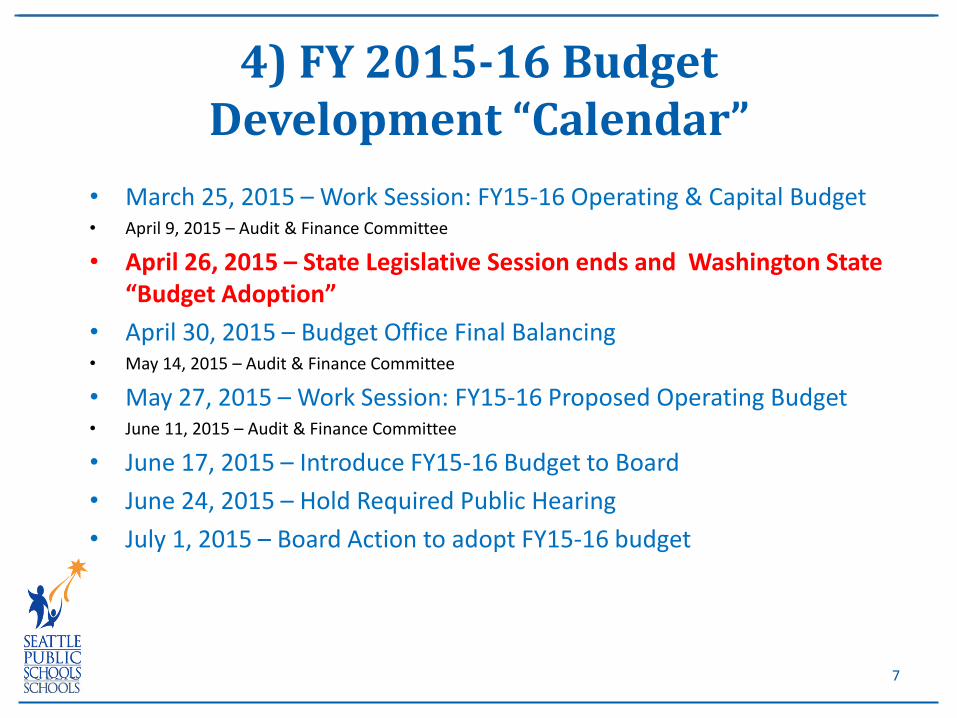
• March 25, 2015 – Work Session: FY15-16 Operating & Capital Budget • April 9, 2015 – Audit & Finance Committee
• April 26, 2015 – State Legislative Session ends and Washington State “Budget Adoption”
• April 30, 2015 – Budget Office Final Balancing • May 14, 2015 – Audit & Finance Committee
• May 27, 2015 – Work Session: FY15-16 Proposed Operating Budget • June 11, 2015 – Audit & Finance Committee
• June 17, 2015 – Introduce FY15-16 Budget to Board
• June 24, 2015 – Hold Required Public Hearing
• July 1, 2015 – Board Action to adopt FY15-16 budget
4) FY 2015-16 Budget Development “Calendar”
7
a) Enrollment Projection
b) Operating Budget Gap Status
c) Central Planning Process Status
d) School Funding Model (WSS) Update
5) FY15-16 Operating Budget Status
8
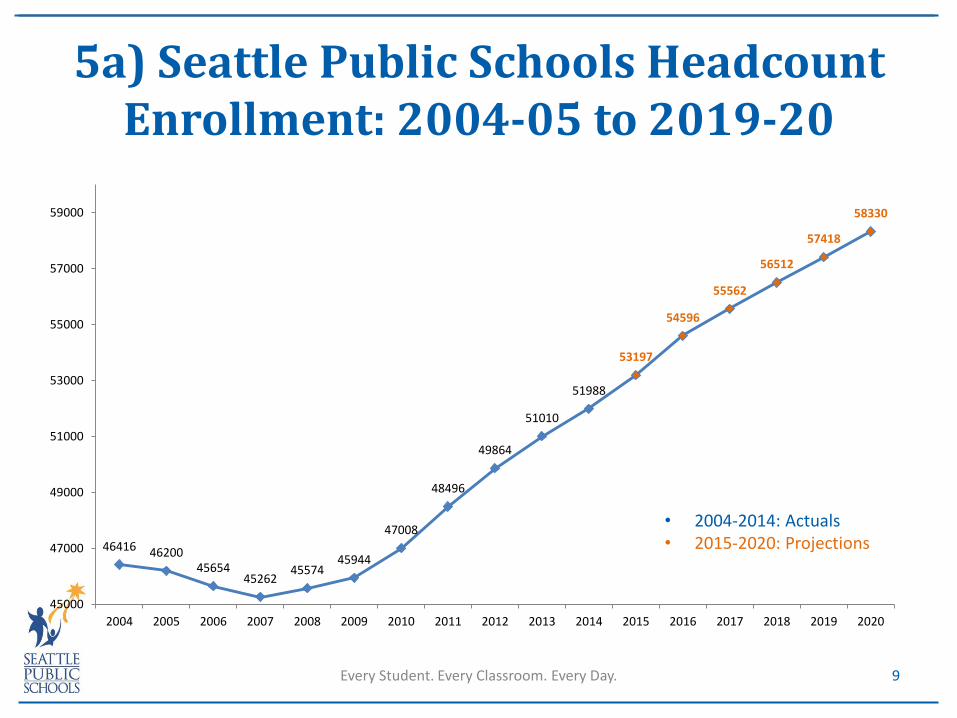
5a) Seattle Public Schools Headcount Enrollment: 2004-05 to 2019-20
Every Student. Every Classroom. Every Day. 9
46416 46200 45654
45262 45574
45944
47008
48496
49864
51010
51988
53197
54596
55562
56512
57418
58330
45000
47000
49000
51000
53000
55000
57000
59000
2004 2005 2006 2007 2008 2009 2010 2011 2012 2013 2014 2015 2016 2017 2018 2019 2020
• 2004-2014: Actuals • 2015-2020: Projections
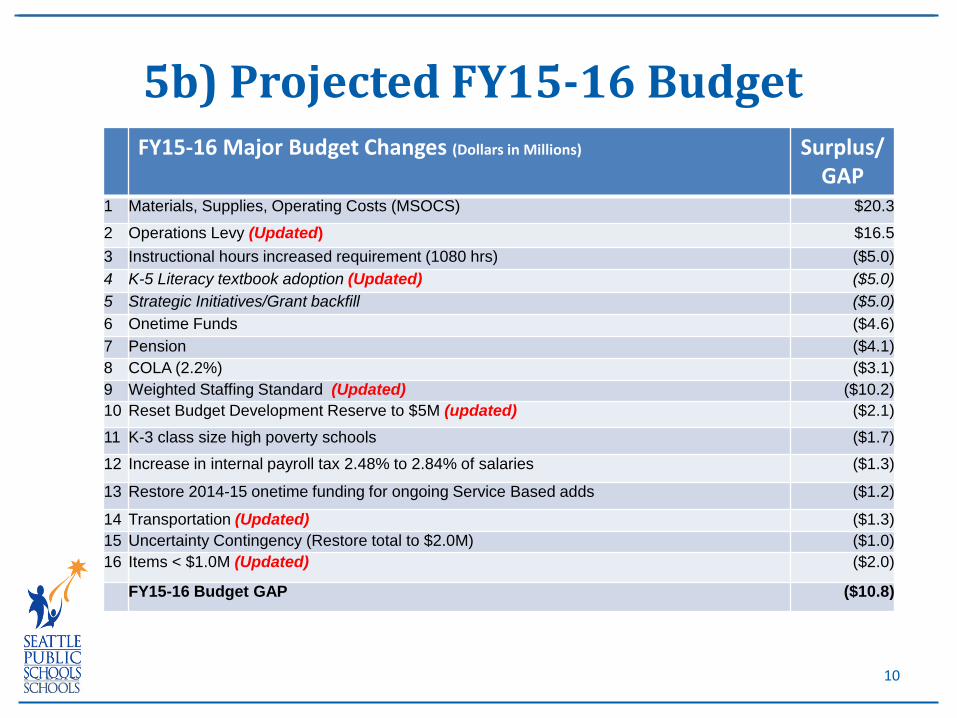
5b) Projected FY15-16 Budget FY15-16 Major Budget Changes (Dollars in Millions)
Surplus/
GAP 1 Materials, Supplies, Operating Costs (MSOCS) $20.3
2 Operations Levy (Updated) $16.5
3 Instructional hours increased requirement (1080 hrs) ($5.0)
4 K-5 Literacy textbook adoption (Updated) ($5.0)
5 Strategic Initiatives/Grant backfill ($5.0)
6 Onetime Funds ($4.6)
7 Pension ($4.1)
8 COLA (2.2%) ($3.1)
9 Weighted Staffing Standard (Updated) ($10.2)
10 Reset Budget Development Reserve to $5M (updated) ($2.1)
11 K-3 class size high poverty schools ($1.7)
12 Increase in internal payroll tax 2.48% to 2.84% of salaries ($1.3)
13 Restore 2014-15 onetime funding for ongoing Service Based adds ($1.2)
14 Transportation (Updated) ($1.3)
15 Uncertainty Contingency (Restore total to $2.0M) ($1.0)
16 Items < $1.0M (Updated) ($2.0)
FY15-16 Budget GAP ($10.8)
10
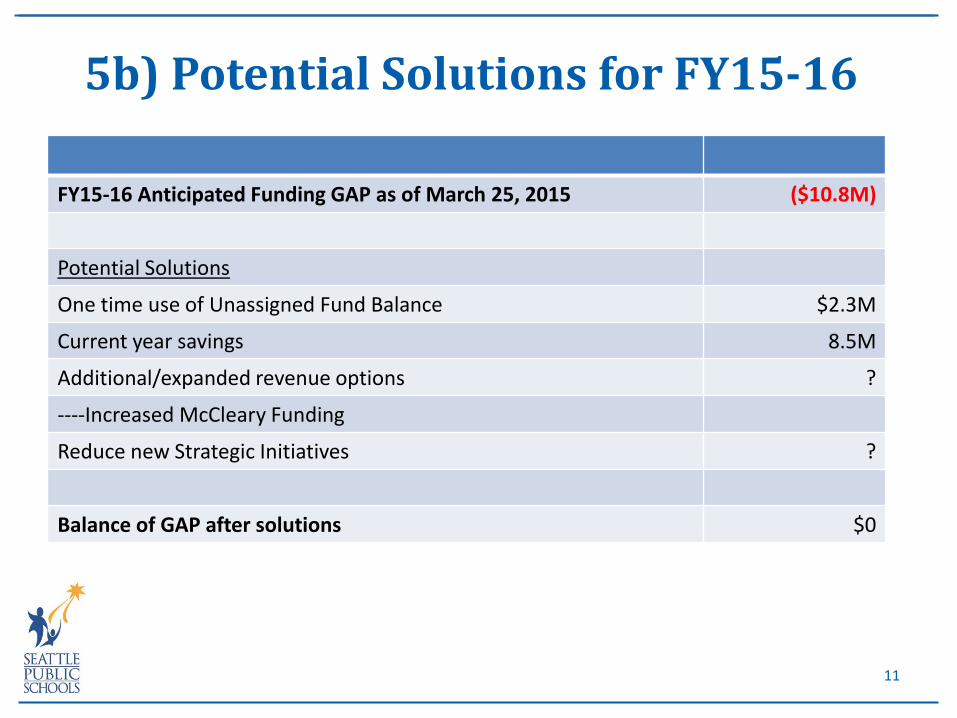
5b) Potential Solutions for FY15-16
FY15-16 Anticipated Funding GAP as of March 25, 2015 ($10.8M)
Potential Solutions
One time use of Unassigned Fund Balance $2.3M
Current year savings 8.5M
Additional/expanded revenue options ?
----Increased McCleary Funding
Reduce new Strategic Initiatives ?
Balance of GAP after solutions $0
11

5c) Central Planning Process The Annual Budgeting & Planning process is an integral component of achieving the goals set out in the 5 year strategic plan
Annual Budgeting & Planning
5 Year District Strategic Plan
24 Month Vision / Planning
5 Yr
2 Yr
1 Yr
Annual reflection on how the services provided tie into the roadmap / implementation plan, and to ensure resources are allocated appropriately to support and achieve annual milestones
24 month vision / planning helps orgs. get more tactical and create a road map / implementation plan for how to drive positive change and execute on the goals stated in the Strategic Plan
Freq
ue
ncy
Strategy is developed every 5 years to guide the district’s work in order to meet its commitment to: • ensure equitable access • closing the opportunity gaps • excellence in education for every student
More Strategic
More Tactical 12
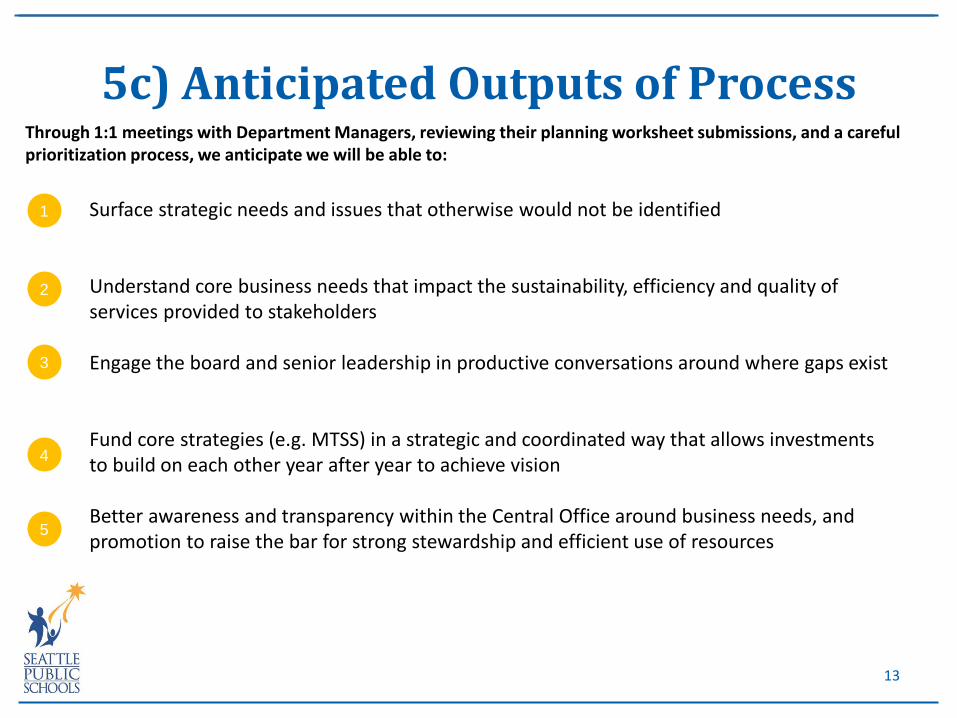
5c) Anticipated Outputs of Process
Surface strategic needs and issues that otherwise would not be identified
Understand core business needs that impact the sustainability, efficiency and quality of services provided to stakeholders
Engage the board and senior leadership in productive conversations around where gaps exist
Fund core strategies (e.g. MTSS) in a strategic and coordinated way that allows investments to build on each other year after year to achieve vision
Better awareness and transparency within the Central Office around business needs, and promotion to raise the bar for strong stewardship and efficient use of resources
Through 1:1 meetings with Department Managers, reviewing their planning worksheet submissions, and a careful prioritization process, we anticipate we will be able to:
1
2
3
4
5
13
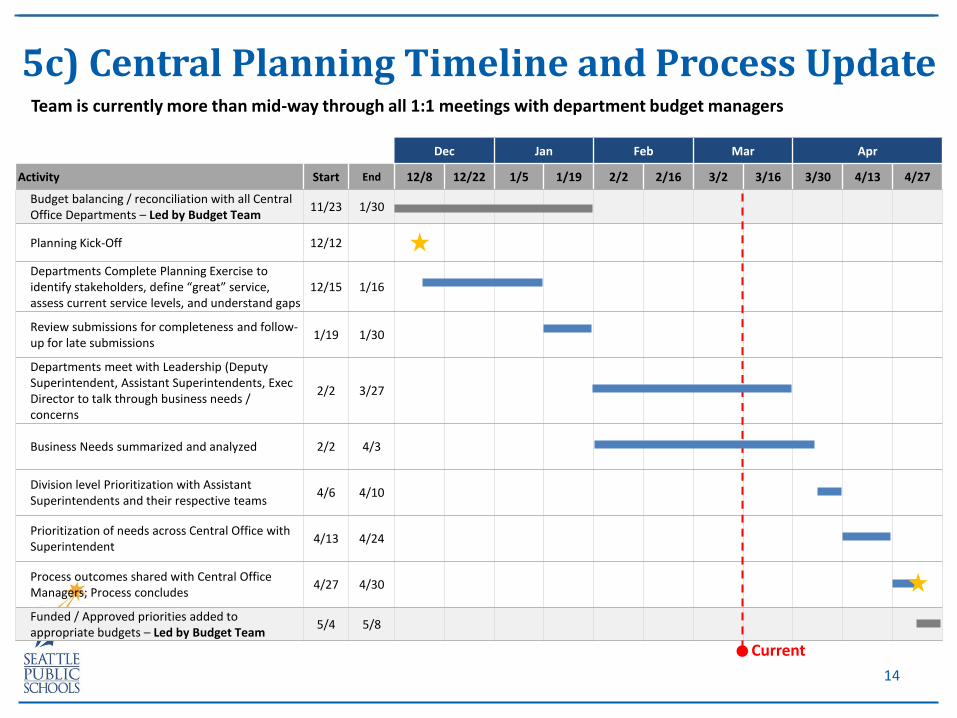
Dec Jan Feb Mar Apr
Activity Start End 12/8 12/22 1/5 1/19 2/2 2/16 3/2 3/16 3/30 4/13 4/27
Budget balancing / reconciliation with all Central Office Departments – Led by Budget Team
11/23 1/30
Planning Kick-Off 12/12
Departments Complete Planning Exercise to identify stakeholders, define “great” service, assess current service levels, and understand gaps
12/15 1/16
Review submissions for completeness and follow-up for late submissions
1/19 1/30
Departments meet with Leadership (Deputy Superintendent, Assistant Superintendents, Exec Director to talk through business needs / concerns
2/2 3/27
Business Needs summarized and analyzed 2/2 4/3
Division level Prioritization with Assistant Superintendents and their respective teams
4/6 4/10
Prioritization of needs across Central Office with Superintendent
4/13 4/24
Process outcomes shared with Central Office Managers; Process concludes
4/27 4/30
Funded / Approved priorities added to appropriate budgets – Led by Budget Team
5/4 5/8
5c) Central Planning Timeline and Process Update
Current
Team is currently more than mid-way through all 1:1 meetings with department budget managers
14
• Completed WSS Committee work in December
• Updated School Based Budget Guiding Principles
• Re-defined scope of work
• In alignment with Board Policy 6010
• Initially planned to be budget neutral with prioritized additions identified
• Desire to have year round working group for FY16-17 school budget
5d) School Weighted Staffing Standards (WSS) Committee Update
15
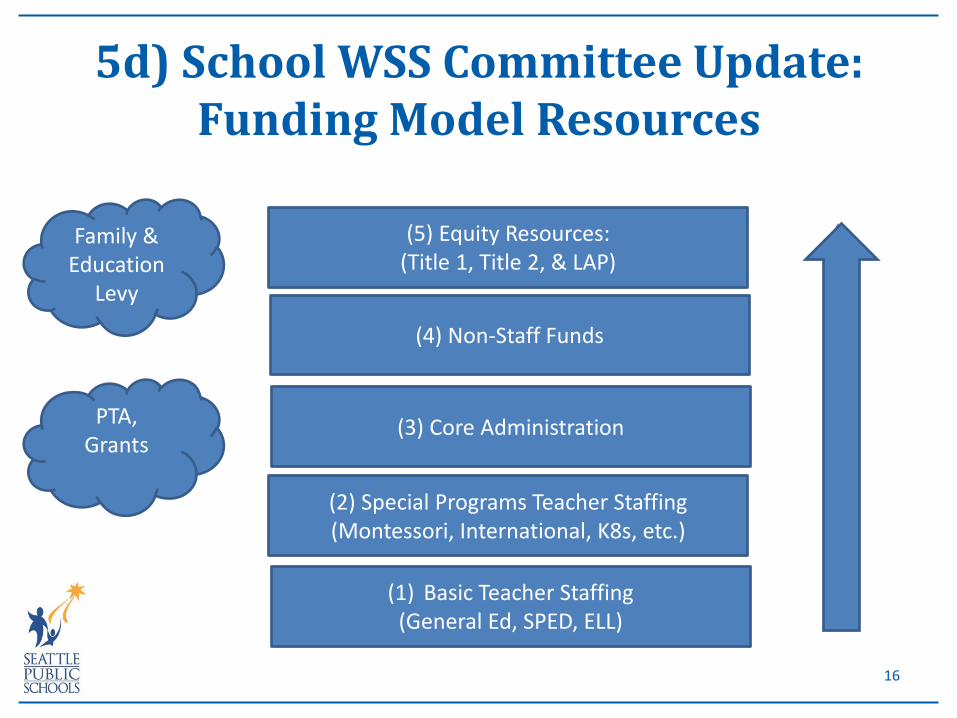
5d) School WSS Committee Update: Funding Model Resources
(1) Basic Teacher Staffing (General Ed, SPED, ELL)
(2) Special Programs Teacher Staffing (Montessori, International, K8s, etc.)
(3) Core Administration
(4) Non-Staff Funds
(5) Equity Resources: (Title 1, Title 2, & LAP)
Family & Education
Levy
PTA, Grants
16
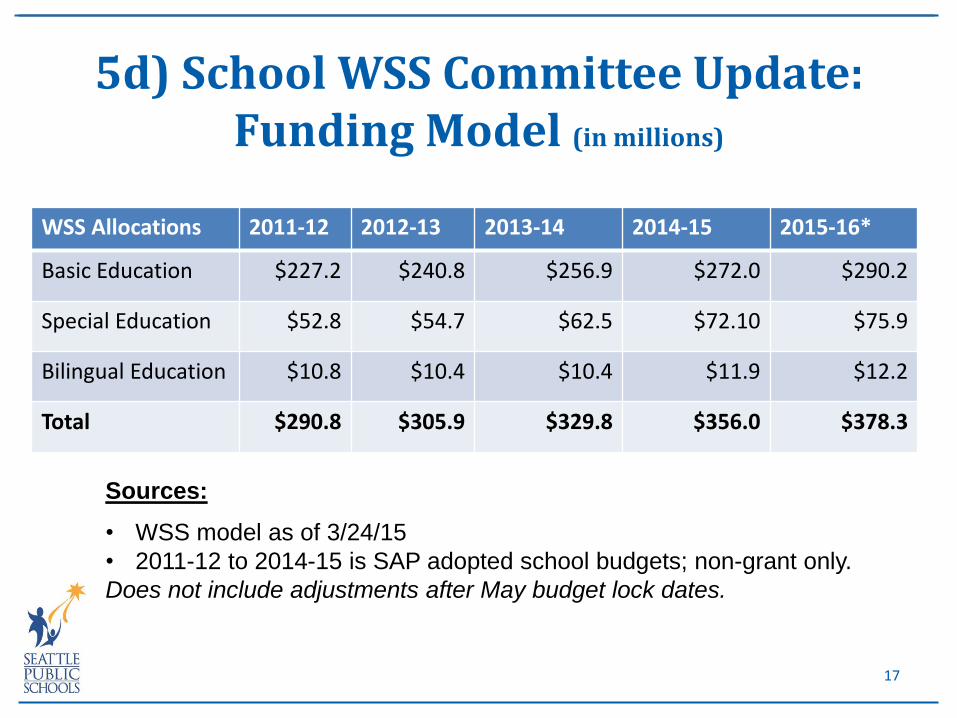
WSS Allocations 2011-12 2012-13 2013-14 2014-15 2015-16*
Basic Education $227.2 $240.8 $256.9 $272.0 $290.2
Special Education $52.8 $54.7 $62.5 $72.10 $75.9
Bilingual Education $10.8 $10.4 $10.4 $11.9 $12.2
Total $290.8 $305.9 $329.8 $356.0 $378.3
5d) School WSS Committee Update: Funding Model (in millions)
Sources:
• WSS model as of 3/24/15
• 2011-12 to 2014-15 is SAP adopted school budgets; non-grant only.
Does not include adjustments after May budget lock dates.
17
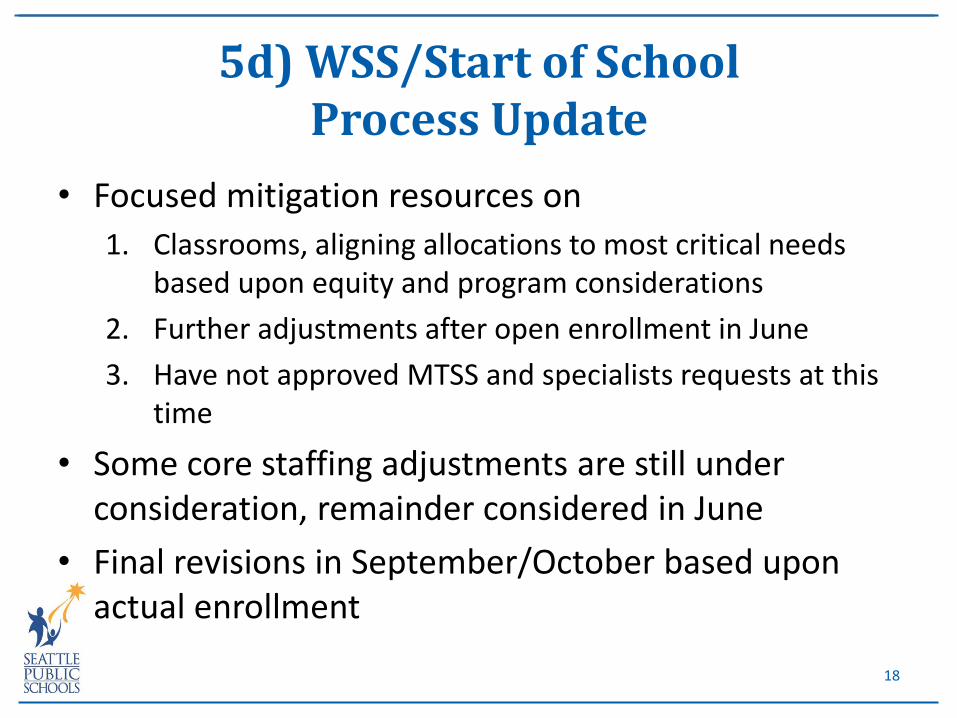
• Focused mitigation resources on
1. Classrooms, aligning allocations to most critical needs based upon equity and program considerations
2. Further adjustments after open enrollment in June
3. Have not approved MTSS and specialists requests at this time
• Some core staffing adjustments are still under consideration, remainder considered in June
• Final revisions in September/October based upon actual enrollment
5d) WSS/Start of School Process Update
18
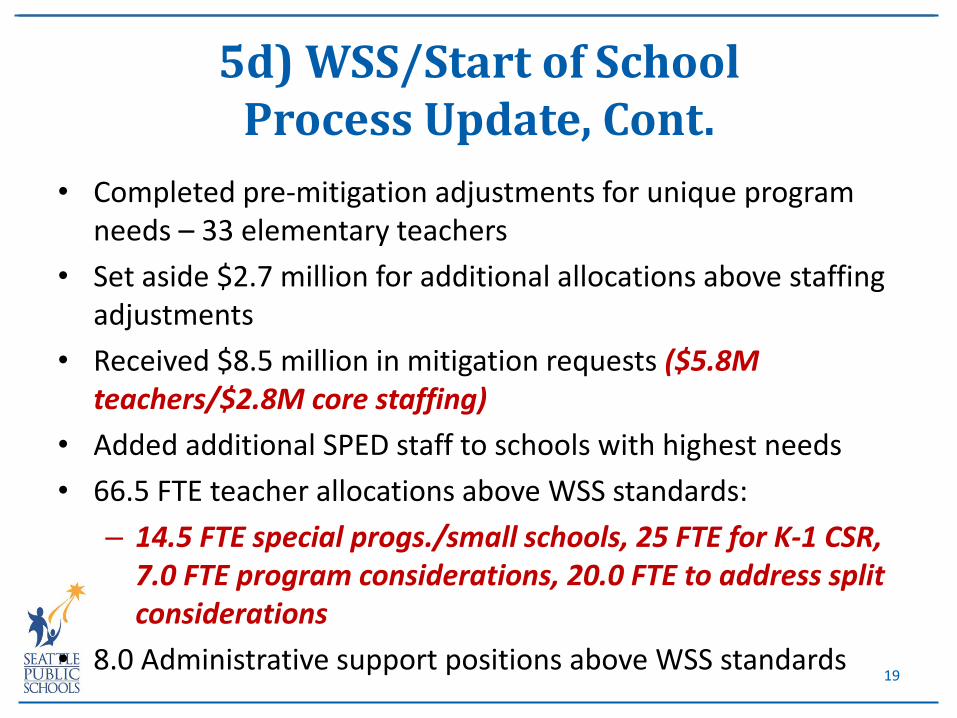
• Completed pre-mitigation adjustments for unique program needs – 33 elementary teachers
• Set aside $2.7 million for additional allocations above staffing adjustments
• Received $8.5 million in mitigation requests ($5.8M teachers/$2.8M core staffing)
• Added additional SPED staff to schools with highest needs
• 66.5 FTE teacher allocations above WSS standards:
– 14.5 FTE special progs./small schools, 25 FTE for K-1 CSR, 7.0 FTE program considerations, 20.0 FTE to address split considerations
• 8.0 Administrative support positions above WSS standards
5d) WSS/Start of School Process Update, Cont.
19
1. Sources of Capital Funding
2. Capital Revenue FY 15-16
3. Specific Planned Expenditures FY 15-16
4. Existing Capital Commitments
5. Next Steps
6. Questions
6) FY15-16 Capital Fund update
20
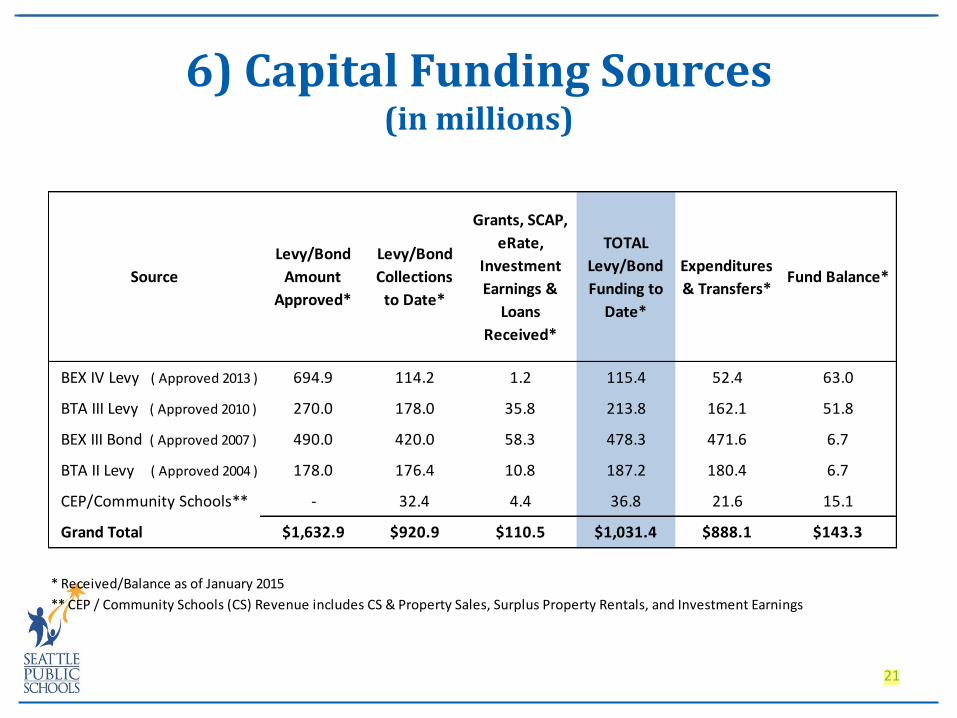
6) Capital Funding Sources (in millions)
21
Source
Levy/Bond
Amount
Approved*
Levy/Bond
Collections
to Date*
Grants, SCAP,
eRate,
Investment
Earnings &
Loans
Received*
TOTAL
Levy/Bond
Funding to
Date*
Expenditures
& Transfers* Fund Balance*
BEX IV Levy ( Approved 2013 ) 694.9 114.2 1.2 115.4 52.4 63.0
BTA III Levy ( Approved 2010 ) 270.0 178.0 35.8 213.8 162.1 51.8
BEX III Bond ( Approved 2007 ) 490.0 420.0 58.3 478.3 471.6 6.7
BTA II Levy ( Approved 2004 ) 178.0 176.4 10.8 187.2 180.4 6.7
CEP/Community Schools** - 32.4 4.4 36.8 21.6 15.1
Grand Total $1,632.9 $920.9 $110.5 $1,031.4 $888.1 $143.3
* Received/Balance as of January 2015
** CEP / Community Schools (CS) Revenue includes CS & Property Sales, Surplus Property Rentals, and Investment Earnings
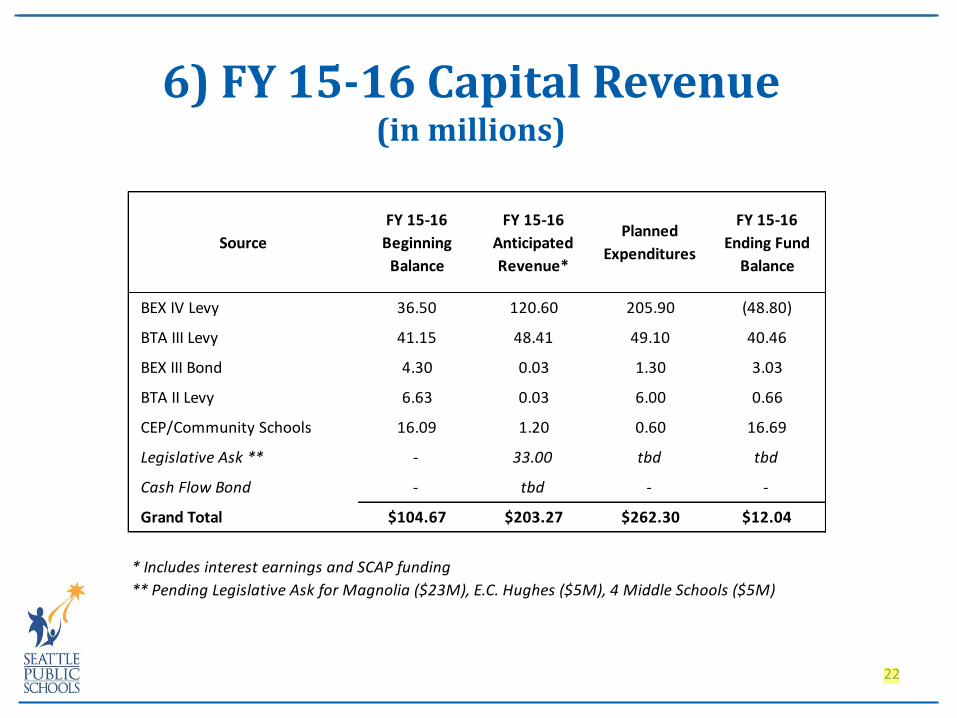
6) FY 15-16 Capital Revenue
(in millions)
22
Source
FY 15-16
Beginning
Balance
FY 15-16
Anticipated
Revenue*
Planned
Expenditures
FY 15-16
Ending Fund
Balance
BEX IV Levy 36.50 120.60 205.90 (48.80)
BTA III Levy 41.15 48.41 49.10 40.46
BEX III Bond 4.30 0.03 1.30 3.03
BTA II Levy 6.63 0.03 6.00 0.66
CEP/Community Schools 16.09 1.20 0.60 16.69
Legislative Ask ** - 33.00 tbd tbd
Cash Flow Bond - tbd - -
Grand Total $104.67 $203.27 $262.30 $12.04
* Includes interest earnings and SCAP funding
** Pending Legislative Ask for Magnolia ($23M), E.C. Hughes ($5M), 4 Middle Schools ($5M)
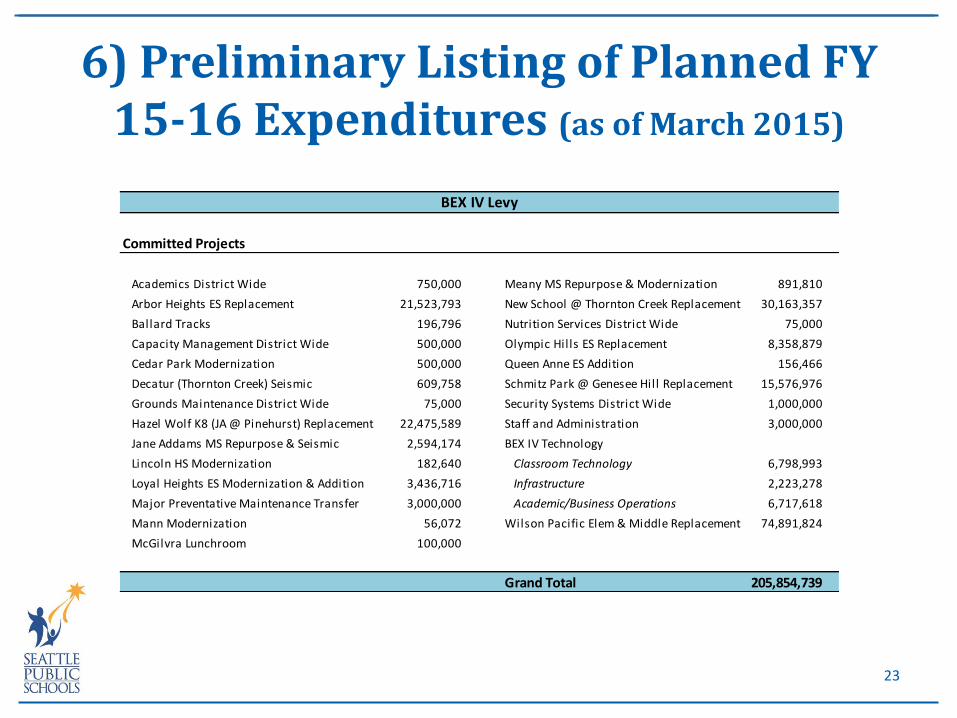
6) Preliminary Listing of Planned FY 15-16 Expenditures (as of March 2015)
23
Committed Projects
Academics District Wide 750,000 Meany MS Repurpose & Modernization 891,810
Arbor Heights ES Replacement 21,523,793 New School @ Thornton Creek Replacement 30,163,357
Ballard Tracks 196,796 Nutrition Services District Wide 75,000
Capacity Management District Wide 500,000 Olympic Hills ES Replacement 8,358,879
Cedar Park Modernization 500,000 Queen Anne ES Addition 156,466
Decatur (Thornton Creek) Seismic 609,758 Schmitz Park @ Genesee Hill Replacement 15,576,976
Grounds Maintenance District Wide 75,000 Security Systems District Wide 1,000,000
Hazel Wolf K8 (JA @ Pinehurst) Replacement 22,475,589 Staff and Administration 3,000,000
Jane Addams MS Repurpose & Seismic 2,594,174 BEX IV Technology
Lincoln HS Modernization 182,640 Classroom Technology 6,798,993
Loyal Heights ES Modernization & Addition 3,436,716 Infrastructure 2,223,278
Major Preventative Maintenance Transfer 3,000,000 Academic/Business Operations 6,717,618
Mann Modernization 56,072 Wilson Pacific Elem & Middle Replacement 74,891,824
McGilvra Lunchroom 100,000
Grand Total 205,854,739
BEX IV Levy
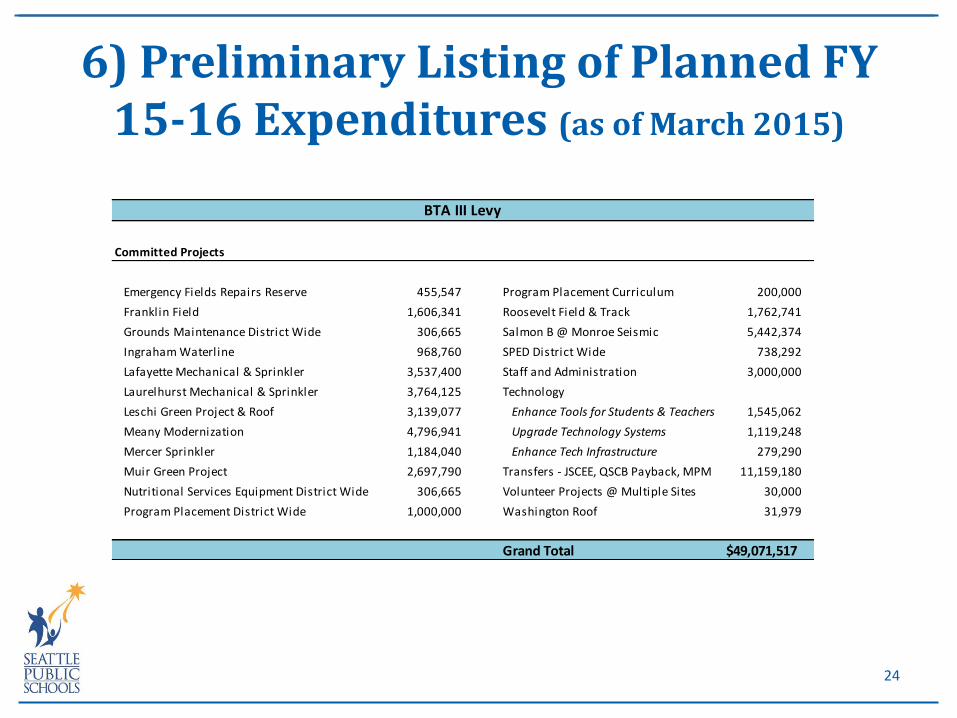
6) Preliminary Listing of Planned FY 15-16 Expenditures (as of March 2015)
24
Committed Projects
Emergency Fields Repairs Reserve 455,547 Program Placement Curriculum 200,000
Franklin Field 1,606,341 Roosevelt Field & Track 1,762,741
Grounds Maintenance District Wide 306,665 Salmon B @ Monroe Seismic 5,442,374
Ingraham Waterline 968,760 SPED District Wide 738,292
Lafayette Mechanical & Sprinkler 3,537,400 Staff and Administration 3,000,000
Laurelhurst Mechanical & Sprinkler 3,764,125 Technology
Leschi Green Project & Roof 3,139,077 Enhance Tools for Students & Teachers 1,545,062
Meany Modernization 4,796,941 Upgrade Technology Systems 1,119,248
Mercer Sprinkler 1,184,040 Enhance Tech Infrastructure 279,290
Muir Green Project 2,697,790 Transfers - JSCEE, QSCB Payback, MPM 11,159,180
Nutritional Services Equipment District Wide 306,665 Volunteer Projects @ Multiple Sites 30,000
Program Placement District Wide 1,000,000 Washington Roof 31,979
Grand Total $49,071,517
BTA III Levy
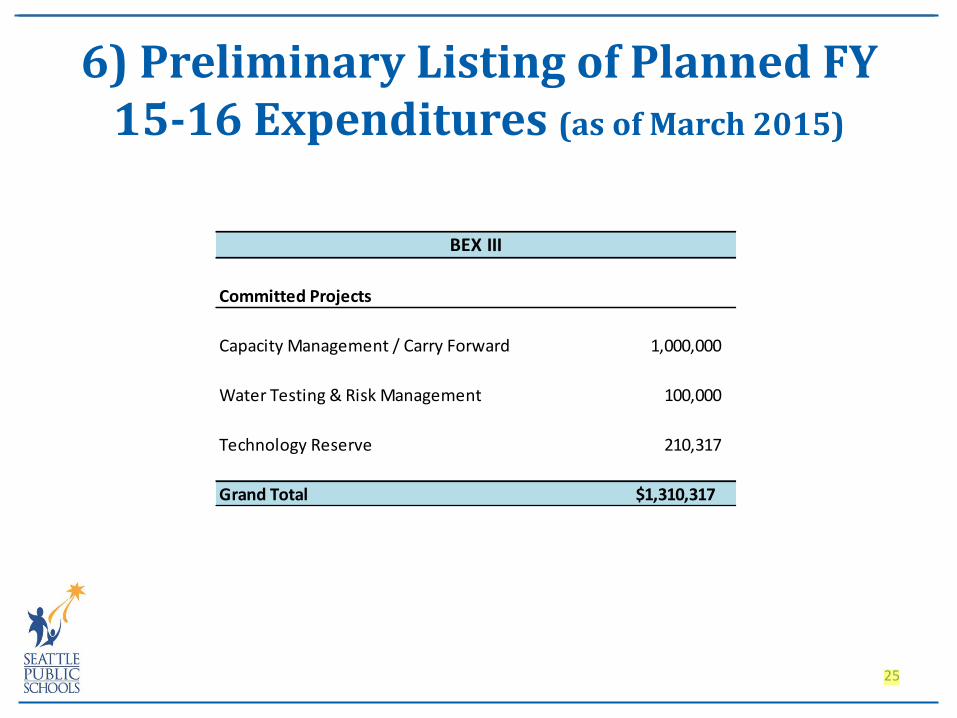
6) Preliminary Listing of Planned FY 15-16 Expenditures (as of March 2015)
25
Committed Projects
Capacity Management / Carry Forward 1,000,000
Water Testing & Risk Management 100,000
Technology Reserve 210,317
Grand Total $1,310,317
BEX III

6) Preliminary Listing of Planned FY 15-16 Expenditures (as of March 2015)
26
Committed Projects
Seattle World School at TT Minor 6,000,000
Grand Total $6,000,000
Committed Projects
Emergency Projects @ Multiple Sites (CEP) 210,000
Property Management (CEP) 400,000
Grand Total $610,000
BTA II Levy
CEP / Community Schools (CS)
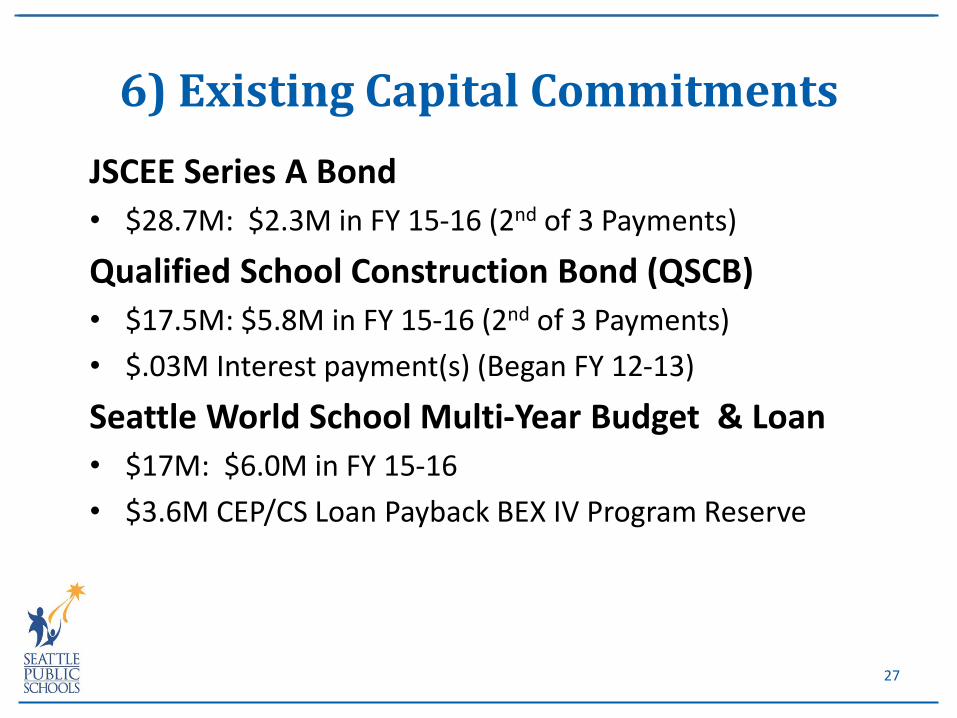
6) Existing Capital Commitments
JSCEE Series A Bond
• $28.7M: $2.3M in FY 15-16 (2nd of 3 Payments)
Qualified School Construction Bond (QSCB)
• $17.5M: $5.8M in FY 15-16 (2nd of 3 Payments)
• $.03M Interest payment(s) (Began FY 12-13)
Seattle World School Multi-Year Budget & Loan
• $17M: $6.0M in FY 15-16
• $3.6M CEP/CS Loan Payback BEX IV Program Reserve
27
Questions??
Please send questions and comments regarding the 2015-16 budget to:
28
1. Budget Benchmarking Data
– State Activity Comparison with other large districts (dollars)
– State Activity Comparison with other large districts (percentage)
– General Fund expenditures per student FTE by State Activity
– Executive Management Positions
2. Board Work Session: BTA IV Planning & Assessments
3. Federal & State Grants Summary
Appendix
29