Embed Size (px)
Citation preview

Fairfax Financial Shareholder’s Dinner
Bob Robotti President & CEO
April 8, 2014

Disclaimer The Firm is not providing investment advice through this material. This presentation is provided for informational purpose only as an illustration of the firm’s investment philosophy and shall not be considered investment advice or a recommendation or solicitation to buy or sell any securities discussed herein. As of the date of this presentation the firm continues to own the securities discussed herein. These opinions are not intended to be a forecast of future events, a guarantee of future results, or investment advice. Past performance is not indicative of future results, and no representation or warranty, express or implied, is made regarding future performance.
Robotti & Company Advisors, LLC or its affiliates may engage in securities transactions that are inconsistent with this communication and may have long or short positions in such securities. The information and any opinions contained herein are as of the date of this material, and the firm does not undertake any obligation to update them. Information contained in this presentation has been obtained from sources which we believe to be reliable, but we do not make any representation as to its accuracy or its completeness and it should not be relied on as such.
This material does not take into account individual client circumstances, objectives, or needs and is not intended as a recommendation to any person who is not a client of the firm. Securities, financial instruments, products or strategies mentioned in this material may not be suitable for all investors. Robotti & Company Advisors, LLC does not provide tax advice. Investors should seek tax advice based on their particular circumstances from an independent tax advisor.
In reaching a determination as to the appropriateness of any proposed transaction or strategy, clients should undertake a thorough independent review of the legal, regulatory, credit, accounting and economic consequences of such transaction in relation to their particular circumstances and make their own independent decisions.
2

About Robotti & Company Advisors
3
• Manage over $700 million in separate accounts and partnerships on behalf of institutional and individual clients
• Focus on small-to-mid capitalization equities of misunderstood, neglected, or out-of-favor companies
• Established in 1983 by Robert Robotti, our primary focus was on North American investments until 2004
• Expanded in 2005, when Isaac Schwartz launched Robotti & Company’s international investing initiative to apply Robotti & Company Advisors’ investment philosophy to the global equity markets

Two Edges Too Many
4
Behavioral Edge We take a longer-term view and have the ability to tolerate losing money
before we make it.
Leads Us To
Analytical Edge Within the context of a longer-term
perspective and 30+ years of experience, we have the ability to develop a different
conclusion than that of the market.
Informational Edge Our network of industry relationships, focus on deep primary research, and
experience serving on company boards, provides us with more pieces for building
our information mosaic.
Our behavioral edge comes from our ability to tolerate losing money before we make it. As a result, our investment process concentrates on understanding the long-term normalized earning power of a business well before the herd, in this case the market, gains interest.

Value Investing: A Big Tent
5
Expensive
Quality
Graham and Dodd
Cheap
Valu
atio
n
Low High
Warren Buffett
“Ideal”
“In theory there is no difference between theory and practice. In practice there is.” - Yogi Berra

What Is A Good Business
6
A high quality or good business is one that
can earn above average returns on capital over a sustained period of time.

Economics 101
7
In a competitive economy, firms that earn above-average returns will quickly attract competition.
Competitors emerge and attempt to compete even more efficiently and/or effectively. This places downward pressure on returns.
As new competitors continue to enter, demand becomes spread among more participants. Average costs will rise as fixed costs are spread over fewer units sold.
Prices fall until returns on capital are driven to a level at or below the cost of capital and economic profits disappear (setting the stage for industry restructuring).

Rivalry of Competitors
Bargaining Power of Suppliers
Bargaining Power of
Customers
Threat of Substitute Products
Threat of New Entrants
Porter
Porter’s Five Forces: Four Too Many?
8
Threat of New
Entrants
Rivalry of Competitors
Bargaining Power of Suppliers
Bargaining Power of
Customers
Threat of Substitute Products
Greenwald
Source: “How Competitive Forces Shape Strategy,” Harvard Business Review, Michael Porter
Source: “Competition Demystified,” Bruce Greenwald

Companies with Barriers to Entry?
9
• According to Bruce Greenwald: “Without the protection of barriers to entry, the only option a company has is to run itself as efficiently and effectively as possible.”
• For companies with barriers to entry, it is most important to execute a strategy that will sustain those barriers.
Expensive
Quality
Graham and Dodd
Cheap
Valu
atio
n
Low High
Warren Buffett
“Ideal”

Primary Sources of Competitive Advantages?
10 Source: “Competition Demystified,” Bruce Greenwald
Type Definition Source Supply Advantages:
Cost advantages that allow a company to produce and deliver its products or services more cheaply than its competitors
• Lower input costs / privileged access to resources
• Proprietary technology
Demand Advantages:
Access to customers that rivals cannot match – customer captivity
• Habit • Switching Costs • Search Costs
Economies of Scale:
Advantage exists if average cost per unit declines as the firm produces more, leaving smaller competitors unable to compete
• Size - but it is important to remember that pure size alone is not the same thing as economies of scale.

CASE STUDY
OB:SUBC
110.40 NOK / $18.42 USD (as of 4/4/2013)

Subsea 7 SA (OB:SUBC)
• Subsea 7 is a global leader in subsea engineering & construction - a niche industry with a sustainable competitive advantage.
• It is the only pure-play among the 3 dominant competitors in an industry with the dynamics to create a runway for significant growth.
• Subsea 7 maintains a solid balance sheet and leadership interests are aligned with shareholders.
• The company has a record backlog indicating the potential for strong growth, yet still trades at a modest multiple of earnings.
Market Capitalization (USD mm as of 4/4/14)
Price $18.42 Shares 350.8 Market Cap $6,462 Long-Term Debt 636 Minority Interest 47 Cash 650 Enterprise Value $6,495
1 Adjusted for convertibles – see slide 30 Source: Capital IQ
12
Valuation Summary
Investment Summary
Trading Summary 52 Week High / Low: $22.61 / $16.70 Avg Daily Volume: 1.4 million shares Listing Exchange: Oslo Bourse
3 Year Price Chart
FY 12/31 2013 2014E 2015E Revenue 6,297 6,860 7,159
ev/revenue 1.0x 0.9x 0.9x EBITDA 981 1,404 1,538
ev/ebitda 6.6x 4.6x 4.2x EPS $0.93 $1.89 $2.03
p/e 19.7x 9.7x 9.2x
1
1

Business Description • Seabed-to-surface engineering, construction and services
contractor to the global offshore energy industry
• Capable of executing projects of all sizes and complexity in all water depths
13

Investment Thesis / Variant Perception Global leader in oligopolistic industry dominated by 3 competitors
Near-term industry-wide concerns and company-specific issues have caused the market to view the business solely through disappointing past earnings and depressed margins
Normalized growth / margins for the industry and the company are being ignored
Long-term, there are dynamics in place to allow for a long runway of revenue growth in an industry protected by sustainable barriers to entry
Backlog growth is just the tip of the iceberg, indicating the potential for significant revenue growth and increased returns on capital
Low margin contracts signed during the 2009-2011 period are being replaced with higher margin contracts
High insider ownership aligns the interest of management and shareholders – capital investment and reinvestment opportunities are focused on returns
We believe that shares trade at > 50% discount to the company’s intrinsic value
14

Industry Map Reservoir Data CGG Veritas, TGS Nopec, Polarcus
Deepwater & UDW E&C Saipem, Subsea 7, Technip
Anadarko
BP Chevron CNOOC
ENI ExxonMobil
PEMEX Petrobras Repsol Shell
Statoil Total
15
Contract Drilling Atwood, Diamond Offshore, Ocean Rig, Rowan, Seadrill, Transocean
Service Equipment Manufacturing Cameron, FMC, Aker
Logistical Support Bristow, Era, Tidewater
Oil Service Majors Baker Hughes, Halliburton, Schlumberger
Major IOCs & NOCs
Other Equipment & Services Cal Dive Intl, Hornbeck Offshore, Oceaneering
Shallow & Deepwater E&C Allseas, EMAS-AMC, Heerema, McDermott

Industry Overview
16
EIPC: Engineering, Procurement, Installation and Commissioning Sapura Crest merged with Kencana in April 2012 and is now known as SapuraKencana Source: Subsea 7 September 2012 Company Presentation

Merger Between Acergy and Subsea 7
17
• In July 2011, Acergy and Subsea 7 merged further consolidating the industry from four to three competitors
• Complementary service offerings, technology offerings and geographic strengths – especially important for local content offerings in key markets
• Kristian Siem – whose interests are aligned with shareholder through large ownership of shares – is named Chairman of Subsea 7 S.A.
Source: Subsea 7 / Acergy Merger Presentation; Robotti & Company Research

Deepwater Lifecycle
18 * Subsea 7 Service Capability
Prospect Identification & Evaluation • Seismic • Subsea Inspections • Drill Wells • Collect & Analyze
Well Data • ROV Support*
Planning, Drilling & Completion, Installation • Reservoir Modeling • Subsea Surveys • TLP/Spar/FPSO • Subsea Tie Back* • Pipelines* • Well Design • Drill Developments • FEED* • Engineering* • Fabricate Topsides • Fabricate
Pipelines* • Heavy Lift • Pipelay*
Production • Outsourced
Labor • Infrastructure
Inspections & Maintenance
• Workovers • Infill Drilling • Platform
Modification • Life-of-Field*
Shut-In • Heavy Lift – Subsea
Pipelines, Platform/Topsides, Pipelines
• FPSO Demobilization
Exploration & Appraisal Development Production Decommission
2 – 10 years 1 – 5 years 10 – 30 years 1 – 2 years
Investment Period Harvest Period
Subsea 7 Work
Subsea is well-positioned at the fulcrum between investment and
cashflow

SURF (72.4%)
Conv / Hook-up (11.7%)
Life-Of-Field
(12.3%)
i-Tech (3.6%)
Segments by Service Capability
19
• Remote intervention and drilling support technologies with global fleet of ROVs from observation-class to purpose-built drill support vehicles ROV Support
• Engineering, procurement, installation and commissioning of subsea umbilicals, risers, flowlines and structures SURF
• Fabrication / installation of fixed platforms & pipelines • Addition of modules on new platforms and the refurbishment of topsides of
existing fixed and floating platforms Conventional / Hook-Up
• Heavy lifting in both the development and decommissioning stages. Heavy Lifting
• Inspection, maintenance, repair and integrity management of subsea infrastructure Life-of-Field
Source: Subsea 7 Annual Report
Revenue by Service Capability:

Brazil (13.0%)
NSC (40.0%)
AFGOM (39.0%)
APME (8.0%)
Segments by Geography
20
• 850 people • SURF Brazil
• 2,850 people • SURF, LOF, Conventional/Hook-Up
Africa, Gulf of Mexico & Mediterranean
• 270 people • SURF and LOF
Asia Pacific & Middle East
• 2,300 people • SURF and LOF North Sea & Canada
Revenue by Geography:
Source: Subsea 7 Annual Report

Leadership / Capital Allocation
Source: Subsea Annual Report 21
• Chairman of Subsea 7 since January 2002
• Assumed Chairman role upon the merger of Subsea 7 with Acergy
• Active in the oil & gas industry since 1972
• Currently Chairman of Siem Industries and Siem Industrikaptial
• Past director of Aker Kvaener and Transocean
• CEO of Subsea 7 since April 2008 • Active in the offshore oil & gas
industry • Prior experience as COO and then
President of Transocean • Spent 21 years in various positions
at Schlumberger
• In 2012, Subsea 7 exited two non-core businesses:
Sold stake in NKT Flexibles
Spun-off VERIPOS as a dividend in-kind to shareholders.
• In 2013 Subsea 7 authorized a $200 million share repurchase, of which $109 million was remaining at year end and paid a special dividend of $199 million. In 2012 the company repurchased $200 million of shares and paid $199 million of dividends.
• Interests are aligned - Siem Industries, which is controlled by Mr. Siem and other family members, owned 69.7 million shares of Subsea 7 or 19.8% of issued shares.
Capital Allocation
Kristian Siem Chairman
Jean Cahuzac CEO
Key Leaders

Mr. Market Reacts to Brazil
Source: Subsea 7 conference call, Robotti & Company research 22
• On June 27, 2013 Subsea 7 surprised the market by announcing the Guara-Lula project in Brazil would lose $250 - $300 million more than expected.
Issues cited were: (1) continued supply chain issues, (2) pipeline fabrication delayed on customs clearance issues, and (3) adverse weather issues.
• In 2010, just 3 months after the merger between Subsea 7 and Acergy, Petrobras awarded the company a $1 billion contract for work in the Guara-Lula pre-salt region.
• In late 2011 it became apparent that Subsea 7 would not be able to gain the necessary permits to use the yard it had originally planned upon. This led to the announcement of a $50 million cost overrun.
• An additional $52 million write-down on the project occurred in Q4 2012. At the end of FY 2013 Subsea 7 announced an additional $49 million write-down, bringing the total full-life provision to $355 million.
While these issues are not insignificant, our discussions with management and primary research leads us to believe this is a contract specific event and not indicative of how other contracts that represent current and future revenue will progress.

Key Investment Factors
23
Subsea 7 is a global leader in oligopolistic industry dominated by 3 competitors. Barriers to entry will allow for above average returns on capital over the long-term.
Near-term industry-wide concerns and specific company issues have caused the market to view the business solely through disappointing past earnings, and depressed margins creating a misperception. Long-term, there are dynamics in place to allow for a long runway of revenue growth in an industry protected by sustainable barriers to entry.
Backlog growth is just the tip of the iceberg, indicating the potential for significant revenue growth and increased returns on capital.
Normalized growth rates and margins for both the industry and the company are being ignored.

• Historical returns on equity do not indicate the presence of barriers to entry.
Indicators of Barriers to Entry
Source: Company Financials, Capital IQ, Robotti & Company Calculations 24
• The ultra-deepwater engineering & construction industry does, however, have a limited number of incumbent competitors with a history of dominating the industry.
0%
10%
20%
30%
40%
50%Subsea 7 Return on Equity 2008- Present

Evidence of a Competitive Advantage
25
Source Type Evidence
Proprietary Technology
Supply Advantage
History of increasingly complex engineering needs in deeper water requires a demonstrated track record of successful and safe execution.
Privileged Access to Resources
Supply Advantage
In this case, the resource is skilled labor.
Customer Captivity
Demand Advantage
The tangible and intangible costs of searching for someone who can complete a major ultra-deepwater project at or above the standard of “the big three” are very high.

Deepwater Production • Declining production of international oil companies drive demand for oil services • Deepwater represents the greatest opportunity to replenish major oil & gas reserves • Also presents greater technical challenges and increased overall complexity
Source: FMC Technologies 2013 Investor Presentation
26
02000400060008000
1000012000
Average Deepwater Well Depth (ft)
Source: BSEE, Hornbeck 2013 Investor Presentation

Revenue Driver: Industry Backlog
27 Source: Company Filings
$0
$5,000
$10,000
$15,000
$20,000
$25,000
$30,000
$35,000
$40,000Industry Backlog – The Big 3
Saipem - Subsea Technip - Offshore Subsea 7

Revenue Driver: Subsea 7 Backlog
28 Source: Subsea 7 Financial Statements
$0
$2,000
$4,000
$6,000
$8,000
$10,000
$12,000
Q1 2011 Q2 2011 Q3 2011 Q4 2011 Q1 2012 Q2 2012 Q3 2012 Q4 2012 Q1 2013 Q2 2013 Q3 2013 Q4 2013
Backlog Progression 2011 - Present Backlog above $10 bn for the
first time
$0
$1,000
$2,000
$3,000
$4,000
$5,000
AFGOM APME Brazil NSC
Current Backlog by Region
$0
$1,000
$2,000
$3,000
$4,000
$5,000
$6,000
$7,000
2014 2015 2016 2017 - 2022
Current Backlog by Year of Execution
Revenue Driver – Backlog Progression
29
Well known by the market
Underappreciated by the market because of horizon to realization
• Reported Backlog over $12 billion
(updated for recent announcements)
• Potential for >420 Tree Awards over the next 15 months1
• Over $10 billion of contract awards expected over the next 18 months 2
• Worldwide offshore rig count is expected to increase over 50% between 2012 - 2015 3
Revenue Driver: Variant View of Potential Backlog
1 FMC Technologies Presentation, Quest Offshore Resources, May 2013 2 Robotti & Company Research 3 IHS-Petrodata, Barclays Research

Comparable Analysis – The Big Three
1 Company reports diluted shares assuming conversion of all convertible bonds regardless of current share price. Diluted shares adjusted for 2017 convertible bonds with a conversion price of $29.31 as of 12/31/2013. LT Debt adjusted for convertible bonds with a conversion price of $15.82 as of 12/31/2013. Source: Company Financials, Capital IQ, Robotti & Company Advisor Calculations, All in USD
30
Ticker Name Price Dil
Shrs Mkt Cap EV
Gross Margin
EBITDA Margin
EBIT Margin ROE
Debt / EBITDA
Debt / Equity
OB:SUBC Subsea 7 SA $18.42 351 1 6,462 6,495 12.4 13.1 7.7 5.4 1.1 13.8
BIT:SPM Saipem SpA $24.31 439 10,682 17,367 24.5 5.2 (0.8) (7.4) 7.5 99.2
ENXTPA:TEC Technip SA $100.27 112 11,198 10,791 17.3 11.1 8.8 14.0 2.5 61.8
Mean: 18.1 9.8 5.2 4.0 3.7 58.3
Median: 17.3 11.1 7.7 5.4 2.5 61.8
EBITDA EPS
Ticker Name FY 2013 EV/
EBITDA FY 2014E EV/
EBITDA FY 2013 Price /
Earnings FY 2014E Price /
Earnings
OB:SUBC Subsea 7 SA 981 6.6 1,404 4.6 0.99 18.5 1.89 9.7
BIT:SPM Saipem SpA 862 20.1 1,977 8.8 – na 1.07 22.7
ENXTPA:TEC Technip SA 1,431 7.5 1,502 7.2 6.44 15.6x 6.47 15.5
Mean: 11.4 6.9 17.0 16.0
Median: 7.5 7.2 17.0 15.5
Comparable Fundamental Analysis
Comparable Valuation Analysis

Earnings Summary
1 Company reports diluted shares assuming conversion of all convertible bonds regardless of current share price. Diluted shares adjusted for 2017 convertible bonds with a conversion price of $29.31 as of 12/31/2013. LT Debt adjusted for convertible bonds with a conversion price of $15.82 as of 12/31/2013.
Source: Company Financials / Capital IQ 31
(USD mm) 2011 2012 2013 Revenue 5,476.5 6,296.6 6,297.1 growth 15.0% (0.0%)
Gross Profit 946.4 1,095.0 742.2 gross margin 17.3% 17.4% 22.0%
Adjusted EBITDA 1,003.0 1,139.0 981.0 ebitda margin 18.3% 18.1% 15.6%
Operating Income 640.5 808.2 573.4 operating margin 11.7% 12.8% 9.1%
Gain on Disposal of Subsidiary – (243.6) – Net Income 450.7 847.2 349.9
Adjusted EPS $1.23 $1.59 $0.99 Diluted EPS $1.23 $2.23 $0.99 Diluted Shares 366.3 380.2 350.8 1

Valuation / Margin of Safety
Source: Robotti & Company Research 32
Revenue (USD) 8,500 9,000 9,500 10,000 10,500 11,000
15% 900 975 1,050 1,125 1,200 1,275 17% 1,020 1,105 1,190 1,275 1,360 1,445 19% 1,140 1,235 1,330 1,425 1,520 1,615 21% 1,260 1,365 1,470 1,575 1,680 1,785 23% 1,380 1,495 1,610 1,725 1,840 1,955 25% 1,500 1,625 1,750 1,875 2,000 2,125
Implied EBITDA
Implied Stock Price (7x EBITDA) Implied Margin of Safety
EB
ITD
A M
argi
n
Revenue (USD)
6,200 6,400 6,600 6,800 7,000 7,200
15% $17.86 $19.36 $20.86 $22.35 $23.85 $25.35
17% $20.26 $21.95 $23.65 $25.35 $27.04 $28.74
19% $22.65 $24.55 $26.44 $28.34 $30.23 $32.13
21% $25.05 $27.14 $29.24 $31.33 $33.43 $35.52
23% $27.44 $29.74 $32.03 $34.32 $36.62 $38.91
25% $29.84 $32.33 $34.82 $37.32 $39.81 $42.31
Revenue (USD)
6,200 6,400 6,600 6,800 7,000 7,200
15% (3.0%) 5.1% 13.2% 21.4% 29.5% 37.6%
17% 10.0% 19.2% 28.4% 37.6% 46.8% 56.0%
19% 23.0% 33.3% 43.6% 53.8% 64.1% 74.4%
21% 36.0% 47.3% 58.7% 70.1% 81.5% 92.8%
23% 49.0% 61.4% 73.9% 86.3% 98.8% 111.3%
25% 62.0% 75.5% 89.1% 102.6% 116.1% 129.7%

Risks to Our Thesis
33
• The safe and successful execution of large, complex EPIC projects is a primary risk. Supply chain delays can reverberate throughout a project.
• While management believes the current provision for the Guara-Lula Project in Brazil is sufficient, additional problems could require additional write-downs.
• Operations in deepwater are subject to unpredictable events such as severe weather or harsh ocean environments.
• Increasing competition in shallower water could result in decreased profitability should well depth not continue to increase.
• Commodity Risk: “A good forecaster is not smarter than everyone else, he merely has his ignorance better organized.” -Anonymous
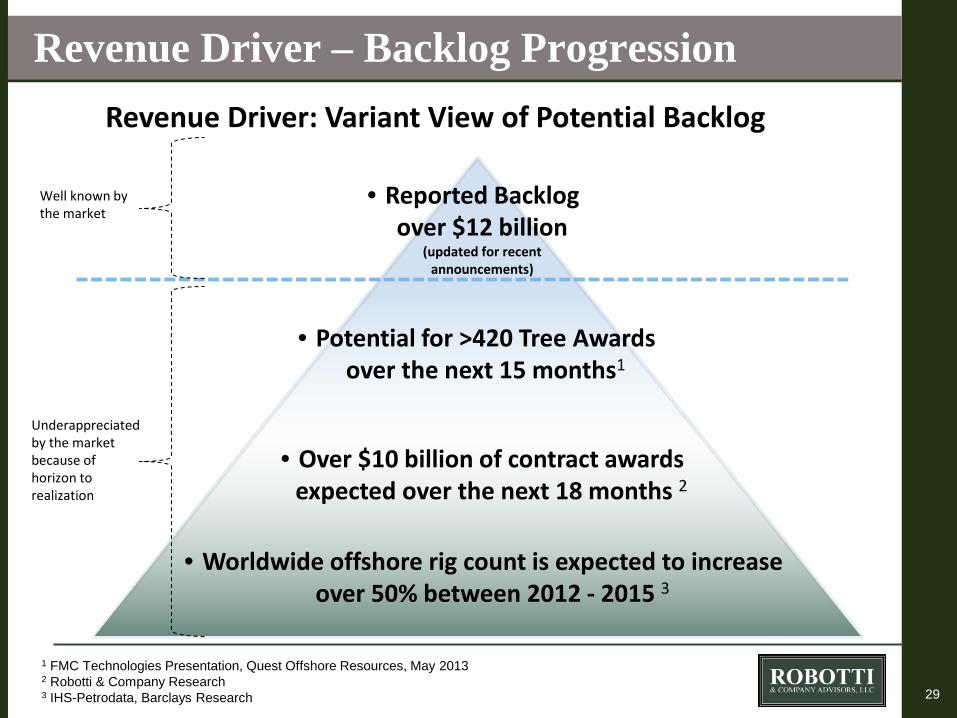
Disclosure: Ownership Information
Disclosures Subsea 7 (OB:SUBC)
Robert Robotti and/or members of his household has a financial interest in the following securities Yes
Robotti & Company or its affiliates beneficially own common equity of the following securities Yes
Robotti & Company or its affiliates beneficially own 1% or more of any class of common equity of the following securities Yes
Robert Robotti serves as a Director or Officer or Advisory Board Member of the following securities No
As of the date of this presentation, Robotti & Company Advisors, LLC and/or its affiliates owns shares of Subsea 7 and does not have any current intention to exit this position. Companies have been chosen solely as a case study to illustrate the investment process and approach of Robotti & Company Advisors, LLC. This information should not be interpreted as a performance record or as an indication of future performance results.
34

QUESTIONS 6 East 43rd Street, 23rd Floor
New York, NY 10017
Phone: (888) 762 - 6884 [email protected] www.robotti.com