Embed Size (px)
Citation preview

Boben, D., Dobrean, A., Raven, J., & Raven, J. (2011, July 14). Slovenian and Romanian Norms for the RavenProgressive Matrices in a Cross-Cultural Context. WebPsychEmpiricist. Retrieved July 14, 2011 fromhttp://wpe.info/papers_table.html.
WPE WebPsychEmpiricist
Slovenian and Romanian Norms for the Raven Progressive Matrices in a Cross-Cultural Context
July 14, 2011
Dusica Boben1, Anca Dobrean2, and Jean & John Raven3
Abstract
The paper illustrates some of the difficulties involved in generating reliable cross-cultural dataand the value of generating meaningful data. Specifically, it illustrates (a) the dependence ofwhat appear to be significant differences between cultural groups on variation in sampling andtesting procedures; (b) the importance of examining such differences within age and abilitycategories; and (c) the irrelevance of the most commonly proffered explanations of cross-culturaldifferences in Raven Progressive Matrices scores. It also documents a major discrepancybetween the reference data obtained in Romania – and especially that relating to less able youngpeople – and those obtained in other countries.
1 Dusica Boben, Center za psihodiagnosticna sredstva, d.o.o., Litostrojska 44d, 1000 Ljubljana, Slovenia.2 Anca Dobrean, Department of Clinical Psychology and Psychotherapy, Faculty of Psychology and EducationalSciences, Babes Bolyai University, Republicii st., no. 37, 400015 Cluj-Napoca, Romania.3 John and Jean Raven, 30 Great King St., Edinburgh EH3 6QH, UK. Website: www.eyeonsociety.co.uk

WPE Slovenian and Romanian Norms for the RPM 2
Slovenian and Romanian Norms for the Raven Progressive Matrices in a Cross-Cultural Context
July 14, 2011
*****
It is particularly useful to use the normative data collected with Raven’s Progressive Matrices4
tests in Slovenia to illustrate some of the problems involved in making cross-cultural
comparisons because data have been collected with all four Raven tests, namely the Coloured
Progressive Matrices, the Classic Standard Progressive Matrices, the Advanced Progressive
Matrices, and the Standard Progressive Matrices Plus. The basic data, along with descriptions of
the samples etc., were originally published in Boben (2003, 2008).
Nevertheless, it is useful, before doing so, to illustrate some of the problems which arise in this
kind of work by summarising some results. (Flynn, 1991, 2008; Flynn & Rossi-Casé, 2011).
As a result of the conspicuous and well documented over-performance of Asians in American
Universities, it came to be believed that they had extraordinarily high IQs. This idea seemed to
be supported by a number of studies of their IQs. However, because of the less-than-well-known
difficulties involved in testing representative samples of such populations, those responsible for
conducting such studies often compare the data they have collected with those collected by
others … and then make what seem to be appropriate adjustments to bring their results into line
with what they believe to be the better studies. An illustrative case study is provided by Flynn
(1991, 2008).
In 1966, the 1954 version of the Primary Mental Abilities test was administered to 253 children
born in the most northwestern island of the Hawaiian chain. Their scores were then compared
with those reported in the 1954 test Manual.
4 For a brief description of the Raven Progressive Matrices see Wikipedia entry.

WPE Slovenian and Romanian Norms for the RPM 3
However, believing that the scores they had obtained in research actually conducted in 1954
were too high, the researchers who prepared the Manual had equated them with those obtained in
a 1932 standardisation of the Binet test.
The result was that when the scores of the 1966 sample of Asians were compared with the
general population norms published in the Manual the authors were, in effect, and without their
knowing it, comparing them, not with 1954 data but with 1932 data.
The resulting “high” scores were therefore, in reality, to be attributed to something unknown at
the time – namely the now well-documented intergenerational increase in scores (the so-called
“Flynn effect”) – and not to differences in ethnicity. Flynn (1991, 2008) has shown that the
outstanding life performances of Chinese in America are not due to superior “intelligence” but to
other factors commonly overlooked by psychologists.
Such adjustments to raw data in an effort to compensate for such things as deficiencies in
samples arising from the absence of adequate sampling fames or lack of adequate funds are, in
reality, quite common.
In fact, sampling problems bedevil work in this area to a much greater extent than is often
realised. Thus there is a prolific literature on gender differences … including much theory
building … which is (as Flynn, 2011, has, as a result of a Herculean effort, also shown [Flynn &
Casé, 2011]), to all intents and purposes, not merely useless but also extremely misleading.
There are always huge gender differences within pre-selected samples – such as university
students specialising in engineering, biological sciences, and arts. These differences are often in
opposite directions and problems arise when they are used to try to estimate overall gender
similarities and differences in the age groups from which they are drawn – and for whom it is
inherently almost impossible to construct a sampling frame from which to select a representative
sample of the population to test.

WPE Slovenian and Romanian Norms for the RPM 4
Similarities and differences between RPM scores in Slovenia and the UK.
Table 1 gives an example of the format in which it has been found most useful to present
normative data for the Raven Matrices tests. It shows the scores obtained on the Classic Standard
Progressive Matrices (SPM) test by what is believed to be a representative sample of young
people in Slovenia (Boben, 2003).
One of the advantages of this format is that it shows the scores obtained by people of different
ages and ability and thus facilitates detailed study of cross-cultural differences within these
specific groups. The format is also important because it deters users from making unjustifiable
inferences from the data. For example, it is clear that the within-age distributions are not
Gaussian (i.e. not what is often misleadingly termed “normal”).
Thus, in Table 1, the difference between the 50th percentile score (which is approximately equal
to the mean) for 8 year olds and the 75th percentile is 9 raw score points, while that between the
50th and 25th percentile is 5 (i.e. the distribution is truncated, skewed, at the lower end). By 18
years of age this is reversed, the relevant figures being 3 and 7. The presentation also discourages
attempts to make the kind of fine discriminations encouraged by presentation in terms of
deviation-IQs. For example, the difference between the 90th and 95th percentile scores (equivalent
to IQs of 120 and 125) for most age groups is only 2 raw score points … hardly likely to support
generalisations – and assignment of life chances – based on small differences. And worse is to
come. The total numbers which form the bases on which many of the columns of percentiles in
Table 1 are based are around 100. Had the data been presented in terms of six month age groups,
the “n’s” would have been around 50. That would mean that the scores shown in the table for the
5th and 95th percentiles would be the scores obtained by the 2nd last child at the bottom and top of
the distribution respectively. For this reason they would be subject to marked variation arising
from sampling “error” and thus hardly provide a basis for confident generalisation about
people’s future lives!
As an aside we may note that fine discrimination beyond 5th and 95th percentiles – where tests are
most used (e.g. for assessing eligibility for “gifted” and “remedial” education) – is usually

WPE Slovenian and Romanian Norms for the RPM 5
unjustifiable. In fact, the figures published for most tests in these ranges are derived from
statistical extrapolations derived from fitting curves to the scores obtained in the centre of the
distribution and not on empirical data. As a result the published scores depend on the
assumptions and decisions (such as whether to fit a Gaussian or bi-modal curve to the raw data)
made by the statisticians who calculated them. Thus Dockrell (1989) showed that someone with
a scaled score of 24 on the WISC-R would be said to have an IQ of 47 if the statistician who
compiled the norms fitted a Gaussian curve to the data (the usual approach) but 60 if he or she
extrapolated the true curve derived from the standardisation sample.
One last incidental observation to be made from Table 1 is that there is more variation between
the 5th and 95th percentile scores for 8-year-olds than there is in the average scores of children
from 8 to 18 years of age. This within-age variation makes any discussion of variation in mean
scores between ethnic populations of apparently similar age heavily depended on sampling
“error”. (This variety also contributes to the practical difficulties teachers encounter in education,
although it is not, in reality, the most important source of such variation [Raven, 2008].)
Figure 1 presents the same data as were presented in Table 1 in graph form.
Note that these are not growth curves … they are simply the same normative (reference) data for
Slovenia as were shown in Table 1 but this time in graph form. Thus we again see that 5% of
Slovenian 8-year-olds score below 10 and 5% above 40. And the mean (50th percentile) score is
23.
Figure 2 compares these Slovenian data with similar data from Great Britain.On the whole, the
UK and Slovenian norms are very similar.
The lower Slovenian 5th percentile cannot be explained from anything contained within these
data but could have something to do with the way the sample was drawn. Note that this
difference is not visible in the 50th percentile scores. Presentation in terms of mean scores alone
would, therefore, lead to misleading conclusions.

WPE Slovenian and Romanian Norms for the RPM 6
Figure 3 shows similar comparative data for the Coloured Progressive Matrices (CPM: Raven,
Rust, & Squire, 2008).
It would seem that the more able of the younger Slovenian children do better than the more able
Dumfries (UK) schoolchildren. But the norms are similar after the age of nine.
Notice that it would be meaningless to make comparisons of higher percentiles (and therefore
“means”) above the age eight because of obvious ceiling effect.
Again, these data provide no insight into what might have caused the difference … but it may be
suggested that it might have something to do with the testing arrangements.
At this point it is useful to reiterate something said earlier: To understand what is going on it is
essential to examine the data within both age and percentile categories.
Figure 4 presents comparative data (for a much narrower range of age groups) for the Advanced
Progressive Matrices, Set II. Again, the impression is of similarity. Figure 5 shows the data for
the Standard Progressive Matrices Plus. Again, the over-riding impression is one of similarity.
The RPM data in a wider context
The Manual for the Raven Progressive Matrices (Raven, Raven, & Court, 2000, updated 2004),
Uses and Abuses of Intelligence (Raven & Raven, 2008), and various article published on
WebPsychEmpiricis5t all contain a great deal of comparative material for the Coloured,
Standard, and Advanced Progressive Matrices tests (Abdel-Khalek & Raven, 2008, June 17;
original 2005, September 2 September 2 #174; Boben, 2007, May 23; Deshpande & Patwardhan,
2006, September 4; Dobrean, Raven, Com_a, Rusu, & Balazsi, 2005, October 10; Linstrom,
Raven, & Raven, 2006, May 22; Taylor, 2008, June 30).
5 http://wpe.info

WPE Slovenian and Romanian Norms for the RPM 7
Less comparative data are available for the Standard Progressive Matrices Plus because the test
was published more recently.
However, the current publishers of the Raven Matrices tests, Pearson inc., have undertaken a
careful standardisation of the SPMPlus in the UK (Raven, Rust, & Squire, 2008) and the 2004
Romanian standardisation of that test is based on an excellent sample (Dobrean, Raven, Comsa,
Rusa, & Balazsi, 2008).
Having, in Figure 5, compared the Slovenian and UK data, Figure 6 presents data comparing the
Slovenian with the Romanian data. There is an unmistakable difference.
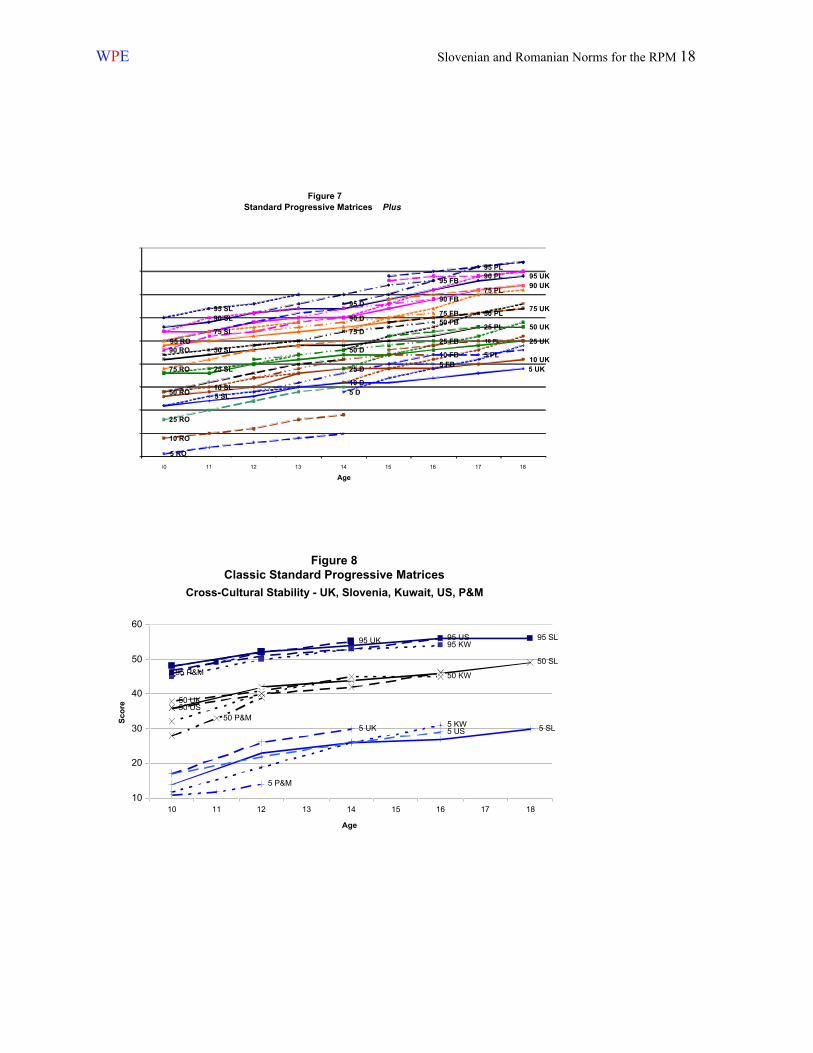
Data for the SPM+ had earlier been collected in Poland, Germany, and Fort Bend, Texas (See
Raven, Raven, & Court, 2000, updated 2004, for details).
Although these studies are, for one reason or another, less satisfactory, the data from all the
available studies are brought together in Figure 7. Although the Figure is rather cluttered, it does
make one point very clearly: The lower percentiles for Romania are well below those obtained in
the other locations.
One’s first suspicion has to be that they are due to the quality of the sample. However, so far as
one can judge from the available data (Dobrean et al., 2008) this was excellent. And this
conclusion is supported by the fact that the results obtained when the data were used to replicate
the item analyses carried out when the test was being constructed confirm, indeed strengthen, the
original conclusions. The distributions covered the full range of ability for which the test was
constructed and the item analyses suggested that there were few missing data and few deviant
results which might have indicated inadequacies in the sample emerged in the course of the
analyses (see Appendix 4 to Raven, Raven, & Court 2000, updated 2004).
Far from bringing to light anything which might have suggested some previously unnoticed
defects in the sample, the enquiries conducted at this time brought to light unexpected

WPE Slovenian and Romanian Norms for the RPM 8
confirmation of the result: The same long tail had been found in the course of Romanian
standardisations of other tests (Dobrean, personal communication).
At this point we can introduce one more set of data. This comes from a study of military
conscripts in Hungary (Klein, Klein, Joubert, & Gyenis, 2008) and thus from the total
population, not a sample, of Hungarian 18-year-olds.
These data are of more importance than many readers might appreciate. Whereas it is relatively
easy to get representative samples of young people in compulsory schooling, it is much more
difficult to get representative samples of 18-25 year olds because many are no long in schools,
have moved all over the place to different kinds of college and employment, and have not yet set
up households through which they could be sampled. (As mentioned earlier, this has major
implications for any attempt to investigate gender differences which might be proposed to appear
in this group but not at earlier ages.)
So, in Table 2, the strongest data are those from Hungary, the UK, and Romania.
It is clear that, while the Romanian norms for the 50th percentile and above correspond with these
two strong data sets, the lower percentiles fall further and further behind.
The conclusion, therefore, seems to be that the Romanian results are real … not a result of such
things as sampling defects … and merit an explanation.
A Still Wider Context
Figure 8 presents Classic Standard Progressive Matrices data for two more countries, Kuwait and
urban areas of India (Pune and Mumbay) (Abdel-Khalek & Raven, 2005, 2006; Deshpande &
Ojha, 2002; Despande & Patwardhan, 2008) which further underline the significance of the
discrepancy between the Romanian and other data. (We have omitted the graphs for most of the
percentiles in order to make the picture clearer.) These data confirm our earlier assertion that the

WPE Slovenian and Romanian Norms for the RPM 9
overall impression one gets from these studies is one of stability across cultures rather than
variation between them.
Table 3 does, however, round out the picture by documenting some genuine differences between
Indians living in urban and tribal areas. But note that, despite the fact that many of those living in
tribal areas have no education, no formal monetary mechanisms of exchange, live in mud huts
that are annually washed away by the rain, and speak a variety of different languages employing
different calligraphies, (a) the differences from the norms for the urban areas are much less than
one might have expected under these circumstances; (b) the test still “works” in the tribal group
in the sense that it scales in the usual way within this group; and (c) the distribution is not compressed
in the way in which one would expect if the socio-economic factors which have been mentioned
were exerting the widely expected effect on these abilities and inhibiting their development.
A Substantive Conclusion
A more general conclusion to the paper appears to be that differences in economic
circumstances, calligraphy, language, family size, access to TV, and nature of the educational
system seem to have much less effect than would commonly be supposed. All of which would
seem to make the quest for an explanation of the Romanian results even more difficult!
References
Abdel-Khalek, A. M., & Raven, J. (2005). Normative data from the standardization of Raven’s
Standard Progressive Matrices in Kuwait in an international context.
http://wpe.info/papers_table.html
Abdel-Khalek, A. M., & Raven, J. (2006). Normative data from the standardization of Raven’s
Standard Progressive Matrices in Kuwait in an international context. Social Behaviour and
Personality: International Journal, 34(4), 169-179.
Abdel-Khalek, A., & Raven, J. (2008, June 17; original 2005, September 2). Normative data from the
standardization of Raven's Standard Progressive Matrices in Kuwait in an international context.
WebPsychEmpiricist. Retrieved June 17, 2008 from http://wpe.info/papers_table.html.

WPE Slovenian and Romanian Norms for the RPM 10
Boben, D. (2003). Priro nik za Ravnove progresivne matrice in besedne lestvice. Slovenska
standardizacija Ravnovih progresivnih matric: norme CPM, SPM, APM. [Manual for
Ravenís Progressive Matrices and Vocabulary Scales. Slovenian Standardization of Ravenís
Progressive Matrices: CPM, SPM, AMP norms.] Ljubljana: Center za psihodiagnosticna
sredstva.
Boben, D. (2007, May 23). The standardization of all the main Raven Progressive Matrices tests in
Slovenia. WebPsychEmpiricist. Retrieved May 23, 2007 from http://wpe.info/papers_table.html.
Boben, D. (2008). The Standardisation of all the main Raven Progressive Matrices tests in
Slovenia. In J. Raven & J. Raven (Eds.) Uses and Abuses of Intelligence: Studies Advancing
Spearman and Raven’s Quest for Non-Arbitrary Metrics. Unionville, New York: Royal
Fireworks Press; Edinburgh, Scotland: Competency Motivation Project; Budapest, Hungary:
EDGE 2000; Cluj Napoca, Romania: Romanian Psychological Testing Services SRL.
(Chapter 10, pp. 288-314).
Deshpande, C. G., & Ojha, J. M. (2002). Indian Norms for Raven’s Standard Progressive
Matrices: A Normative Study in Delhi and Maharashtra. Delhi: Manasayan.
Deshpande, C. G., & Patwardhan, V. (2006, September 4). Raven Standard Progressive Matrices norms
for Indian tribal areas. WebPsychEmpiricist. Retrieved September 4, 2006 from
http://wpe.info/papers_table.html.
Deshpande, C. G., & Patwardhan, V. (2008). Standard Progressive Matrices Norms for Indian
Tribal Areas. In J. Raven & J. Raven (Eds.) Uses and Abuses of Intelligence: Studies
Advancing Spearman and Raven’s Quest for Non-Arbitrary Metrics. Unionville, New York:
Royal Fireworks Press; Edinburgh, Scotland: Competency Motivation Project; Budapest,
Hungary: EDGE 2000; Cluj Napoca, Romania: Romanian Psychological Testing Services
SRL. (Chapter 16, pp. 392-401).
Dobrean, A., Raven, J., Comsa, M., Rusu, C., & Balazsi, R. (2005, October 10). Romanian
Standardization Of Raven’s Standard Progressive Matrices Plus. WebPsychEmpiricist. Retrieved
October 10, 2005 from http://wpe.info/papers_table.html.
Dobrean, A., Raven, J., Comsa, M., Rusa, C., & Balazsi. R. (2008). The Romanian
Standardisation of the SPM Plus: Sample and general results. In J. Raven & J. Raven (Eds.)
Uses and Abuses of Intelligence: Studies Advancing Spearman and Raven’s Quest for Non-

WPE Slovenian and Romanian Norms for the RPM 11
Arbitrary Metrics. Unionville, New York: Royal Fireworks Press; Edinburgh, Scotland:
Competency Motivation Project; Budapest, Hungary: EDGE 2000; Cluj Napoca, Romania:
Romanian Psychological Testing Services SRL. (Chapter 4, pp. 113-126).
Dockrell, W. B. (1989). Extreme scores on the WISC-R. Bulletin of the International Test
Commission, 28, April, 1-7.
Flynn, J. R. (1991). Asian Americans: Achievement Beyond IQ. Hillside, NJ: Lawrence Erlbaum
Associates.
Flynn, J. (2008). Asian Americans: Achievement well beyond IQ. In J. Raven & J. Raven (Eds.)
Uses and Abuses of Intelligence: Studies Advancing Spearman and Raven’s Quest for Non-
Arbitrary Metrics. Unionville, New York: Royal Fireworks Press; Edinburgh, Scotland:
Competency Motivation Project; Budapest, Hungary: EDGE 2000; Cluj Napoca, Romania:
Romanian Psychological Testing Services SRL. (Chapter 18, pp. 415-430).
Flynn, J. R., & L. Rossi-Casé (2011). (Appendix to) Modern women match men on Raven's
Progressive Matrices. Personality and Individual Differences 50: 799-803.
Klein, B., Klein, S., Joubert, K, & Gyenis, G. (2008). Social cage (socio-economic status and
intelligence in Hungary. In J. Raven & J. Raven (Eds.) Uses and Abuses of Intelligence:
Studies Advancing Spearman and Raven’s Quest for Non-Arbitrary Metrics. Unionville, New
York: Royal Fireworks Press; Edinburgh, Scotland: Competency Motivation Project;
Budapest, Hungary: EDGE 2000; Cluj Napoca, Romania: Romanian Psychological Testing
Services SRL. (Chapter 26, pp. 568-593).
Linstrom, A., Raven, J., & Raven, J. (2006, May 22). The Coloured Progressive Matrices in South
Africa. WebPsychEmpiricist. Retrieved May 22, 2006 from http://wpe.info/papers_table.html.
Raven, J. (2008). Intelligence, engineered invisibility, and the destruction of life on earth. In J.
Raven & J. Raven (Eds.) Uses and Abuses of Intelligence: Studies Advancing Spearman and
Raven’s Quest for Non-Arbitrary Metrics. Unionville, New York: Royal Fireworks Press;
Edinburgh, Scotland: Competency Motivation Project; Budapest, Hungary: EDGE 2000; Cluj
Napoca, Romania: Romanian Psychological Testing Services SRL. (Chapter 19, pp. 431-471).
Raven, J., & Raven, J. (Eds.). (2008). Uses and Abuses of Intelligence: Studies Advancing
Spearman and Raven’s Quest for Non-Arbitrary Metrics. Unionville, New York: Royal
Fireworks Press; Edinburgh, Scotland: Competency Motivation Project; Budapest, Hungary:
WPE Slovenian and Romanian Norms for the RPM 12
EDGE 2000; Cluj Napoca, Romania: Romanian Psychological Testing Services SRL. First
Chapter followed by many others at http://eyeonsociety.co.uk/resources/UAIPartI.pdf
Raven, J., Raven, J. C., & Court, J. H. (2000, updated 2004). Manual for Raven's Progressive
Matrices and Vocabulary Scales. Section 3: The Standard Progressive Matrices, Including
the Parallel and Plus Versions. San Antonio, TX: Harcourt Assessment.
Raven, J., Rust, J., & Squire, A. (2008). Manual: Coloured Progressive Matrices and Crichton
Vocabulary Scale. London, England: NCS Pearson, Inc.
Taylor, N. (2008, June 30). Raven’s Standard and Advanced Progressive Matrices among Adults in
South Africa. WebPsychEmpiricist. Retrieved June 30, 2008 from
http://wpe.info/papers_table.html.

WPE Slovenian and Romanian Norms for the RPM 13
Classic Standard Progressive Matrices
Smoothed 1998 Norms for Slovenia
Age in Years (Months)
87(6)
to8(5)
98(6)
to
9(5)
109(6)
to10(5)
1110(6)
to
11(5)
1211(6)
to
12(5)
1312(6)
to
13(5)
1413(6)
to
14(5)
1514(6)
to
15(5)
1615(6)
to
16(5)
1716(6)
to
17(5)
1817(6)
to
18(5)Percentile
95 40 46 48 50 52 53 54 55 56 56 56
90 37 42 46 48 50 52 52 53 54 54 54
75 32 39 43 45 47 48 49 50 51 52 52
50 23 31 36 40 42 43 44 45 46 48 49
25 18 22 28 33 37 38 39 40 41 41 42
10 12 16 20 24 30 32 33 35 35 35 36
5 10 11 14 17 23 25 26 26 27 29 30
n 99 128 115 125 123 116 132 144 283 211 80
Table 1
Standard Progressive Matrices PlusSmoothed 2003 Norms for Romania
In the Context of 2008 UK Norms, Army Conscripts in Hungary, Army Recruits in Poland, and Germany
Age in Years (Months)
1817(9)
to18(2)
18.518(3)
to18(8)
18 18 18.518(0)
to18(11)
18.5Army
Conscripts
18.5Army
Recruits
2018to22
25
Percentile RO RO PL D UK H PL RO PL
95 46 47 52 52 49 49 44 47 52
90 45 46 50 50 47 47 42 46 48
75 40 41 47 46 42 42 38 41 41
50 36 37 42 43 38 37 34 37 36
25 30 31 38 39 35 32 30 31 30
10 20 20 35 36 31 27 25 20 24
5 17 17 33 34 29 24 21 16 20n 37 41 248 184 7588 395 151 248
Table 2

WPE Slovenian and Romanian Norms for the RPM 14
Table 3Classic Standard Progressive MatricesSmoothed 2006 Norms for Indian Tribal AreasIn the Context of 1997 Norms for Pune and Mumbai (Bombay)
Age in Years
9 11 13 15 17
Percentile P&M TR P&M TR P&M TR P&M TR P&M TR
95 44 36 49 39 53 43 55 47 56 49
50 21 15 33 17 41 23 44 29 45 34
5 10 8 12 8 17 8 24 10 26 11
n 592 84 1189 245 1310 320 1108 341 769 243

WPE Slovenian and Romanian Norms for the RPM 15
0
10
20
30
40
50
60
8 9 10 11 12 13 14 15 16 17 18
Age
Classic Standard Progressive Matrices1998 Smoothed Norms for Slovenia
95
90
75
50
25
10
5
Figure 1
Figure 2 Classic Standard Progressive Matrices

WPE Slovenian and Romanian Norms for the RPM 16
95 SL90 SL75 SL50 SL
25 SL
10 SL
5 SL
95 UK
90 UK
75 UK
50 UK
25 UK
10 UK
5 UK
5
10
15
20
25
30
35
40
6 61⁄2 7 71⁄2 8 81⁄2 9 91⁄2 10 101⁄2 11 111⁄2 12 121⁄2 13
Age
Coloured Progressive Matrices Smoothed 1998 Slovenian and 1982 Dumfries Norms
Figure 3
95 SL
90 SL
75 SL
50 SL
25 SL
10 SL
5 SL
95 UK
90 UK
75 UK
50 UK
25 UK
10 UK
5 UK
0
5
10
15
20
25
30
35
121⁄2 13 131⁄2 14 141⁄2 15 151⁄2 16 161⁄2 17 171⁄2 18 181⁄2 19Age
Advanced Progressive Matrices Set II (Untimed)Smoothed 1998 Slovenian and 1979 UK Norms
Figure 4

WPE Slovenian and Romanian Norms for the RPM 17
SPM Plus
2005 Slovenian and 2008 UK Smoothed Norms
95 UK90 UK75 UK
50 UK25 UK
10 UK
5 UK
95 SL
90 SL
75 SL
50 SL
25 SL
10 SL
5 SL
20
30
40
50
10.5 11 11.5 12 12.5 13 13.5 14 14.5
Age
Sco
re
Figure 5Standard Progressive Matrices Plus
Figure 6Standard Progressive Matrices Plus
WPE Slovenian and Romanian Norms for the RPM 18
95 UK90 UK
75 UK
50 UK
25 UK
10 UK5 UK
95 RO90 RO
75 RO
50 RO
25 RO
10 RO
5 RO
95 D
90 D
75 D
50 D
25 D
10 D5 D
95 FB
90 FB
75 FB50 FB
25 FB
10 FB5 FB
95 PL90 PL
75 PL
50 PL
25 PL
10 PL
5 PL
95 SL90 SL
75 SL
50 SL
25 SL
10 SL5 SL
10
15
20
25
30
35
40
45
50
55
10 11 12 13 14 15 16 17 18
Age
SPM Plus Norms for UK, Germany, Romania, Poland, Slovenia, Fort Bend, Texas
Figure 7Standard Progressive Matrices Plus
SPM Cross-Cultural Stability - UK, Slovenia, Kuwait, US, P&M
95 SL
50 SL
5 SL
95 UK
50 UK
5 UK
95 KW
50 KW
5 KW
95 US
50 US
5 US
95 P&M
50 P&M
5 P&M
10
20
30
40
50
60
10 11 12 13 14 15 16 17 18
Age
Sco
re
Figure 8Classic Standard Progressive Matrices