Embed Size (px)
Citation preview

HAL Id: halshs-01213640https://halshs.archives-ouvertes.fr/halshs-01213640
Preprint submitted on 8 Oct 2015
HAL is a multi-disciplinary open accessarchive for the deposit and dissemination of sci-entific research documents, whether they are pub-lished or not. The documents may come fromteaching and research institutions in France orabroad, or from public or private research centers.
L’archive ouverte pluridisciplinaire HAL, estdestinée au dépôt et à la diffusion de documentsscientifiques de niveau recherche, publiés ou non,émanant des établissements d’enseignement et derecherche français ou étrangers, des laboratoirespublics ou privés.
Bobos in Paradise: Urban Politics and the NewEconomy
Gilles Saint-Paul
To cite this version:
Gilles Saint-Paul. Bobos in Paradise: Urban Politics and the New Economy. 2015. �halshs-01213640�
WORKING PAPER N° 2015 – 34
Bobos in Paradise: Urban Politics and the New Economy
Gilles Saint Paul
JEL Codes: H7, R3, R4, R5 Keywords: New economy, urban amenities, bobos, residential choice, local public goods, urban voting models, bunkerization
PARIS-JOURDAN SCIENCES ECONOMIQUES
48, BD JOURDAN – E.N.S. – 75014 PARIS TÉL. : 33(0) 1 43 13 63 00 – FAX : 33 (0) 1 43 13 63 10
www.pse.ens.fr
CENTRE NATIONAL DE LA RECHERCHE SCIENTIFIQUE – ECOLE DES HAUTES ETUDES EN SCIENCES SOCIALES
ÉCOLE DES PONTS PARISTECH – ECOLE NORMALE SUPÉRIEURE – INSTITUT NATIONAL DE LA RECHERCHE AGRONOMIQUE
Bobos in Paradise: Urban Politics and theNew Economy1
Gilles Saint-PaulParis School of Economics (ENS-PSL)New York University Abu Dhabi
October 6, 2015
1This paper has bene�tted from comments by seminar participants at the Lon-don School of Economics, CEMFI Madrid, the Bank of Spain, the Univeristy ofZürich, and the NBER Summer Institute EFG meeting on income distribution. Iam grateful to Cyril Couaillier for excellent research assistance.
Abstract
This paper provides some elements to explain the observed takeover in someurban areas of a new kind of elite associated with new economy jobs, alsoknown as "bourgeois bohème" (bobos). This takeover has been associatedwith greater investment in urban amenities and "clean" means of transport,with adverse e¤ects on commuting time. The model allows us to explainthose developments by productivity is growth in the new economy, and by thedi¤erences in production processes between the new and old economies. Theconsequences of bobo takeover for house prices and employment of unskilledservice workers are also discussed. A bunkerized equilibrium in which skilledworkers in the old economy no longer reside in the city and have been replacedby service workers is studied. In such an equilibrium urban amenities areat their maximum and commuting �ows have been eliminated. For someparameter values, bobos are better-o¤ under bunkerization, in which casethey may gain by favoring it with a "diversity" subsidy for unskilled workersto reside in the city.JEL �H7, R3, R4, R5Keywords �New economy, urban amenities, bobos, residential choice,
local public goods, urban voting models, bunkerization
1 Introduction
The term "bobo" stands for "Bourgeois Bohème" and was coined by David
Brooks (2000) in a famous book about the rise of a new knowledge elite.
This new kind of bourgeoisie is generally considered as prevalent in globalized
capital cities, and its lifestyle and political attitude stand in contrast to that
of the traditional bourgeoisie. Furthermore, the bobos are generally viewed
as a politically powerful group. They have been instrumental in bringing
about left-wing governments in municipalities such as Berlin, Paris or San
Francisco, despite the relatively high economic status of this social class.
Economically, the bobos are "symbol manipulators": teachers, intellectu-
als, professionals, journalists, advertisers, architects, and "connected" work-
ers of the new economy.
In terms of consumption attitudes, the bobos promote a relaxed lifestyle
where conspicuous consumption is banned. They seek human scale habitat
and a "village" atmosphere, while generally living in large metropolitan areas
(an early example of such conceptions is Jacobs (1961)). They insist on
environmental quality and promote public transportation or bicycles. They
value "arts", in particular in their most modern forms: contemporary arts,
rock concerts, and so forth.
Politically, the bobos are viewed as generally supportive of environmen-
talists and/or socialist parties. Their takeover of major cities has taken place
in the context of sharply increasing house prices from the mid-1990s to the
onset of the �nancial crisis, and led to policies that recognizably di¤er from
the ones implemented both by the right and by the traditional left. These
policies can be summarized as follows1:
� Greater investment in collective urban amenities and socialized recre-ational events.
1See Brooks (2001), Chapter 7.
1
� Reduced urban space for the automobile, generally coupled with a re-duction in parking space, higher taxes and more stringent regulations
and constraints for personal vehicles. More investment in public trans-
portation and in dedicated areas for bicycles, skate-boards, roller skates,
and so forth. Deregulation of the use of bicyles (authorization to use
wrong ways and bus corridors). Public provision of cheap bike and
electrical car rental, and dedication of public space to those devices.
� Promotion of "social mixity" and "diversity", by means of transfer poli-cies and/or subsidized housing that maintain a critical mass of lower
class dwellers in the city center, while intermediate classes are elimi-
nated and relocate themselves in the outer periphery2.
This paper provides some elements for understanding these developments
from a "pure economic perspective". By this I mean that I will attempt to
explain them as a consequence of technological developments, instead of just
assuming that bobos are a new kind of individuals with their own preferences.
The paper focuses on the relative roles of, and con�ict of interest between
two kinds of bourgeoisie: The skilled workers of the old economy versus the
skilled workers of the new economy (bobos)3. The former work in activities
that are more land intensive, while still preferring to live in a city centre. As
a result they derive more utility from commuting and are less willing to raise
commuting costs in order to improve urban amenities than the bobos. The
paper shows that as the new economy grows faster than the old economy, the
2See Guilluy (2010), for a discussion of those relocation �ows in the French case. Seealso Clerval and Fleury, 2009, for a discussion of the Paris case.
3These two groups di¤er in income, in addition to occupation. As will be shown below,in equilibrium the bobos may be a majority in the city even though they earn less than thecadres, provided the gap is not too large. But the analysis equally applies to a situationwhere the bobos earn more than the cadres, regardless of the size of the gap. That is, thecadres alternatively may be interpreted as an intermediate class, as long as they work inthe land intensive sector.
2
bobos overtake the cadres as the politically decisive group in the city. As a
result, the level of urban amenities goes up and so do transportation costs.
The consequences for house prices and the cost of services are also studied,
as well as the implications for suburban unemployment of the lower classes.
House price dynamics in the transition from one regime to another are also
studied. It is also shown that the date of this transition is indeterminate,
as both regimes may co-exist for a range of productivity levels in the new
economy.
Finally, I also show that it may be pro�table for the decisive bobo class
to subsidize location of lower class unskilled workers in the city, in absence of
any altruism toward them or intrinsic taste for a socially diverse makeup of
the city. This is because such subsidies allow to force the economy to settle
in a "bunkerized" equilibrium in which the service providers to city dwellers
are located in the city, so that the price of services no longer goes up with
the amenity level. As a result, ex-post there is no cost to raising the amenity
level in the city, and the resulting political equilibrium involves the highest
possible level of amenities and transportation cost.
The model is an application of voting equilibrium theory under interjus-
dictional mobility, as was studied by Rose-Ackerman (1979), Westho¤(1977),
Richter (1982), Epple et al. (1983, 1984), to the speci�c urban trends that
have been oberved in the recent decades. It is also related somewhat to
the large sociological literature on gentri�cation pioneered by Glass (1964)4.
This literature, however, generally fails to identify con�icts of interest within
the bourgeoisie, sticking instead with the traditional marxist scheme of class
con�ict. Instead, I focus on the con�ict of interests between two categories of
4There are also a number of economic studies of gentri�cation, like Rossi-Hansberg etal. (2008), Guerrieri et al. (2010), who focus on the geographical spread of increases inland prices following income growth or investment in amenities. This kind of e¤ects is alsopresent in the current model, but the focus is on the politico-economic equilibrium, noton gentri�cation per se.
3
skilled workers that work in di¤erent types of occupation. Another relatively
unusual aspect of the model is departure from the traditional assumption
that all economic activity must take place in the Central Business District,
as, say in, Leroy and Sonstelje�s (1983) analysis of commuting gentri�ca-
tion. Here the existence of land-intensive economic activities located in the
suburbs plays a key role in the analysis.
An illustration of the phenomena analyzed here in the case of Paris is the
fate of the so-called "axes rouges". These policies were introduced by Paris
mayors Jacques Chirac and Jean Tiberi and consisted in preventing parking
along the side of a number of designated large communication ways (such
as Avenue Denfert-Rochereau), in order to improve tra¢ c on those axes. In
contrast, the socialist Delanoe administration, which took over in 2001, had
a deliberate policy of reallocating space away from automobile tra¢ c and
in favor of alternative means of transport as well as recreational activities5.
Consequently, the axes rouges were abolished. It is generally considered that
the gentri�cation process was already well under way under the Chirac and
Tiberi administrations. The introduction of axes rouges should therefore
be understood as catering to the Parisian upper-middle class voter of that
time, and conversely their abolition should be interpreted as a shift in the
preferences of the median voter, as analyzed in this paper, not as public
policies working toward gentri�cation.6
5These policies culminate with the recent plan by Anne Hidalgo, new Paris mayor, toentirely eliminate the automobile from the capital in 2020. For a polemical assessment,see, Roger-Petit (2015).
6Clerval and Fleury (2009) document the evolution of the Delanoe administration�surban policies and the di¤erences with the preceding administration. They also show thatgentri�cation had occured prior to the taking over of the Socialist Party, although theyalso argue that Delanoe�s policies reinforced the gentri�cation process, contrary to hisclaims.
4
2 The model
In this section, I lay out the main assumptions of the model. This is a
partial equilibrium model of an area with two locations: city and periphery.
Unlike the traditional central business district models, economic activity is
not constrained to take place in the city7.
2.1 Workers and skills
There are three categories of workers:
� Skilled workers specialized in the new economy, thereafter referred toas "Bobos". The total number of bobos is �xed and equal to H1: Each
of them is endowed with one unit of specialized skilled (type 1) labor.
� Skilled workers specialized in the old economy, that I will refer to as"Cadres"8. There are H2 of them, each endowed again with one unit
of (type 2) skilled labor.
� Unskilled workers, called "workers", who are specialized in services.There are L workers in the economy, each endowed with one unit of
unskilled labor.
2.2 Goods and production
There are �ve goods:
7For the analysis of polycentric cities, see Anas and Kim (1996), Anas et al. (1998)and Okamoto (2007).
8This French word loosely means "executive", but it is also associated with a conven-tional lifestyle with a substantial emphasis on consumer�s society, as opposed to the morecounter-cultural lifestyle of the bobos. The cadre lifestyle is described to some extent inBarthes (1957), and its somewhat more austere U.S. equivalent is discussed in Brooks(2001), in his analysis of the "Bourgeois" versus the "Bohemians".
5
� A generic consumption good which is imported, and whose price is
normalized to one. This good will be used as the numéraire.
� Two exported goods:
�A new economy good, good 1, whose production only involves
type 1 skills. The production function is
y1 = a1h1;
where y1 is output and h1 the input of type-1 skill.
�An old economy good, good 2, whose production uses both type
2 skills and land. The production function is
y2 = min(a2h2; t=b);
where t is the land input and h2 the type 2 skill input. The wage
of type 2 labor working in location i is therefore equal to
w2 = a2(1� bRi);
where Ri denotes the rental cost of housing in location i:9
� Services, denoted by subscript S: These services only use labor. Theproduction function is
yS = aSlS;
where lS is the input of labor. Furthermore, in order to supply a service
to their customers, workers must be physically located in the residence
of the customer.9While the assumption that land plays no role in the production of good 1 drastically
simpli�es the analysis, what really matters is that it is less intensive in land than good 2,and similarly for services.
6
� Housing: at any time, one unit of land can be converted into one unitof housing at no cost. Therefore, the production fonction for housing
is yH = t; but in practice we will not distinguish between housing and
land.
2.3 Geography
There are two areas
� The center (C), or "city", which has a �xed size X in terms of land. I
will assume that
max(H1; H2) < X < 2min(H1; H2): (1)
This assumption implies that the entire bobo or cadre population may
�t in the city, and that if it is the case, the corresponding group will
be a political majority. This land is usable for housing or as an input
for good 2. In addition to that, a �xed amount of additional land is
allocated to public goods, that are divided between urban amenities
and transportation infrastructures. As will be clear below, we do not
actually need to specify that amount.
� The periphery (P), or "suburb", with an in�nite supply of land. Inthe periphery, there is a �xed, exogenous level of amenities, which is
normalized to zero. This allows us, for simplicity, to limit the political
economy analysis to the city, which is the focus of the paper.
In the city, public decisions over amenities involve reallocating available
space for public goods between amenities and transportation infrastructures.
As a result, there is a trade-o¤ between amenities and commuting costs. I
7
assume that this trade-o¤ is summarized by a positive relationship between
�, the level of transportation cost, and �; the amenity level in the city:
� = �(�); �0 > 0:
2.4 Preferences
There are overlapping generations of agents who live for two periods. Each
cohort�s size is equal to one. People can borrow and lend at the �xed real
international interest rate equal to r: In the �rst period of their life, peo-
ple decide where to locate (city vs. suburb), and they purchase housing, if
needed, from the preceding generation, at price qt. In the second period of
their life, people vote on the level of amenities in the city, work, sell their
home to the next generation, and consume. All agents have the same utility
function, given by
ln c+ � ln cS � ��+ ;
where
� c is the consumption of the generic consumption good,
� cS is consumption of services
� � is a dummy equal to one if the person commutes and zero if not
� if the amenity level, which is equal to � in the city and zero in thesuburb.
Furthermore, each individual needs exactly one unit of housing, and there-
fore of land, so as to survive.
8
Instead of working and consuming, people can instead live in autarky,
in which case they get a reservation utility equal to �u10: Also, I will limit
the analysis to a regime where the constraint u � �u is binding for workers
only. Consequently, only a fraction of the total mass of workers L will be
employed, and the others will be "unemployed". An increase in �u can also
be interpreted as an increase in the generosity of welfare bene�ts.
3 Consumption, production, and location
In this section and the following I describe how to solve for the equilibrium.
I will solve the problem in three steps:
1. The consumption and production decisions of all three social classes
when old, as a function of their residential location.
2. The locational decisions of the young of the three classes, as a function
of expected amenity levels and house prices.
3. The voting decision of urban households on amenities, as a function
of the sociological composition of the city.
The equilibrium concept prevailing here is essentially the same as in Epple
et al. (1984): there is equilibrium in goods markets, each location is internally
in a majority voting equilibrium, and no individual can gain by changing
residence. 11.10Unless there is a housing bubble, i.e. house prices grow at or faster than the real
interest rate, such an option would make people insolvent if they live in the city, in whichcase they have to borrow to buy a house. But the option is viable in the suburb where theequilibrium land price is zero. Therefore, to opt for autarky one has to live in the suburb.11However, here voters (rationally) internalize the e¤ects of electoral outcomes on the
resale value of their house, contrary to the assumptions made in Epple et al. (1984). Inmost of the analysis, though, this is immaterial, because house prices only depend on theexpected amenity level in the subsequent period, not on the current amenity level. Butthis e¤ect plays some role when we consider the introduction of "diversity subsidies" inSection 9.
9
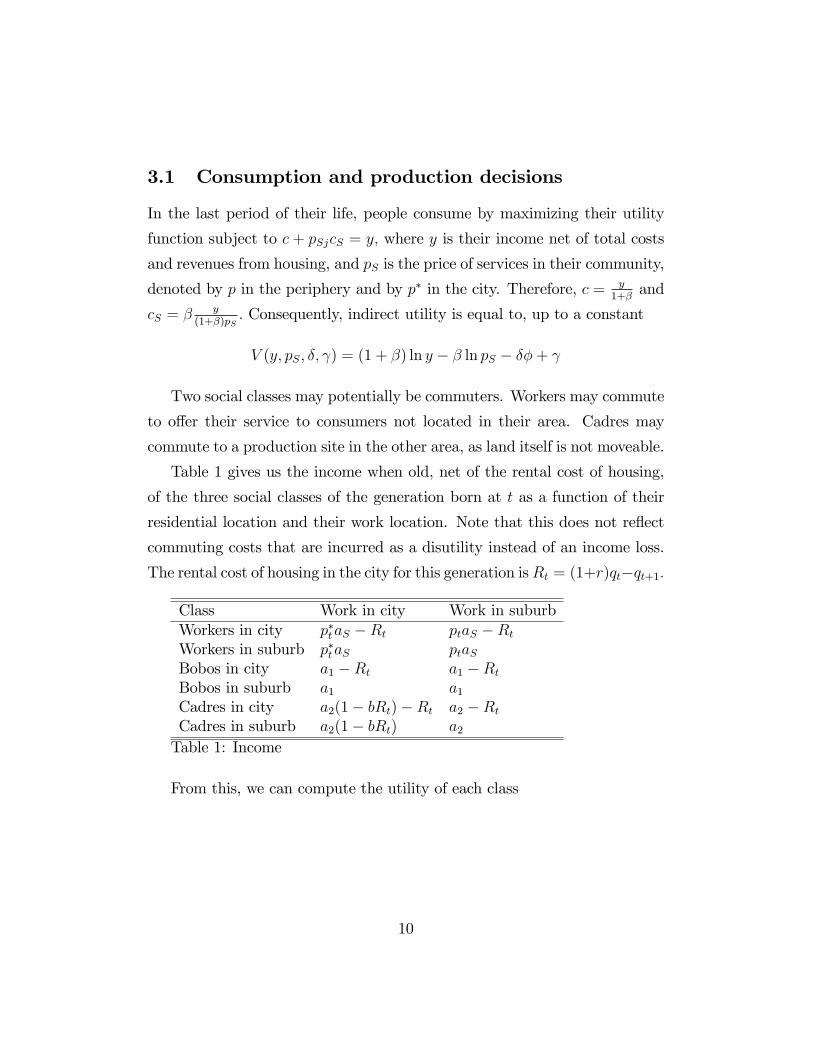
3.1 Consumption and production decisions
In the last period of their life, people consume by maximizing their utility
function subject to c + pSjcS = y; where y is their income net of total costs
and revenues from housing, and pS is the price of services in their community,
denoted by p in the periphery and by p� in the city. Therefore, c = y1+�
and
cS = �y
(1+�)pS: Consequently, indirect utility is equal to, up to a constant
V (y; pS; �; ) = (1 + �) ln y � � ln pS � ��+
Two social classes may potentially be commuters. Workers may commute
to o¤er their service to consumers not located in their area. Cadres may
commute to a production site in the other area, as land itself is not moveable.
Table 1 gives us the income when old, net of the rental cost of housing,
of the three social classes of the generation born at t as a function of their
residential location and their work location. Note that this does not re�ect
commuting costs that are incurred as a disutility instead of an income loss.
The rental cost of housing in the city for this generation isRt = (1+r)qt�qt+1:
Class Work in city Work in suburbWorkers in city p�taS �Rt ptaS �RtWorkers in suburb p�taS ptaSBobos in city a1 �Rt a1 �RtBobos in suburb a1 a1Cadres in city a2(1� bRt)�Rt a2 �RtCadres in suburb a2(1� bRt) a2Table 1: Income
From this, we can compute the utility of each class
10
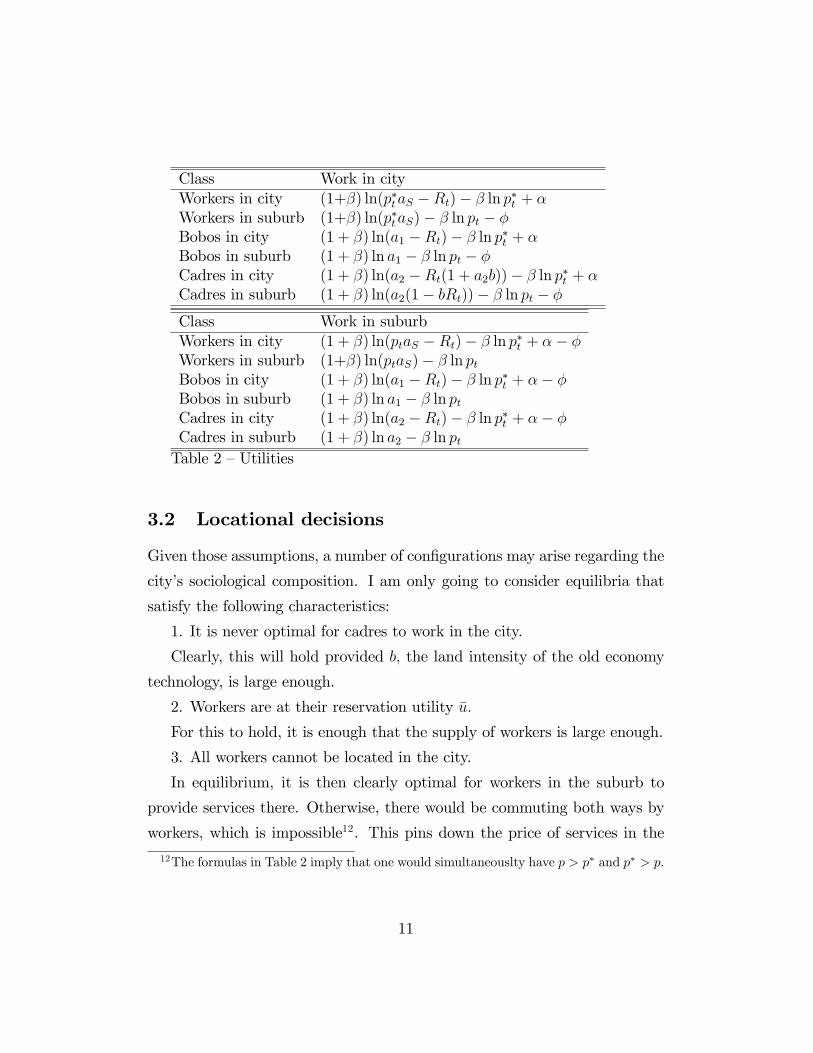
Class Work in cityWorkers in city (1+�) ln(p�taS �Rt)� � ln p�t + �Workers in suburb (1+�) ln(p�taS)� � ln pt � �Bobos in city (1 + �) ln(a1 �Rt)� � ln p�t + �Bobos in suburb (1 + �) ln a1 � � ln pt � �Cadres in city (1 + �) ln(a2 �Rt(1 + a2b))� � ln p�t + �Cadres in suburb (1 + �) ln(a2(1� bRt))� � ln pt � �Class Work in suburbWorkers in city (1 + �) ln(ptaS �Rt)� � ln p�t + �� �Workers in suburb (1+�) ln(ptaS)� � ln ptBobos in city (1 + �) ln(a1 �Rt)� � ln p�t + �� �Bobos in suburb (1 + �) ln a1 � � ln ptCadres in city (1 + �) ln(a2 �Rt)� � ln p�t + �� �Cadres in suburb (1 + �) ln a2 � � ln ptTable 2 �Utilities
3.2 Locational decisions
Given those assumptions, a number of con�gurations may arise regarding the
city�s sociological composition. I am only going to consider equilibria that
satisfy the following characteristics:
1. It is never optimal for cadres to work in the city.
Clearly, this will hold provided b; the land intensity of the old economy
technology, is large enough.
2. Workers are at their reservation utility �u:
For this to hold, it is enough that the supply of workers is large enough.
3. All workers cannot be located in the city.
In equilibrium, it is then clearly optimal for workers in the suburb to
provide services there. Otherwise, there would be commuting both ways by
workers, which is impossible12. This pins down the price of services in the
12The formulas in Table 2 imply that one would simultaneouslty have p > p� and p� > p:
11
suburbs:
ln pt = �u� (1 + �) ln aS; (2)
4. Some city residents are not workers.
In the Appendix, I provide a su¢ cient condition for conditions 3 and 4
to hold in equilibrium. Finally, I also ignore equilibria where more than one
group is located in both areas: that is, groups can be strictly ranked by their
marginal willingness to pay to live in the city.
This leaves four possible regimes:
I. All Cadres are in the city (and therefore are a majority), bobos are
indi¤erent between the city and the periphery, and workers live in the suburb
II. All Bobos are in the city, cadres are indi¤erent between the city and
the periphery, and workers all live in the suburb
III. All Bobos are in the city, workers live in the city and periphery, cadres
are all in the suburb
IV. All Cadres are in the city, workers are in both locations, and bobos
are all in the suburb.
I will �rst discuss regimes I and II and the transition between the two
regimes. Then I will study the speci�c characteristics of regime III. The
analysis of regime IV is left out, because it is less plausible and less relevant to
this paper�s focus. In particular, as long as bobos are rich enough compared
to service workers, they are likely to be willing to pay more to live in the
city, and any equilibrium with some workers living in the city must be such
that all bobos live there.13
In both regime I and regime II, all workers live in the suburb. Part of
them commute to o¤er their services to the city. Workers must be indi¤erent
between that option and that of working in the suburb. Consequently, this
13On the other hand, Cadres may be willing to pay less than service workers to livre inthe city if commuting costs are very high, as is the case in Regime III.
12
pins down the price of services in the city:
ln p�t = ln pt +�
1 + �(3)
= �u� (1 + �) ln aS +�
1 + �:
We also need, in those regimes, that workers be below their reservation
utility should they decide to live in the city, i.e.
(1 + �) ln(p�taS �Rt)� � ln p�t + � < �u:
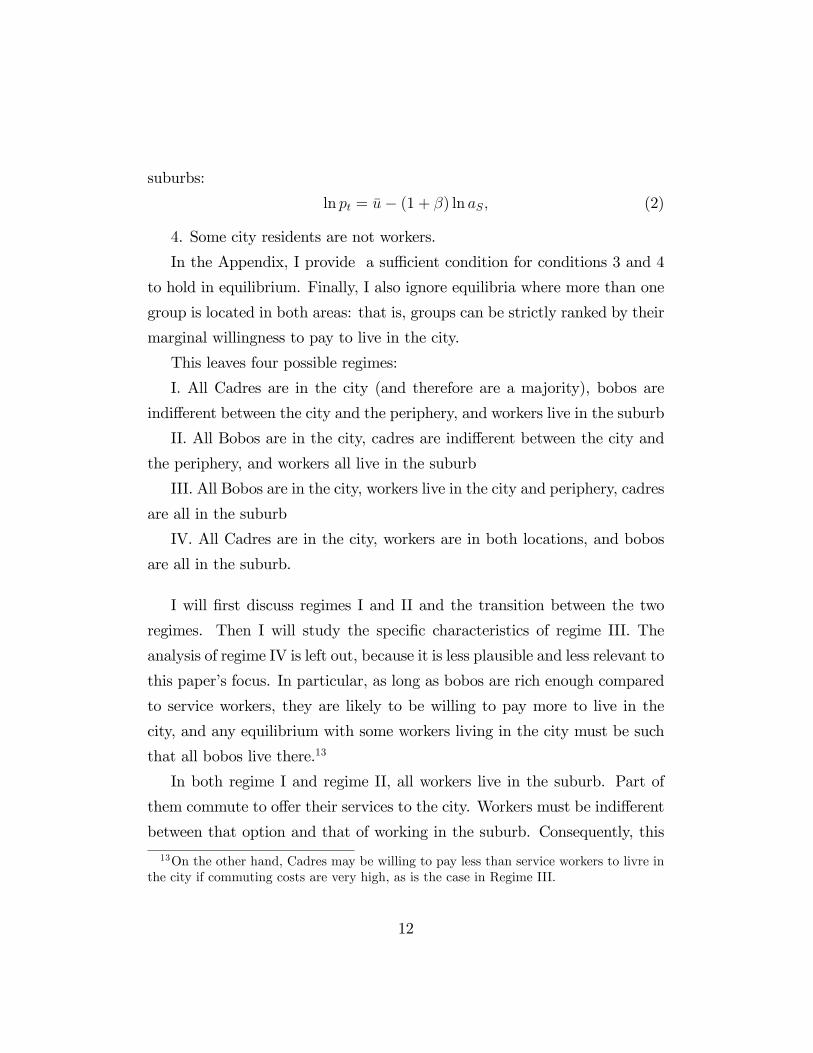
4 Equilibrium in Regime I
In Regime I, bobos are indi¤erent between living in the city and living in the
suburb. In either case, they do not pay the commuting cost. Therefore, from
Table 2, the following condition must hold:
(1 + �) ln(a1 �Rt)� � ln p�t + � = (1 + �) ln a1 � � ln pt:
Using (3), we �nd that
(1 + �) [ln(a1 �Rt)� ln a1] = ��+��
1 + �:
This determines the rental cost of housing in equilibrium:
Rt = a1 (1� exp�(�; �)) = RA (4)
where
�(�; �) =��� �(1 + �)(1 + �)2
:
The �() function captures the net utility cost of living in the city for the
bobos, ignoring housing. For this regime to be possible, we need that � < 0;
i.e.
� >��
1 + �:
13
As implied by (4), house prices are larger, the greater the amenity level
and the smaller the commuting cost. The bobos in the city, while not su¤er-
ing directly from commuting costs, su¤er indirectly due to more expensive
services in the city. Therefore, the greater the commuting cost, the lower
should house prices be in the city. Also, house prices are higher, the greater
the bobo�s productivity. This captures the e¤ect of income on the willingness
to pay for amenities of the bobos, which is re�ected in rental costs, since they
are the marginal group of city residents.
We now turn to the cadres. Their utility is (1+ �) ln(a2�Rt)� � ln p�t +� � �: They set amenities so as to maximize this utility. This decision ismade after they have picked their residence and paid the house price qt;
but before selling back their real estate to the new generation. As long as
amenities are not a state variable, qt+1 will depend on the amenities set by
the next generation. Therefore the amenity level has no e¤ect on qt+1; and
hence no e¤ect on Rt: In this model, there are no capital gains associated
with investing in greater amenities14. On the other hand, p� goes up with
transportation costs. Therefore, the cadres set amenities by just maximizing
���(�)�� ln p�t ; or equivalently, given (3), �� 1+2�1+�
�(�): Let �A; �A be the
corresponding amenity level and commuting cost. The corresponding utility
of the cadres is equal to (1 + �) ln(a2�Rt)� � ln p�t +�A� �A: For regime I14This feature greatly simpli�es the model but some of the richness of the analysis is
lost, as capital gains on real estate disappear as a motivation for investing in amenities.Note that reintroducing them would introduce a con�ict of interest between tenants andlandowners, and results would be highly sensitive to whether the decisive voter is a tenantor an owner. In the model, while it is assumed that people own their home, their utilityonly depends on the rental cost of housing and the results would be unchanged if theyrented instead.If amenities were a state variable, then the future amenity level would depend positively
on the current one, and investing in amenities would increase the price at which the oldgeneration could resell their homes.Finally, note that in the analysis of diversity policies below, capital gains play a role,
since these policies may irreversibly change the equilibrium regime, thus a¤ecting landprices.
14
to prevail, this must be larger than their utility from residing in the suburb,
which is equal to (1 + �) ln a2 � � ln pt: This is equivalent to
a2a1>1� exp(�A)1� exp(�A)
= zA > 1; (5)
where
�A = �(�A; �A);
�A =(1 + 2�)�A � �A(1 + �)
(1 + �)2= �(�A; �A) > �A:
We note that a2(1�exp(�A)) is the cadre�s willingness to pay for living inthe city. The �() function is the net utility cost of residing in the city for the
cadres, ignoring housing costs. Since the cadres, unlike the bobos, have to
commute, we have that �(�; �) > �(�; �) for all �; �: Equation (5) therefore
states that in regime I, this quantity is larger than the cost of housing, itself
equal to the bobos willingness to pay for living in the city.
It is also interesting to compute the employment level in the service sector.
Denoting by RA the rental cost of housing in this regime, total income in the
city is
YC = a2H2 + a1(X �H2)�RAX:
Total service demand in the city is therefore equal to
CSC = �a2H2 + a1(X �H2)�RAX
(1 + �)p�:
Therefore, the number of service workers who work in the city (but live
in the periphery) is
LC = �a2H2 + a1(X �H2)�RAX
(1 + �)p�aS
= �a2H2 + a1(X �H2)�RAX
(1 + �)paSexp(� �A
1 + �)
= LAC :
15
In the periphery, the demand for services comes from the working class
and the bobos who live there. Their combined income is
YP = a1(H1 +H2 �X) + p�aSLC + paSLP ;
where LP denotes the unskilled employment level in the periphery. Again we
must have LP =�1+�
YPaSp; yielding
LP =�
paS
��
1 + �(a2H2 + a1(X �H2)�RAX) + a1(H1 +H2 �X)
�= LAP :
It is easy to see that @(LAP + LAC)=@a1 > 0; although the rise in house
prices associated with an increase in the new economy�s productivity may
well lead to a reduction in services consumption in the city.
These derivations allow us to summarize the main properties of Regime
I:
� An equilibrium in regime I prevails if a2a1is larger than a critical thresh-
old, which is itself greater than 1. Other things equal, bobos are willing
to pay more to live in the city than cadres, because the former do not
have to commute. Therefore, for cadres to dominate in the city, their
income must be larger than that of the bobos by a su¢ cient margin.
� In regime I, the cost of housing goes up with productivity in the neweconomy sector.
� In regime I, employment of unskilled workers goes up with productivityin the new economy.
16
5 Regime II
Let us now turn to Regime II. The indi¤erent social group in residential choice
is now the cadres, while the bobos are politically pivotal. The indi¤erence
condition for the cadres reads
(1 + �) ln(a2 �Rt)� � ln p�t + �� � = (1 + �) ln a2 � � ln pt (6)
House rental costs are now equal to
Rt = a2 (1� exp�(�; �)) = RB: (7)
For this regime to be possible, we need that � < 0; i.e.
� >1 + 2�
1 + ��:
The utility of the bobos is (1 + �) ln(a1 � Rt) � � ln p�t + �: They max-imize �� ln p�t + �; or equivalently � � ��(�)=(1 + �): Let �B; �B be thecorresponding amenity level and commuting cost. The corresponding utility
of the bobos is, in steady state, equal to (1 + �) ln(a1 � Rt) � � ln p�t + �B:For regime II to prevail, this must be larger than their utility from residing
in the suburb, which is equal to (1 + �) ln a1 � � ln pt: This is equivalent to
a2a1<1� exp(�B)1� exp(�B)
= zB > 1; (8)
where15
�B = �(�B; �B);
�B = �(�B; �B) > �B
15Again, this inequality means that the bobo�s WTP, a1(1� exp(�B)); exceeds the costof housing, a2(1� exp(�B)):
17
We have the following Lemma:
Lemma 1 ��A > �B and �B > �A:
Corollary �zB > zA
This corollary implies that there may be multiple equilibria16. Expecting
to win the election makes it more valuable for the winning group to locate in
the city, as they get an amenity level closer to their preferences. Therefore,
that expectation is to some extent self-ful�lling.
Finally, we can compute unskilled employment as in the preceding section:
LBC = �a1H1 + a2(X �H1)�RBX
(1 + �)paSexp(� �B
1 + �)
LBP =�
paS
��
1 + �(a1H1 + a2(X �H1)�RBX) + a2(H1 +H2 �X)
�We note that in this regime, house prices are independent of productivity
in the new economy. On the other hand, productivity in the new economy
has a positive e¤ect on service employment (since dLBC=da1 > 0 because of
demand e¤ects, and dLBP =da1 > 0 because of the positive spillovers on the
periphery of the additional service workers hired by the bobos in the city).
6 Comparing regime II with regime I
I now establish a number of results regarding the comparison between the
two regimes17.
16This mutliplicity issue is recognized in Epple et al. (1984) and Westho¤ (1977).17All proofs are in the Appendix.
18
Proposition 1 �Amenities, and therefore commuting costs and the price
of services in the city, are larger in regime II.
This result is straightforward: As the bobos do not have to commute,
they incur a lower cost from increasing amenities. Therefore they vote for a
greater amenity level.
Proposition 2 �House prices are larger in regime II if and only if
a2a1>1� e�A1� e�B = ~z 2 [zA; zB]
House prices may go up as the bobos take over, because amenities make
living in the city more desirable. But, at the same time, the cadres become
the marginal buyers of land and they su¤er from the excess level of amenities
and transportation costs. The political takeover of the bobos would increase
house prices if the cadres are rich enough compared to the bobos at the time
of a transition from regime I to regime II.
The model does not systematically validate the naive view that more
amenities would increase house prices, since in regime II the marginal city
dwellers su¤er from greater commuting costs, that are the price to be paid
for raising the amenity level. This prediction stands in contrast to what
would be expected from a central business district model where all economic
activity takes place in the city.
We can also compare the employment levels of unskilled workers in the
two regimes. The preceding formulas highlight that there are three e¤ects:
� The price of services is higher in the city in the regime where the bobosare politically decisive. This tends to reduce the demand for services
and unskilled employment. Essentially, greater commuting costs are
similar to a negative productivity shock a¤ecting the service sector.
19
� If the cost of housing (R) is larger in regime II than in regime I, thisdepresses the demand for services in the city. The converse holds if the
cost of housing actually falls in regime II compared to regime I.18
� In regime II, the bobos who live in the suburbs are replaced by cadres.In the zone where a switch may occur, the latter are richer than the
former. The cadres who live in the suburb instead of the city consume
more services than the bobos they have replaced. The bobos who live
in the city instead of the suburb consume fewer services than the cadres
they have replaced. But, because services are more expensive in the
city, the former e¤ect is stronger than the latter. On net, therefore,
this change in the suburban bourgeois population tends to raise service
employment.
Despite those ambiguities, we can get a su¢ cient condition for service
employment to be lower in regime II than in regime I:
Proposition 3 �Assume that
�A < �(1 + �) ln(1� �):
and
RB > RA
Then at the margin of a transition from regime I to regime II,
LBP + LBC < L
AP + L
AC :
Therefore, if a transition from regime I to regime II is associated with
higher housing costs and if the initial amenity level picked by the cadres in
the city is low enough, such a transition is harmful for the employment of
uskilled service workers.18Note that these interest payments accrue to the rest of the world. An increase in
house prices would be �nanced by a capital in�ow, i.e. a trade de�cit.
20
7 The rise of the new economy and the tran-sition from regime I to regime II
In this section I discuss the e¤ect of an expected bobo takeover on house
price dynamics.
Suppose that, due to the progress of the new economy, a1 rises over
time, while a2 remains constant. Then the preceding analysis implies that
at some stage, the composition of the city will change: the economy will
shift from regime I to regime II. However, due to multiple equilibria, the
date of the transition cannot be predicted. During the period such that
a2=a1 2 [zA; zB] ; multiple transitions in both directions may even occur. Tosimplify the analysis, let us plausibly assume that there is a unique transition
date T: Therefore, the economy is in regime I before T and in regime II after.
The rental cost of housing keeps going up until date T; and stabilizes
thereafter. As for house prices, before date T they evolve according to
qt =1
1 + r
�qt+1 + a1t(1� e�A
�);
since Rt = a1t(1� e�A): We can show that house prices go up monotonicallyin the run-up to the bobo�s takeover, provided the transition does not occur
too late:
Proposition 4 �Assume
a1T�1 < a21� e�B1� e�A ; (9)
then qt is monotonically increasing with time for t � T; and constant there-after.
Condition (9) means that house prices are higher after the transition than
before, which, given that a1 is growing over time, is a weaker condition than
for house prices to be higher in regime II than in regime I.
21
From Proposition 4 we may conclude that growth in the new economy will
generate an upward trend in house prices, but that it should stop once the
bobo takeover is complete and once they have completed their investments
in urban infrastructure. However, as we are going to see, this levelling o¤ of
house prices only takes place if the city does not become bunkerized.
8 The bunkerized equilibrium (regime III)
In this section I characterize an equilibrium in regime III, where only workers
and bobos live in the city, the latter being all located there and therefore
being a political majority, and cadres are all in the suburb. Such a regime
is likely to exist, for the following reason: if workers are initially located in
the city, and are numerous enough to be the sole providers of services in that
community, then, contrary to regimes I and II, an increase in commuting
costs no longer raises the price of services in the city. This will induce city
residents to elect the highest possible level of amenities, making it very costly
for the cadres to locate in the city ex-ante and commute to work19. In such
a regime, the city becomes bunkerized, in that no commuting takes place
between the city and the periphery.
Let us now characterize this regime. I will limit the analysis to the zone
where a regime II equilibrium also exists, i.e. a1 > a2=zB:
8.1 Equilibrium determination and properties
First, it must be that workers are indi¤erent between locating in the city and
the periphery. We assume (and will check that it holds in equilibrium), that
19One also has to check that working in the city delivers too low a wage for the cadres,as captured by Proposition 5, condition iv.
22
workers do not commute. Therefore, we have from Table 2 that
�u = (1 + �) ln(p�taS �Rt)� � ln p�t + � (10)
= (1 + �) ln(ptaS)� � ln pt:
The price of services in the suburbs is still determined by (2). However,
the price of services in the city is determined by equilibrium between supply
and demand. Total city income is
YC = a1H1 + p�taS(X �H1)�XRt:
Equilibrium in the service market in the city is such that
Sd =�
1 + �
YCp�t= Ss = aS(X �H1):
Rearranging, we get that
Rt = a1H1X� aS�p�t
�1� H1
X
�: (11)
This de�nes a downward sloping relationship between R and p�; labeled
SME. The greater the cost of housing, the lower the city dwellers�purchasing
power, and the lower the equilibrium price of services.
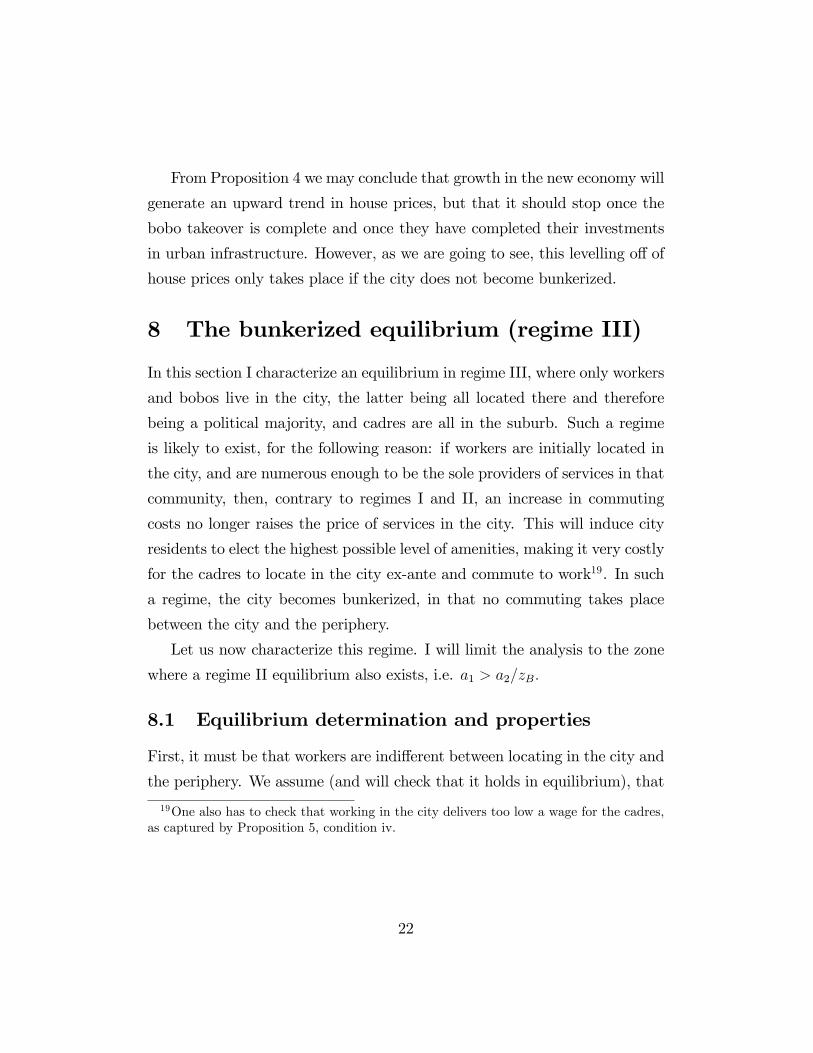
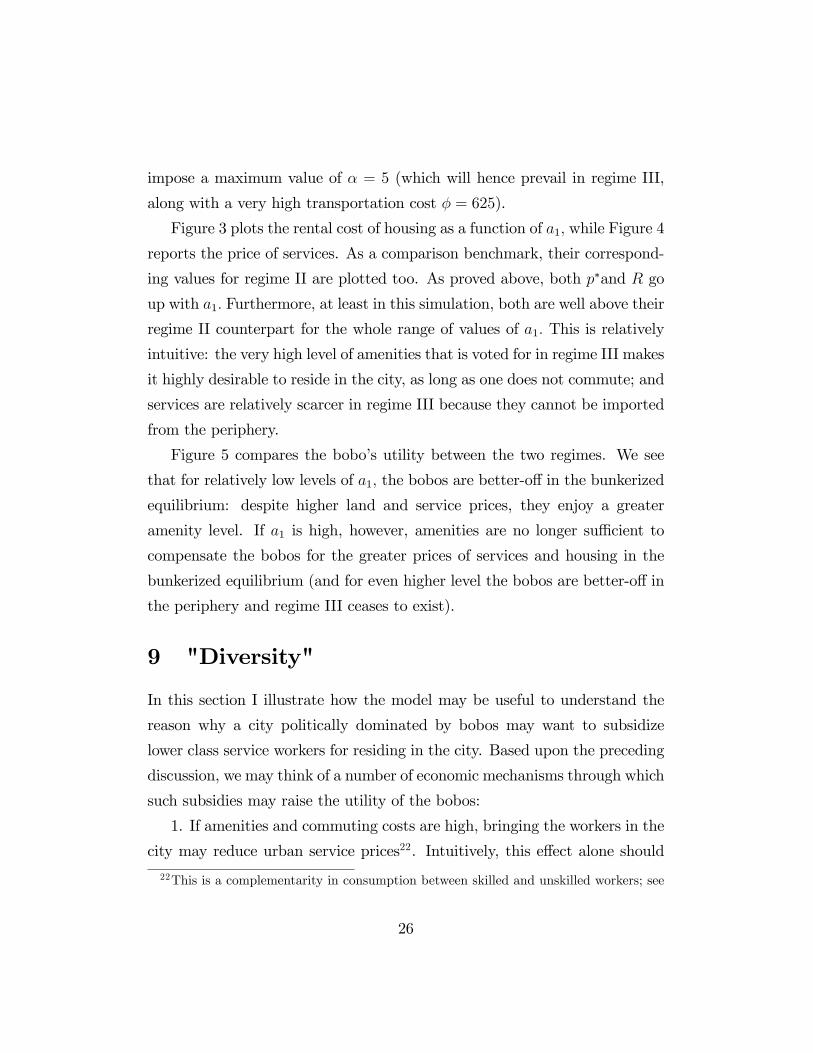
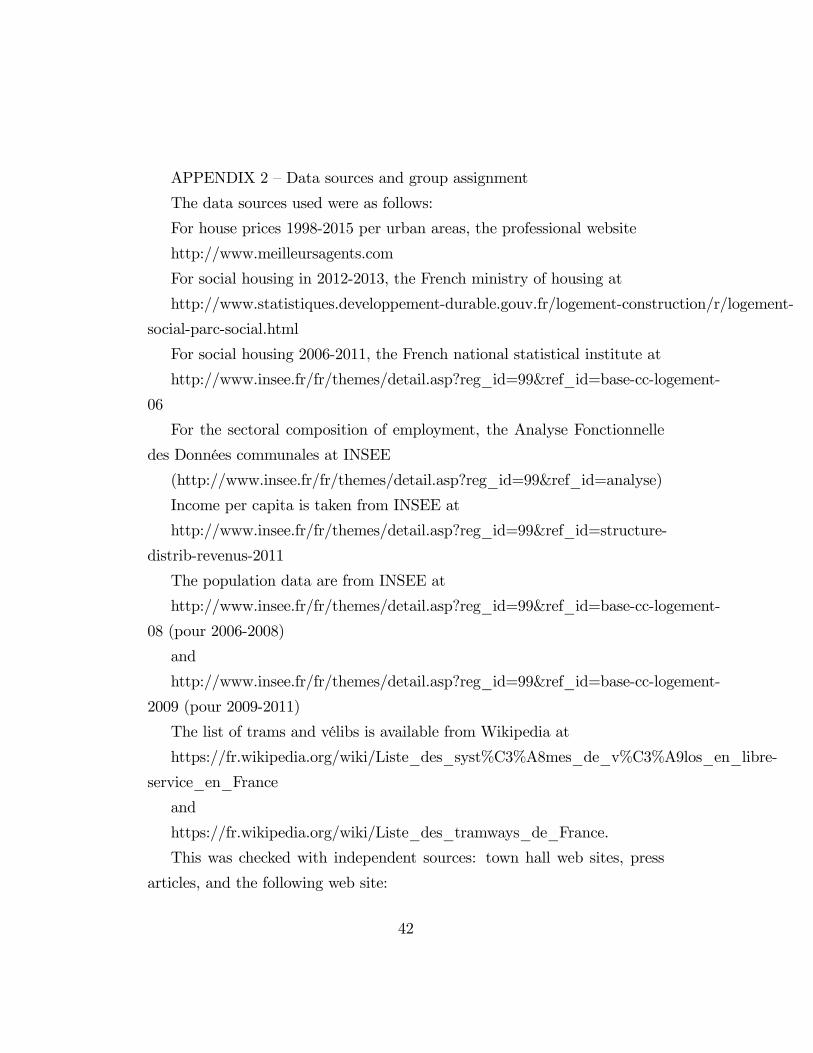
It can be checked that Equation (10) de�nes a positive relationship be-
tween p� and R; representing equilibrium in the housing market (HME). The
greater p�; the greater the incentives for workers to locate in the city, and
the higher the equilibrium rental cost of housing. As illustrated on Figure
1, the two relationships HME and SME uniquely determine the equilibrium
values of R and p�: I will label these values RC and p�C :
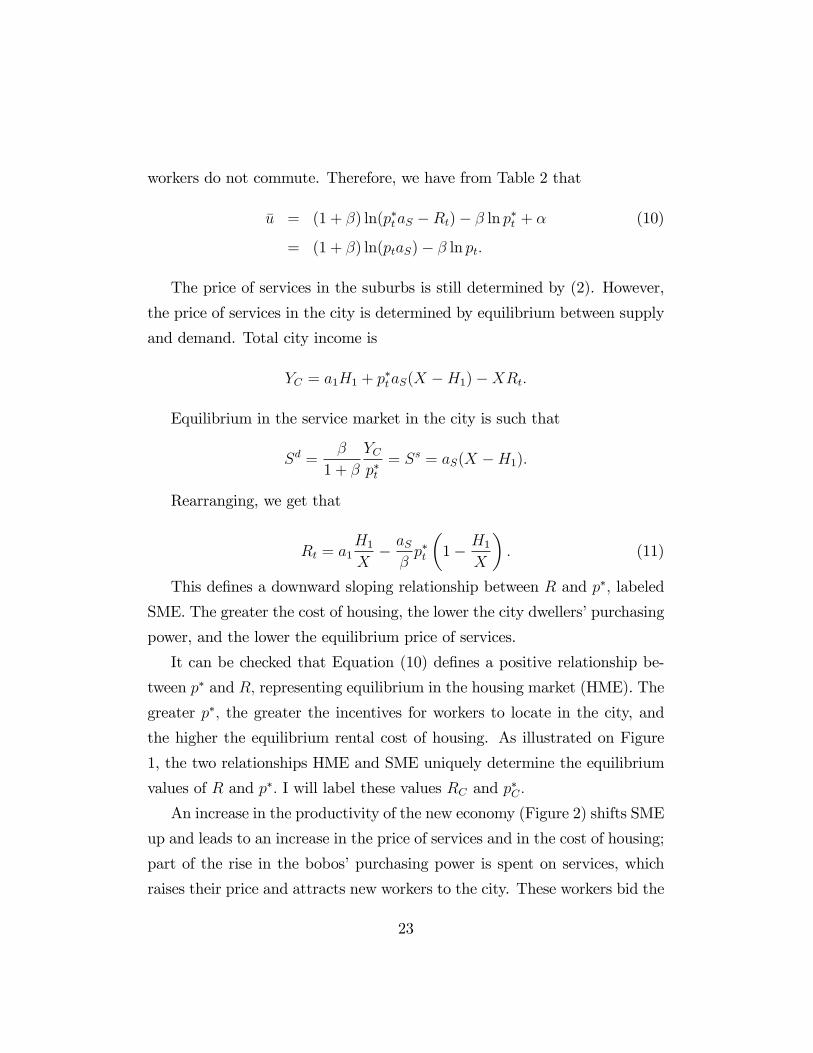
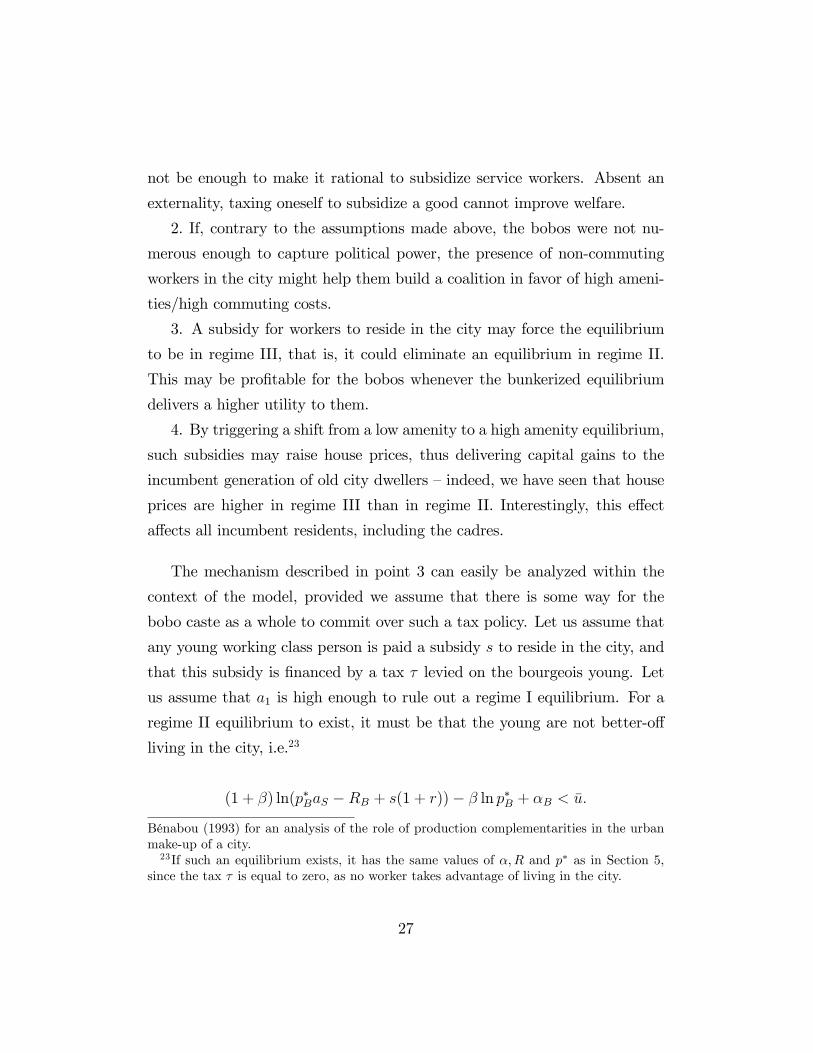
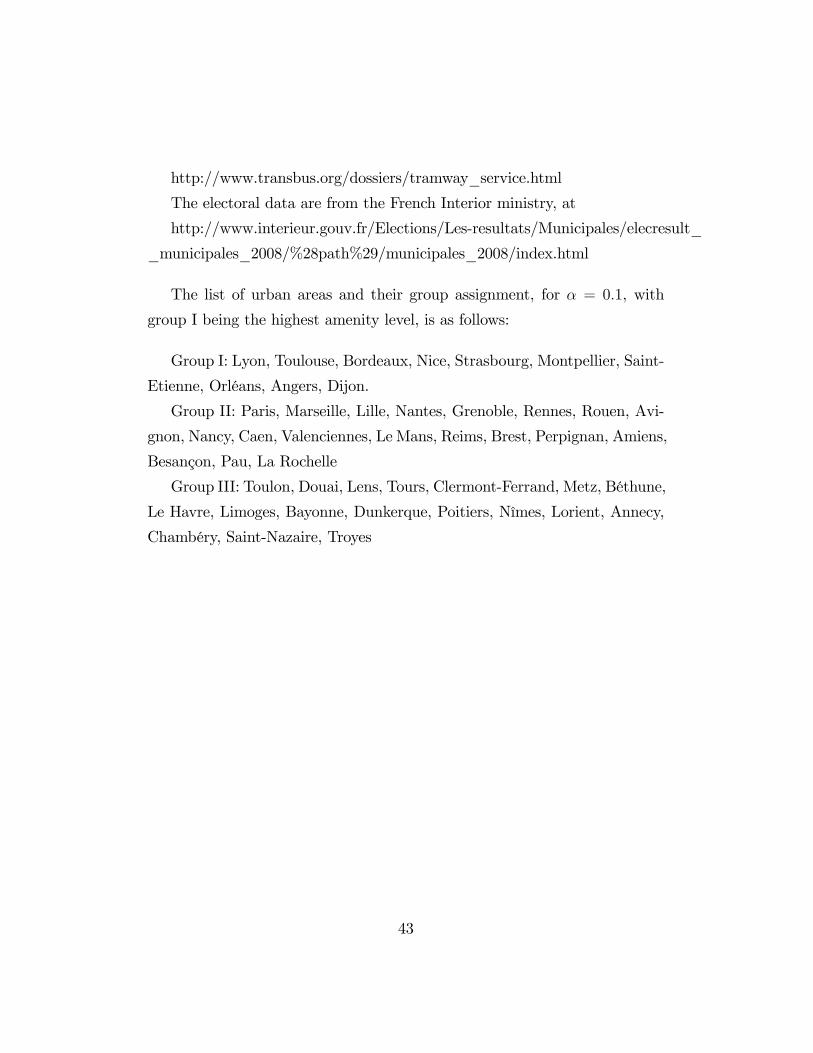
An increase in the productivity of the new economy (Figure 2) shifts SME
up and leads to an increase in the price of services and in the cost of housing;
part of the rise in the bobos�purchasing power is spent on services, which
raises their price and attracts new workers to the city. These workers bid the
23
price of housing up, to the point where they are again indi¤erent between
locating in the city and in the periphery. Note that this response stands in
contrast to that of regime II, where the price of services was insulated from
the bobo�s income due to commuting of workers from the suburbs, and the
price of housing also did not depend on the bobo�s income because it was
pinned down by productivity in the old economy, due to the cadres being the
marginal city dwellers.
Furthermore, in the bunkerized regime an increase in a1 has no e¤ect on
service employment, contrary to regimes I and II. Service employment in the
city is constrained by available space (there are X � H1 housing units leftfor the workers), and service employment in the suburb is determined by the
cadre�s income, which is �xed.
An increase in the amenity level � shifts HME up: workers have a greater
incentive to locate to the city, which bids rents up, eventually depressing the
demand for, and prices of services. It should be stressed that this should be
an expected increase in �; as housing has to be purchased before the utility
from amenities is incurred.
What amenity level will the bobos choose? Again, given our timing of
events, this choice does not a¤ect qt+1: While its expectation was already
priced in qt; the current choice of � does not a¤ect qt either, since it takes
place after the preceding period�s housing market. Nor does � a¤ect p�t ; since
the supply of services is frozen by the locational decisions of service workers
made at t: Therefore, the bobos will simply maximize � and pick the highest
possible level of amenities (and therefore of commuting costs). I will denote
that level by �C ; and the corresponding commuting cost by �C :20
20As discussed in footnote 21, for high values of a1 regime III is replaced by regime IIIBwhere not all bobos live in the city, and where workers may even be a political majority.Since the workers do not commute, in such a regime they will choose the same (maximum)level of � as in regime III.
24
8.2 Conditions for a bunkerized equilibrium to exist
The preceding analysis discusses the properties of an equilibrium in regime
III, but fails to characterize its conditions for existence. This is done in the
following Proposition:
Proposition 5 � An equilibrium in regime III exists if and only if the
following conditions hold:
(i) (1 + �) ln(a2 �RC)� � ln p�C + �C � �C < (1 + �) ln a2 � � ln p:(ii) (1 + �) ln(a1 �RC)� � ln p�C + �C > (1 + �) ln a1 � � ln p:(iii) (1 + �) ln(p�CaS)� � ln p� �C < (1 + �) ln(paS)� � ln p:(iv) (1 + �) ln(a2 �RC(1 + ba2))� � ln p�C + �C < (1 + �) ln a2 � � ln p:(v) �C � �B � �(ln p�C � ln p�
�B1+�):
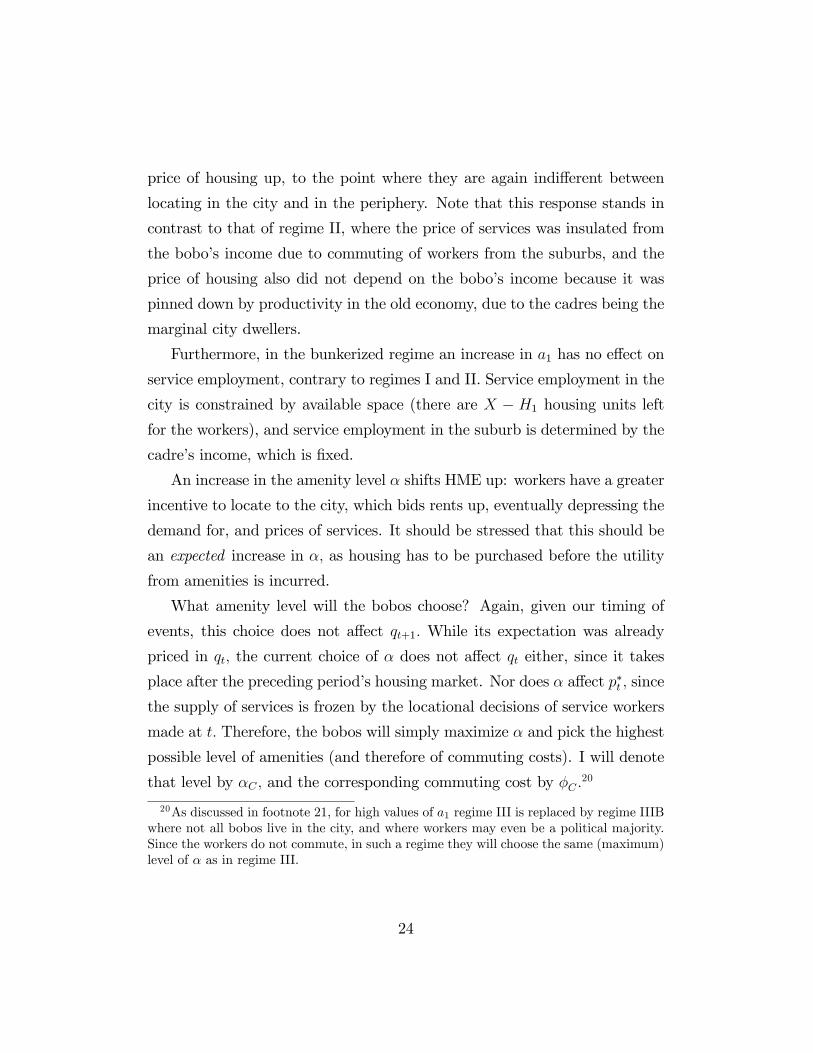
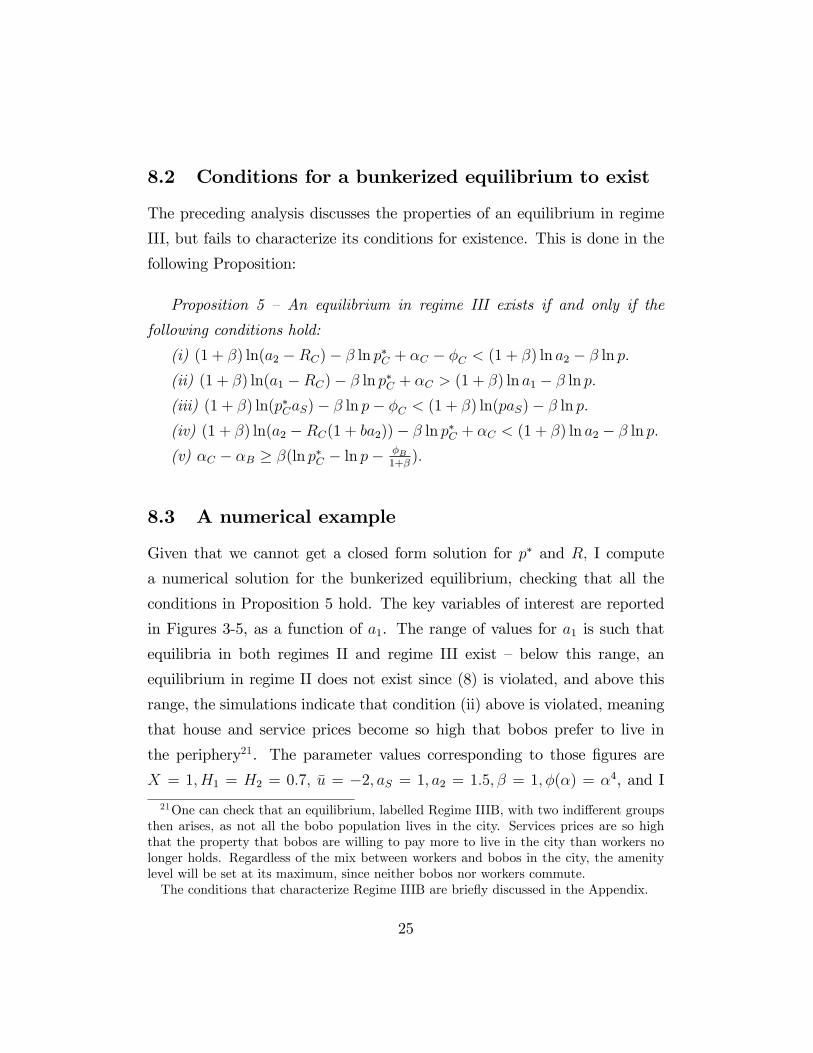
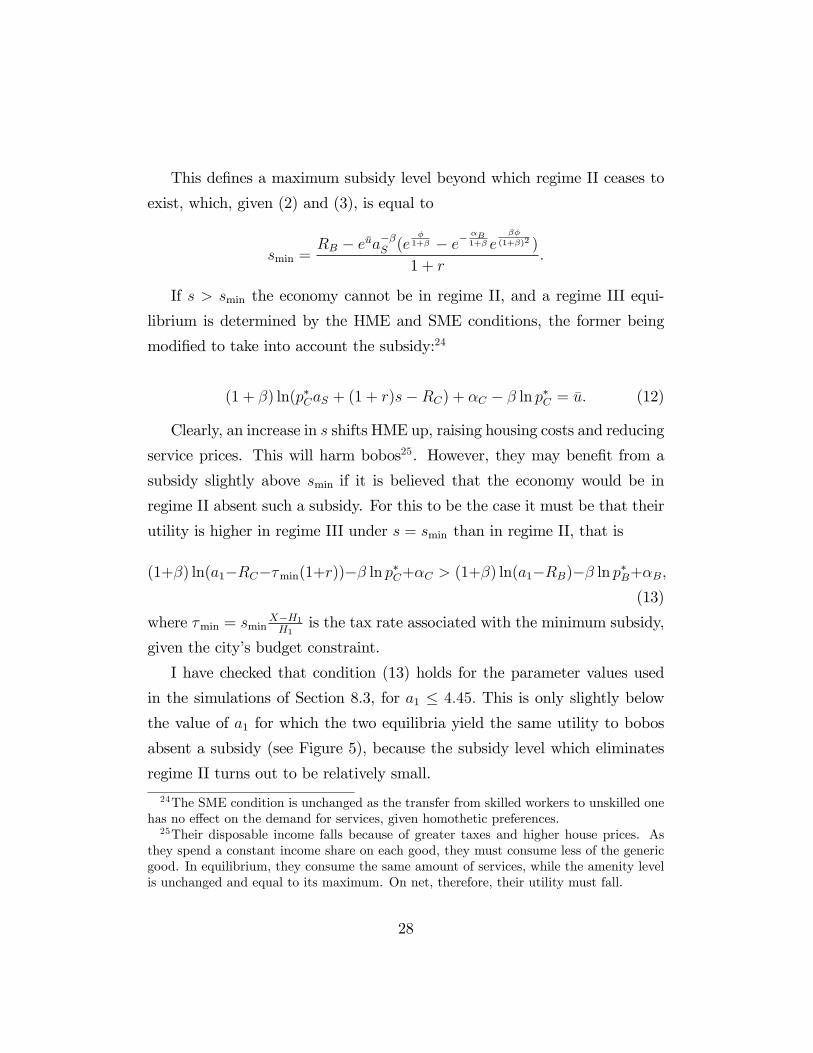
8.3 A numerical example
Given that we cannot get a closed form solution for p� and R; I compute
a numerical solution for the bunkerized equilibrium, checking that all the
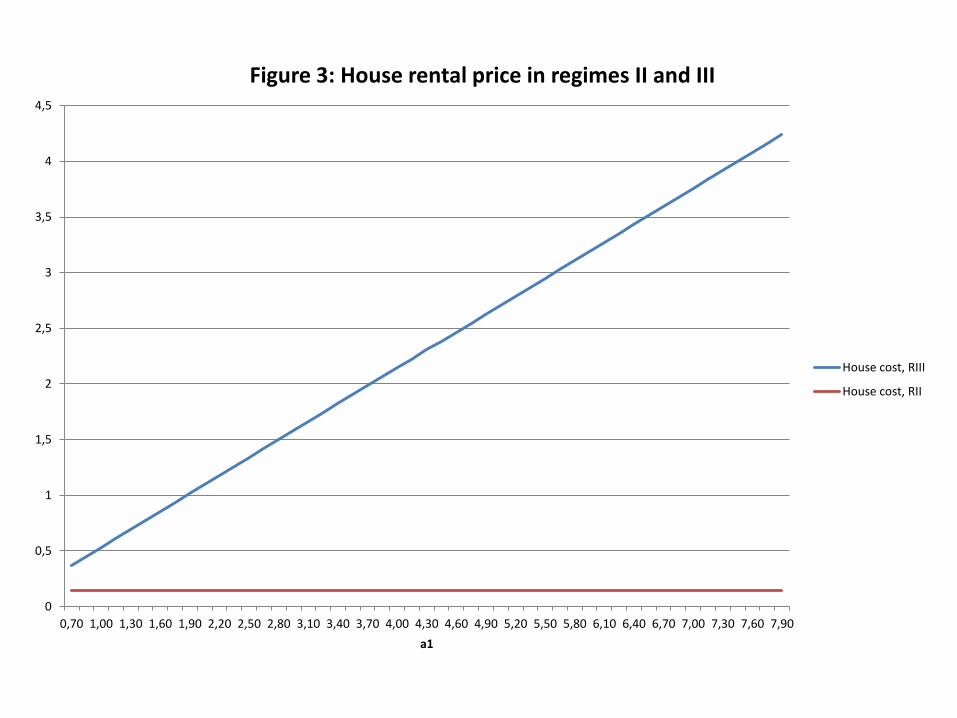
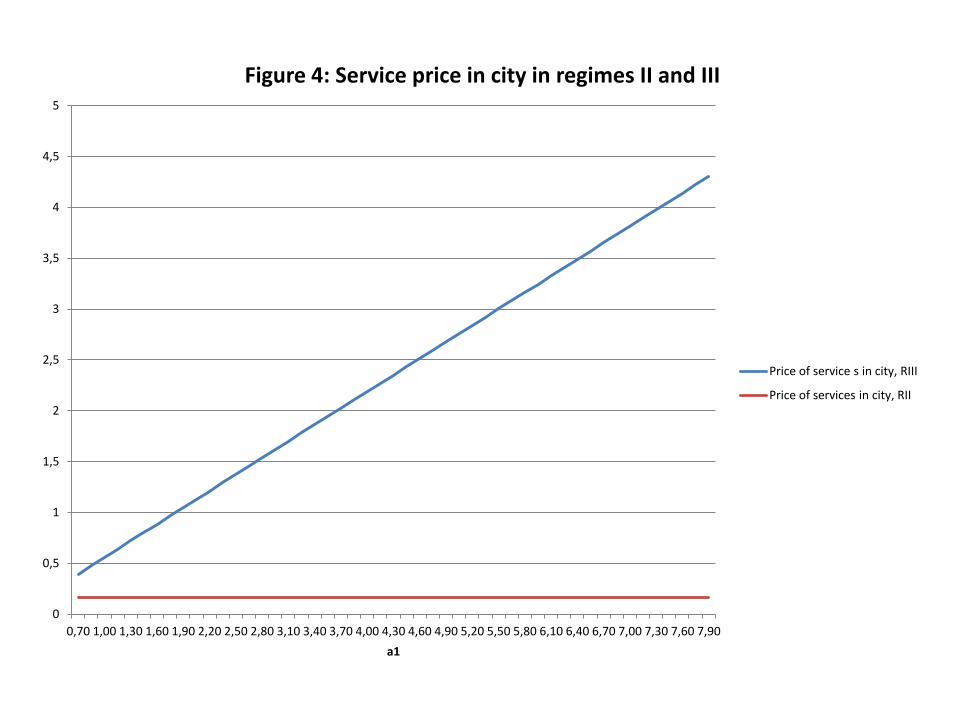
conditions in Proposition 5 hold. The key variables of interest are reported
in Figures 3-5, as a function of a1. The range of values for a1 is such that
equilibria in both regimes II and regime III exist � below this range, an
equilibrium in regime II does not exist since (8) is violated, and above this
range, the simulations indicate that condition (ii) above is violated, meaning
that house and service prices become so high that bobos prefer to live in
the periphery21. The parameter values corresponding to those �gures are
X = 1; H1 = H2 = 0:7; �u = �2; aS = 1; a2 = 1:5; � = 1; �(�) = �4, and I
21One can check that an equilibrium, labelled Regime IIIB, with two indi¤erent groupsthen arises, as not all the bobo population lives in the city. Services prices are so highthat the property that bobos are willing to pay more to live in the city than workers nolonger holds. Regardless of the mix between workers and bobos in the city, the amenitylevel will be set at its maximum, since neither bobos nor workers commute.The conditions that characterize Regime IIIB are brie�y discussed in the Appendix.
25
impose a maximum value of � = 5 (which will hence prevail in regime III,
along with a very high transportation cost � = 625).
Figure 3 plots the rental cost of housing as a function of a1; while Figure 4
reports the price of services. As a comparison benchmark, their correspond-
ing values for regime II are plotted too. As proved above, both p�and R go
up with a1: Furthermore, at least in this simulation, both are well above their
regime II counterpart for the whole range of values of a1: This is relatively
intuitive: the very high level of amenities that is voted for in regime III makes
it highly desirable to reside in the city, as long as one does not commute; and
services are relatively scarcer in regime III because they cannot be imported
from the periphery.
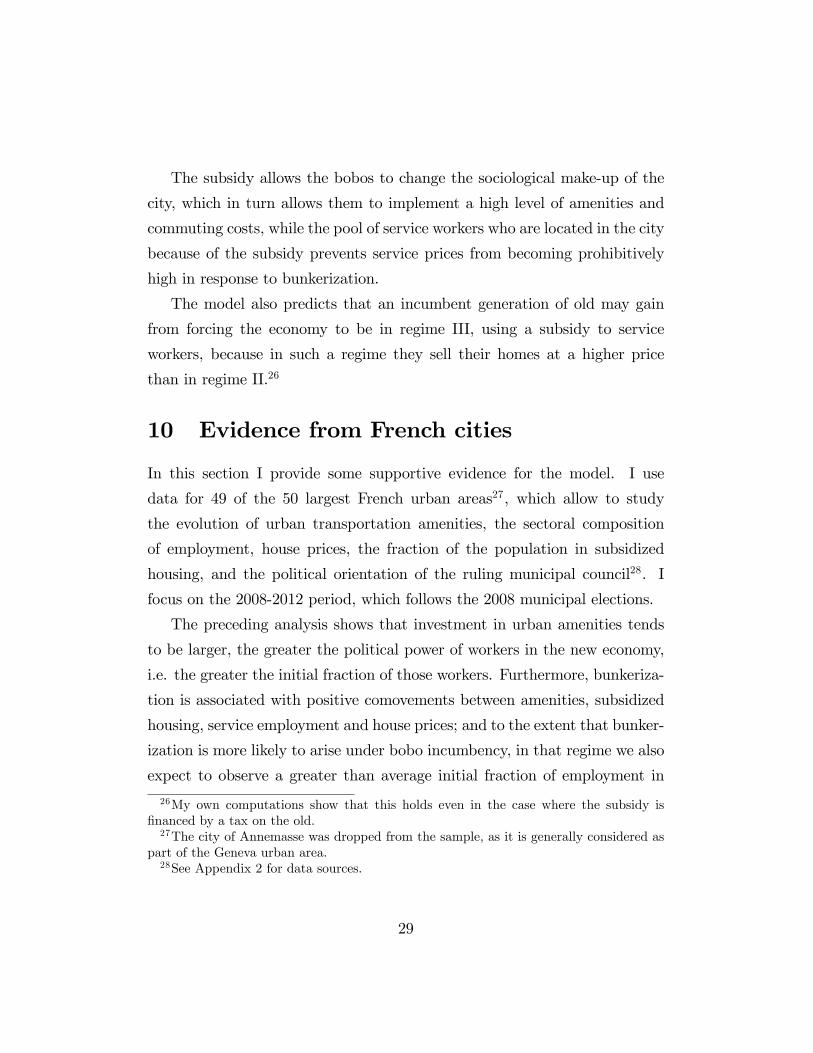
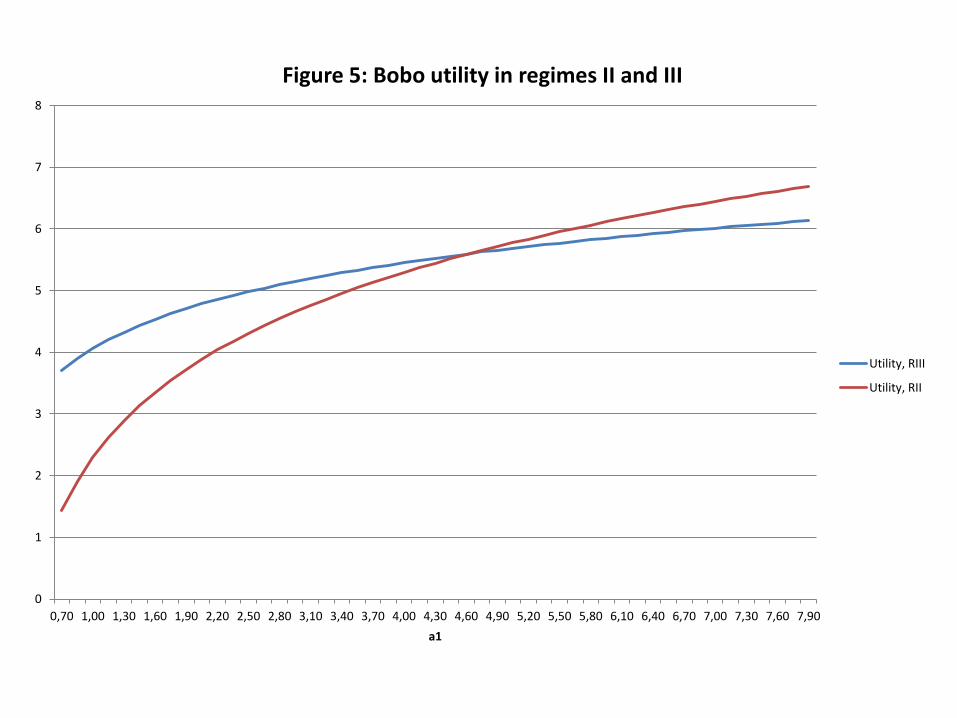
Figure 5 compares the bobo�s utility between the two regimes. We see
that for relatively low levels of a1; the bobos are better-o¤ in the bunkerized
equilibrium: despite higher land and service prices, they enjoy a greater
amenity level. If a1 is high, however, amenities are no longer su¢ cient to
compensate the bobos for the greater prices of services and housing in the
bunkerized equilibrium (and for even higher level the bobos are better-o¤ in
the periphery and regime III ceases to exist).
9 "Diversity"
In this section I illustrate how the model may be useful to understand the
reason why a city politically dominated by bobos may want to subsidize
lower class service workers for residing in the city. Based upon the preceding
discussion, we may think of a number of economic mechanisms through which
such subsidies may raise the utility of the bobos:
1. If amenities and commuting costs are high, bringing the workers in the
city may reduce urban service prices22. Intuitively, this e¤ect alone should
22This is a complementarity in consumption between skilled and unskilled workers; see
26
not be enough to make it rational to subsidize service workers. Absent an
externality, taxing oneself to subsidize a good cannot improve welfare.
2. If, contrary to the assumptions made above, the bobos were not nu-
merous enough to capture political power, the presence of non-commuting
workers in the city might help them build a coalition in favor of high ameni-
ties/high commuting costs.
3. A subsidy for workers to reside in the city may force the equilibrium
to be in regime III, that is, it could eliminate an equilibrium in regime II.
This may be pro�table for the bobos whenever the bunkerized equilibrium
delivers a higher utility to them.
4. By triggering a shift from a low amenity to a high amenity equilibrium,
such subsidies may raise house prices, thus delivering capital gains to the
incumbent generation of old city dwellers �indeed, we have seen that house
prices are higher in regime III than in regime II. Interestingly, this e¤ect
a¤ects all incumbent residents, including the cadres.
The mechanism described in point 3 can easily be analyzed within the
context of the model, provided we assume that there is some way for the
bobo caste as a whole to commit over such a tax policy. Let us assume that
any young working class person is paid a subsidy s to reside in the city, and
that this subsidy is �nanced by a tax � levied on the bourgeois young. Let
us assume that a1 is high enough to rule out a regime I equilibrium. For a
regime II equilibrium to exist, it must be that the young are not better-o¤
living in the city, i.e.23
(1 + �) ln(p�BaS �RB + s(1 + r))� � ln p�B + �B < �u:
Bénabou (1993) for an analysis of the role of production complementarities in the urbanmake-up of a city.23If such an equilibrium exists, it has the same values of �;R and p� as in Section 5,
since the tax � is equal to zero, as no worker takes advantage of living in the city.
27
This de�nes a maximum subsidy level beyond which regime II ceases to
exist, which, given (2) and (3), is equal to
smin =RB � e�ua��S (e
�1+� � e�
�B1+� e
��
(1+�)2 )
1 + r:
If s > smin the economy cannot be in regime II, and a regime III equi-
librium is determined by the HME and SME conditions, the former being
modi�ed to take into account the subsidy:24
(1 + �) ln(p�CaS + (1 + r)s�RC) + �C � � ln p�C = �u: (12)
Clearly, an increase in s shifts HME up, raising housing costs and reducing
service prices. This will harm bobos25. However, they may bene�t from a
subsidy slightly above smin if it is believed that the economy would be in
regime II absent such a subsidy. For this to be the case it must be that their
utility is higher in regime III under s = smin than in regime II, that is
(1+�) ln(a1�RC��min(1+r))�� ln p�C+�C > (1+�) ln(a1�RB)�� ln p�B+�B;(13)
where �min = sminX�H1H1is the tax rate associated with the minimum subsidy,
given the city�s budget constraint.
I have checked that condition (13) holds for the parameter values used
in the simulations of Section 8.3, for a1 � 4:45: This is only slightly below
the value of a1 for which the two equilibria yield the same utility to bobos
absent a subsidy (see Figure 5), because the subsidy level which eliminates
regime II turns out to be relatively small.
24The SME condition is unchanged as the transfer from skilled workers to unskilled onehas no e¤ect on the demand for services, given homothetic preferences.25Their disposable income falls because of greater taxes and higher house prices. As
they spend a constant income share on each good, they must consume less of the genericgood. In equilibrium, they consume the same amount of services, while the amenity levelis unchanged and equal to its maximum. On net, therefore, their utility must fall.
28
The subsidy allows the bobos to change the sociological make-up of the
city, which in turn allows them to implement a high level of amenities and
commuting costs, while the pool of service workers who are located in the city
because of the subsidy prevents service prices from becoming prohibitively
high in response to bunkerization.
The model also predicts that an incumbent generation of old may gain
from forcing the economy to be in regime III, using a subsidy to service
workers, because in such a regime they sell their homes at a higher price
than in regime II.26
10 Evidence from French cities
In this section I provide some supportive evidence for the model. I use
data for 49 of the 50 largest French urban areas27, which allow to study
the evolution of urban transportation amenities, the sectoral composition
of employment, house prices, the fraction of the population in subsidized
housing, and the political orientation of the ruling municipal council28. I
focus on the 2008-2012 period, which follows the 2008 municipal elections.
The preceding analysis shows that investment in urban amenities tends
to be larger, the greater the political power of workers in the new economy,
i.e. the greater the initial fraction of those workers. Furthermore, bunkeriza-
tion is associated with positive comovements between amenities, subsidized
housing, service employment and house prices; and to the extent that bunker-
ization is more likely to arise under bobo incumbency, in that regime we also
expect to observe a greater than average initial fraction of employment in
26My own computations show that this holds even in the case where the subsidy is�nanced by a tax on the old.27The city of Annemasse was dropped from the sample, as it is generally considered as
part of the Geneva urban area.28See Appendix 2 for data sources.
29
the new economy. Finally, conventional wisdom suggests that bobo power is
associated with a left-wing municipality, although actual outcomes depend
on the nature of electoral competition: If platform convergence arises as in
Downsian competition, right-wing municipalities will also pursue those poli-
cies.
In order to test those predictions, I split my sample into three groups,
using an aggregate index of transportation amenities. I have data for two
types of amenities: tramways ("tram") and public self-service rental bicycles
("vélib"). Both types of investment were explicitly associated with the goal
of reducing the scope of car travel in urban areas. For example the Paris
tramway is a substitute for a former bus line (the "petite ceinture"), but
was built in order to reduce the number of entry points for cars into down-
town Paris29. Similarly vélibs are associated with a massive reconversion of
parking space into vélib delivery spots, and of car transit lanes into bicy-
cle lanes. Overall, while these policies introduce more "ecological" means
of transportation, it is plausible to assume that they tend to have adverse
e¤ects on commuting costs.
I can compute the increase in the number of tramway lines between 2007
and 2012, denoted by TRAM ; I can also construct a dummy equal to 1,
called V ELIB; if the city introduces vélibs between 2007 and 2012. For any
given value of �; I can construct an aggregate amenity index equal to
AMEN(�) = V ELIB + �TRAM:
Groups I,II, and III are then de�ned as the upper, middle and bottom
thirds of the ranking of cities by AMEN(�):30 Although the assignment to
29See, "Tramway à Paris: Delanoë est-il l�ennemi de la voiture?", L�Express, decem-ber 15 2012, http://www.lexpress.fr/actualite/politique/tramway-a-paris-delanoe-est-il-l-ennemi-de-la-voiture_1199483.html30Because many cities share the same values for AMEN(�); however, and because it
does not make sense to assign cities with the same value to di¤erent groups, the resulting
30
each group is exogenous, due to the relatively small number of observations,
we could loosely think of group I being in regime III, group II in regime II,
and group III in regime I.
Table 3 reports the mean values of the variables of interests. The ranking
and results turn out to be quite robust to the choice of �; for � 2 [0:1; 9]:31
Variable Average group I Average group II Average group III p-valueHLM 0:5 (0:4) -0.2 (0.2) -0.1 (0.4) 0.27Service employment 0.54 (0.1) 0.53 (0.06) 0.34 (0.15) 0.49Left 0.63 (0.15) 0.75 (0.1) 0.61 (0.1) 0.64New economy 9.5 (0.9) 8.5 (0.7) 6.4 (0.3) 0.002NE execs 50.1 (2.1) 48.9 (1.7) 44.5 (1.3) 0.03House prices 3.8 (2.6) 1.3 (1.9) -3.0 (1.8) 0.09Table 3 �Average values of economic variables by amenity groups. The last
column is the p-value for an ANOVA test of equality between those averages.
Standard errors in parentheses. HLM = Increase in population share in subsidized
housing, 2007-2012, %. Service employment �Increase in the share of population
in services to households, 2007-2012, %. Left �Dummy for left-wing municipality
in 2007. New economy �Share of total employment in the new economy, as de�ned
by the following industries: Culture, leisure, conception, research, intellectual ser-
vices; %, 2007. NE Execs �Share of total employment in the new economy, as
de�ned in the preceding industries, among executives. House prices �Increase in
area house prices, %, 2007-2012
The numbers in Table I are overall supportive of the model, although
not all di¤erences are statistically signi�cant. Cities that invested more in
amenities after the 2008 elections tend to be those with a greater fraction of
groups turn out to have di¤erent sizes. In particular, the bottom group is reduced to allcities for whom AMEN(�) is equal to zero, while a large set of cities with equal scoresequal to the threshold for the top third has to be assigned to group II, otherwise thatgroup would only have three cities. As a result, group I has 11 cities.A two-group decomposition has also been tried, with similar results.31Only three cities change categories when comparing the assignment for � = 9 to
� = 0:1 : Brest, Le Mans and Reims which all move from group II to group I.
31
workers in the new economy, either in the workforce at large or among highly
skilled workers, and experienced stronger growth in house prices thereafter.
They are also more likely to have raised the fraction of households in social
housing ("HLM") and to have more service employment, in accordance with
the above discussion on bunkerization. However, taken individually, these
latter di¤erences are not statistically signi�cant. Finally, a large increase
in the amenity level does not seem to be especially related to a left-wing
municipality. This is consistent with the Downsian prediction of platform
convergence. Indeed, the 2014 campaign of the right-wing contender for the
Paris municipality, Nathalie Kosciusko-Morizet, was fully supportive of the
policies that are generally associated with the Bobo establishment32.
11 Conclusion
This paper has shown that one can explain some recent trends in urban
sociology and policies without referring to an evolution of the preferences
of the decisive voters in the city, regarding urban amenities, transportation
infrastructure, and housing subsidies for the lower class. Rather, these trends
can be explained by productivity growth in the new economy goods relative
to other sectors, along with the speci�city of the production process for
those goods. Of course, as documented by the original book by Brooks,
preferences may matter in other dimensions (such as consumption of organic
food or speci�c details of home interior decoration) that are not treated by
the model analyzed here. It is possible, though, that these aspects of the new
urban elite�s lifestyle also are a consequence of their economic characteristics,
especially if one allows for endogenous preferences. This is a productive
avenue for further research.32See "The harpist or the heiress? Image is all in the race to be �rst woman mayor
of Paris", The Guardian, March 2 2014, in which it is stated that "[Nathalie Kosciusko-Morizet] was photographed using a free Vélib�bicycle(...)."
32
12 References
Anas, A. and I. Kim (1996), "General equilibrium models of polycentric
urban land use with endogenous congestion and job agglomeration", Journal
of Urban Economics, 40, 232-256
Anas, A., Arnott, R. and K.A. Small (1998), "Urban spatial structure",
Journal of Economic Literature, 36, 1426-1464
Barthes, Roland (1957), Mythologies, Paris: Editions du Seuil.
Bénabou, Roland, "Workings of a city: Location, Education, and Pro-
duction", Quarterly Journal of Economics, 108, 3, 619-652
Brooks, David, (2000), Bobos in Paradise, NY: Simon and Schuster
Clerval, Anne and Antoine Fleury (2009), "Politiques urbaines et gentri-
�cation, une analyse critique à partir du cas de Paris", L�Espace Politique,
8, 2009-2
Epple, Denis, Radu Filimon and Thomas Romer (1983), "Housing, voting
and moving: Equilibrium in a model of local public goods" in J.V. Henderson,
ed., Research in Urban Economics, vol. 3. Greenwich: Connecticut, JAI
Press, 59-90.
Epple, Denis, Radu Filimon and Thomas Romer (1984), "Equilibrium
among local jurisdictions: Toward and integrated treatment of voting and
residential choice", Journal of Public Economics, 24, 281-308
Guilluy, Christophe (2010), Fractures françaises, Paris: François Bourin
Glass, R. (1964) Introduction: aspects of change. In London: Aspects
of Change, ed. Centre for Urban Studies, London: MacKibbon and Kee,
xiii�xlii.
Guerrieri, Veronica, Daniel Hartley and Erik HUrst (2010), "Endogenous
gentri�cation and housing price dynamics", NBER Working paper 16237
Jacobs, Jane (1961), The Death and Life of Great American Cities
Okamoto, Ryokuse (2007), "Location choices of �rms and workers in an
33
urban model with heterogeneities in skills and preferences", Regional Science
and Urban Economics, 37, 670-687
LeRoy, Stephen F. and Andjon Sonstelie (1983), "Paradise Lost and Re-
gained: Transportation Innovation, Income, and Residential Location", Jour-
nal of Urban Economics 13,67-89
Roger-Petit, Bruno (2015), "Pollution à Paris: pourquoi l�écologie puni-
tive d�Anne Hidalgo est contre-productive", Challenges, February 10 2015,
http://www.challenges.fr/politique/20150210.CHA2932/pollution-a-paris-pourquoi-
l-ecologie-punitive-d-anne-hidalgo-est-contre-productive.html (Accessed sept
24 2015).
Rose-Ackerman, Suzanne, 1979, "Market models of local government:
Exit, voting, and the land market", Journal of Urban Economics, 6, 319-337
Rossi-Hansberg, Esteban, Pierre-Daniel Sarte and Raymond Owens III
(2008), "Housing externalities", NBER Working paper 14369.
Westho¤, F., 1977, "Existence of equilibrium in economies with a local
public good", Journal of Economic Theory, 14, 84-112
34
APPENDIX I: Proofs
Ruling out a con�guration where all service workers are in the
city �We prove that a su¢ cient condition for ruling out such an outcome
is33
�u� � ln aS < min(ln a1; ln a2): (14)
To see this, assume such a con�guration holds. Then from Table 2 we
know that workers in the city provide services to both the city and the suburb,
i.e.
�u = (1 + �) ln(paS �R)� � ln p� + �� �; (15)
�u = (1 + �) ln(p�aS �R)� � ln p� + �: (16)
Cleraly, from these conditions, we must have that p > p�:
In such an equilibrium it must be that the workers get less than �u in the
suburb, i.e.
�u > (1 + �) ln(paS)� � ln p (17)
: From (15) it follows that
(1 + �) lnpaS �RpaS
> � lnp
p�+ �� �:
33In the bunkerized equilibrium that is characterized below, cadres cannot overbid work-ers for living in the city, because of the very high commuting they would have to incur.In an equilibrium where all workers are located in the city, however, they must also becommuting to the periphery, and it is enough for cadres to be richer than them to be ableto underbid them.Also note that the condition is more likely to be satis�ed, the more productive the
unskilled workers. Because services are nontraded and the supply of service workers isin�nitely elastic, an increase in aS reduces the price of services more than proportionally,making it easier for the two other classes to be richer. On the other hand, the skilledworkers�income always goes up with their productivity, as they produce a traded good.
35
Given (1), we also need that either the cadres or the bobos are better-o¤
in the suburb that in the city. Using Table 2, we see that bobos prefer to be
in the city provided
(1 + �) ln(a1 �R)� � ln p� + � > (1 + �) ln a1 � � ln p:
For this to be violated, it must be that
(1 + �) lna1 �Ra1
� � ln pp�� � < (1 + �) ln paS �R
paS� �:
Since � > 0; it must be that
a1 � paS: (18)
Using the same steps, we can show that for the cadres not to strictly
prefer the city, we need that
a2 � paS: (19)
From (17) we have that
ln p < �u� (1 + �) ln aS:
This inequality implies that if (14) holds, both (18) and (19) are violated.
It must then be that all cadres and all bobos live in the city, which contradicts
assumption (1).
Ruling out a con�guration where all city residents are service
workers �If that is the case, clearly some city residents must commute to
supply their services to the suburb, since total city demand for services is
lower than total city supply. Consequently, we must have that
(1 + �) ln(paS �R)� � ln p� + �� � = �u:
At the same time, city residents cannot get strictly more than �u by sup-
plying services locally:
36
(1 + �) ln(p�aS �R)� � ln p� + � � �u:
From these two conditions it must clearly be that case that
p� < p:
Consequently, suburban workers do not commute to the city. Then ser-
vices in the city are supplied locally, implying
(1 + �) ln(p�aS �R)� � ln p� + � = �u:
Since the LHS is an increasing function of p�; and since p > p�; it follows
that
(1 + �) ln(paS �R)� � ln p+ � > �u = (1 + �) ln(paS)� � ln p: (20)
Furthermore, bobos cannot be strictly better-o¤ in the city:
(1 + �) ln(a1 �R)� � ln p� + � < (1 + �) ln a1 � � ln p:
Since p� < p; it must then be that
(1 + �) ln(a1 �R)� � ln p+ � < (1 + �) ln a1 � � ln p: (21)
For (20) and (21) to simultaneously hold, it must be that a1 < paS; or
equivalently
ln a1 < �u� � ln aS:
But this contradicts (14).
Proof of Lemma 1 �The optimization problem of the pivotal voter in
each regime implies that �(�; �) is minimum in regime I, while �(�; �) is
minimum in regime II.
37
Proof of Proposition 1 �in regime II, the bobos set � and � so as to
maximize ����(�)=(1+�): In regime I, the cadres maximize �� 1+2�1+�
�(�):
Proof of Proposition 2 �Straightforward from the expression of house
prices and the fact that �B > �A > �A > �B:
Proof of Proposition 3 �We have that, using the derivations in the
preceding sections,
LBP + LBC � (LAP + LAC) / (a2 � a1)(H1 +H2 �X)(1� � � e�
�A1+� )
+X(RA �RB)�� + e�
�A1+�
�+ZB(e
� �B1+� � e�
�A1+� );
where
ZB = a1H1 + a2(X �H1)�RBX > 0:
Clearly, a2 > a1 since both regimes must exist for the transition to oc-
cur. Since one also has �B > �A; all terms above are negative under the
assumptions of the Proposition. QED.
Proof of Proposition 4 �Clearly, for t � T; we have that qt = RB=r =a2(1� e�B)=r: Furthermore, qT�1 = a1T�1(1�e�A )
1+r+ RB
r(1+r): This is clearly lower
than RB=r if (9) holds. Furthermore, we have that
qt+1 � qt =qt+1r � a1t(1� e�A)
1 + r:
We now show that this quantity is positive. Note that for t � T � 2
rqt+1 = r
T�1Xs=t+1
a1s(1� e�A)(1 + r)s�t
+RB
(1 + r)T�t�1
> a1t(1� e�A)�1� 1
(1 + r)T�1�t
�+a1T�1(1� e�A)(1 + r)T�1�t
> a1t(1� e�A)�1� 1
(1 + r)T�1�t
�+a1t(1� e�A)(1 + r)T�1�t
= a1t(1� e�A):
38
This proves that qt+1 > qt: QED.
Proof of Proposition 5 �For an equilibrium in regime III to exist,
the the cadres must be better-o¤ in the periphery. This is equivalent to (i).
Second, the bobos must be better-o¤ in the city, which is equivalent to (ii).
Third, the workers in the periphery should not have an incentive to commute
to the city, implying that (iii) must hold. Fourth, the cadres should not be
better-o¤ locating and working in the city, i.e. (iv) should hold.
Finally, the bobos should not be better-o¤ by deviating from the equilib-
rium value of � and picking an ex-post level of amenities that would induce
the workers to commute to the city. The price that would induce them to
do so is given by the RHS of (3), which we now denote by p�AB(�)34: If this
is lower than the autarky price of services obtained from (10) and (11), then
suburban workers commute to the city. This happens i¤ p�AB(�) < p�; or
equivalently
� < (1 + �)(ln p�C � ln p) = �max:
In the zone where � < �max; the bobo�s utility is given by (1 + �) ln(a1�RC)� � ln p�AB(�) + �:35 Therefore they maximize �� ��(�)=(1 + �); as inregime II, and pick � = min(�B; �
�1(�max)) = �0: The bobos will vote for
this outcome if and only if it delivers a greater utility than the maximum
possible value of �, that is (1+�) ln(a1�RC)�� ln p�C+�C < (1+�) ln(a1�RC)� � ln p�AB(�(�0)) + �0; or equivalently, denoting by �0 = �(�0);
�C � �0 < �(ln p�C � ln p��0
1 + �):
We note that if �0 = �max; the RHS is equal to zero. The LHS cannot
be negative, as �C is the maximum value of �: Therefore, this inequality is34The subscript AB refers to the fact that this relationship between p� and � must hold
in both regimes I and II.35Choosing an amenity level �0 6= �C ex-post has no e¤ect on R; since the resale value
of the home depends on expected future amenities, while the purchase price of the homedepends on expected curren amenities, given by �C :
39
violated for �0 = �max: It may only hold for �0 = �B; which is equivalent to
(v) being violated. If that is the case, then ex-post the bobos would pick an
amenity level such that workers commute from the suburbs to the city to o¤er
their services. But we can then check that it cannot be rational for workers
to locate to the city ex-ante. The reason is as follows: Service prices and
amenity levels are the same as in regime II. But in regime II workers prefer
to reside in the suburbs, i.e. would get a utility level lower than �u should
they live in the city. For them to locate in the city, it must therefore be that
rents are lower than in regime II, that is, Rt < RB: However, we know that
under regime II, cadres are indi¤erent between the two areas. For them to
now strictly prefer the periphery, it must be that Rt > RB; a contradiction.
Consequently, it must be that (v) holds for regime III to exist.
Conversely, if (i)-(v) hold, then clearly, the otucome computed in the
preceding subsection satis�es all the equilibrium conditions. QED.
Properties of regime IIIB �In regime IIIB, both workers and bobos
are located both in the city and periphery. The di¤erence between regime
III is two-fold. First, condition (ii) is replaced by an equality, stating that
bobos are equally better-o¤ in the city and in the periphery:
(1 + �) ln(a1 �RC)� � ln p�C + �C = (1 + �) ln a1 � � ln p: (22)
Second, the service market equilibrium condition is replaced by an inequality:
the demand for services in the city has to be lower than if all bobos were
located in the city, implying that
Rt � a1H1X� aS�p�t
�1� H1
X
�:
Consequently, the SME schedule has to be replaced by Equation (22),
which is again downward sloping, while the HME schedule is unchanged.
Given the equilibrium values of R and p�; the number of bobos residing in
40
the city, ~H1; is determined by the city equilibrium in the service market, that
is
~H1 =R + p�aS=�
a1 + p�aS=�X:
41
APPENDIX 2 �Data sources and group assignment
The data sources used were as follows:
For house prices 1998-2015 per urban areas, the professional website
http://www.meilleursagents.com
For social housing in 2012-2013, the French ministry of housing at
http://www.statistiques.developpement-durable.gouv.fr/logement-construction/r/logement-
social-parc-social.html
For social housing 2006-2011, the French national statistical institute at
http://www.insee.fr/fr/themes/detail.asp?reg_id=99&ref_id=base-cc-logement-
06
For the sectoral composition of employment, the Analyse Fonctionnelle
des Données communales at INSEE
(http://www.insee.fr/fr/themes/detail.asp?reg_id=99&ref_id=analyse)
Income per capita is taken from INSEE at
http://www.insee.fr/fr/themes/detail.asp?reg_id=99&ref_id=structure-
distrib-revenus-2011
The population data are from INSEE at
http://www.insee.fr/fr/themes/detail.asp?reg_id=99&ref_id=base-cc-logement-
08 (pour 2006-2008)
and
http://www.insee.fr/fr/themes/detail.asp?reg_id=99&ref_id=base-cc-logement-
2009 (pour 2009-2011)
The list of trams and vélibs is available from Wikipedia at
https://fr.wikipedia.org/wiki/Liste_des_syst%C3%A8mes_de_v%C3%A9los_en_libre-
service_en_France
and
https://fr.wikipedia.org/wiki/Liste_des_tramways_de_France.
This was checked with independent sources: town hall web sites, press
articles, and the following web site:
42
http://www.transbus.org/dossiers/tramway_service.html
The electoral data are from the French Interior ministry, at
http://www.interieur.gouv.fr/Elections/Les-resultats/Municipales/elecresult_
_municipales_2008/%28path%29/municipales_2008/index.html
The list of urban areas and their group assignment, for � = 0:1, with
group I being the highest amenity level, is as follows:
Group I: Lyon, Toulouse, Bordeaux, Nice, Strasbourg, Montpellier, Saint-
Etienne, Orléans, Angers, Dijon.
Group II: Paris, Marseille, Lille, Nantes, Grenoble, Rennes, Rouen, Avi-
gnon, Nancy, Caen, Valenciennes, Le Mans, Reims, Brest, Perpignan, Amiens,
Besançon, Pau, La Rochelle
Group III: Toulon, Douai, Lens, Tours, Clermont-Ferrand, Metz, Béthune,
Le Havre, Limoges, Bayonne, Dunkerque, Poitiers, Nîmes, Lorient, Annecy,
Chambéry, Saint-Nazaire, Troyes
43
R
HME
SME
Figure 1 – Equilibrium determination in regime III
p*
R
p*
HME
SME Increase in amenities
Increase in a1
Figure 2 – Effect of α and a1 on equilibrium rentals and service prices
0
0,5
1
1,5
2
2,5
3
3,5
4
4,5
0,70 1,00 1,30 1,60 1,90 2,20 2,50 2,80 3,10 3,40 3,70 4,00 4,30 4,60 4,90 5,20 5,50 5,80 6,10 6,40 6,70 7,00 7,30 7,60 7,90
a1
Figure 3: House rental price in regimes II and III
House cost, RIII
House cost, RII
0
0,5
1
1,5
2
2,5
3
3,5
4
4,5
5
0,70 1,00 1,30 1,60 1,90 2,20 2,50 2,80 3,10 3,40 3,70 4,00 4,30 4,60 4,90 5,20 5,50 5,80 6,10 6,40 6,70 7,00 7,30 7,60 7,90
a1
Figure 4: Service price in city in regimes II and III
Price of service s in city, RIII
Price of services in city, RII
0
1
2
3
4
5
6
7
8
0,70 1,00 1,30 1,60 1,90 2,20 2,50 2,80 3,10 3,40 3,70 4,00 4,30 4,60 4,90 5,20 5,50 5,80 6,10 6,40 6,70 7,00 7,30 7,60 7,90
a1
Figure 5: Bobo utility in regimes II and III
Utility, RIII
Utility, RII


![CWS ParadiseLine. Exklusive Waschraumgestaltung. · 2019-03-15 · 10 ] Paradise Antibact Slim 11 ] Paradise Disinfect 12 ] Paradise Air Bar 13 ] Paradise Seatcleaner 14 ] Paradise](https://img.pdfslide.net/doc/110x75/5fb4caf7abd6f51d5367cf9d/cws-paradiseline-exklusive-2019-03-15-10-paradise-antibact-slim-11-paradise.jpg)


![CWS ParadiseLine. · 3 ] Paradise Dry Slim 4 ] Paradise Paperroll 5 ] Paradise Paper Slim 6 ] Paradise Foam Universal* 7 ] Paradise Foam NT 8 ] Paradise Cream Universal* 9 ] Paradise](https://img.pdfslide.net/doc/110x75/5ec6aefefa78e972cd305fc1/cws-3-paradise-dry-slim-4-paradise-paperroll-5-paradise-paper-slim-6-paradise.jpg)


![CWS ParadiseLine.€¦ · 13 ] Paradise Superroll 14 ] Paradise LadyCare NT*** 15 ] Paradise Cleanseat Power / Universal Welcome to Paradise. Wir bei CWS begreifen die hochwertige](https://img.pdfslide.net/doc/110x75/5f0733997e708231d41bd006/cws-13-paradise-superroll-14-paradise-ladycare-nt-15-paradise-cleanseat.jpg)