Embed Size (px)
Citation preview

BOC HPU CCS STUDY REPORT
28603�8111�RP�001 PAGE 2 OF 49 REV O2
Revision: O2 Date: Nov 2014
CONTENTS
1. EXECUTIVE SUMMARY ......................................................................................................... 3
1.1 Scope ............................................................................................................................... 3
1.2 Capture Options ............................................................................................................... 4
1.3 Technical Highlights – Post�Combustion Capture ............................................................. 4
1.4 Plot Considerations ........................................................................................................... 6
1.5 Total Installed Cost (TIC) .................................................................................................. 6
1.6 Estimate of Operating Costs ............................................................................................. 7
1.7 Projected Overall Project Schedule .................................................................................. 7
1.8 Conclusions ...................................................................................................................... 8
2. INTRODUCTION ................................................................................................................... 10
2.1 Carbon Capture Options ................................................................................................. 10
3. POST�COMBUSTION CAPTURE PLANT DESIGN ASSESSMENT ...................................... 12
3.1 Hydrogen Plant Operating Mode ..................................................................................... 12
3.2 Carbon Capture Plant Process Description ..................................................................... 12
3.3 Technical Performance ................................................................................................... 17
3.4 Plot Plan & Plant Layout ................................................................................................. 18
3.5 Total Installed Cost (TIC) ................................................................................................ 20
3.6 Estimate of Operating Costs ........................................................................................... 24
3.7 Projected Execution Strategy .......................................................................................... 27
4. ASSESSMENT OF CAPTURE AND TECHNOLOGY OPTIONS ............................................ 30
5. STUDY CONCLUSIONS & RECOMMENDATIONS............................................................... 36
5.1 Conclusions .................................................................................................................... 36
5.2 Recommendations for Further Consideration .................................................................. 37
5.3 Heat Integration .............................................................................................................. 37
6. STUDY DESIGN BASIS ........................................................................................................ 38
6.1 Basic Design Data (existing HPU) .................................................................................. 38
6.2 Design Basis New CO2 Capture Plant ............................................................................ 39
ATTACHMENTS
1. Process Flow Diagrams & Material Balances
2. Equipment List
3. Utilities Summary
4. Plot Plan
5. Preliminary Single Line Diagram
6. Cost Estimate
7. Project Schedule
DISCLAIMER
The information contained herein is provided by Foster Wheeler Energy Limited (FWEL) to Stockton Borough Council on behalf of Tees Valley Unlimited (TVU), solely to assist TVU in its study into the potential application of CCS in Teesside UK.
FWEL has not made any independent verification of data and information contained herein that has been supplied by TVU or other third parties. This report is intended for the sole use of TVU and FWEL makes no representation or warranty, express or implied, and assumes no obligation or liability, whatsoever, to any third party with respect to the veracity, adequacy, completeness, accuracy or use of any information contained herein.
The information provided is not, and should not be construed as, a recommendation by FWEL that any recipient provide finance to any particular technology provider or project. Each recipient of this document should make its own independent evaluation of any such technology provider or project and of the relevance and accuracy of the information contained herein, and should make such other investigations as it deems necessary to determine whether to extend credit to that technology provider or project.
BOC HPU CCS STUDY REPORT
28603�8111�RP�001 PAGE 3 OF 49 REV O2
Revision: O2 Date: Nov 2014
1. EXECUTIVE SUMMARY
1.1 Scope
In 2013 Tees Valley Unlimited (TVU) secured a City Deal to progress the development of an industrial carbon capture and storage (ICCS) scheme. This has initiated the development of a carbon capture scheme involving four of the more significant CO2 emitters in the Teesside area; Sahaviriha Steel Industries (SSI), Growhow, BOC and Lotte. TVU have engaged Pale Blue Dot to co�ordinate the overall ICCS scheme.
As the technology licensor for the BOC Hydrogen Plant, Foster Wheeler were engaged to provide a feasibility level design for a CO2 Capture Plant which would recover CO2 and deliver it to the plant battery limit where it would be collected by others for sequestration.
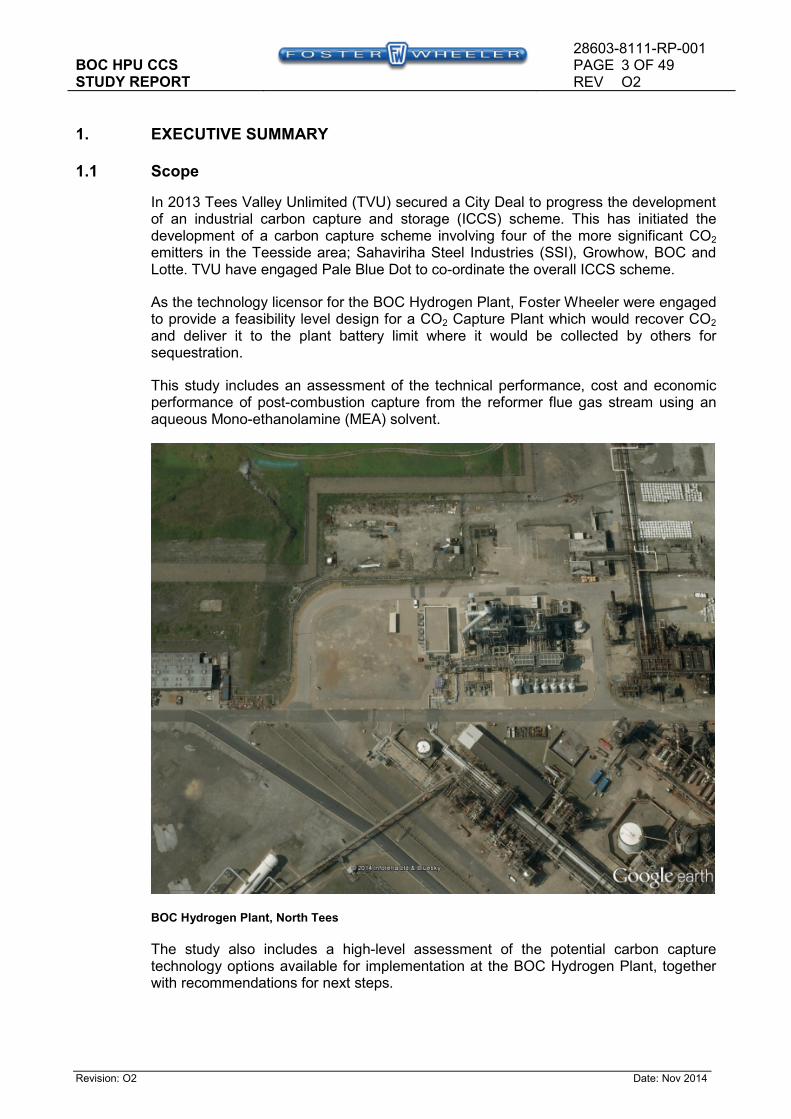
This study includes an assessment of the technical performance, cost and economic performance of post�combustion capture from the reformer flue gas stream using an aqueous Mono�ethanolamine (MEA) solvent.
BOC Hydrogen Plant, North Tees
The study also includes a high�level assessment of the potential carbon capture technology options available for implementation at the BOC Hydrogen Plant, together with recommendations for next steps.
BOC HPU CCS STUDY REPORT
28603�8111�RP�001 PAGE 4 OF 49 REV O2
Revision: O2 Date: Nov 2014
1.2 Capture Options
There are three main options for carbon capture from the BOC Hydrogen plant;
1. Post combustion carbon capture from the Reformer flue gas; Expected to achieve an overall capture rate of 90% using an MEA unit.
2. Carbon capture from the pressure swing adsorption (PSA) unit tail gas; Expected to achieve an overall capture rate of 49% using MEA unit based on 90% CO2 capture. This option reduces the amount of CO2 produced overall for the same hydrogen production.
3. Carbon capture from the synthesis gas feed to the PSA unit; Expected to achieve an overall capture rate of 49�54%. This is the essentially the same as above as only reforming product CO2 is captures. Just removed upstream of the PSA unit rather than downstream. This would use technologies that are more suited to higher operating pressure. This option also reduces the amount of CO2 produced overall for the same hydrogen production.
1.3 Technical Highlights – Post1Combustion Capture
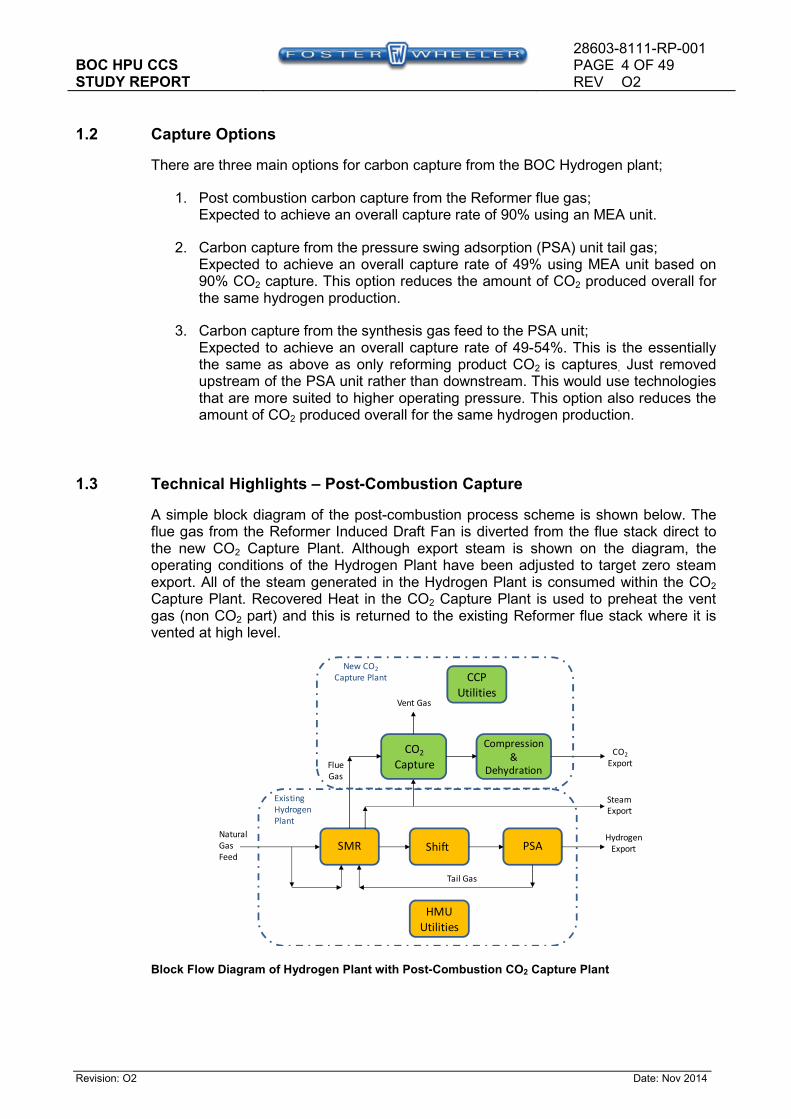
A simple block diagram of the post�combustion process scheme is shown below. The flue gas from the Reformer Induced Draft Fan is diverted from the flue stack direct to the new CO2 Capture Plant. Although export steam is shown on the diagram, the operating conditions of the Hydrogen Plant have been adjusted to target zero steam export. All of the steam generated in the Hydrogen Plant is consumed within the CO2 Capture Plant. Recovered Heat in the CO2 Capture Plant is used to preheat the vent gas (non CO2 part) and this is returned to the existing Reformer flue stack where it is vented at high level.
Block Flow Diagram of Hydrogen Plant with Post1Combustion CO2 Capture Plant
Natural
Gas
FeedSMR Shift PSA
Hydrogen
Export
Tail Gas
Flue
Gas
Steam
Export
HMU
Utilities
Existing
Hydrogen
Plant
CO2
Capture
Compression
&
Dehydration
CO2
Export
Vent Gas
CCP
Utilities
New CO2
Capture Plant
BOC HPU CCS STUDY REPORT
28603�8111�RP�001 PAGE 5 OF 49 REV O2
Revision: O2 Date: Nov 2014
In the Hydrogen Plant, CO2 is produced in two places. Firstly, as a by�product of the steam reforming reactions � this CO2 forms part of the Tail Gas stream; secondly, in the combustion side of the steam reformer furnace, where the Tail Gas, along with supplementary fuel is burnt. The Flue Gas from the Reformer contains both the reaction CO2 and the combustion CO2.
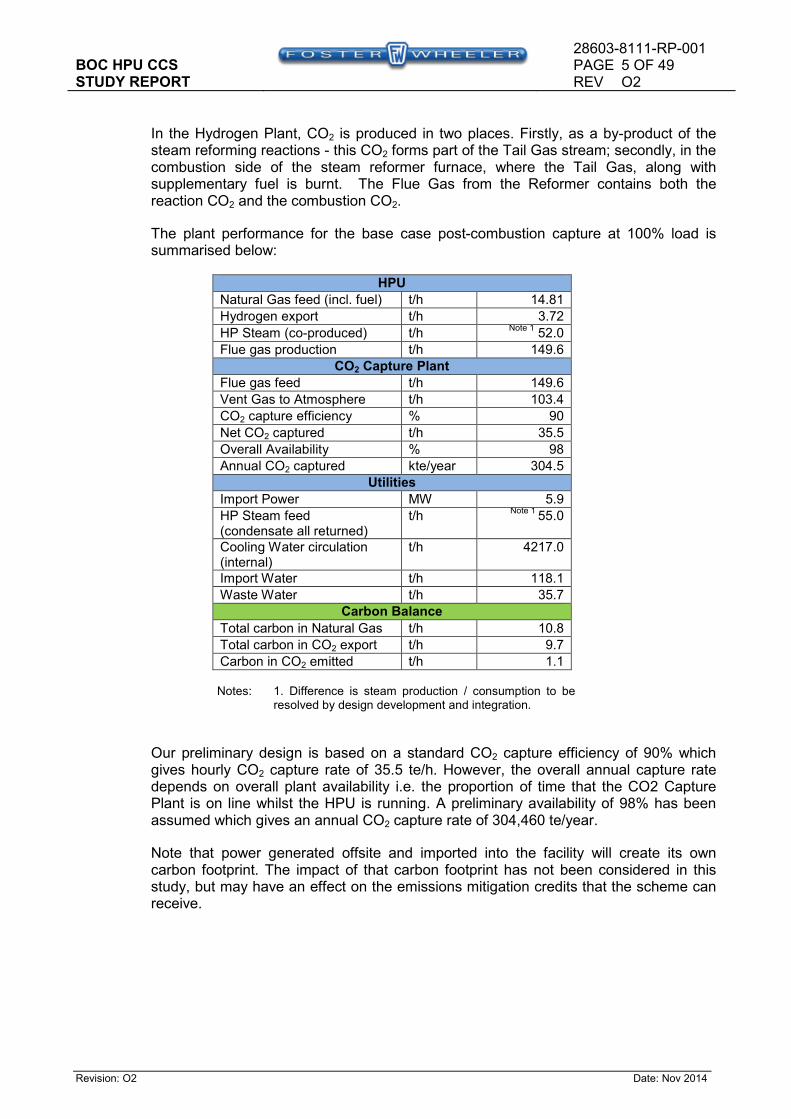
The plant performance for the base case post�combustion capture at 100% load is summarised below:
HPU
Natural Gas feed (incl. fuel) t/h 14.81
Hydrogen export t/h 3.72
HP Steam (co�produced) t/h Note 1
52.0
Flue gas production t/h 149.6
CO2 Capture Plant
Flue gas feed t/h 149.6
Vent Gas to Atmosphere t/h 103.4
CO2 capture efficiency % 90
Net CO2 captured t/h 35.5
Overall Availability % 98
Annual CO2 captured kte/year 304.5
Utilities
Import Power MW 5.9
HP Steam feed (condensate all returned)
t/h Note 1
55.0
Cooling Water circulation (internal)
t/h 4217.0
Import Water t/h 118.1
Waste Water t/h 35.7
Carbon Balance
Total carbon in Natural Gas t/h 10.8
Total carbon in CO2 export t/h 9.7
Carbon in CO2 emitted t/h 1.1 Notes: 1. Difference is steam production / consumption to be
resolved by design development and integration.
Our preliminary design is based on a standard CO2 capture efficiency of 90% which gives hourly CO2 capture rate of 35.5 te/h. However, the overall annual capture rate depends on overall plant availability i.e. the proportion of time that the CO2 Capture Plant is on line whilst the HPU is running. A preliminary availability of 98% has been assumed which gives an annual CO2 capture rate of 304,460 te/year.
Note that power generated offsite and imported into the facility will create its own carbon footprint. The impact of that carbon footprint has not been considered in this study, but may have an effect on the emissions mitigation credits that the scheme can receive.
BOC HPU CCS STUDY REPORT
28603�8111�RP�001 PAGE 6 OF 49 REV O2
Revision: O2 Date: Nov 2014
Two other options have been considered at a high level owing to the time constraints on this initial study. These options are;
Option 1 � CO2 recovery from the Tail Gas stream (shown above).This a low pressure reject stream from the Pressure Swing Absorber (PSA) Unit. This stream is rich in CO2; it only contains the CO2 produced in the Reforming process and does not capture the combustion CO2.
Option 2 � CO2 recovery from the feed stream to the PSA Unit. This stream similarly contains only the process CO2 and does not capture the combustion CO2. The difference is that this is a high pressure stream and the CO2 partial pressure is considerably higher.
1.4 Plot Considerations
The total plot area needed for the CO2 Capture Plant is larger than the area initially suggested by BOC and a number of auxiliary items have been located on an area of ground alongside the existing but now redundant Cumene Plant control room.
Parts of the plot identified for the CO2 Capture Plant are not currently owned by BOC. Land acquisition has not been addressed in this study, and costs associated with acquiring and initial preparation of land have been excluded from our estimate.
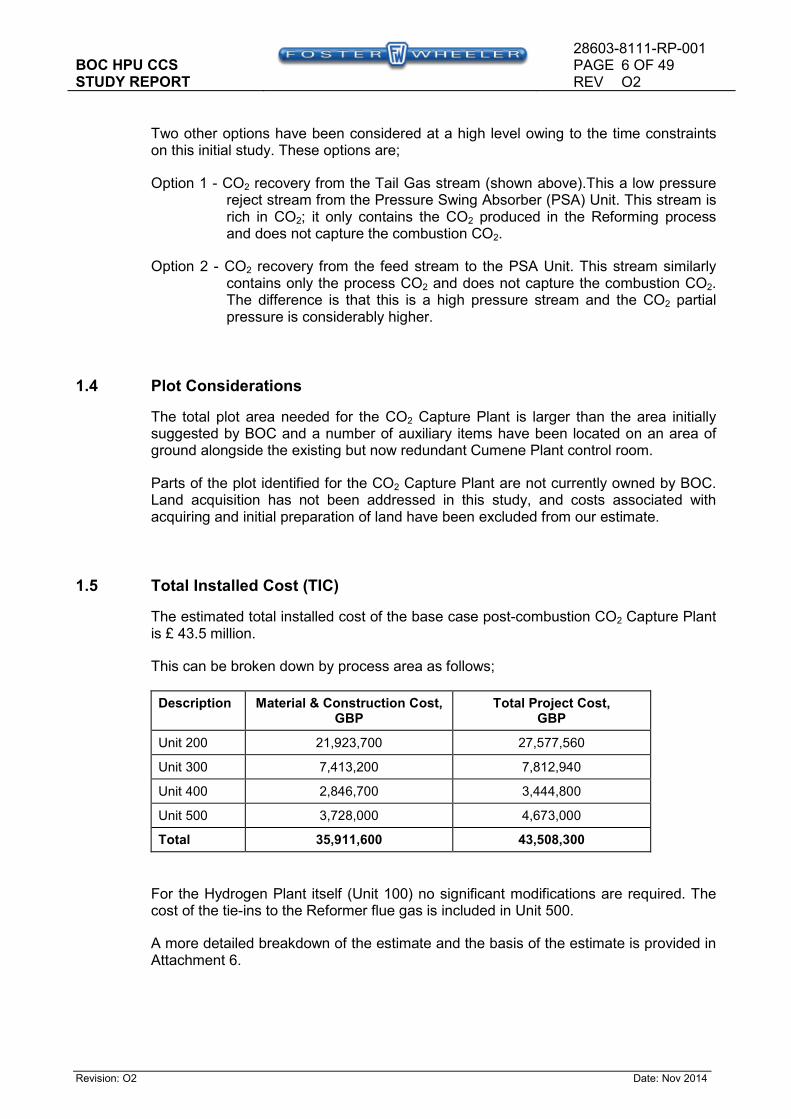
1.5 Total Installed Cost (TIC)
The estimated total installed cost of the base case post�combustion CO2 Capture Plant is £ 43.5 million.
This can be broken down by process area as follows;
Description Material & Construction Cost, GBP
Total Project Cost, GBP
Unit 200 21,923,700 27,577,560
Unit 300 7,413,200 7,812,940
Unit 400 2,846,700 3,444,800
Unit 500 3,728,000 4,673,000
Total 35,911,600 43,508,300
For the Hydrogen Plant itself (Unit 100) no significant modifications are required. The cost of the tie�ins to the Reformer flue gas is included in Unit 500.
A more detailed breakdown of the estimate and the basis of the estimate is provided in Attachment 6.
BOC HPU CCS STUDY REPORT
28603�8111�RP�001 PAGE 7 OF 49 REV O2
Revision: O2 Date: Nov 2014
1.6 Estimate of Operating Costs
The operating costs of the CO2 Capture Plant (fixed & variable) are summarised below;
Fixed Costs £3.95 m/year (Direct Labour, Admin/General Overhead Maintenance & Insurance)
Variable Costs £4.43 m/year (Import Power, Fresh Water, Waste Water)
At over £3.7m/year, the cost of importing power is by far the largest element, accounting for 85% of the total variable operating costs.
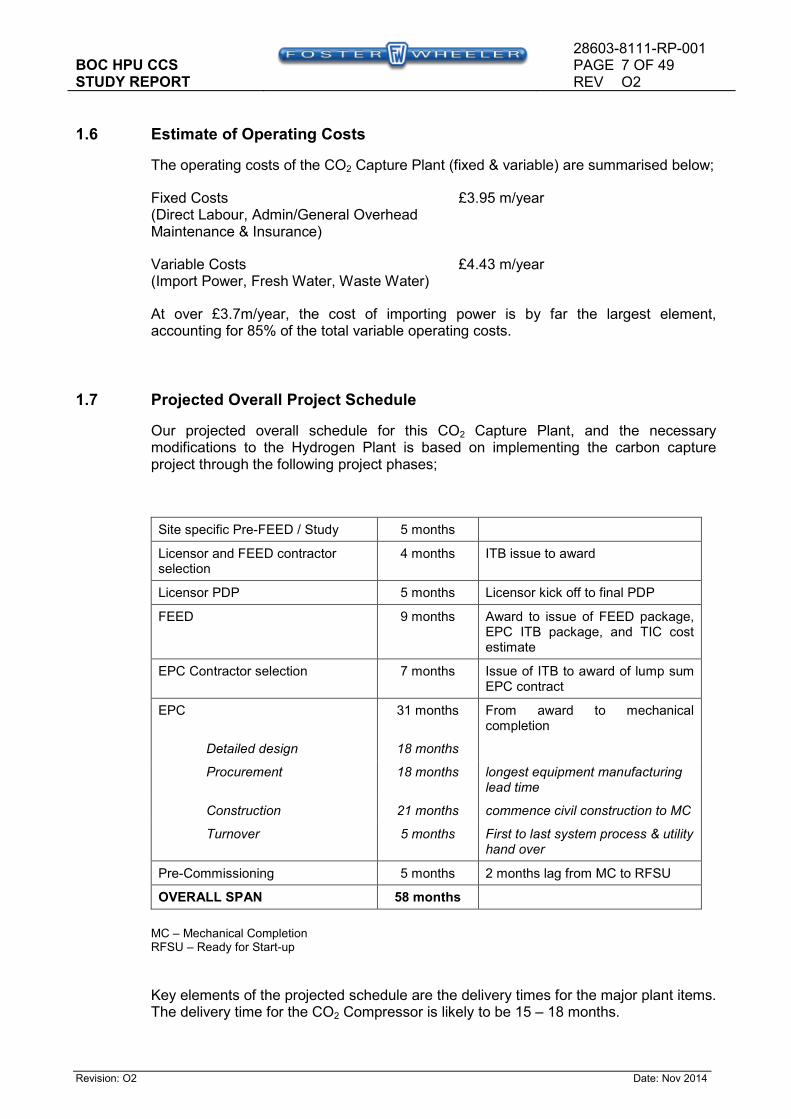
1.7 Projected Overall Project Schedule
Our projected overall schedule for this CO2 Capture Plant, and the necessary modifications to the Hydrogen Plant is based on implementing the carbon capture project through the following project phases;
Site specific Pre�FEED / Study 5 months
Licensor and FEED contractor selection
4 months ITB issue to award
Licensor PDP 5 months Licensor kick off to final PDP
FEED 9 months Award to issue of FEED package, EPC ITB package, and TIC cost estimate
EPC Contractor selection 7 months Issue of ITB to award of lump sum EPC contract
EPC 31 months From award to mechanical completion
Detailed design 18 months
Procurement 18 months longest equipment manufacturing lead time
Construction 21 months commence civil construction to MC
Turnover 5 months First to last system process & utility hand over
Pre�Commissioning 5 months 2 months lag from MC to RFSU
OVERALL SPAN 58 months
MC – Mechanical Completion RFSU – Ready for Start�up
Key elements of the projected schedule are the delivery times for the major plant items. The delivery time for the CO2 Compressor is likely to be 15 – 18 months.
BOC HPU CCS STUDY REPORT
28603�8111�RP�001 PAGE 8 OF 49 REV O2
Revision: O2 Date: Nov 2014
1.8 Conclusions
Base Case Post Combustion CO2 Capture
The base case, post combustion CO2 capture is the conventional approach and provides the highest CO2 capture efficiency. Based on 90% capture, and an overall availability of 98%, 304 ktpa of CO2 is captured and exported to the collection network.
The base case scheme has been shown to be feasible with an estimated total installed cost of £43.5 million, an operating cost of £7.2 million per year, and a total project schedule of 58 months.
The next step would be to carry out a full pre�FEED and licensor selection as outlined in our suggested execution strategy described in section 3.7.
CO2 Capture Options 1 & 2
Options 1 & 2 capture only the CO2 produced by the reforming process as a result of the chemical reactions. The CO2 captured is 19,380 kg/hr, giving an overall capture efficiency of 49%.
In option 1 the CO2 Capture Plant would use a post�combustion capture solvent (such as MEA) as in the base case and would be around half of the base case capacity, pro�rated directly from the amount of CO2 removed.
The TIC for the CO2 Capture Plant in option 1 has been crudely estimated at £28 million. Some economy of scale is lost but if there is limited capital available, this option may be attractive.
In option 2, as the feed gas is at high pressure it is likely that a physical absorption process would be more appropriate to take advantage of the very much higher CO2 partial pressure. The CO2 removal technology would therefore not be that typically employed in post combustion capture, but more aligned to process gas sweetening. By removing the CO2 from the feed stream to the PSA unit, the PSA unit would be significantly de�bottlenecked which would provide opportunity to de�bottleneck the HPU.
This study has not looked at the potential costs of these technologies; however it is clear that if they can deliver the same amount of CO2 capture for lower cost than option 1, then these would be preferred.
BOC HPU CCS STUDY REPORT
28603�8111�RP�001 PAGE 9 OF 49 REV O2
Revision: O2 Date: Nov 2014
Base Case Post Combustion CO2 Capture
Future work should look at:
• Reducing the TIC of CO2 Compression & Drying Unit by optimising the CO2 export pressure to the network.
• Controllability and potential for combination of the HPU ID Fan and CCP Flue Gas Blower
• Optimisation of heat recovery between combustion air preheater and gas�gas exchanger, which could reduce DCC capex and cooling load
• Resolution of minor steam imbalance through targeted production of steam at LP level.
BOC HPU CCS STUDY REPORT
28603�8111�RP�001 PAGE 10 OF 49 REV O2
Revision: O2 Date: Nov 2014
2. INTRODUCTION
In 2013 Tees Valley Unlimited (TVU) secured a City Deal to progress the development of an industrial carbon capture and storage (ICCS) scheme. This has initiated the development of a carbon capture scheme involving four of the more significant CO2 emitters in the Teesside area; Sahaviriha Steel Industries (SSI), Growhow, BOC and Lotte. TVU have engaged Pale Blue Dot to co�ordinate the overall ICCS scheme.
Foster Wheeler is the technology licensor for the BOC Hydrogen plant which is based on the patented Terrace Wall® steam methane reformer design. The BOC plant which commenced operation in 2001 was designed and constructed by Foster Wheeler. Foster Wheeler also has considerable experience in the design of carbon capture plants for both power and industrial applications.
Foster Wheeler were engaged to provide a pre�feasibility level design and assessment of the technical performance, cost and economic performance of post�combustion capture from the reformer flue gas stream using an aqueous Mono�ethanolamine (MEA) solvent.
This study also includes a high�level assessment of the potential carbon capture technology options available for implementation at the BOC Hydrogen Plant, together with recommendations for next steps.
2.1 Carbon Capture Options
There are three main options for carbon capture from the BOC Hydrogen plant;
1. Post combustion carbon capture from the main reformer flue gas;
2. Carbon capture from the pressure swing adsorption (PSA) unit tail gas;
3. Carbon capture from the synthesis gas upstream of the PSA unit.
In this study, option 1 has been assumed as the base case for design assessment, using MEA as a solvent, which is an established technology often referenced as a capture benchmark, and allows for a largely independent capture scheme with a high overall capture rate.
BOC HPU CCS STUDY REPORT
28603�8111�RP�001 PAGE 11 OF 49 REV O2
Revision: O2 Date: Nov 2014
2.1.1 Post Combustion Carbon Capture
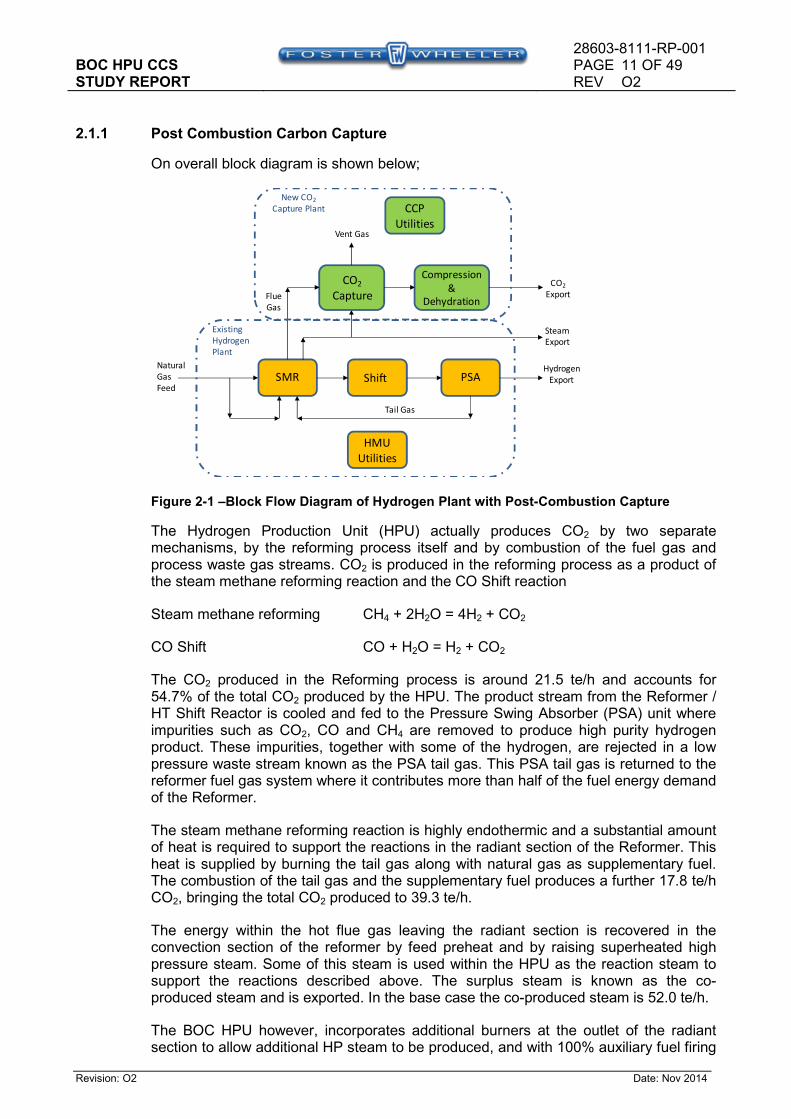
On overall block diagram is shown below;
Figure 211 –Block Flow Diagram of Hydrogen Plant with Post1Combustion Capture
The Hydrogen Production Unit (HPU) actually produces CO2 by two separate mechanisms, by the reforming process itself and by combustion of the fuel gas and process waste gas streams. CO2 is produced in the reforming process as a product of the steam methane reforming reaction and the CO Shift reaction
Steam methane reforming CH4 + 2H2O = 4H2 + CO2
CO Shift CO + H2O = H2 + CO2
The CO2 produced in the Reforming process is around 21.5 te/h and accounts for 54.7% of the total CO2 produced by the HPU. The product stream from the Reformer / HT Shift Reactor is cooled and fed to the Pressure Swing Absorber (PSA) unit where impurities such as CO2, CO and CH4 are removed to produce high purity hydrogen product. These impurities, together with some of the hydrogen, are rejected in a low pressure waste stream known as the PSA tail gas. This PSA tail gas is returned to the reformer fuel gas system where it contributes more than half of the fuel energy demand of the Reformer.
The steam methane reforming reaction is highly endothermic and a substantial amount of heat is required to support the reactions in the radiant section of the Reformer. This heat is supplied by burning the tail gas along with natural gas as supplementary fuel. The combustion of the tail gas and the supplementary fuel produces a further 17.8 te/h CO2, bringing the total CO2 produced to 39.3 te/h.
The energy within the hot flue gas leaving the radiant section is recovered in the convection section of the reformer by feed preheat and by raising superheated high pressure steam. Some of this steam is used within the HPU as the reaction steam to support the reactions described above. The surplus steam is known as the co�produced steam and is exported. In the base case the co�produced steam is 52.0 te/h.
The BOC HPU however, incorporates additional burners at the outlet of the radiant section to allow additional HP steam to be produced, and with 100% auxiliary fuel firing
Natural
Gas
FeedSMR Shift PSA
Hydrogen
Export
Tail Gas
Flue
Gas
Steam
Export
HMU
Utilities
Existing
Hydrogen
Plant
CO2
Capture
Compression
&
Dehydration
CO2
Export
Vent Gas
CCP
Utilities
New CO2
Capture Plant

BOC HPU CCS STUDY REPORT
28603�8111�RP�001 PAGE 12 OF 49 REV O2
Revision: O2 Date: Nov 2014
the steam export can be increased to 96 te/h. This allows for additional HP steam to be exported to external customers.
For the purpose of this study, additional export steam will not be produced and auxiliary fuel firing will be zero. All of the co�produced steam will be fed to the Carbon Capture Plant (CCP) to provide process heating for reboilers etc.
The HPU is tied into the CCP by diverting the flue gas from the delivery side of the Induced Draft Blower B�101 to the CCP rather than being sent to flue stack.
At this point the flue gas is at near�atmospheric pressure and the CO2 concentration is 17.4 mol% (wet basis). Capturing CO2 at this point will allow for capture of both the carbon from the reforming process and from the combustion of the tail gas and fuel gas. Typically 90% of this total CO2 (35.4 te/h) would be captured.
This option is the most straight forward of the options, and achieves the highest rate of overall capture. As such, this is the option that has been studied in detail in this report.
3. POST1COMBUSTION CAPTURE PLANT DESIGN ASSESSMENT
3.1 Hydrogen Plant Operating Mode
A marked up PFD showing the main tie�ins to the Reformer flue stack for the base case is included in Attachment 1.
An important operating mode of the Reformer is the ability to operate in natural draft mode during certain trip scenarios, such as failure of the ID Fan. In such circumstances the Reformer trips to what is known as “minimum fire” mode. The firing rate is reduced, the stack damper is opened and Reformer operates in natural draft mode. This operating mode must be retained as it forms part of the Reformer protection system and contributes significantly to the Hydrogen Plant reliability.
3.2 Carbon Capture Plant Process Description
The Carbon Capture Plant is made up of the following:
• CO2 Capture Unit – CO2 removal scheme developed using in�house information on the basis of a 30% MEA�based process;
• CO2 Compression and Drying Unit – dehydration and multi�stage compression to export conditions of 100 barg and 35°C;
• Associated utility systems – new substation, cooling towers and cooling water systems, waste water buffer tank, etc.
The carbon capture scheme is configured with a single train of MEA absorption, steam stripping and CO2 compression and drying. None of these units is approaching the maximum capacity of train size.
BOC HPU CCS STUDY REPORT
28603�8111�RP�001 PAGE 13 OF 49 REV O2
Revision: O2 Date: Nov 2014
Attachment 1 includes Process Flow Diagrams and a material balance for the CO2 Capture Unit and the CO2 Compression and Dehydration Unit.
Attachment 2 includes a list of the new equipment required, the sizes of which have been developed to reflect the expected flows and process conditions.
Attachment 3 includes a summary of the utilities required by each of the new units for the capture facility.
CO2 Capture
A blower boosts the flue gas pressure sufficiently to overcome the pressure drop in the direct contact cooler (DCC), gas/gas exchanger and absorption column. In the DCC much of the water present in the flue gas stream condenses as the gas is cooled to 50°C. The condensate is then recirculated through a cooler and returned to the contact tower. A small quantity of sodium hydroxide may be added to the recirculating water in order to ensure that any remaining SO2 in the flue gas is removed to meet the <10 ppm specification to prevent excessive solvent losses. Precipitates and excess water are removed from the system to waste water treatment.
In the lower portion of the absorption column the flue gas is contacted with semi�lean and then lean amine which absorbs approximately 90% of the CO2 content of the flue gas. This section also incorporates an extraction and cooling loop in order to ensure the cooler conditions which are more favourable to CO2 absorption. In the top of the absorption column the flue gas is washed with water to prevent solvent losses to the atmosphere. The flue gas is routed back to the gas / gas exchanger, to cool the incoming flue gas and ensure the absorber vent gas temperature is sufficient for dispersion (assumed as 125°C), then is released to atmosphere via the stack.
The CO2�rich solvent stream exits the bottom of the absorber column and is pumped to approximately 5 bara. The stream is then split, with approximately 25% of the flow passing through 2 stages of heating against warmer solvent streams before being flashed at a pressure of 1.3 bara. The semi lean solvent from the flash drum is then cooled against rich solvent and returned to the absorption column with the cooled extracted solvent. The remaining rich solvent is heated against lean solvent in the cross over exchanger and introduced to the regenerator column.
In the regenerator column the CO2 desorbs from the rich solvent as it is heated producing a stream of hot lean solvent from the bottom of the regenerator. This lean solvent is cooled against rich solvent and returned to the absorption column. The regenerator overheads are cooled to 30°C, condensing a significant quantity of water, some of which is returned to the regenerator as reflux with the rest being sent to treatment or recovery.
CO2 Compression and Drying
The acid gas resulting from the semi lean amine flash is compressed in the first of 7 compression stages, after which it is cooled and passed through a knock out drum. After the first compression stage the main CO2 stream from the regenerator column is added to the flashed acid gas stream for all the subsequent compression steps. Between each of the next 4 steps is a cooler and knock out drum, and the CO2 is compressed up to a pressure of 26 bara.
The CO2 is then dried by molecular sieve adsorption to reach the specification of <50 ppmv moisture. Two dehydration vessels are required since one bed will be in use whilst the second bed will be in regeneration. The regeneration cycle uses a slipstream
BOC HPU CCS STUDY REPORT
28603�8111�RP�001 PAGE 14 OF 49 REV O2
Revision: O2 Date: Nov 2014
of dried gas exiting the operating molecular sieve bed. The gas is heated using the returning regeneration gas exiting the molecular sieve bed in regeneration. It is further heated under temperature control in an electric heater before entering the bed in a counter flow direction. The wet gas leaving the bed is cooled against incoming gas, any condensed water is separated in a knock out drum before it is passed through a fines filter and returned upstream of the 3rd stage compressor. The absorbent regeneration process takes several hours. When complete the heater is bypassed and the bed is cooled down over several hours before return to operation.
The final 2 compression stages include intercoolers and an after cooler and result in a final CO2 product at specification of 100 barg and 35°C.
CO2 Export � Oxygen Specification
The product CO2 stream has an oxygen concentration of 9.8 ppm, which meets the proposed pipeline specification. At <10 ppm O2, the CO2 is acceptable for storage in a saline aquifer such as National Grid’s 5/42 or other new build underground CO2 storage facility.
However, if an existing oil/gas field is proposed for CO2 storage, such as Shell’s Goldeneye facility, a much tighter oxygen specification as low as 1 ppm may be required to reduce well piping corrosion. Reducing the allowable O2 in the CO2 specification will require an additional process, which will add to the cost and complexity of the overall scheme. A cryogenic CO2 purification unit or a catalytic purification process would be required in order to produce a CO2 product gas with an O2 content of below 10ppmv. The O2 polishing process will add to the parasitic load, require additional plot space and increase the cost of capture per tonne of CO2.
Assuming that the product CO2 from the plant boundary will be sent into the Tees Valley ICCS network before being transported offshore for storage, it is expected that it would be more efficient and cost effective to have a centralised O2 polishing system, for example at a booster station, before being sent to the offshore pipeline.
Utility Systems
The key utility requirements for this scheme include:
Electrical Supply
The estimated power consumption of the new plant is approximately 5.8 MW. This is over five times the total power consumption of the existing HPU and this additional power will need to be met by a new 11kV power supply from a third party. This could be either SABIC Aromatics 2 (11kV substation) or alternatively from the new Air Products Tees Valley Energy from Waste Plant.
It will require a new package substation to include (1 off) 11kV 1200 amp switchboard, (2 off) 11/0.433 kV, 1 MVA transformers and (1 off) 415V switchboard. The package substation would be delivered pre�wired. A preliminary Single Line Diagram is included in Attachment 5 to show the degree of modifications required to the electrical infrastructure.
The largest single contributor to the power demand is the CO2 Compressor, due in part to the specified export pressure of 100 barg. Export pressures from individual producers are a key area for optimisation from an ICCS scheme.
BOC HPU CCS STUDY REPORT
28603�8111�RP�001 PAGE 15 OF 49 REV O2
Revision: O2 Date: Nov 2014
It is also worth considering that the additional power generated offsite and imported into the facility will create its own carbon footprint. The impact of that carbon footprint has not been considered in this study, but may have an effect on the emissions mitigation credits that the scheme can receive.
Steam
For the base case design, BOC’s preference is that export HP steam from the HPU should be kept to a minimum. Actually, after completing the preliminary design of the CO2 Capture Plant the co�produced steam from the HPU (52te/h) falls slightly short of that required by the regenerator in the CO2 Capture Unit (55te/h).
The net effect is that there would be no HP steam export and the overall steam balance is slightly in deficit. Unfortunately utilising auxiliary fuel firing to increase the export steam to the CCP would also increase the amount of flue gas produced and the CO2 produced.
This issue will be resolved by development of a more detailed and rigorously integrated design based on proprietary data from the selected licensor for the CO2 capture unit.
Since all of the co�produced steam is utilised by the CO2 Capture Plant, the condensate treatment system in the HPU will need to be uprated to be able to treat the steam condensate returned by the CO2 Capture Plant. However, since all of this condensate is returned, and no steam is exported, the make up demand will also be much reduced. The net effect on the BFW treatment system has not been considered in detail at this stage.
Cooling Water
A very large flow of cooling water is required to supply the Carbon Capture plant. Where this cannot be supplied using heat integration within or between the process units, cooling water is required.
The estimated cooling water demand of the new plant is approximately 48.9 MW, which corresponds to 4,127 te/h of cooling water. This is almost 10 times the capacity of the existing cooling tower package at the existing HPU. This cooling water is supplied as fresh cooling water from a new twin�cell evaporative cooling tower, cooling water pumps and a side�stream filter package.
The new cooling tower is expected to require a blowdown of 16 te/h, and a make�up of 112 te/h of fresh water to account for drift and evaporative losses.
MEA Storage
Facilities are also required for storage and make�up of the MEA based solvent to the Carbon Capture Unit. Reuse and treatment of the numerous, mainly small, water streams produced from the cooling of water saturated gas streams are integrated with the units where possible.
BOC HPU CCS STUDY REPORT
28603�8111�RP�001 PAGE 16 OF 49 REV O2
Revision: O2 Date: Nov 2014
Waste Water Tank
Cooling tower blowdown, process condensates and purge streams containing contaminants such as MEA are routed to third party waste water treatment via a buffer tank to allow for monitoring.
Make1up Water
Additional make�up water is required to compensate for blowdown and drift losses from the new Cooling Water system. This is estimated at around 118 te/h and would require a 6”NB supply. As the existing Gately water supply is only 2”NB, a new feed line will be required from the Gately water supply header. For the purpose of the estimate a 250m supply line has been allowed.
3.2.1 General Considerations
For a given flue gas composition and operating parameters, as the plant capacity is increased, the consumption of utilities and chemicals increases approximately linearly with the mass of CO2 captured.
Generally speaking there are specific economies of scale to be gained from deploying larger scale plant, such as capital cost savings and plot area reduction. Typically capital cost is a function of the total CO2 captured, and indeed other studies have shown that the cost per tonne of capturing CO2 decreases with increasing CO2 capture rate, but this is far from being the only factor which affects the CAPEX.
The total capital cost of the post�combustion CO2 Capture Plant also varies with the concentration of CO2 in the flue gas feed. A low concentration of CO2 in the flue gas results in the need for a larger quench, blower and absorber, all of which are significant items in the capital cost.
CO2 Compression
Also, while economies of scale can be realised by using a single machine to compress all of the CO2 from the capture unit, in some circumstances opting for 2 x 50% machines arrangement might be preferable, such as where high turndown is a frequent occurrence. Inter�stage cooling on the CO2 compressor should take place at as low a temperature as possible to minimise power consumption and to minimise the cost of the machine.
Flue Gas Duct Pressure
Pressure control in the flue gas duct needs careful consideration to ensure no fresh air is drawn into the flue gas duct via the existing stack. Also, pressure control of the Reformer fire box is particularly important. High�high pressure in the fire box initiates a whole plant emergency shutdown (typically a SIL2 trip).
Tie�in to the Hydrogen Plant, the flue gas duct in particular, needs to be aligned with major plant turnarounds to reduce any impact on existing operations and supply contracts.
BOC HPU CCS STUDY REPORT
28603�8111�RP�001 PAGE 17 OF 49 REV O2
Revision: O2 Date: Nov 2014
Water Treatment
It has been assumed that waste water from the CO2 Capture Plant can be routed to the Bran Sands ETP along with the waste water stream from the Hydrogen Plant and an allowance for this has been included in our economic assessment.
Relief & Blowdown
The Hydrogen Plant does not require and does not have a flare system. All vent points and relief valves discharge to a dedicated high level vent pipe which runs alongside the high level flue stack. The CO2 Capture Plant similarly does not require access to a flare system. Relief valves on the HP steam let�down system would discharge to atmosphere at a safe location. The CO2 Capture Plant operates at very low pressure and the pressures systems can be designed to avoid non�routine discharges to atmosphere.
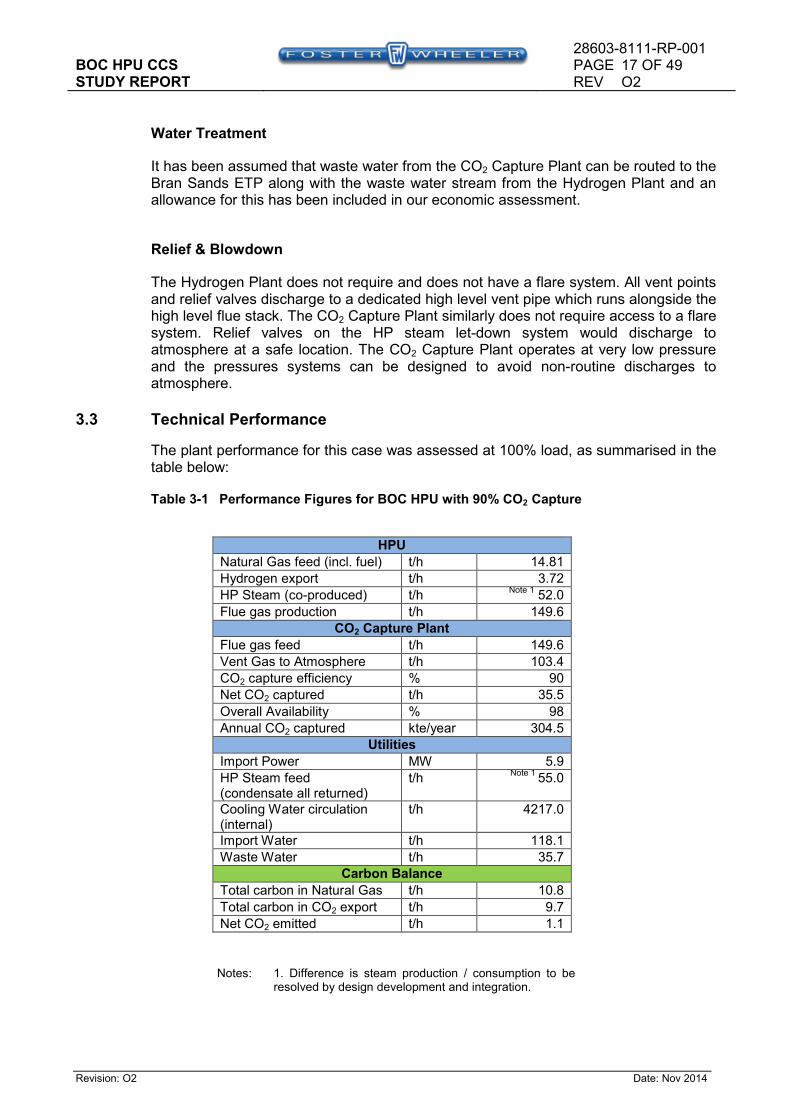
3.3 Technical Performance
The plant performance for this case was assessed at 100% load, as summarised in the table below:
Table 311 Performance Figures for BOC HPU with 90% CO2 Capture
HPU
Natural Gas feed (incl. fuel) t/h 14.81
Hydrogen export t/h 3.72
HP Steam (co�produced) t/h Note 1
52.0
Flue gas production t/h 149.6
CO2 Capture Plant
Flue gas feed t/h 149.6
Vent Gas to Atmosphere t/h 103.4
CO2 capture efficiency % 90
Net CO2 captured t/h 35.5
Overall Availability % 98
Annual CO2 captured kte/year 304.5
Utilities
Import Power MW 5.9
HP Steam feed (condensate all returned)
t/h Note 1
55.0
Cooling Water circulation (internal)
t/h 4217.0
Import Water t/h 118.1
Waste Water t/h 35.7
Carbon Balance
Total carbon in Natural Gas t/h 10.8
Total carbon in CO2 export t/h 9.7
Net CO2 emitted t/h 1.1
Notes: 1. Difference is steam production / consumption to be resolved by design development and integration.
BOC HPU CCS STUDY REPORT
28603�8111�RP�001 PAGE 18 OF 49 REV O2
Revision: O2 Date: Nov 2014
Our preliminary design is based on a standard CO2 capture efficiency of 90% which gives hourly CO2 capture rate of 35.5 te/h. However, the overall annual capture rate depends on overall plant availability i.e. the proportion of time that the CO2 Capture Plant is on line whilst the HPU is running. A preliminary availability of 98% has been assumed which gives an annual CO2 capture rate of 304,460 te/year.
Note that power generated offsite and imported into the facility will create its own carbon footprint. The impact of that carbon footprint has not been considered in this study, but may have an effect on the emissions mitigation credits that the scheme can receive.
3.4 Plot Plan & Plant Layout
3.4.1 Plot Plan
Attachment 4 includes a preliminary plot plan showing the extent and arrangement of the new facilities for the CO2 Capture Plant, and the modifications to the Hydrogen Plant and associated services and utilities.
The original plot identified by BOC as the location of the CO2 Capture Plant was the open area of ground enclosed by the existing access road. Unfortunately this area been found to be too small to accommodate everything required. Although the main CO2 Capture Plant can be accommodated here, additional land is required.
A number of auxiliary items such as the new Cooling Tower Package, the MEA Storage Tank, Waste Water Buffer Tank and a new substation have needed to be located on separate areas to the west of the HPU, adjacent to the redundant Cumene plant control room. As a consequence a pipe bridge across the existing service road is also required.
One of the main considerations in developing the plot plan is the flammability or toxicity of the process fluids contained with the process. In the CO2 Capture plant the only hydrocarbon that is present in significant quantities is the MEA. Pure MEA has a flashpoint of 96°C. The highest risk is in the Regenerator Reboiler where the temperature is 115°C. But even here the MEA is a 30 wt% solution in water and is therefore not considered flammable. To provide inherent safety the MEA Regenerator Column and Reboilers are located furthest away from the existing control room and transformers.
Pure MEA has a freezing point of +10°C and will therefore most likely be delivered as Low Freezing Grade (LFG) which is an 85 wt% MEA solution in water having a freezing point of �13°C. Stored at ambient temperature, MEA would not be considered to be flammable and electrical equipment would be classified accordingly.
BOC HPU CCS STUDY REPORT
28603�8111�RP�001 PAGE 19 OF 49 REV O2
Revision: O2 Date: Nov 2014
3.4.2 Plant Layout Considerations
The CO2 Capture Plant itself consists of the CO2 Capture Unit, Compression and Dehydration plant. Within the CO2 Capture Plant the main layout considerations are as follows:
Flue Gas Blower
The break�in to the large duct on the discharge side of the existing Induced Draft Fan (B�101) will require structural steel and the Flue Gas Blower (BL�201) has therefore been located as close as possible to this break�in.
Actually, there are two possible positions for flue gas blower; before or after the Direct Contactor Cooler (C�201). In our proposed scheme the Flue Gas Blower (BL�201) is upstream of C�201 and would be essentially a carbon steel machine, sized to accommodate the high volume of the high temperature flue gas from the HPU. The control of BL�201 and the existing Induced Draft Fan (B�101) would require careful consideration. At present BL�201 is specified as a fixed speed machine but it may be necessary to use a variable speed drive to provide adequate control. This requires further review. As the absorbed power of BL�201 is around 1.1MW � a variable speed drive on BL�201 would require significant changes and would add significant cost to the new electrical supply infrastructure.
Alternatively, the Flue Gas Blower could be installed downstream of the DCC. At this location although the actual volume flow would be reduced but as the suction side would be at water dewpoint the materials of construction would need to be significantly upgraded which would increase cost. The same considerations with regard to control would still apply. Further review is required to determine the optimum blower arrangement.
Direct Contact Cooler and CO2 Absorber
The Direct Contactor Cooler (C�201) and the Absorber (C�202) have been positioned in close proximity to reduce duct length and the requirement for structural steel between these columns. This configuration minimises initial capital cost in this area associated with stainless steel ducting and structural work.
Regenerator Column
The Regenerator Reboilers E�209A&B are conventionally located alongside the Regenerator Column (C203). The reboilers are supplied with steam direct from the HPU. The co�produced superheated HP steam is supplied to the Carbon Capture Plant from the main pipe rack and is let down to LP level within the CCP.
CO2 Compressor & Regenerator
The inlet suction volume flow and power requirement of the CO2 compressor is particularly sensitive to the inlet pressure of the first and second stage. K�201 has been located close to the Regenerator Column to minimise power consumption.
CO2 Dehydration Unit
Owing to the interconnecting streams between these units the CO2 Dehydration Package is located close to CO2 compressor in order to minimise pressure drop and hence the overall compression power.
BOC HPU CCS STUDY REPORT
28603�8111�RP�001 PAGE 20 OF 49 REV O2
Revision: O2 Date: Nov 2014
3.5 Total Installed Cost (TIC)
3.5.1 Estimating Methodology
A capital cost estimate has been developed at a pre�feasibility level of accuracy (typically +/�30% on total installed cost). Equipment costs have been estimated based on sized equipment lists, using Foster Wheeler’s in�house indexed version of AspenTech Capital Cost Estimator (ACCE) software, which is benchmarked against the latest market information available.
Equipment costs have then been developed from the sized Equipment List (Attachment 2) using a combination of factors and in�house knowledge gained on similar projects to provide Total Installed Costs.
The estimates represent the base cost for the engineering, procurement and construction of the work. The estimates exclude any land acquisition costs, initial site remediation, demolition or development. It has been assumed that the site is clear and level and hence all necessary earthworks are excluded from the estimate scope.
Estimate Scope
The estimate has been based on instantaneous cost levels for 4Q2014 and summarised in GBP. The estimate, together with the exclusions stated, represents Foster Wheeler’s view of the installed cost of the project based upon the scope of works outlined within this report.
Work Breakdown Structure
The following Work Breakdown Structure (WBS) has been used:
• Unit 100 – Existing HPU
• Unit 200 � CO2 Capture Unit
• Unit 300 – CO2 Compression & Dehydration
• Unit 400 – Cooling Water
• Unit 500 – Other Utilities & Tie�ins
Estimate Breakdown Structure
The estimate has been broken down into the following Estimate Breakdown Structure (EBS):
• Direct Materials
• Material and Labour Contracts
• Labour Only Contracts
• Construction Indirects
• EPC Services
BOC HPU CCS STUDY REPORT
28603�8111�RP�001 PAGE 21 OF 49 REV O2
Revision: O2 Date: Nov 2014
The estimate summary shows the entire project cost split by EBS & WBS. No Contingency or Forward Escalation has been applied within the estimate.
General Methodology
Equipment costs were estimated using the Aspentech Capital Cost Estimator (ACCE) Version 8.4 estimating software, indexed to reflect Foster Wheeler’s view on current cost levels.
Bulk material costs and construction costs have been estimated using factors based on previous CCS studies and recent projects in Teesside. Statistics from similar projects were used as benchmarks to check and adjust the output from the ACCE models. Benchmarks have been set for cost and quantities, allowing the factors held within the ACCE models to be adjusted to suit the most likely expected out�turn cost for the project.
Other utilities & tie�ins � preliminary quantification of the electrical equipment, interconnecting pipe lines/tie�ins and site infrastructure has been included under this heading.
Construction
This includes the cost of the related labour associated with equipment placement, and the installation of bulk materials of piping, electrical and instrumentation. The construction element of the estimate is assumed to be a traditional “stick built” facility.
It also includes the construction of work elements normally procured on a design and supply basis such as tankage, civils, steelwork, buildings and protective cover.
The construction and location labour costs were based on all�inclusive local construction rates as follows.
• Labour Rate used: GB £60.0/manhr
The local construction rate includes all direct and indirect costs including profit. These all�inclusive rates were derived from Foster Wheeler current knowledge of the region.
Indirect Costs
EPC Engineering
This cost element includes the various engineering and support activities needed to design and procure the project that would normally be incurred by the Engineering, Procurement & Construction (EPC) contractor.
The estimates allow for EPC project management, detailed engineering, procurement, interfacing with licensors and package vendors, and home office construction management, and are based on typical factors based on in�house experience.
EPC Construction Management
The EPC contractor’s construction management team has been based on a statistical average for this type of project. Is has been assumed that most of Field Supervision personnel would be local.
BOC HPU CCS STUDY REPORT
28603�8111�RP�001 PAGE 22 OF 49 REV O2
Revision: O2 Date: Nov 2014
Temporary Facilities
An allowance has been made for EPC Contractor’s Temporary Facilities based on in�house experience.
Other
Factored allowances have also been made for vendors engineers and heavy lifts based on in�house experience.
Licensor Proprietary Costs
Without any enhancements MEA units are considered to be open art and for the purpose of this study Amec Foster Wheeler have prepared the preliminary design. However, it is likely that the MEA unit would ultimately be provided by a licensor specialising in these units. Although such units will have enhanced performance they will attract a license fee. At this stage all the license fees have been excluded from the estimate. Licensor selection typically forms part of the pre�FEED work.
Accuracy
The anticipated overall accuracy of the estimate is ± 30% accuracy.
Exclusions
• Owner’s Costs
• Land Costs
• Financing
• Pre�sanction Costs
• VAT
• Taxes & Duties
• Process Development
• Disinvestment of existing facilities (if applicable)
• Removal or Dealing with Contaminated Soil / Asbestos
• ‘Wayleave’ charges (if applicable)
• Commissioning
• Obstructions and Archaeological Investigations
• Changes to existing waste water system
• Future Escalation
• Contingency
• Licensor Costs
• Insurances
• Infrastructure upgrade outside of the battery limits.
• Statutory authority and utility company costs
BOC HPU CCS STUDY REPORT
28603�8111�RP�001 PAGE 23 OF 49 REV O2
Revision: O2 Date: Nov 2014
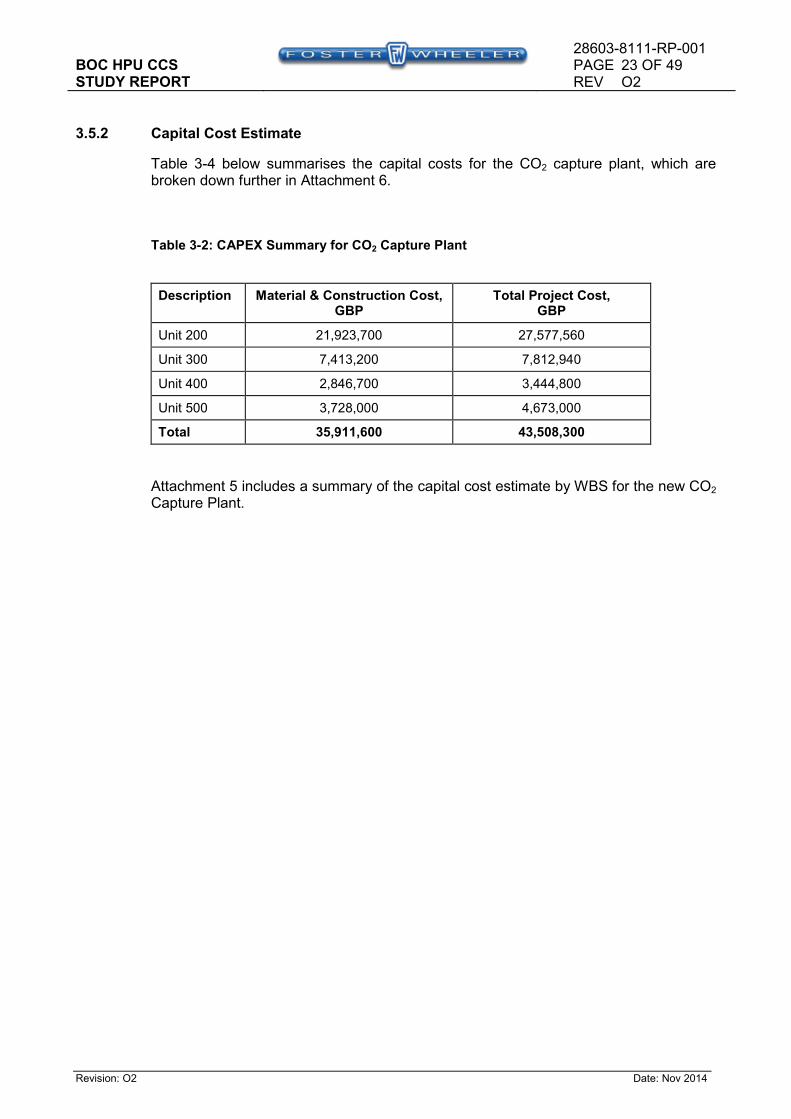
3.5.2 Capital Cost Estimate
Table 3�4 below summarises the capital costs for the CO2 capture plant, which are broken down further in Attachment 6.
Table 312: CAPEX Summary for CO2 Capture Plant
Description Material & Construction Cost, GBP
Total Project Cost, GBP
Unit 200 21,923,700 27,577,560
Unit 300 7,413,200 7,812,940
Unit 400 2,846,700 3,444,800
Unit 500 3,728,000 4,673,000
Total 35,911,600 43,508,300
Attachment 5 includes a summary of the capital cost estimate by WBS for the new CO2 Capture Plant.
BOC HPU CCS STUDY REPORT
28603�8111�RP�001 PAGE 24 OF 49 REV O2
Revision: O2 Date: Nov 2014
3.6 Estimate of Operating Costs
Operating and Maintenance (O&M) costs are generally allocated as either fixed or variable costs. This section summarises the basis used and assumptions made in our estimate of O&M costs.
3.6.1 Fixed costs
The fixed costs mainly include the following:
• Direct labour
• Administrative and general overheads
• Maintenance
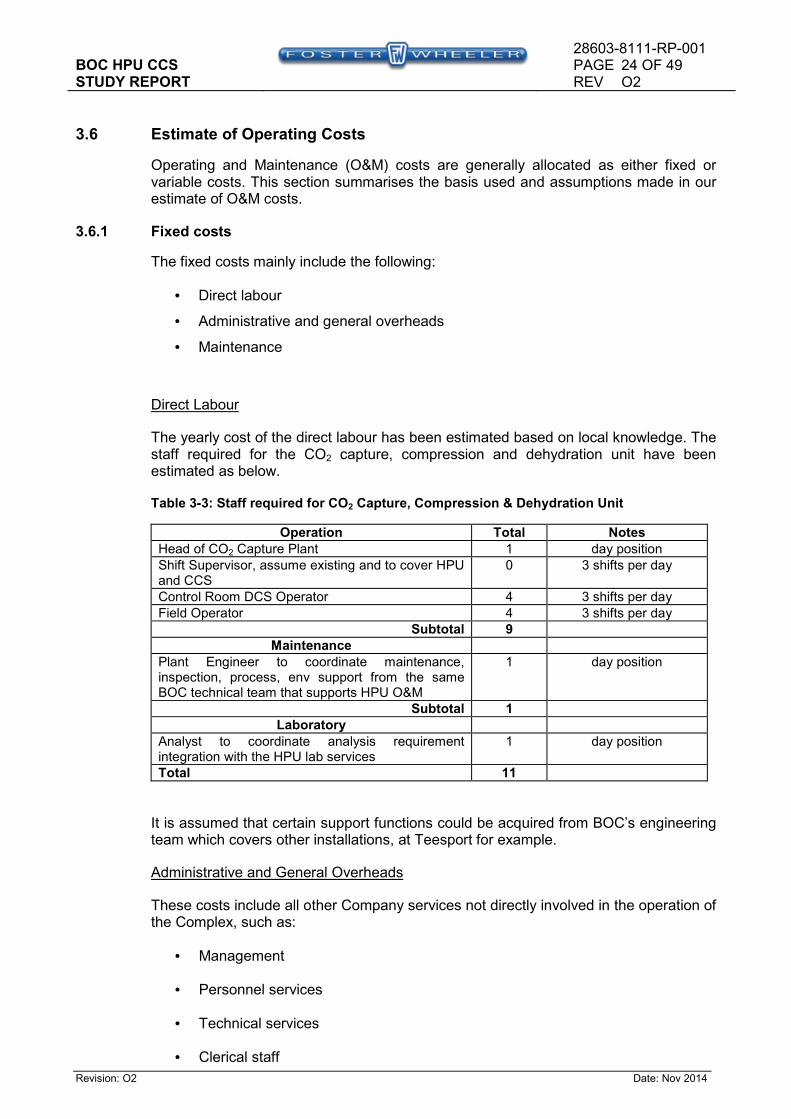
Direct Labour
The yearly cost of the direct labour has been estimated based on local knowledge. The staff required for the CO2 capture, compression and dehydration unit have been estimated as below.
Table 313: Staff required for CO2 Capture, Compression & Dehydration Unit
Operation Total Notes
Head of CO2 Capture Plant 1 day position
Shift Supervisor, assume existing and to cover HPU and CCS
0 3 shifts per day
Control Room DCS Operator 4 3 shifts per day
Field Operator 4 3 shifts per day
Subtotal 9
Maintenance
Plant Engineer to coordinate maintenance, inspection, process, env support from the same BOC technical team that supports HPU O&M
1 day position
Subtotal 1
Laboratory
Analyst to coordinate analysis requirement integration with the HPU lab services
1 day position
Total 11
It is assumed that certain support functions could be acquired from BOC’s engineering team which covers other installations, at Teesport for example.
Administrative and General Overheads
These costs include all other Company services not directly involved in the operation of the Complex, such as:
• Management
• Personnel services
• Technical services
• Clerical staff
BOC HPU CCS STUDY REPORT
28603�8111�RP�001 PAGE 25 OF 49 REV O2
Revision: O2 Date: Nov 2014
These services vary widely from company to company and are also dependent on the type and complexity of the operation.
An amount equal to 30% of the direct labour cost has been used to account for administrative and general overhead costs. This is typical for a new build on a greenfield site and could possibly be reduced to account for support services already in place to cover the HPU and other BOC assets in the region.
Maintenance
The annual maintenance cost of the carbon capture plant is typically 3% of the CAPEX, depending on site specific factors.
3.6.2 Variable costs
The variable costs include the consumption of feedstocks and fuels, catalysts, chemicals and solvents. These costs are annual, based on the expected equivalent availability of the plant. The variable costs mainly include the following:
• Flue gas feedstock assumed to be zero cost,
• Fuel
• Electricity,
• Water,
• Waste water disposal
• Solvent, chemicals and adsorbents.
Fuel
The CO2 Capture Plant does not require fuel gas. All the process heating is provided by the HP steam exported by the Hydrogen Plant.
Steam
In the preliminary design the steam demand of the CO2 Capture is entirely met by the co�produced steam from the Hydrogen Plant. Since there is no requirement to use auxiliary fuel firing to increase steam production, the HP steam export to the CO2 Capture Plant has been assumed to be zero cost.
Electricity
It is assumed that import power will be supplied to the carbon capture unit from over the fence. The cost assumed for power supply over the fence in 2014 is £75/MWh.
Make�up Water
It is assumed that Gately water, supplied by Northumbrian Water will be supplied to the CO2 Capture Plant to meet all requirements.
The cost assumed for water supply over the fence in 2014 is taken as £0.2/te.
BOC HPU CCS STUDY REPORT
28603�8111�RP�001 PAGE 26 OF 49 REV O2
Revision: O2 Date: Nov 2014
Waste Water
It is assumed that waste water will be discharged from the CO2 Capture Plant will be routed along with the waste water from the Hydrogen Plant to Bran Sands.
The cost assumed for waste water discharge in 2014 is taken as £1.5/te.
Solvent, Chemicals and Adsorbents
There will be some operating costs associated with replacement and disposal of solvent used in the capture plant, chemicals and filter media required for capture plant and cooling tower operation, and co2 dryer package adsorbent. As these depend on the selected licensors and equipment suppliers, these have not been quantified at this stage.
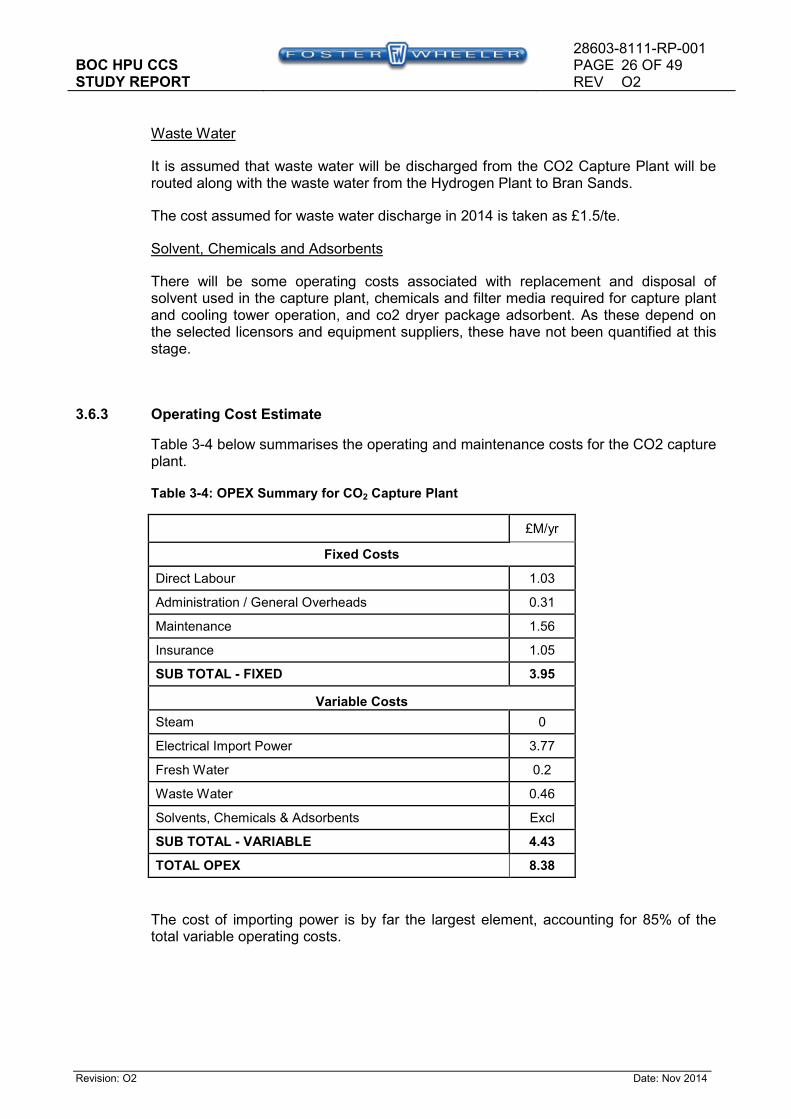
3.6.3 Operating Cost Estimate
Table 3�4 below summarises the operating and maintenance costs for the CO2 capture plant.
Table 314: OPEX Summary for CO2 Capture Plant
£M/yr
Fixed Costs
Direct Labour 1.03
Administration / General Overheads 0.31
Maintenance 1.56
Insurance 1.05
SUB TOTAL 1 FIXED 3.95
Variable Costs
Steam 0
Electrical Import Power 3.77
Fresh Water 0.2
Waste Water 0.46
Solvents, Chemicals & Adsorbents Excl
SUB TOTAL 1 VARIABLE 4.43
TOTAL OPEX 8.38
The cost of importing power is by far the largest element, accounting for 85% of the total variable operating costs.
BOC HPU CCS STUDY REPORT
28603�8111�RP�001 PAGE 27 OF 49 REV O2
Revision: O2 Date: Nov 2014
3.7 Projected Execution Strategy
3.7.1 Project Schedule
A projected level 1 schedule for the Carbon Capture Plant is included in Attachment 7. This summarises whole project execution from appointment of Pre�FEED (Front End Engineering Design) contractor through to RFSU (Ready for Start Up). The schedule commences at month 1 with the appointment of Pre�FEED contractor.
The schedule only considers the CO2 Capture Plant within the ICCS scheme. The CO2 collection network and booster compression systems are excluded.
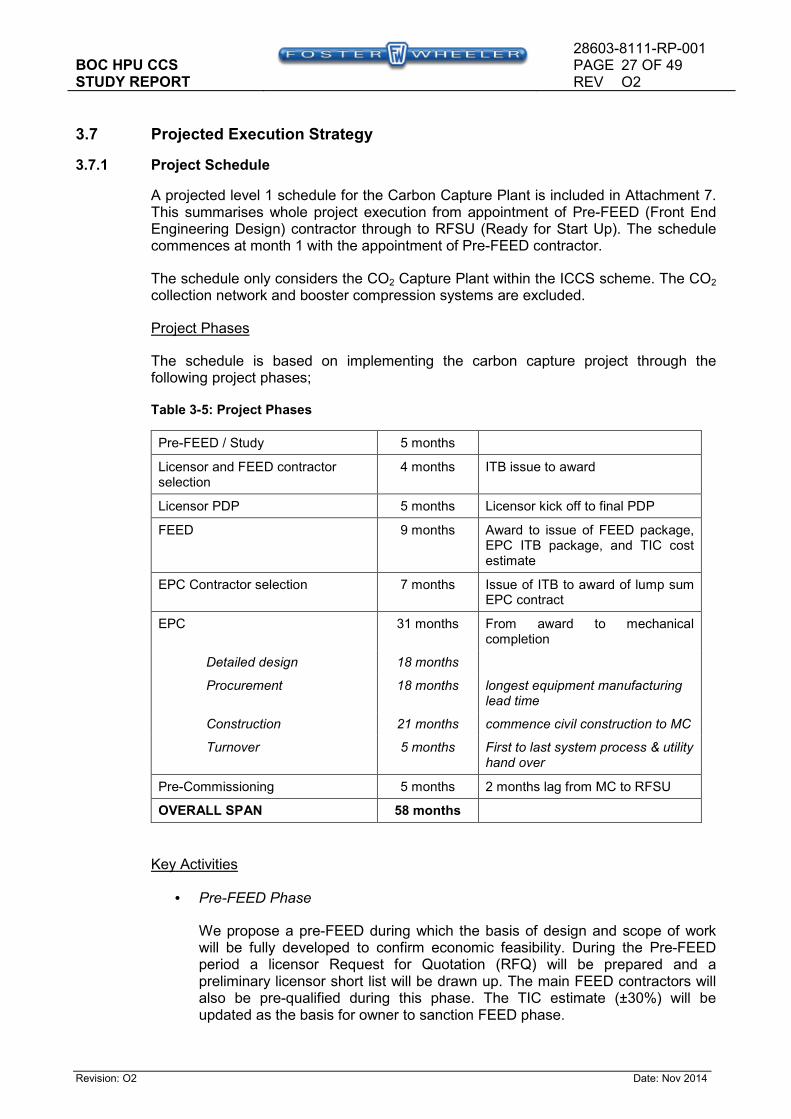
Project Phases
The schedule is based on implementing the carbon capture project through the following project phases;
Table 315: Project Phases
Pre�FEED / Study 5 months
Licensor and FEED contractor selection
4 months ITB issue to award
Licensor PDP 5 months Licensor kick off to final PDP
FEED 9 months Award to issue of FEED package, EPC ITB package, and TIC cost estimate
EPC Contractor selection 7 months Issue of ITB to award of lump sum EPC contract
EPC 31 months From award to mechanical completion
Detailed design 18 months
Procurement 18 months longest equipment manufacturing lead time
Construction 21 months commence civil construction to MC
Turnover 5 months First to last system process & utility hand over
Pre�Commissioning 5 months 2 months lag from MC to RFSU
OVERALL SPAN 58 months
Key Activities
• Pre$FEED Phase
We propose a pre�FEED during which the basis of design and scope of work will be fully developed to confirm economic feasibility. During the Pre�FEED period a licensor Request for Quotation (RFQ) will be prepared and a preliminary licensor short list will be drawn up. The main FEED contractors will also be pre�qualified during this phase. The TIC estimate (±30%) will be updated as the basis for owner to sanction FEED phase.
BOC HPU CCS STUDY REPORT
28603�8111�RP�001 PAGE 28 OF 49 REV O2
Revision: O2 Date: Nov 2014
• Appointment of Licensor and FEED Contractor
The schedule assumes that the licensor has not been pre�selected, and that the licensor and FEED contractor are independent of one another. A four month period is indicated from the issue of licensor enquiry, for licensors to prepare responses, be evaluated, to then conclude negotiation of the licensor agreement.
The ITB package for the appointment of a FEED contractor is issued in parallel with the licensor enquiry. A four month period is assumed from issue of ITB to award of FEED. This allows approximately 6 to 8 weeks for bid preparation, 4 to 6 weeks evaluation, and 4 weeks for final commercial evaluation and approval.
The schedule reflects a reimbursable FEED contract. The FEED may be let on a lump sum basis, in which case the bid preparation period would need to be extended.
• Licensor PDP (Process Design Package), and FEED Package Preparation
Kick off with the licensor is held until the FEED contract is awarded, so that the FEED contractor can participate in the licensor kick off meeting. Preparation of the licensor PDP and overall FEED package then progress in parallel with intermediate release of licensor design deliverables to the FEED contractor. A five month period is assumed for preparation of the licensor PDP, and a nine month period is allowed for the FEED. This allows a four month lag to finalise the engineering package and cost estimate after issue of the final PDP. At the end of FEED a technical design specification, EPC ITB package and TIC cost estimate (target accuracy+/�10%) are issued.
During the FEED phase consideration should be given to the procurement of the Long Lead Items (LLIs) such as the CO2 Compressor, which may jeopardise the project schedule. The Contractor should conduct market surveys in order to determine a list of LLIs and propose possible solutions to the Client for their acceptance.
• EPC Contract
One month lag is allowed between the issue of the FEED package release of the EPC ITB package. This period allows for owner’s review of the FEED package.
It is assumed that the scope is let as a single lump sum EPC package. A seven month period is allowed for EPC contracting from ITB issue to EPC contract award. This allows approximately 14 to 16 weeks lump sum bid preparation, 8 weeks bid evaluation, and 6 weeks final negotiation and owner approvals.
The bid preparation time allowed assumes that the EPC contractors are provided with a comprehensive FEED package providing a sound basis for developing lump sum pricing.
BOC HPU CCS STUDY REPORT
28603�8111�RP�001 PAGE 29 OF 49 REV O2
Revision: O2 Date: Nov 2014
• Project Sanction
It is assumed that the project is sanctioned in three phases:
o Initial budget release to conduct pre�FEED, engage the licensor and appoint the FEED contractor;
o Sanctioning to prepare a FEED and progress EPC contract
o Full sanction of the EPC project execution.
Time is allowed within the respective contracting spans for owner approvals of the award recommendations for the FEED and EPC contracts. It is assumed that budget is allocated to the project in advance of this, based on the Pre�FEED and FEED TIC cost estimates. Therefore project finance and sanctioning is in place so as not to impact the overall schedule critical path.
• EPC Contract Execution
An indicative EPC span from contract award to MC (mechanical completion) in the range of thirty�one months is indicated. The EPC execution includes detailed design, procurement, subcontracting, fabrication, construction, and systems turnover.
The EPC span is determined by the lead time for the CO2 compressor package, which is assumed to be purchased by the EPC contractor within one month of award of the EPC contract. Our current knowledge is that the delivery period for the CO2 Compressor is in the region of 16 – 20 months.
The EPC contractor will develop the equipment purchase order as part of their lump sum bid preparation, and will revalidate the purchase order upon award of the EPC contract. A manufacturing lead time of 18 months is shown, based on budget enquiry responses from relevant vendors. A six week period is allowed for shipping equipment to site.
Lead times for other equipment items (e.g. tower, drums, exchangers, tanks, pumps, dehydration package) are typically in the region of 12 to 14 months and these are purchased progressively such that equipment arrives on site at the same time or before the compressors. A construction installation sequence would be developed to allow equipment installation to progress prior to the compressor arriving on site.
During the EPC phase the owner project team is assumed to be fully resourced, empowered, and resident in the EPC contractors’ office during detailed design to ensure that; engineering deliverables are reviewed expediently as the design develops.
• Commissioning and Start Up:
An indicative two month span is scheduled between MC and RFSU for finishing commissioning activities, based on a phased handover of systems.
BOC HPU CCS STUDY REPORT
28603�8111�RP�001 PAGE 30 OF 49 REV O2
Revision: O2 Date: Nov 2014
Schedule Summary and Recommendations
An overall span of 58 months is indicated, from commencing pre�FEED to achieving RFSU. Based on a high level assessment, this overall schedule span is considered to represent a realistic and achievable schedule, considering logical development of a specific project through sequential project phases, albeit a preliminary view based on feasibility study project definition.
4. ASSESSMENT OF CAPTURE AND TECHNOLOGY OPTIONS
In the Hydrogen Production Unit (HPU) approximately 55% of the total CO2 produced is contained in the Reformer syngas (and then in the PSA tail gas), while the remaining 45% is the product of the combustion of the additional natural gas required by the steam reformer. Eventually, all the CO2 ends up in the flue gas of the reformer heater.
As outlined in Section 2.1, the CO2 could be captured from any of following three streams:
1. Steam reformer flue gas
2. PSA tail gas
3. PSA feed syngas
Removal efficiency of about 90% can be achieved from reformer flue gas and from PSA tails gas, and more than 99% can be achieved from raw H2 at higher pressure. It is also possible, in principle, to combine CO2 removal option 3, with 1 (from flue gas), and obtain an overall removal efficiency of about 94 and 96% respectively.
There are several and different available technologies for CO2 removal, at different stage of development and commercialisation.
4.1.1 Carbon Capture from Steam Reformer Flue Gas
The CO2 present in the steam reformer flue gas has a very low partial pressure (about 0.2 bara) and the flue gas actual volumetric flow is approximately 60 times more than the PSA feed syngas volumetric flow (m3/h). These two factors and the presence in the flue gas of components like oxygen, sulphur, NOx, makes the CO2 removal from this stream generally more complicated and expensive. Nevertheless the amount of CO2 in this steam is highest.
For this study, CO2 capture from reformer flue gas has been considered as the base case with 90% capture efficiency achieved using an amine solvent.
There are several technology providers using different chemical solvents available which are suitable for post combustion CO2 capture. Listed below are the main technologies for post combustion capture:
• Amines (MEA, MDEA, “hindered” amines);
• Chilled ammonia;
• Amino acid;
BOC HPU CCS STUDY REPORT
28603�8111�RP�001 PAGE 31 OF 49 REV O2
Revision: O2 Date: Nov 2014
Carbon capture from the flue gas has an advantage compared to capturing from the tail gas or PSA feed gas as no pre�investment is needed in case of retrofit of a traditional plant. However additional ducting and ID fan addition/replacement shall be considered when the capture unit is added to the HPU.
There are several licensors active in the post combustion carbon capture technologies, including MHI, Fluor, Shell, Aker and Alstom. The most common post combustion carbon capture solvents are amines, amino acid salts and ammonia based solvents.
The most common equipment configuration for post combustion carbon capture is CO2 absorption in an absorption column, followed by solvent regeneration in a regeneration column. The majority of the technologies discussed adopt this configuration; however solvents and process conditions employed vary between technology suppliers.
Within this section, an overview of a range of post combustion carbon capture technologies is provided.
4.1.1.1 Amine Based Solvents
Amine based solvents are the most common solvents used in post combustion CO2 capture. Details of the main commercially available proprietary amine technology providers are given in the following sections.
MHI KS11TM Hindered Amine Process
The MHI flue gas CO2 capture process, “KM CDR Process®” (Kansai Mitsubishi Carbon Dioxide Recovery Process) has been co�developed by MHI and Kansai Electric Power Company (KEPCO) since 1990. The process utilizes the proprietary KS�1 trademark solvent which is based on advanced hindered amine technologies. MHI’s carbon capture process consists of three main sections; flue gas cooling, CO2 absorption and solvent regeneration.
MHI’s technology is well established with many commercial plants using this technology, capturing CO2 from both power generation and other sources. Based on the numerous commercial plant experiences capturing CO2 from natural gas flue gas streams, MHI now offers large scale commercial single train CO2 recovery plants. In addition MHI are currently developing even higher efficiency solvents such as KS�2TM and KS�3TM which claim to have lower regeneration energies and lower levels of solvent degradation. MHI are also developing new and improved processes which are to be applied to future plants.
Fluor Econamine FG Plus Process
Econamine FG Plus is an amine�based post�combustion CO2 capture technology. The proprietary solvent is primarily composed of 30�35 wt% MEA solution, with the addition of an activator and a corrosion inhibitor. The traditional absorber/ stripper configuration is employed with some key alterations intended to reduce the energy requirement of the process. For example, Fluor uses a split configuration in which two parallel solvent regeneration schemes are utilised: flash regeneration and steam stripping.
Fluor has more than 20 years of experience capturing CO2 from flue gas, mainly for use in the food industry. The Fluor process has been demonstrated on flue gas from a combined cycle power plant on a large scale since 1991 and on a pilot plant scale on
BOC HPU CCS STUDY REPORT
28603�8111�RP�001 PAGE 32 OF 49 REV O2
Revision: O2 Date: Nov 2014
flue gas from a coal fired power station since 1997. Several new large scale demonstration plants are currently in the design and construction phase and due for start�up over the next few years.
BASF, Linde & RWE aMDEA
BASF, Linde and RWE have formed an alliance to develop CO2 scrubbing technology using a proprietary solvent, aMDEA, which claims to use 20% less energy than other chemical solvents and features better stability in the presence of oxygen.
The aMDEA solvent developed by BASF is employed in the carbon capture technology developed and optimized by Linde. The use of the jointly developed CO2 scrubbing technology will allow power plants to capture 90% of CO2 of the flue gas.
Shell Cansolv Process
Cansolv, now owned by Shell Global Solutions, has developed both a CO2 capture unit and an integrated CO2 capture and SOx removal unit. The benefit of the integrated plant is a reduction in plot space requirement and a net reduction in energy requirement as waste heat from the SOx removal section can be utilised in the CO2 capture section.
Cansolv Absorbent DC 101, a patented amine solvent, is employed for the Cansolv CO2 Capture System which is a traditional CO2 absorption/regeneration process.
The Boundary Dam project, the world's first commercial�scale carbon capture and storage process on a coal�fired power plant, uses Shell’s Consolv technology for 90% CO2 capture. The project began operation in October 2014.
Aker Clean Carbon “Just Catch”
Aker Kvearner and Aker Clean Carbon have been developing carbon capture technology for more than 15 years. The “Just Catch” scheme aims to test improved solvents and process innovations, although the exact solvent and process configuration is not clear.
4.1.1.2 Ammonia Based Solvents
Two developing ammonia based CO2 capture processes are described in this section. These are provided by Alstom Power and Powerspan.
Alstom Chilled Ammonia Process (CAP)
The Chilled Ammonia Process (CAP) is a proprietary technology developed by Alstom which uses Ammonia, a globally available low cost commodity chemical, as solvent. CAP technology is a chemical absorption process. The flue gas is contacted with chilled ammonia which reacts with the CO2. Raising the temperature reverses the above reaction releasing CO2 and allowing the solvent to be recycled.
BOC HPU CCS STUDY REPORT
28603�8111�RP�001 PAGE 33 OF 49 REV O2
Revision: O2 Date: Nov 2014
Alstom carried field validation tests which have successfully demonstrated > 99.9% pure CO2 product quality at 90% capture rates. The CAP technology is an environmentally benign process in terms of emissions and generates Ammonium Sulphate as by�product that could be sold as fertilizer. The carbon capture facility built by Alstom at the Technology Center Mongstad (TCM) is based on Alstom’s Chilled Ammonia Process (CAP) with a CO2 capture capacity 82,000 metric tons per year.
Powerspan ECO2 Process
Powerspan offer a similar proprietary ammonia based CO2 capture process known as ECO2. This is of the same configuration as the Alstom chilled ammonia process, however, it does not include the initial cooling stage.
The ECO2 process is designed to follow flue gas desulphurisation (FGD). Flue gas from FGD is fed to the ECO2 absorption column at 52°C where around 90% CO2 is absorbed into the ammonia based solvent. The solvent is stripped of CO2 in the regenerator. Lean solvent leaving the bottom of the regenerator is returned to the absorber for re�use and concentrated CO2 leaving the top of the regenerator is dried and compressed for sequestration.
Powerspan tested its ECO2 process at its one megawatt pilot facility near Shadyside, Ohio from December 2008 through to 2010. The pilot testing demonstrated the advantages of the ECO2 technology result in lower costs, less waste, and a simpler system to operate and maintain.
4.1.1.3 Amino Acid Based Solvents
Siemens PostCap Amino Acid Salt Process
The Siemens PostCapTM process employs an amino acid salt solution to capture CO2 from flue gas in an absorption and regeneration configuration.
The benefits of the amino acid salt include its relatively low cost, stability, low environmental impact, low solvent degradation and low regeneration energy (approximately 35% lower than MEA). The Siemens PostCapTM process is currently only suitable for use with flue gas from coal fired power stations; however, Siemens are currently working with Norwegian utility company Statkraft to develop the solvent for use in combined cycle gas plants. The Siemens PostCapTM process has been demonstrated on a pilot plant scale. Siemens executed several engineering studies and FEED based on the experience from pilot plant operation and its knowledge in chemical and power plant engineering.
4.1.2 Carbon Capture from PSA Tail Gas
The PSA tail gas is at low pressure (typically 0.35 barg) but has a higher CO2 concentration of 44.9 mol% CO2 (wet basis). The partial pressure of CO2 is about 0.6 bara. With low overall pressure and low CO2 partial pressure, chemical solvent technology using an amine solvent is typically used as carbon capture process.
The CO2 in this stream is only that produced by the reforming reactions (21.5 te/h). Therefore for 90% capture (achievable using amine solvent), only 19.4 te/h would be
BOC HPU CCS STUDY REPORT
28603�8111�RP�001 PAGE 34 OF 49 REV O2
Revision: O2 Date: Nov 2014
recovered and the overall capture rate would therefore fall to 49%. However, the reduction in the amount of CO2 captured and the higher concentration of CO2 in the feed gas would reduce the size of the CCP equipment and associated utilities, reducing the overall cost and scale of the system. Overall this may prove a more attractive economic option.
Removing the bulk of the CO2 from the tail gas also reduces the mass flow of flue gas in the Reformer radiant and convective sections. This reduces the amount of waste heat that can be recovered in the convective section. In this option there is similarly no auxiliary fuel firing and the effect of the reduced heat recovery is that the co�produced steam will fall from 52 te/h to 40te/h. However, the steam required by the MEA unit could be expected to fall approximately in proportion to the quantity of CO2 captured so the net effect would be perhaps 10 te/h of HP steam available for export.
Also when a traditional plant is to be retrofitted like this, the steam reformer burners would have to be checked for the new tail gas composition which, being poorer in CO2, would have a higher tendency for NOx formation, with the consequence that low�NOx burners and/or space for a future installation of a de�NOx catalytic system in the convection section of the heater, may need to be considered.
4.1.3 Carbon Capture from PSA Feed Syngas
This option is similar to the one above in that it would only capture the CO2 produced by the reforming reactions. It is in effect the same CO2, just upstream of the PSA rather than downstream. However, the feed gas to the PSA unit is at high pressure, typically 21.6 barg, and although it contains only 16.6 mol% (wet), the partial pressure of CO2 is 3.75 bara.
There are several technologies available to remove CO2 from syngas at relatively high total pressure (20�30 barg) and CO2 partial pressure (3�4 bara).
The CO2 in this stream is only that produced by the reforming reactions (21.5 te/h). Therefore for a range of capture rates between 90�99%, 19.4�21.5 te/h would be recovered and the overall capture rate would therefore fall to 49�55%.
Main technologies include:
• Amines (MEA, MDEA, aMDEA);
• Hot potassium carbonate;
• Physical solvents (PEGE, Methanol);
• Membranes.
The first three categories use liquid solvents in an absorption/regeneration sequence. Amines and hot potassium carbonate are chemical solvent processes which rely on chemical reactions to remove CO2 from gas stream. The regeneration of chemical solvents is achieved by the application of heat whereas physical solvents can often be stripped of impurities by reducing the pressure without the application of heat.
Physical solvents tend to be favoured over chemical solvents when the concentration and partial pressure of acid gases is very high. Unlike chemical solvents, physical solvents are non�corrosive, requiring only carbon steel construction.
BOC HPU CCS STUDY REPORT
28603�8111�RP�001 PAGE 35 OF 49 REV O2
Revision: O2 Date: Nov 2014
In general, the economics of CO2 recovery is strongly influenced by the partial pressure of CO2 in the feed gas. At low partial pressures, physical solvents are impractical because the compression of the gas for physical absorption is expensive. However, if the gas is available at high pressure, physical solvents might be a better choice than chemical solvents.
Membranes performances are expected to be lower in terms of removal efficiency and purity.
With this retrofit option, the PSA will have some capacity margin due to the reduced inlet flow rate after CO2 removal upstream. As discussed in Section 4.1.2, due to possibility of high NOx concentration in the tail gas after bulk CO2 removal from syngas, Nox production in the burners would need to be checked.
Reduced mass flow to the Reformer also reduces the amount of waste heat that can be recovered in the convective section. This will decrease steam production rate. However, the steam required by the chemical solvent based capture unit could be expected to be less in proportion to the quantity of CO2 captured. If physical solvent based capture technology is employed, the amount of exportable HP steam could be significantly higher.
Licensors active in these technologies include:
• BASF, Linde & RWE: aMDEA chemical solvent technology (See Section 4.1.1.1)
• Giammarco�Vetrocoke: Activated Hot Potassium Carbonate solvent used for chemical absorption process
• Lurgi and Linde : Rectisol physical solvent technology
• UOP: Selexol physical solvent technology
BOC HPU CCS STUDY REPORT
28603�8111�RP�001 PAGE 36 OF 49 REV O2
Revision: O2 Date: Nov 2014
5. STUDY CONCLUSIONS & RECOMMENDATIONS
5.1 Conclusions
5.1.1 Base Case Post Combustion CO2 Capture
The base case, post combustion CO2 capture is the conventional approach and provides the highest CO2 capture efficiency. Based on 90% capture, 35,450 kg/h of CO2 is captured and exported to the collection network. However, the overall annual capture rate depends on overall plant availability i.e. the proportion of time that the CO2 Capture Plant is on line whilst the HPU is running. A preliminary availability of 98% has been assumed which gives an annual CO2 capture rate of 304,460 te/year.
The base case scheme has been shown to be feasible with an estimated total installed cost of £43.5 million, an operating cost of £8.38 million per year, and a total project schedule of 58 months.
The next step would be to carry out a full pre�FEED and licensor selection as outlined in our suggested execution strategy described in section 3.7. This should include confirming the optimum export CO2 pressure as this has a significant impact on compression unit cost and import power load / cost.
5.1.2 CO2 Capture Option 1
Options 1 & 2 capture only the CO2 produced by the reforming process as a result of the chemical reactions. The CO2 captured is 19,380 te/year, giving an overall capture efficiency of 49%.
In option 1 the CO2 Capture Plant would use a post�combustion capture solvent (such as MEA) as in the base case and would be around half of the base case capacity, pro�rated directly from the amount of CO2 removed.
The TIC for the CO2 Capture Plant in option 1 has been crudely estimated at £28 million. Some economy of scale is lost but if there is limited capital available, this option may provide an intermediate solution.
5.1.3 CO2 Capture Option 2
As the feed gas is at high pressure it is likely that a physical absorption process would be more appropriate to take advantage of the very much higher CO2 partial pressure. The CO2 removal technology would not be that typically employed in post combustion capture, but more aligned to process gas sweetening.
Option 2 similarly only recovers the CO2 produced by the reforming chemistry, providing an overall CO2 capture efficiency of 49�55%. This study has not looked at the potential costs of these technologies, however it is clear that if they can deliver the same amount of CO2 capture for lower cost than option 1, then these would be preferred.
By removing the CO2 from the feed stream to the PSA unit, the PSA unit would be significantly de�bottlenecked. This has the added benefit of helping to de�bottleneck the HPU if this is a future objective.
BOC HPU CCS STUDY REPORT
28603�8111�RP�001 PAGE 37 OF 49 REV O2
Revision: O2 Date: Nov 2014
5.2 Recommendations for Further Consideration
5.2.1 CO2 Export Pressure
The CO2 export pressure from the BOC Hydrogen Plant to the CO2 network has been set at 100 barg. From the standpoint of the Hydrogen Plant this significantly increases the total power consumption of the CO2 Capture Plant and substantially increases the cost of the CO2 Compressor.
Within the Hydrogen Plant CO2 Capture Plant the minimum CO2 pressure is set by the Dehydration Unit. To achieve the export CO2 specification, the minimum CO2 export pressure is 27 barg.
The CO2 network and booster station are being developed by others and we appreciate that there is an economic trade�off between the cost of compression at the distributed CO2 producing sites, the pressure rating of the inter�connecting pipeline and the cost of the booster station.
It is important that the economic optimum export pressure is used to keep the system cost low, and ensure there is not a barrier to future producers wishing to join the network.
5.2.2 Flue Gas Blower
There are a number of areas would require further development in the pre�FEED phase. On such area is the control of the existing Reformer ID Fan (B�101) and the proposed Flue Gas Blower (BL�201). It is possible for example that B�101 could be totally replaced by BL�201, which would avoid potential controllability issues between the two machines. The new flue gas duct valves shown on the Reformer PFD mark�up will need to be position proved open, midpoint and closed, and would require a safety interlock scheme to be developed.
5.3 Heat Integration
Further work needs to be done to ascertain the optimum balance of energy integration between the gas�gas exchanger and the combustion air preheater. If additional heat can be recovered from the flue gas in this way, this will reduce the size of the direct contact cooler tower and the DCC cooler, which in turn will reduce the cooling water system demand.
There is also a minor steam imbalance which needs to be resolved. If production of HP steam for export is no longer required, there is potential to target steam production at specifically at the LP user level.
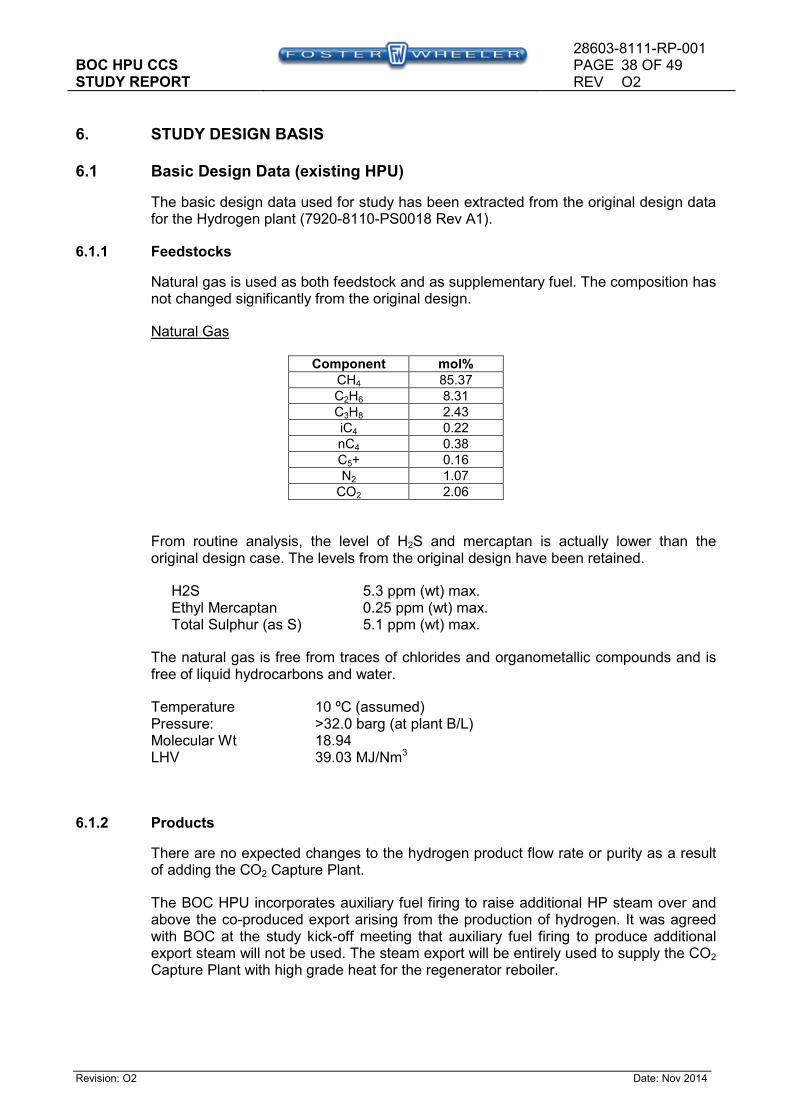
BOC HPU CCS STUDY REPORT
28603�8111�RP�001 PAGE 38 OF 49 REV O2
Revision: O2 Date: Nov 2014
6. STUDY DESIGN BASIS
6.1 Basic Design Data (existing HPU)
The basic design data used for study has been extracted from the original design data for the Hydrogen plant (7920�8110�PS0018 Rev A1).
6.1.1 Feedstocks
Natural gas is used as both feedstock and as supplementary fuel. The composition has not changed significantly from the original design.
Natural Gas
Component mol%
CH4 85.37
C2H6 8.31
C3H8 2.43
iC4 0.22
nC4 0.38
C5+ 0.16
N2 1.07
CO2 2.06
From routine analysis, the level of H2S and mercaptan is actually lower than the original design case. The levels from the original design have been retained.
H2S 5.3 ppm (wt) max. Ethyl Mercaptan 0.25 ppm (wt) max. Total Sulphur (as S) 5.1 ppm (wt) max.
The natural gas is free from traces of chlorides and organometallic compounds and is free of liquid hydrocarbons and water.
Temperature 10 ºC (assumed) Pressure: >32.0 barg (at plant B/L) Molecular Wt 18.94 LHV 39.03 MJ/Nm3
6.1.2 Products
There are no expected changes to the hydrogen product flow rate or purity as a result of adding the CO2 Capture Plant.
The BOC HPU incorporates auxiliary fuel firing to raise additional HP steam over and above the co�produced export arising from the production of hydrogen. It was agreed with BOC at the study kick�off meeting that auxiliary fuel firing to produce additional export steam will not be used. The steam export will be entirely used to supply the CO2 Capture Plant with high grade heat for the regenerator reboiler.
BOC HPU CCS STUDY REPORT
28603�8111�RP�001 PAGE 39 OF 49 REV O2
Revision: O2 Date: Nov 2014
6.1.3 Effluent Flue Gas
The design stack gas temperature at the outlet of the ID Fan B�101 is 135 °C.
The reformer is fitted with low NOx burners and it has been assumed that the guaranteed NOx emission is not exceeded.
6.1.4 Utilities
There are no expected changes to the utilities at the existing BOC HPU.
6.2 Design Basis New CO2 Capture Plant
6.2.1 Feedstocks
Flue Gas
The new CO2 Capture Plant will take the flue gas from the existing reformer as a feedstock. The flue gas conditions assumed below are those expected for the “minimum steam” case, i.e. without any firing of the auxiliary burners.
Component mol%
N2 62.31
CO2 17.43
H2O 18.00
O2 1.52
Ar 0.74
Emissions at max and normal heat release (not turndown):
Expected Guaranteed NOx mg/Nm3 111 150 CO mg/Nm3 33 205 UHC mg/Nm3 17 21
Temperature: 135ºC (assumed) Pressure: 0.025 barg (at plant B/L) Flow: 5131 kmol/hr 149600 kg/hr
The sulphur content in the natural gas feed is very low. Based on the design H2S/Mercaptan levels the SO2/3 content in the flue gas is 0.19 ppmwt (dry basis).
Should additional firing through the auxiliary burners be required, this will both increase the flow and change the composition of the flue gas. This case has not been considered in the design at this stage.
BOC HPU CCS STUDY REPORT
28603�8111�RP�001 PAGE 40 OF 49 REV O2
Revision: O2 Date: Nov 2014
6.2.2 Products
The addition of the capture plant will have no net effect on hydrogen export capacity of the HPU.
Carbon Dioxide
The new capture plant will produce CO2 for export at the plant battery limit, in accordance with the following export specification.
Component Recommended Specification, mol%
CO2 >95 mol%
Hydrogen Sulphide (Safety) <200 ppmv
Carbon Monoxide <2000 ppmv
NOx <100 ppmv
SOx <100 ppmv
Oxygen <10 ppmv
Nitrogen <1 mol %
Hydrogen <1 mol %
Argon <1 mol %
Methane <1 mol %
Non�condensable <4 mol %
Water <50 ppmv
Hydrocarbons <2 mol %
Particulates 1 mg/Nm³
Particle size (micron) ≤10 Zm
Mercury Regulation
B/L Export Pressure: 100 barg B/L Export Temperature: 35°C
6.2.3 Utilities
Power
Power will be provided from an external source to meet the high power demand of the CO2 Capture Plant.
Steam
For the original “minimum steam” design case, the total (co�produced) steam is 52 te/h (at 265°C / 42.8 barg). This export steam will be used to supply the CO2 Capture Plant.
Steam condensate will be returned to the HPU. The existing condensate treatment package / polisher may need to be upgraded to cope with the increased condensate load.
Process Water
The CO2 Capture Plant will use Gately water as make�up to its cooling water system and as make�up to the Absorber Pump�around.

BOC HPU CCS STUDY REPORT
28603�8111�RP�001 PAGE 41 OF 49 REV O2
Revision: O2 Date: Nov 2014
The Gately water conditions are as follows:
Pressure: 2 barg (minimum) Temperature: 10ºC (ambient)
The quality of Gately Water is assumed to be as follows;
Hardness : 60 ppm (as CaCO3) pH : 7.5 – 8 Dissolved solids : 120 – 150 ppm
Nitrogen and Instrument Nitrogen
Nitrogen and instrument nitrogen for the CO2 Capture Plant will be imported at the battery limit. It is assumed that sufficient N2 can be made available.
Purity: 99.5% N2 (min) Pressure: 3.0 barg (min) Temperature: ambient ºC
Instrument Nitrogen will be provided by BOC.
Instrument Nitrogen pressure 7.0 barg Instrument Nitrogen dew point �40 ºC
Plant Cooling
An evaporative cooling water system will be included to independently meet the requirements of the CO2 Capture Plant. The design basis will be the same as the existing cooling tower package;
Cooling water inlet temperature: 35°C Cooling water outlet temperature: 25°C Design wet bulb temperature: 17.5°C Rated capacity: 120% of normal capacity Concentration cycles: 3 Type: Induced draft 2 x 50% Cells required (for availability/on�line maintenance)
The cooling water pumps have a discharge pressure of 4 barg.
Effluent Water
There is a single connection to the water sewer (closed header) with a pH limit of 6�8 and a temperature limit of 30ºC. The existing cooling water system blowdown and the steam system blowdown discharge to the sewer. Effluent from the cation polishing unit regeneration is also routed to the sewer after pH adjustment.
The combined effluents from the CO2 Capture Plant are assumed to be routed offsite for third party treatment.
BOC HPU CCS STUDY REPORT
28603�8111�RP�001 PAGE 42 OF 49 REV O2
Revision: O2 Date: Nov 2014
6.2.4 Design Aspects
The following assumptions have been made relating to the CO2 Capture Plant design aspects:
Ambient Conditions
The ambient conditions are assumed to be:
Annual Average Dry/Wet Bulb Temperature 10 / 8 ºC Design Dry/Wet Bulb Temperature 23 / 17.5 ºC Max/Min Temperature 34 / �12 ºC Barometric Pressure 1.013 bara
Noise
The noise limit for the plant is 85 dBA at 1 metre from the equipment during normal plant operation.
Vents and Flares
The HPU was designed so as to not require any discharges to flare.
The CCP will be similarly designed.
Effluent Flue Gas
The net effect of capturing the CO2 from the reformer flue gas will be to increase the concentration of NOx in the residual flue gas, which may be subject to a discharge limitation.
As there is no increase in the mass emission rate, no additional flue gas treatment has been considered at this stage to reduce the NOx content of the flue gas emitted to atmosphere.
Site Conditions
The site conditions are assumed to be the same as those for the existing BOC HPU.

BOC HPU CCS STUDY REPORT
28603�8111�RP�001 PAGE 43 OF 49 REV O2
Revision: O2 Date: Nov 2014
ATTACHMENT 1: PROCESS FLOW DIAGRAMS & MATERIAL BALANCES
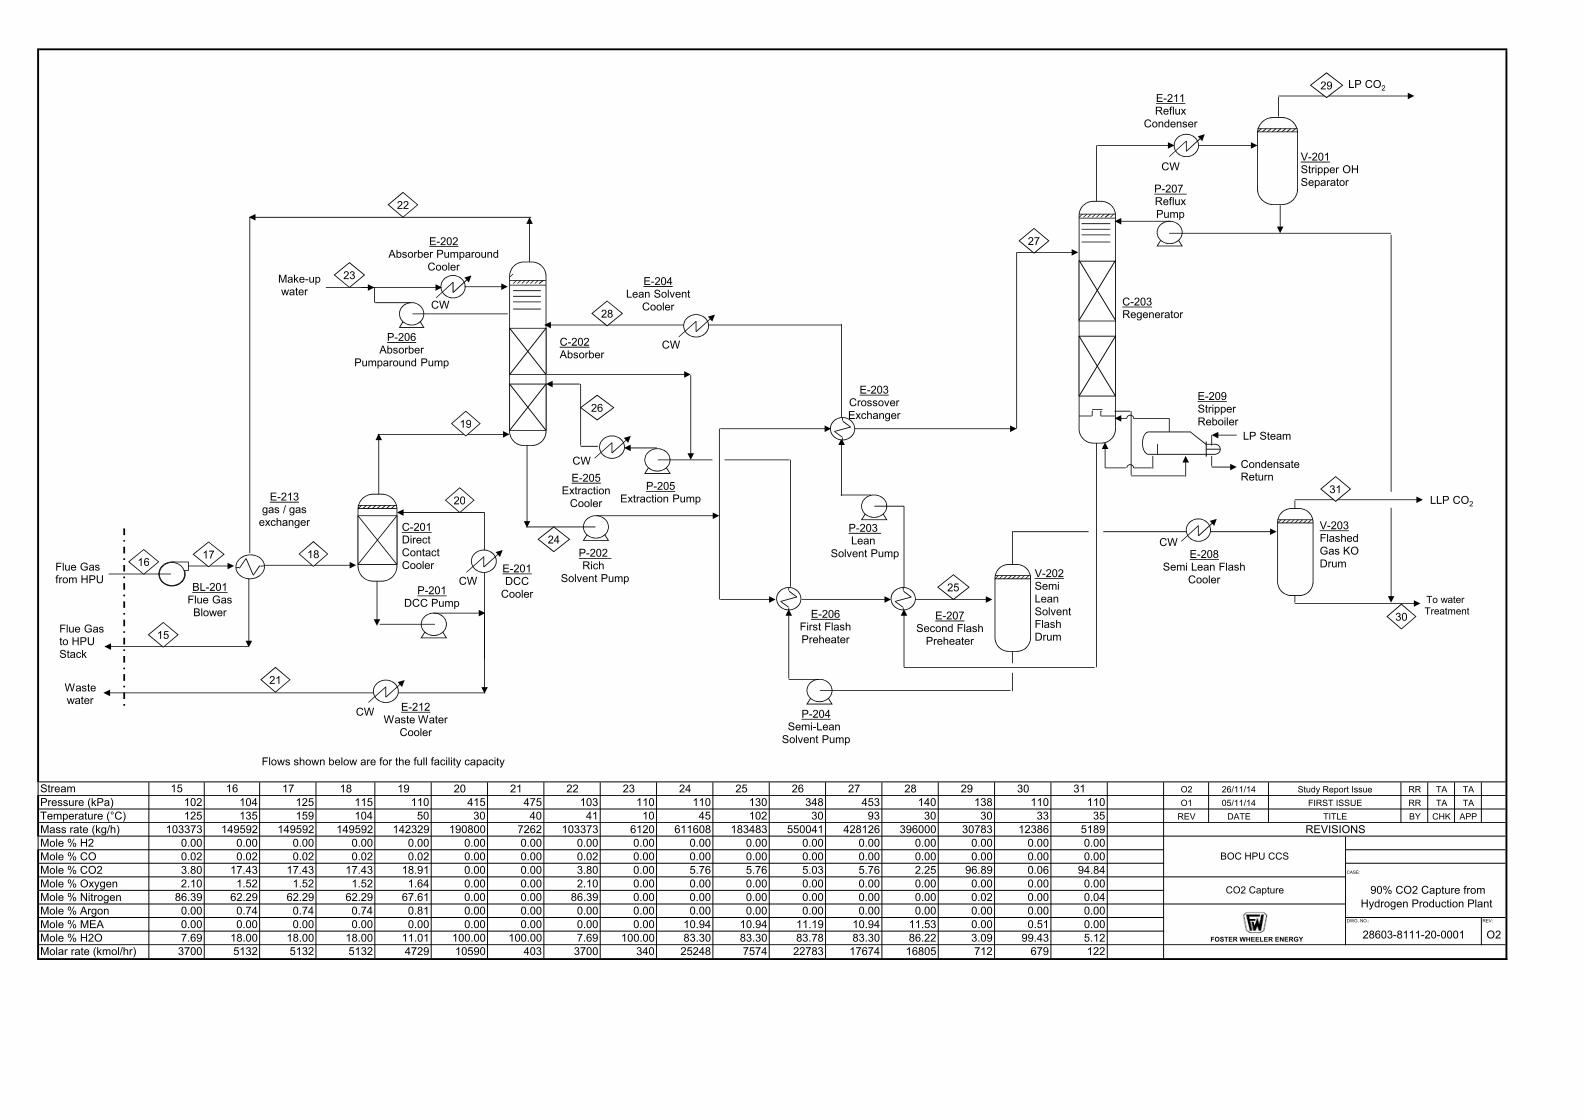
Flows shown below are for the full facility capacity
Stream 15 16 17 18 19 20 21 22 23 24 25 26 27 28 29 30 31 O2 26/11/14 RR TA TA
Pressure (kPa) 102 104 125 115 110 415 475 103 110 110 130 348 453 140 138 110 110 O1 05/11/14 RR TA TA
Temperature (°C) 125 135 159 104 50 30 40 41 10 45 102 30 93 30 30 33 35 REV DATE BY CHK APP
Mass rate (kg/h) 103373 149592 149592 149592 142329 190800 7262 103373 6120 611608 183483 550041 428126 396000 30783 12386 5189
Mole % H2 0.00 0.00 0.00 0.00 0.00 0.00 0.00 0.00 0.00 0.00 0.00 0.00 0.00 0.00 0.00 0.00 0.00
Mole % CO 0.02 0.02 0.02 0.02 0.02 0.00 0.00 0.02 0.00 0.00 0.00 0.00 0.00 0.00 0.00 0.00 0.00
Mole % CO2 3.80 17.43 17.43 17.43 18.91 0.00 0.00 3.80 0.00 5.76 5.76 5.03 5.76 2.25 96.89 0.06 94.84
Mole % Oxygen 2.10 1.52 1.52 1.52 1.64 0.00 0.00 2.10 0.00 0.00 0.00 0.00 0.00 0.00 0.00 0.00 0.00
Mole % Nitrogen 86.39 62.29 62.29 62.29 67.61 0.00 0.00 86.39 0.00 0.00 0.00 0.00 0.00 0.00 0.02 0.00 0.04
Mole % Argon 0.00 0.74 0.74 0.74 0.81 0.00 0.00 0.00 0.00 0.00 0.00 0.00 0.00 0.00 0.00 0.00 0.00
Mole % MEA 0.00 0.00 0.00 0.00 0.00 0.00 0.00 0.00 0.00 10.94 10.94 11.19 10.94 11.53 0.00 0.51 0.00
Mole % H2O 7.69 18.00 18.00 18.00 11.01 100.00 100.00 7.69 100.00 83.30 83.30 83.78 83.30 86.22 3.09 99.43 5.12
Molar rate (kmol/hr) 3700 5132 5132 5132 4729 10590 403 3700 340 25248 7574 22783 17674 16805 712 679 122
Study Report Issue
FIRST ISSUE
TITLE
REVISIONS
DWG. NO.: REV:
90% CO2 Capture from
Hydrogen Production Plant
BOC HPU CCS
CASE:
CO2 Capture
FOSTER WHEELER ENERGY
LP Steam
Condensate Return
Make?upwater
28603?8111?20?0001 O2
Waste water
Flue Gas to HPU Stack
To water Treatment
LP CO2
LLP CO2
18
19
21
20
24
27
25
26
28
22
29
31
30
23
C?202Absorber
P?203 Lean
Solvent Pump
C?203Regenerator
E?209StripperReboiler
V?201Stripper OHSeparator
E?211Reflux
Condenser
P?207 RefluxPump
C?201Direct Contact Cooler
P?202 Rich
Solvent Pump
E?204Lean Solvent
Cooler
V?203Flashed Gas KO Drum
E?208Semi Lean Flash
CoolerV?202Semi Lean Solvent FlashDrum
E?203CrossoverExchanger
E?207Second Flash
Preheater
P?204Semi?Lean
Solvent Pump
E?206First Flash Preheater
P?205Extraction Pump
P?201DCC Pump
E?201DCC
Cooler
P?206Absorber
Pumparound Pump
E?202Absorber Pumparound
Cooler
E?205Extraction
CoolerE?213
gas / gas exchanger
17Flue Gas from HPU
16
15
CW
CW
CW
CW
CW
CW
CW
BL?201Flue GasBlower
E?212Waste Water
Cooler

Flows shown below are for the full facility capacity
O2 26/11/14 RR TA TA
32 33 34 35 36 37 38 39 40 O1 05/11/14 RR TA TA
Pressure (kPa) 138 138 270 530 1140 2600 2500 4000 10100 REV DATE BY CHK APP
Temperature (°C) 35 35 35 35 35 35 35 35 35
Mass rate (kg/h) 512 5166 35780 35628 39494 39451 39400 35460 35460
Mole % H2 0.00 0.00 0.00 0.00 0.00 0.00 0.00 0.00 0.00
Mole % CO 0.00 0.00 0.00 0.00 0.00 0.00 0.00 0.00 0.00
Mole % CO2 0.28 95.86 97.84 98.85 99.40 99.66 99.98 99.98 99.98
Mole % Oxygen 0.00 0.00 0.00 0.00 0.00 0.00 0.00 0.00 0.00
Mole % Nitrogen 0.00 0.04 0.02 0.02 0.02 0.02 0.02 0.02 0.02
Mole % MEA 0.00 0.00 0.00 0.00 0.00 0.00 0.00 0.00 0.00
Mole % H2O 99.72 4.10 2.13 1.13 0.58 0.32 0.00 0.00 0.00
Molar rate (kmol/hr) 28 120 823 815 901 898 895 806 806
CO2 Compression & Dehydration
REVISIONS
BOC HPU CCS
CASE:
Study Report Issue
90% CO2 Capture from
Hydrogen Production Plant
FOSTER WHEELER ENERGY
DWG. NO.: REV:
FIRST ISSUE
TITLE
Stream Name
LP CO2
28603?8111?20?0002 O2
CO2 Compression
To Water Treatment
CO2 ProductExport
LLP CO2
CO2 Drying
29
31
38
37363533
32
34
K?301?1CO2 Compresor
1st Stage
K?301?2CO2 Compresor
2nd Stage
K?301?3CO2 Compresor
3rd Stage
K?301?4CO2 Compresor
4th Stage
K?301?5CO2 Compresor
5th Stage
PK?301 CO2 Drier Package
CW CW CW CW CW
39 40
K?301?6CO2 Compresor
6th Stage
K?301?7CO2 Compresor
7th Stage
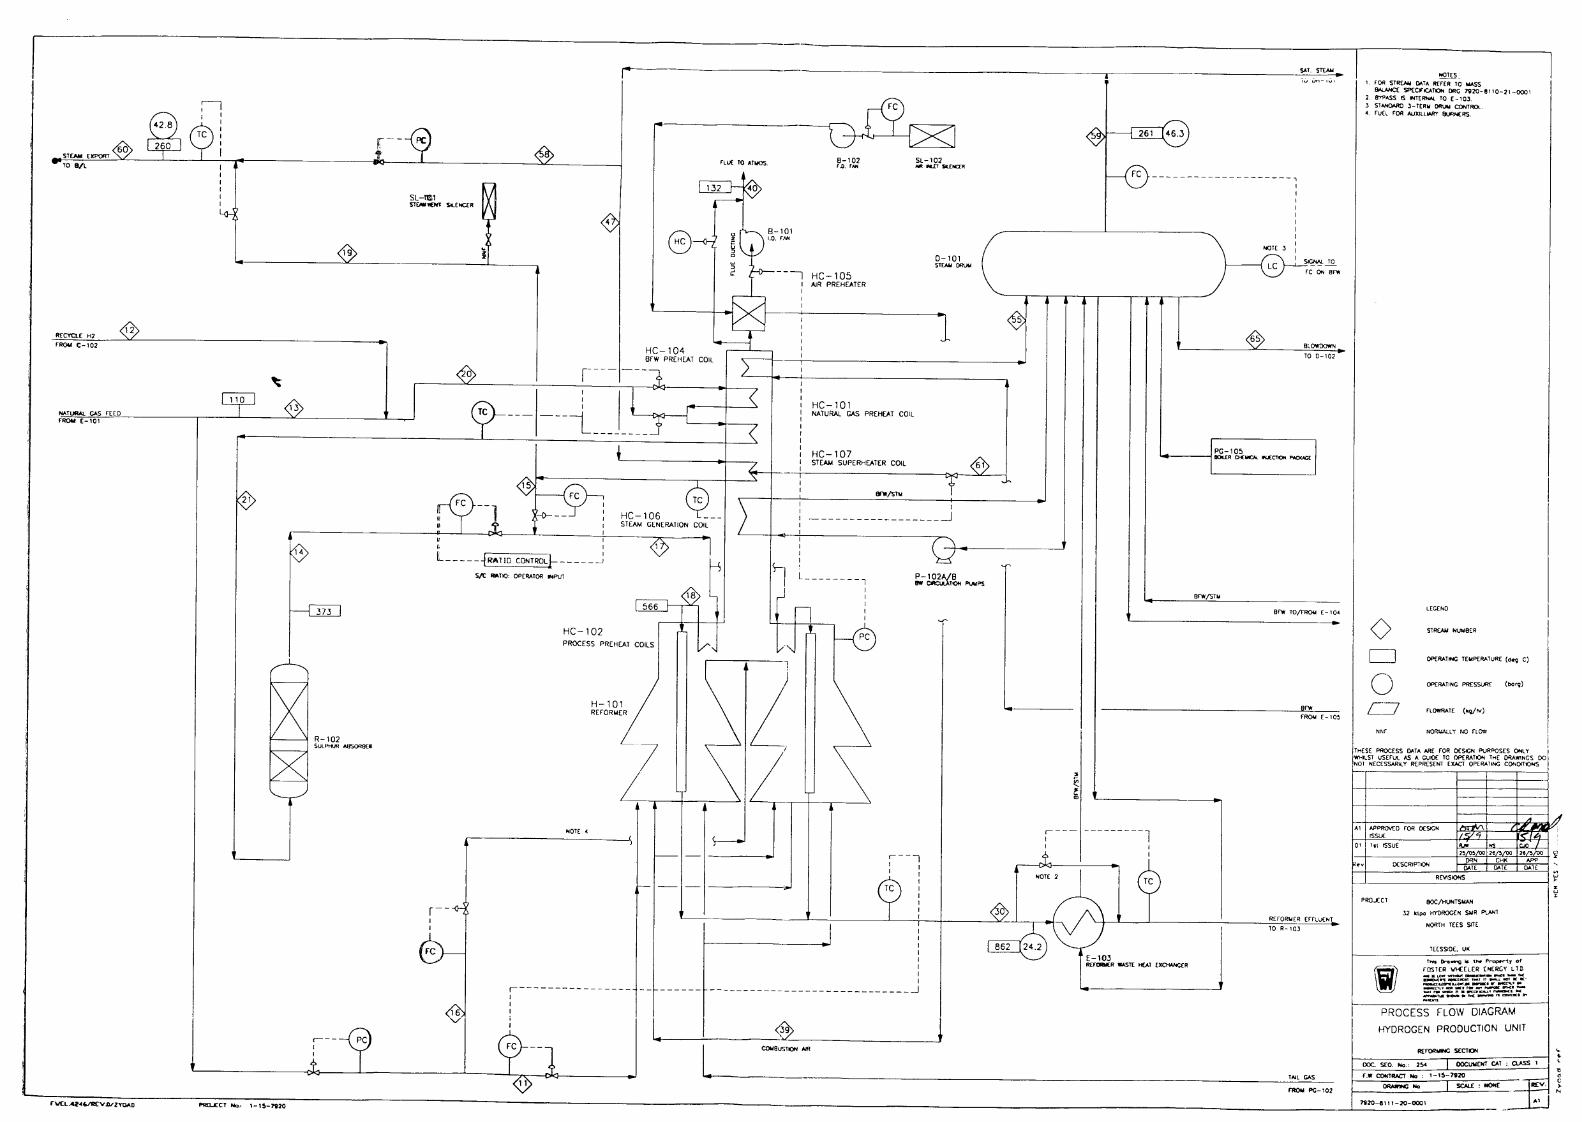

BOC HPU CCS STUDY REPORT
28603�8111�RP�001 PAGE 44 OF 49 REV O2
Revision: O2 Date: Nov 2014
ATTACHMENT 2: EQUIPMENT SCHEDULE
PAGE 1 OF 8
FOSTER WHEELER
ENERGY LTD
READING
REV BY APPROVED DATE
UNIT NAME: MEA Unit / CO2 Compression / Utilities ORIG RR 10/11/2014
01 RR 26/11/2014
UNIT No.: 200 / 300 / 400 02
03
CLIENT: Tees Valley Unlimited
PROJECT: BOC HPU CCS
CONTRACT 28603
DOCUMENT No.: 28603.8111.EL.0001
CASE SUMMARY
NOTES
Hydrogen Plant with 90% Post Combustion CO2 Capture
EQUIPMENT LIST � BOC HPU with 90% CCS
PROJECT No.: 1.17.12716
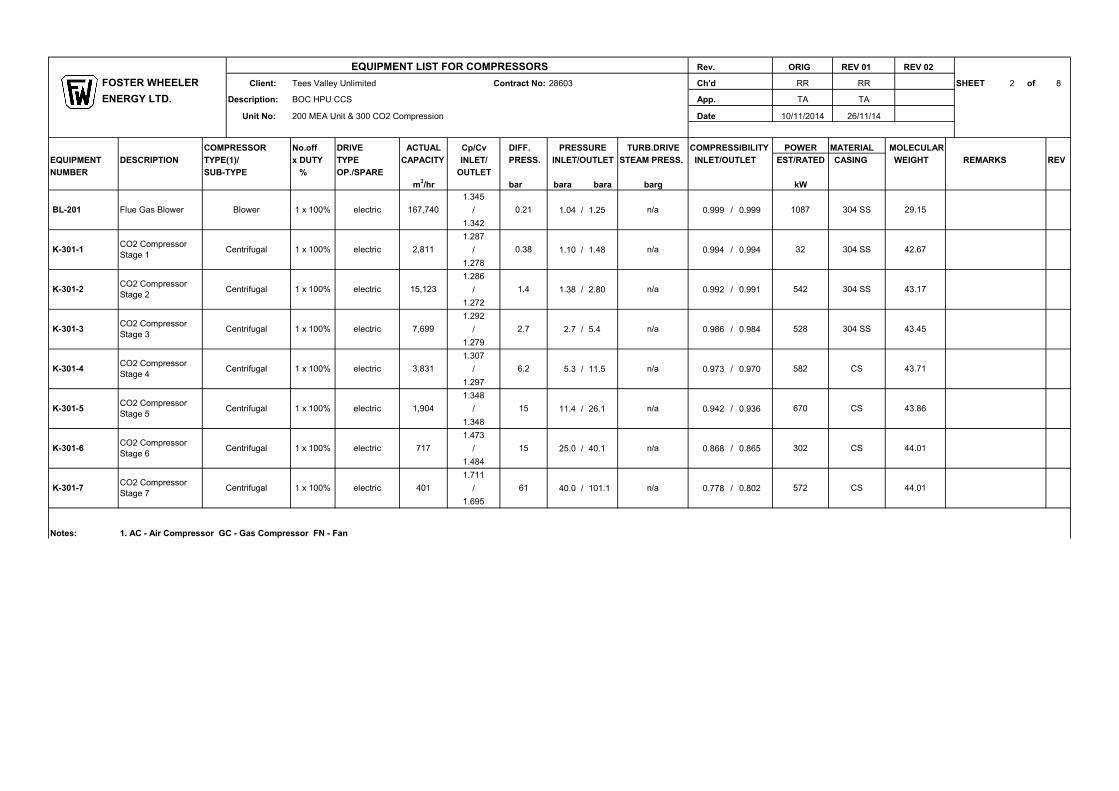
EQUIPMENT LIST FOR COMPRESSORS
FOSTER WHEELER Client: Tees Valley Unlimited Contract No: 28603 SHEET 2 of 8
ENERGY LTD. Description: BOC HPU CCS
Unit No: 200 MEA Unit & 300 CO2 Compression
COMPRESSOR No.off DRIVE ACTUAL Cp/Cv DIFF. TURB.DRIVE POWER MATERIAL MOLECULAR
EQUIPMENT DESCRIPTION TYPE(1)/ x DUTY TYPE CAPACITY INLET/ PRESS. STEAM PRESS. EST/RATED CASING WEIGHT REMARKS REMARKS REV
NUMBER SUB�TYPE % OP./SPARE OUTLET
m3/hr bar bara bara barg kW
1.345
/ 1.04 / 1.25 0.999 / 0.999
1.342
1.287
/ 1.10 / 1.48 0.994 / 0.994
1.278
1.286
/ 1.38 / 2.80 0.992 / 0.991
1.272
1.292
/ 2.7 / 5.4 0.986 / 0.984
1.279
1.307
/ 5.3 / 11.5 0.973 / 0.970
1.297
1.348
/ 11.4 / 26.1 0.942 / 0.936
1.348
1.473
/ 25.0 / 40.1 0.868 / 0.865
1.484
1.711
/ 40.0 / 101.1 0.778 / 0.802
1.695
Notes: 1. AC � Air Compressor GC � Gas Compressor FN � Fan
CS 44.01 K�301�7CO2 Compressor
Stage 7Centrifugal 1 x 100% electric 401 61 n/a 572
15 n/a 302 CS 44.01 K�301�6CO2 Compressor
Stage 6Centrifugal 1 x 100% electric 717
10/11/2014
29.15
PRESSURE
INLET/OUTLET
COMPRESSIBILITY
INLET/OUTLET
K�301�1CO2 Compressor
Stage 1Centrifugal 1 x 100%
528 K�301�3CO2 Compressor
Stage 3Centrifugal 1 x 100% electric 43.45
K�301�4CO2 Compressor
Stage 4Centrifugal 1 x 100% electric
REV 02REV 01ORIG
304 SS 42.67electric
15,123
0.38
167,740electric
2,811
0.21
1.4
n/a 32
Rev.
Ch'd
App.
Date
n/a 1087
RR
TA
6.2 n/a
304 SS
K�301�2CO2 Compressor
Stage 2Centrifugal 1 x 100% electric 304 SS 43.17n/a 542
BL�201 Flue Gas Blower Blower 1 x 100% 304 SS
15 n/a K�301�5CO2 Compressor
Stage 5Centrifugal 1 x 100% electric CS6701,904 43.86
3,831
2.7 n/a7,699
RR
TA
26/11/14
582 CS 43.71
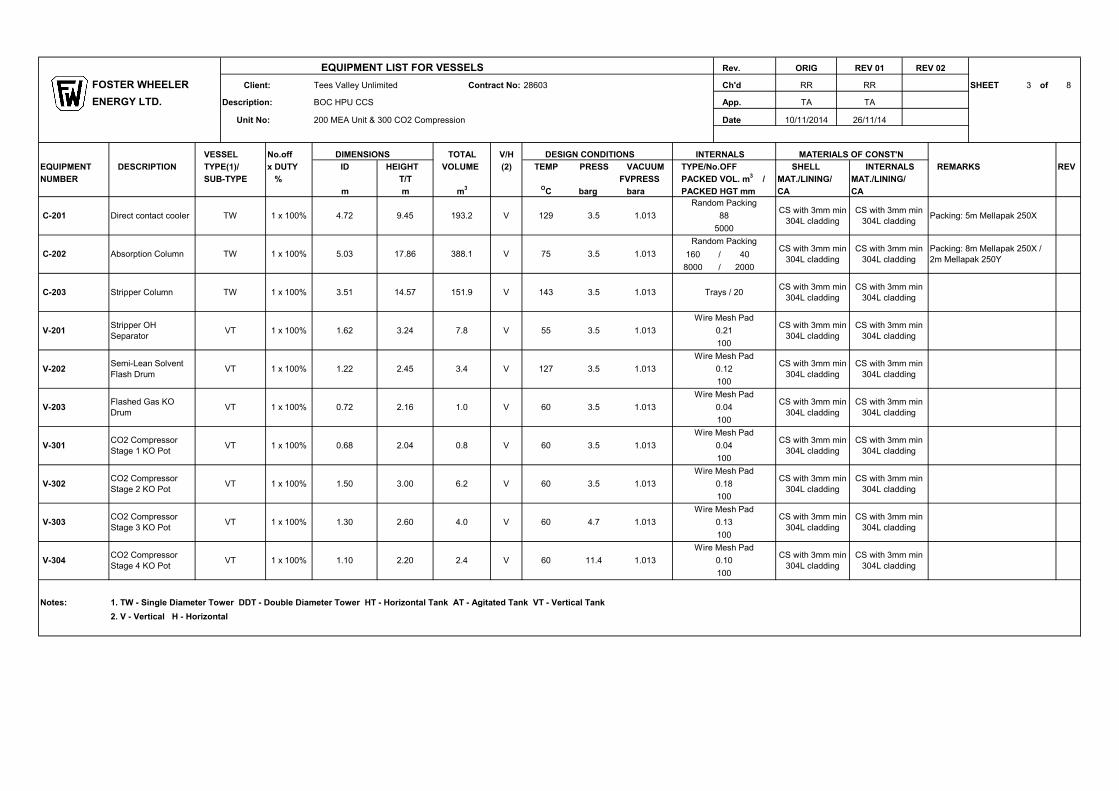
EQUIPMENT LIST FOR VESSELS Rev. ORIG REV 02
FOSTER WHEELER Client: Tees Valley Unlimited Contract No: 28603 Ch'd RR SHEET 3 of 8
ENERGY LTD. Description: BOC HPU CCS App. TA
Unit No: 200 MEA Unit & 300 CO2 Compression Date 10/11/2014
VESSEL No.off DIMENSIONS TOTAL V/H DESIGN CONDITIONS INTERNALS MATERIALS OF CONST'N
EQUIPMENT DESCRIPTION TYPE(1)/ x DUTY ID HEIGHT VOLUME (2) TEMP PRESS VACUUM TYPE/No.OFF SHELL INTERNALS REMARKS REV
NUMBER SUB�TYPE % T/T FVPRESS PACKED VOL. m3 / MAT./LINING/ MAT./LINING/
m m m3 O
C barg bara PACKED HGT mm CA CA
160 40
8000 2000
Notes: 1. TW � Single Diameter Tower DDT � Double Diameter Tower HT � Horizontal Tank AT � Agitated Tank VT � Vertical Tank
2. V � Vertical H � Horizontal
TW 1 x 100%
3.51 14.57 C�203 3.5 1.013
5.03 17.86 388.1 V 75 3.5 1.013
Stripper Column TW 1 x 100% 143151.9 V
C�201 Direct contact cooler TW 1 x 100%
127
4.72 9.45 193.2 V 129 3.5 1.013
Random Packing
3.5 1.0132.45 3.4 V V�202Semi.Lean Solvent
Flash Drum
C�202 Absorption Column
0.68 2.04 0.8 VCS with 3mm min
304L cladding
3.24
CS with 3mm min
304L cladding
CS with 3mm min
304L cladding
100
Wire Mesh Pad
1.62
60
3.5 1.01360
Wire Mesh Pad
Random PackingCS with 3mm min
304L cladding
CS with 3mm min
304L cladding
CS with 3mm min
304L cladding
Stripper OH
SeparatorVT 1 x 100%
0.04
100
1 x 100% 1.22
V�304CO2 Compressor
Stage 4 KO PotVT 1 x 100% 1.10
3.5
7.8 V 55
V�203Flashed Gas KO
DrumVT 1 x 100% 0.72 1.0 V
VT
V�301CO2 Compressor
Stage 1 KO PotVT 1 x 100%
3.5
3.5
2.16
4.7 V�303CO2 Compressor
Stage 3 KO PotVT 1 x 100% 1.30 2.60 4.0 V 60
V�302CO2 Compressor
Stage 2 KO PotVT 1 x 100% 1.50 3.00
V�201
1.013
Wire Mesh PadCS with 3mm min
304L cladding
CS with 3mm min
304L cladding
CS with 3mm min
304L cladding1.013
Wire Mesh Pad
0.18
100
CS with 3mm min
304L cladding0.13
100
6.2 V
1.013CS with 3mm min
304L cladding
CS with 3mm min
304L cladding1.013
Wire Mesh PadCS with 3mm min
304L cladding
CS with 3mm min
304L cladding
Wire Mesh Pad
60
REV 01
RR
TA
26/11/14
88
5000
CS with 3mm min
304L cladding
CS with 3mm min
304L cladding
0.04
0.21
100
0.12
100
CS with 3mm min
304L cladding
Packing: 5m Mellapak 250X
CS with 3mm min
304L cladding
Packing: 8m Mellapak 250X /
2m Mellapak 250Y
Trays / 20
0.10
100
2.20 2.4 V 60 11.4 1.013
Wire Mesh PadCS with 3mm min
304L cladding
CS with 3mm min
304L cladding
/
/
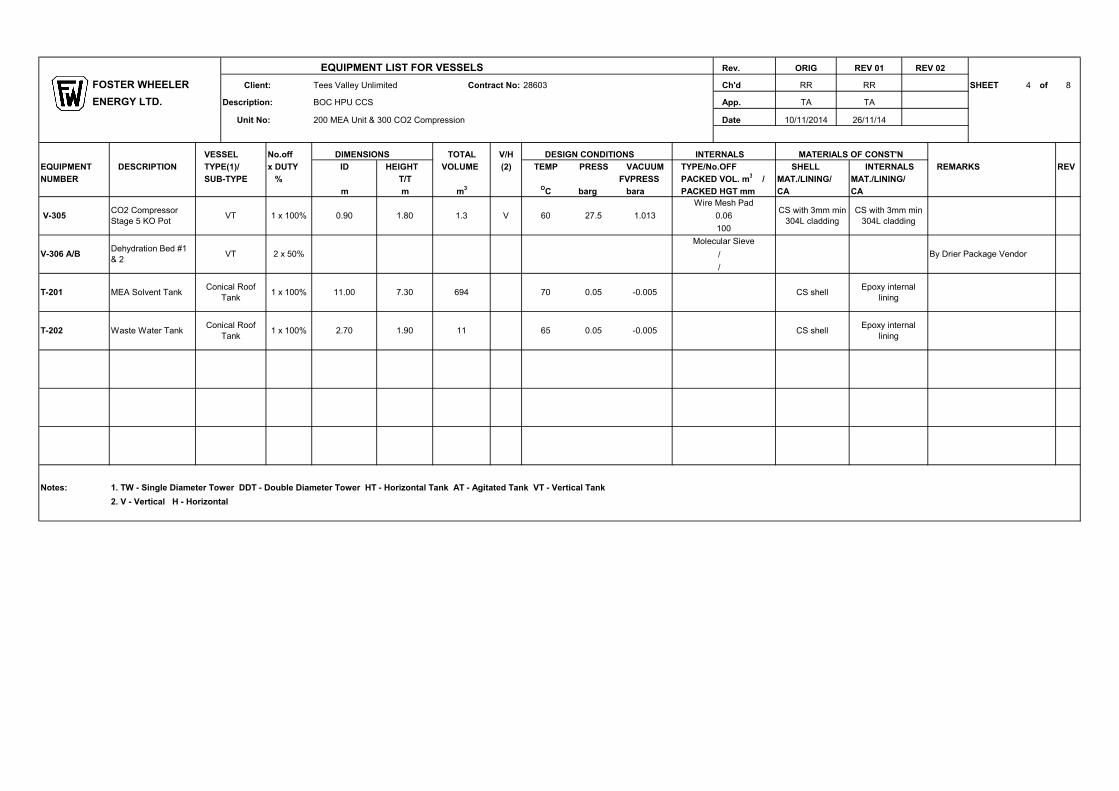
EQUIPMENT LIST FOR VESSELS Rev. ORIG REV 02
FOSTER WHEELER Client: Tees Valley Unlimited Contract No: 28603 Ch'd RR SHEET 4 of 8
ENERGY LTD. Description: BOC HPU CCS App. TA
Unit No: 200 MEA Unit & 300 CO2 Compression Date 10/11/2014
VESSEL No.off DIMENSIONS TOTAL V/H DESIGN CONDITIONS INTERNALS MATERIALS OF CONST'N
EQUIPMENT DESCRIPTION TYPE(1)/ x DUTY ID HEIGHT VOLUME (2) TEMP PRESS VACUUM TYPE/No.OFF SHELL INTERNALS REMARKS REV
NUMBER SUB�TYPE % T/T FVPRESS PACKED VOL. m3 / MAT./LINING/ MAT./LINING/
m m m3 O
C barg bara PACKED HGT mm CA CA
Notes: 1. TW � Single Diameter Tower DDT � Double Diameter Tower HT � Horizontal Tank AT � Agitated Tank VT � Vertical Tank
2. V � Vertical H � Horizontal
REV 01
RR
TA
26/11/14
0.06
100
Epoxy internal
lining
CS with 3mm min
304L cladding
CS with 3mm min
304L cladding
T�201
0.05 .0.005 CS shellT�202 Waste Water TankConical Roof
Tank1 x 100% 652.70 1.90 11
60 27.5 1.013
Wire Mesh Pad
V�305CO2 Compressor
Stage 5 KO PotVT 1 x 100% 0.90 1.80 1.3 V
By Drier Package Vendor
Molecular Sieve
11.00 7.30 694
V�306 A/BDehydration Bed #1
& 2VT 2 x 50%
MEA Solvent TankConical Roof
Tank1 x 100% 70 0.05 .0.005 CS shell
Epoxy internal
lining
/
/
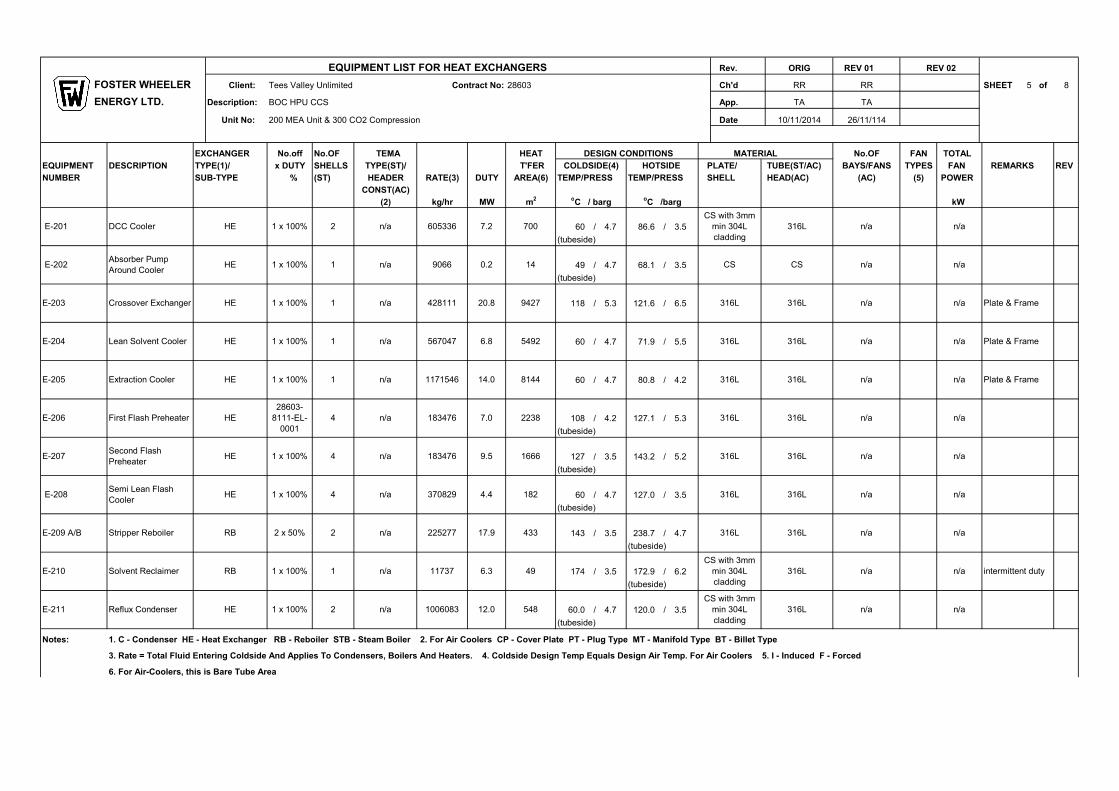
EQUIPMENT LIST FOR HEAT EXCHANGERS Rev. ORIG REV 01
FOSTER WHEELER Client: Tees Valley Unlimited Contract No: 28603 Ch'd RR RR SHEET 5 of 8
ENERGY LTD. Description: BOC HPU CCS App. TA TA
Unit No: 200 MEA Unit & 300 CO2 Compression Date 10/11/2014 26/11/114
EXCHANGER No.off No.OF TEMA HEAT MATERIAL No.OF FAN TOTAL
EQUIPMENT DESCRIPTION TYPE(1)/ x DUTY SHELLS TYPE(ST)/ T'FER PLATE/ TUBE(ST/AC) BAYS/FANS TYPES FAN REMARKS REV
NUMBER SUB�TYPE % (ST) HEADER RATE(3) DUTY AREA(6) SHELL HEAD(AC) (AC) (5) POWER
CONST(AC)
(2) kg/hr MW m2
kW
60 / 4.7 86.6 / 3.5
(tubeside)
49 / 4.7 68.1 / 3.5
(tubeside)
118 / 5.3 121.6 / 6.5
60 / 4.7 71.9 / 5.5
60 / 4.7 80.8 / 4.2
108 / 4.2 127.1 / 5.3
(tubeside)
127 / 3.5 143.2 / 5.2
(tubeside)
60 / 4.7 127.0 / 3.5
(tubeside)
143 / 3.5 238.7 / 4.7
(tubeside)
174 / 3.5 172.9 / 6.2
(tubeside)
60.0 / 4.7 120.0 / 3.5
(tubeside)
Notes: 1. C � Condenser HE � Heat Exchanger RB � Reboiler STB � Steam Boiler 2. For Air Coolers CP � Cover Plate PT � Plug Type MT � Manifold Type BT � Billet Type
3. Rate = Total Fluid Entering Coldside And Applies To Condensers, Boilers And Heaters. 4. Coldside Design Temp Equals Design Air Temp. For Air Coolers 5. I � Induced F � Forced
6. For Air�Coolers, this is Bare Tube Area
n/a 9066 0.2 n/a
CS with 3mm
min 304L
cladding
316L n/a
HE 1 x 100% n/a
HOTSIDE
TEMP/PRESS
oC /barg
REV 02
COLDSIDE(4)
TEMP/PRESS
oC / barg
DESIGN CONDITIONS
2 E.201 DCC Cooler HE 1 x 100%
1 E.202Absorber Pump
Around CoolerHE 1 x 100% 14 CS CS n/a
n/a 605336 7.2 n/a700
n/a n/a intermittent duty
1 n/a 428111 20.8
1 n/a 567047 6.8
1 n/a 1171546 14.0
4 n/a 183476 7.0
316L
11737 6.3
Plate & Frame9427 316L 316L n/a
E.204 Lean Solvent Cooler HE 1 x 100% n/a Plate & Frame5492 316L 316L n/a
E.203 Crossover Exchanger
316L n/a n/a
E.205 Extraction Cooler HE 1 x 100% 8144 n/a Plate & Frame316L 316L n/a
n/a
E.206 First Flash Preheater HE
28603.
8111.EL.
0001
2238 316L
CS with 3mm
min 304L
cladding
316LE.210 Solvent Reclaimer RB 1 x 100% 1 n/a 49
n/a n/a E.208
2 1006083 12.0E.211 Reflux Condenser HE 1 x 100%
4.4 182
E.209 A/B Stripper Reboiler RB 2 x 50% 2 n/a 225277 17.9 433
548
CS with 3mm
min 304L
cladding
316L n/a
E.207Second Flash
PreheaterHE 1 x 100% 4 n/a 183476 9.5 1666 316L 316L n/a n/a
n/a
316L 316L n/a n/a
Semi Lean Flash
CoolerHE 1 x 100% 4 n/a 370829 316L
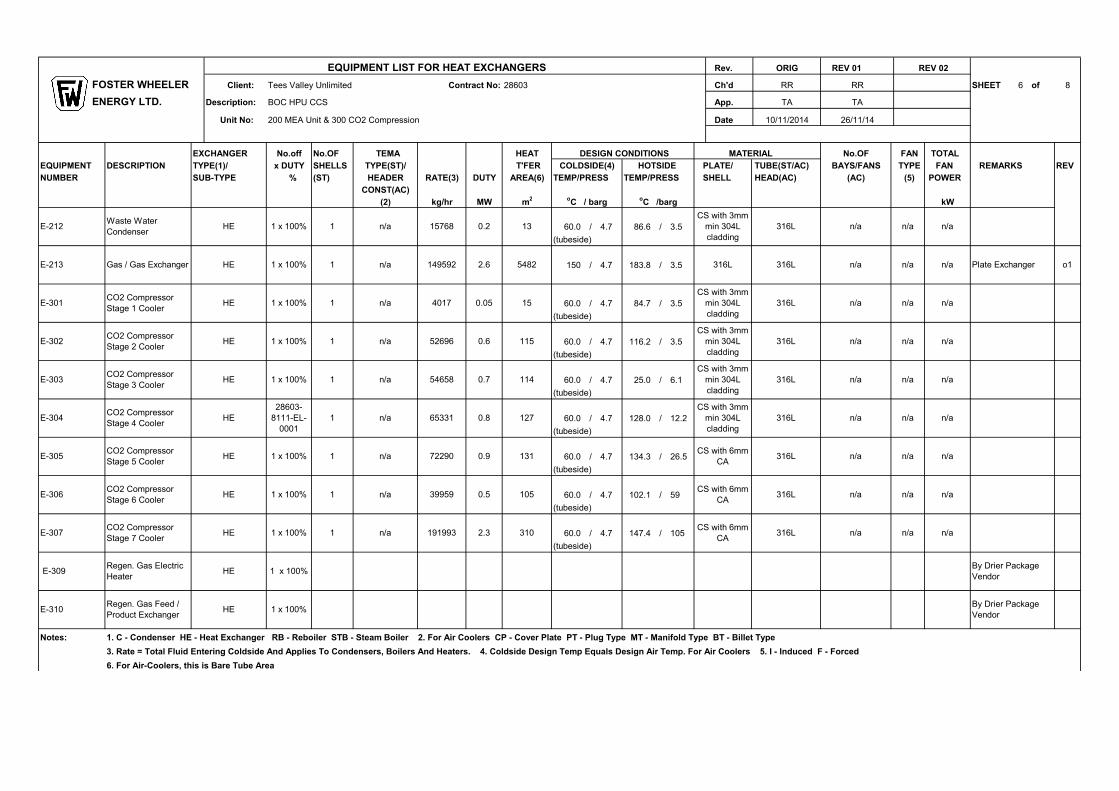
EQUIPMENT LIST FOR HEAT EXCHANGERS Rev. ORIG
FOSTER WHEELER Client: Tees Valley Unlimited Contract No: 28603 Ch'd RR SHEET 6 of 8
ENERGY LTD. Description: BOC HPU CCS App. TA
Unit No: 200 MEA Unit & 300 CO2 Compression Date 10/11/2014
EXCHANGER No.off No.OF TEMA HEAT MATERIAL No.OF FAN TOTAL
EQUIPMENT DESCRIPTION TYPE(1)/ x DUTY SHELLS TYPE(ST)/ T'FER PLATE/ TUBE(ST/AC) BAYS/FANS TYPE FAN REMARKS REV
NUMBER SUB�TYPE % (ST) HEADER RATE(3) DUTY AREA(6) SHELL HEAD(AC) (AC) (5) POWER
CONST(AC)
(2) kg/hr MW m2
kW
60.0 / 4.7 86.6 / 3.5
(tubeside)
150 / 4.7 183.8 / 3.5
60.0 / 4.7 84.7 / 3.5
(tubeside)
60.0 / 4.7 116.2 / 3.5
(tubeside)
60.0 / 4.7 25.0 / 6.1
(tubeside)
60.0 / 4.7 128.0 / 12.2
(tubeside)
60.0 / 4.7 134.3 / 26.5
(tubeside)
60.0 / 4.7 102.1 / 59
(tubeside)
60.0 / 4.7 147.4 / 105
(tubeside)
Notes: 1. C � Condenser HE � Heat Exchanger RB � Reboiler STB � Steam Boiler 2. For Air Coolers CP � Cover Plate PT � Plug Type MT � Manifold Type BT � Billet Type
3. Rate = Total Fluid Entering Coldside And Applies To Condensers, Boilers And Heaters. 4. Coldside Design Temp Equals Design Air Temp. For Air Coolers 5. I � Induced F � Forced
6. For Air�Coolers, this is Bare Tube Area
n/a
316L n/a n/a
E.212Waste Water
CondenserHE 1 x 100% 1 n/a 15768 0.2 13
n/a n/a n/a
n/a n/a
HE
CO2 Compressor
Stage 7 Cooler
CO2 Compressor
Stage 6 Cooler
E.307
E.306 n/a
n/a
CS with 3mm
min 304L
cladding
1 x 100%
1 x 100%
1
1
28603.
8111.EL.
0001
n/a
n/a n/a
E.303CO2 Compressor
Stage 3 CoolerHE 1 x 100% 1 n/a
E.302CO2 Compressor
Stage 2 CoolerHE 1 x 100% 115
CS with 3mm
min 304L
cladding
1 n/a 52696
316L
By Drier Package
Vendor
n/a
39959 0.5 105
191993 2.3 310
CS with 6mm
CA
CS with 6mm
CA
316L
316L
n/a
n/a
n/a
n/a
E.309Regen. Gas Electric
HeaterHE 1 x 100%
15
CS with 3mm
min 304L
cladding
316L
127
114
CS with 3mm
min 304L
cladding
CS with 3mm
min 304L
cladding
316L4017 0.05
54658 0.7
1 n/a 65331 0.8
26/11/14
REV 02 REV 01
RR
TA
E.213 Gas / Gas Exchanger HE 1 x 100% 1 n/a
COLDSIDE(4)
TEMP/PRESS
oC / barg
DESIGN CONDITIONS
HOTSIDE
TEMP/PRESS
oC /barg
316L n/a n/a
E.310Regen. Gas Feed /
Product ExchangerHE 1 x 100%
By Drier Package
Vendor
149592 316L 316L n/a Plate Exchanger o154822.6
CS with 6mm
CA316L n/a n/a n/a
0.6
n/a
n/a
n/a
n/a n/a
CO2 Compressor
Stage 5 CoolerE.305 HE 1 x 100% 1 n/a 72290 0.9 131
E.301CO2 Compressor
Stage 1 CoolerHE 1 x 100% 1 n/a
E.304CO2 Compressor
Stage 4 CoolerHE
HE
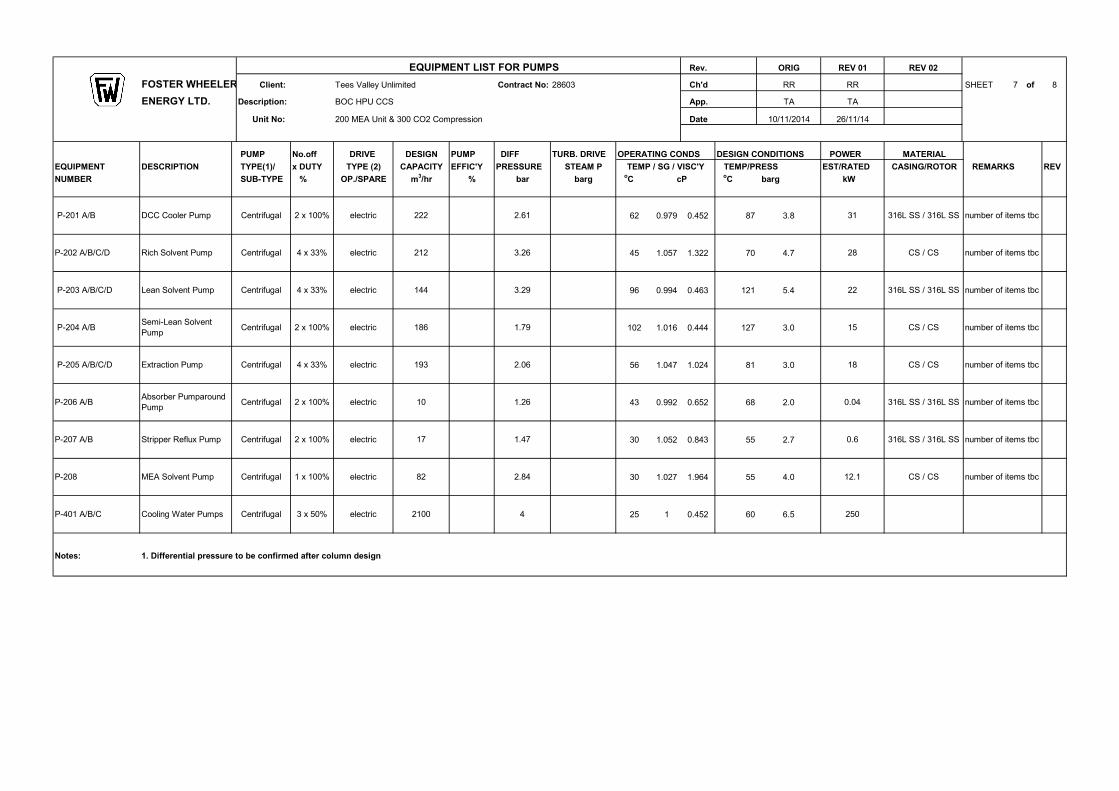
EQUIPMENT LIST FOR PUMPS Rev. ORIG
FOSTER WHEELER Client: Tees Valley Unlimited Contract No: 28603 Ch'd RR SHEET 7 of 8
ENERGY LTD. Description: BOC HPU CCS App. TA
Unit No: 200 MEA Unit & 300 CO2 Compression Date 10/11/2014
PUMP No.off DRIVE DESIGN PUMP DIFF TURB. DRIVE OPERATING CONDS DESIGN CONDITIONS POWER MATERIAL
EQUIPMENT DESCRIPTION TYPE(1)/ x DUTY TYPE (2) CAPACITY EFFIC'Y PRESSURE STEAM P TEMP/PRESS EST/RATED CASING/ROTOR REMARKS REV
NUMBER SUB�TYPE % OP./SPARE m3/hr % bar barg
oC cP
oC barg kW
62 0.979 0.452 87 3.8
45 1.057 1.322 70 4.7
96 0.994 0.463 121 5.4
102 1.016 0.444 127 3.0
56 1.047 1.024 81 3.0
43 0.992 0.652 68 2.0
30 1.052 0.843 55 2.7
30 1.027 1.964 55 4.0
25 1 0.452 60 6.5
Notes: 1. Differential pressure to be confirmed after column design
2 x 100%
number of items tbc P.201 A/B DCC Cooler Pump Centrifugal 2 x 100%
REV 02
RR
TA
26/11/14
REV 01
31 316L SS / 316L SS
electric
212 CS / CS
22
TEMP / SG / VISC'Y
electric 10 1.26
144
number of items tbc
number of items tbc
number of items tbc
number of items tbc
number of items tbc
2.61
electric
3.29
1.79
CS / CS
316L SS / 316L SS
316L SS / 316L SS
CS / CS
electric 193
electric 222
0.04
28
182.06
15
P.203 A/B/C/D
Rich Solvent Pump Centrifugal 4 x 33%P.202 A/B/C/D
Lean Solvent Pump Centrifugal
3.26
electric 186
P.205 A/B/C/D Extraction Pump
Centrifugal 2 x 100%
Centrifugal 4 x 33%
1.47
4 x 33%
P.204 A/B
P.207 A/B
Semi.Lean Solvent
PumpCentrifugal
P.401 A/B/C Centrifugal 3 x 50% electric
P.206 A/BAbsorber Pumparound
PumpCentrifugal 2 x 100%
316L SS / 316L SS number of items tbc0.6Stripper Reflux Pump electric 17
2100Cooling Water Pumps 4
P.208 number of items tbc12.1 CS / CSMEA Solvent Pump Centrifugal 1 x 100% electric 82
250
2.84
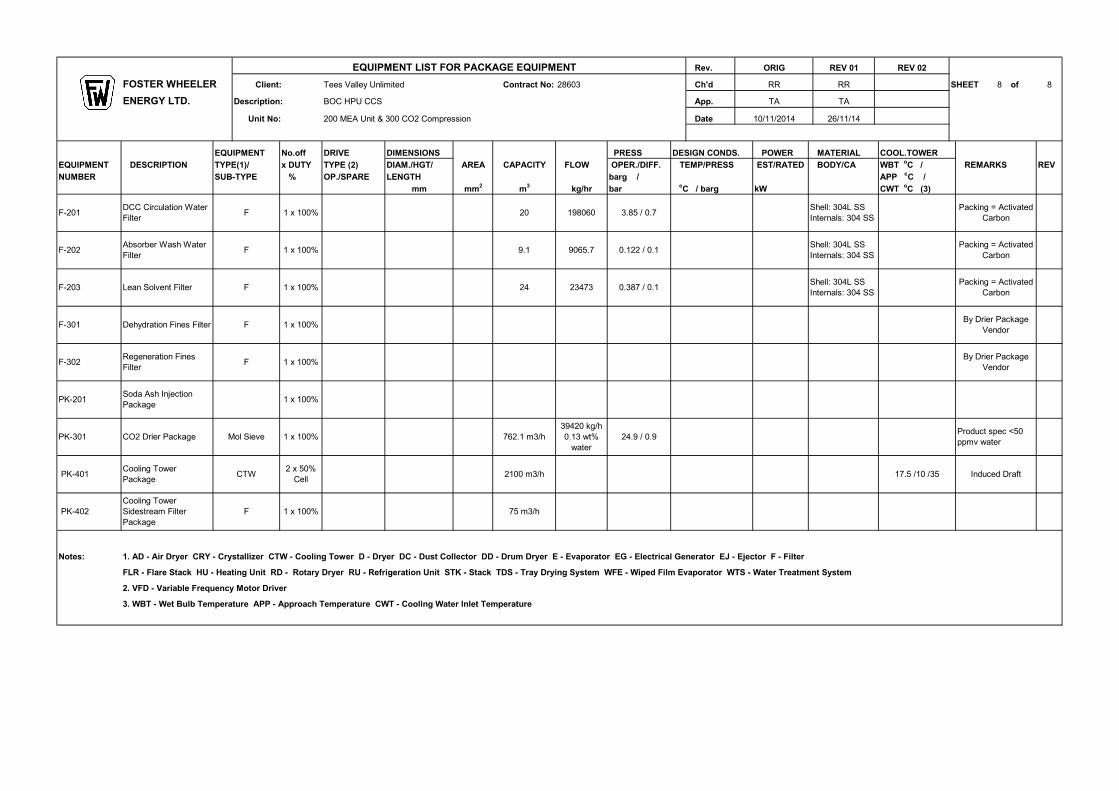
EQUIPMENT LIST FOR PACKAGE EQUIPMENT Rev. REV 01
FOSTER WHEELER Client: Tees Valley Unlimited Contract No: 28603 Ch'd RR SHEET 8 of 8
ENERGY LTD. Description: BOC HPU CCS App. TA
Unit No: 200 MEA Unit & 300 CO2 Compression Date 26/11/14
EQUIPMENT No.off DRIVE DIMENSIONS PRESS DESIGN CONDS. POWER MATERIAL COOL.TOWER
EQUIPMENT DESCRIPTION TYPE(1)/ x DUTY TYPE (2) DIAM./HGT/ AREA CAPACITY FLOW OPER./DIFF. TEMP/PRESS EST/RATED BODY/CA WBT oC / REMARKS REV
NUMBER SUB�TYPE % OP./SPARE LENGTH barg / APP oC /
mm mm2
m3
kg/hr baroC / barg kW CWT
oC (3)
Notes: 1. AD � Air Dryer CRY � Crystallizer CTW � Cooling Tower D � Dryer DC � Dust Collector DD � Drum Dryer E � Evaporator EG � Electrical Generator EJ � Ejector F � Filter
FLR � Flare Stack HU � Heating Unit RD � Rotary Dryer RU � Refrigeration Unit STK � Stack TDS � Tray Drying System WFE � Wiped Film Evaporator WTS � Water Treatment System
2. VFD � Variable Frequency Motor Driver
3. WBT � Wet Bulb Temperature APP � Approach Temperature CWT � Cooling Water Inlet Temperature
75 m3/h PK.402
Cooling Tower
Sidestream Filter
Package
F 1 x 100%
Product spec <50
ppmv water
Induced Draft PK.401Cooling Tower
PackageCTW
2 x 50%
Cell2100 m3/h
39420 kg/h
0.13 wt%
water
24.9 / 0.9
17.5 /10 /35
PK.201Soda Ash Injection
Package1 x 100%
1 x 100% 762.1 m3/h Mol SieveCO2 Drier PackagePK.301
F.203 Lean Solvent Filter F 1 x 100%Shell: 304L SS
Internals: 304 SS
Packing = Activated
Carbon
1 x 100%
0.122 / 0.1
3.85 / 0.719806020
Shell: 304L SS
Internals: 304 SS
Packing = Activated
Carbon
Packing = Activated
Carbon
24 23473 0.387 / 0.1
By Drier Package
Vendor
By Drier Package
Vendor
ORIG
RR
Shell: 304L SS
Internals: 304 SS
TA
10/11/2014
F.202Absorber Wash Water
FilterF 1 x 100%
DCC Circulation Water
FilterF.201
REV 02
9.1 9065.7
F
F.301 Dehydration Fines Filter F
F.302
1 x 100%
Regeneration Fines
FilterF 1 x 100%

BOC HPU CCS STUDY REPORT
28603�8111�RP�001 PAGE 45 OF 49 REV O2
Revision: O2 Date: Nov 2014
ATTACHMENT 3: UTILITIES SUMMARY
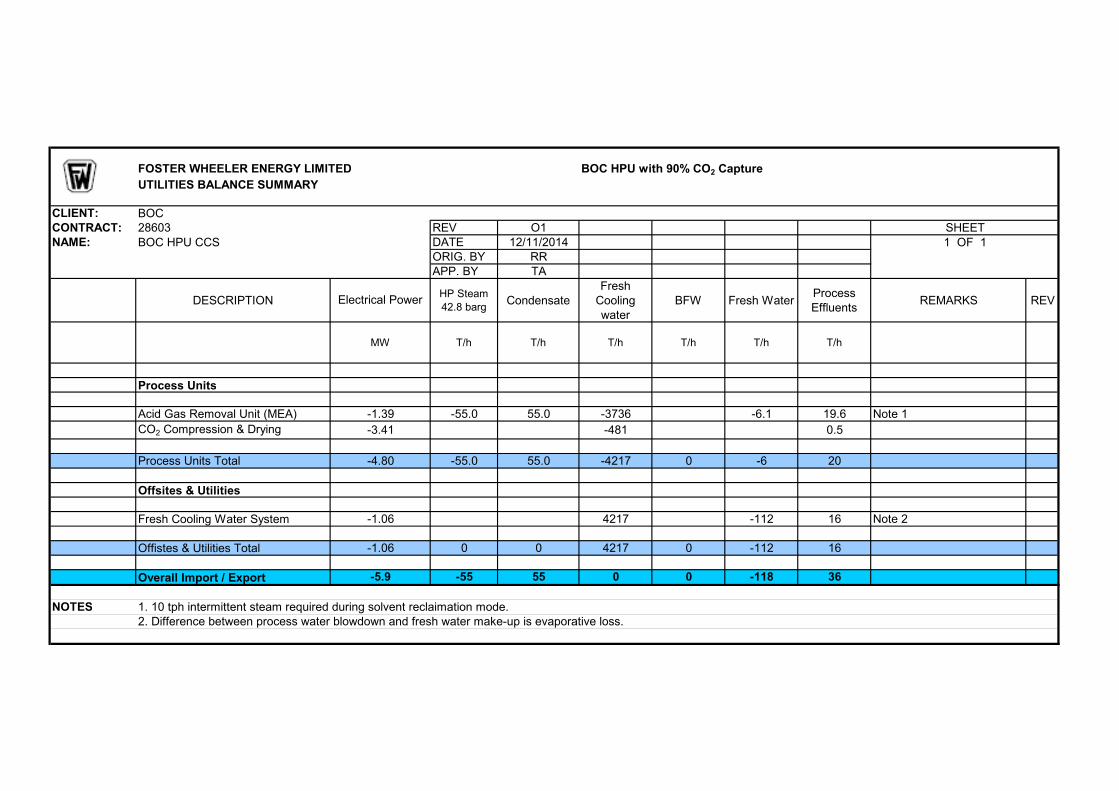
FOSTER WHEELER ENERGY LIMITED BOC HPU with 90% CO2 Capture
UTILITIES BALANCE SUMMARY
CLIENT:
CONTRACT: REV O1
NAME: DATE 12/11/2014
ORIG. BY RR
APP. BY TA
UNIT No. DESCRIPTIONHP Steam
42.8 bargCondensate
Fresh
Cooling
water
BFW Fresh WaterProcess
EffluentsREMARKS REV
MW T/h T/h T/h T/h T/h T/h
Process Units
Acid Gas Removal Unit (MEA) 31.39 355.0 55.0 33736 36.1 19.6 Note 1
CO2 Compression & Drying 33.41 3481 0.5
Process Units Total 34.80 355.0 55.0 34217 0 36 20
Offsites & Utilities
Fresh Cooling Water System 31.06 4217 3112 16 Note 2
Offistes & Utilities Total 31.06 0 0 4217 0 3112 16
Overall Import / Export 05.9 055 55 0 0 0118 36
NOTES 1. 10 tph intermittent steam required during solvent reclaimation mode.
2. Difference between process water blowdown and fresh water make3up is evaporative loss.
SHEET
BOC HPU CCS 1 OF 1
Electrical Power
BOC
28603

BOC HPU CCS STUDY REPORT
28603�8111�RP�001 PAGE 46 OF 49 REV O2
Revision: O2 Date: Nov 2014
ATTACHMENT 4: PLOT PLAN
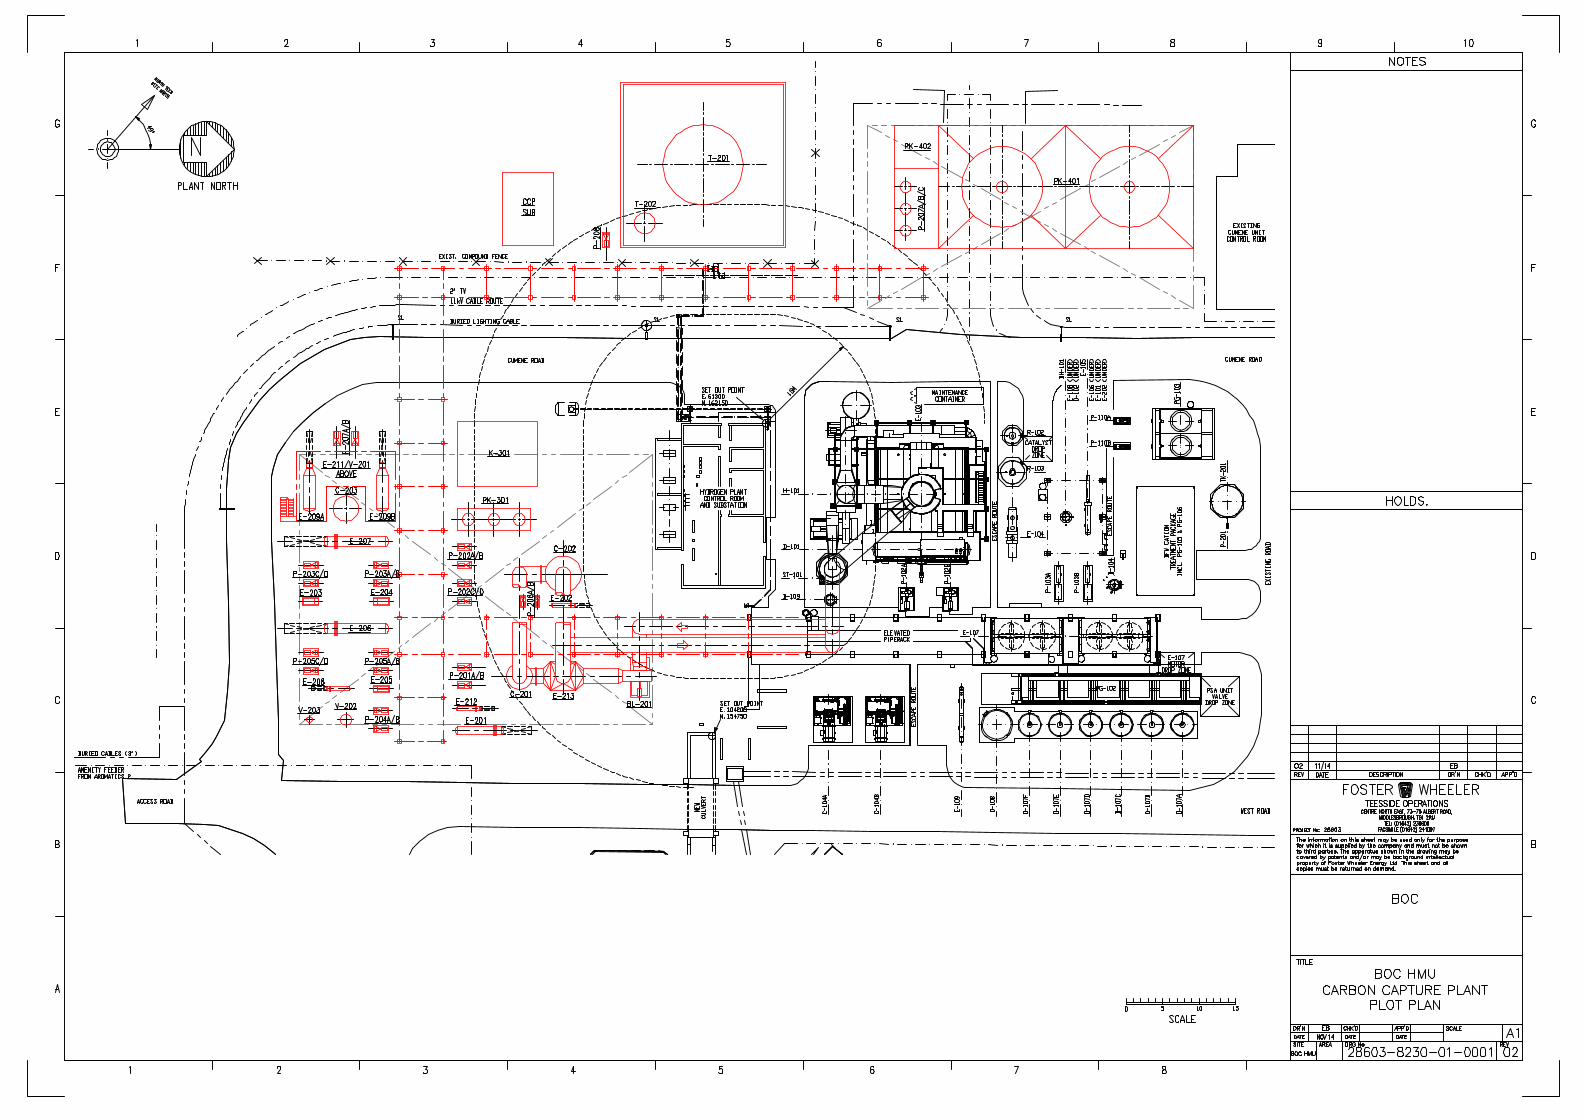

BOC HPU CCS STUDY REPORT
28603�8111�RP�001 PAGE 47 OF 49 REV O2
Revision: O2 Date: Nov 2014
ATTACHMENT 5: PRELIMINARY SINGLE LINE DIAGRAM
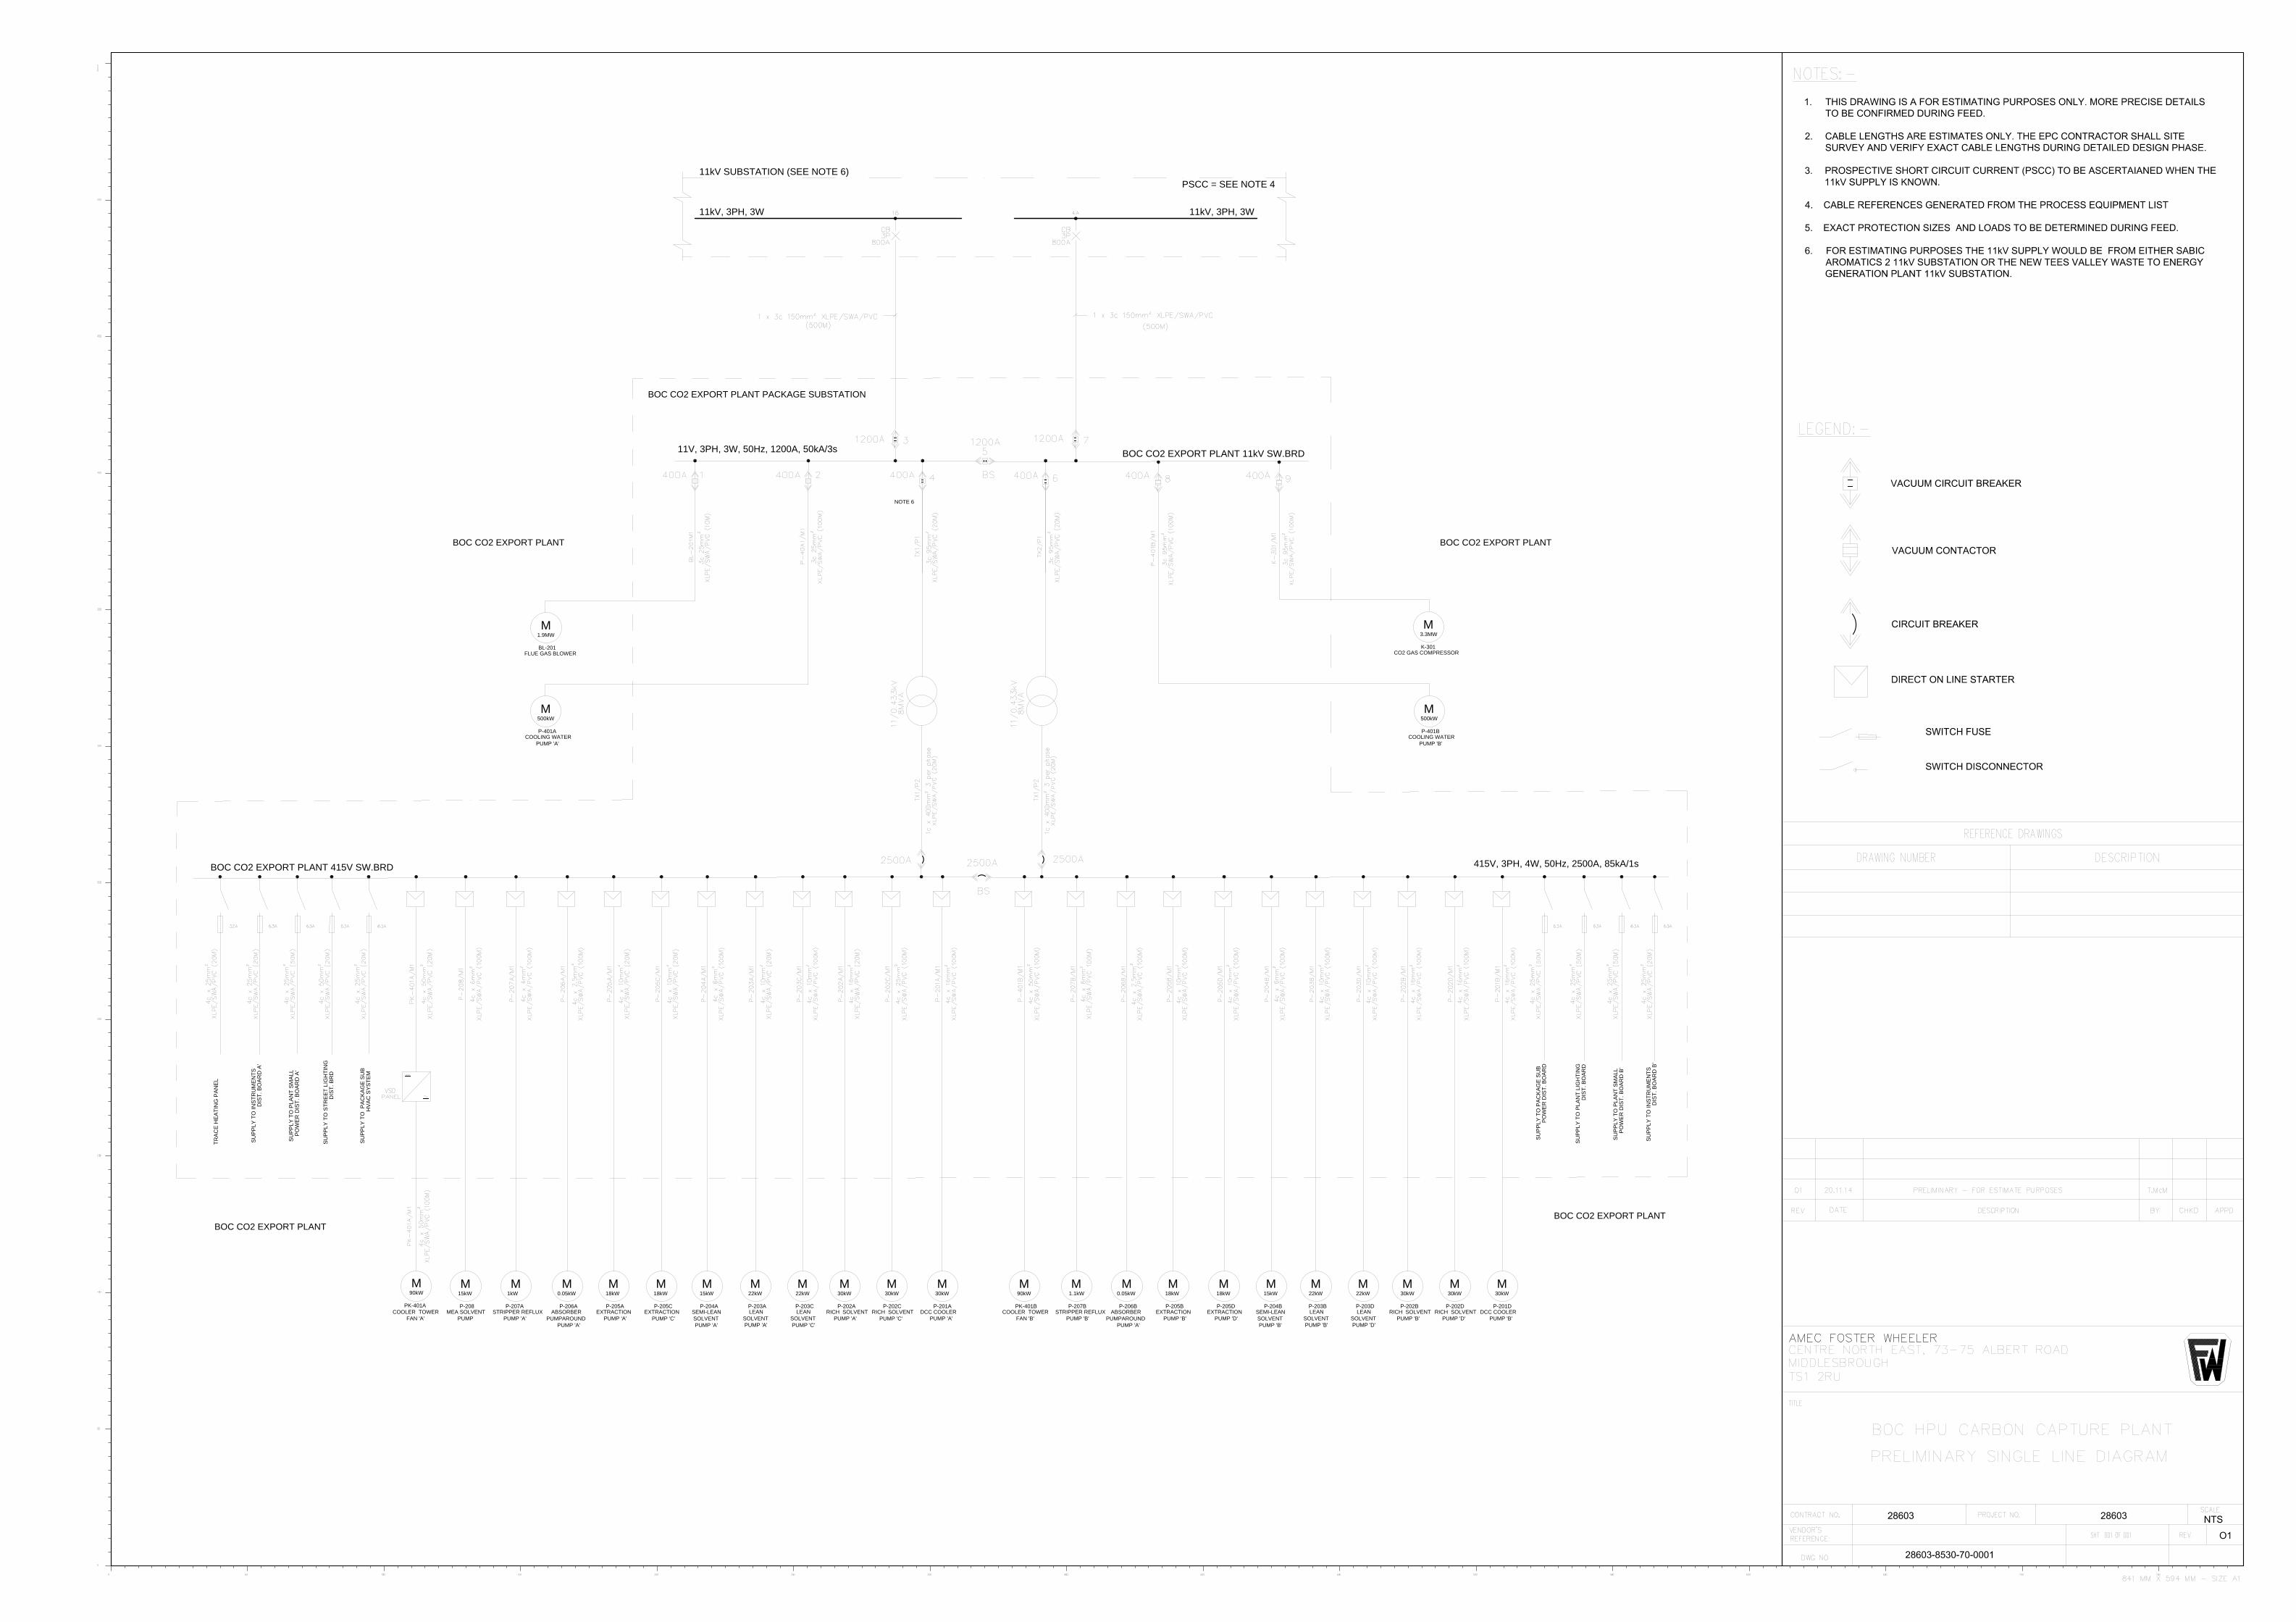
11V, 3PH, 3W, 50Hz, 1200A, 50kA/3s
BOC CO2 EXPORT PLANT PACKAGE SUBSTATION
11kV SUBSTATION (SEE NOTE 6)
PSCC = SEE NOTE 4
NOTE 6
BOC CO2 EXPORT PLANT 11kV SW.BRD
BOC CO2 EXPORT PLANT 415V SW.BRD
BL-201
FLUE GAS BLOWER
1.9MW
M
K-301
CO2 GAS COMPRESSOR
3.3MW
M
P-401A
COOLING WATER
PUMP 'A'
500kW
M
P-401B
COOLING WATER
PUMP 'B'
500kW
M
415V, 3PH, 4W, 50Hz, 2500A, 85kA/1s
P-208
MEA SOLVENT
PUMP
15kW
M
P-207A
STRIPPER REFLUX
PUMP 'A'
1kW
M
P-206A
ABSORBER
PUMPAROUND
PUMP 'A'
0.05kW
M
P-205A
EXTRACTION
PUMP 'A'
18kW
M M
1.1kW
M
P-207B
STRIPPER REFLUX
PUMP 'B'
P-206B
ABSORBER
PUMPAROUND
PUMP 'A'
0.05kW
M
P-205C
EXTRACTION
PUMP 'C'
18kW
P-205B
EXTRACTION
PUMP 'B'
18kW
M M
P-205D
EXTRACTION
PUMP 'D'
18kW
M
P-204A
SEMI-LEAN
SOLVENT
PUMP 'A'
15kW
M
P-204B
SEMI-LEAN
SOLVENT
PUMP 'B'
15kW
M
P-203B
LEAN
SOLVENT
PUMP 'B'
22kW
M
P-203D
LEAN
SOLVENT
PUMP 'D'
22kW
M
P-203A
LEAN
SOLVENT
PUMP 'A'
22kW
M
P-203C
LEAN
SOLVENT
PUMP 'C'
22kW
M
P-202A
RICH SOLVENT
PUMP 'A'
30kW
M
30kW
P-202C
RICH SOLVENT
PUMP 'C'
M
P-202B
RICH SOLVENT
PUMP 'B'
30kW
M
30kW
P-202D
RICH SOLVENT
PUMP 'D'
M
30kW
P-201D
DCC COOLER
PUMP 'B'
M
30kW
P-201A
DCC COOLER
PUMP 'A'
SU
PP
LY
T
O P
AC
KA
GE
S
UB
PO
WE
R D
IS
T. B
OA
RD
SU
PP
LY
T
O P
LA
NT
L
IG
HT
IN
G
DIS
T. B
OA
RD
SU
PP
LY
T
O P
AC
KA
GE
S
UB
HV
AC
S
YS
TE
M
SU
PP
LY
T
O S
TR
EE
T L
IG
HT
IN
G
DIS
T. B
RD
SU
PP
LY
T
O P
LA
NT
S
MA
LL
PO
WE
R D
IS
T. B
OA
RD
A
'
SU
PP
LY
T
O P
LA
NT
S
MA
LL
PO
WE
R D
IS
T. B
OA
RD
B
'
SU
PP
LY
T
O IN
ST
RU
ME
NT
S
DIS
T. B
OA
RD
B
'
SU
PP
LY
T
O IN
ST
RU
ME
NT
S
DIS
T. B
OA
RD
A
'
M
90kW
PK-401B
COOLER TOWER
FAN 'B'
M
90kW
PK-401A
COOLER TOWER
FAN 'A'
BOC CO2 EXPORT PLANT BOC CO2 EXPORT PLANT
BOC CO2 EXPORT PLANT
BOC CO2 EXPORT PLANT
TR
AC
E H
EA
TIN
G P
AN
EL
11kV, 3PH, 3W 11kV, 3PH, 3W

BOC HPU CCS STUDY REPORT
28603�8111�RP�001 PAGE 48 OF 49 REV O2
Revision: O2 Date: Nov 2014
ATTACHMENT 6: COST ESTIMATE
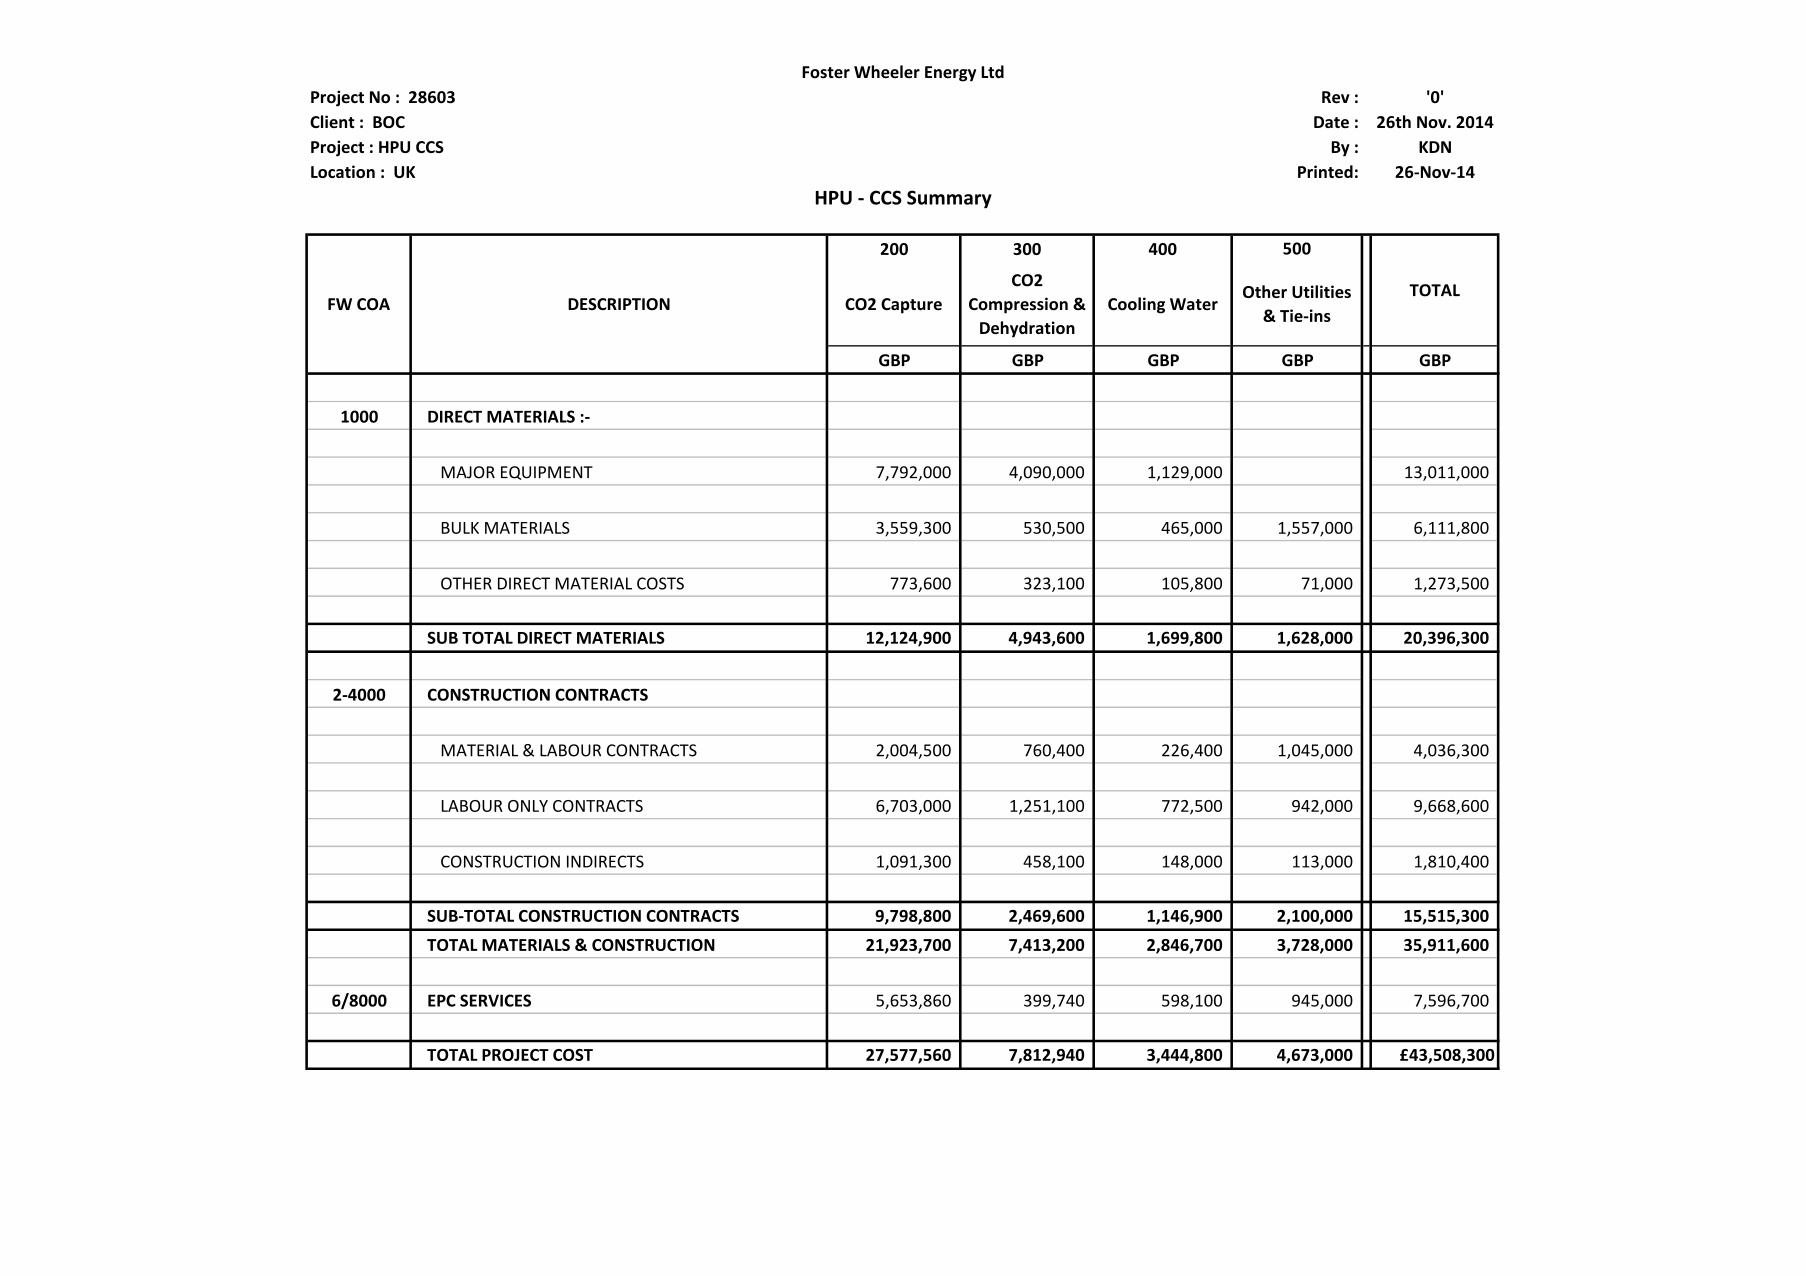
Foster Wheeler Energy Ltd
Project No : 28603 Rev : '0'
Client : BOC Date : 26th Nov. 2014
Project : HPU CCS By : KDN
Location : UK Printed: 26-Nov-14
HPU - CCS Summary
200 300 400 500
GBP GBP GBP GBP GBP
1000 DIRECT MATERIALS :-
MAJOR EQUIPMENT 7,792,000 4,090,000 1,129,000 13,011,000
BULK MATERIALS 3,559,300 530,500 465,000 1,557,000 6,111,800
OTHER DIRECT MATERIAL COSTS 773,600 323,100 105,800 71,000 1,273,500
SUB TOTAL DIRECT MATERIALS 12,124,900 4,943,600 1,699,800 1,628,000 20,396,300
2-4000 CONSTRUCTION CONTRACTS
MATERIAL & LABOUR CONTRACTS 2,004,500 760,400 226,400 1,045,000 4,036,300
LABOUR ONLY CONTRACTS 6,703,000 1,251,100 772,500 942,000 9,668,600
CONSTRUCTION INDIRECTS 1,091,300 458,100 148,000 113,000 1,810,400
SUB-TOTAL CONSTRUCTION CONTRACTS 9,798,800 2,469,600 1,146,900 2,100,000 15,515,300
TOTAL MATERIALS & CONSTRUCTION 21,923,700 7,413,200 2,846,700 3,728,000 35,911,600
6/8000 EPC SERVICES 5,653,860 399,740 598,100 945,000 7,596,700
TOTAL PROJECT COST 27,577,560 7,812,940 3,444,800 4,673,000 £43,508,300
DESCRIPTIONTOTAL
FW COA CO2 Capture
CO2
Compression &
Dehydration
Cooling WaterOther Utilities
& Tie-ins

BOC HPU CCS STUDY REPORT
28603�8111�RP�001 PAGE 49 OF 49 REV O2
Revision: O2 Date: Nov 2014
ATTACHMENT 7: LEVEL 1 SCHEDULE
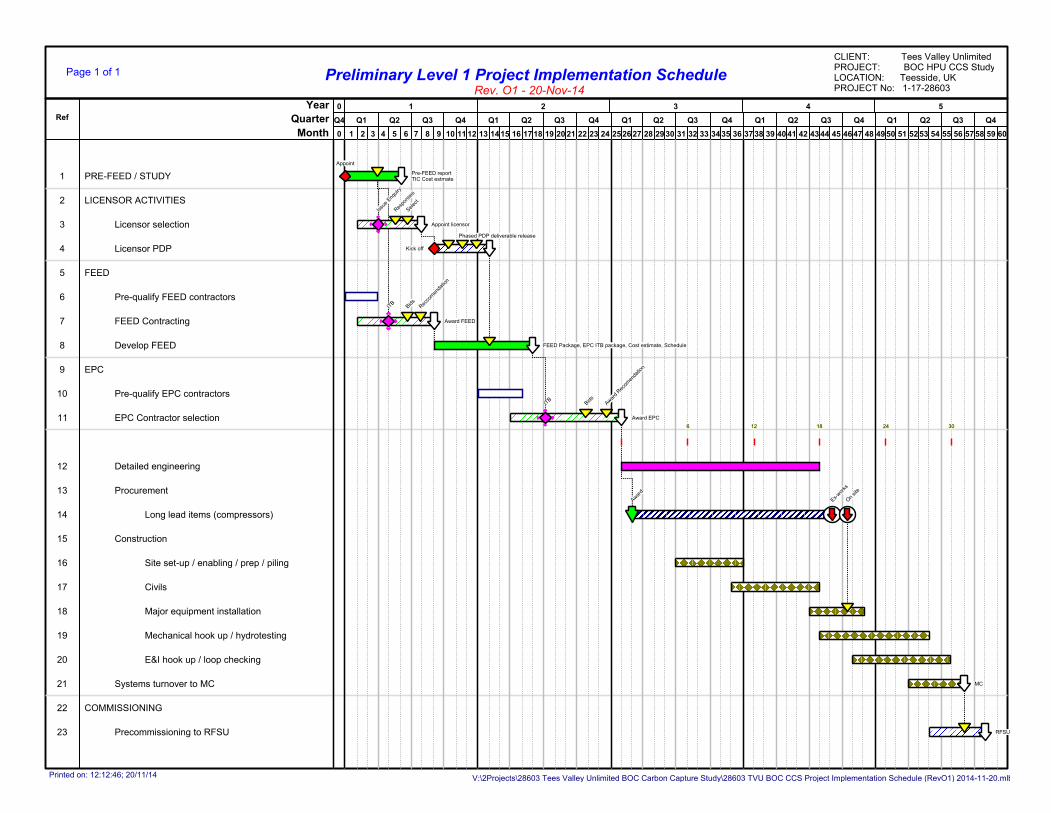
0 1 2 3 4 5
Q4 Q1 Q2 Q3 Q4 Q1 Q2 Q3 Q4 Q1 Q2 Q3 Q4 Q1 Q2 Q3 Q4 Q1 Q2 Q3 Q4
0 1 2 3 4 5 6 7 8 9 10 1112 13 1415 16 1718 19 2021 22 23 24 252627 28 2930 31 32 33 3435 36 3738 39 4041 42 4344 45 4647 48 4950 51 5253 54 55 56 5758 59 60
Rev. O1 - 20-Nov-14Preliminary Level 1 Project Implementation Schedule
YearQuarterRef
PRE-FEED / STUDY1
LICENSOR ACTIVITIES2
Licensor selection3
Licensor PDP4
FEED5
Pre-qualify FEED contractors6
FEED Contracting7
Develop FEED8
EPC9
Pre-qualify EPC contractors10
EPC Contractor selection11
Detailed engineering12
Procurement13
Long lead items (compressors)14
Construction15
Site set-up / enabling / prep / piling16
Civils17
Major equipment installation18
Mechanical hook up / hydrotesting19
E&I hook up / loop checking20
Systems turnover to MC21
COMMISSIONING22
Precommissioning to RFSU23
Appoint
Pre-FEED reportTIC Cost estmate
Issue
Enq
uiry
Respo
nses
Select
Appoint licensor
Kick off
Phased PDP deliverable release
ITB
Bids Recco
men
datio
n
Award FEED
FEED Package, EPC ITB package, Cost estimate, Schedule
ITB
Bids Award
Recom
enda
tion
Award EPC
6 12 18 24 30
Award
Ex-wor
ks
On sit
e
MC
RFSU
CLIENT: Tees Valley UnlimitedPROJECT: BOC HPU CCS StudyLOCATION: Teesside, UKPROJECT No: 1-17-28603
Printed on: 12:12:46; 20/11/14 V:\2Projects\28603 Tees Valley Unlimited BOC Carbon Capture Study\28603 TVU BOC CCS Project Implementation Schedule (RevO1) 2014-11-20.mlb
Page 1 of 1
Month